Article

Economic Evaluation of Population-Based BRCA1/BRCA2 Mutation Testing across Multiple Countries and Health Systems

1
Wolfson Institute for Preventive Medicine, CRUK Barts Cancer Centre, Queen Mary University of London, London EC1M 6BQ, UK
2
Department of Gynaecological Oncology, Barts Health NHS Trust, Royal London Hospital, London E1 1BB, UK
3
MRC Clinical Trials Unit at UCL, Institute of Clinical Trials & Methodology, Faculty of Population Health Sciences, University College London, London WC1V 6LJ, UK
4
Department of Health Services Research and Policy, London School of Hygiene & Tropical Medicine, London WC1H 9SH, UK
5
Department of Epidemiology and Biostatistics, Amsterdam UMC, Vrije Universiteit Amsterdam, 1081 HV Amsterdam, Netherlands
6
Departamento de Medicina Preventiva, Faculdade de Medicina FMUSP, Universidade de Sao Paulo, 01246903 Sao Paulo, Brazil
7
Centre for Cancer Prevention, Wolfson Institute of Preventive Medicine, Queen Mary University of London, London EC1M 6BQ, UK
8
School of Public Health, Peking University, Beijing 100191, China
9
Department of Humanities & Social Sciences, Indian Institute of Technology, Kharagpur, West Bengal 721302, India
10
Department of Economics, Presidency University, Kolkata 700073, India
11
Centre for Epidemiology & Biostatistics, Melbourne School of Population & Global Health, Faculty of Medicine, Dentistry & Health Sciences, University of Melbourne, Victoria 3010, Australia
12
Tata Medical Centre, Kolkata, West Bengal 700160, India
13
Northern Institute for Cancer Research, Newcastle University, Newcastle upon Tyne NE2 4HH, UK
*
Author to whom correspondence should be addressed.
Cancers 2020, 12(7), 1929; https://doi.org/10.3390/cancers12071929
Submission received: 7 June 2020 / Revised: 7 July 2020 / Accepted: 13 July 2020 / Published: 17 July 2020

Abstract

:
Clinical criteria/Family history-based BRCA testing misses a large proportion of BRCA carriers who can benefit from screening/prevention. We estimate the cost-effectiveness of population-based BRCA testing in general population women across different countries/health systems. A Markov model comparing the lifetime costs and effects of BRCA1/BRCA2 testing all general population women ≥30 years compared with clinical criteria/FH-based testing. Separate analyses are undertaken for the UK/USA/Netherlands (high-income countries/HIC), China/Brazil (upper–middle income countries/UMIC) and India (low–middle income countries/LMIC) using both health system/payer and societal perspectives. BRCA carriers undergo appropriate screening/prevention interventions to reduce breast cancer (BC) and ovarian cancer (OC) risk. Outcomes include OC, BC, and additional heart disease deaths and incremental cost-effectiveness ratio (ICER)/quality-adjusted life year (QALY). Probabilistic/one-way sensitivity analyses evaluate model uncertainty. For the base case, from a societal perspective, we found that population-based BRCA testing is cost-saving in HIC (UK-ICER = $−5639/QALY; USA-ICER = $−4018/QALY; Netherlands-ICER = $−11,433/QALY), and it appears cost-effective in UMIC (China-ICER = $18,066/QALY; Brazil-ICER = $13,579/QALY), but it is not cost-effective in LMIC (India-ICER = $23,031/QALY). From a payer perspective, population-based BRCA testing is highly cost-effective in HIC (UK-ICER = $21,191/QALY, USA-ICER = $16,552/QALY, Netherlands-ICER = $25,215/QALY), and it is cost-effective in UMIC (China-ICER = $23,485/QALY, Brazil−ICER = $20,995/QALY), but it is not cost-effective in LMIC (India-ICER = $32,217/QALY). BRCA testing costs below $172/test (ICER = $19,685/QALY), which makes it cost-effective (from a societal perspective) for LMIC/India. Population-based BRCA testing can prevent an additional 2319 to 2666 BC and 327 to 449 OC cases per million women than the current clinical strategy. Findings suggest that population-based BRCA testing for countries evaluated is extremely cost-effective across HIC/UMIC health systems, is cost-saving for HIC health systems from a societal perspective, and can prevent tens of thousands more BC/OC cases.

1. Introduction

Around 10–20% of ovarian cancer (OC) [1] and 6% breast cancer (BC) [2] overall are caused by inheritable BRCA1/BRCA2 mutations. Women carrying BRCA1/BRCA2 mutations have a 17–44% risk of OC and 69–72% risk of BC until age 80 years [3]. Most of these cancers can be prevented in unaffected BRCA1/BRCA2 women carriers. Women can opt for risk-reducing salpingo-oophorectomy (RRSO), to reduce OC risk [4]. In BRCA women, RRSO reduces OC risk by 79–96% [4,5,6]. Additionally, they can opt for MRI/mammography screening, chemoprevention with selective estrogen-receptor modulators (SERM) or aromatase inhibitors [7]; or risk-reducing mastectomy (RRM) [8,9] to reduce their BC risk [10]. RRM reduces BC risk by 90–95% [8,9]. Mutation identification also enables women to make timely, informed reproductive/lifestyle choices and consider prenatal/pre-implantation genetic diagnosis.
Despite 25 years of BRCA testing and effective mechanisms for prevention, current guidelines and access to testing/treatment pathways remain complex and associated with a massive under-utilisation of genetic testing [11]. Only 20% of eligible US women have accessed/undergone genetic testing [11]. A UK analysis shows the huge majority (>97%) of BRCA carriers in the population remain unidentified [12]. This highlights substantial missed opportunities for early detection and primary prevention. The current approach uses established clinical-criteria/family-history (FH) based a priori BRCA probability thresholds to identify high-risk individuals eligible for BRCA testing. These clinical criteria/FH-based criteria are used to calculate mutation probability and have been loosened over the years. Earlier, the threshold for offering BRCA testing used to be 20% probability. Most countries/health systems now offer BRCA testing at a BRCA mutation probability of around 10% [13]. A number of different strategies ranging from standardised criteria to complex mathematical (Empirical/Mendelian) models have been used to calculate mutation probability and are used in clinical practice. However, this requires individuals and health practitioners to recognise and act on a significant FH. BRCA carriers, who are unaware of their FH, unappreciative of its risk/significance, not proactive in seeking advice, or lack a strong FH (small families/paternal inheritance/chance) get excluded. Over 50% BRCA carriers do not fulfil clinical criteria and are missed [14,15,16,17,18,19,20]. Current detection rates are inadequate to identify all BRCA carriers and even doubling detection rates will need 165 years to ascertain the ‘clinically detectable’ proportion of BRCA carriers [12]. Why should we wait for decades for people to develop cancer before identifying BRCA carriers and unaffected at-risk family members to offer prevention?
These limitations can be overcome through unrestricted/unselected population based BRCA testing. Falling BRCA testing costs, advances in computing/bioinformatics, and next-generation sequencing has made this possible. Jewish population studies show this is feasible, acceptable, has high satisfaction (91–95%), significantly reduces anxiety, doesn’t harm psychological well-being or quality of life, and is extremely cost-effective [15,16,21,22]. Pilot general population studies are ongoing in the UK/Canada [23]. However, the potential applicability and scope for primary prevention transcends continents and countries. Health systems, infrastructure, costs, environment, contexts, opportunities, and capacity along with health sector priorities vary considerably across different countries, [24]. Economic evaluations of health interventions, health perspectives and cost-effectiveness thresholds differ amongst countries. Nevertheless, economic evaluation is important to weigh up costs and health effects of alternative health strategies, to help health policy decision making with respect to cost efficiency and resource allocation. For interventions to be sustainable, they need to be cost-effective and affordable. The World Bank separates countries into four income categories using Gross National Income (GNI) per capita (USA dollars): Low-income (LIC: ≤$1025), Lower–Middle Income (LMIC: $1026–$4035), Upper–Middle Income (UMIC: $4036–$12,475), and High Income (HIC: ≥$12,476). In settings of state funded universal health care coverage, the difference between government and societal perspectives is narrower than countries with a limited social security structure/net, where this gap can be significantly larger and consequences considerable. We for the first time evaluate the cost-effectiveness of population-based BRCA-testing (compared to clinical-criteria/family-history testing) across multiple countries/health systems: India (LMIC), Brazil (UMIC), China (UMIC), the USA (HIC), the UK (HIC), and the Netherlands (HIC). We present analyses from both health system or payer (here forth called ‘payer’) and societal perspectives.

2. Results

The comparison of lifetime costs and quality-adjusted life year (QALYs) of population testing and clinical-criteria/FH testing for women in different countries along with the country-specific incremental cost-effectiveness ratios (ICERs) and willingness-to-pay (WTP) thresholds are given in Table 1. Our results show that from a ‘societal perspective’ (using WHO guidelines), population-based BRCA testing is actually ‘cost-saving’ and contributes to better health in HIC of the UK (ICER = $−5,639/QALY; life expectancy gained = 3.0 days), USA (ICER = $−4018/QALY; life expectancy gained = 2.2 days), and The Netherlands (ICER = 
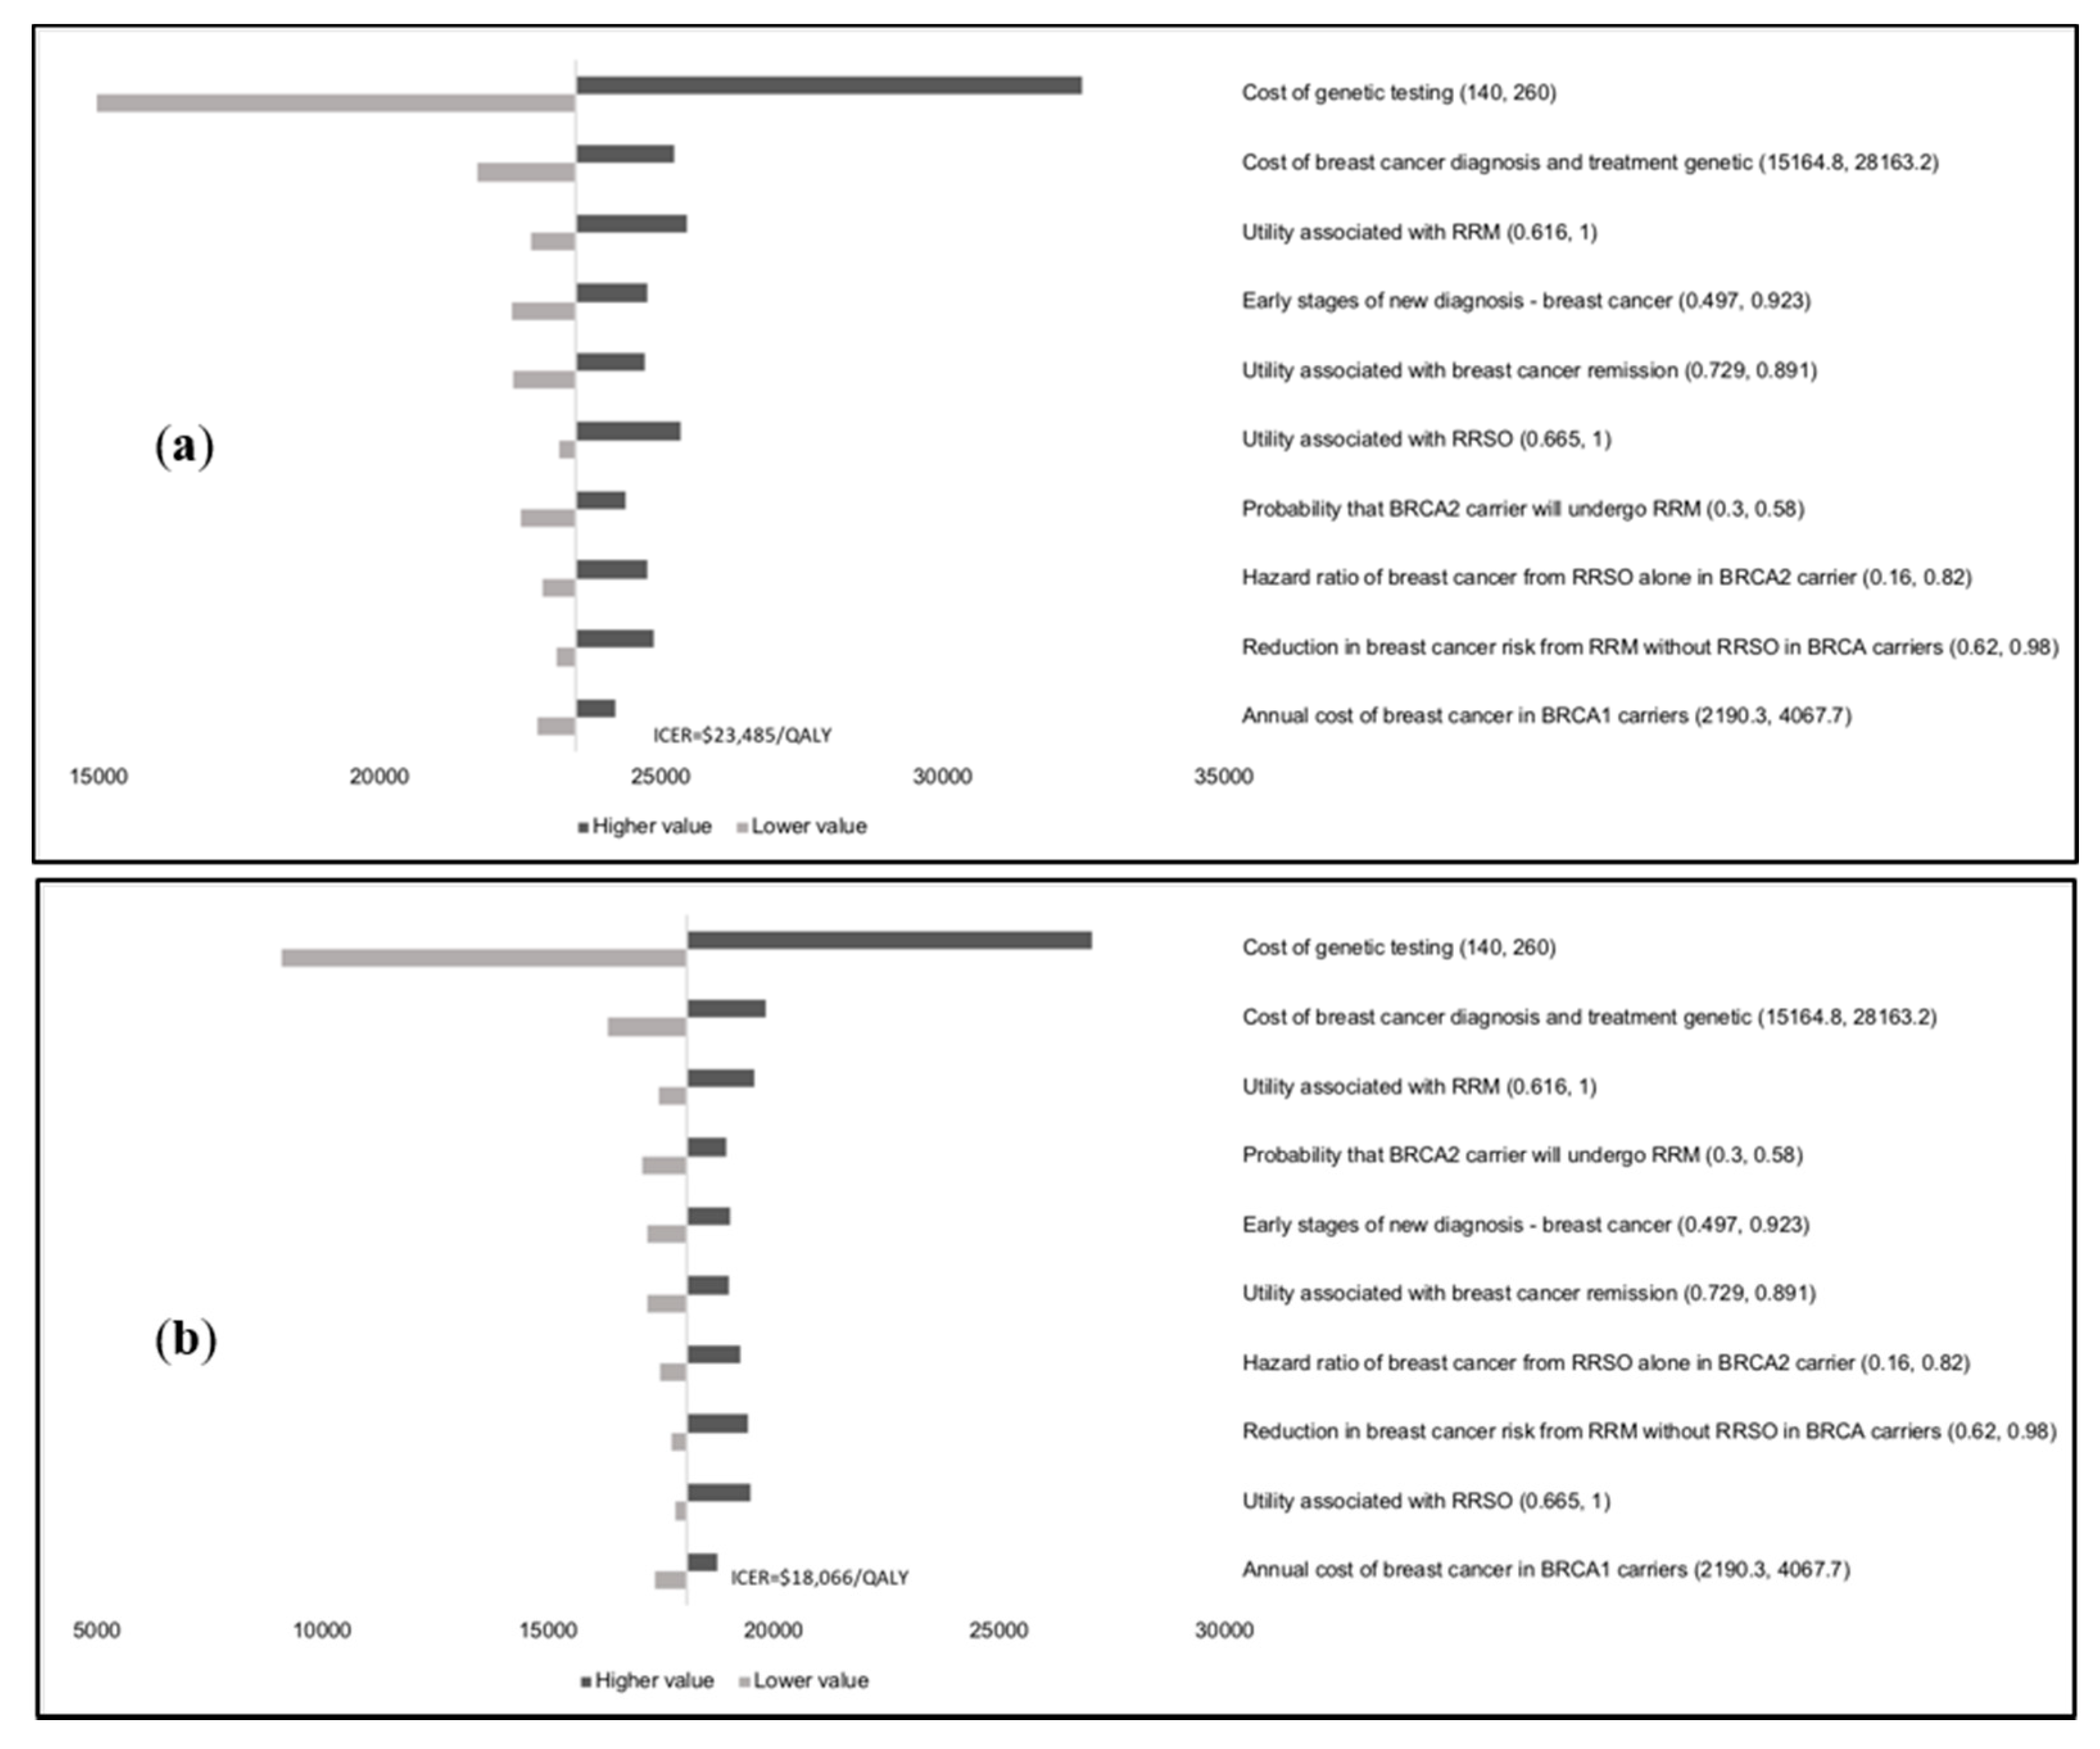
$−11,433/QALY; life expectancy gained = 2.8 days). It appears potentially cost-effective in UMICs of China (ICER = 
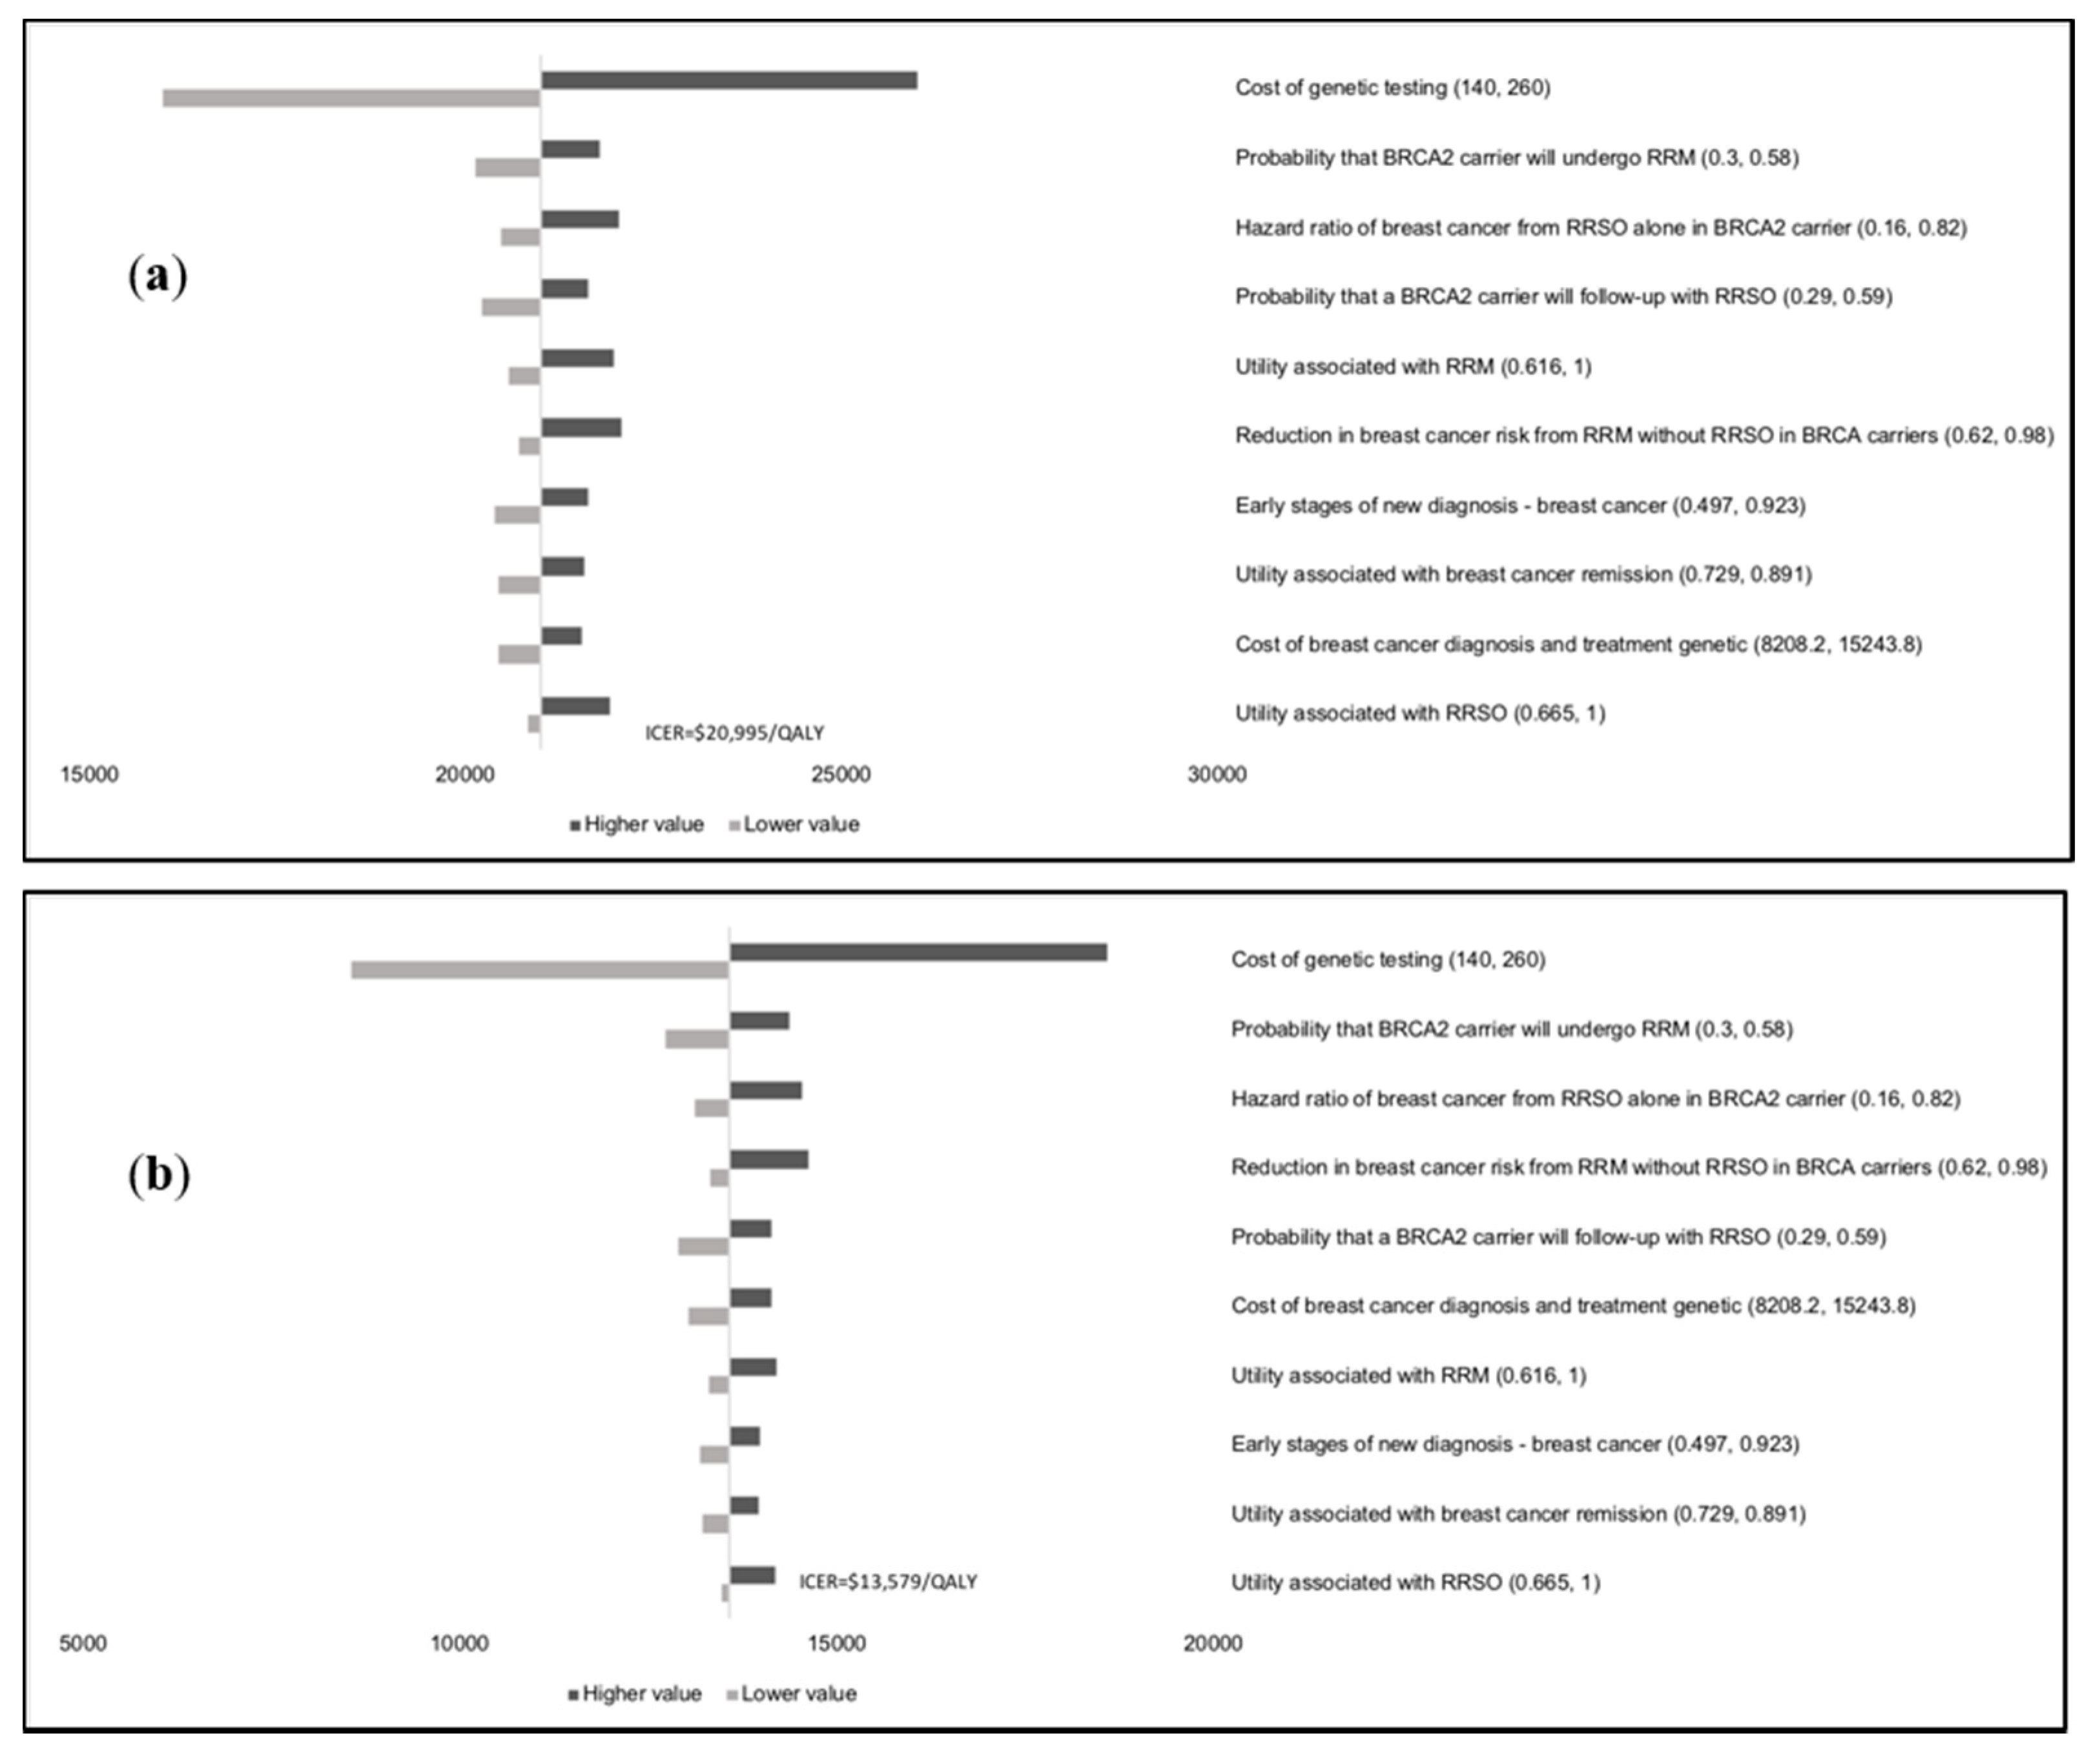
$18,066/QALY; life expectancy gained = 1.8 days) and cost-effective in Brazil (ICER = 
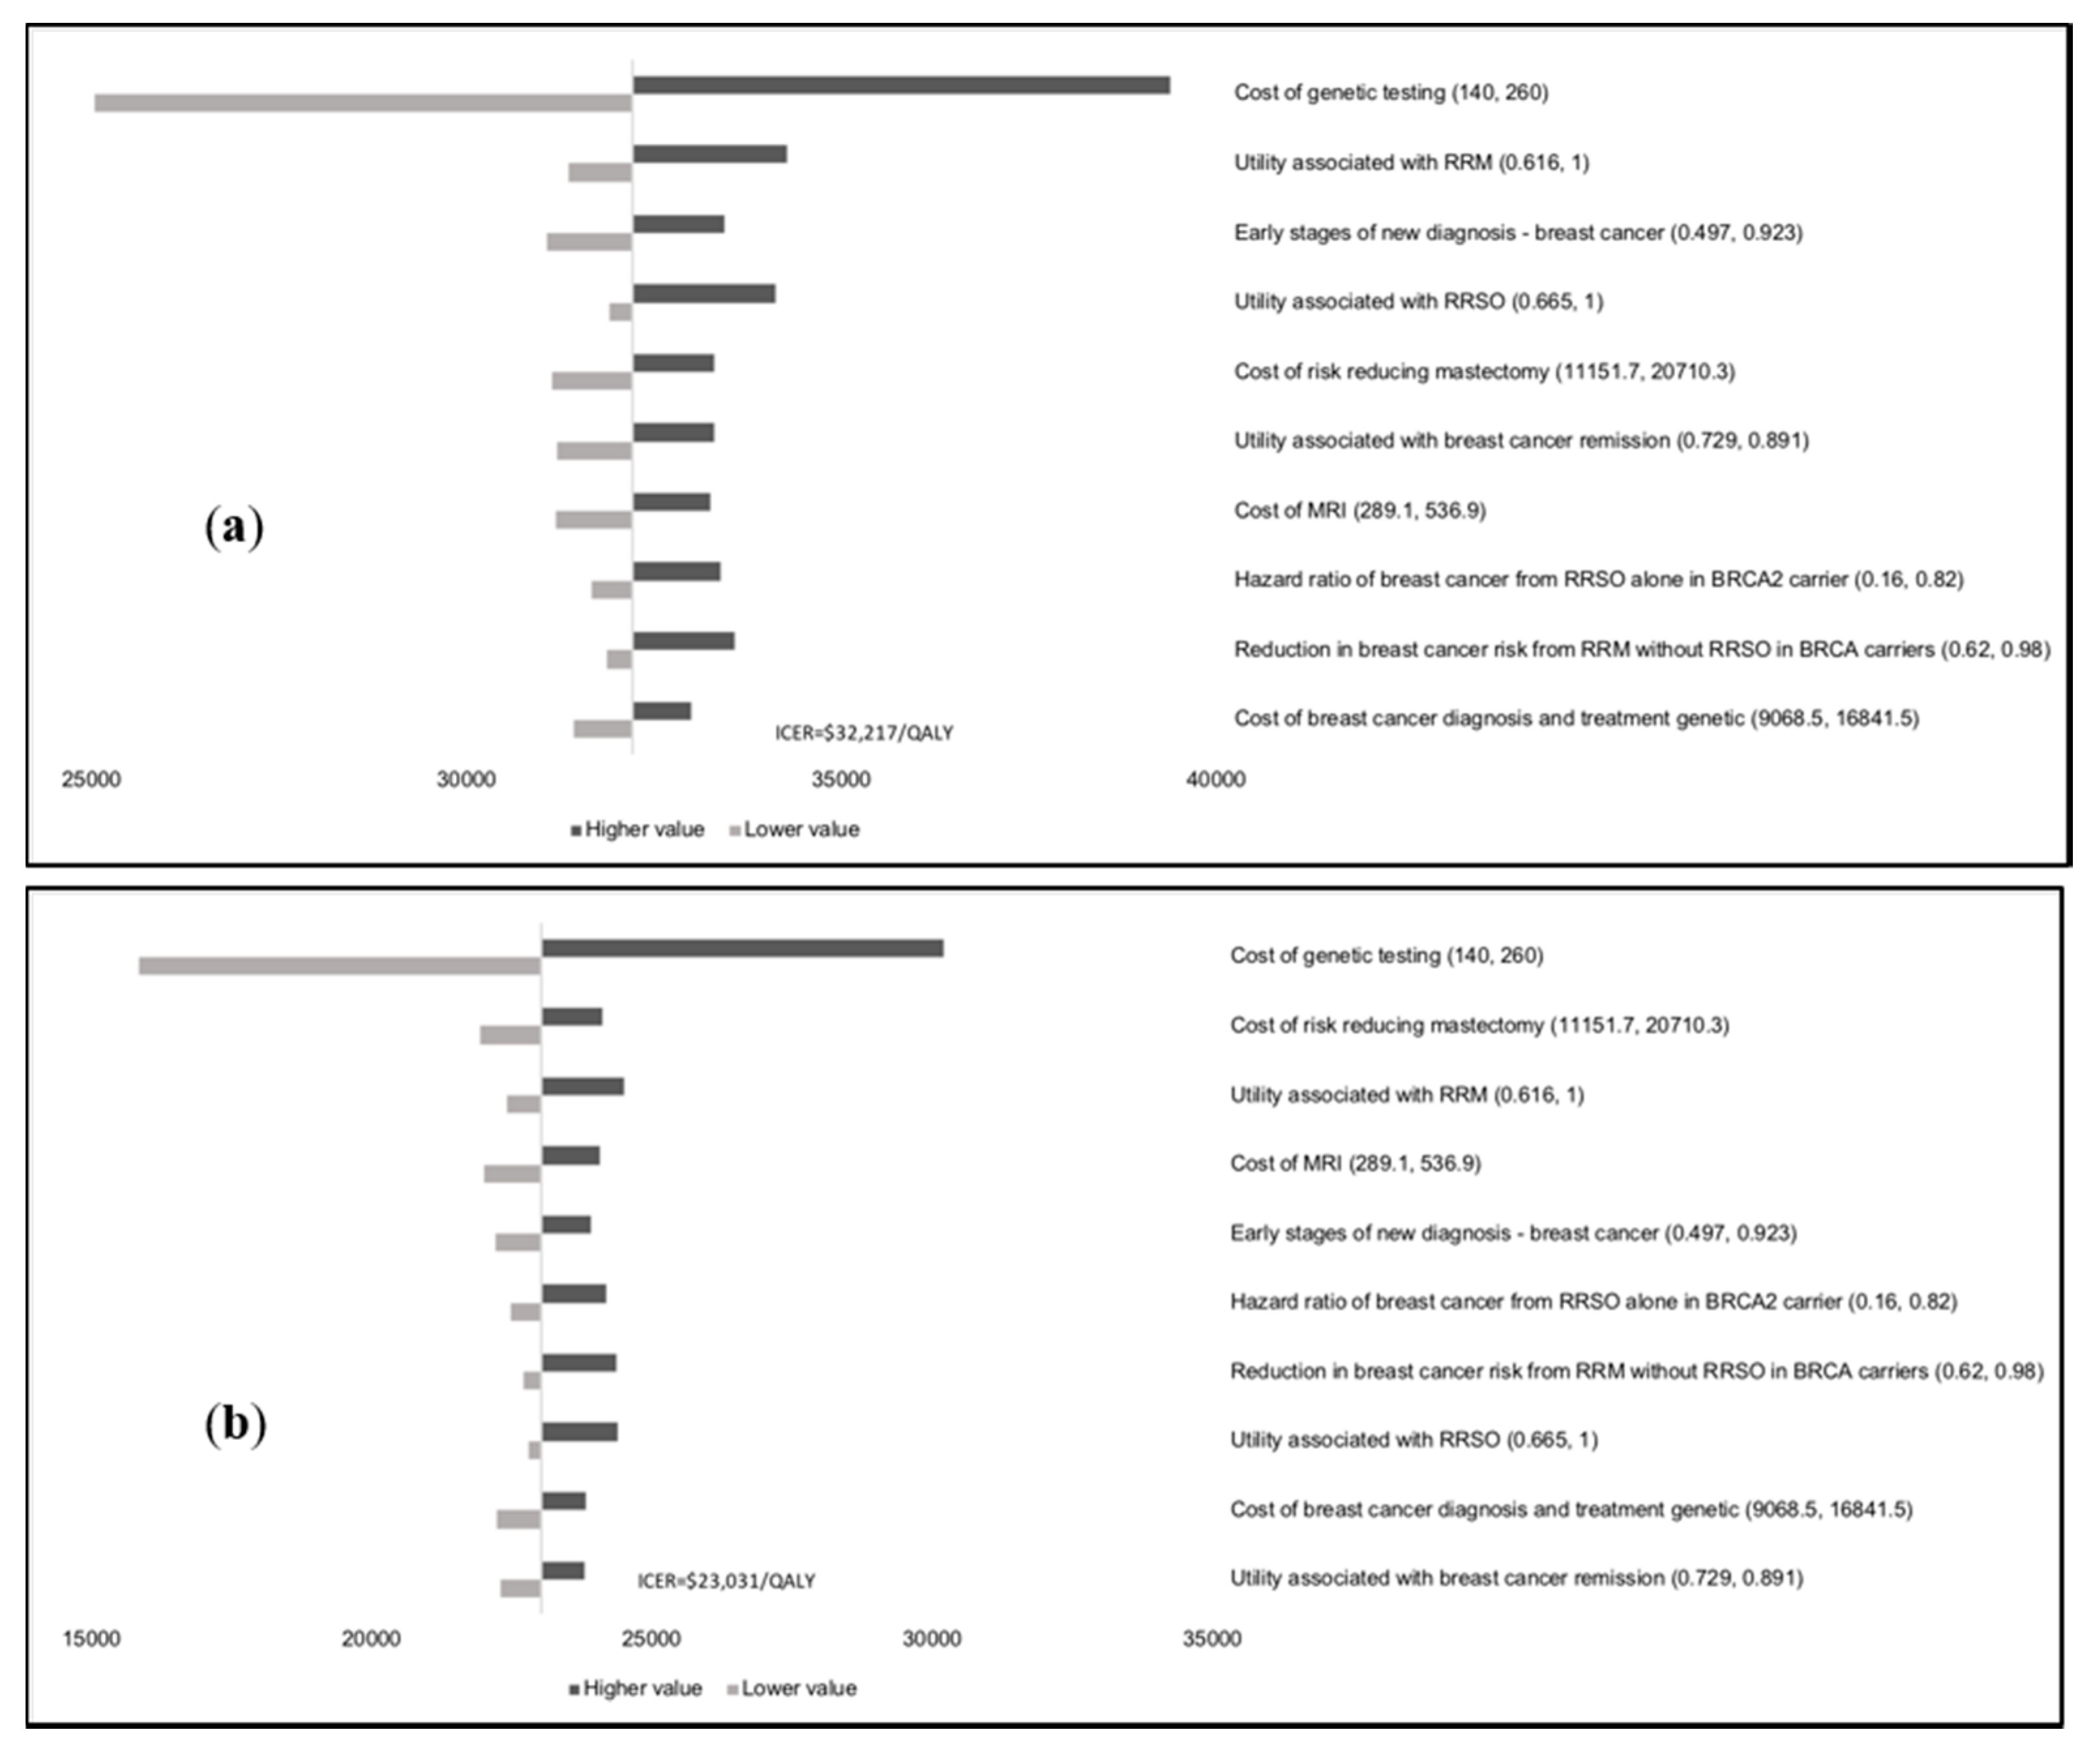
$13,579/QALY; life expectancy gained = 3.7 days), but it is not cost-effective in India (ICER = $23,031/QALY; life expectancy gained = 2.5 days) (LMIC) for the base case.
From a ‘payer perspective’ (using WHO guidelines), population-based BRCA testing is ‘highly’ cost-effective compared with clinical criteria/FH-based testing in HIC, with UK-ICER = $21,191/QALY (life expectancy gained = 3.0 days), USA-ICER = $16,552/QALY (life expectancy gained = 2.2 days), and Netherlands-ICER = $25,215/QALY (life expectancy gained = 2.8 days). In UMIC population-based BRCA testing is cost-effective with ICER = $23,485/QALY in China (life expectancy gained = 1.8 days) and ICER = $20,995/QALY in Brazil (life expectancy gained = 3.7 days). Population-based BRCA testing is not cost-effective in LMIC with ICER = $32,217/QALY in India (life expectancy gained = 2.5 days).
If we consider local, country-specific guidelines for the UK, USA, and the Netherlands, then population-based BRCA testing is cost-effective from the payer perspective (UK-ICER = $24,066/QALY; USA-ICER = $16,552/QALY; Netherlands-ICER = $17655/QALY), and cost-saving from the societal perspective (UK-ICER = −$3543/QALY; USA-ICER = −$4018/QALY; Netherlands ICER = −$3185/QALY). The corresponding values for life expectancy gained are 2.6 days (UK), 2.2 days (USA) and 4.2 days Netherlands. 
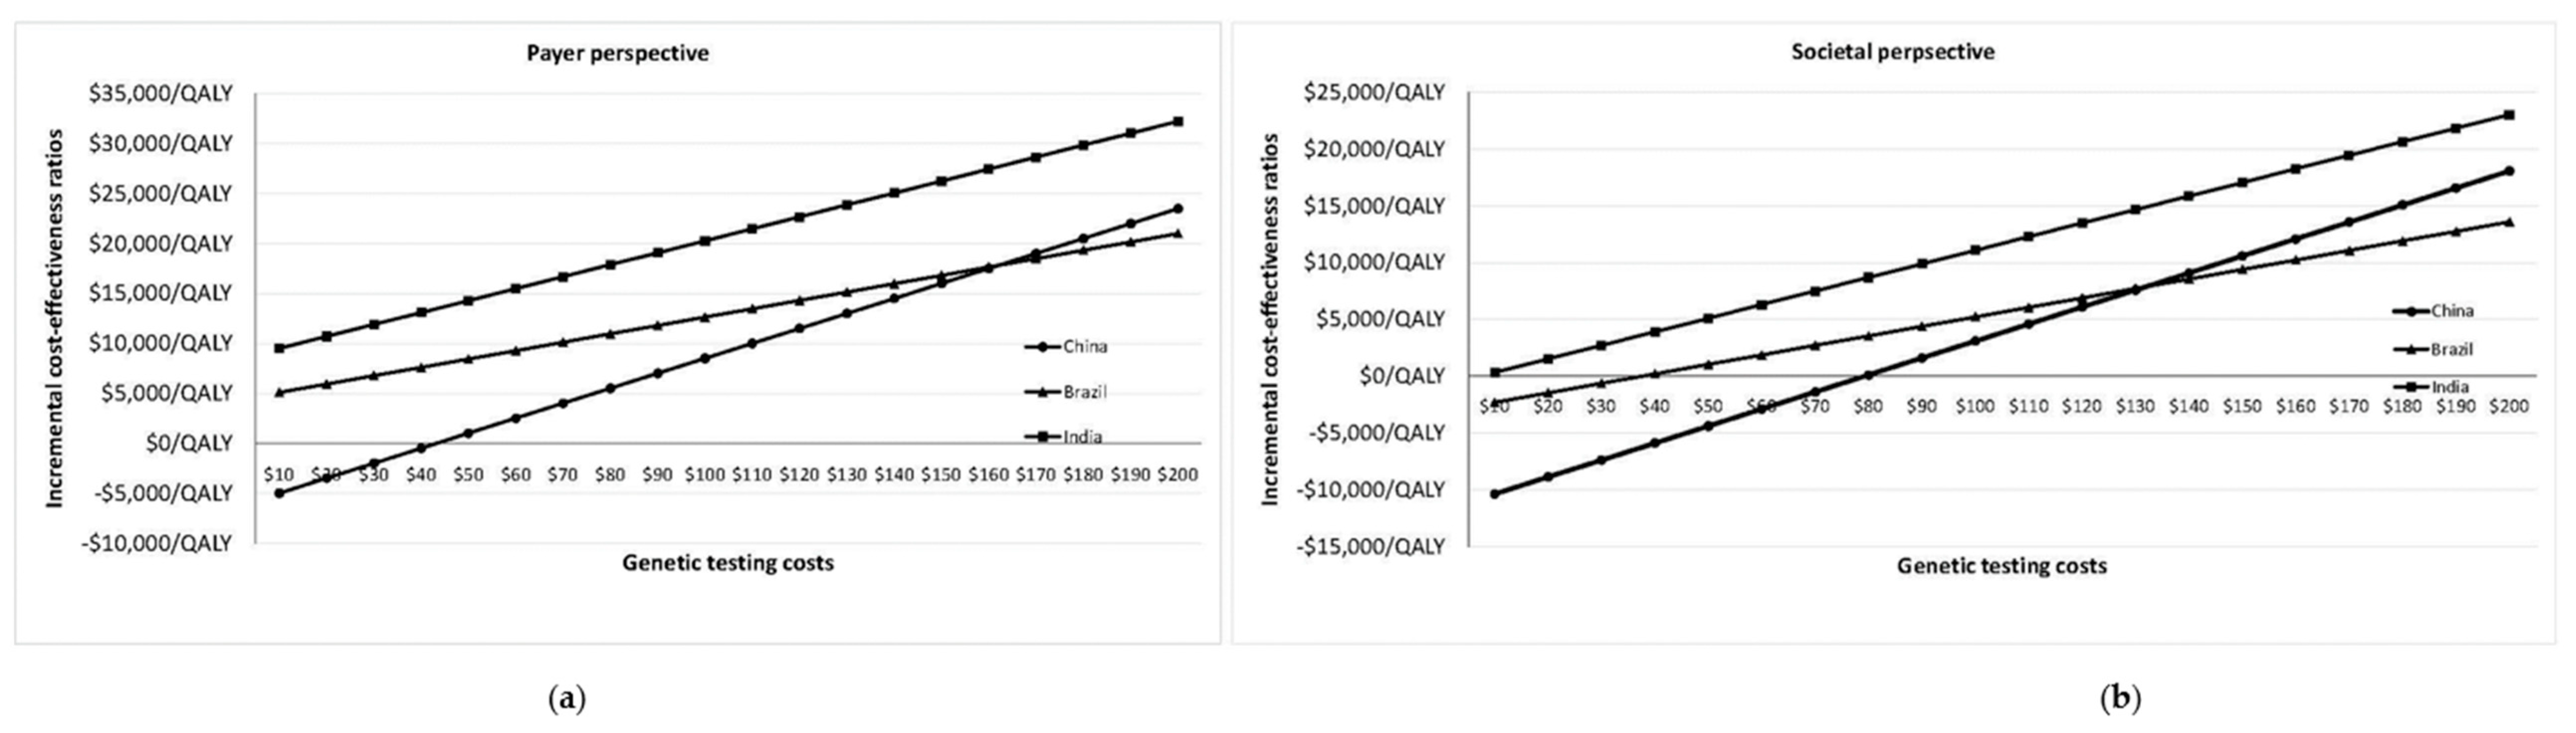
Figure 1a,b plot change in ICER/QALY with varying BRCA testing costs in Brazil, China and India for payer and societal perspectives. Population testing becomes potentially cost-effective (from a societal perspective) in India if the BRCA testing cost falls to $172/test (ICER = $19,685/QALY) (Figure 1a; Appendix D). BRCA testing costs need to reach $95/test (ICER = $19,670/QALY) for cost-effective population testing in India from the payer perspective (Figure 1b; Appendix D).
The lifetime population impact (reduction in BC and OC cases and deaths; and excess coronary heart disease (CHD)) of offering population BRCA testing for the six countries is detailed in Table 2. A population-based BRCA testing approach can potentially prevent an additional 2319 to 2666 BC and 327 to 449 OC cases per million women, translating to tens of thousands more BC/OC prevented across the population than the current clinical strategy.
Scenario analyses results are given in Table 3. Different scenarios analysed include no reduction in BC risk from RRSO, nil compliance with hormone replacement therapy (HRT), reduction in RRM and RRSO rates by half, and reduced genetic testing costs of $100. Population-based BRCA testing remains cost-effective from payer and societal perspectives in each HIC and UMIC country at their respective WTP thresholds, even without reduction in BC risk from RRSO, no HRT uptake after RRSO, and 50% lower RRM and RRSO uptake rates (Table 3). If the BRCA testing costs fell to $100/test, it would be highly cost-effective from the payer perspective and cost-saving (negative ICERs) from the societal perspective for HIC; highly cost-effective from payer/societal perspectives for UMIC, and cost-effective from the societal perspective for India (LMIC). The maximum BRCA testing costs for population testing to remain cost-effective from the payer/societal perspectives respectively are in Appendix E. At the 3*GDP WTP threshold, these are: UK = $1254/$1520; USA = $1417/$1577; Netherlands = $1407/$1758; China = $354/$390; Brazil = $493/$582; and India = $95/$172. Using UK/USA/Netherlands guideline-based WTP thresholds, these maximum BRCA testing costs are UK = $365, USA = $850–$1010, and Netherlands = $800.
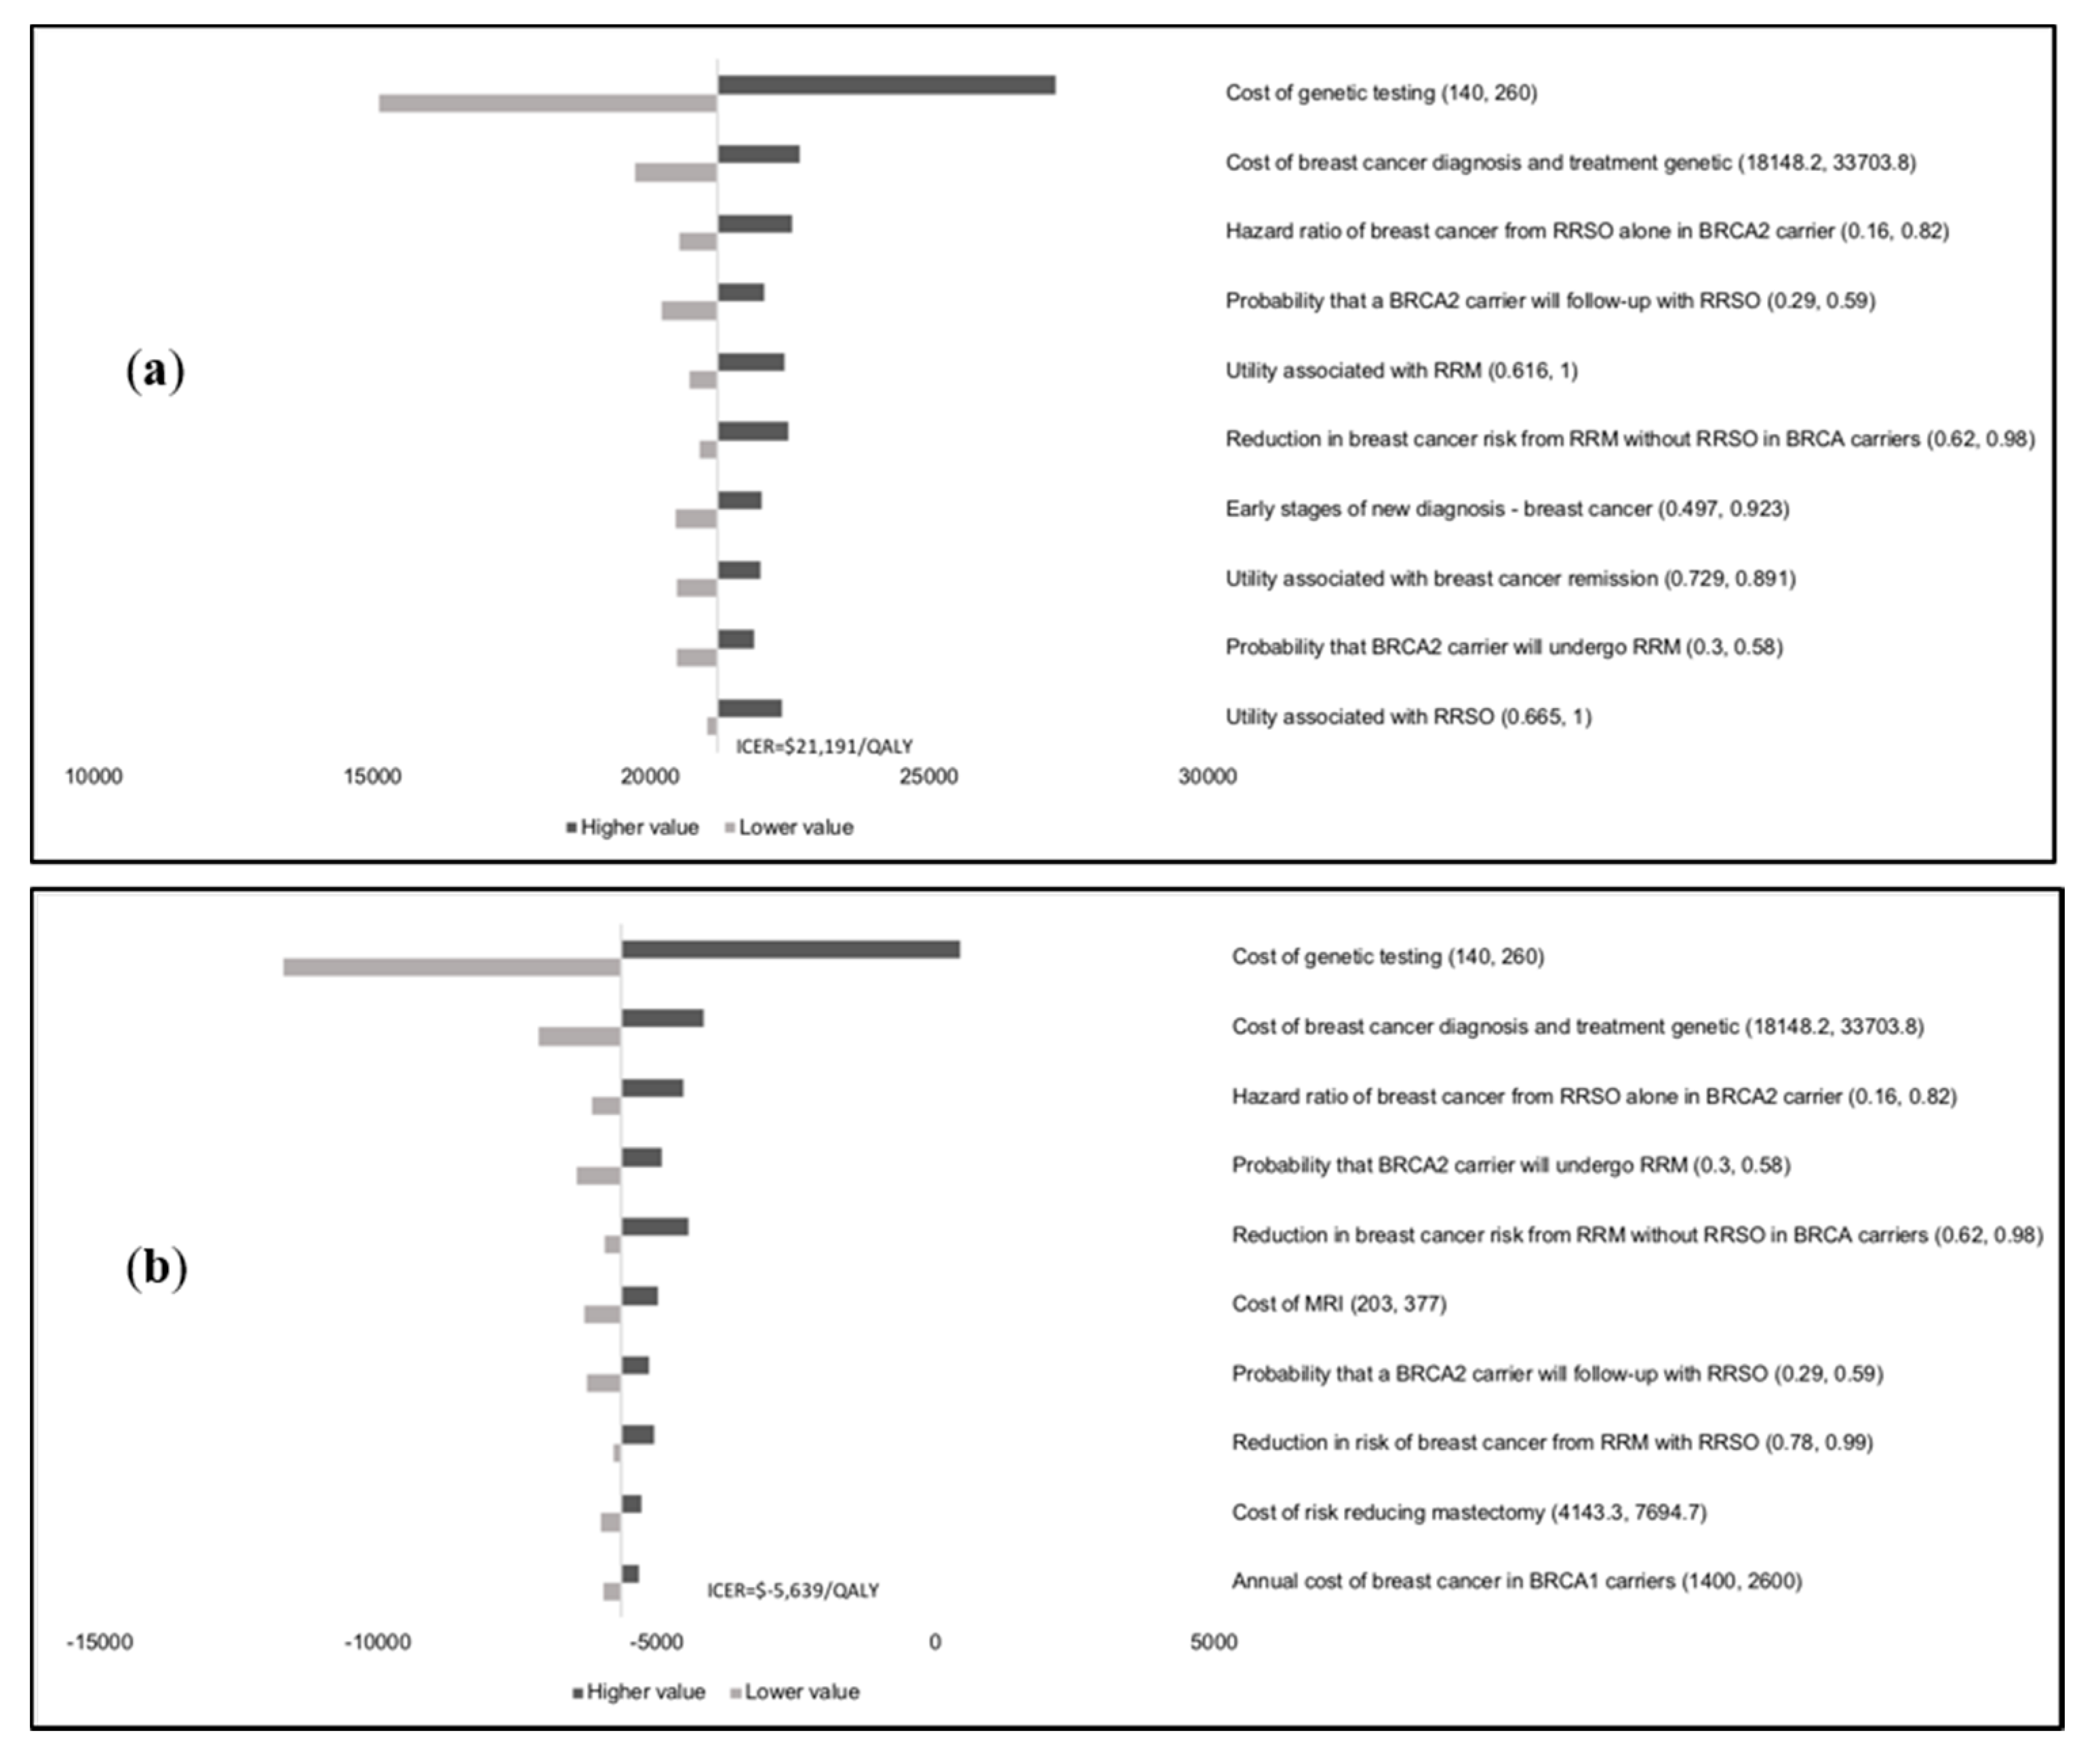
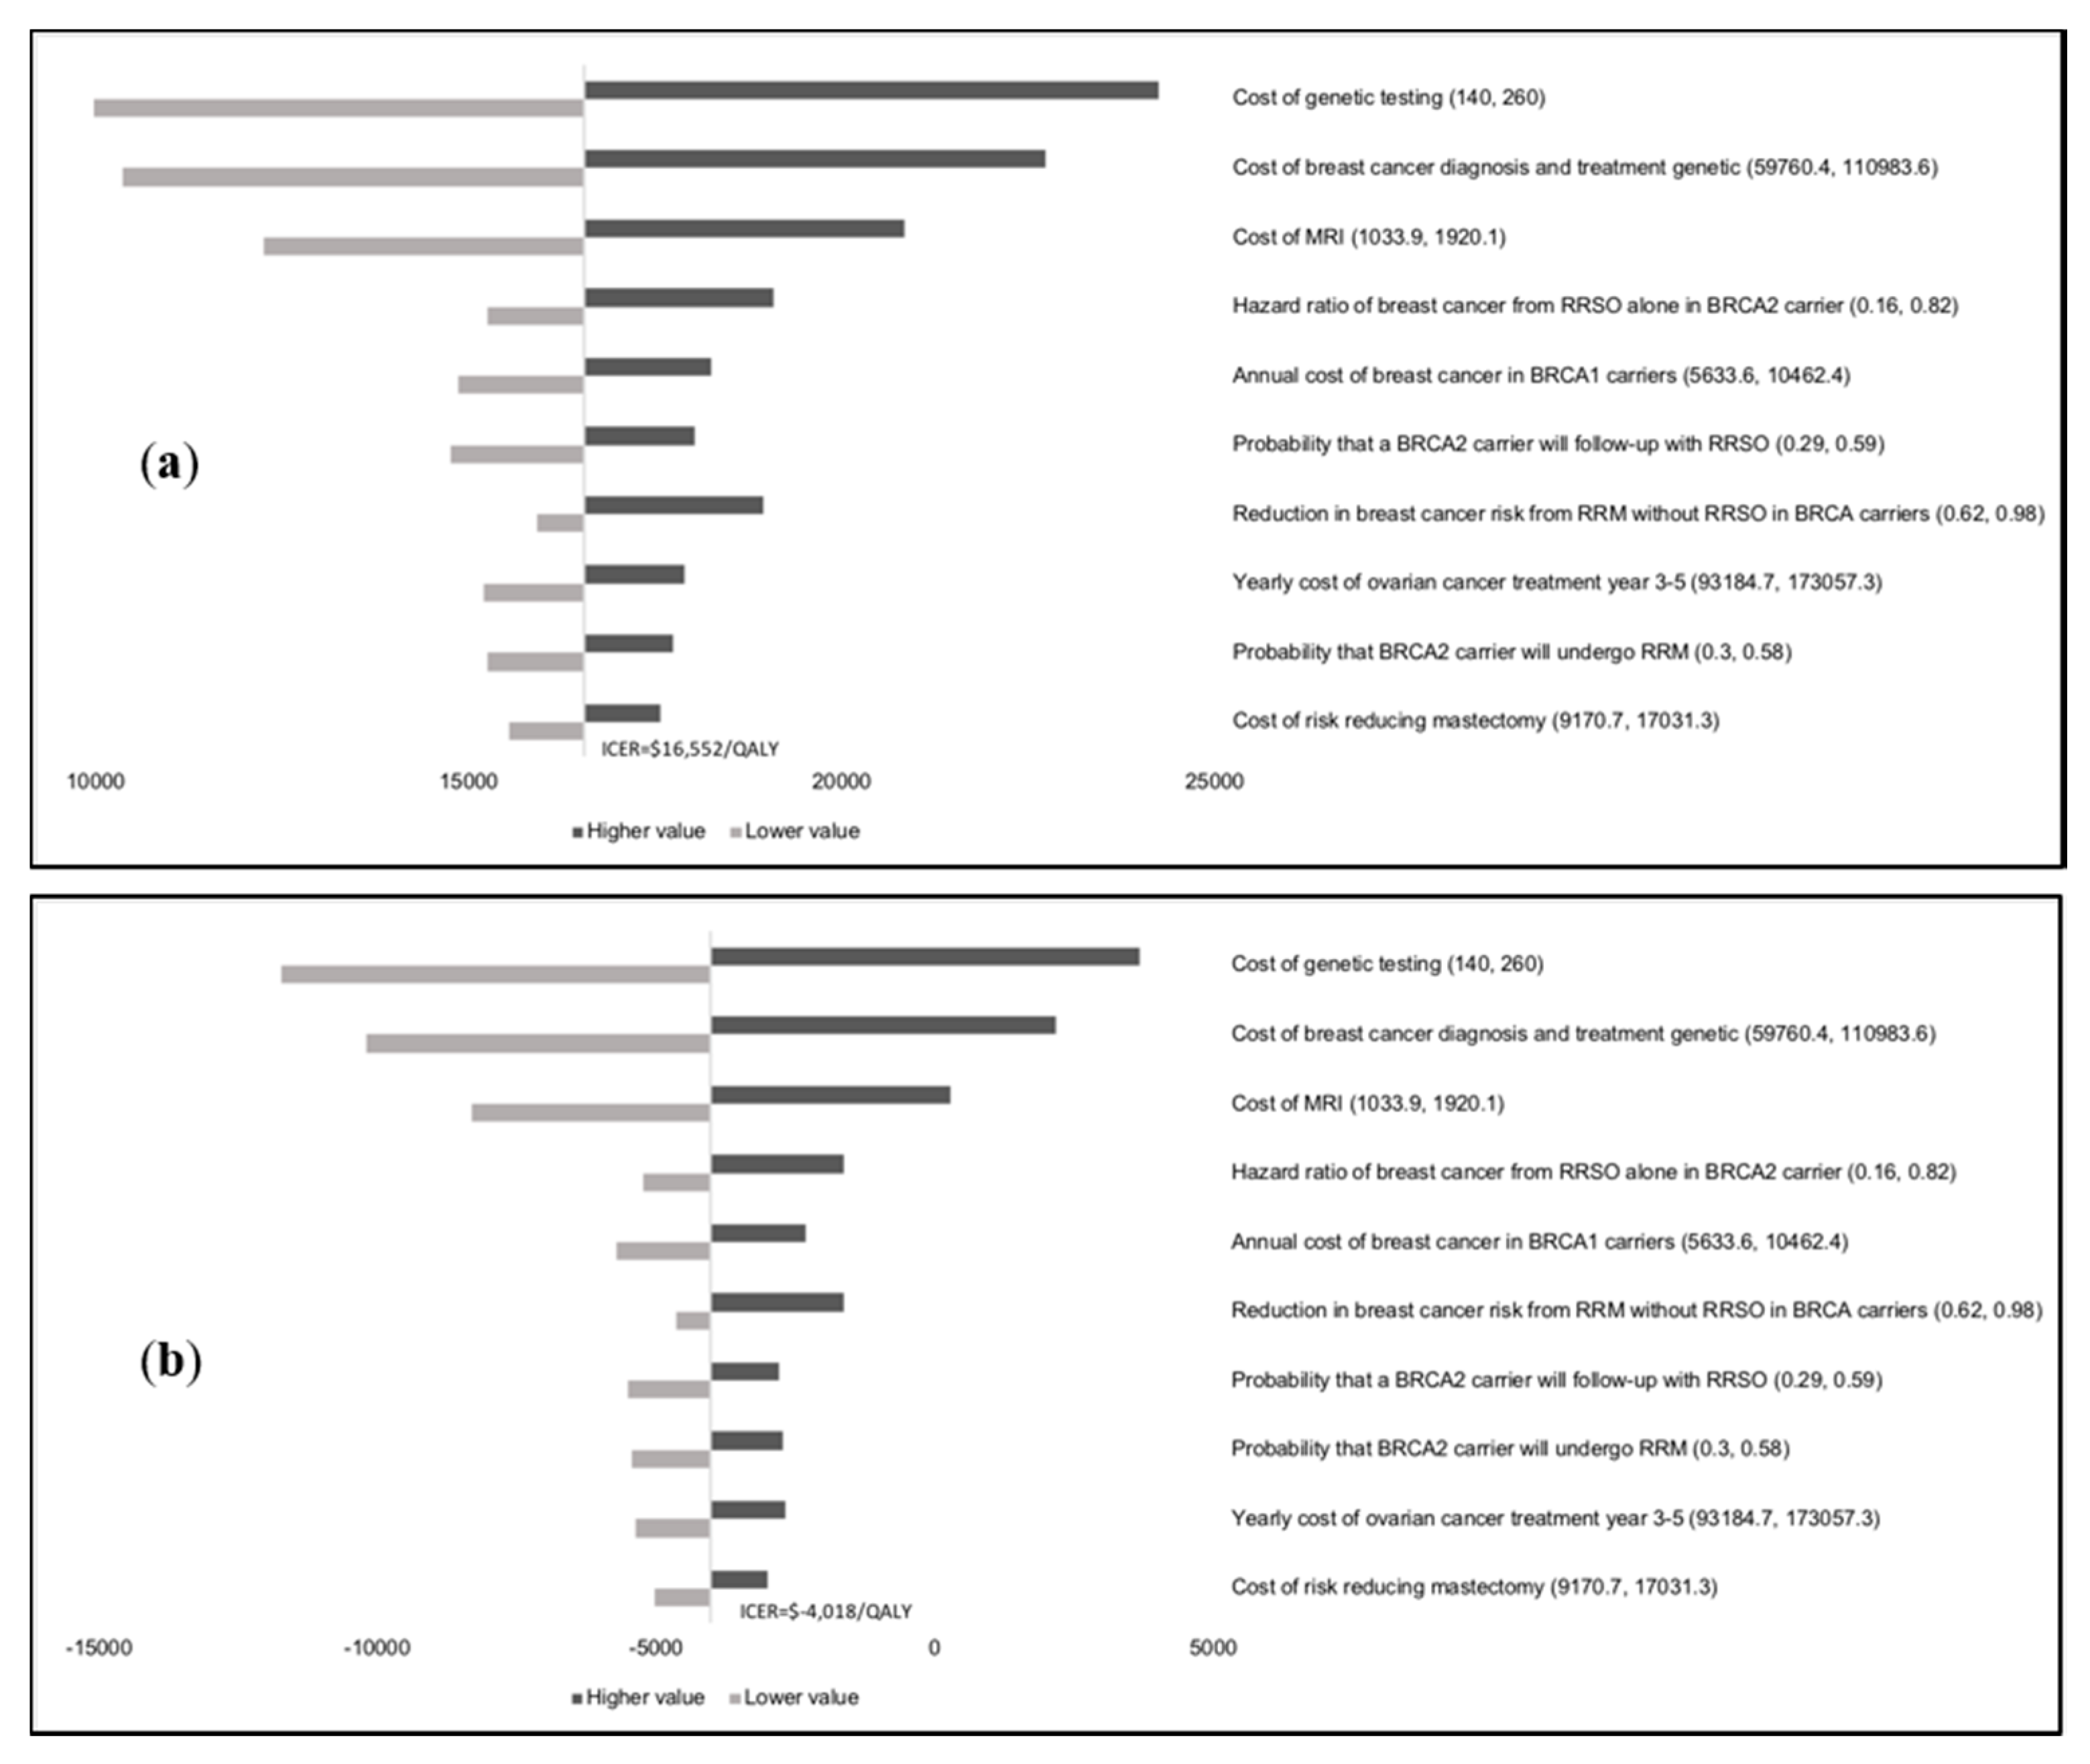
Results of the one-way sensitivity analysis indicate that model outcomes are not impacted much by treatment costs, utility scores, mutation prevalence, and probabilities (Appendix E). The variable with the maximum effect on ICERs is the cost of BRCA testing. Probabilistic sensitivity analysis (PSA) results (Figure 2) show that at the WTP thresholds in each country, a population-testing strategy is cost-effective compared to clinical-criteria/FH-testing strategy from both the payer and societal perspectives for HIC and UMIC but not LMIC countries evaluated. The PSAs were highly cost-effective for the evaluated HIC and UMIC countries. All (100%) simulations are cost-effective at the guideline-specific thresholds for the UK/USA/Netherlands from payer and societal perspectives. For the 3*GDP-based WTP threshold for China/Brazil/India, 100%/100%/22.2% for the societal perspective and 100%/100%/0% simulations for the payer perspective were cost-effective (Figure 2a,b). However, a population strategy becomes cost-effective in India (LMIC) at $172/test. At the country-specific WTP thresholds for UK/USA/Netherlands, 84.9%/100%/98.5% of simulations for the payer perspective were cost-effective, and 100% simulations for the societal perspective were cost-effective for all three countries).

3. Discussion

For the first time, we explore the cost-effectiveness of population-based BRCA testing across countries from HIC, UMIC and LMIC health systems. We show that population-based BRCA testing is extremely cost-effective across HIC/UMIC health systems assessed and is potentially cost-saving for HIC health systems (UK/USA/Netherlands) if analysed from a societal perspective. Societal perspective analyses are associated with lower ICER/QALY than the payer perspective, as it incorporates additional costs linked to productivity loss. There is increasing recognition of the importance and need for economic cost-effectiveness evaluations to conform to the societal perspective and is recommended by WHO/international bodies. This is particularly important in middle/lower–income countries that lack a robust/comprehensive state-funded social security system. However, some countries such as the UK only consider a payer perspective when making health policy.
A population-based BRCA testing approach can potentially prevent an additional 57,708/269,089/15,181/1,050,314/156,299/692,571 BC cases and 9727/43,817/2557/154,756/25,170/97,659 OC cases in the UK/USA/Netherlands/China/Brazil/India respectively (Table 2) compared to the current clinical strategy. Given the huge under-utilisation of BRCA testing along with limited access and uptake associated with current treatment pathways [11,12], one could postulate that the benefit could be even higher. Our findings are important, as we show that a new population-based approach can have much broader global applicability and a far greater impact on BC/OC burden in the population than current treatment strategies. Cost-effectiveness analyses are necessary to guide policy decisions on healthcare resource allocation. Our findings support a change in paradigm toward population testing to maximise OC/BC prevention and highlights a need for further implementation research in this area.
Our results are sensitive to the cost of testing, particularly in LMIC countries. BRCA testing costs need to fall further for population testing to be cost-effective in LMIC countries. In India, it would become potentially cost-effective at $172/test. Although our base case analysis uses costs higher than this, we are aware of Indian providers who offer BRCA testing for around $140/test. Genetic testing costs have fallen considerably over the last 5 years and remain on a downward trajectory. While we have used a standard cost for BRCA testing that is currently available across countries, some providers may charge more than this. Our analysis of maximum cost(s) of BRCA testing for a population testing strategy remaining cost-effective (Appendix D) shows that these lie above what is charged by a number of providers today.
The precise definition of an appropriate cost-effectiveness threshold remains an important issue of ongoing debate. While this has been clearly defined in some (particularly HIC) health systems, a WHO-CHOICE 3*GDP threshold is considered too high by some, as it ignores opportunity costs [30]. Additionally, whilst cost-effectiveness is a key factor for allocating health budgets, it needs to be considered along with context-specific local issues, affordability, budget impact, fairness, and feasibility [31]. Some advocate against a single fixed threshold and recommend a range of thresholds for different contexts. The Norwegian health system prioritises interventions based on health benefit, resource implications, and health loss to the beneficiary if the intervention was absent (higher priority for higher health loss to the beneficiary) [32]. We provide a range of cost estimates for BRCA testing linked to varying potential cost-effectiveness thresholds (ICER/QALY) from payer and societal perspectives to help decision makers in UMIC and LIC. This is important, as the main model parameter impacting the overall result is the cost of BRCA testing (Figure 1a,b).
Our analysis has several advantages. We follow the transparency principle to facilitate the interpretation of methodology and results and use current standard of care or best practice as the comparator for measuring costs and effects. As per NICE recommendations, we use QALYs to measure health outcomes, which captures both length of life and quality of life and is generalisable across disease states. Our economic evaluation uses a lifetime horizon that is long enough to capture all costs and effects relevant to the decision problem. Additionally, costs and effects are discounted to reflect their value at the time of decision making, ensuring that the potential time preferences of the relevant population are accounted for. Our base case reflects direct health-care costs and health outcomes, and our analysis includes a societal perspective. We explore heterogeneity through scenario analyses and uncertainty and variability through extensive one-way/PSA analyses, as recommended. Our results remain robust at parameter extremes on one-way analysis (Appendix E) and with PSA (Figure 2). Our analysis uses PPP (purchasing power parity), which is a mechanism for accounting for different relative costs of goods when undertaking a comparative analysis of expenditures and incomes in different countries. Besides OC/BC outcomes, we also included excess CHD deaths from premenopausal oophorectomy [33] and incorporate costs for HRT, excess heart disease, bone health monitoring, and treatment. Our costs also include pre-test counselling for all and post-test genetic counselling for pathogenic mutations and VUS.
Similar to other modelling studies, our study has some limitations. In line with earlier analyses in high-risk and low-risk women, our base case analysis assumes a reduction in BC risk with premenopausal oophorectomy. However, recently, there has been uncertainty around the benefit of BC risk reduction from RRSO. Nonetheless, our scenario analysis shows cost-effectiveness in HIC/UMIC even without BC risk reduction (Table 3). We use established surgical prevention rates from HIC in the base-case analysis (Table 4). However, RRM/RRSO rates vary, and lower rates are reported in some populations [34]. The uptake of breast screening, chemoprevention, and risk-reducing surgery may also be influenced by socioeconomic, demographic, and cultural factors and may vary across populations [34]. Rates of screening and preventive interventions have also increased with time. Higher rates are reported in the last 10 years compared to earlier decades, as knowledge and awareness of these issues has improved. Rates could be lower in carriers ascertained from population testing, particularly in the absence of cancer burden in the family. More prospective data on the uptake of surgical prevention following population-based testing will be needed. Our scenario analyses confirm cost-effectiveness for both payer and societal perspectives, even at half of standard surgical prevention rates (Table 3). Although we incorporate a disutility for RRSO and RRM in the analysis, these procedures have potential complication rates of around 3–4% and 21%, respectively [35,36]. This needs to be part of the informed consent and decision-making process. While RRSO has been reported to have high satisfaction rates, less cancer worry, and no detriment in generic quality of life; poorer sexual function despite HRT use has been found [37]. RRM has an adverse association with body image and sexual pleasure but not with sexual activity/habit/discomfort, anxiety/depression, or generic quality of life, and overall satisfaction rates are good. Countries such as India and China lack established national breast cancer screening programmes. The uptake of mammograms is much lower in these countries. The cost-effectiveness of population testing may be higher for these countries than estimated, as the implementation of these interventions in BRCA carriers are likely to be more beneficial in the absence of routine mammograms in the population. In our analysis, while we included productivity loss, we did not include all indirect costs in the analysis. This may be a limitation. However, including additional indirect costs would improve cost-effectiveness, so our analysis is conservative in that respect. While our analysis covers some important/key countries across different income groups, it does not cover most countries, and therefore, these results are not generalisable globally to all countries across different (HIC/UMIC/LMIC) income groups. While the countries represented in this analysis are from four continents—North America, South America, Europe, and Asia—we do not have representation from Africa or Australia. The populations of countries in our analysis contribute approximately 45% to the global population.
Population-based BRCA testing implementation studies have been completed in the Jewish population [15,21,22,38], and pilot ones are being undertaken in the UK and Canadian general populations [23]. For population testing to be feasible, newer approaches for delivering pre-test information will be needed to facilitate informed decision-making. These will need to be country/region or context-specific. The best modality to deliver pre-test education within the population testing setting remains unresolved. We do not feel there will eventually be a one-size-fits-all model. Although we have costed for pre-test counselling for all in our analyses, whether formal pre-test counselling will be needed for all in the future remains uncertain. Israeli and Canadian Jewish population studies provided only ‘pre-test information’ and post-test genetic counselling for BRCA carriers, with >90% satisfaction rates [39,40]. An Australian Jewish population [41] and a UK general population study have demonstrated the feasibility of an online web-based decision aid (along with an optional telephone helpline) pre-test education and consent process [42].
A strategy for the management of variants of unknown significance (VUS) is important and will need developing. People have raised concerns at unnecessary treatment or screening/preventive intervention(s) being undertaken for VUS alone. However, VUS are currently identified through routine clinical testing, too. There is clear acceptance in clinical practice that for a VUS (class-3 variant), no clinical action should be taken based on that variant alone [43]. A key presumption inherent in a public health screening strategy is that it is not designed to identify ‘all’ individuals with disease, but the large/significant proportion of individuals in a clinically efficient and cost-effective manner. Therefore, some suggest an alternative option of not providing VUS results within a population-testing context [14]. We incorporate a cost for VUS counselling and management in our analysis.
Chronic disease accounts for 90% US Medicare and 70% UK health care expenditure and is a major challenge facing most health systems, with cancer being its second commonest cause. Between 2006 and 2016, the average annual age-standardised incidence rates for all cancers increased in 130 of 195 countries [44]. The leading cause for women is BC: 1.7 million cases, 535,000 deaths, 14.9 million disability adjusted life-years (DALYs) [44]. Globally breast/ovarian cancers in women are predicted to increase by 46.5%/47% and cancer deaths are predicted to increase by 58.3%/58.6% respectively over the next 20 years [45]. Population testing for BRCA genes can significantly increase BRCA carrier detection rates for maximising prevention and reducing cancer burden. It can also serve as an initial model, which subsequently informs the potential applicability of a population testing risk-stratification strategy for other cancer genes and other chronic diseases.
While developing an approach towards implementing population-based BRCA-testing, it is important to bear in mind the principles of population testing of disease. These were initially proposed by Wilson and Jungner [46]. Updated criteria have been suggested by the UK National Screening Committee [47], Khoury [48], the CDC (ACCE model) [49], and Burke and Zimmerman (Public Health Foundation) [50]. Analytic validity, clinical validity, clinical utility, and associated ethical, legal, and social implications remain key principles of the ACCE model, providing a framework for evaluating the applicability of a genetic test [49]. In our study, we focussed on BRCA testing, as testing for these genes has well-established clinical utility fulfilling the ACCE principles. Multigene panel testing is widely available in current clinical practice. We are against indiscriminate large-scale commercial panel testing without well-established clinical benefit/utility in the population-testing context. The low incidence of moderate penetrance genes, poor precision, and wide confidence intervals around prevalence and penetrance estimates require more data on the clinical significance of pathogenic variants in multigene panels, and these are reasons against currently implementing large multigene panel testing in the general population [51,52]. The USPSTF currently recommends against population testing in the general population [51]. More data are needed on the ‘E’ (Ethical, legal, and social implications) of a population-based BRCA testing approach across different populations and health systems. There is an urgent need for multiple implementation studies across countries for evaluating general population BRCA testing and to develop local/regional and context-specific implementation pathways. These studies will need to provide prospective data on the impact of population testing on psychological well-being, quality of life, long-term health behaviour, socio-ethics, and lifestyle outcomes. A number of challenges and logistic hurdles will need to be overcome, including varying levels of workforce expansion/upskilling and the reorganisation of health services infrastructure. These include increasing public and health-professional awareness, establishing/expanding laboratory testing infrastructure, expanding downstream management pathways, and involving general practitioners, genetics services, gynaecologists, and breast clinicians/services. A framework/structure for data management and legal and regulatory protections will need to be established. These changes will need to be system/country and context-specific.

4. Materials and Methods

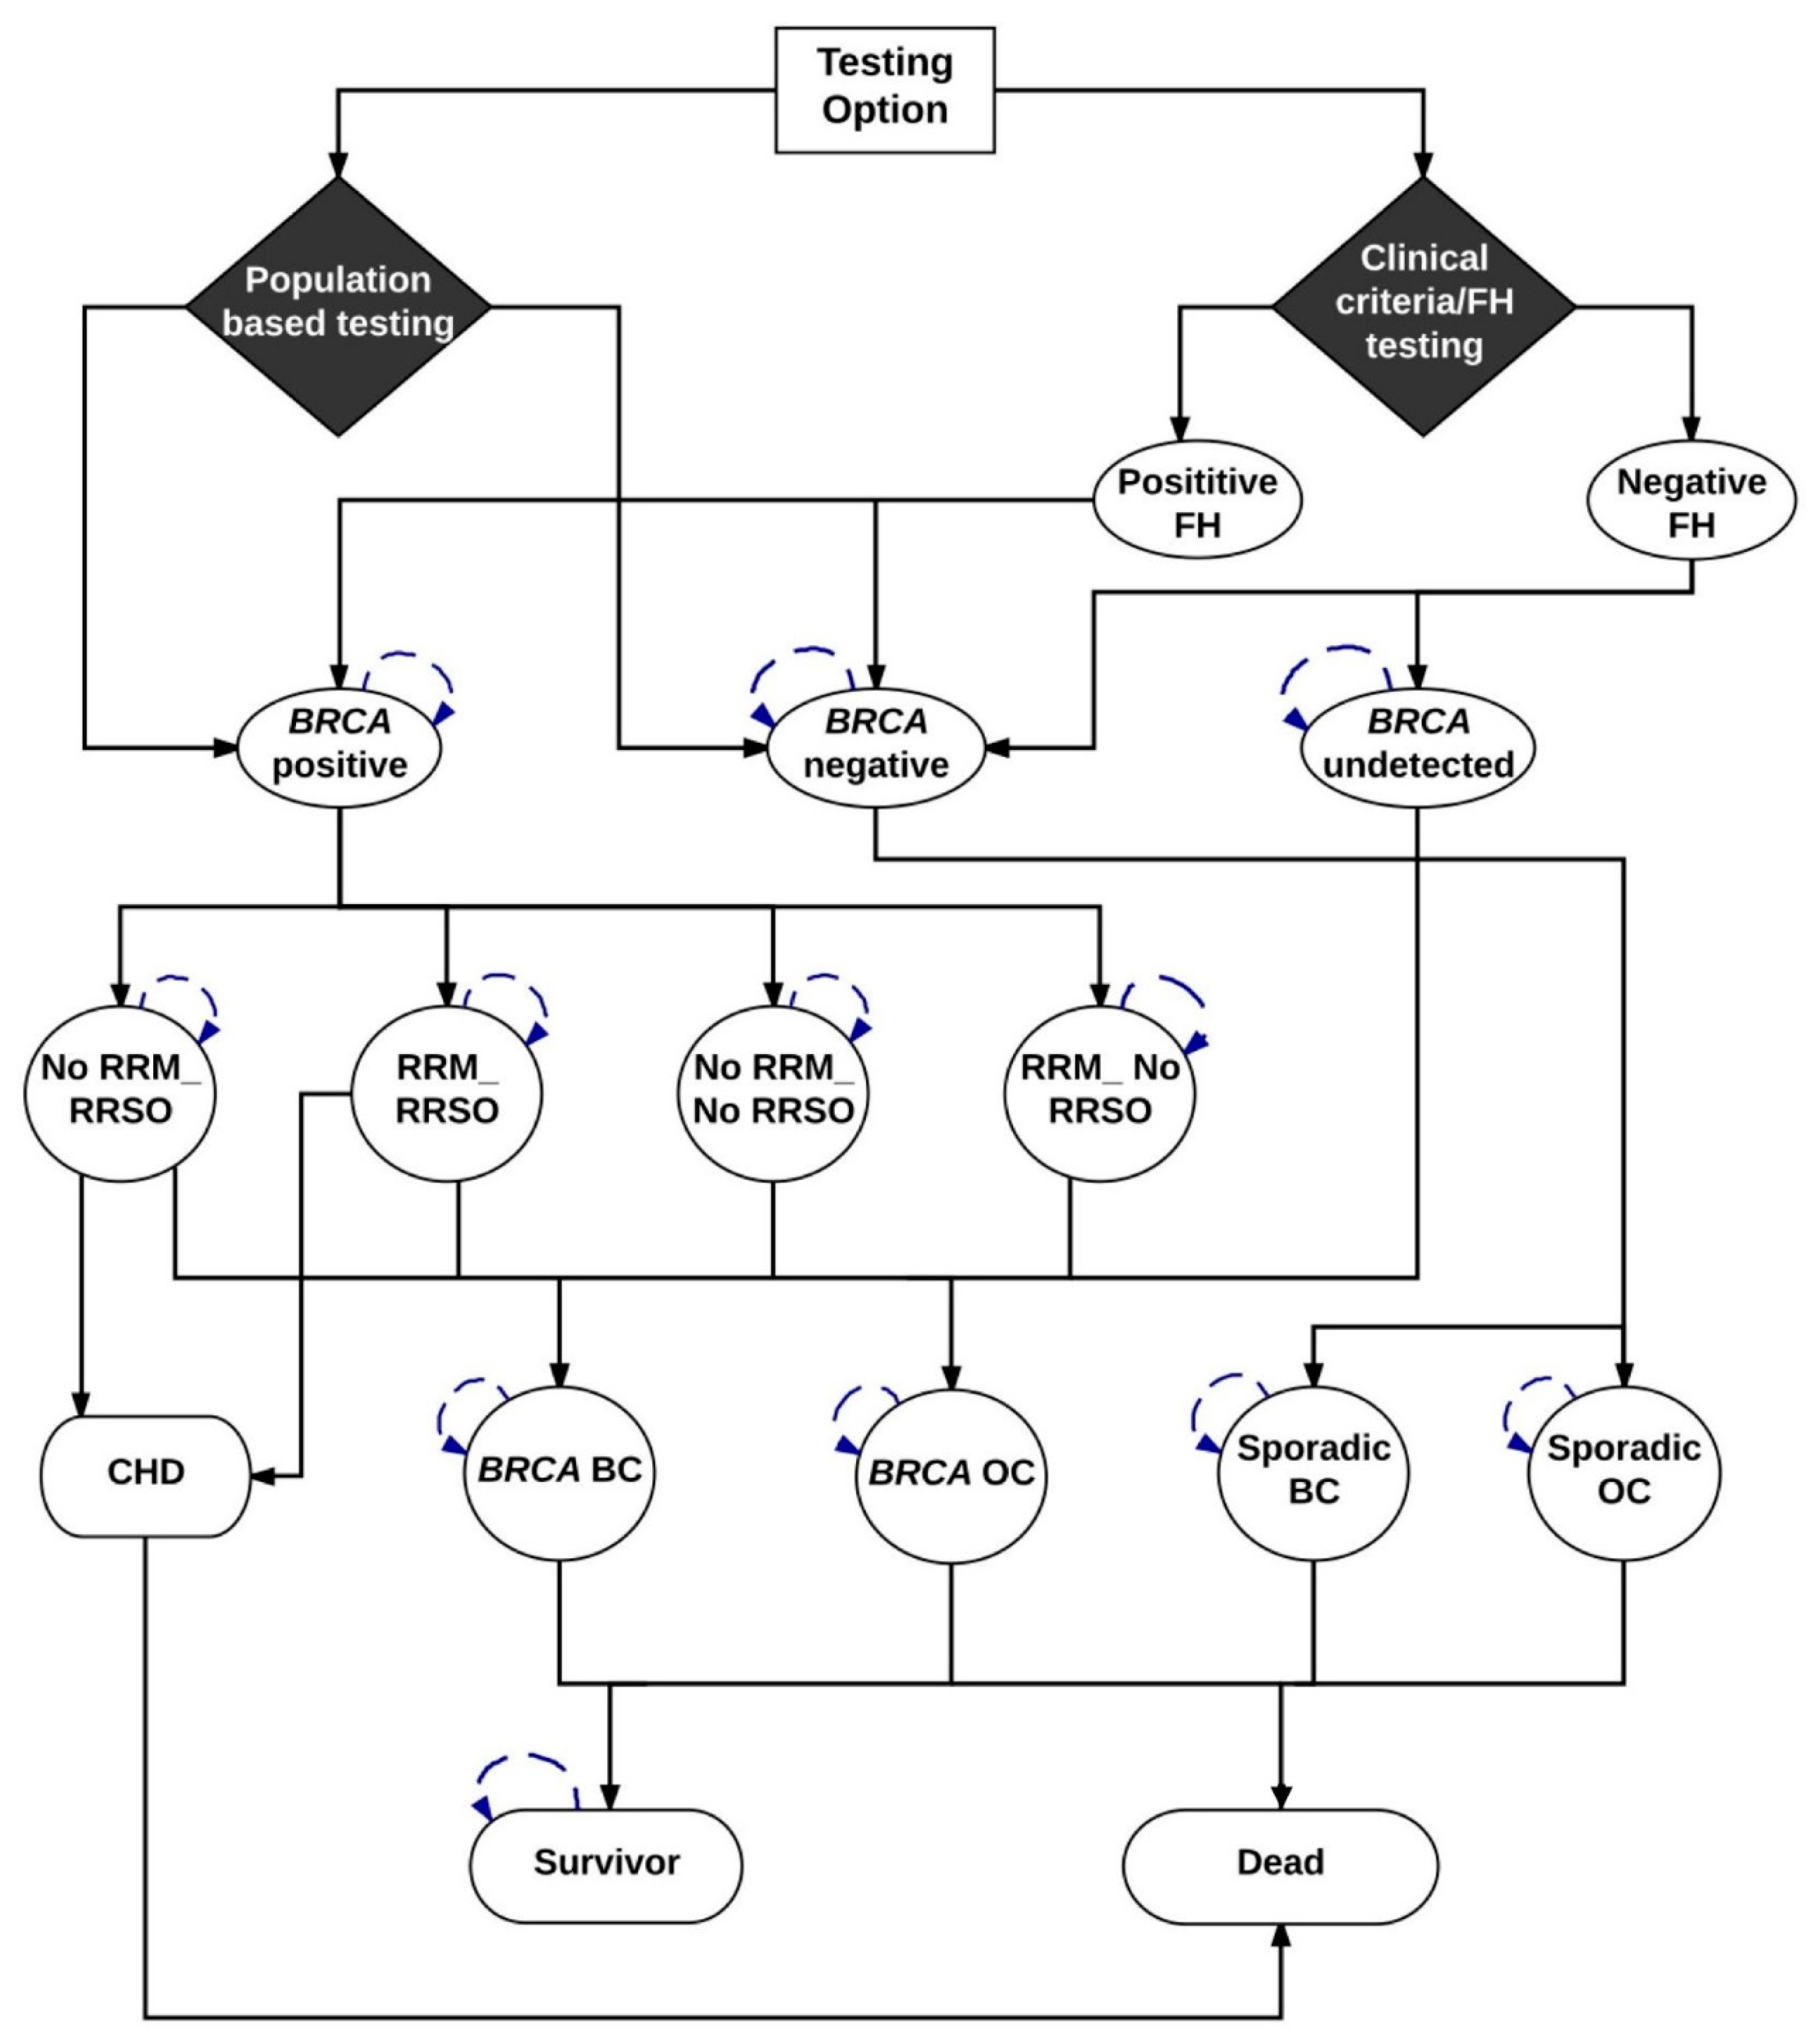
We developed a Markov model (Figure 3) (TreeAge-Pro-2018 Williamson, MA, USA) to compare the lifetime costs and effects of BRCA1/BRCA2 testing all general population women ≥30 years compared with clinical-criteria/FH-based testing. We describe separate analyses for populations in the UK, USA, Netherlands, China, Brazil, and India using both payer and societal perspectives. While some countries only consider a payer perspective, a societal perspective is recommended by the WHO and other international bodies [53]. In the model, all women ≥30 years in the Population testing arm and only those fulfilling clinical/FH criteria in the Clinical-Criteria/FH-based testing arm undergo genetic testing for BRCA mutations. We include pre-test counselling for all and assume a 70% uptake of genetic testing (from the published literature) [22]. We include the cost of post-test counselling for mutation carriers as well as the cost of post-test counselling for those with variants of uncertain significance (VUS). We assume a VUS prevalence of 2% [54]. Model probabilities are described in Table 4, Appendix A, and costs are outlined in Appendix B. BRCA carriers identified are offered RRSO to reduce OC risk [4] and MRI/mammography screening, chemoprevention with SERM or RRM [8] to reduce their BC risk [10]. OC screening is excluded given the lack of mortality benefit. Women undergoing RRSO receive hormone replacement therapy (HRT) until 51 years. We include the costs of bone health monitoring and dual energy X-ray scans. We incorporate the excess risk and mortality from coronary heart disease (CHD) after premenopausal RRSO for women who do not take HRT (absolute mortality increase = 3.03%) [33]. Associated costs are modelled over an individual’s lifetime. The Markov cycles’ run depends on life expectancy and these are different across countries (starting from age 30): UK = 53 cycles, US = 52 cycles, Netherlands = 53 cycles, China = 48 cycles, Brazil = 49 cycles, and India = 38 cycles. Cancer incidence is estimated by summing the probabilities of pathways ending in OC or BC.

4.1. Probabilities

The model probabilities for different pathways are given in Table 4, and a detailed explanation is given in Appendix A. The age-specific incidence of BC and OC among general population women is obtained from Cancer Research UK [55,56], USA Cancer Statistics [57], and the International Agency for Research on Cancer (GLOBOCAN-2018) [58]. The BC/OC incidence for BRCA1/BRCA2 carriers is obtained from the literature [3].
Figure 3 is a schematic diagram showing the Markov model structure for population and clinical-criteria/family-history (FH)-based BRCA1/BRCA2 testing. In the Population testing arm, all women ≥30 years old are offered BRCA1/BRCA2 testing and get classified as BRCA-positive and BRCA-negative. BRCA mutation carriers identified are offered options of risk-reducing mastectomy (RRM) and risk-reducing salpingo-oophorectomy (RRSO). Depending on the probability of BRCA women undertaking RRM and/or RRSO (+/− chemoprevention), they are placed into different health states and then progress to either BRCA-associated breast cancer (BC) or BRCA-associated ovarian cancer (OC). All women undergoing RRSO have an increased risk of fatal coronary heart disease (CHD). In addition, they have a probability of dying from the background all-cause mortality. Hence, patients in the model can go from intervention to death without ever developing breast cancer, ovarian cancer, or coronary artery disease. Patients can move from healthy state to death as they have a probability of dying from the background all-cause mortality. BRCA-positive women who do not progress or die would stay in the health states and undertake the next cycle. BRCA1/BRCA2-negative women progress to sporadic non-BRCA OC or non-BRCA BC based on the age-dependent probabilities. They also have a probability of dying from the background all-cause mortality. Women do not progress or die would stay in the health states to undertake the next cycle.
In the Clinical criteria/FH arm, only women whose FH fulfil current clinical criteria (based on current guidelines) undergo BRCA1/BRCA2 genetic testing and get classified as BRCA-positive and BRCA-negative. Women with a negative FH are either BRCA negative or have an undetected BRCA mutation. Options of RRM and RRSO and disease progression for identified BRCA mutation carriers and disease progression for BRCA negative women are the same as those in the population testing arm and are described above. All women undergoing RRSO have an increased risk of fatal coronary heart disease (CHD). Undetected BRCA women are not offered RRM or RRSO. Depending on the baseline risk (no risk-reducing options), they progress to BRCA-associated BC or BRCA-associated OC. In addition, they have a probability of dying from the background all-cause mortality. Hence, patients in the model can go from intervention to death without developing breast cancer, ovarian cancer, or coronary artery disease. Patients can move from healthy state to death as they may die from the background all-cause mortality. Women who do not progress or die stay in the health state of BRCA undetected and undertake the next cycle.
Progression through the model is dependent on the probabilities provided in Table 4.

4.2. Costs

The analysis was conducted from both a payer perspective and societal perspective. All costs are reported at 2016 USA dollars, which was converted by purchasing power parity (PPP) factor [28]. PPP reflects the value of a country’s currency required to purchase equivalent amounts of goods and services in the domestic market as the USA dollar would buy in the USA. Thus, it is used to translate and compare costs of goods/services between countries using the USA dollar as a common reference point. For comparison, we convert values in all other country currencies (£s, €s, ¥, ₹, R$) to $ (USA) using the purchasing power parity (PPP) factor [28]. In line with the National Institute of Health and Care Excellence (NICE) recommendations, future healthcare costs not associated with BC/OC/heart disease were not considered [25]. We collected primary data on relevant direct medical costs from the Urban Basic Medical Insurance Database in China [65]; the Dutch Healthcare Authority (NZA) in Netherlands; Management System of Procedures/Medical drugs/Orthotics/Prosthetics/Special Materials (SIGTAP) [66], the Health Price Bank (BPS) [67], and Chamber of Regulation of the Market of Medicines (CMED) [68] in Brazil; and an accredited cancer centre (Tata Medical Centre) in India (details in Appendix B). Costing data were obtained from published national health service (NHS) reference costs for the UK [69,70] and published literature for the USA (details in Appendix B). We adopted a standard internationally available BRCA testing cost (US $200) for our base case and explored the impact of change in testing costs on the overall results in the sensitivity analyses.
The retirement ages for females are 65 in the UK, 62 in the USA, 50–55 in China, 60 in Brazil, 68 in Netherlands, and 60–65 in India. We used the lower values of the retirement age ranges in China and India to get the conservative estimates of productivity loss. The female labour force participation rates are 56.77% in the UK, 55.99% in the USA, 62.03% in China, 53.32% in Brazil, 58.02% in the Netherlands, and 27.45% in India, which were obtained from the World Bank [71]. For the hourly wage rates across countries, see Appendix C. Additionally, we categorised costs due to productivity loss (for details: see Appendix C) as three subcomponents: (1) temporary disability due to short-term work absences following diagnosis, (2) permanent disability from reduced working hours following return to work or workforce departure; and (3) premature mortality due to death before retirement [72]. We estimated temporary disability as time absent from work multiplied by age-specific gross earnings. We calculated productivity costs due to permanent disability by applying age-specific gross earnings to the reduction in working hours, or the number of working hours in cases of permanent workforce departure, until retirement age. Regarding productivity loss from premature mortality, we assumed that without cancer, the productive capacity of an individual would continue from the age of diagnosis until the age of retirement. We multiplied the projected years of life lost by the age-specific gross earnings for the remainder of the working life to generate monetary estimates (see Appendix C). While we included productivity loss, we did not include all indirect costs in the analysis.

4.3. Life Years

Lifetime tables from each country were used to model the lifetime health outcomes, and these were obtained from the World Health Organisation (WHO) [73]. The median ages for RRM and RRSO in unaffected BRCA carriers were assumed to be 37 and 40 years [60]. BC and OC survival were modelled using five-year survival data from the CONCORD global surveillance of cancer survival [74]. No significant overall long-term survival differences between germ-line and sporadic BC/OC have been found [75,76,77]. After five years, the probability of death was assumed to be the same as that of the general population. Modelling estimated the number of BC cases, OC cases, BC deaths, OC deaths, and excess CHD deaths per million women aged 30 years in the six countries, and it calculated the number of cases prevented and deaths prevented. The actual numbers of cases prevented and deaths prevented were estimated based on the number of female population aged over 30 years in the six countries [29].

4.4. Quality-Adjusted Life Years (QALY)

QALYs are recommended by NICE as the appropriate summary measure of health effects for economic evaluation. Utility scores multiplied by life years provides QALYs. QALY = (survival in life years) x (utility score). Utility score is an adjustment for quality of life. It is an indication of individual preferences for specific health states where 1 = perfect health and 0 = death. The utility scores for early, advanced, recurrent, and end-stage breast cancer are 0.71, 0.65, 0.45, and 0.16 [78]. The utility scores used for early, advanced, recurrent, and end-stage OC are 0.81, 0.55, 0.61, and 0.16, respectively [79]. Additionally, utility scores used for RRM is 0.88 (SD = 0.22) and RRSO is 0.95 (SD = 0.10) [80].

4.5. Analysis

The Markov model is illustrated in Figure 3. Model outcomes include OC, BC, and excess deaths from CHD. Future costs and health effects are discounted at WHO-recommended 3% rate for the WHO analyses [81] and at country-recommended rates for country-specific analyses (see Table 1). The lifetime costs and QALYs were estimated in both population-testing and clinical-criteria/FH-testing arms. The incremental cost-effectiveness ratio (ICER) was calculated by dividing the difference in cost by the difference in health effects between these two strategies. ICER = (CostPopulation-Testing–CostCriteria/FH-testing)/(EffectPopulation-Testing–EffectCriteria/FH-testing). The potential population impact was estimated by calculating the additional reduction in BC and OC incidence/deaths obtained through BRCA testing women aged >30 years. We present analyses using a range of cost-effectiveness thresholds. For all countries, we present the initial WHO recommendation of three times gross domestic product (GDP) per capita (threshold of being cost-effective) and one-time GDP per capita (threshold for being highly cost-effective) [82]. For countries (UK [25], USA [26], Netherlands [27]) with specific health economic willingness-to-pay (WTP) threshold guidelines, we also present analysis using those guidelines: UK = £20,000–30,000 [25]; USA = $50,000–100,000 [26]; Netherlands = €20,000–50,000. [27] Additionally, given the lack of a clear established threshold, we evaluate changes in ICER/QALY with BRCA testing costs for China, Brazil, and India to identify the BRCA testing cost threshold for a given economic cost-effectiveness threshold. We use $ (USA) conversion with PPP for comparison [28].
We also explored a number of scenario analyses, including: (1) no BC risk reduction from RRSO (p9 = 1); (2) no HRT uptake (p13 = 0); (3) 50% reduction in RRM uptake; (4) 50% reduction in RRSO uptake; (5) lower BRCA-testing costs of $100; and (6) the maximum genetic testing costs at which population BRCA testing remains cost-effective (see Table 3, Appendix D). In the one-way sensitivity analysis, each parameter is varied to evaluate their individual impact on results. Probabilities and utility scores were varied according to 95% confidence intervals or ranges where available or by +/−10%. Costs were varied by +/−30%. Probabilistic sensitivity analysis (PSA) was undertaken, and parameters varied simultaneously across their distributions. Costs were specified as having a Gamma distribution, quality of life was specified as having a log-normal distribution, and probability was specified as having a beta distribution, as recommended [83]. A cost-effectiveness acceptability curve was used to plot the results of 1000 simulations for each country, showing the probability of population-based BRCA testing being cost-effective at different WTP thresholds. Different curves were generated for payer and societal perspectives.

5. Conclusions

The increasing societal awareness and acceptability of genetic testing, falling costs, computational advancements, and technological advancements provides the ability to implement large-scale population testing. We have demonstrated the potential cost-effectiveness of BRCA testing on a much broader scale in the general population and across a number of health systems. This is cost-effective for HIC and UMIC health systems and can prevent tens of thousands more BC and OC than the current clinical strategy. Such an approach can bring about a new paradigm for improving global cancer prevention. Context-specific implementation strategies and pathways for population testing need to be developed. A number of implementation studies providing data on the impact of population BRCA testing on real-world outcomes are needed. All this is essential for population genomics to achieve its potential for maximising early detection and cancer prevention.

Author Contributions

Conceptualisation, R.M.; methodology, L.S., S.P., R.M. and R.L. software, L.S.; validation, L.S., S.P., R.M., and R.L.; formal analysis, L.S., R.M., S.P., R.L., A.B., S.D., and Z.S.; data curation, J.W., H.B., A.M., Z.H., L.S., L.Y., B.C., P.C.D.S., J.H., F.G., and O.E.; writing—original draft preparation, R.M., L.S., and R.L.; writing—review and editing, all authors.; visualisation, L.S., R.M., R.L., F.G., and O.E.; All authors have read and agreed to the published version of the manuscript.

Funding

R.L., L.Y. and L.S. are supported by travel costs funded by the Royal Society UK and National Natural Science Foundation of China (7181101283). R.M. is supported through an NHS Innovation Accelerator Fellowship and by The Eve Appeal. A.B. is supported by C569/A16891 grant from Cancer Research UK.

Acknowledgments

We are grateful to Melissa Southey (Monash University, Australia) for her support of this work. The study is supported by researchers at the Barts Cancer Research UK Centre for Excellence, Queen Mary University of London (C16420/A18066). This study/analysis received full ethics approval from the Institute of Child Health/ Great Ormond Street Hospital Research Ethics Committee on (REC Reference number 08/H0713/44, Substantial Amendment 3/7/2018).

Conflicts of Interest

R.M. is supported by a NHS Innovation Accelerator Fellowship. R.M. declares research funding from The Eve Appeal and Cancer Research UK into population testing and funding from Barts & the London Charity and Rosetree Trust outside this work, as well as an honorarium for grant review from Israel National Institute for Health Policy Research and honorarium for advisory board meeting for MSD and Astrazeneca. The study is supported by researchers at the Barts Cancer Institute Cancer Research UK Centre for Excellence, Queen Mary University of London (C16420/A18066). A.B. is supported by a Cancer Research UK Grant (C569/A16891). The other authors declare no conflict of interest. The funders had no role in the design of the study; in the collection, analyses, or interpretation of data; in the writing of the manuscript, or in the decision to publish the results.

Appendix A. Probability Values and Explanation

Table A1. Probability Values.
ProbabilityDescriptionValue(95% CI) (Range)Source
P1BRCA1/2 mutation prevalence in general population 0.0067(0.0059, 0.0077)[59]
P2Probability that carriers will undergo RRM0.47(0.34, 0.56)[60]
P3Reduction in ovarian cancer risk from RRSO 0.96(0.8, 0.96)[4,6]
P4Probability of having a positive FH0.0098(0.0047, 0.0179)ABCFS
P5BRCA1/2 mutation prevalence in FH positive individuals0.1 [84]
P6BRCA1/2 mutation prevalence in FH negative individuals0.0058(0.0051, 0.0068)[59], ABCFS
P7Reduction in breast cancer risk from RRM without RRSO in BRCA1/2 carriers0.91(0.62, 0.98)[8]
P8Probability that carriers will undergo RRSO0.55(0.45, 0.64)[61]
P9Hazard ratio in breast cancer risk from RRSO alone0.49(0.37,0.65)[4]
P10Reduction in risk of breast cancer from RRM with RRSO0.95(0.78, 0.99)[8]
P11Excess CHD risk0.0072(0.0068, 0.0076)[33]
P12Fatal CHD risk0.0303(0.011, 0.043)[33]
P13Compliance with HRT0.8(0.76, 0.83)[62]
P14HR of breast cancer risk from breast cancer chemoprevention0.71(0.6, 0.83)[63]
P15Uptake of breast cancer chemoprevention0.163(0.136, 0.19)[64]
95%CI—95% confidence interval, ABCFS—Australia Breast Cancer Family Study, CHD—coronary heart disease, FH—family history, RRM—risk-reducing mastectomy, RRSO—risk-reducing salpingo-oophorectomy.

Explanations

P1: BRCA1/2 mutation prevalence in the general population is calculated based on Jervis 2015 [59].
P2: The probability that unaffected carriers will undergo RRM is taken from an analysis of UK BRCA1/2 carriers by Evans et al. 2009 [60]. A composite uptake rate for BRCA1 (60% RRM rate) and BRCA2 (43% RRM rate) carriers weighted for the relative prevalence of BRCA1 and BRCA2 mutations was computed [60].
P3: The reduction in ovarian cancer risk obtained from RRSO is taken from previous studies which report a 4% residual risk of primary peritoneal cancer following RRSO [6].
P4: The probability of having a positive family history in general population is obtained from the Australia Breast Cancer Family Study (ABCFS).
P5: The overall BRCA1/BRCA2 mutation prevalence (10%) among FH-positive breast cancer patients is based on the current testing guideline.
P6: The BRCA1/2 mutation prevalence in FH negative individuals is calculated based on the BRCA1/2 mutation prevalence in the general population, the BRCA1/2 mutation prevalence in FH-positive individuals, and the probability of having a positive FH.
P7: The reduction in breast cancer risk from RRM in BRCA1/BRCA2 mutation carriers not undergoing RRSO is taken from the PROSE study data by Rebbeck et al. 2004 [8].
P8: The uptake of RRSO in unaffected BRCA1/BRCA2 carriers is taken from a study among high-risk UK women [7].
P9: The hazard ratio for breast cancer in premenopausal unaffected BRCA1/BRCA2 women undergoing RRSO alone is taken from a meta-analysis by Rebbeck et al. 2009 [4].
P10: The reduction in breast cancer risk in BRCA1/BRCA2 mutation carriers undergoing RRM and RRSO is taken from the PROSE study data by Rebbeck et al. 2004 [8].
P11: Excess risk of CHD after RRSO is estimated using data from Parker 2013 [33]. The absolute excess CHD incidence is obtained by subtracting CHD incidence in women undergoing RRSO from those who have not.
P12: The risk of CHD mortality is obtained from the Nurses Health Study (Parker et al. 2013) [33]. Death from CHD is reported in 1 in 33 premenopausal women undergoing RRSO and not taking HRT [33].
P13: HRT compliance rate is obtained from a UK cohort (Read et al., 2010) [62].
P14: The Hazard Ratio for breast cancer risk from chemoprevention in high-risk women is obtained from the extended long-term follow-up of the IBIS-I breast cancer prevention trial (Cuzick et al. 2015) [63].
P15: The uptake of breast cancer chemoprevention is obtained from a recent meta-analysis by Smith et al. 2016 [64].

Appendix B. Medical Costs in 2016 Values (USA Dollars Converted by PPP)

Table A2. Medical costs in 2016 values (USA dollars converted by PPP).
Cost descriptionsUKUSNetherlandsChinaBrazilIndia
GBPUSDUSDEURUSDRMBUSDBRLUSDINRUSD
Cost of genetic testing 200200 200 200 200 200
Cost of genetic counselling2942425567001356873342
Cost of prophylactic bilateral salpingo-oophorectomy279939997904371345844525130895748382,3684712
Cost of ovarian cancer diagnosis and treatment14,26820,383133,12123,23828,68912,991375512,5646345613,66235,107
Annual cost of ovarian cancer in years 1 to 25433776114,63510,86513,41348,49514,01644422244290,08616,595
Annual cost of ovarian cancer in years 3 to 55090727114,63510,48012,93948,02113,87942782161280,72016,059
Terminal care cost with ovarian cancer16,45223,50393,00511,32513,98110,0602907135868680,6234612
Cost of risk reducing mastectomy4143591913,101295036422634761867438278,47415,931
Annual cost of hormone replacement therapy6086526176214862121711015,595892
Cost of mammography608515695117822442212051117
Cost of MRI20329014772152656051752521277222413
Cost of breast cancer diagnosis and treatment in general population18,14825,92685,37211,97714,78674,95921,66423,21811,726226,45112,955
Annual cost of breast cancer in general population1388198280482718335512,36035722328117655,5193176
Cost of breast cancer diagnosis and treatment in BRCA1/2 carriers16,49923,57078,96410,78013,30968,47619,79120,86110,536200,90211,493
Annual cost of breast cancer in BRCA1/2 carriers1400200080482656327910,82731291999100953,9593087
Terminal care cost with breast cancer16,45223,50368,02211,32513,98110,0602907135868680,6234612
Cost of fatal coronary heart disease3387483923,9343008371411,97234602953149147,6732727
Annual cost of excess coronary heart disease1221757277109134526152124633708212
Annual cost of chemoprevention192789936459327499252624
CHD—coronary heart disease, HRT—hormone replacement therapy, MRI—magnetic resonance imaging, RRM—risk-reducing mastectomy, RRSO—risk-reducing salpingo-oophorectomy, PPP—purchasing power parity.

Appendix B.1. Explanations

All costs are adjusted for 2016 consumer price index.
For comparison, we convert values in all other country currencies (£s, €s, ¥, ₹, R$) to $ (USA) using purchasing power parity (PPP) factor [28].
We collected primary data on relevant direct medical costs from the Urban Basic Medical Insurance Database in China [65]; the Dutch Healthcare Authority (NZA) in Netherlands; Management System of Procedures/Medical drugs/Orthotics/Prosthetics/Special Materials (SIGTAP) [66], the Health Price Bank (BPS) [67] and Chamber of Regulation of the Market of Medicines (CMED) [68] in Brazil; and an accredited Cancer Centre (Tata Medical Centre) in India. UK costing data were obtained from published NHS reference costs for the UK [69,70].

Appendix B.2. Cost of Genetic Testing/Counselling

We use a standard international cost for genetic testing for all countries (US$ 200 in 2016). We assume a 71% uptake of genetic testing (based on our previous population based research studies) [22]. All participants have pre-test counselling and post-test counselling is received by those testing positive (pathogenic/likely pathogenic carriers). We assume a VUS prevalence of 2% and include the cost of post-test counselling for VUS in these 2% cases [54].
The cost of BRCA1/BRCA2 testing is based on testing costs for these genes in our population testing research programme as well as confirmatory testing costs in an accredited national genetics laboratory for those testing positive. The UK national unit cost assumed for genetic counselling is £44 per hour of client contact from PSSRU Unit costs of Health and Social Care 2010 [22,85,86]. The US genetic counselling costs are obtained from Schwartz 2014 and include ancillary preparation (scheduling/administration), counsellor preparation, and counselling [87]. The genetic counselling costs in the Netherlands, Brazil, and India were obtained from primary data. There is no additional physician genetic counselling cost charged from patients in China; hence, this was not incorporated for Chinese analysis.

Appendix B.3. RRSO Costs

The UK RRSO costs are obtained from NHS reference costs [88], and the US costs are from Grann 2011 [89] inflated using the medical component of the USA consumer price index to 2016 US$. Costs of HRT for the UK are taken from BNF [90] and for the USA from William-Frame 2009 [91]. The costs of RRSO and HRT in Netherlands, China, Brazil, and India are obtained from primary data. Costs assume HRT is given from average age of RRSO to the average age of menopause (51 years). These costs are calculated for the 80% assumed to be compliant with HRT. Costs include the cost of three follow-up DEXA scans for monitoring bone health and calcium and vitamin-D3 for additional osteo-protection.

Appendix B.4. RRM

The UK RRM costs are obtained from NHS reference costs [88], and the USA costs are from Grann 2011 [89] inflated using the medical component of the US consumer price index to 2016 US$. The RRM costs in Netherlands, China, Brazil and India are obtained from primary data.

Appendix B.5. Costs of Ovarian Cancer

We assume that the costs of ovarian cancer diagnosis include a pelvic examination, ultrasound scan, CA125 test, CT scan, percutaneous biopsy, and peritoneal cytology. The costs of ovarian cancer treatment include the reference cost for a lower and upper genital tract very complex major procedure and administration of chemotherapy based on 6 cycles of carboplatin and paclitaxel treatment. It is assumed that in the first and second years, treated survivors would have a further three consultant visits, a CT scan, and four CA125 tests each year. In the third to fifth years post-surgery, it is assumed that survivors would have two consultant visits and two CA125 tests.
Costs for ovarian cancer diagnosis and treatment in the UK are derived from national reference costs and a recent ovarian cancer guideline developed by NICE [88,92]. Annual costs of ovarian cancer treatment in the USA are taken from Grann et al. 2011 [89] and inflated using the medical component of the USA consumer price index to 2016 US$. We include the costs of treatment of recurrence taken from Cancer Research UK [93] and Grann 2011 [89]. The costs of ovarian cancer diagnosis and treatment in Netherlands, China, Brazil, and India are obtained from primary data.
The costs of ovarian cancer terminal care are derived from end-of-life costs for cancer patients based on a report from the National Audit office UK [94]. For the USA, the terminal care costs for ovarian cancer are obtained from Grann 2011 [89], which were inflated using the medical component of the USA consumer price index to 2016 US$. The costs of ovarian cancer terminal care are obtained from primary data in the Netherlands, China, Brazil and India. In line with NICE recommendations, future healthcare costs not associated with ovarian cancer are not considered [95].

Appendix B.6. Costs of Breast Cancer

In the general population, 10% breast cancer is non-invasive DCIS and 90% is invasive. 95% of invasive breast cancer is early and locally advanced (stages 1–3), and 5% of invasive breast cancer is advanced breast cancer (stage 4) [96]. In BRCA1/2 carriers, 20% of cancers are DCIS and 80% are invasive [9,97].
Seventy percent of invasive breast cancers are ER-positive [98,99], among which 49% are premenopausal; 15% of early/locally advanced breast cancers and 25% of advanced breast cancers are HER2-positive; 27% BRCA1 and 67% BRCA2 breast cancers are ER-positive; 5% BRCA1 and 14% BRCA2 breast cancers are HER2-positive [100,101,102,103,104,105]. All costs are adjusted for BRCA1/BRCA2 breast cancers for differences in stage at presentation, the proportion of being non-invasive, and the proportion of being ER-positive or HER2-positive.
Annual breast cancer treatment costs in the USA are obtained from Grann et al. 2011 [89] and inflated using the medical component of the USA consumer price index to 2016 US$. In the UK, Netherlands, China, Brazil, and India, breast cancer treatment costs are estimated based on clinical guidelines and unit costs are detailed as below.
Diagnosis costs: Whether suspected at breast screening or through presentation to the GP, diagnosis in the breast clinic is made by triple assessment (clinical assessment, mammography, and ultrasound imaging with core biopsy and/or fine needle aspiration cytology) [98]. Clinical examination and mammography costs are from the paper by Robertson C et al. [106]. Breast ultrasound and biopsy costs are obtained from NHS reference costs [88] in the UK and from primary data in Netherlands, China, Brazil, and India. For all patients presented with suspected advanced breast cancer, MRI should be offered to assess for bone metastases [99].
Sentinel lymph node biopsy (SLNB) costs: SLNB is used for staging axilla for early invasive breast cancer and no evidence of lymph node involvement on ultrasound or a negative ultrasound-guided needle biopsy (73% of early and locally advanced invasive cancers). The SLNB costs in the UK are obtained from NHS reference costs including sentinel lymph node scan and unilateral intermediate breast procedures [88]. The SLNB costs in Netherlands, China, Brazil, and India are obtained from the primary data sources described above.
Pretreatment axilla ultrasound costs: Pretreatment ultrasound evaluation of the axilla should be performed for all patients being investigated for early invasive breast cancer and, if morphologically abnormal lymph nodes are identified, ultrasound-guided needle sampling should be offered [96]. The commissioning cost of pretreatment ultrasound evaluation of the breast and axilla is the same as that of the breast only [88]. The costing model considers the cost of ultrasound-guided needle sampling only, obtained from NHS reference costs (UK) [24] and primary data (Netherlands, China, Brazil, and India).
Axillary lymph node dissection (ALND) costs: ALNB is undertaken for lymph node positive cancers (approximately 31% early and locally advanced invasive cancers—NICE guideline and BCCOM project [96,98,107]; 30% node positive for BRCA1/2 breast cancer—familial breast cancer screening studies, breast cancer case series and Early Breast Cancer Trialists’ Collaborative Group data) [97,100,101,102,108]. The cost of ALND is assumed to be 25% of the cost of breast surgery as per NICE guideline development group recommendations [96].
Breast surgery costs include costs of breast-conserving surgery (assumed for all non-invasive cancers and 75% of early/locally advanced invasive cancers) and costs of mastectomy with reconstruction (for 25% early/locally advanced and all advanced cancers). Costs are obtained from the national NHS reference costs (UK) [88] and primary data (Netherlands, China, Brazil, and India).
Chemotherapy and radiotherapy costs: Invasive breast cancers who are not at low risk [107,109,110] receive adjuvant treatment in line with NICE guidelines. Costs include radiotherapy costs for 60% of early invasive/locally advanced, radiotherapy, and chemotherapy costs for 40% early invasive/locally advanced, and chemotherapy for all advanced cancers. Radiotherapy costs include planning and 40Gy in 15 fractions over 3 weeks [98] or palliative treatment; these were taken from national NHS reference costs [88]. Chemotherapy costs based on polychemotherapy [108] include administration costs, the costs of first and second-line therapy and toxicity from NICE guidelines [96,99]. In the Netherlands, China, Brazil, and India, radiotherapy costs and chemotherapy costs are obtained from the primary data sources described above.
Endocrine therapy costs: As per NICE guidelines [96,98], ER-positive invasive breast cancers receive Tamoxifen 20 mg/day (premenopausal) or Anastrazole 1mg/day (postmenopausal). Seventy percent of invasive breast cancers are ER-positive [98,99], among which 49% are premenopausal. We assume that the length of endocrine therapy is 5 years. The drug costs are obtained from the BNF [26] in the UK. ER testing costs are obtained from a local NHS trust and included for all invasive breast cancers. The costs of drugs and ER testing are obtained from primary data sources in the Netherlands, China, Brazil, and India described above.
Target therapy costs: HER2-positive breast cancer patients can be given at 3-week intervals for 1 year or until disease recurrence as per NICE guidelines. Breast cancer patients with positive HER2 are eligible for treatment with trastuzumab [98,99]. Ten percent of the eligible patients are intolerant of trastuzumab. Among women suitable for this treatment, 80% receive trastuzumab [96]. HER2 testing costs are obtained from a local NHS trust and included for all invasive breast cancers. The trastuzumab cost per patient including the administration of treatment and cardiac monitoring is £15080, which was obtained from the NICE costing report [96]. In the Netherlands, China, Brazil, and India, the costs of HER2 testing and trastuzumab are obtained from the primary data sources described above.
Follow-up costs: Breast cancer patients are offered mammographic surveillance and clinical follow up, with the screening cost of £141.45 per women in 2011 [106]. We assume that patients are followed up every four months in the first two years, every six months from the third to the fifth year, and every year from the sixth to the 10th year.
Bisphosphonate costs: Bisphosphonates is considered to be offered to patients newly diagnosed with bone metastases to prevent skeletal-related events and reduce pain [99]. Seventy-four percent of patients with advanced breast cancer will develop bone metastases, and 65% of patients with bone metastases are offered bisphosphonates [96,111]. Bisphosphonates that are currently offered include oral sodium clodronate, ibandronic acid, zoledronic acid, and pamidronate. The proportions of patients receiving the four drugs are 20%, 30%, 25%, and 25%, respectively. The annual costs including administration for the four drugs are £1971, £2541.96, £3208, and £3208 respectively, which were obtained from the NICE costing report [96]. We assume that the average length of bisphosphonates treatment is 2.7 years, which is the life expectancy of advanced breast cancers based on one-year survival rate (63.2%) [112]. The bisphosphonate costs in the Netherlands, China, Brazil, and India are obtained from the primary data sources described above.
Recurrence costs: For non-invasive breast cancers, the non-invasive and invasive relapse rates are both 12.5%. Thirty-five percent of early and locally advanced invasive breast cancers progress to advanced disease [96]. The recurrence rates for early and locally advanced breast cancer are 15.9% for node-positive [113] and 11% for node-negative disease [114]. Weighted for 31% node positive and 69% node negative, the composite recurrence rate for early and locally advanced breast cancer is 12.5%. The recurrence rate for the advanced disease is 66% (34% relapse-free five-year survival) [115].
Terminal care costs: The costs of terminal care for breast cancer are derived from end-of-life costs for cancer patients based on a report from the National Audit office UK [30]. For the US, the terminal care costs for breast cancer are obtained from Grann 2011 [89], and these were inflated using the medical component of the US consumer price index to 2016 US$. The costs of breast cancer terminal care are obtained from primary data sources in the Netherlands, China, Brazil, and India. In line with NICE recommendations, future healthcare costs not associated with breast cancer were not considered [95].

Appendix B.7. Cost of Breast Cancer Screening

For non-carriers, we assume routine triennial mammography between 50 and 70 years as per the UK NHS breast cancer screening programme [116] (seven mammograms on average). Breast screening in the USA assumes mammography every two years starting at 50 years [117]. In the Netherlands, the National Breast Cancer Screening Programme is designed for women between 50 and 75 years of age. Once every 2 years, women in this age group are invited for a mammogram. The guidelines from the Brazilian Ministry of Health is for all women aged 50–69 years to be screened with mammography only every 2 years. The coverage in the target age group remains low ranging from 27% to 51% [118]. To obtain a conservative estimate of the cost-effectiveness of population-based genetic testing, we adopted the highest value of uptake (51%) in Brazil. There is no national breast cancer screening programme in China or India.
For BRCA1/BRCA2 mutation carriers, we assume an annual mammogram from 40 to 69 years and annual MRI from 30–49 years as per NICE guidelines for familial breast cancer [119] (30 mammograms and 20 MRIs on average). We assume that breast cancer screening policies for BRCA1/2 carriers in the Netherlands, China, Brazil, and India, are the same as that in the UK. For the USA, it is based on annual mammography and MRI starting at 30 years, and annual mammography only from age 50 years [117].

Appendix B.8. Cost of Chemoprevention

BRCA1/BRCA2 mutation carriers are offered tamoxifen (premenopausal) or raloxifene (postmenopausal) for 5 years [119,120] to reduce breast cancer risk. The drug costs are obtained from the BNF (UK) [90], Grann 2011 (US) [89], and primary data (Netherlands, China, Brazil, and India). A 16.3% uptake is assumed for chemoprevention [64].

Appendix B.9. Cost of CHD

Cost of excess CHD: British Heart Foundation statistics reports costs per capita across four commissioning regions in England (London, Midlands and East, North, and South) [121].
The costs of CHD and stroke are averaged across the four regions. The prevalence of CHD is estimated at 12.0% in the UK [121] and 11.7% in the USA [122], with the onset of CHD estimated at 55 years of age [33,123].
The yearly cost of CHD in the UK is obtained by dividing the per capita cost by the population prevalence of CHD [121]. Using the report published by the American Heart Association [124], the total cost of CHD, CHF, and stroke were divided by the population with CHD [122,125], giving the yearly cost of CHD in the USA. This yearly cost is multiplied by the number of years between onset of CHD and average life expectancy to provide the cost attributed to excess CHD.
Cost of fatal CHD: This is costed on the basis of a fatal myocardial infarction using NHS reference costs [88]. USA costs are obtained from Afana et al. 2015 [126], and these are inflated using the medical component of the US consumer price index to 2016 US$.
We used the ratio of breast cancer treatment costs in the Netherlands, China, Brazil, and India compared to treatment costs in the UK to impute the costs of excess CHD and fatal CHD in each of these countries (Netherlands, China, Brazil, and India) based on the cost of CHD in the UK.

Appendix C. Estimation of Productivity Loss

The retirement ages for females are 65 in the UK, 62 in the USA, 50–55 in China, 60 in Brazil, 68 in Netherlands, and 60–65 in India. We used the lower values of the retirement age ranges in China and India to get the conservative estimates of productivity loss. The female labour force participation rates are 56.77% in the UK, 55.99% in the USA, 62.03% in China, 53.32% in Brazil, 58.02% in Netherlands, and 27.45% in India, which were obtained from the World Bank [71]. The hourly wage rage across countries are presented in Table A3.
Table A3. Hourly wage rage across countries (USA dollars in 2016).
AgeUKUSANetherlandsChinaBrazilIndia
30–3419.4713.0816.8555.544.77
35–3919.4714.7522.3755.544.58
40–4419.3314.7522.3755.544.58
45–4919.3314.9724.1155.546.56
50–5417.4214.9724.11 5.546.56
55–5917.4215.1024.19 5.543.71
60–6415.0815.10 24.19
65–69 21.32
Source[127][128][129][130][131][132]
We categorised the productivity costs as three subcomponents: (1) temporary disability due to short-term work absences following diagnosis, (2) permanent disability due to reduced working hours following a return to work or workforce departure; and (3) premature mortality due to death before retirement [72], as detailed in Table A4.
Table A4. Descriptive statistics for productivity loss in breast and ovarian cancer patients.
VariablesBreast CancerOvarian Cancer
(1) Temporary disability
Percentage of temporary disability cases94.0%98% 1
Average time taken off work following diagnosis (weeks)44.947.22 2
(2) Permanent disability
Percentage of permanent disability: reduced hours26%40% 3
Reduced hours per week after returning to work (hours)5.55.5
(3) Premature mortality (before retirement)
Percentage of permanent disability: workforce departure12.9%30% 3
Source: Hanly P, et al., 2012 [72]. 1 We assume 98% ovarian cancer patients have cancer-related short-term work absences after diagnosis. 2 We assume ovarian cancer patients experience four weeks for surgery, 24 weeks for chemotherapy, and 24 weeks for recurrence treatment with the recurrence rate of 80% [133]. 3 We assume the percentages of permanent disability for ovarian cancer are 40% for reduced working hours and 30% for workforce departure.
We estimated temporary disability as time absent from work multiplied by age-specific gross earnings.
We calculated productivity costs due to permanent disability by applying age-specific gross earnings to the reduction in working hours, or the number of working hours if permanent workforce departure, until retirement age. Regarding productivity loss from premature mortality, we assumed that without cancer, the productive capacity of an individual would continue from the age of diagnosis until age of retirement. We multiplied the projected years of life lost by the age-specific gross earnings for the remainder of the working life to generate monetary estimates.

Appendix D. Maximum Values of Genetic Testing Costs at Which Offering Genetic Testing for the Population Remains Cost-Effective.

Table A5. Maximum values of genetic testing costs at which offering genetic testing for the population remains cost-effective.
Payer PerspectiveSocietal Perspective
Lower WTP #Higher WTP##Lower WTP #Higher WTP ##
Thresholds based on GDP
UK$412 ($42,648/QALY)$1254 ($127,869/QALY)$677 ($42,639/QALY)$1520 ($127,960/QALY)
USA$519 ($57,490/QALY)$1417 ($172,735/QALY)$680 ($57,582/QALY)$1577 ($172,698/QALY)
Netherlands$442 ($50,539/QALY)$1407 ($151,520/QALY)$792 ($50,517/QALY)$1758 ($151,603/QALY)
China$146 ($15,402/QALY)$354 ($46,536/QALY)$183 ($15,522/QALY)$390 ($46,506/QALY)
Brazil$130 ($15,143/QALY)$493 ($45,490/QALY)$219 ($15,168/QALY)$582 ($45,515/QALY)
IndiaNot cost-effective$95 ($19,670/QALY)$62 ($6,540/QALY)$172 ($19,685/QALY)
Thresholds based on local economic evaluation guidelines
UK$238 ($28,386/QALY)$365 ($42,826/QALY)$481 ($28,406/QALY)$608 ($42,845/QALY)
USA$460 ($49,919/QALY)$850 ($99,969/QALY)$620 ($49,882/QALY)$1010 ($99,933/QALY)
Netherlands$293 ($24,364/QALY)$800 ($60,934/QALY)$582 ($24,369/QALY)$1089 ($60,939/QALY)
# 1*GDP per capita, ## 3*GDP per capita, WTP—willingness to pay (threshold), GDP—gross domestic product.
The appendix describes the maximum genetic testing costs and corresponding ICER/QALY (in brackets) at which offering BRCA testing for the population will remain cost-effective. Results are presented for both the payer and societal perspectives.
For GDP-based thresholds: This is cost-effective at the standard 3*GDP per capita WTP threshold and highly cost-effective at the 1*GDP per capita WTP threshold [82]. The discount rate is 3% for costs and health effects (LYs and QALYs) [81].
For country-specific thresholds:
For the UK, this is £20,000 to £30,000 [25,134]; for the USA, this is $50,000 to $100,000 [26,135]; for the Netherlands, this is: €20,000 to €50,000 [27]. Values in £s and €s have been converted to $ using PPP (purchasing power parity) [28].
For country-specific thresholds:
For the UK, the discount rate is 3.5% discount for costs and QALYs [25,134]; for the USA, this is 3% discount for costs and QALYs [53]; for the Netherlands, this is 4% discount for costs and 1.5% discount for QALYs [136].
Perspective:
WHO guidelines recommend a societal perspective [81,82].
Dutch guidelines recommend a societal perspective [136]. UK NICE guidelines recommend a payer perspective [25]. US guidelines recommend presentation of both societal and payer perspectives [53].

Appendix E. One-Way Sensitivity Analyses

One-way sensitivity analysis for all probabilities, costs, and utilities in terms of ICER of population-based BRCA testing compared to a clinical-criteria/FH-based approach in the UK, USA, Netherlands, China, Brazil, and India from both the payer perspective and the societal perspective.
X-axis: Incremental cost-effectiveness ratio (ICER): cost (£s or $s) per quality-adjusted life year (QALY) (discounted).
Y-axis: Probability, cost, and utility parameters in the model. The model is run at both lower and upper values/limits of the 95% confidence interval or range of all probability parameters described in Table 1, and both lower and upper values/limits of the cost and utility-score parameters given in the methods and Table 2.
‘Upper value’ represents outcomes for the upper limit of the parameter, and ‘Lower value’ represents outcomes for lower limit of the parameter.
Figure A1. Tornado Diagram in the UK (a) from the healthcare payer perspective. (b) from the societal perspective.
Cancers 12 01929 g0a1
Figure A2. Tornado Diagram in the USA (a) from the healthcare payer perspective. (b) from the societal perspective.
Cancers 12 01929 g0a2
Figure A3. Tornado Diagram in the Netherlands (a) from the healthcare payer perspective. (b) from the societal perspective.
Cancers 12 01929 g0a3
Figure A4. Tornado Diagram in China (a) from the healthcare payer perspective. (b) from the societal perspective.
Cancers 12 01929 g0a4
Figure A5. Tornado Diagram in Brazil (a) from the healthcare payer perspective. (b) from the societal perspective.
Cancers 12 01929 g0a5
Figure A6. Tornado Diagram in India (a) from the healthcare payer perspective. (b) from the societal perspective.
Cancers 12 01929 g0a6

References

  1. Harter, P.; Hauke, J.; Heitz, F.; Reuss, A.; Kommoss, S.; Marme, F.; Heimbach, A.; Prieske, K.; Richters, L.; Burges, A.; et al. Prevalence of deleterious germline variants in risk genes including BRCA1/2 in consecutive ovarian cancer patients (AGO-TR-1). PLoS ONE 2017, 12, e0186043. [Google Scholar] [CrossRef]
  2. Buys, S.S.; Sandbach, J.F.; Gammon, A.; Patel, G.; Kidd, J.; Brown, K.L.; Sharma, L.; Saam, J.; Lancaster, J.; Daly, M.B. A study of over 35,000 women with breast cancer tested with a 25-gene panel of hereditary cancer genes. Cancer 2017, 123, 1721–1730. [Google Scholar] [CrossRef] [PubMed] [Green Version]
  3. Kuchenbaecker, K.B.; Hopper, J.L.; Barnes, D.R.; Phillips, K.A.; Mooij, T.M.; Roos-Blom, M.J.; Jervis, S.; Van Leeuwen, F.E.; Milne, R.L.; Andrieu, N.; et al. Risks of Breast, Ovarian, and Contralateral Breast Cancer for BRCA1 and BRCA2 Mutation Carriers. JAMA 2017, 317, 2402–2416. [Google Scholar] [CrossRef] [PubMed] [Green Version]
  4. Rebbeck, T.R.; Kauff, N.D.; Domchek, S.M. Meta-analysis of risk reduction estimates associated with risk-reducing salpingo-oophorectomy in BRCA1 or BRCA2 mutation carriers. J. Natl. Cancer Inst. 2009, 101, 80–87. [Google Scholar] [CrossRef] [PubMed]
  5. Kauff, N.D.; Domchek, S.M.; Friebel, T.M.; Robson, M.E.; Lee, J.; Garber, J.E.; Isaacs, C.; Evans, D.G.; Lynch, H.; Eeles, R.A.; et al. Risk-reducing salpingo-oophorectomy for the prevention of BRCA1- and BRCA2-associated breast and gynecologic cancer: A multicenter, prospective study. J. Clin. Oncol. 2008, 26, 1331–1337. [Google Scholar] [CrossRef] [Green Version]
  6. Finch, A.; Beiner, M.; Lubinski, J.; Lynch, H.T.; Moller, P.; Rosen, B.; Murphy, J.; Ghadirian, P.; Friedman, E.; Foulkes, W.D.; et al. Salpingo-oophorectomy and the risk of ovarian, fallopian tube, and peritoneal cancers in women with a BRCA1 or BRCA2 Mutation. JAMA 2006, 296, 185–192. [Google Scholar] [CrossRef] [Green Version]
  7. Nelson, H.D.; Fu, R.; Zakher, B.; Pappas, M.; McDonagh, M. Medication Use for the Risk Reduction of Primary Breast Cancer in Women: Updated Evidence Report and Systematic Review for the US Preventive Services Task Force. JAMA 2019, 322, 868–886. [Google Scholar] [CrossRef] [Green Version]
  8. Rebbeck, T.R.; Friebel, T.; Lynch, H.T.; Neuhausen, S.L.; Van’t Veer, L.; Garber, J.E.; Evans, G.R.; Narod, S.A.; Isaacs, C.; Matloff, E.; et al. Bilateral prophylactic mastectomy reduces breast cancer risk in BRCA1 and BRCA2 mutation carriers: The PROSE Study Group. J. Clin. Oncol. 2004, 22, 1055–1062. [Google Scholar] [CrossRef] [PubMed] [Green Version]
  9. Nelson, H.D.; Pappas, M.; Zakher, B.; Mitchell, J.P.; Okinaka-Hu, L.; Fu, R. Risk assessment, genetic counseling, and genetic testing for BRCA-related cancer in women: A systematic review to update the U.S. Preventive Services Task Force recommendation. Ann. Intern. Med. 2014, 160, 255–266. [Google Scholar] [CrossRef] [PubMed] [Green Version]
  10. NICE. Familial Breast Cancer: Classification and Care of People at Risk of Familial Breast Cancer and Management of Breast Cancer and Related Risks in People with a Family History of Breast Cancer. In NICE Clinical Guideline CG164; National Institute for Health and Care Excellence: London, UK, 2013. [Google Scholar]
  11. Childers, C.P.; Childers, K.K.; Maggard-Gibbons, M.; Macinko, J. National Estimates of Genetic Testing in Women With a History of Breast or Ovarian Cancer. J. Clin. Oncol. 2017, 35, 3800–3806. [Google Scholar] [CrossRef] [PubMed]
  12. Manchanda, R.; Blyuss, O.; Gaba, F.; Gordeev, V.S.; Jacobs, C.; Burnell, M.; Gan, C.; Taylor, R.; Turnbull, C.; Legood, R.; et al. Current detection rates and time-to-detection of all identifiable BRCA carriers in the Greater London population. J. Med. Genet. 2018, 55. [Google Scholar] [CrossRef] [PubMed]
  13. NHS England. Clinical Commissioning Policy: Genetic Testing for BRCA1 and BRCA2 Mutations; NHS England Specialised Services Clinical Reference Group for Medical Genetics: London, UK, 2015. [Google Scholar]
  14. Manchanda, R.; Lieberman, S.; Gaba, F.; Lahad, A.; Levy-Lahad, E. Population Screening for Inherited Predisposition to Breast and Ovarian Cancer. Annu. Rev. Genom. Hum. Genet. 2020. [Google Scholar] [CrossRef] [PubMed]
  15. Gabai-Kapara, E.; Lahad, A.; Kaufman, B.; Friedman, E.; Segev, S.; Renbaum, P.; Beeri, R.; Gal, M.; Grinshpun-Cohen, J.; Djemal, K.; et al. Population-based screening for breast and ovarian cancer risk due to BRCA1 and BRCA2. Proc. Natl. Acad. Sci. USA 2014, 111, 14205–14210. [Google Scholar] [CrossRef] [PubMed] [Green Version]
  16. Manchanda, R.; Burnell, M.; Gaba, F.; Desai, R.; Wardle, J.; Gessler, S.; Side, L.; Sanderson, S.; Loggenberg, K.; Brady, A.F.; et al. Randomised trial of population-based BRCA testing in Ashkenazi Jews: Long-term outcomes. BJOG 2020, 127, 364–375. [Google Scholar] [CrossRef] [Green Version]
  17. George, A.; Riddell, D.; Seal, S.; Talukdar, S.; Mahamdallie, S.; Ruark, E.; Cloke, V.; Slade, I.; Kemp, Z.; Gore, M.; et al. Implementing rapid, robust, cost-effective, patient-centred, routine genetic testing in ovarian cancer patients. Sci. Rep. 2016, 6, 29506. [Google Scholar] [CrossRef] [Green Version]
  18. Moller, P.; Hagen, A.I.; Apold, J.; Maehle, L.; Clark, N.; Fiane, B.; Lovslett, K.; Hovig, E.; Vabo, A. Genetic epidemiology of BRCA mutations—Family history detects less than 50% of the mutation carriers. Eur. J. Cancer 2007, 43, 1713–1717. [Google Scholar] [CrossRef] [PubMed]
  19. Norum, J.; Grindedal, E.M.; Heramb, C.; Karsrud, I.; Ariansen, S.L.; Undlien, D.E.; Schlichting, E.; Maehle, L. BRCA mutation carrier detection. A model-based cost-effectiveness analysis comparing the traditional family history approach and the testing of all patients with breast cancer. ESMO Open 2018, 3, e000328. [Google Scholar] [CrossRef] [Green Version]
  20. Beitsch, P.D.; Whitworth, P.W.; Hughes, K.; Patel, R.; Rosen, B.; Compagnoni, G.; Baron, P.; Simmons, R.; Smith, L.A.; Grady, I.; et al. Underdiagnosis of Hereditary Breast Cancer: Are Genetic Testing Guidelines a Tool or an Obstacle? J. Clin. Oncol. 2018, 37. [Google Scholar] [CrossRef]
  21. Manchanda, R.; Legood, R.; Burnell, M.; McGuire, A.; Raikou, M.; Loggenberg, K.; Wardle, J.; Sanderson, S.; Gessler, S.; Side, L.; et al. Cost-effectiveness of population screening for BRCA mutations in Ashkenazi jewish women compared with family history-based testing. J. Natl. Cancer Inst. 2015, 107, 380. [Google Scholar] [CrossRef]
  22. Manchanda, R.; Loggenberg, K.; Sanderson, S.; Burnell, M.; Wardle, J.; Gessler, S.; Side, L.; Balogun, N.; Desai, R.; Kumar, A.; et al. Population testing for cancer predisposing BRCA1/BRCA2 mutations in the Ashkenazi-Jewish community: A randomized controlled trial. J. Natl. Cancer Inst. 2015, 107, 379. [Google Scholar] [CrossRef] [Green Version]
  23. Manchanda, R.; Gaba, F. Population Based Testing for Primary Prevention: A Systematic Review. Cancers 2018, 10, 424. [Google Scholar] [CrossRef] [Green Version]
  24. Griffiths, U.K.; Legood, R.; Pitt, C. Comparison of Economic Evaluation Methods Across Low-income, Middle-income and High-income Countries: What are the Differences and Why? Health Econ. 2016, 25 (Suppl. 1), 29–41. [Google Scholar] [CrossRef] [PubMed] [Green Version]
  25. NICE. Guide to the Methods of Technology Appraisal; National Institute of Health and Care Excellence: London, UK, 2013. [Google Scholar]
  26. Neumann, P.J.; Cohen, J.T.; Weinstein, M.C. Updating cost-effectiveness—The curious resilience of the $50,000-per-QALY threshold. N. Engl. J. Med. 2014, 371, 796–797. [Google Scholar] [CrossRef] [Green Version]
  27. Kosteneffectiviteit in de Praktijk; Zorginstituut Nederland (National Health Care Institute, Netherlands): Diemen, The Netherlands, 2015.
  28. The World Bank. PPP Conversion Factor, GDP. Available online: http://data.worldbank.org/indicator/PA.NUS.PPP (accessed on 9 August 2019).
  29. World Bank. Population, Female. Available online: https://data.worldbank.org/indicator/SP.POP.TOTL.FE.IN?year_high_desc=true (accessed on 29 January 2019).
  30. Woods, B.; Revill, P.; Sculpher, M.; Claxton, K. Country-Level Cost-Effectiveness Thresholds: Initial Estimates and the Need for Further Research. Value Health 2016, 19, 929–935. [Google Scholar] [CrossRef] [PubMed] [Green Version]
  31. Bertram, M.Y.; Lauer, J.A.; De Joncheere, K.; Edejer, T.; Hutubessy, R.; Kieny, M.P.; Hill, S.R. Cost-effectiveness thresholds: Pros and cons. Bull. World Health Organ. 2016, 94, 925–930. [Google Scholar] [CrossRef]
  32. Ottersen, T.; Forde, R.; Kakad, M.; Kjellevold, A.; Melberg, H.O.; Moen, A.; Ringard, A.; Norheim, O.F. A new proposal for priority setting in Norway: Open and fair. Health Policy 2016, 120, 246–251. [Google Scholar] [CrossRef] [Green Version]
  33. Parker, W.H.; Feskanich, D.; Broder, M.S.; Chang, E.; Shoupe, D.; Farquhar, C.M.; Berek, J.S.; Manson, J.E. Long-term mortality associated with oophorectomy compared with ovarian conservation in the nurses‘ health study. Obstet. Gynecol. 2013, 121, 709–716. [Google Scholar] [CrossRef] [Green Version]
  34. Metcalfe, K.; Eisen, A.; Senter, L.; Armel, S.; Bordeleau, L.; Meschino, W.S.; Pal, T.; Lynch, H.T.; Tung, N.M.; Kwong, A.; et al. International trends in the uptake of cancer risk reduction strategies in women with a BRCA1 or BRCA2 mutation. Br. J. Cancer 2019, 121. [Google Scholar] [CrossRef] [PubMed] [Green Version]
  35. Manchanda, R.; Abdelraheim, A.; Johnson, M.; Rosenthal, A.N.; Benjamin, E.; Brunell, C.; Burnell, M.; Side, L.; Gessler, S.; Saridogan, E.; et al. Outcome of risk-reducing salpingo-oophorectomy in BRCA carriers and women of unknown mutation status. BJOG 2011, 118, 814–824. [Google Scholar] [CrossRef]
  36. Miller, M.E.; Czechura, T.; Martz, B.; Hall, M.E.; Pesce, C.; Jaskowiak, N.; Winchester, D.J.; Yao, K. Operative risks associated with contralateral prophylactic mastectomy: A single institution experience. Ann. Surg. Oncol. 2013, 20, 4113–4120. [Google Scholar] [CrossRef] [PubMed]
  37. Gaba, F.; Manchanda, R. Systematic review of acceptability, cardiovascular, neurological, bone health and HRT outcomes following risk reducing surgery in BRCA carriers. Best Pract. Res. Clin. Obstet. Gynaecol. 2020, 65. [Google Scholar] [CrossRef] [PubMed]
  38. Metcalfe, K.A.; Poll, A.; Royer, R.; Llacuachaqui, M.; Tulman, A.; Sun, P.; Narod, S.A. Screening for founder mutations in BRCA1 and BRCA2 in unselected Jewish women. J. Clin. Oncol. 2010, 28, 387–391. [Google Scholar] [CrossRef] [PubMed]
  39. Lieberman, S.; Tomer, A.; Ben-Chetrit, A.; Olsha, O.; Strano, S.; Beeri, R.; Koka, S.; Fridman, H.; Djemal, K.; Glick, I.; et al. Population screening for BRCA1/BRCA2 founder mutations in Ashkenazi Jews: Proactive recruitment compared with self-referral. Genet. Med. 2016, 19. [Google Scholar] [CrossRef]
  40. Metcalfe, K.A.; Poll, A.; Llacuachaqui, M.; Nanda, S.; Tulman, A.; Mian, N.; Sun, P.; Narod, S.A. Patient satisfaction and cancer-related distress among unselected Jewish women undergoing genetic testing for BRCA1 and BRCA2. Clin. Genet. 2010, 78, 411–417. [Google Scholar] [CrossRef] [PubMed]
  41. Yuen, J.; Cousens, N.; Barlow-Stewart, K.; O’Shea, R.; Andrews, L. Online BRCA1/2 screening in the Australian Jewish community: A qualitative study. J. Community Genet. 2019, 11. [Google Scholar] [CrossRef] [PubMed]
  42. Manchanda, R. Predicting risk of ovarian malignancy improved screening and early detection feasibility study. In ISRCTN Registry: ISRCTN54246466; BioMed Central: London, UK, 2017. [Google Scholar]
  43. Plon, S.E.; Eccles, D.M.; Easton, D.; Foulkes, W.D.; Genuardi, M.; Greenblatt, M.S.; Hogervorst, F.B.; Hoogerbrugge, N.; Spurdle, A.B.; Tavtigian, S.V.; et al. Sequence variant classification and reporting: Recommendations for improving the interpretation of cancer susceptibility genetic test results. Hum. Mutat. 2008, 29, 1282–1291. [Google Scholar] [CrossRef] [PubMed] [Green Version]
  44. Global Burden of Disease Cancer, C.; Fitzmaurice, C.; Akinyemiju, T.F.; Al Lami, F.H.; Alam, T.; Alizadeh-Navaei, R.; Allen, C.; Alsharif, U.; Alvis-Guzman, N.; Amini, E.; et al. Global, Regional, and National Cancer Incidence, Mortality, Years of Life Lost, Years Lived With Disability, and Disability-Adjusted Life-Years for 29 Cancer Groups, 1990 to 2016: A Systematic Analysis for the Global Burden of Disease Study. JAMA Oncol. 2018, 4, 1553–1568. [Google Scholar] [CrossRef]
  45. International Agency for Research on Cancer. Cancer Tomorrow. In A Tool That Predicts the Future Cancer Incidence and Mortality Burden Worldwide from the Current Estimates in 2018 up until 2040; International Agency for Research on Cancer (IARC): Lyon, France, 2018. [Google Scholar]
  46. Wilson, J.; Jungner, G. Principles and Practice of Screening for Disease; 34; World Health Organisation: Geneva, Switzerland, 1968. [Google Scholar]
  47. UK, N.S.C. Criteria for Appraising the Viability, Effectiveness and Appropriateness of a Screening Programme. Available online: https://www.gov.uk/government/publications/evidence-review-criteria-national-screening-programmes/criteria-for-appraising-the-viability-effectiveness-and-appropriateness-of-a-screening-programme (accessed on 1 December 2019).
  48. Khoury, M.J.; McCabe, L.L.; McCabe, E.R. Population screening in the age of genomic medicine. N. Engl. J. Med. 2003, 348, 50–58. [Google Scholar] [CrossRef] [Green Version]
  49. CDC. ACCE Model Process for Evaluating Genetic Tests. In Genomic Testing; The Office of Public Health Genomics (OPHG), Centers for Disease Control and Prevention (CDC): Atlanta, GA, USA, 2010. [Google Scholar]
  50. Burke, W.; Zimmerman, R. Moving Beyond ACCE: An Expanded Framework for Genetic Test Evaluation; PHG Foundation: London, UK, 2007. [Google Scholar]
  51. Force, U.S.P.S.T.; Owens, D.K.; Davidson, K.W.; Krist, A.H.; Barry, M.J.; Cabana, M.; Caughey, A.B.; Doubeni, C.A.; Epling, J.W., Jr.; Kubik, M.; et al. Risk Assessment, Genetic Counseling, and Genetic Testing for BRCA-Related Cancer: US Preventive Services Task Force Recommendation Statement. JAMA 2019, 322, 652–665. [Google Scholar] [CrossRef] [Green Version]
  52. Nelson, H.D.; Pappas, M.; Cantor, A.; Haney, E.; Holmes, R. Risk Assessment, Genetic Counseling, and Genetic Testing for BRCA-Related Cancer in Women: Updated Evidence Report and Systematic Review for the US Preventive Services Task Force. JAMA 2019, 322, 666–685. [Google Scholar] [CrossRef] [Green Version]
  53. Sanders, G.D.; Neumann, P.J.; Basu, A.; Brock, D.W.; Feeny, D.; Krahn, M.; Kuntz, K.M.; Meltzer, D.O.; Owens, D.K.; Prosser, L.A.; et al. Recommendations for Conduct, Methodological Practices, and Reporting of Cost-effectiveness Analyses: Second Panel on Cost-Effectiveness in Health and Medicine. JAMA 2016, 316, 1093–1103. [Google Scholar] [CrossRef] [PubMed]
  54. Eggington, J.M.; Bowles, K.R.; Moyes, K.; Manley, S.; Esterling, L.; Sizemore, S.; Rosenthal, E.; Theisen, A.; Saam, J.; Arnell, C.; et al. A comprehensive laboratory-based program for classification of variants of uncertain significance in hereditary cancer genes. Clin. Genet. 2014, 86, 229–237. [Google Scholar] [CrossRef] [PubMed]
  55. Cancer Research UK. Breast Cancer Incidence (Invasive) Statistics. Available online: http://www.cancerresearchuk.org/health-professional/cancer-statistics/statistics-by-cancer-type/breast-cancer/incidence-invasive#collapseOne (accessed on 14 March 2019).
  56. Cancer Research UK. Ovarian Cancer Incidence Statistics. Available online: http://www.cancerresearchuk.org/health-professional/cancer-statistics/statistics-by-cancer-type/ovarian-cancer/incidence#heading-One (accessed on 14 March 2019).
  57. United States Cancer Statistics. Rate of New Cancers by Age Group, All Races, Female. Available online: https://gis.cdc.gov/Cancer/USCS/DataViz.html (accessed on 19 November 2019).
  58. International Agency for Research on Cancer. Estimated Number of New Cases in 2018, Worldwide, Females, All Ages. Available online: http://gco.iarc.fr/today/online-analysis-table (accessed on 21 November 2019).
  59. Jervis, S.; Song, H.; Lee, A.; Dicks, E.; Harrington, P.; Baynes, C.; Manchanda, R.; Easton, D.F.; Jacobs, I.; Pharoah, P.P.; et al. A risk prediction algorithm for ovarian cancer incorporating BRCA1, BRCA2, common alleles and other familial effects. J. Med. Genet. 2015, 52, 465–475. [Google Scholar] [CrossRef] [PubMed] [Green Version]
  60. Evans, D.G.; Lalloo, F.; Ashcroft, L.; Shenton, A.; Clancy, T.; Baildam, A.D.; Brain, A.; Hopwood, P.; Howell, A. Uptake of risk-reducing surgery in unaffected women at high risk of breast and ovarian cancer is risk, age, and time dependent. Cancer Epidemiol. Biomark. Prev. 2009, 18, 2318–2324. [Google Scholar] [CrossRef] [Green Version]
  61. Manchanda, R.; Burnell, M.; Abdelraheim, A.; Johnson, M.; Sharma, A.; Benjamin, E.; Brunell, C.; Saridogan, E.; Gessler, S.; Oram, D.; et al. Factors influencing uptake and timing of risk reducing salpingo-oophorectomy in women at risk of familial ovarian cancer: A competing risk time to event analysis. BJOG 2012, 119, 527–536. [Google Scholar] [CrossRef] [PubMed]
  62. Read, M.D.; Edey, K.A.; Hapeshi, J.; Foy, C. Compliance with estrogen hormone replacement therapy after oophorectomy: A prospective study. Menopause Int. 2010, 16, 60–64. [Google Scholar] [CrossRef]
  63. Cuzick, J.; Sestak, I.; Cawthorn, S.; Hamed, H.; Holli, K.; Howell, A.; Forbes, J.F.; Investigators, I.-I. Tamoxifen for prevention of breast cancer: Extended long-term follow-up of the IBIS-I breast cancer prevention trial. Lancet Oncol. 2015, 16, 67–75. [Google Scholar] [CrossRef]
  64. Smith, S.G.; Sestak, I.; Forster, A.; Partridge, A.; Side, L.; Wolf, M.S.; Horne, R.; Wardle, J.; Cuzick, J. Factors affecting uptake and adherence to breast cancer chemoprevention: A systematic review and meta-analysis. Ann. Oncol. 2016, 27, 575–590. [Google Scholar] [CrossRef]
  65. Chen, H.; Chen, Y.; Cui, B. The association of multimorbidity with healthcare expenditure among the elderly patients in Beijing, China. Arch. Gerontol. Geriatr. 2018, 79, 32–38. [Google Scholar] [CrossRef] [PubMed]
  66. SIGTAP. Sistema de Gerenciamento da Tabela de Procedimentos, Medicamentos e OPM do SUS; Ministry of Health, Brazil: Brasilia, Brazil, 2020.
  67. BPS. Banco de Preços em Saúde; Health Price Bank; Ministry of Health, Brazil: Brasilia, Brazil, 2019.
  68. CMED. Câmara de Regulação do Mercado de Medicamentos; ANVISA, Barzilian Health Regulatory Agency: Brasilia, Brazil, 2016.
  69. Curtis, L.; Burns, A. Unit Costs of Health and Social Care 2016; Personal Social Services Research Unit (PSSRU): Canterbury, Kent, UK, 2016. [Google Scholar]
  70. NHS Improvement. NHS Reference Costs 2016/17; NHS Improvement: London, UK, 2017. [Google Scholar]
  71. The World Bank. Labor Force Participation Rate, Female (% of Female Population Ages 15+) (Modeled ILO Estimate). Available online: https://data.worldbank.org/indicator/SL.TLF.CACT.FE.ZS (accessed on 7 November 2019).
  72. Hanly, P.; Timmons, A.; Walsh, P.M.; Sharp, L. Breast and prostate cancer productivity costs: A comparison of the human capital approach and the friction cost approach. Value Health 2012, 15, 429–436. [Google Scholar] [CrossRef] [Green Version]
  73. World Health Organisation. Life Tables. Available online: http://apps.who.int/gho/data/node.main.687?lang=en (accessed on 27 January 2020).
  74. Allemani, C.; Matsuda, T.; Di Carlo, V.; Harewood, R.; Matz, M.; Niksic, M.; Bonaventure, A.; Valkov, M.; Johnson, C.J.; Esteve, J.; et al. Global surveillance of trends in cancer survival 2000-14 (CONCORD-3): Analysis of individual records for 37,513,025 patients diagnosed with one of 18 cancers from 322 population-based registries in 71 countries. Lancet 2018, 391, 1023–1075. [Google Scholar] [CrossRef] [Green Version]
  75. Bordeleau, L.; Panchal, S.; Goodwin, P. Prognosis of BRCA-associated breast cancer: A summary of evidence. Breast Cancer Res. Treat. 2010, 119, 13–24. [Google Scholar] [CrossRef] [PubMed]
  76. Rennert, G.; Bisland-Naggan, S.; Barnett-Griness, O.; Bar-Joseph, N.; Zhang, S.; Rennert, H.S.; Narod, S.A. Clinical outcomes of breast cancer in carriers of BRCA1 and BRCA2 mutations. N. Engl. J. Med. 2007, 357, 115–123. [Google Scholar] [CrossRef] [PubMed] [Green Version]
  77. McLaughlin, J.R.; Rosen, B.; Moody, J.; Pal, T.; Fan, I.; Shaw, P.A.; Risch, H.A.; Sellers, T.A.; Sun, P.; Narod, S.A. Long-term ovarian cancer survival associated with mutation in BRCA1 or BRCA2. J. Natl. Cancer Inst. 2013, 105, 141–148. [Google Scholar] [CrossRef] [PubMed]
  78. National Institue for Health and Care Excellence (NICE). Clinical Guideline (CG81)—Advanced Breast Cancer: Diagnosis and Treatment; National Collaborating Centre for Cancer, National Institute for Health and Clinical Excellence: Cardiff, UK, 2009. [Google Scholar]
  79. Havrilesky, L.J.; Broadwater, G.; Davis, D.M.; Nolte, K.C.; Barnett, J.C.; Myers, E.R.; Kulasingam, S. Determination of quality of life-related utilities for health states relevant to ovarian cancer diagnosis and treatment. Gynecol. Oncol. 2009, 113, 216–220. [Google Scholar] [CrossRef] [Green Version]
  80. Grann, V.R.; Patel, P.; Bharthuar, A.; Jacobson, J.S.; Warner, E.; Anderson, K.; Tsai, W.Y.; Hill, K.A.; Neugut, A.I.; Hershman, D. Breast cancer-related preferences among women with and without BRCA mutations. Breast Cancer Res. Treat. 2010, 119, 177–184. [Google Scholar] [CrossRef]
  81. Edejer, T.; Baltussen, R.; Adam, T.; Hutubessy, R.; Acharya, A.; Evans, D.; Murray, C. WHO Guide to Cost-Effectiveness Analysis; World Health Organisation: Geneva, Switzerland, 2003. [Google Scholar]
  82. Hutubessy, R.; Chisholm, D.; Edejer, T.T. Generalized cost-effectiveness analysis for national-level priority-setting in the health sector. Cost Eff. Resour. Alloc. 2003, 1, 8. [Google Scholar] [CrossRef] [Green Version]
  83. Briggs, A. Probabilistic analysis of cost-effectiveness models: Statistical representation of parameter uncertainty. Value Health 2005, 8, 1–2. [Google Scholar] [CrossRef] [Green Version]
  84. National Institute for Health and Care Excellence (NICE). Familial Breast Cancer: Classification, Care and Managing Breast Cancer and Related Risks in People with a Family History of Breast Cancer; National Institute for Health and Clinical Excellence: Cardiff, UK, 2013. [Google Scholar]
  85. Manchanda, R.; Burnell, M.; Loggenberg, K.; Desai, R.; Wardle, J.; Sanderson, S.C.; Gessler, S.; Side, L.; Balogun, N.; Kumar, A.; et al. Cluster-randomised non-inferiority trial comparing DVD-assisted and traditional genetic counselling in systematic population testing for BRCA1/2 mutations. J. Med. Genet. 2016, 53, 472–480. [Google Scholar] [CrossRef] [Green Version]
  86. Curtis, L. Unit Costs of Health and Social Care 2011; Personal Social Services Research Unit (PSSRU): Canterbury, UK, 2011. [Google Scholar]
  87. Schwartz, M.D.; Valdimarsdottir, H.B.; Peshkin, B.N.; Mandelblatt, J.; Nusbaum, R.; Huang, A.T.; Chang, Y.; Graves, K.; Isaacs, C.; Wood, M.; et al. Randomized noninferiority trial of telephone versus in-person genetic counseling for hereditary breast and ovarian cancer. J. Clin. Oncol. 2014, 32, 618–626. [Google Scholar] [CrossRef]
  88. NHS Reference Costs 2015 to 2016. Available online: https://assets.publishing.service.gov.uk/government/uploads/system/uploads/attachment_data/file/577083/Reference_Costs_2015-16.pdf (accessed on 1 March 2019).
  89. Grann, V.R.; Patel, P.R.; Jacobson, J.S.; Warner, E.; Heitjan, D.F.; Ashby-Thompson, M.; Hershman, D.L.; Neugut, A.I. Comparative effectiveness of screening and prevention strategies among BRCA1/2-affected mutation carriers. Breast Cancer Res. Treat. 2011, 125, 837–847. [Google Scholar] [CrossRef] [PubMed] [Green Version]
  90. British National Formulary. British National Formulary; BMJ Group and Pharmaceutical Press (Royal Pharmaceutical Society of Great Britain): London, UK, 2018. [Google Scholar]
  91. Williams-Frame, A.; Carpenter, J.S. Costs of hormonal and nonhormonal prescription medications for hot flashes. Womens Health (Lond) 2009, 5, 497–502. [Google Scholar] [CrossRef] [Green Version]
  92. National Institue for Health and Care Excellence (NICE). Ovarian Cancer: The Recognition and initial Management of Ovarian Cancer; National Institute for Health and Clinical Excellence (NICE): Cardiff, UK, 2011. [Google Scholar]
  93. Cancer Research UK. Saving Lives, Averting Costs. an Analysis of the Financial Implications of Achieving Earlier Diagnosis of Colorectal, Lung and Ovarian Cancer; CRUK: London, UK, 2014. [Google Scholar]
  94. National Audit Office. End of Life Care; National Audit Office (NAO), House of Commons: London, UK, 2008.
  95. National Institute of Health and Clinical Excellence. Guide to the Methods of Technology Appraisal; National Institute for Health and Clinical Excellence (NICE): London, UK, 2013. [Google Scholar]
  96. National Institute for Health and Clinical Excellence. National Costing Report: Early and Locally Advanced Breast Cancer/Advanced Breast Cancer; National Institute for Health and Clinical Excellence: London, UK, 2009. [Google Scholar]
  97. Heijnsdijk, E.A.; Warner, E.; Gilbert, F.J.; Tilanus-Linthorst, M.M.; Evans, G.; Causer, P.A.; Eeles, R.A.; Kaas, R.; Draisma, G.; Ramsay, E.A.; et al. Differences in natural history between breast cancers in BRCA1 and BRCA2 mutation carriers and effects of MRI screening-MRISC, MARIBS, and Canadian studies combined. Cancer Epidemiol. Biomarkers Prev. 2012, 21, 1458–1468. [Google Scholar] [CrossRef] [PubMed] [Green Version]
  98. National Institue for Health and Care Excellence (NICE). Early and Locally Advanced Breast Cancer: Diagnosis and Treatment; National Collaborating Centre for Cancer, National Institute for Health and Clinical Excellence: Cardiff, UK, 2009. [Google Scholar]
  99. National Institute for Health and Care Excellence (NICE). Advanced Breast Cancer: Diagnosis and Treatment; National Institute for Health and Clinical Excellence: London, UK, 2009. [Google Scholar]
  100. Cortesi, L.; Turchetti, D.; Marchi, I.; Fracca, A.; Canossi, B.; Battista, R.; Ruscelli, S.; Pecchi, A.R.; Torricelli, P.; Federico, M. Breast cancer screening in women at increased risk according to different family histories: An update of the Modena Study Group experience. BMC Cancer 2006, 6, 210. [Google Scholar] [CrossRef] [PubMed] [Green Version]
  101. MARIBS Study Group. Screening with magnetic resonance imaging and mammography of a UK population at high familial risk of breast cancer: A prospective multicentre cohort study (MARIBS). Lancet 2005, 365, 1769–1778. [Google Scholar] [CrossRef]
  102. Robson, M.E.; Chappuis, P.O.; Satagopan, J.; Wong, N.; Boyd, J.; Goffin, J.R.; Hudis, C.; Roberge, D.; Norton, L.; Begin, L.R.; et al. A combined analysis of outcome following breast cancer: Differences in survival based on BRCA1/BRCA2 mutation status and administration of adjuvant treatment. Breast Cancer Res. 2003, 6, R8–R17. [Google Scholar] [CrossRef] [Green Version]
  103. Comen, E.; Davids, M.; Kirchhoff, T.; Hudis, C.; Offit, K.; Robson, M. Relative contributions of BRCA1 and BRCA2 mutations to “triple-negative” breast cancer in Ashkenazi Women. Breast Cancer Res. Treat. 2011, 129, 185–190. [Google Scholar] [CrossRef] [PubMed] [Green Version]
  104. Tung, N.; Garber, J.E.; Lincoln, A.; Domchek, S.M. Frequency of triple-negative breast cancer in BRCA1 mutation carriers: Comparison between common Ashkenazi Jewish and other mutations. J. Clin. Oncol. 2012, 30, 4447–4448. [Google Scholar] [CrossRef]
  105. Chappuis, P.O.; Nethercot, V.; Foulkes, W.D. Clinico-pathological characteristics of BRCA1- and BRCA2-related breast cancer. In Seminars in Surgical Oncology; John Wiley & Sons: Hoboken, NJ, USA, 2000; Volume 18, pp. 287–295. [Google Scholar]
  106. Robertson, C.; Arcot Ragupathy, S.K.; Boachie, C.; Dixon, J.M.; Fraser, C.; Hernandez, R.; Heys, S.; Jack, W.; Kerr, G.R.; Lawrence, G.; et al. The clinical effectiveness and cost-effectiveness of different surveillance mammography regimens after the treatment for primary breast cancer: Systematic reviews registry database analyses and economic evaluation. Health Technol. Assess 2011, 15, i–vi. [Google Scholar] [CrossRef]
  107. Bates, T.; Kearins, O.; Monypenny, I.; Lagord, C.; Lawrence, G. Clinical outcome data for symptomatic breast cancer: The Breast Cancer Clinical Outcome Measures (BCCOM) Project. Br. J. Cancer 2009, 101, 395–402. [Google Scholar] [CrossRef] [Green Version]
  108. Breast, E.; Trialist, C. Group C. Effects of chemotherapy and hormonal therapy for early breast cancer on recurrence and 15-year survival: An overview of the randomised trials. Lancet 2005, 365, 1687–1717. [Google Scholar] [CrossRef]
  109. Blamey, R.W.; Ellis, I.O.; Pinder, S.E.; Lee, A.H.; Macmillan, R.D.; Morgan, D.A.L.; Robertson, J.F.R.; Mitchell, M.J.; Ball, G.R.; Haybittle, J.L.; et al. Survival of invasive breast cancer according to the Nottingham Prognostic Index in cases diagnosed in 1990–1999. Eur. J. Cancer 2007, 43, 1548–1555. [Google Scholar] [CrossRef] [PubMed]
  110. Gribbin, J.; Dewis, R. Adjuvant! Online: Review of Evidence Concerning Its Validity, and Other Considerations Relating to Its Use in the NHS; National Institute for Health and Clinical Excellence: Cardiff, UK, 2009. [Google Scholar]
  111. Kozlow, W.; Guise, T.A. Breast cancer metastasis to bone: Mechanisms of osteolysis and implications for therapy. J. Mammary Gland Biol. 2005, 10, 169–180. [Google Scholar] [CrossRef] [PubMed]
  112. Breast cancer survival statistics. Available online: https://www.cancerresearchuk.org/health-professional/cancer-statistics/statistics-by-cancer-type/breast-cancer/survival (accessed on 1 April 2018).
  113. Wapnir, I.L.; Anderson, S.J.; Mamounas, E.P.; Geyer Jr, C.E.; Jeong, J.H.; Tan-Chiu, E.; Fisher, B.; Wolmark, N. Prognosis after ipsilateral breast tumor recurrence and locoregional recurrences in five National Surgical Adjuvant Breast and Bowel Project node-positive adjuvant breast cancer trials. J. Clin. Oncol. 2006, 24, 2028–2037. [Google Scholar] [CrossRef] [PubMed]
  114. Anderson, S.J.; Wapnir, I.; Dignam, J.J.; Fisher, B.; Mamounas, E.P.; Jeong, J.H.; Geyer Jr, C.E.; Wickerham, D.L.; Costantino, J.P.; Wolmark, N. Prognosis after ipsilateral breast tumor recurrence and locoregional recurrences in patients treated by breast-conserving therapy in five National Surgical Adjuvant Breast and Bowel Project protocols of node-negative breast cancer. J. Clin. Oncol. 2009, 27, 2466–2473. [Google Scholar] [CrossRef] [Green Version]
  115. Gennari, A.; Conte, P.; Rosso, R.; Orlandini, C.; Bruzzi, P. Survival of metastatic breast carcinoma patients over a 20-year period: A retrospective analysis based on individual patient data from six consecutive studies. Cancer 2005, 104, 1742–1750. [Google Scholar] [CrossRef]
  116. Waldron, J. Breast Screening Programme, England 2008-09; NHS Digital: Leeds, UK, 2010. [Google Scholar]
  117. CDC. Breast Cancer Screening Guidelines for Women. Available online: https://www.cdc.gov/cancer/breast/pdf/breastcancerscreeningguidelines.pdf (accessed on 1 April 2018).
  118. Dos-Santos-Silva, I. Breast cancer control policies in Brazil: Where to go from here? Cadernos De Saude Publica 2018, 34. [Google Scholar] [CrossRef] [Green Version]
  119. National Institute for Health and Care Excellence. Familial Breast Cancer: Classification and Care of People at Risk of Familial Breast Cancer and Management of Breast Cancer and Related Risks in People with a Family History of Breast Cancer; National Institute for Health and Care Excellence: London, UK, 2013. [Google Scholar]
  120. Cuzick, J.; Sestak, I.; Bonanni, B.; Costantino, J.P.; Cummings, S.; DeCensi, A.; Dowsett, M.; Forbes, J.F.; Ford, L.; LaCroix, A.Z.; et al. Selective oestrogen receptor modulators in prevention of breast cancer: An updated meta-analysis of individual participant data. Lancet 2013, 381, 1827–1834. [Google Scholar] [CrossRef] [Green Version]
  121. Townsend, N.; Bhatnagar, P.; Wilkins, E. Cardiovascular Disease Statistics; British Heart Foundation: London, UK, 2015. [Google Scholar]
  122. CDC. Heart Disease. Available online: https://www.cdc.gov/nchs/fastats/heart-disease.htm (accessed on 17 March 2018).
  123. Who Is at Risk for Coronary Heart Disease? Available online: https://www.nhlbi.nih.gov/health-topics/coronary-heart-disease#Risk-Factors (accessed on 17 March 2018).
  124. American Heart Association. Cardiovascular Disease: A Costly Burden for America — Projections through 2035. Available online: http://www.heart.org/idc/groups/heart-public/@wcm/@adv/documents/downloadable/ucm_491543.pdf (accessed on 17 March 2018).
  125. Population, total. Available online: https://data.worldbank.org/indicator/SP.POP.TOTL?view=chart (accessed on 7 November 2019).
  126. Afana, M.; Brinjikji, W.; Cloft, H.; Salka, S. Hospitalization costs for acute myocardial infarction patients treated with percutaneous coronary intervention in the United States are substantially higher than Medicare payments. Clin. Cardiol. 2015, 38, 13–19. [Google Scholar] [CrossRef] [Green Version]
  127. Office for National Statistics. Employee earnings in the UK: 2018. Available online: https://www.ons.gov.uk/employmentandlabourmarket/peopleinwork/earningsandworkinghours/bulletins/annualsurveyofhoursandearnings/2018 (accessed on 7 November 2019).
  128. Bureau of Labor Statistics. Labor Force Statistics from the Current Population Survey. Available online: https://www.bls.gov/cps/earnings.htm#demographics (accessed on 7 November 2019).
  129. Statistics Netherlands. Available online: www.cbs.nl (accessed on 7 November 2019).
  130. World Economic Forum. The Global Gender Gap Report 2016. Available online: http://reports.weforum.org/global-gender-gap-report-2016/economies/#economy=CHN (accessed on 7 November 2019).
  131. Brazilian Institute of Geography and Statistics. Estatísticas de Gênero - Indicadores sociais das mulheres no Brasil. Available online: https://www.ibge.gov.br/estatisticas-novoportal/multidominio/genero/20163-estatisticas-de-genero-indicadores-sociais-das-mulheres-no-brasil.html?=&t=o-que-e (accessed on 7 November 2019).
  132. National Sample Survey Office. Employment and Unemployment Survey, 68th Round, 2012-13, Government of India, Ministry of Statistics & Programme Implementation; National Sample Survey Office (NSSO): New Delhi, India, 2013.
  133. National Ovarian Cancer Coalition. Ovarian Cancer Recurrence: Discussion With an Expert. Available online: http://ovarian.org/component/content/article/33/385 (accessed on 7 November 2019).
  134. National Institue for Health and Care Excellence (NICE). Social Value Judgements: Principles for the Development of NICE Guidance; National Institute for Health and Clinical Excellence: Cardiff, UK, 2008. [Google Scholar]
  135. Ubel, P.A.; Hirth, R.A.; Chernew, M.E.; Fendrick, A.M. What is the price of life and why doesn’t it increase at the rate of inflation? Arch. Intern. Med. 2003, 163, 1637–1641. [Google Scholar] [CrossRef]
  136. Richtlijn Voor Het Uitvoeren van Economische Evaluaties in de Gezondheidszorg; Zorginstituut Nederland (National Health Care Institute, Netherlands): Diemen, The Netherlands, 2016; Available online: https://www.zorginstituutnederland.nl/publicaties/publicatie/2016/02/29/richtlijn-voor-het-uitvoeren-van-economische-evaluaties-in-de-gezondheidszorg (accessed on 21 March 2019).
Figure 1. Change in ICER/QALY with varying BRCA testing costs in Brazil, China, and India. (a) Change in ICER/QALY with varying BRCA testing costs in Brazil, China and India from a payer/healthcare perspective. (b) Change in ICER/QALY with varying BRCA testing costs in Brazil, China, and India from a societal perspective. The graphs depict the change in ICER/QALY at varying costs of BRCA testing for Brazil, China, and India from payer (Figure 1a) and societal (Figure 1b) perspectives. X axis: BRCA testing costs in US$; Y axis: ICER/QALY.
Cancers 12 01929 g001
Figure 2. Cost-effectiveness acceptability curves. (a) Cost-effectiveness acceptability curve—payer perspective. (b) Cost-effectiveness acceptability curve—societal perspective. * The GDP-based (WHO) willingness-to-pay thresholds are $127,969/QALY in the UK, $172,766/QALY in the US, $151,616/QALY in the Netherlands, $46,592/QALY in China, $45,545/QALY in Brazil, and $19,722/QALY in India (Table 2). The country guideline-specific willingness-to-pay thresholds are $42,857/QALY in the UK, $100,000 in the US, and $60,976 in the Netherlands (Table 2). Probabilistic sensitivity analysis in which all model parameters/variables are varied simultaneously across their distributions to further explore model uncertainty. X-axis: Willingness-to-pay thresholds in terms of Cost ($s))/QALY; Y-axis: Proportion of simulations. The results of 1000 simulations were plotted on a cost-effectiveness acceptability curve showing the proportion of simulations (Y-axis) that indicated that the intervention was cost-effective at different willingness-to-pay thresholds (X-axis). Separate curves are plotted for the UK, USA, Netherlands, China, Brazil, and India, with different analyses provided for both payer (Figure 2a) and societal (Figure 2b) perspectives.
Cancers 12 01929 g002
Figure 3. BC, breast cancer; CHD, coronary heart disease; FH, family history; OC, ovarian cancer; RRM, risk-reducing mastectomy; RRSO, risk-reducing salpingo-oophorectomy.
Cancers 12 01929 g003
Table 1. Baseline analysis.
Baseline Analysis Based on WHO Guidelines, Using GDP-Based Thresholds
Population-Based Testing# FH-Based TestingICERWTP Threshold ($/QALY)
Health EffectsCostsHealth EffectsCostsCost/LYCost/QALY (95% Credible Intervals)1*GDP per Capita3*GDP per Capita
LYQALYPayerSocietalLYQALYPayerSocietalPayerSocietalPayerSocietal
UK25.6725.62254318,56825.6625.61233618,62325,530−679421,191 (14,857, 29,619)−5639 (−11,880, 1895)42,656127,969
USA25.2325.18725021,95125.2225.17712221,98220,997−509716,552 (4435, 30,280)−4018 (−15,947, 8764)57,589172,766
Netherlands25.8625.81247824,64225.8525.80223924,75030,587−13,86825,215 (18,193, 34,069)−11,433 (−18,054, −3689)50,539151,616
China20.7020.69820768720.7020.68665756830,78823,68423,485 (13,947, 36,162)18066 (8683, 30,653)15,53146,592
Brazil24.5424.51834631424.5324.49586615324,49615,84420,995 (15,707, 27,953)13,579 (8561, 20,180)15,18245,545
India18.1718.1663430,96818.1718.1536930,77939,47328,21832,217 (23,982, 42,786)23,031 (15,107, 22,112)657419,722
Country-Specific Analysis Based on Local Health Economic Guidelines Where they Exist
Population-Based Testing# FH-Based TestingICERWTP Threshold ($/QALY)
Health effectsCostsHealth effectsCostsCost/LYCost/QALY (95% Credible Intervals)
LYQALYPayerSocietalLYQALYPayerSocietalPayerSocietalPayerSocietal
UK 23.5523.51226316,57023.5523.50205316,60129,273−430924,066 (16,407, 33,590)−3543 (−10452, 4901)28,47142,857
USA25.2325.18725021,95125.2225.17712221,98220,997−509716,552 (4435, 30,280)−4018 (−15947, 8764)50,000100,000
Netherlands 34.5834.51196819,10934.5734.49172519,15320,796−375217,655 (12,948, 23,766)−3185 (−7568, 2319)24,39060,976
ICER: incremental cost-effectiveness ratio, LY—life years, QALY—quality-adjusted life years, FH—family history, GDP—gross domestic product. # Reference Strategy, Costs are given in $ WTP: willingness to pay. This reflects the different cost-effective thresholds for different countries. For GDP-based thresholds: Three times GDP per capita is the threshold for being cost-effective and one time GDP per capita is the threshold for being highly cost-effective. Discount rate is 3% for costs and health effects (LYs and QALYs). For country-specific thresholds: For the UK, this is £20,000 to £30,000 [25]; For the USA, this is $50,000 to $100,000 [26]; For the Netherlands, this is: €20,000 to €50,000 [27]. Values in £s and €s have been converted to $ using PPP (purchasing power parity) [28]. For the UK, the discount rate is 3.5% for costs and health effects as per National Institute of Health and Care Excellence (NICE) economic evaluation guidelines [25]. For the Netherlands, the discount rate is 4% for costs and 1.5% for QALYs as per Dutch health economic analysis guidelines. Perspective: Dutch guidelines recommend a societal perspective. UK NICE guidelines recommend a payer perspective [25]. (See Appendix D for details and references). 1*GDP means 1 × GDP; 3*GDP means 3 × GDP
Table 2. Lifetime population impact of offering genetic testing for the population.
Population-Based TestingFH-Based TestingDifference
Per MillionActualPer MillionActualPer MillionActual
UK (female population over 30 years = 21,760,299)
BC cases112,0142,437,458114,6662,495,166−2652−57,708
OC cases15,822344,29116,269354,018−447−9727
BC deaths12,985282,55713,258288,498−273−5941
OC deaths278604955011,968−272−5919
Excess CHD deaths173700017370
USA (female population over 30 years = 101,428,241)
BC cases106,43110,795,109109,08411,064,198−2653−269,089
OC cases99851,012,76110,4171,056,578−432−43,817
BC deaths8113822,8878285840,333−172−17,446
OC deaths23523,83647548,178−240−24,343
Excess CHD deaths17172400171724
Netherlands (female population over 30 years = 5,694,479)
BC cases111,732636,256114,398651,437−2666−15,181
OC cases10,96462,43411,41364,991−449−2557
BC deaths11,82267,32012,07268,744−250−1424
OC deaths27715775423086−265−1509
Excess CHD deaths1797001797
China (female population over 30 years = 422,831,894)
BC cases27,06211,442,67729,54612,492,991−2484−1,050,314
OC cases38621,632,97742281,787,733−366−154,756
BC deaths3728157631740151,697,670−287−121,353
OC deaths16368922369156,025−206−87,103
Excess CHD deaths12507400125074
Brazil (female population over 30 years = 58,670,634)
BC cases66,2273,885,58068,8914,041,879−2664−156,299
OC cases5358314,3575787339,527−429−25,170
BC deaths12,901756,91013,421787,419−520−30,509
OC deaths27115,90053931,623−268−15,724
Excess CHD deaths179970017997
India (female population over 30 years = 298,650,697)
BC cases13,7134,095,39716,0324,787,968−2319−692,571
OC cases2826843,9873153941,646−327−97,659
BC deaths37961,133,67843911,311,375−595−177,697
OC deaths16850,173429128,121−261−77,948
Excess CHD deaths823890082389
BC—breast cancer, CHD—coronary heart disease, FH—family history, OC—ovarian cancer. The female population data is obtained from the World Bank [29]. We used the modelling to estimate the number of BC cases, OC cases, BC deaths, OC deaths, and excess CHD deaths per million women aged 30 years in the six countries and calculated the number of cases prevented and deaths prevented. The actual numbers of cases prevented and deaths prevented were estimated based on the number of female population aged over 30 years in the six countries [29].
Table 3. Scenario analysis.
Population-Based TestingFH-Based TestingICERWTP
Health EffectsCostsHealth EffectsCostsCost/LYCost/QALYGDP per Capita3*GDP per Capita
LYQALYPayerSocietalLYQALYPayerSocietalPayerSocietalPayerSocietal
Scenario: No reduction in breast cancer risk from RRSO (P9 = 1)
UK 25.6725.62255018,58925.6625.61233618,62627,692−472923,188−396042,656127,969
USA 25.2225.18727321,98225.2225.17712521,98625,474−56520,318−45057,589172,766
Netherlands 25.8625.81248324,66825.8525.80224024,75432,834−11,55927,318−961750,539151,616
China20.7020.69825769320.7020.68666756932,87425,74525,40119,89215,53146,592
Brazil24.5424.51837632124.5324.49586615426,17517,44722,57715,04915,18245,545
India18.1718.1663730,97418.1718.1537030,77941,33330,12534,01924,795657419,722
Scenario: No compliance with HRT (P13 = 0)
UK 25.6725.62254218,56925.6625.61233518,62326,315−695421,707−573642,656127,969
USA 25.2225.18725021,95125.2225.17712221,98221,997−528017,173−412257,589172,766
Netherlands 25.8625.81247724,64725.8525.80223924,75131,629−13,86925,897−11,35650,539151,616
China20.7020.69812767820.7020.68664756629,97522,72222,75017,24615,53146,592
Brazil24.5424.51833631224.5324.49586615324,93216,07721,29613,73215,18245,545
India18.1718.1662330,95718.1718.1536730,77738,32726,99531,24222,005657419,722
Scenario: Half RRM uptake (p2 = 0.235) *
UK 25.6725.62254518,59025.6625.61233618,62727,301−483422,648−401042,656127,969
USA 25.2225.18726521,97825.2225.17712521,98724,248−150319,122−118557,589172,766
Netherlands 25.8625.81248024,67125.8525.80224024,75532,616−11,44926,879−943550,539151,616
China20.7020.69826769520.7020.68666756933,44026,36225,45320,06615,53146,592
Brazil24.5424.51838632424.5324.49587615526,62217,93822,76215,33715,18245,545
India18.1718.1662030,95918.1718.1536730,77739,82028,63732,37723,285657419,722
Scenario: Half RRSO uptake (p8 = 0.275)
UK 25.6725.62254618,58925.6625.61233618,62828,209−527223,325−435942,656127,969
USA 25.2225.18727121,98225.2225.17712721,98925,917−120520,308−94457,589172,766
Netherlands 25.8625.81248224,67525.8525.80224124,75833,868−11,68127,799−958850,539151,616
China20.7020.69820768820.7020.68665756832,32125,01824,65119,08115,53146,592
Brazil24.5424.51835631924.5324.49586615426,24117,34122,47514,85215,18245,545
India18.1718.1663030,96718.1718.1536930,77940,49029,17533,03723,805657419,722
Scenario: Genetic testing cost of $100
UK 25.6725.62244318,46825.6625.61233518,62213,337−18,98811,070−15,76142,656127,969
USA 25.2325.18715021,85125.2225.17712121,9814717−21,3773718−16,85257,589172,766
Netherlands 25.8625.81237824,54225.8525.80223824,74917,893−26,56214,750−21,89750,539151,616
China20.7020.69721758720.7020.68664756711,16540618517309815,53146,592
Brazil24.5424.51735621424.5324.49585615214,741608912,635521915,18245,545
India18.1718.1653530,86918.1718.1536830,77824,83213,57720,26711,081657419,722
LY—life years, QALY—quality-adjusted life year, FH—family history, GDP—gross domestic product, HRT—hormone replacement therapy, ICER—incremental cost-effectiveness ratio, RRM—risk-reducing mastectomy, RRSO—risk-reducing salpingo-oophorectomy, WTP—willingness to pay. * Half the RRM uptake rate of the baseline case analysis. Baseline uptake = 47%, Half the baseline = 23.5%. # Half the RRSO uptake rate of the baseline case analysis. Baseline uptake = 55%, Half the baseline = 27.5%. UK health-economic guideline based threshold is $28,471–$42,857/QALY. £s have been converted to $ using PPP (purchasing power parity) [28]. USA health-economic guideline based WTP threshold is $50,000–$100,000/QALY. Netherlands health-economic guideline based WTP threshold is $24,390–$60,976/QALY. €s have been converted to $ using PPP (purchasing power parity).
Table 4. Probability Values.
ProbabilityDescriptionValue(95% CI) (Range)Source
P1BRCA1/2 mutation prevalence in general population 0.0067(0.0059, 0.0077)[59]
P2Probability that carriers will undergo RRM0.47(0.34, 0.56)[60]
P3Reduction in ovarian cancer risk from RRSO 0.96[0.8, 0.96][4,6]
P4Probability of having a positive FH0.0098(0.0047, 0.0179)ABCFS
P5BRCA1/2 mutation prevalence in FH-positive individuals0.1 [10]
P6BRCA1/2 mutation prevalence in FH-negative individuals0.0058(0.0051, 0.0068)[59], ABCFS
P7Reduction in breast cancer risk from RRM without RRSO in BRCA1/2 carriers0.91(0.62, 0.98)[8]
P8Probability that carriers will undergo RRSO0.55(0.45, 0.64)[61]
P9Hazard ratio in breast cancer risk from RRSO alone0.49(0.37,0.65)[4]
P10Reduction in risk of breast cancer from RRM with RRSO0.95(0.78, 0.99)[8]
P11Excess CHD risk0.0072(0.0068, 0.0076)[33]
P12Fatal CHD risk0.0303(0.011, 0.043)[33]
P13Compliance with HRT0.8(0.76, 0.83)[62]
P14HR of breast cancer risk from breast cancer chemoprevention0.71(0.6, 0.83)[63]
P15Uptake of breast cancer chemoprevention0.163(0.136, 0.19)[64]
95%CI—95% confidence interval, ABCFS—Australia Breast Cancer Family Study, CHD—coronary heart disease, FH—family history, RRM—risk-reducing mastectomy, RRSO—risk-reducing salpingo-oophorectomy. A detailed explanation of probabilities is given in Appendix A.

