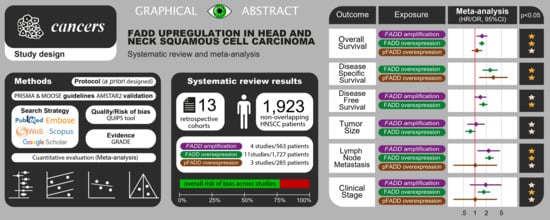
Prognostic and Clinicopathological Significance of FADD Upregulation in Head and Neck Squamous Cell Carcinoma: A Systematic Review and Meta-Analysis

 ,
, 

Abstract
:
1. Introduction
2. Results
2.1. Results of the Literature Search
2.2. Study Characteristics
2.3. Qualitative Evaluation
2.4. Quantitative Evaluation (Meta-Analysis)
2.4.1. Association between FADD Upregulation and Prognostic Variables
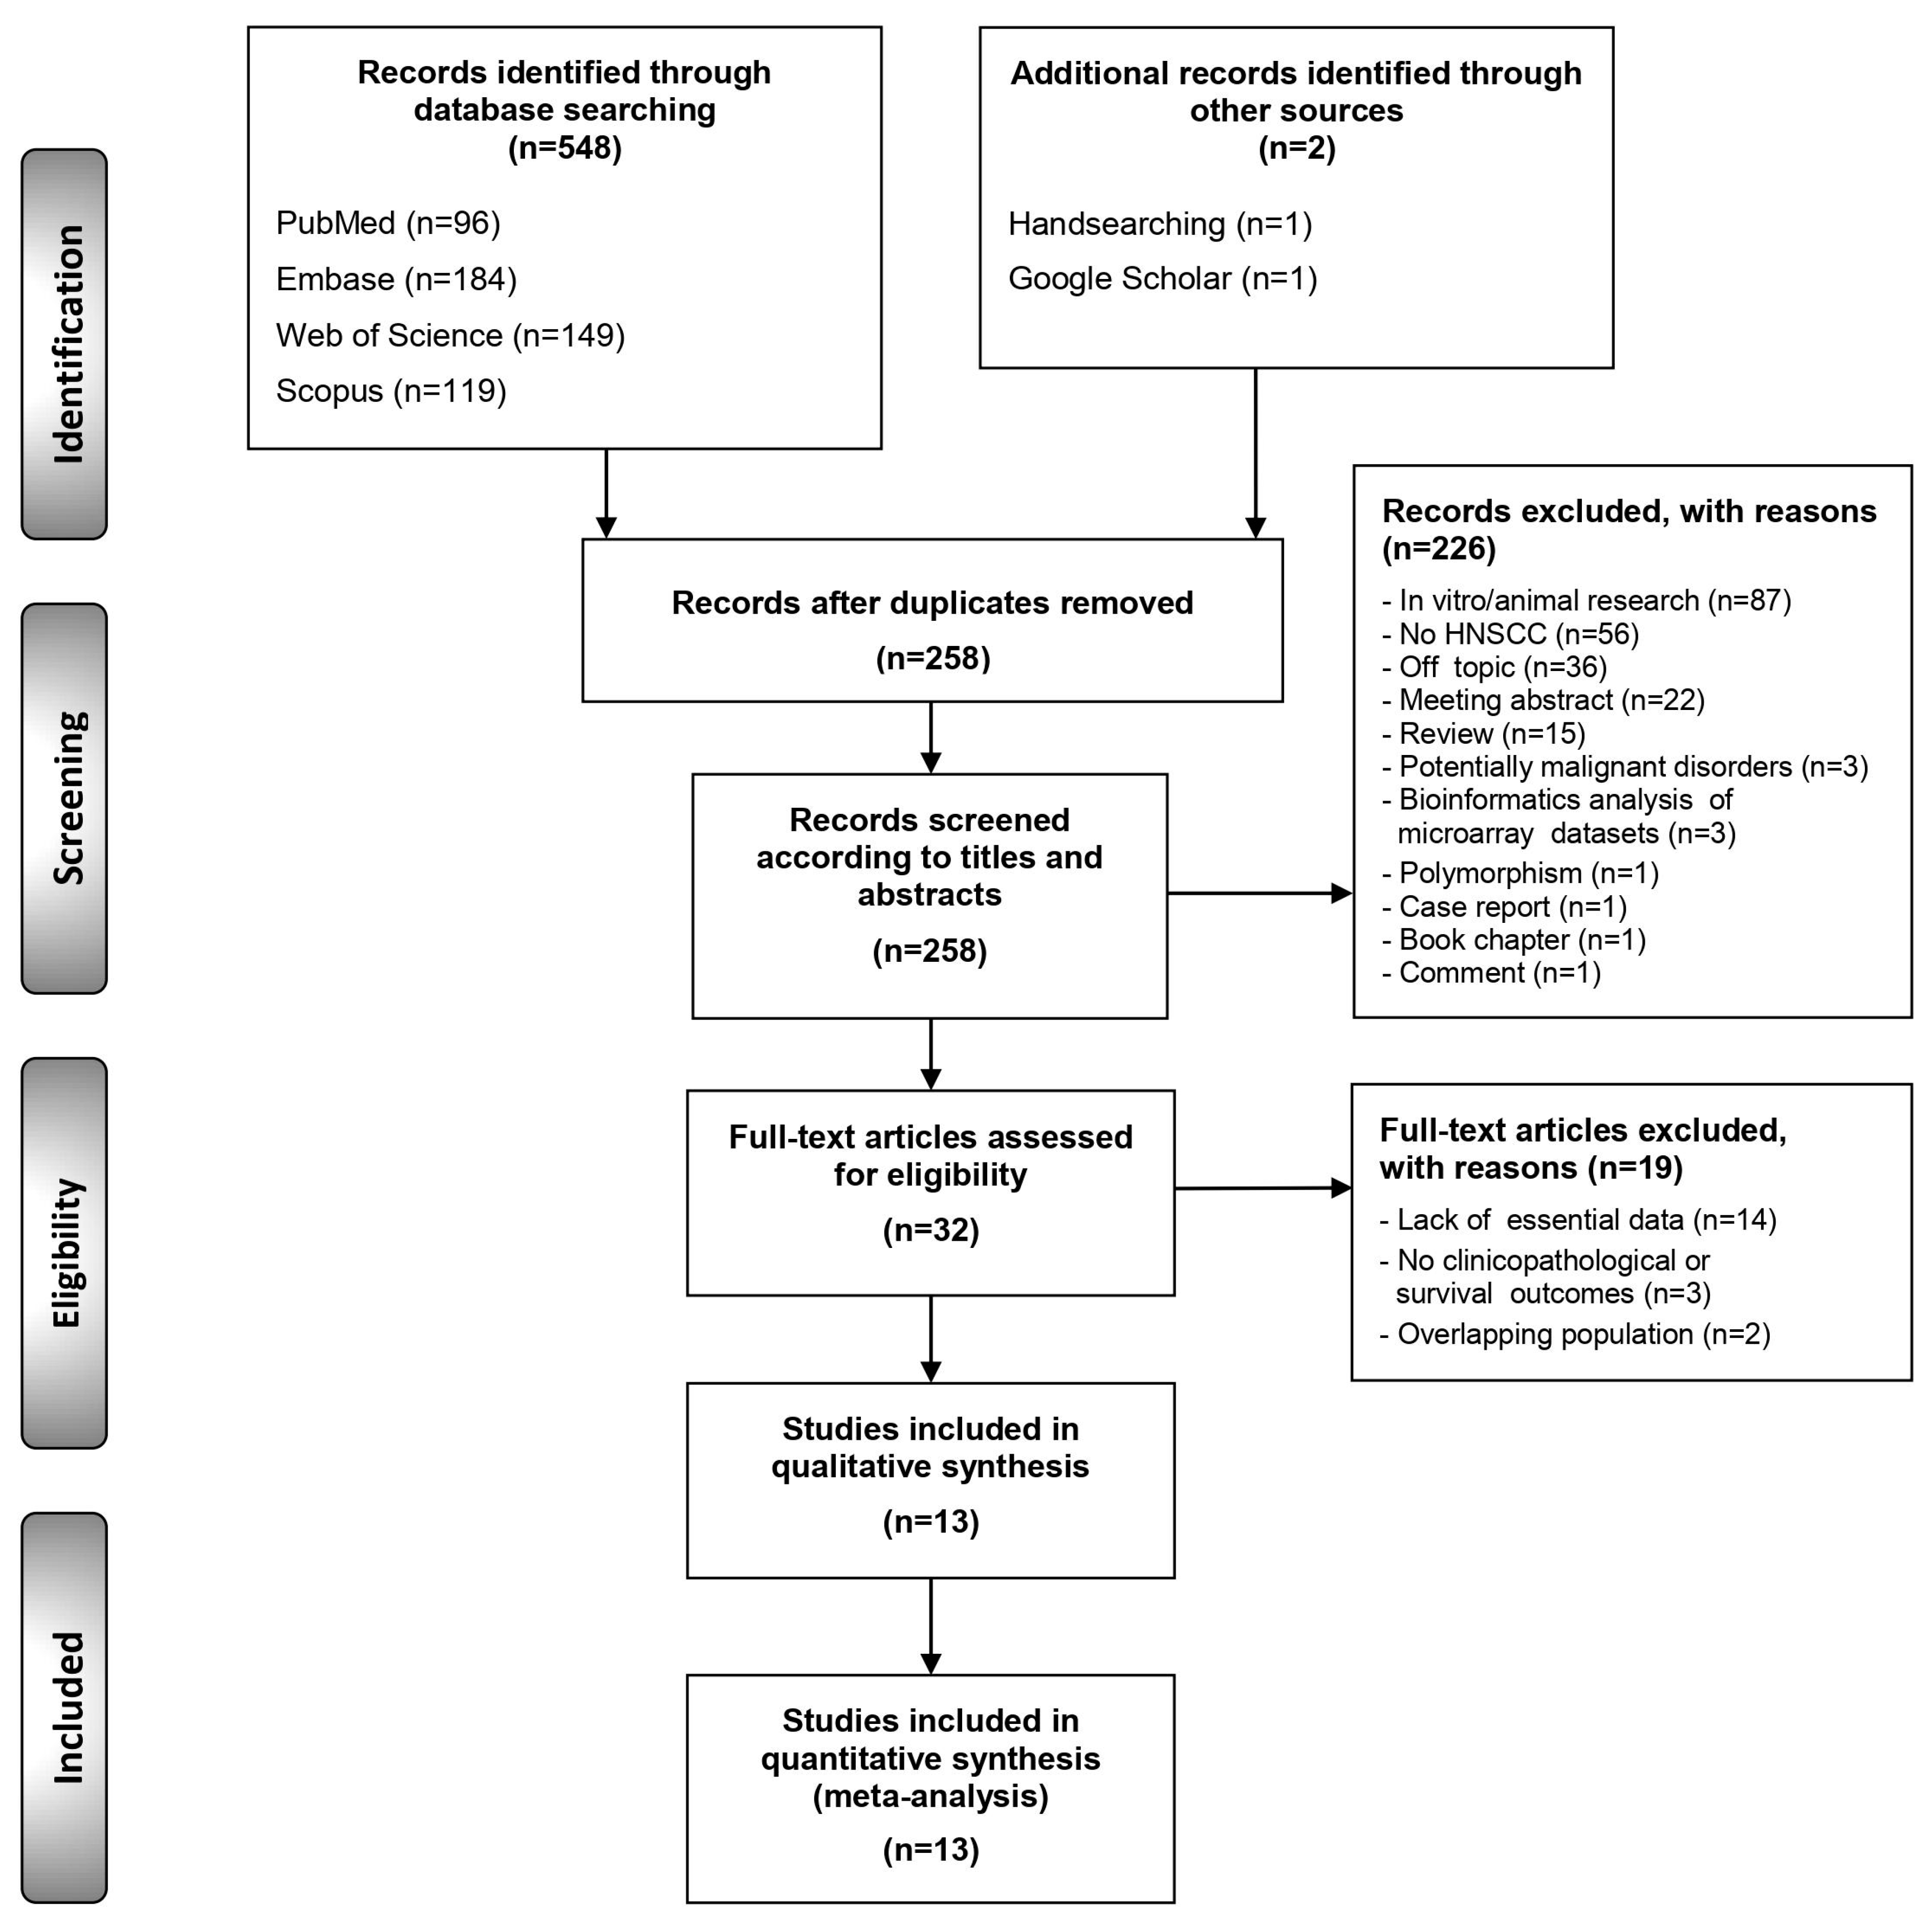
2.4.2. Association between FADD Upregulation and Clinicopathological Variables
2.5. Quantitative Evaluation (Variables Not Included in Meta-Analysis)
2.6. Quantitative Evaluation (Secondary Analyses)
2.6.1. Sensitivity Analysis
2.6.2. Analysis of Subgroups
2.6.3. Meta-Regression Analysis
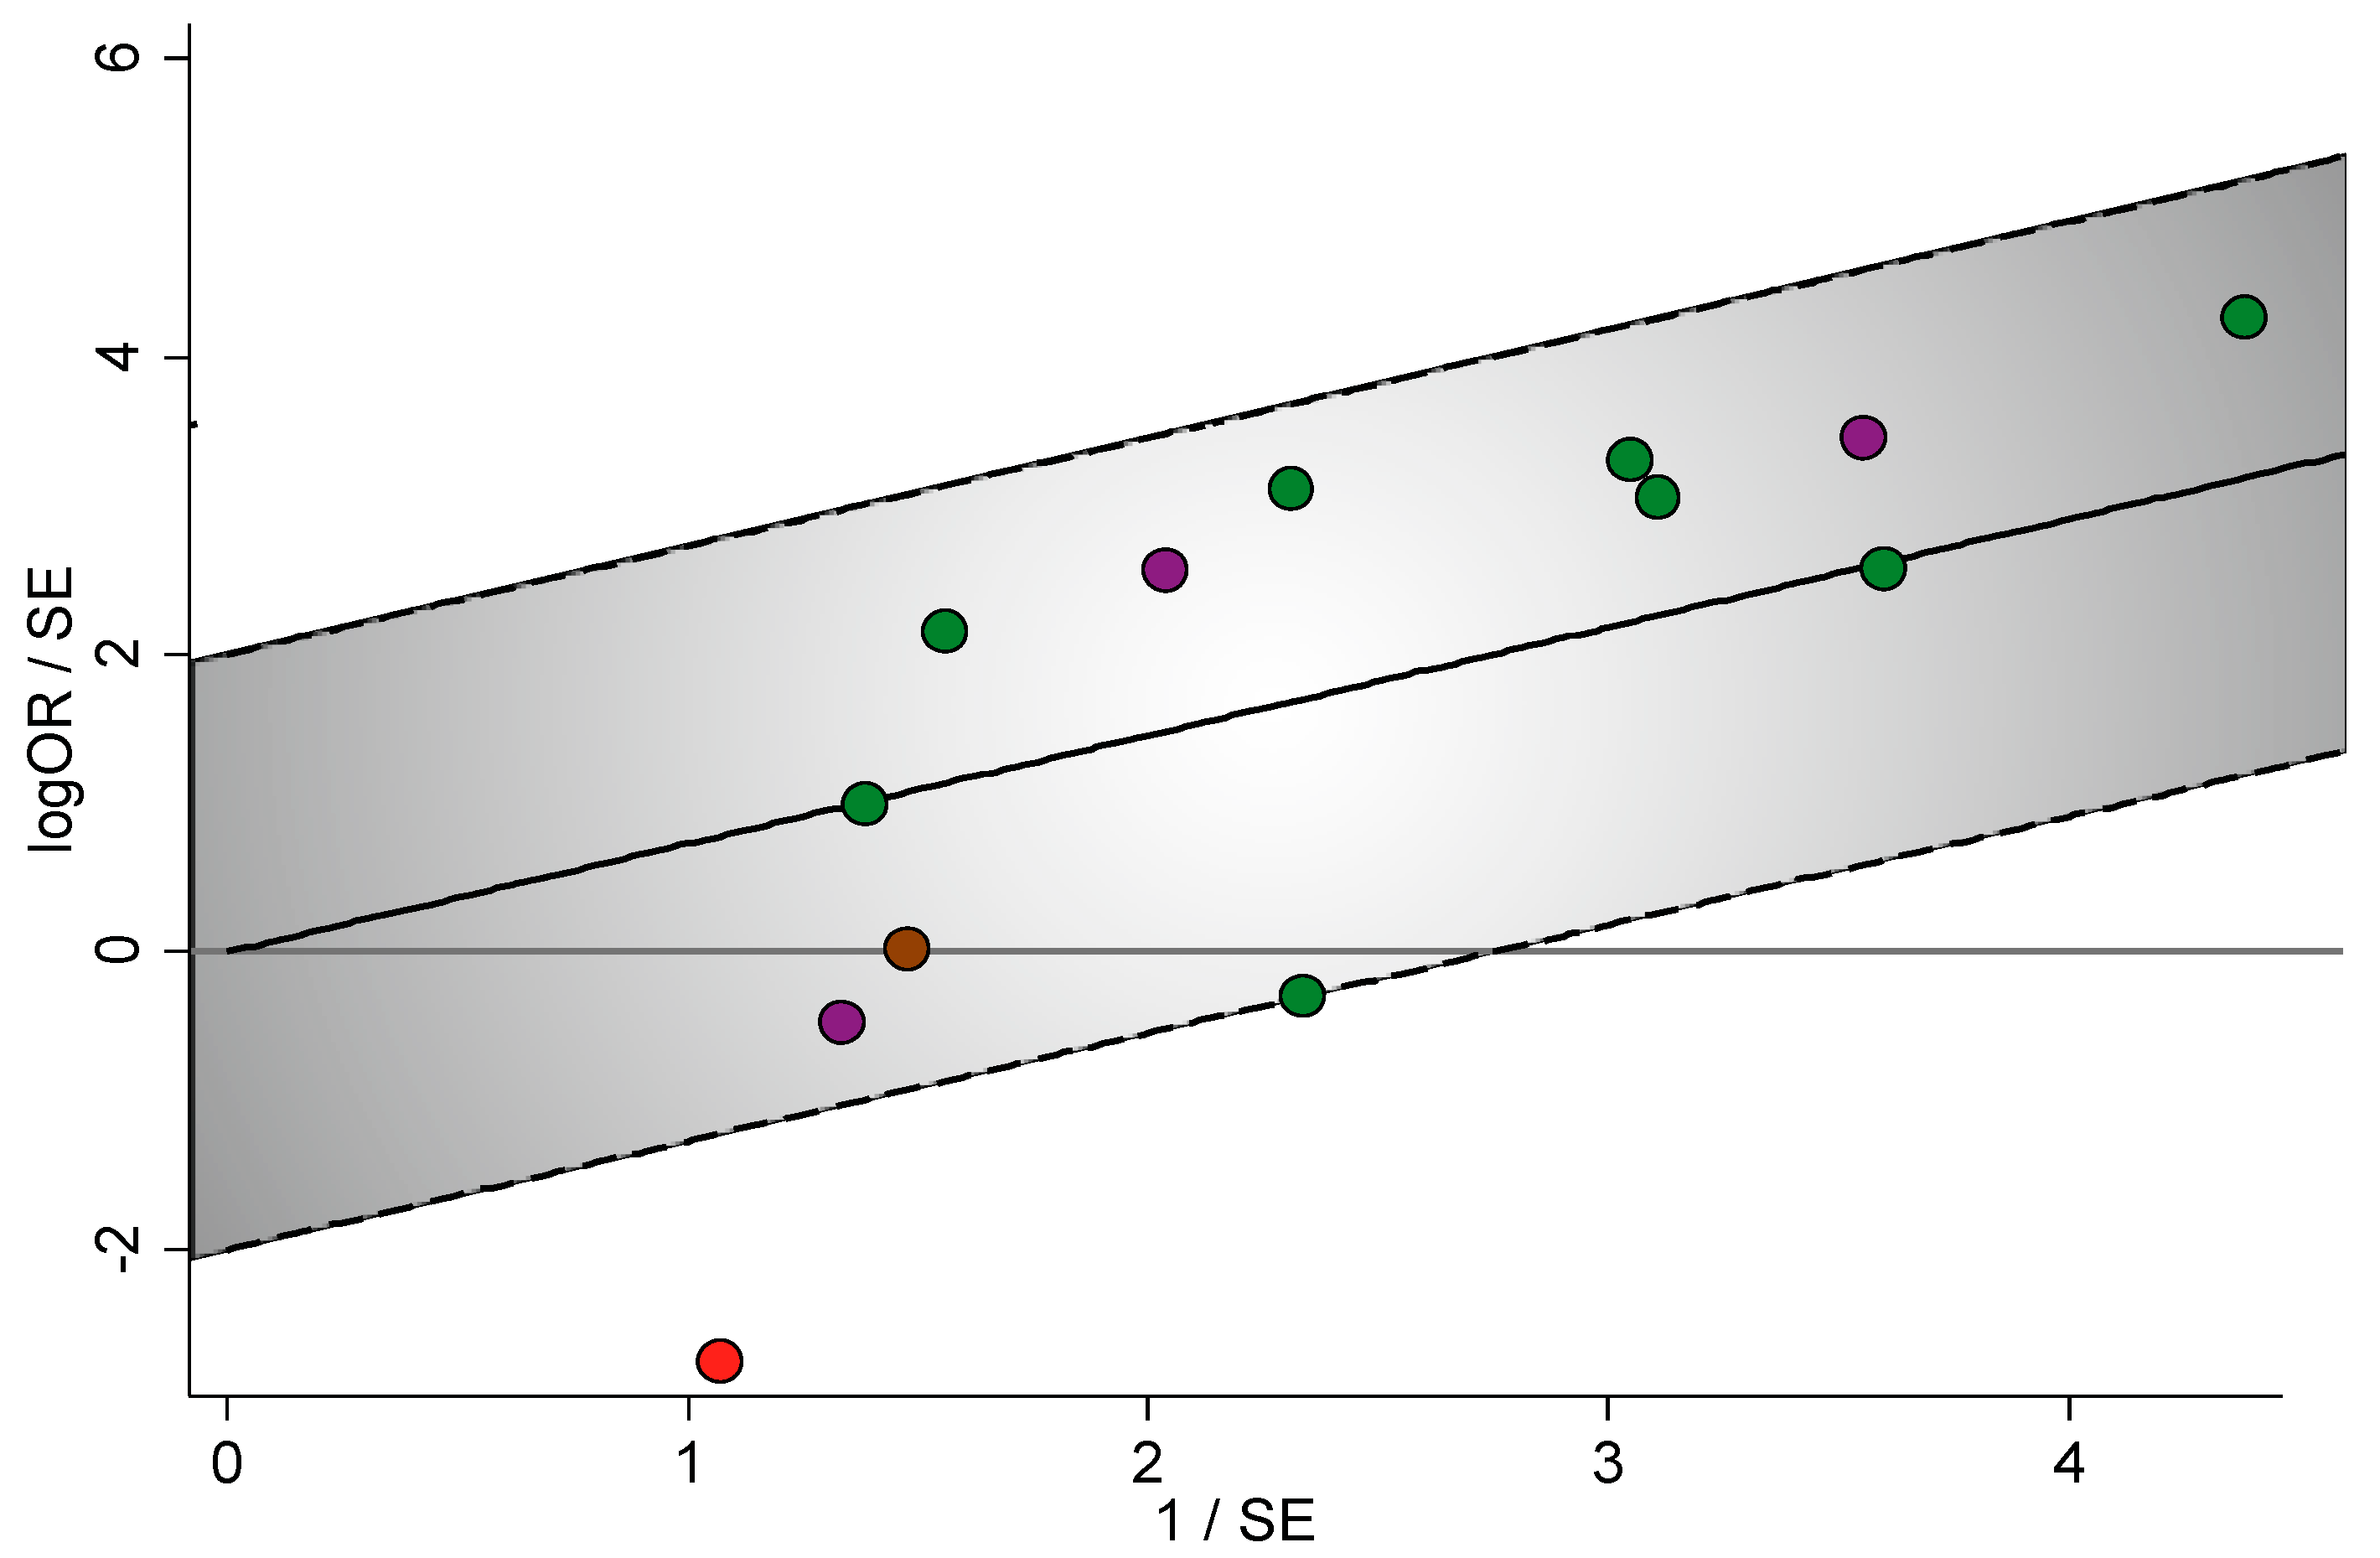
2.6.4. Analysis of Small-Study Effects
2.7. Quality of Evidence
2.8. Validation of Methodological Quality
3. Discussion
4. Materials and Methods
4.1. Protocol
4.2. Search Strategy
4.3. Eligibility Criteria
4.4. Study Selection Process
4.5. Data Extraction
4.6. Evaluation of Quality and Risk of Bias of Individual Studies
4.7. Evaluation of Quality of Evidence
4.8. Validation of Methodological Quality
4.9. Statistical Analysis
5. Conclusions
Supplementary Materials
Author Contributions
Funding
Acknowledgments
Conflicts of Interest
References
- Bray, F.; Ferlay, J.; Soerjomataram, I.; Siegel, R.L.; Torre, L.A.; Jemal, A. Global cancer statistics 2018: GLOBOCAN estimates of incidence and mortality worldwide for 36 cancers in 185 countries. CA Cancer J. Clin. 2018, 68, 394–424. [Google Scholar] [CrossRef] [PubMed] [Green Version]
- Argiris, A.; Karamouzis, M.V.; Raben, D.; Ferris, R.L. Head and neck cancer. Lancet 2008, 371, 1695–1709. [Google Scholar] [CrossRef]
- Leemans, C.R.; Braakhuis, B.J.M.; Brakenhoff, R.H. The molecular biology of head and neck cancer. Nat. Rev. Cancer 2011, 11, 9–22. [Google Scholar] [CrossRef] [PubMed]
- Chow, L.Q.M. Head and Neck Cancer. N. Engl. J. Med. 2020, 382, 60–72. [Google Scholar] [CrossRef] [PubMed]
- Polanska, H.; Raudenska, M.; Gumulec, J.; Sztalmachova, M.; Adam, V.; Kizek, R.; Masarik, M. Clinical significance of head and neck squamous cell cancer biomarkers. Oral Oncol. 2014, 50, 168–177. [Google Scholar] [CrossRef] [PubMed]
- Kang, H.; Kiess, A.; Chung, C.H. Emerging biomarkers in head and neck cancer in the era of genomics. Nat. Rev. Clin. Oncol. 2015, 12, 11–26. [Google Scholar] [CrossRef]
- Ramos-García, P.; Ruiz-Ávila, I.; Gil-Montoya, J.A.; Ayén, Á.; González-Ruiz, L.; Navarro-Triviño, F.J.; González-Moles, M.Á. Relevance of chromosomal band 11q13 in oral carcinogenesis: An update of current 8. knowledge. Oral Oncol. 2017, 72, 7–16. [Google Scholar] [CrossRef]
- Tourneur, L.; Chiocchia, G. FADD: A regulator of life and death. Trends Immunol. 2010, 31, 260–269. [Google Scholar] [CrossRef]
- Marín-Rubio, J.L.; Vela-Martín, L.; Fernández-Piqueras, J.; Villa-Morales, M. FADD in Cancer: Mechanisms of Altered Expression and Function, and Clinical Implications. Cancers 2019, 11, 1462. [Google Scholar] [CrossRef] [Green Version]
- Zhang, J.; Zhang, D.; Hua, Z. FADD and its phosphorylation. IUBMB Life 2004, 56, 395–401. [Google Scholar] [CrossRef]
- Marín-Rubio, J.L.; Pérez-Gómez, E.; Fernández-Piqueras, J.; Villa-Morales, M. S194-P-FADD as a marker of aggressiveness and poor prognosis in human T-cell lymphoblastic lymphoma. Carcinogenesis 2019, 40, 1260–1268. [Google Scholar] [CrossRef] [PubMed]
- Chen, G.; Bhojani, M.S.; Heaford, A.C.; Chang, D.C.; Laxman, B.; Thomas, D.G.; Griffin, L.B.; Yu, J.; Coppola, J.M.; Giordano, T.J.; et al. Phosphorylated FADD induces NF-kappaB, perturbs cell cycle, and is associated with poor outcome in lung adenocarcinomas. Proc. Natl. Acad. Sci. USA 2005, 102, 12507–12512. [Google Scholar] [CrossRef] [PubMed] [Green Version]
- Wachters, J.E.; Kop, E.; Slagter-Menkema, L.; Mastik, M.; van der Wal, J.E.; van der Vegt, B.; de Bock, G.H.; van der Laan, B.F.A.M.; Schuuring, E. Distinct Biomarker Profiles and Clinical Characteristics in T1-T2 Glottic and Supraglottic Carcinomas. Laryngoscope 2020. [Google Scholar] [CrossRef] [PubMed]
- Ramos-García, P.; Gil-Montoya, J.A.; Scully, C.; Ayén, A.; González-Ruiz, L.; Navarro-Triviño, F.J.; González-Moles, M.A. An update on the implications of cyclin D1 in oral carcinogenesis. Oral Dis. 2017, 23, 897–912. [Google Scholar] [CrossRef] [PubMed]
- Ramos-García, P.; González-Moles, M.Á.; González-Ruiz, L.; Ayén, Á.; Ruiz-Ávila, I.; Navarro-Triviño, F.J.; Gil-Montoya, J.A. An update of knowledge on cortactin as a metastatic driver and potential therapeutic target in oral squamous cell carcinoma. Oral Dis. 2019, 25, 949–971. [Google Scholar] [CrossRef]
- Wilkerson, P.M.; Reis-Filho, J.S. The 11q13-q14 amplicon: Clinicopathological correlations and potential drivers. Genes Chromosomes Cancer 2013, 52, 333–355. [Google Scholar] [CrossRef]
- Gibcus, J.H.; Menkema, L.; Mastik, M.F.; Hermsen, M.A.; de Bock, G.H.; van Velthuysen, M.-L.F.; Takes, R.P.; Kok, K.; Alvarez Marcos, C.A.; van der Laan, B.F.A.M.; et al. Amplicon mapping and expression profiling identify the Fas-associated death domain gene as a new driver in the 11q13.3 amplicon in laryngeal/pharyngeal cancer. Clin. Cancer Res. 2007, 13, 6257–6266. [Google Scholar] [CrossRef] [Green Version]
- Cancer Genome Atlas Network. Comprehensive genomic characterization of head and neck squamous cell carcinomas. Nature 2015, 517, 576–582. [Google Scholar] [CrossRef] [Green Version]
- Pérez Sayáns, M.; Chamorro Petronacci, C.M.; Lorenzo Pouso, A.I.; Padín Iruegas, E.; Blanco Carrión, A.; Suárez Peñaranda, J.M.; García García, A. Comprehensive Genomic Review of TCGA Head and Neck Squamous Cell Carcinomas (HNSCC). J. Clin. Med. 2019, 8, 1896. [Google Scholar] [CrossRef] [Green Version]
- Eytan, D.F.; Snow, G.E.; Carlson, S.; Derakhshan, A.; Saleh, A.; Schiltz, S.; Cheng, H.; Mohan, S.; Cornelius, S.; Coupar, J.; et al. SMAC mimetic birinapant plus radiation eradicates human head and neck cancers with genomic amplifications of cell death genes FADD and BIRC2. Cancer Res. 2016, 76, 5442–5454. [Google Scholar] [CrossRef] [Green Version]
- Reddy, R.B.; Bhat, A.R.; James, B.L.; Govindan, S.V.; Mathew, R.; Dr, R.; Hedne, N.; Illiayaraja, J.; Kekatpure, V.; Khora, S.S.; et al. Meta-Analyses of Microarray Datasets Identifies ANO1 and FADD as Prognostic Markers of Head and Neck Cancer. PLoS ONE 2016, 11, e0147409. [Google Scholar] [CrossRef] [PubMed]
- Derakhshan, A.; Chen, Z.; Van Waes, C. Therapeutic small molecules target inhibitor of apoptosis proteins in cancers with deregulation of extrinsic and intrinsic cell death pathways. Clin. Cancer Res. 2017, 23, 1379–1387. [Google Scholar] [CrossRef] [PubMed] [Green Version]
- Xiao, R.; Allen, C.; Tran, L.; Patel, P.; Park, S.; Chen, X.; van Waes, C.; Schmitt, N. Antagonist of cIAP1/2 and XIAP enhances anti-tumor immunity when combined with radiation and PD-1 blockade in a syngeneic model of head and neck cancer. Oncoimmunology 2018, 7. [Google Scholar] [CrossRef] [PubMed]
- Lenouvel, D.; González-Moles, M.Á.; Talbaoui, A.; Ramos-García, P.; González-Ruiz, L.; Ruiz-Ávila, I.; Gil-Montoya, J.A. An update of knowledge on PD-L1 in head and neck cancers: Physiologic, prognostic and therapeutic perspectives. Oral Dis. 2020, 26, 511–526. [Google Scholar] [CrossRef] [PubMed]
- Ramos-García, P.; González-Moles, M.Á.; González-Ruiz, L.; Ruiz-Ávila, I.; Ayén, Á.; Gil-Montoya, J.A. Prognostic and clinicopathological significance of cyclin D1 expression in oral squamous cell carcinoma: A systematic review and meta-analysis. Oral Oncol. 2018, 83, 96–106. [Google Scholar] [CrossRef]
- Ramos-García, P.; González-Moles, M.Á.; Ayén, Á.; González-Ruiz, L.; Ruiz-Ávila, I.; Gil-Montoya, J.A. Prognostic and clinicopathological significance of CTTN/cortactin alterations in head and neck squamous cell carcinoma: Systematic review and meta-analysis. Head Neck 2018, 41, 1963–1978. [Google Scholar] [CrossRef]
- van Kempen, P.M.W.; Noorlag, R.; Braunius, W.W.; Moelans, C.B.; Rifi, W.; Savola, S.; Koole, R.; Grolman, W.; van Es, R.J.J.; Willems, S.M. Clinical relevance of copy number profiling in oral and oropharyngeal squamous cell carcinoma. Cancer Med. 2015, 4, 1525–1535. [Google Scholar] [CrossRef] [Green Version]
- Haili, S.; Huam, G.; Ting, L.; Shuifang, X. Expression and significance of Fas, FasL and Fas-related death domain proteins in laryngeal carcinoma. Chinese Otolaryngol. Head Neck Surg. 2010, 17, 343–345. [Google Scholar]
- Fan, S.; Müller, S.; Chen, Z.; Lin, P.; Tighiouart, M.; Shin, D.; Khuri, F.R.; Sun, S.-Y. Prognostic impact of Fas-associated death domain, a key component in death receptor signaling, is dependent on the presence of lymph node metastasis in head and neck squamous cell carcinoma. Cancer Biol. Ther. 2013, 14, 365–369. [Google Scholar] [CrossRef]
- Chien, H.-T.; Cheng, S.-D.; Chuang, W.-Y.; Liao, C.-T.; Wang, H.-M.; Huang, S.-F. Clinical Implications of FADD Gene Amplification and Protein Overexpression in Taiwanese Oral Cavity Squamous Cell Carcinomas. PLoS ONE 2016, 11, e0164870. [Google Scholar] [CrossRef]
- Schrijvers, M.L.; Pattje, W.J.; Slagter-Menkema, L.; Mastik, M.F.; Gibcus, J.H.; Langendijk, J.A.; van der Wal, J.E.; van der Laan, B.F.A.M.; Schuuring, E. FADD Expression as a Prognosticator in Early-Stage Glottic Squamous Cell Carcinoma of the Larynx Treated Primarily with Radiotherapy. Int. J. Radiat. Oncol. 2012, 83, 1220–1226. [Google Scholar] [CrossRef] [PubMed] [Green Version]
- Prapinjumrune, C.; Morita, K.; Kuribayashi, Y.; Hanabata, Y.; Shi, Q.; Nakajima, Y.; Inazawa, J.; Omura, K. DNA amplification and expression of FADD in oral squamous cell carcinoma. J. Oral Pathol. Med. 2009. [Google Scholar] [CrossRef] [PubMed]
- Guyatt, G.H.; Oxman, A.D.; Vist, G.E.; Kunz, R.; Falck-Ytter, Y.; Alonso-Coello, P.; Schünemann, H.J. GRADE Working Group GRADE: An emerging consensus on rating quality of evidence and strength of recommendations. BMJ 2008, 336, 924–926. [Google Scholar] [CrossRef] [PubMed] [Green Version]
- Shea, B.J.; Reeves, B.C.; Wells, G.; Thuku, M.; Hamel, C.; Moran, J.; Moher, D.; Tugwell, P.; Welch, V.; Kristjansson, E.; et al. AMSTAR 2: A critical appraisal tool for systematic reviews that include randomised or non-randomised studies of healthcare interventions, or both. BMJ 2017, j4008. [Google Scholar] [CrossRef] [PubMed] [Green Version]
- Zhang, X.; Dong, X.; Wang, H.; Li, J.; Yang, B.; Zhang, J.; Hua, Z.C. FADD regulates thymocyte development at the β-selection checkpoint by modulating Notch signaling. Cell Death Dis. 2014, 5. [Google Scholar] [CrossRef] [PubMed] [Green Version]
- Nowell, C.S.; Radtke, F. Notch as a tumour suppressor. Nat. Rev. Cancer 2017, 17, 145–159. [Google Scholar] [CrossRef]
- Agrawal, N.; Frederick, M.J.; Pickering, C.R.; Bettegowda, C.; Chang, K.; Li, R.J.; Fakhry, C.; Xie, T.-X.; Zhang, J.; Wang, J.; et al. Exome sequencing of head and neck squamous cell carcinoma reveals inactivating mutations in NOTCH1. Science 2011, 333, 1154–1157. [Google Scholar] [CrossRef] [Green Version]
- Stransky, N.; Egloff, A.M.; Tward, A.D.; Kostic, A.D.; Cibulskis, K.; Sivachenko, A.; Kryukov, G.V.; Lawrence, M.S.; Sougnez, C.; McKenna, A.; et al. The mutational landscape of head and neck squamous cell carcinoma. Science 2011, 333, 1157–1160. [Google Scholar] [CrossRef] [Green Version]
- Linkermann, A.; Green, D.R. Necroptosis. N. Engl. J. Med. 2014, 370, 455–465. [Google Scholar] [CrossRef] [Green Version]
- Lin, Y.; Devin, A.; Rodriguez, Y.; Liu, Z.G. Cleavage of the death domain kinase RIP by Caspase-8 prompts TNF-induced apoptosis. Genes Dev. 1999, 13, 2514–2526. [Google Scholar] [CrossRef]
- Osborn, S.L.; Diehl, G.; Han, S.J.; Xue, L.; Kurd, N.; Hsieh, K.; Cado, D.; Robey, E.A.; Winoto, A. Fas-associated death domain (FADD) is a negative regulator of T-cell receptor-mediated necroptosis. Proc. Natl. Acad. Sci. USA 2010, 107, 13034–13039. [Google Scholar] [CrossRef] [PubMed] [Green Version]
- Henry, C.M.; Martin, S.J. Caspase-8 Acts in a Non-enzymatic Role as a Scaffold for Assembly of a Pro-inflammatory “FADDosome” Complex upon TRAIL Stimulation. Mol. Cell 2017, 65, 715–729. [Google Scholar] [CrossRef] [PubMed] [Green Version]
- Mouasni, S.; Tourneur, L. FADD at the Crossroads between Cancer and Inflammation. Trends Immunol. 2018, 39, 1036–1053. [Google Scholar] [CrossRef] [PubMed]
- Zhang, X.Y.; Yang, B.Y.; Wang, J.Y.; Mo, X.; Zhang, J.; Hua, Z.C. FADD is essential for glucose uptake and survival of thymocytes. Biochem. Biophys. Res. Commun. 2014, 451, 202–207. [Google Scholar] [CrossRef]
- Hanahan, D.; Weinberg, R.A. Hallmarks of cancer: The next generation. Cell 2011, 144, 646–674. [Google Scholar] [CrossRef] [Green Version]
- Shin, M.S.; Kim, H.S.; Lee, S.H.; Lee, J.W.; Song, Y.H.; Kim, Y.S.; Park, W.S.; Kim, S.Y.; Lee, S.N.; Park, J.Y.; et al. Alterations of Fas-pathway genes associated with nodal metastasis innon-small cell lung cancer. Oncogene 2002, 21, 4129–4136. [Google Scholar] [CrossRef] [Green Version]
- Sun, S.Y. Understanding the role of the death receptor 5/FADD/caspase-8 death signaling in cancer metastasis. Mol. Cell. Pharmacol. 2011, 3, 31–34. [Google Scholar] [CrossRef]
- Barbero, S.; Mielgo, A.; Torres, V.; Teitz, T.; Shields, D.J.; Mikolon, D.; Bogyo, M.; Barilà, D.; Lahti, J.M.; Schlaepfer, D.; et al. Caspase-8 association with the focal adhesion complex promotes tumor cell migration and metastasis. Cancer Res. 2009, 69, 3755–3763. [Google Scholar] [CrossRef] [Green Version]
- Liu, Y.; Cui, H.; Huang, X.; Zhu, B.; Guan, S.; Cheng, W.; Lai, Y.; Zhang, X.; Hua, Z.C. MiR-7a is an important mediator in Fas-associated protein with death domain (FADD)-regulated expression of focal adhesion kinase (FAK). Oncotarget 2016, 7, 51393–51407. [Google Scholar] [CrossRef] [Green Version]
- Sulzmaier, F.J.; Jean, C.; Schlaepfer, D.D. FAK in cancer: Mechanistic findings and clinical applications. Nat. Rev. Cancer 2014, 14, 598–610. [Google Scholar] [CrossRef] [Green Version]
- Ramos-García, P.; Bravo, M.; González-Ruiz, L.; González-Moles, M. Significance of cytoplasmic cyclin D1 expression in oral oncogenesis. Oral Dis. 2018, 24, 98–102. [Google Scholar] [CrossRef] [PubMed]
- González-Moles, M.A.; Scully, C.; Ruiz-Ávila, I.; Plaza-Campillo, J.J. The cancer stem cell hypothesis applied to oral carcinoma. Oral Oncol. 2013, 49, 738–746. [Google Scholar] [CrossRef] [PubMed]
- Pantel, K.; Brakenhoff, R.H. Dissecting the metastatic cascade. Nat. Rev. Cancer 2004, 4, 448–456. [Google Scholar] [CrossRef] [PubMed]
- Parmar, M.K.; Torri, V.; Stewart, L. Extracting summary statistics to perform meta-analyses of the published literature for survival endpoints. Stat. Med. 1998, 17, 2815–2834. [Google Scholar] [CrossRef]
- Tierney, J.F.; Stewart, L.A.; Ghersi, D.; Burdett, S.; Sydes, M.R. Practical methods for incorporating summary time-to-event data into meta-analysis. Trials 2007, 8, 16. [Google Scholar] [CrossRef] [Green Version]
- Stroup, D.F.; Berlin, J.A.; Morton, S.C.; Olkin, I.; Williamson, G.D.; Rennie, D.; Moher, D.; Becker, B.J.; Sipe, T.A.; Thacker, S.B. Meta-analysis of observational studies in epidemiology: A proposal for reporting. J. Am. Med. Assoc. 2000, 283, 2008–2012. [Google Scholar] [CrossRef]
- Moher, D.; Liberati, A.; Tetzlaff, J.; Altman, D.G. PRISMA Group Preferred reporting items for systematic reviews and meta-analyses: The PRISMA statement. PLoS Med. 2009, 6, e1000097. [Google Scholar] [CrossRef] [Green Version]
- Riley, R.D.; Ridley, G.; Williams, K.; Altman, D.G.; Hayden, J.; de Vet, H.C.W. Prognosis research: Toward evidence-based results and a Cochrane methods group. J. Clin. Epidemiol. 2007, 60, 863–865, author reply 865–866. [Google Scholar] [CrossRef]
- Higgins, J.P.; Green, S. Cochrane Handbook for Systematic Reviews of Interventions: Cochrane Book Series. Available online: http://handbook.cochrane.org/ (accessed on 17 June 2020).
- Shamseer, L.; Moher, D.; Clarke, M.; Ghersi, D.; Liberati, A.; Petticrew, M.; Shekelle, P.; Stewart, L.A. PRISMA-P Group Preferred reporting items for systematic review and meta-analysis protocols (PRISMA-P) 2015: Elaboration and explanation. BMJ 2015, 350, g7647. [Google Scholar] [CrossRef] [Green Version]
- Cohen, J. A Coefficient of Agreement for Nominal Scales. Educ. Psychol. Meas. 1960, 20, 37–46. [Google Scholar] [CrossRef]
- Hayden, J.A.; Côté, P.; Bombardier, C. Evaluation of the quality of prognosis studies in systematic reviews. Ann. Intern. Med. 2006, 144, 427–437. [Google Scholar] [CrossRef] [PubMed]
- Hayden, J.A.; van der Windt, D.A.; Cartwright, J.L.; Côté, P.; Bombardier, C. Assessing bias in studies of prognostic factors. Ann. Intern. Med. 2013, 158, 280–286. [Google Scholar] [CrossRef] [PubMed]
- Stang, A. Critical evaluation of the Newcastle-Ottawa scale for the assessment of the quality of nonrandomized studies in meta-analyses. Eur. J. Epidemiol. 2010, 25, 603–605. [Google Scholar] [CrossRef] [PubMed] [Green Version]
- Sauerbrei, W.; Taube, S.E.; McShane, L.M.; Cavenagh, M.M.; Altman, D.G. Reporting Recommendations for Tumor Marker Prognostic Studies (REMARK): An Abridged Explanation and Elaboration. JNCI J. Natl. Cancer Inst. 2018, 110, 803–811. [Google Scholar] [CrossRef] [PubMed]
- Ramos-García, P.; González-Moles, M.Á.; Ayén, Á.; González-Ruiz, L.; Gil-Montoya, J.A.; Ruiz-Ávila, I. Predictive value of CCND1 /cyclin D1 alterations in the malignant transformation of potentially malignant head and neck disorders: Systematic review and meta-analysis. Head Neck 2019, 41, 3395–3407. [Google Scholar] [CrossRef]
- Lenouvel, D.; González-Moles, M.Á.; Ruiz-Ávila, I.; Gonzalez-Ruiz, L.; Gonzalez-Ruiz, I.; Ramos-García, P. Prognostic and clinicopathological significance of PD-L1 overexpression in oral squamous cell carcinoma: A systematic review and comprehensive meta-analysis. Oral Oncol. 2020, 106, 104722. [Google Scholar] [CrossRef]
- Harrison, S.; Jones, H.E.; Martin, R.M.; Lewis, S.J.; Higgins, J.P.T. The albatross plot: A novel graphical tool for presenting results of diversely reported studies in a systematic review. Res. Synth. Methods 2017, 8, 281–289. [Google Scholar] [CrossRef] [Green Version]
- Symons, M.J.; Moore, D.T. Hazard rate ratio and prospective epidemiological studies. J. Clin. Epidemiol. 2002, 55, 893–899. [Google Scholar] [CrossRef]
- Dekkers, O.M.; Vandenbroucke, J.P.; Cevallos, M.; Renehan, A.G.; Altman, D.G.; Egger, M. COSMOS-E: Guidance on conducting systematic reviews and meta-analyses of observational studies of etiology. PLoS Med. 2019, 16, e1002742. [Google Scholar] [CrossRef]
- Higgins, J.P.T.; Thompson, S.G. Quantifying heterogeneity in a meta-analysis. Stat. Med. 2002, 21, 1539–1558. [Google Scholar] [CrossRef]
- Higgins, J.P.T.; Thompson, S.G.; Deeks, J.J.; Altman, D.G. Measuring inconsistency in meta-analyses. BMJ 2003, 327, 557–560. [Google Scholar] [CrossRef] [PubMed] [Green Version]
- Thompson, S.G.; Higgins, J.P.T. How should meta-regression analyses be undertaken and interpreted? Stat. Med. 2002, 21, 1559–1573. [Google Scholar] [CrossRef] [PubMed]
- Higgins, J.P.T.; Thompson, S.G. Controlling the risk of spurious findings from meta-regression. Stat. Med. 2004, 23, 1663–1682. [Google Scholar] [CrossRef] [PubMed]
- Manly, B.F.J. Randomization, Bootstrap and Monte Carlo Methods in Biology; Taylor & Francis: Boca Raton, FL, USA, 2006; Volume 53. [Google Scholar]
- Galbraith, R.F. A note on graphical presentation of estimated odds ratios from several clinical trials. Stat. Med. 1988, 7, 889–894. [Google Scholar] [CrossRef] [PubMed]
- Viechtbauer, W.; Cheung, M.W.-L. Outlier and influence diagnostics for meta-analysis. Res. Synth. Methods 2010, 1, 112–125. [Google Scholar] [CrossRef]
- Sterne, J.A.C.; Sutton, A.J.; Ioannidis, J.P.A.; Terrin, N.; Jones, D.R.; Lau, J.; Carpenter, J.; Rücker, G.; Harbord, R.M.; Schmid, C.H.; et al. Recommendations for examining and interpreting funnel plot asymmetry in meta-analyses of randomised controlled trials. BMJ 2011, 343, d4002. [Google Scholar] [CrossRef] [Green Version]
- Egger, M.; Davey Smith, G.; Schneider, M.; Minder, C. Bias in meta-analysis detected by a simple, graphical test. BMJ 1997, 315, 629–634. [Google Scholar] [CrossRef] [Green Version]
- Peters, J.L.; Sutton, A.J.; Jones, D.R.; Abrams, K.R.; Rushton, L. Comparison of two methods to detect publication bias in meta-analysis. JAMA 2006, 295, 676–680. [Google Scholar] [CrossRef] [Green Version]
- Palmer, T.M.; Sterne, J.A.C. Meta-Analysis in Stata: An Updated Collection from the Stata Journal, 2nd ed.; Stata Press: College Station, TX, USA, 2016. [Google Scholar]


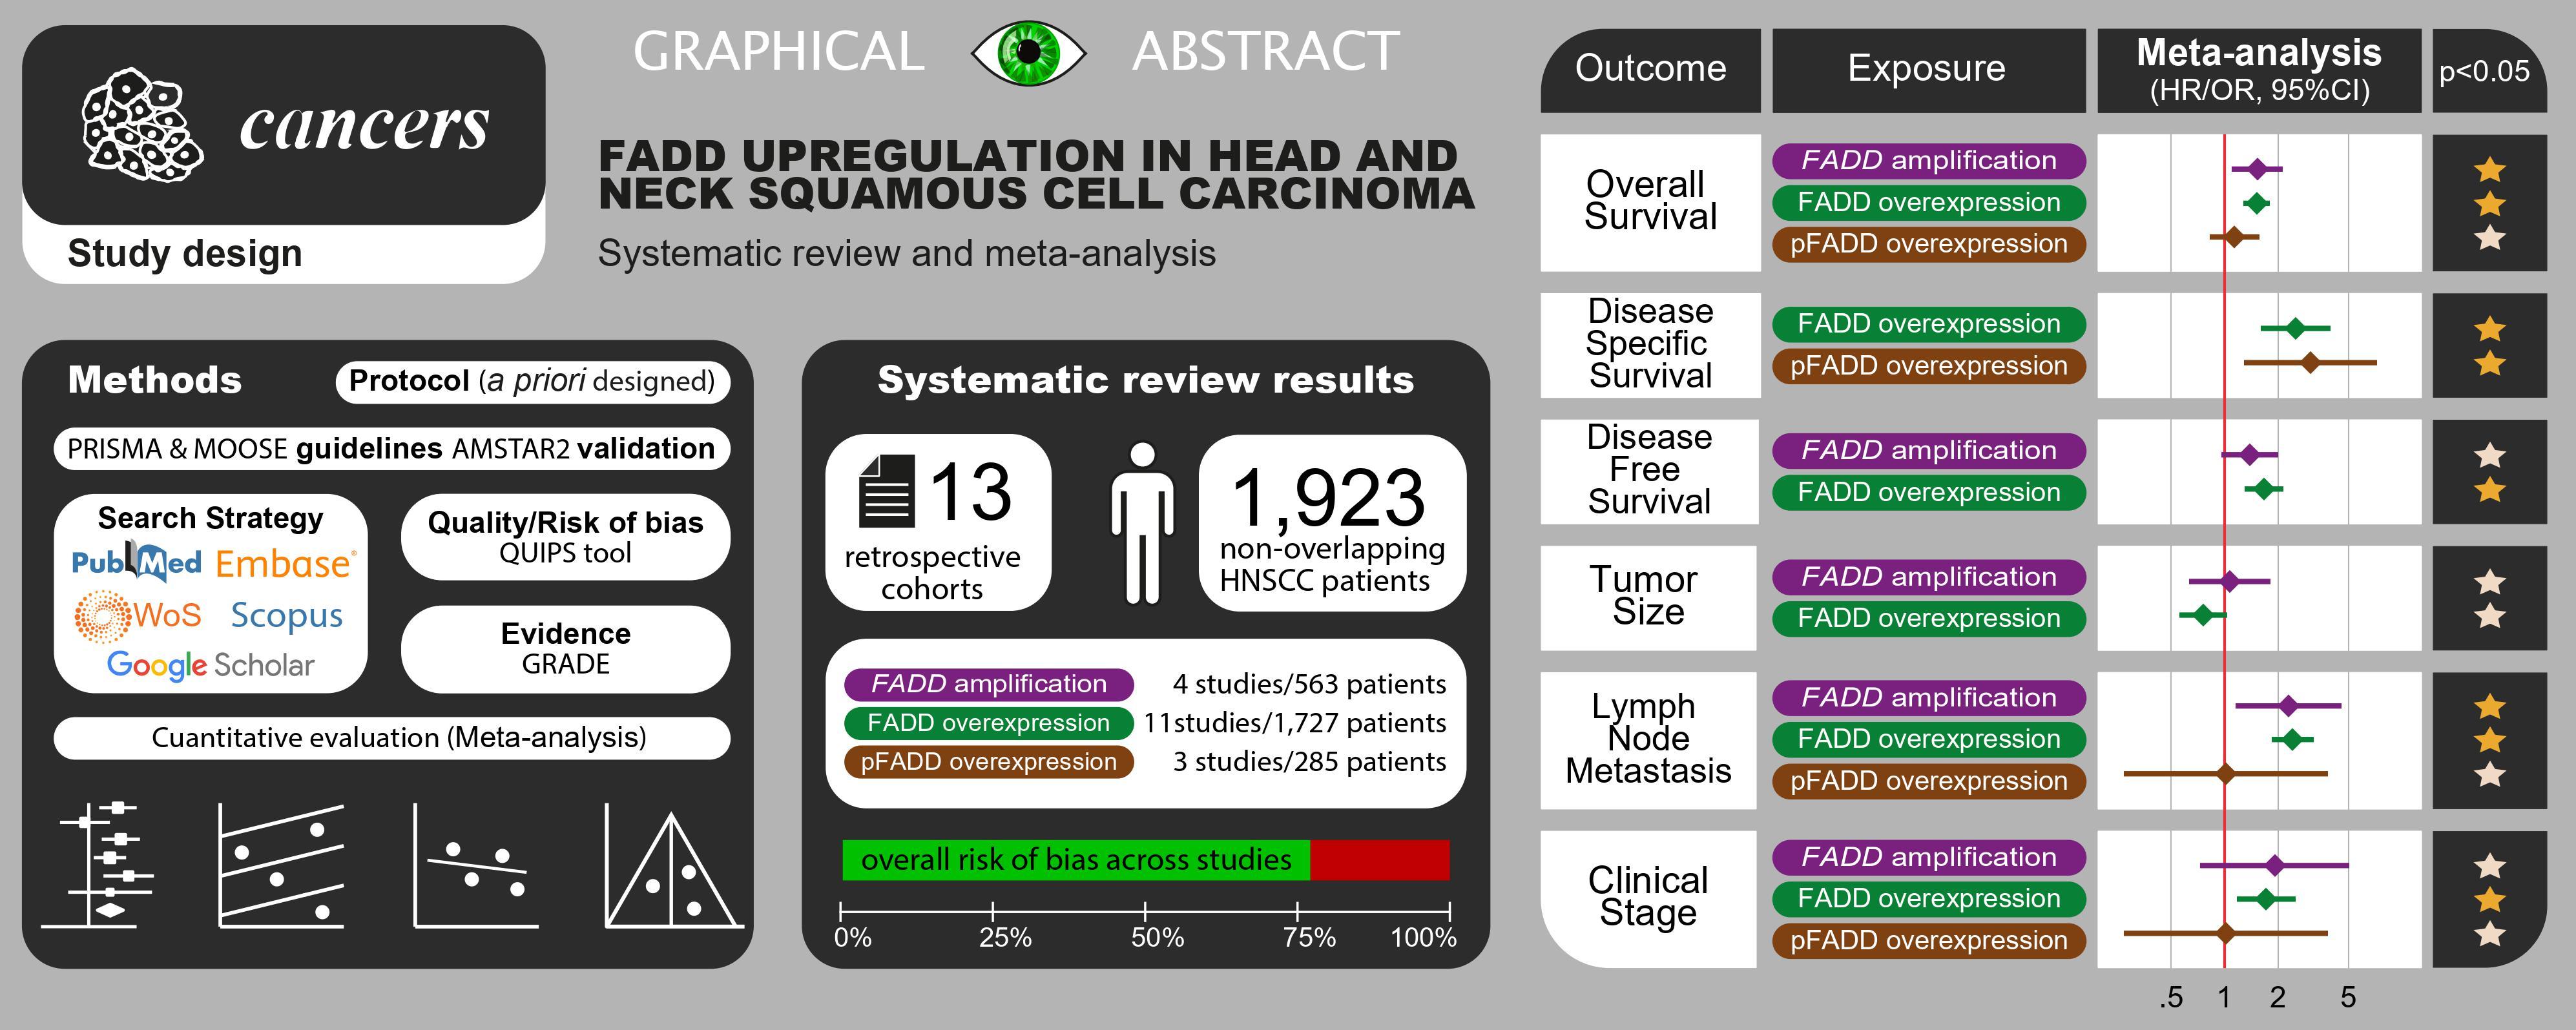
| Total | 13 Studies |
|---|---|
| Year of publication | 2007–2017 |
| Number of patients | |
| Total | 1923 patients |
| Sample size, range | 30–339 patients |
| FADD alterations analysed * | |
| FADD overexpression | 11 studies (1727 patients) |
| pFADD overexpression | 3 studies (285 patients) |
| FADD gene amplification | 4 studies (563 patients) |
| Affected sites | |
| Oral SCC | 5 studies (747 patients) |
| Laryngeal SCC | 4 studies (332 patients) |
| Nasopharyngeal SCC | 1 study (248 patients) |
| HNSCC mixed | 3 studies (596 patients) |
| Study design | |
| Retrospective cohort | 13 studies |
| Geographical region | |
| Europe | 7 studies (663 patients) |
| Asia | 4 studies (687 patients) |
| North America | 2 studies (419 patients) |
| Pooled Data | Heterogeneity | ||||||||
|---|---|---|---|---|---|---|---|---|---|
| Meta-Analyses | No. of Studies | No. of Patients | Stat. Model | Wt | ES (95% CI) | p-Value | Phet | I2 (%) | Appendix a |
| SURVIVAL PARAMETERS | |||||||||
| Overall survival | |||||||||
| All b | 7 * | 1198 * | REM | D-L | HR = 1.45 (1.16–1.81) | 0.001 | <0.001 | 74.3 | FigureS3, p10 |
| Subgroup analysis by alteration c | |||||||||
| FADD amplification | 1 | 339 | ── | ── | HR = 1.53 (1.10–2.12) | 0.01 | ── | ── | FigureS3, p10 |
| pFADD overexpression | 3 | 285 | REM | D-L | HR = 1.14 (0.82–1.56) | 0.44 | 0.15 | 46.9 | FigureS3, p10 |
| FADD overexpression | 7 | 1196 | REM | D-L | HR = 1.52 (1.28–1.81) | <0.001 | 0.50 | 0.0 | FigureS3, p10 |
| Subgroup analysis by geographical area (FADD overexpression group) c | |||||||||
| Asian | 2 | 587 | REM | D-L | HR = 1.66 (1.05–2.63) | 0.03 | 0.15 | 52.9 | FigureS4, p11 |
| Non-Asian | 5 | 609 | REM | D-L | HR = 1.51 (1.20–1.90) | <0.001 | 0.52 | 0.0 | FigureS4, p11 |
| Subgroup analysis by affected site (FADD overexpression group) c | |||||||||
| LSCC | 3 | 290 | REM | D-L | HR = 1.40 (1.06–1.85) | 0.02 | 0.39 | 0.0 | FigureS5, p12 |
| OSCC | 1 | 339 | ── | ── | HR = 1.39 (1.03–1.87) | 0.03 | ── | ── | FigureS5, p12 |
| NPSCC | 1 | 248 | ── | ── | HR = 2.27 (1.26–4.09) | 0.006 | ── | ── | FigureS5, p12 |
| HNSCC mixed | 2 | 319 | REM | D-L | HR = 1.77 (1.18–2.65) | 0.005 | 0.50 | 0.0 | FigureS5, p12 |
| Subgroup analysis by anti-FADD antibody (FADD overexpression group) c | |||||||||
| A66-2 | 4 | 512 | REM | D-L | HR = 1.53 (1.18–1.97) | 0.001 | 0.36 | 7.3 | FigureS6, p13 |
| H181 | 3 | 684 | REM | D-L | HR = 1.54 (1.18–2.01) | 0.002 | 0.34 | 6.9 | FigureS6, p13 |
| Subgroup analysis by immunohistochemical pattern (FADD overexpression group) c | |||||||||
| Cytoplasmic | 2 | 189 | REM | D-L | HR = 1.58 (0.87–2.88) | 0.13 | 0.65 | 0.0 | FigureS7, p14 |
| Nuclear and cytoplasmic | 5 | 1007 | REM | D-L | HR = 1.54 (1.25–1.91) | <0.001 | 0.27 | 22.5 | FigureS7, p14 |
| Univariable meta-regression d | |||||||||
| Sex (% of males) | 7 | 1196 | random-effects meta-regression | Coef = −0.003 (−0.027 to 0.021) | 0.729 ± 0.004 e | ── | ── | FigureS8, p15 | |
| Age (mean age of patients) | 7 | 1196 | random-effects meta-regression | Coef = −0.008 (−0.052 to 0.035) | 0.704 ±0.004 e | ── | ── | FigureS9, p16 | |
| Stage (% of stage-III/IV patients) | 7 | 1196 | random-effects meta-regression | Coef = 0.003 (−0.007 to 0.013) | 0.558 ± 0.005 e | ── | ── | FigureS10, p17 | |
| Follow up period (months) | 7 | 1196 | random-effects meta-regression | Coef = −0.001 (−0.005 to 0.004) | 0.769 ± 0.004 e | ── | ── | FigureS11, p18 | |
| Disease-specific survival | |||||||||
| All b | 3 * | 422 * | REM | D-L | HR=2.63 (1.76–3.92) | <0.001 | 0.56 | 0.0 | FigureS12, p19 |
| Subgroup analysis by alteration c | |||||||||
| pFADD overexpression | 1 | 133 | ── | ── | HR = 3.05 (1.29–7.22) | 0.01 | ── | ── | FigureS12, p19 |
| FADD overexpression | 3 | 422 | REM | D-L | HR = 2.52 (1.61–3.96) | <0.001 | 0.73 | 0.0 | FigureS12, p19 |
| Disease-free survival | |||||||||
| All b | 3 * | 658 * | REM | D-L | HR = 1.57 (1.28–1.94) | <0.001 | 0.53 | 0.0 | FigureS13, p20 |
| Subgroup analysis by alteration c | |||||||||
| FADD amplification | 1 | 339 | ── | ── | HR = 1.39 (0.96–2.02) | 0.08 | ── | ── | FigureS13, p20 |
| FADD overexpression | 3 | 658 | REM | D-L | HR = 1.67 (1.29–2.15) | <0.001 | 0.45 | 0.0 | FigureS13, p20 |
| Local recurrence | |||||||||
| All b | 2 * | 152 * | REM | D-L | Data not pooled | 0.21 | 0.03 | 67.3 | ── |
| Subgroup analysis by alteration c | |||||||||
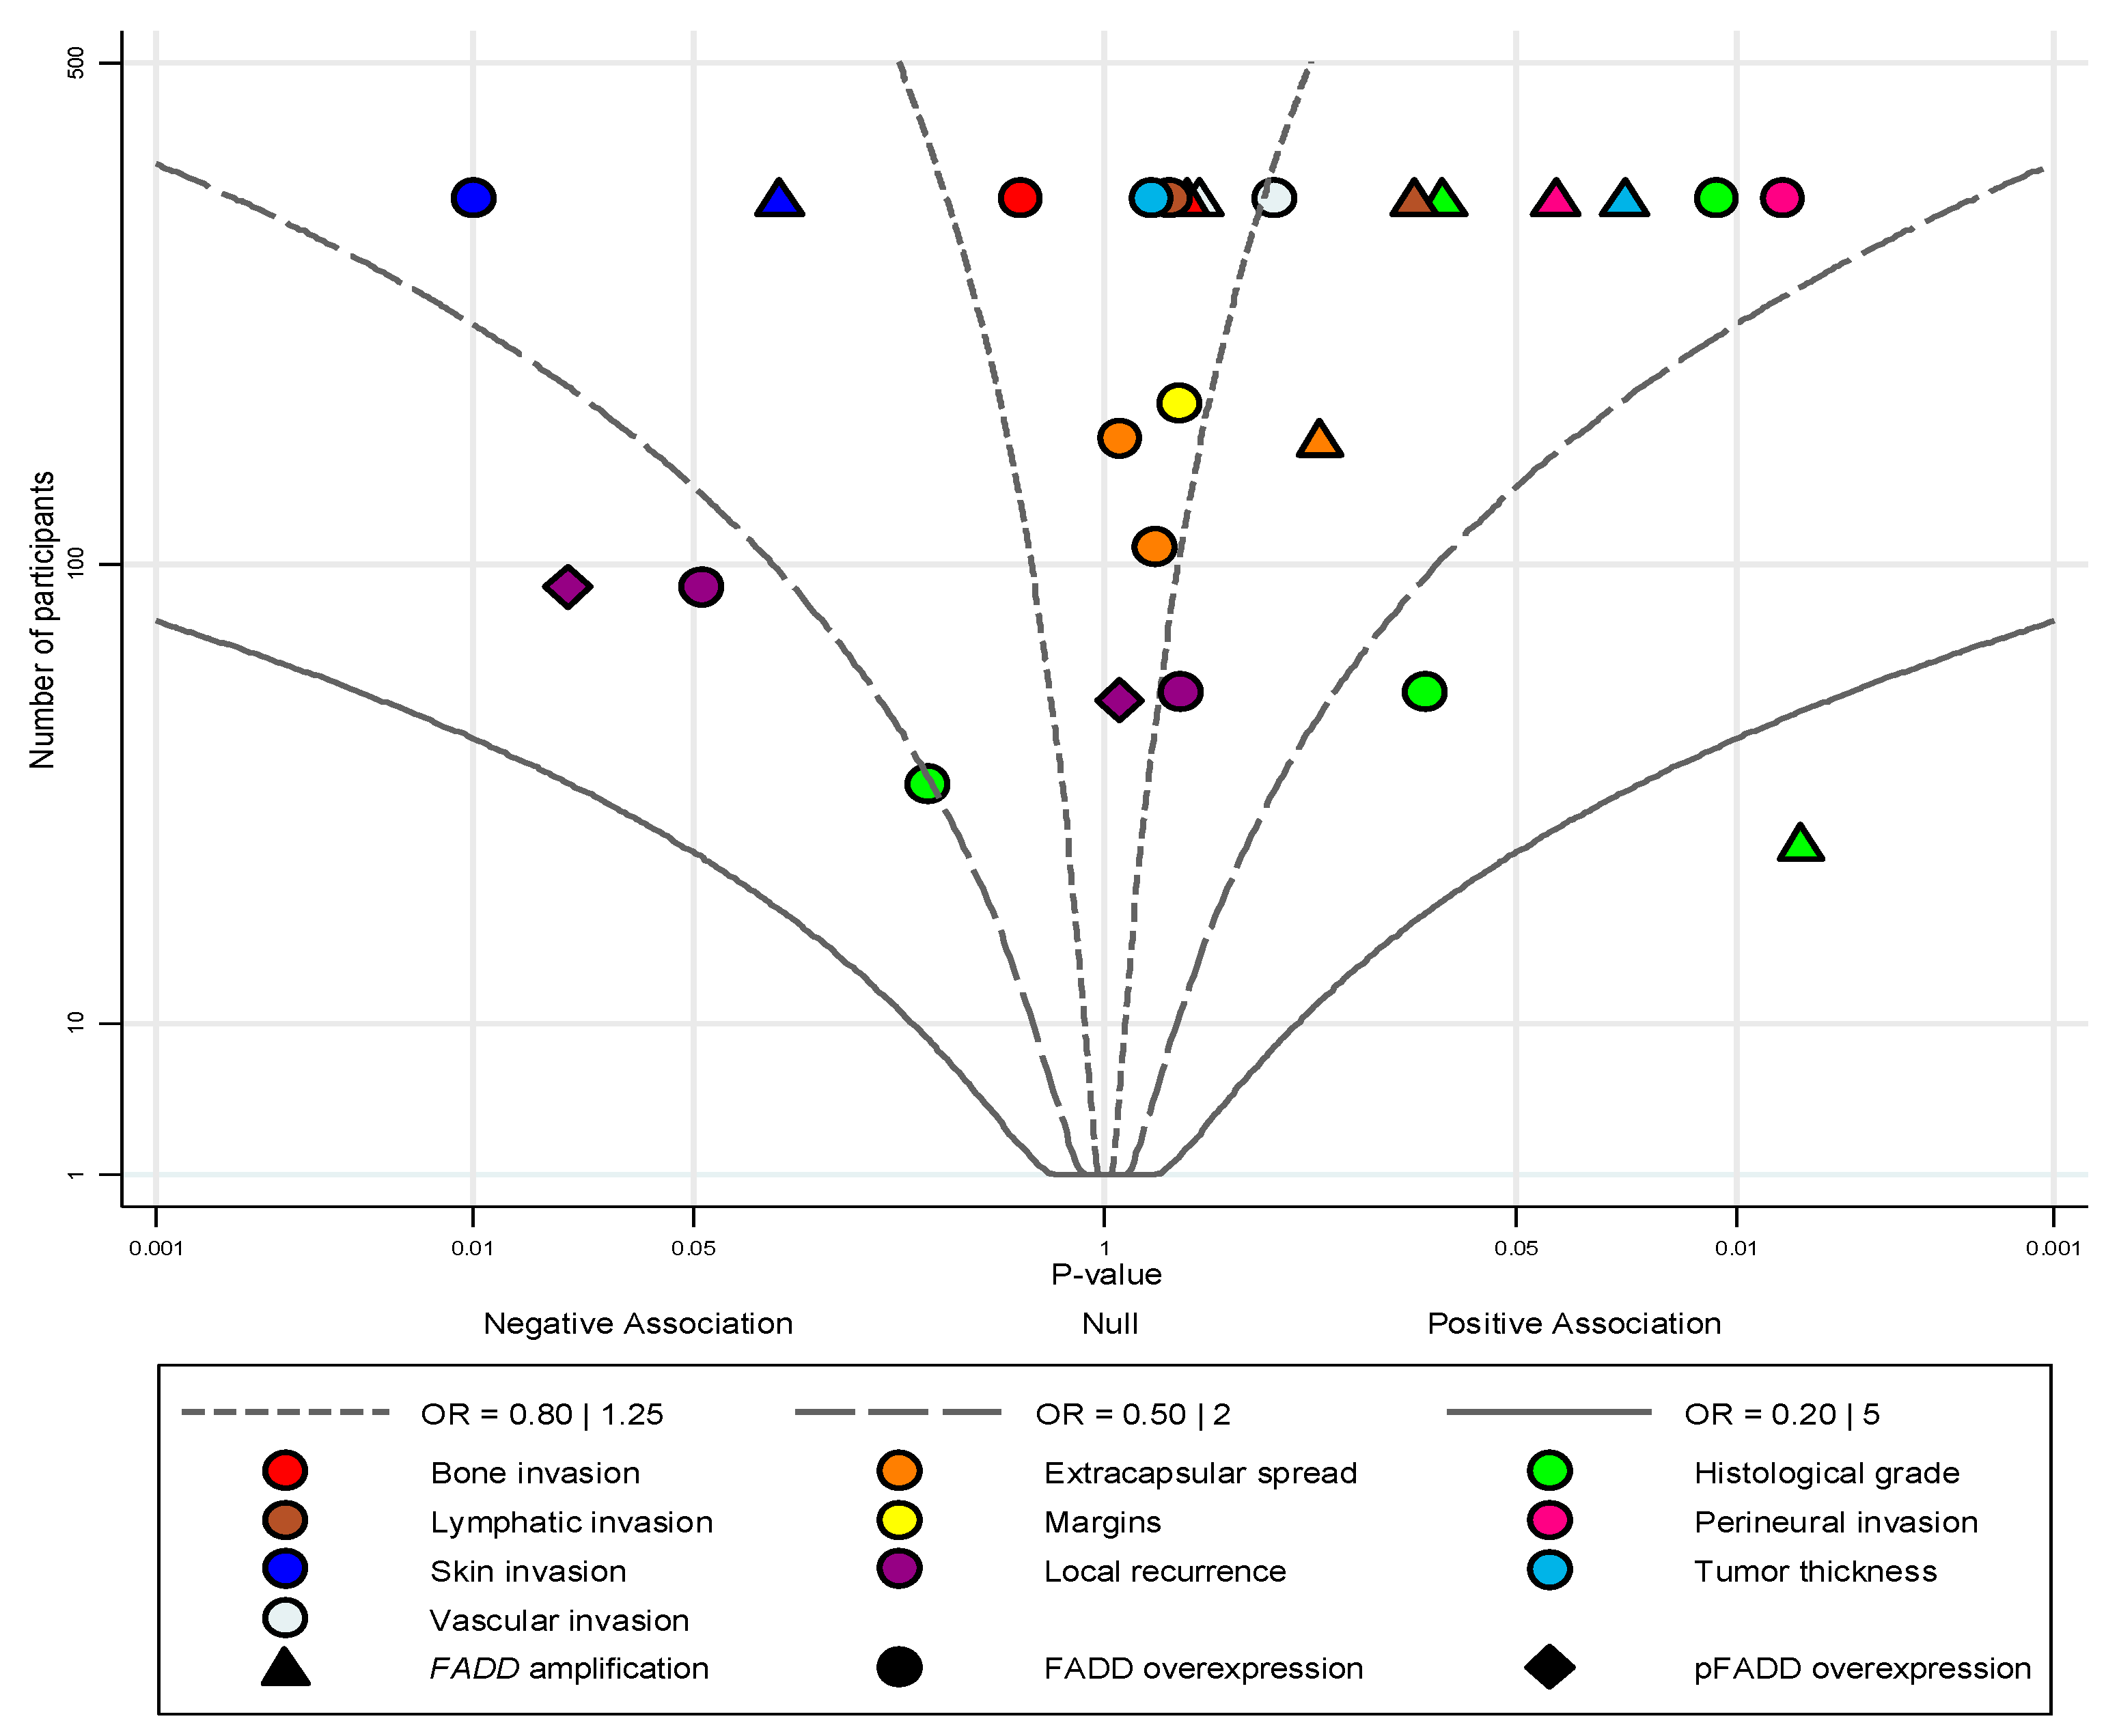
| pFADD overexpression | 2 | 152 | REM | D-L | Data not pooled | 0.41 | 0.02 | 81.6 | Manuscript, Figure 4 |
| FADD overexpression | 2 | 150 | REM | D-L | Data not pooled | 0.45 | 0.06 | 70.7 | |
| CLINICO-PATHOLOGICAL CHARACTERISTICS | |||||||||
| T status | |||||||||
| All b | 3* | 727 * | REM | D-L | OR = 0.83 (0.63–1.08) | 0.17 | 0.57 | 0.0 | FigureS14, p21 |
| Subgroup analysis by alteration c | |||||||||
| FADD amplification | 1 | 339 | ── | ── | OR = 1.07 (0.63–1.82) | 0.79 | ── | ── | FigureS14, p21 |
| FADD overexpression | 3 | 727 | REM | D-L | OR = 0.76 (0.55–1.03) | 0.08 | 0.67 | 0.0 | FigureS14, p21 |
| N status | |||||||||
| All b | 10* | 1649 * | REM | D-L | OR = 2.07 (1.47–2.91) | <0.001 | 0.008 | 55.2 | |
| Subgroup analysis by alteration c | |||||||||
| FADD amplification | 3 | 533 | REM | D-L | OR = 2.30 (1.16–4.58) | 0.02 | 0.18 | 41.1 | Manuscript, Figure 2 |
| pFADD overexpression | 1 | 59 | ── | ── | OR = 1.02 (0.27–3.83) | 0.98 | ── | ── | |
| FADD overexpression | 9 | 1483 | REM | D-L | OR = 2.07 (1.34–3.20) | 0.001 | 0.005 | 63.3 | |
| Sensitivity analysis | |||||||||
| All f | 9 * | 1609 * | REM | D-L | OR = 2.36 (1.85–3.00) | <0.001 | 0.27 | 17.9 | FigureS16, p23 |
| Sensitivity analysis stratified by alteration f | |||||||||
| FADD amplification | 3 | 533 | REM | D-L | OR = 2.30 (1.16–4.58) | 0.02 | 0.18 | 41.1 | FigureS16, p23 |
| pFADD overexpression | 1 | 59 | ── | ── | OR = 1.02 (0.27–3.83) | 0.98 | ── | ── | FigureS16, p23 |
| FADD overexpression | 8 | 1443 | REM | D-L | OR = 2.42 (1.84–3.18) | <0.001 | 0.30 | 16.3 | FigureS16, p23 |
| Clinical stage | |||||||||
| All b | 7 * | 812 * | REM | D-L | OR = 1.74 (1.26–2.41) | 0.001 | 0.44 | 0.0 | FigureS17, p24 |
| Subgroup analysis by alteration c | |||||||||
| FADD amplification | 3 | 224 | REM | D-L | OR = 1.92 (0.73–5.06) | 0.18 | 0.20 | 38.3 | FigureS17, p24 |
| pFADD overexpression | 1 | 59 | ── | ── | OR = 1.02 (0.27–3.83) | 0.98 | ── | ── | FigureS17, p24 |
| FADD overexpression | 5 | 616 | REM | D-L | OR = 1.72 (1.17–2.51) | 0.005 | 0.44 | 0.0 | FigureS17, p24 |
| Histological grade | |||||||||
| All b | 3 * | 439 * | REM | D-L | Data not pooled | 0.02 | 0.10 | 48.7 | ── |
| Subgroup analysis by alteration c | |||||||||
| FADD amplification | 2 | 369 | REM | D-L | Data not pooled | 0.17 | 0.04 | 76.2 | Manuscript, Figure 4 |
| FADD overexpression | 3 | 439 | REM | D-L | Data not pooled | 0.22 | 0.18 | 41.0 | |
© 2020 by the authors. Licensee MDPI, Basel, Switzerland. This article is an open access article distributed under the terms and conditions of the Creative Commons Attribution (CC BY) license (http://creativecommons.org/licenses/by/4.0/).
Share and Cite
González-Moles, M.Á.; Ayén, Á.; González-Ruiz, I.; de Porras-Carrique, T.; González-Ruiz, L.; Ruiz-Ávila, I.; Ramos-García, P. Prognostic and Clinicopathological Significance of FADD Upregulation in Head and Neck Squamous Cell Carcinoma: A Systematic Review and Meta-Analysis. Cancers 2020, 12, 2393. https://doi.org/10.3390/cancers12092393
González-Moles MÁ, Ayén Á, González-Ruiz I, de Porras-Carrique T, González-Ruiz L, Ruiz-Ávila I, Ramos-García P. Prognostic and Clinicopathological Significance of FADD Upregulation in Head and Neck Squamous Cell Carcinoma: A Systematic Review and Meta-Analysis. Cancers. 2020; 12(9):2393. https://doi.org/10.3390/cancers12092393
Chicago/Turabian StyleGonzález-Moles, Miguel Ángel, Ángela Ayén, Isábel González-Ruiz, Teresa de Porras-Carrique, Lucía González-Ruiz, Isábel Ruiz-Ávila, and Pablo Ramos-García. 2020. "Prognostic and Clinicopathological Significance of FADD Upregulation in Head and Neck Squamous Cell Carcinoma: A Systematic Review and Meta-Analysis" Cancers 12, no. 9: 2393. https://doi.org/10.3390/cancers12092393