Article

Monitoring DNA Damage and Repair in Peripheral Blood Mononuclear Cells of Lung Cancer Radiotherapy Patients

1
Research Division, Peter MacCallum Cancer Centre, Melbourne, VIC 3000, Australia
2
Advanced Analytical Technologies, Montmorency, VIC 3094, Australia
3
Department of Radiation Oncology, Peter MacCallum Cancer Centre, Melbourne, VIC 3000, Australia
4
Sir Peter MacCallum Department of Oncology, The University of Melbourne, Melbourne, VIC 3010, Australia
5
Melbourne Medical School, The University of Melbourne, Melbourne, VIC 3010, Australia
6
Physics Department, Peter MacCallum Cancer Centre, Melbourne, VIC 3000, Australia
*
Author to whom correspondence should be addressed.
These authors contributed equally to this work as first authors.
These authors contributed equally to this work as last authors.
Cancers 2020, 12(9), 2517; https://doi.org/10.3390/cancers12092517
Submission received: 3 August 2020 / Revised: 28 August 2020 / Accepted: 31 August 2020 / Published: 4 September 2020

Abstract

:

Simple Summary

Every patient responds to radiotherapy in individual manner. Some suffer severe side-effects because of normal tissue toxicity. Their radiosensitivity can be caused by inability of DNA repair system to fix radiation-induced damage. The γ-H2AX assay can detect such deficiency in untransformed primary cells (e.g., peripheral blood mononuclear cells, PBMC), over a period of only hours post ex-vivo irradiation. Earlier we have shown that the level and kinetics of decline (repair) of radiation-induced DNA damage detected by the assay is a measure of the cellular radiosensitivity. In this study, we applied the γ-H2AX assay to judge the radiosensitivity of lung cancer radiotherapy patients as normal or abnormal, based on kinetics of DNA damage repair. Considering the potential of the assay as a clinical biodosimeter, we also monitored DNA damage in serial samples of PBMC during the course of radiotherapy. This study opens an opportunity to monitor individual response to radiotherapy treatment.

Abstract

Thoracic radiotherapy (RT) is required for the curative management of inoperable lung cancer, however, treatment delivery is limited by normal tissue toxicity. Prior studies suggest that using radiation-induced DNA damage response (DDR) in peripheral blood mononuclear cells (PBMC) has potential to predict RT-associated toxicities. We collected PBMC from 38 patients enrolled on a prospective clinical trial who received definitive fractionated RT for non-small cell lung cancer. DDR was measured by automated counting of nuclear γ-H2AX foci in immunofluorescence images. Analysis of samples collected before, during and after RT demonstrated the induction of DNA damage in PBMC collected shortly after RT commenced, however, this damage repaired later. Radiation dose to the tumour and lung contributed to the in vivo induction of γ-H2AX foci. Aliquots of PBMC collected before treatment were also irradiated ex vivo, and γ-H2AX kinetics were analyzed. A trend for increasing of fraction of irreparable DNA damage in patients with higher toxicity grades was revealed. Slow DNA repair in three patients was associated with a combined dysphagia/cough toxicity and was confirmed by elevated in vivo RT-generated irreparable DNA damage. These results warrant inclusion of an assessment of DDR in PBMC in a panel of predictive biomarkers that would identify patients at a higher risk of toxicity.

1. Introduction

Radiotherapy (RT) is included in the treatment of half of all patients with cancer. This treatment is commonly used as the primary curative modality in a number of different cancers including carcinomas of the lung, head and neck, cervix and prostate. Across all cancer types, the inclusion of RT is associated with improvements in 5-year local control and overall survival (OS) of an estimated 23% and 6%, respectively [1]. In some tumour types, such as unresectable locally advanced lung cancer, RT is the only available primary curative modality available. The efficacy of RT in cancer treatment is steadily improving, largely driven by rapid developments in technology, which aim to maximize the dose to the tumour while minimizing the dose to normal tissues. The management of cancer is a rapidly evolving landscape with successes including the advent of immunotherapy, targeted therapies, improvements in chemotherapy and surgical oncology. This has resulted in significant improvements in survival (in the United States, there are now >14 million cancer survivors; ~4% of the population) [2,3], such that toxicity remains one of the main concerns when deciding on a treatment regimen.
RT has a prominent role in the treatment of lung cancer. In the curative setting, it is the standard of care in patients with inoperable localized disease and those with mediastinal nodal involvement. In stage III non-small cell lung cancer (NSCLC), RT is the most commonly used primary local treatment. In this cohort the 5-year survival rates are still modest, reported at 32% in a modern RT trial [4]. The recent addition of adjuvant systemic immunotherapy is expected to significantly increase long-term survival, with an ongoing clinical trial reporting an improvement in 2-year OS rate (66% with immunotherapy vs. 56% chemo-RT alone) [5].
Despite advances in technology, RT continues to pose some risk of both acute and late toxicity. Thoracic RT is associated with a risk of developing acute pneumonitis and chronic lung fibrosis [6]. Symptomatic pneumonitis occurs in a third of patients treated with curative intent lung RT, with fatal pneumonitis occurring in 2% of these patients. The prescribed radiation dose and the mean lung dose are the strongest treatment factors associated with pneumonitis [6]. Other factors that increase this risk further include the use of concurrent chemotherapy, the presence of interstitial lung disease and age. There is also a small population of patients who experience significant, even fatal toxicity without any significant risk factors and despite appropriate RT plans. It has been hypothesized that this group of patients may have inherent biological factors underlying their radiation sensitivity (RS), and that if detected before or early in treatment, their plans could be adapted to reduce the risk of toxicity [7].
We conducted a clinical trial that explored gallium-68 ventilation/perfusion (V/Q) positron emission tomography (PET) as an imaging marker of pulmonary toxicity [8]. The overall aim of the trial was to understand the fundamental effects of radiation on pulmonary physiology, to better predict radiation toxicity and to work towards future reductions in radiation toxicity by avoiding irradiation of functionally critical segments of lung. The immune response and accumulated unrepaired systemic DNA damage have been proposed to underlie RT-induced toxicities [9,10,11], and therefore, the associated molecules provide a source of potential predictive biomarkers. Since the relevant tissue for pulmonary toxicity, healthy lung, is inaccessible without unacceptable clinical risk, we restricted our search for predictive biomarkers to minimally invasive blood sampling, concentrating on plasma inflammatory cytokine response to treatment (a manuscript in preparation) and radiation-induced DNA damage response (DDR) in peripheral blood mononuclear cells (PBMC). The latter is a subject of this report.
The discovery in 1998 of histone H2AX phosphorylation (forming γ-H2AX) in response to DNA double-strand breaks (DSB) induction advanced the field of DNA damage and repair [12]. The exquisite sensitivity (a single DSB in a nucleus can be visualized within a nucleus) and speed of DNA damage detection (the signal peaks minutes after the DSB formation) have made the γ-H2AX assay an indispensable tool for measuring DNA damage in situ [13]. The assay has utility across biodosimetry, relative biological effectiveness of novel RT modalities including radionuclide therapy, as well as chemotherapy. One of these exploited the systemic DNA damage propagation in NSCLC RT patients [14]; this study suggested the potential of the accumulated unrepaired DNA damage to predict RT-associated toxicities. Further, in a retrospective study, the assay revealed that compromised DDR is associated with extreme RS [15,16]. Finally, the assay has been used as a biodosimeter in clinical studies [17,18] and has been exploited for clinical trials, e.g., [19,20].
In this study, we followed the γ-H2AX foci formation and disappearance in PBMC collected prior to, during and post-RT treatment in NSCLC patients recruited for the GalliPET VQ-RT prospective clinical trial. We describe a common trend and individual variations of DDR to the treatment. We searched for associations of the observed DDR with various types of RT-related toxicity and the tumour response.

2. Results

Experimental scheme of the study is presented in Figure 1. We collected blood samples before commencement of RT (“baseline”), at 1 h post first RT fraction, 24 h post first RT fraction before the 2nd RT session, 4 weeks into RT and 3 months after the end of RT. The study consists of two parts: (1) in vivo study, where PBMC were not exposed to ex vivo irradiation, thus detected γ-H2AX foci per cell (fpc) that were induced either by endogenous factors or by RT treatment for NSCLC and (2) ex vivo study, where PBMC collected prior to commencement of RT were exposed ex vivo to 2-Gy irradiation that induced the γ-H2AX response.

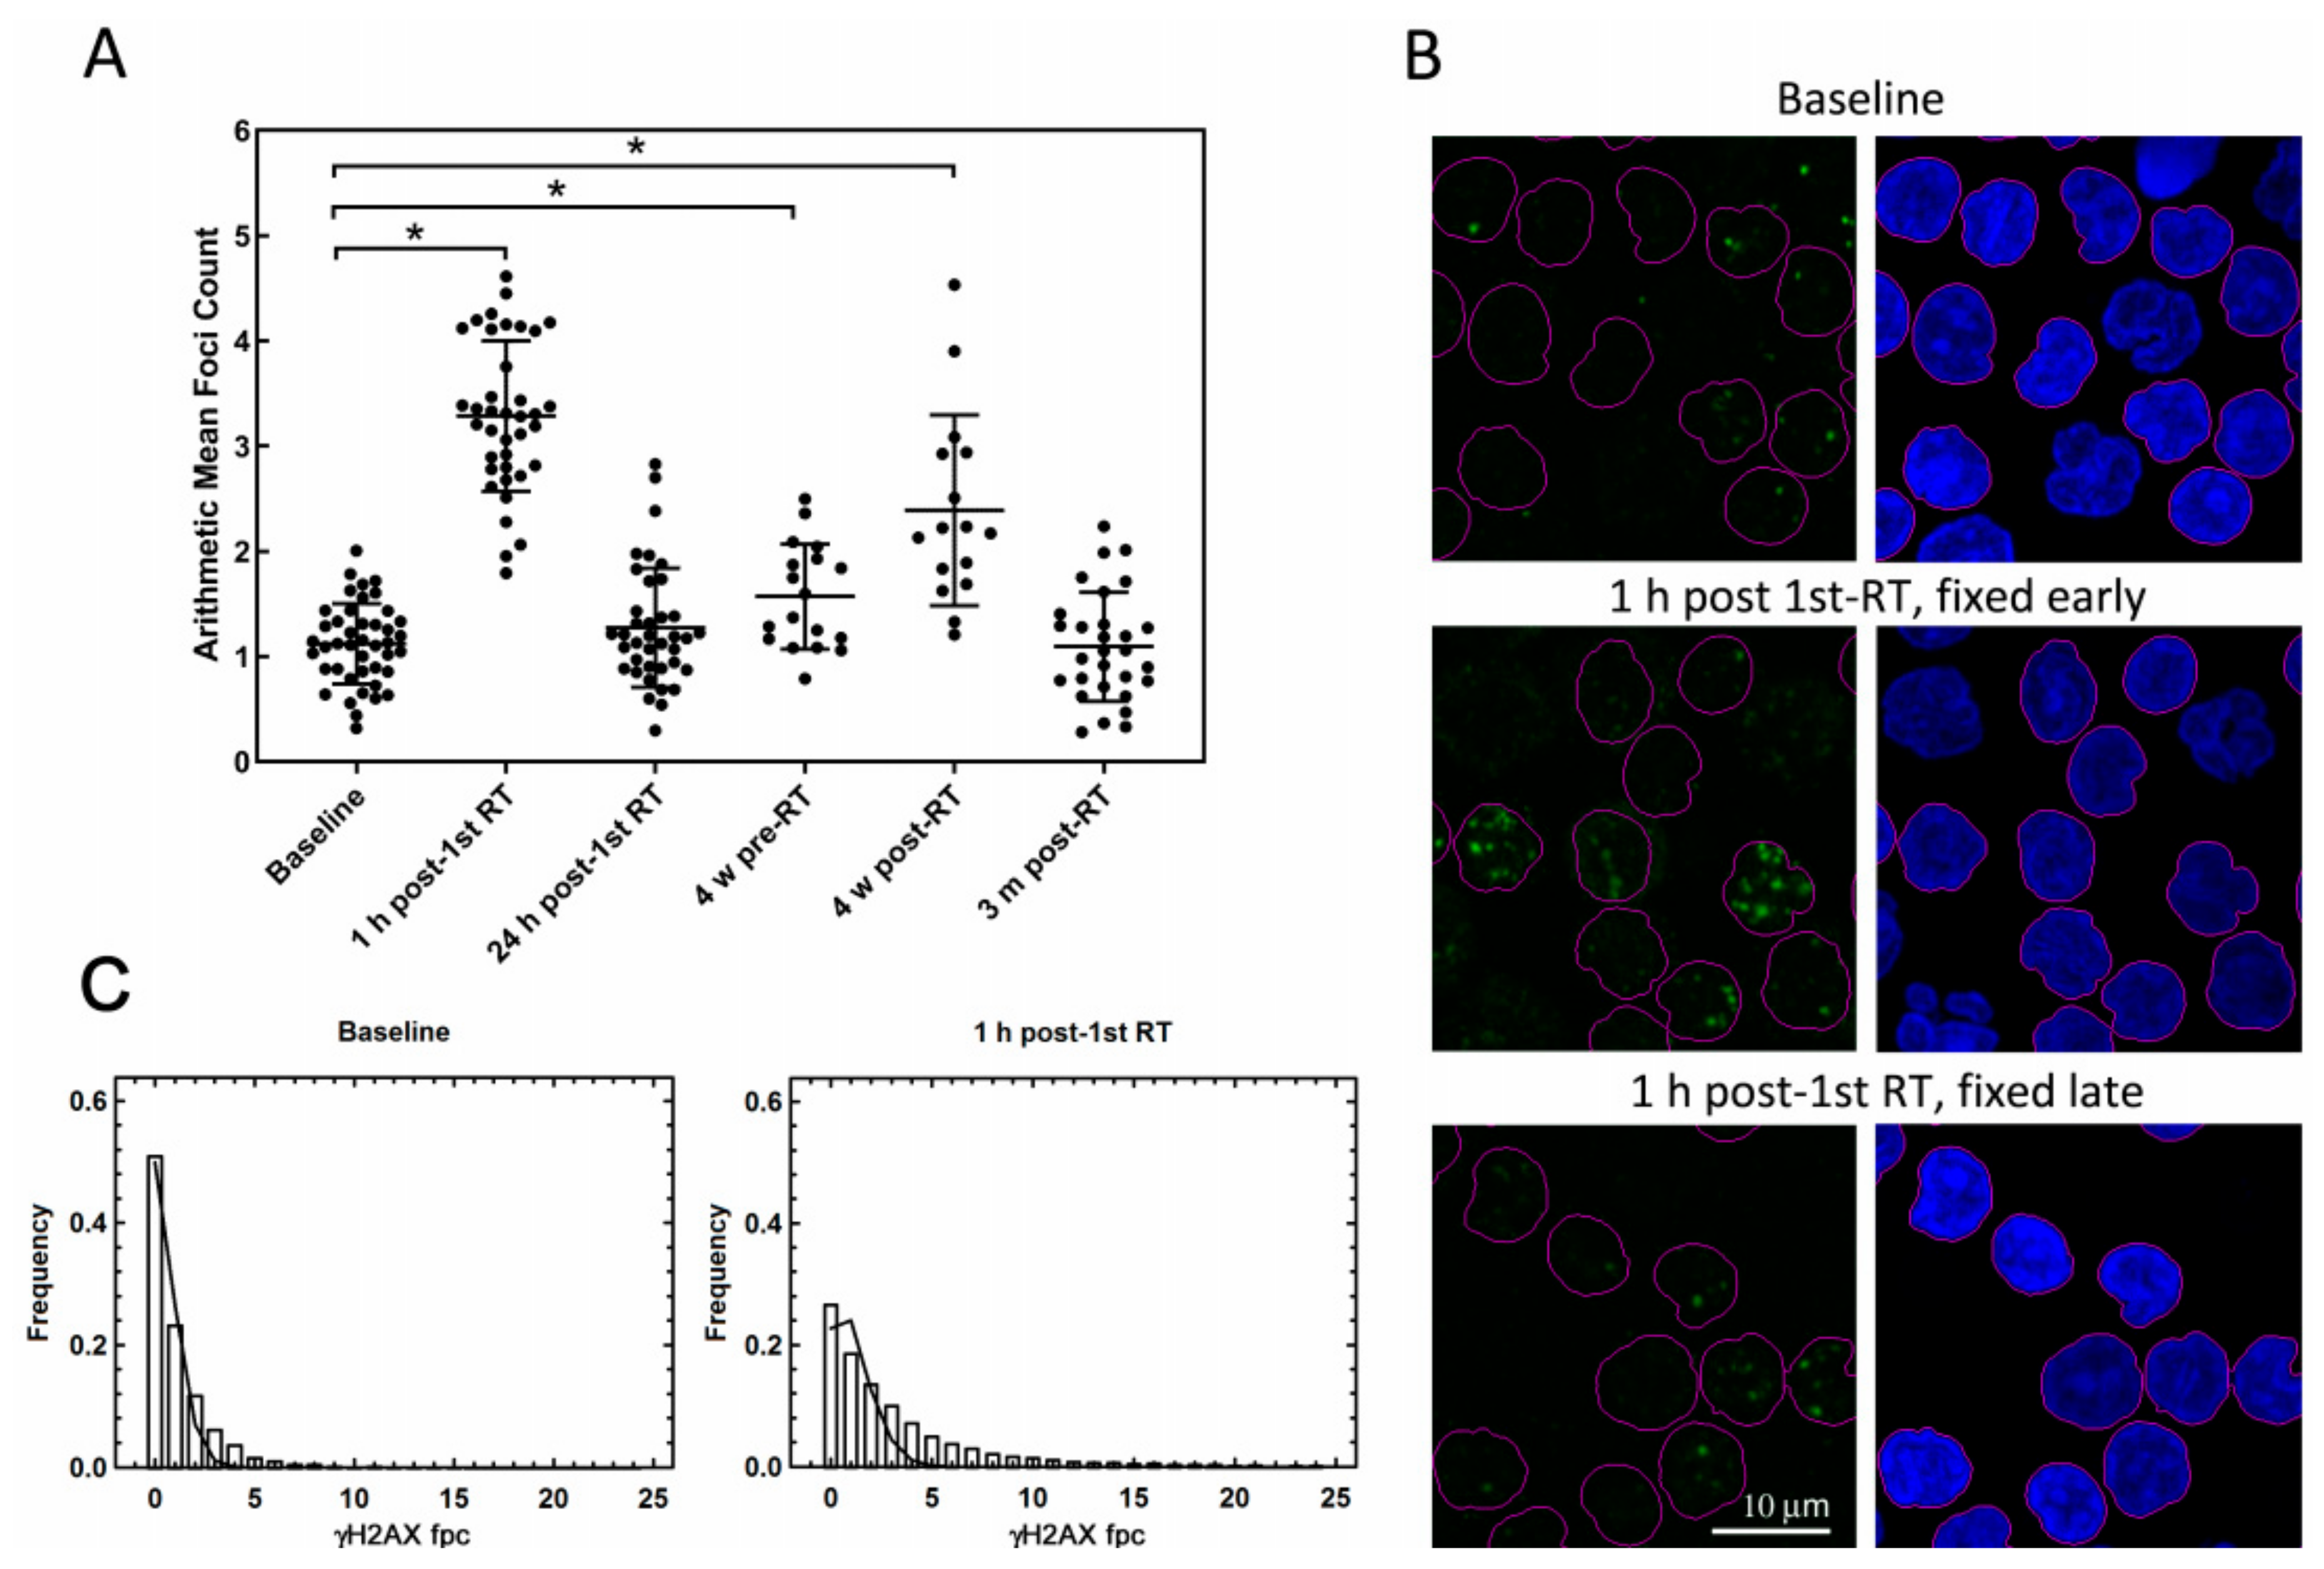
2.1. In Vivo Study: γ-H2AX Foci in PBMC that Were Not Exposed to Ex Vivo Irradiation

Isolated PBMC were fixed immediately after blood collection (and subsequently immunostained for γ-H2AX) and, when it was logistically possible, also at 24 h post blood collection. Table 1 summarizes the statistics of fpc numbers for each group in PBMC that were fixed early: the arithmetic mean value, standard deviation, number of samples, and p-values for the comparison of each group with the baseline. Table S1 shows the same values for PBMC that were fixed 24 h after blood collection. The 4-week time point was a mixed group. Due to treatment logistics, i.e., timing of patients’ RT and chemotherapy schedules, some blood samples were collected after delivery of the RT session (at 1–6 h), while some were collected before the session. The results for each of these two subgroups are shown separately in Table 1.
Figure 2A illustrates dynamics of γ-H2AX fpc in PBMC that were fixed immediately after blood collection, for all time points and patients, and representative microscopy images are shown in Figure 2B. There is a significant increase of mean foci numbers at two time points of blood collection, approximately three fold at 1 h post first RT session (3.24 fpc) compared to the baseline value (1.11 fpc), p < 0.0001, for both paired and unpaired t-test, and at 4 weeks in the RT, with more than two fold increase in samples collected post-RT session (2.39 fpc, p < 0.0001 for both paired and unpaired t-test), and some increase in samples collected pre-RT session (1.57 fpc, p = 0.0089, paired t-test). The substantial increase of foci post-RT sessions is assumed to be related to the presence in the blood samples of cells that had been in the irradiated volume during delivery of RT treatment [14], as described in details in Text S1. This interpretation is consistent with the subsequent decrease of fpc in the same samples that were fixed late, at 24 h post blood collection (Table S1), thus allowing time for foci elimination as a result of γ-H2AX dephosphorylation, signifying ex vivo repair of radiation-induced DSB. A similar decrease of fpc was observed in the samples collected at 24 h post first RT fraction (Table 1), ascribed to in vivo repair.
The analysis of foci frequency distributions (Figure 2C) supports this interpretation. The background foci form randomly, and their distribution follows Poisson statistics, as indicated by high R-squared value of nonlinear regression analysis (0.975). If a subpopulation of cells is irradiated, a two-component foci frequency distribution is expected. Indeed, at 1 h post first RT session, apart from the higher mean foci number, the agreement of the experimental histogram with Poisson distribution is weaker (R = 0.853), due to the presence of cells with a substantially higher foci numbers than expected from the random distribution. A further analysis of foci frequency distributions is presented in the first paragraph of Section 2.3.

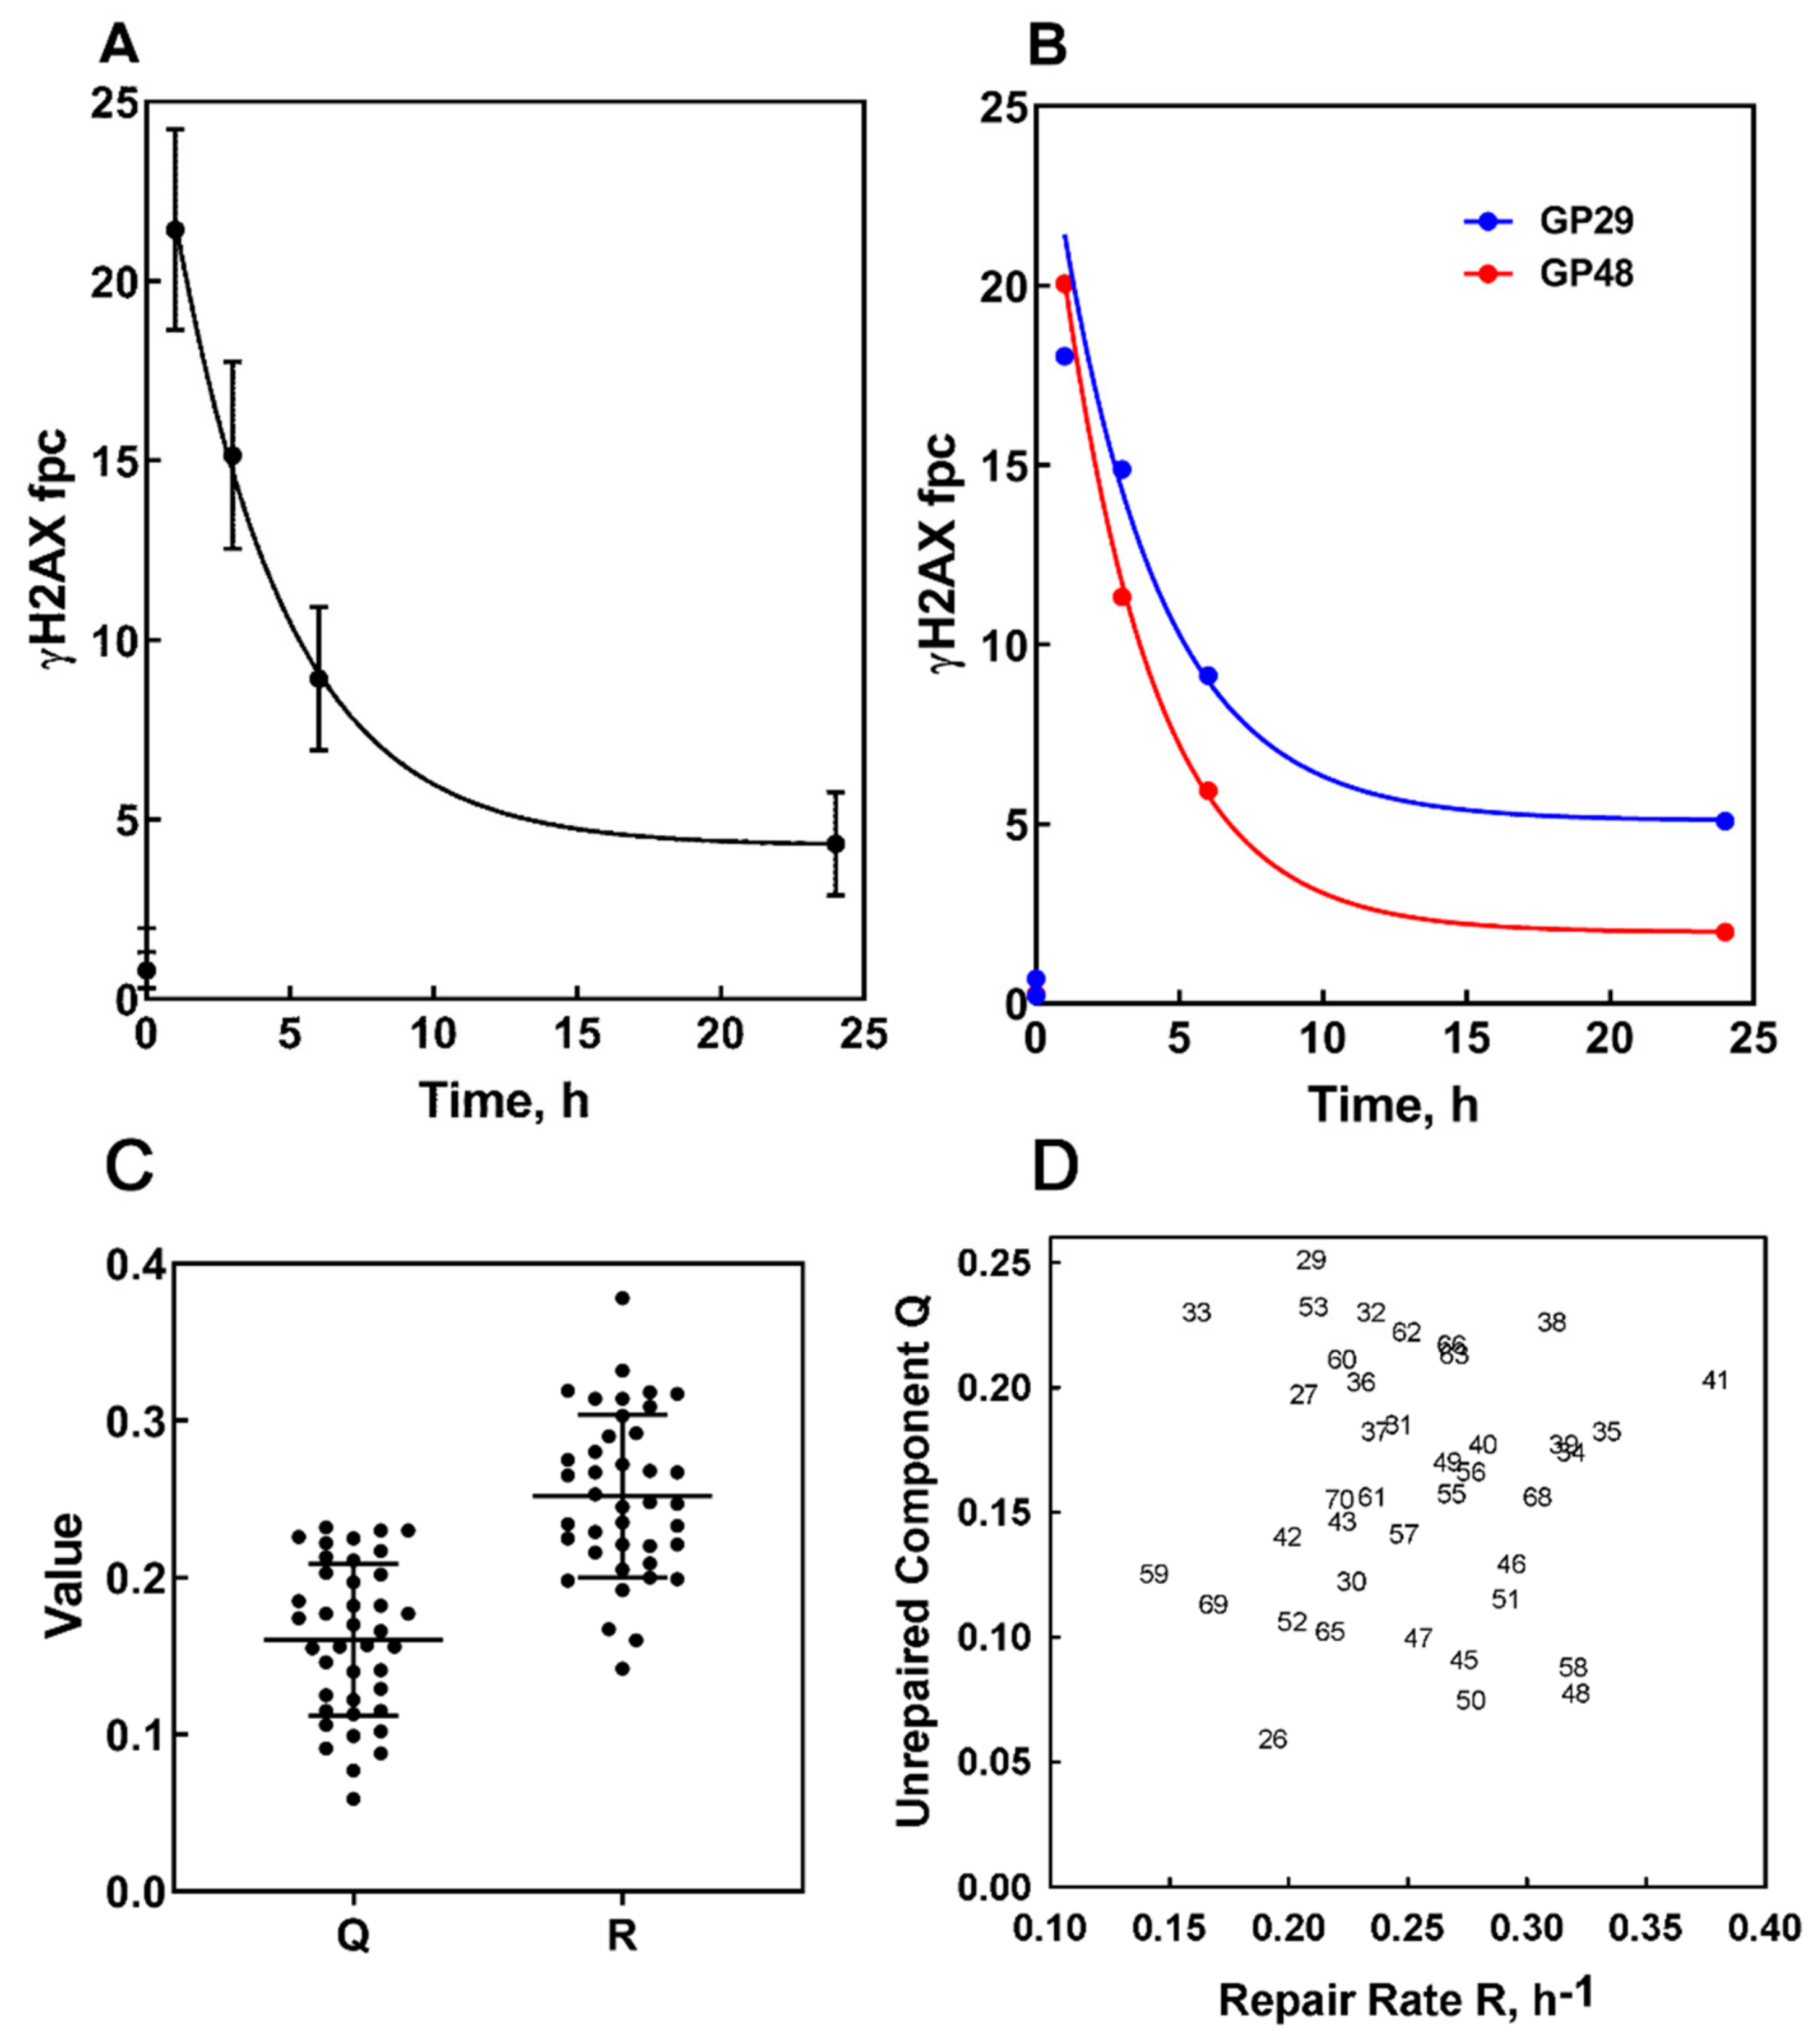
2.2. Ex Vivo Study: Kinetics of γ-H2AX Foci in Baseline PBMC that Were Exposed to Ex Vivo Irradiation

Aliquots of PMBC from blood samples collected at baseline (before commencement of RT) were irradiated ex vivo to a dose of 2 Gy 137Cs γ-rays, or 320 KeV X-rays, and fixed at serial time points (1, 3, 6 and 24 h). In Figure 3A,B regression analysis of post irradiation γ-H2AX foci kinetics averaged for the entire cohort is shown (Figure 3A), as well as representative examples of a large variation between patients (Figure 3B).
We previously reported that two parameters derived from the nonlinear regression analysis (curve fitting) of foci kinetics (Equation (4) from Section 4), as well as their combination, were associated with extreme normal tissue toxicity in RT patients [15]. The two parameters reflect the fraction of DNA damage, which is apparently irreparable, determined by extrapolation to infinite time, of the curve fitted through the data points for each plot following the decay of damage with time (Q) and the rate of repair as a fraction of fpc per hour (R). The Q and R are individual for each dataset (i.e., each patient); the values reported here correspond to the statistically best fit curves through the experimental data. The best predictor of extreme RS was the combination of these two values, the 2-D mapping onto R and Q coordinates (“RS map”) [15]. The results of the foci kinetics analysis are summarized in Table S2, and displayed in Figure 3C,D. Figure 3C shows scatter plots of Q and R values, and Figure 3D shows the RS map for all patients. The frequency distributions for both values (shown in Figure S1) pass the normality tests (p > 0.1, Kolmogorov-Smirnov test), indicating that each data set is derived from a single population without obvious outliers.
To understand if DSB repair in ex vivo irradiated PBMC correlates with DSB repair in PBMC exposed to RT in vivo, we studied a correlation between Q-values and the ratio of foci in PBMC collected at 24 and 1 h post first RT (shown in Table S2). The lower ratio indicates better repair. We found a statistically significant correlation between these values (r = 0.487, p = 0.0035), as illustrated in Figure 4. We also found a statistically significant correlation between fpc numbers in PBMC collected at 24 h post first RT session and Q-values (r = 0.529, p = 0.001).

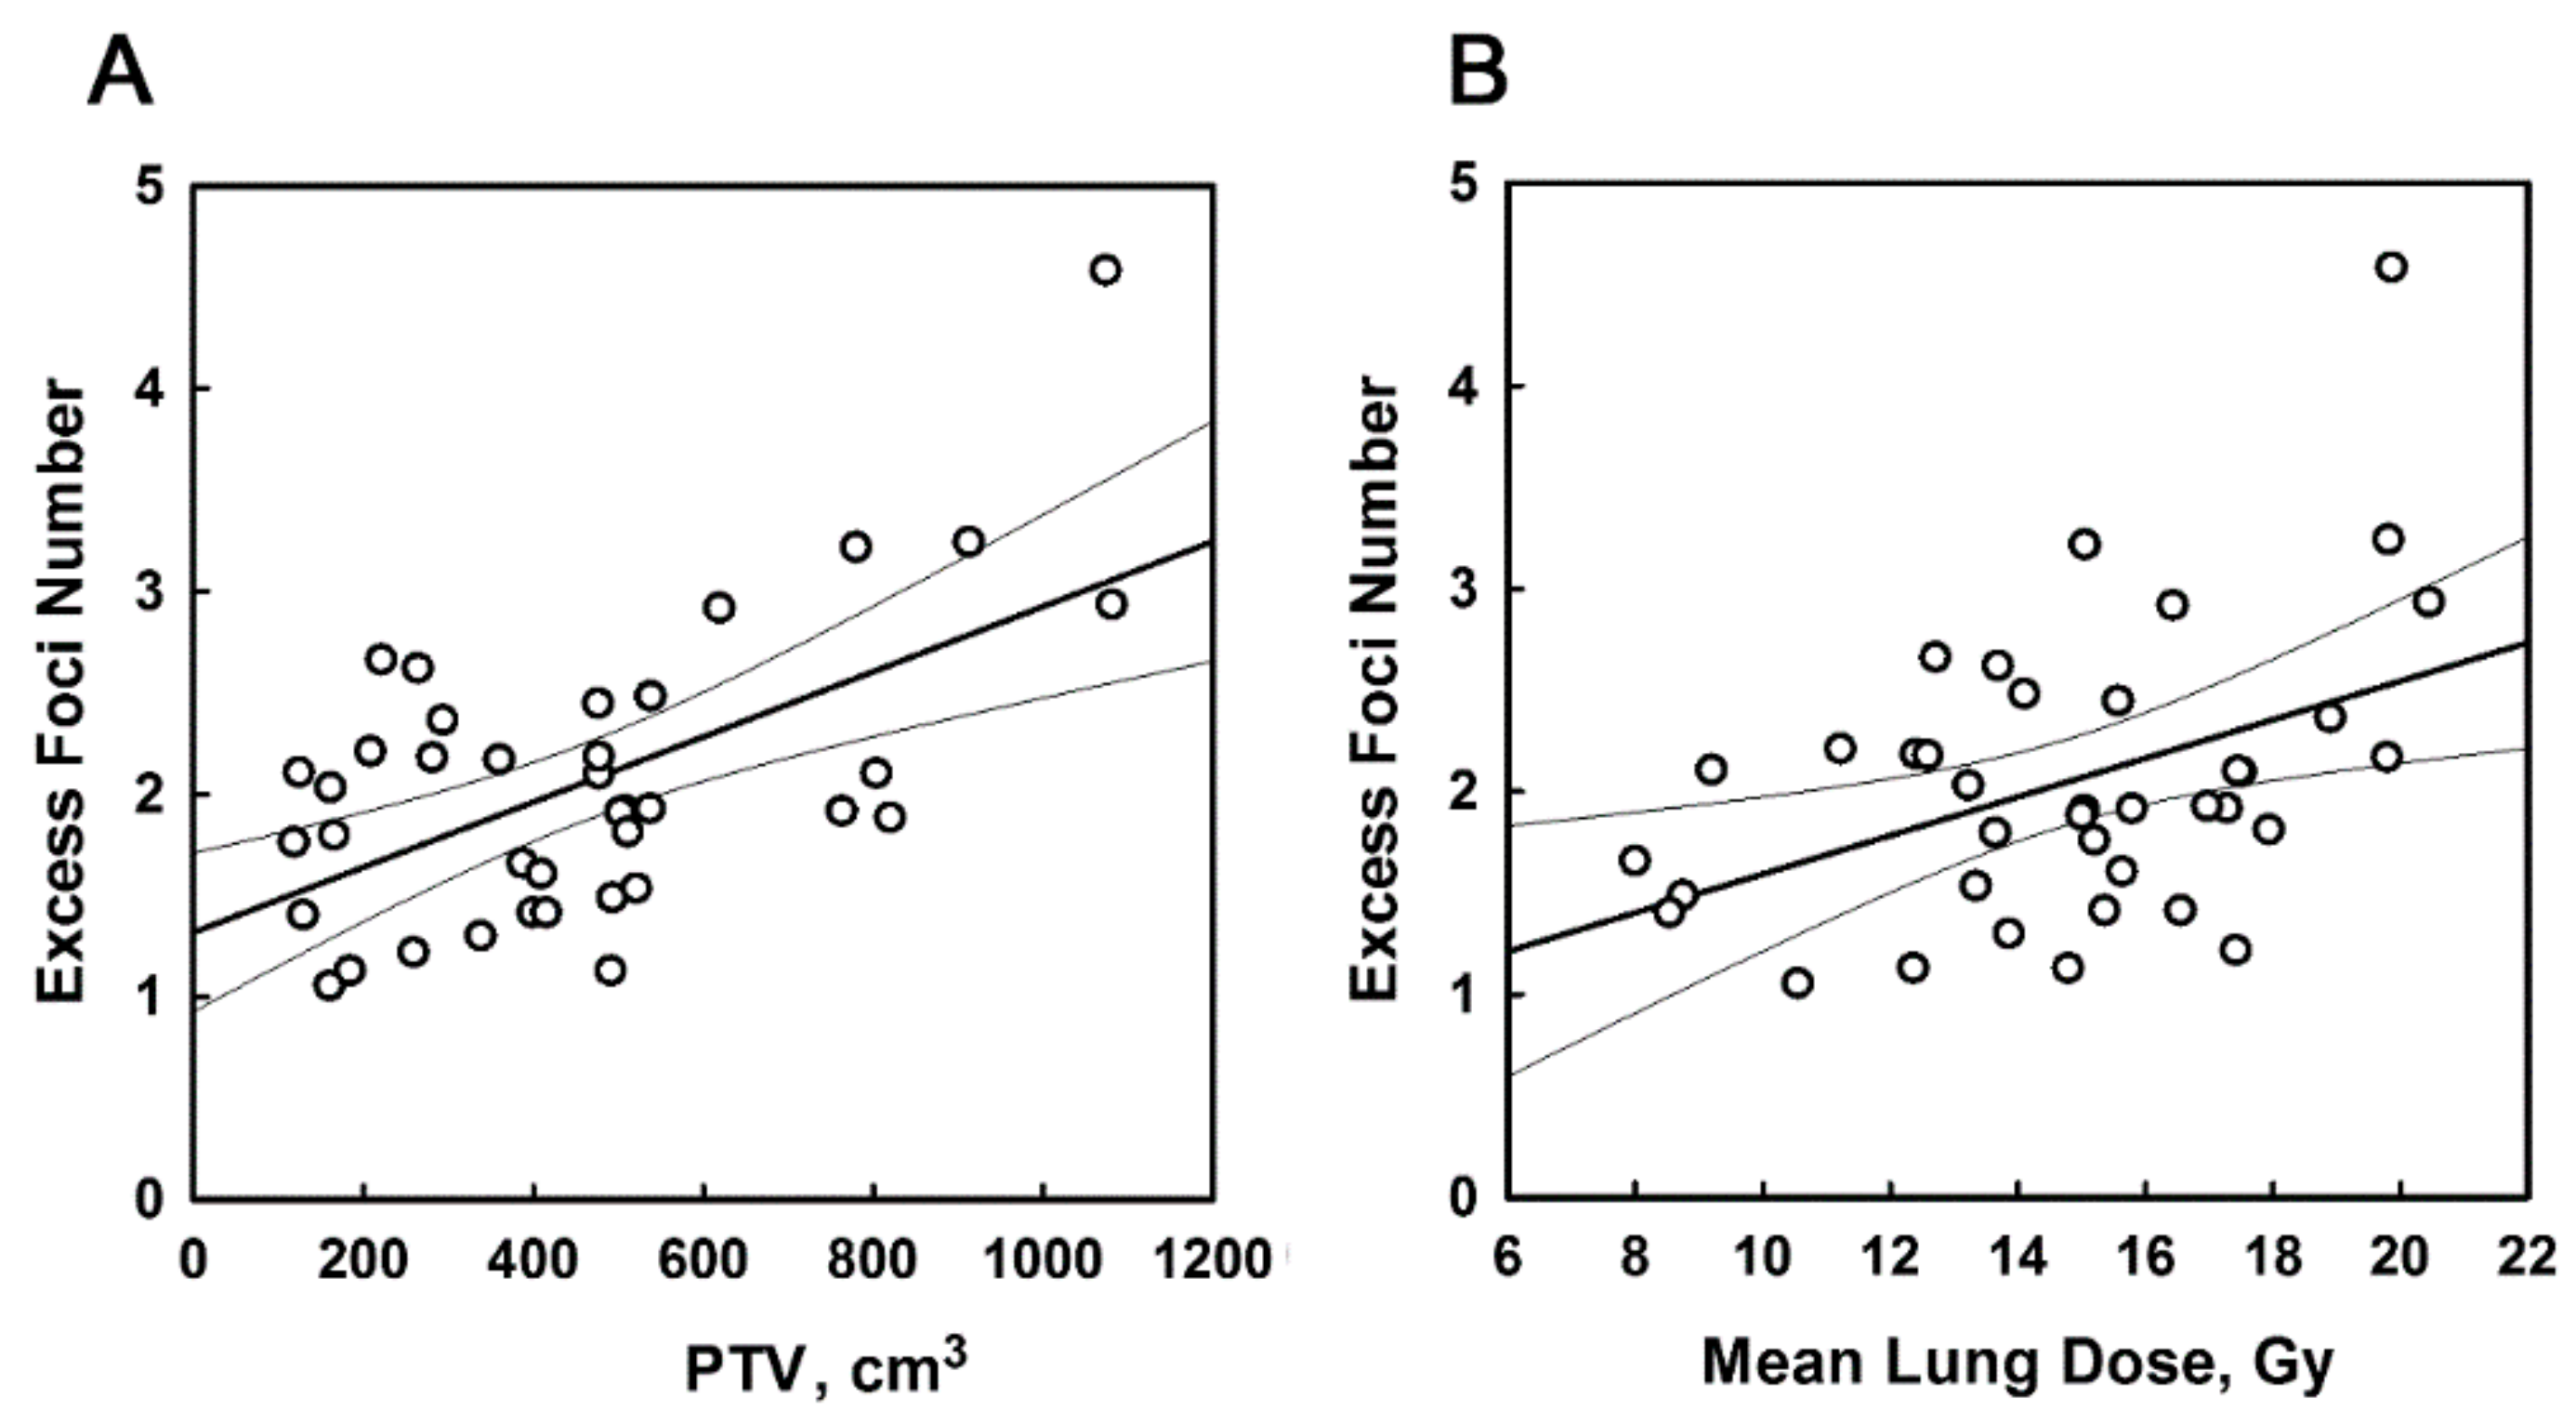
2.3. Correlation Studies with Treatment Conditions; PBMC that Were not Exposed to Ex Vivo Irradiation

We further deconvoluted γ-H2AX foci that originated from RT and background foci, by applying a nonlinear regression analysis to foci frequency distributions (Equation (1) from Section 4). Nonirradiated PBMC have random background foci that follow Poisson statistics (Equation (2) from Section 4). Radiation-induced foci are generally random events as well, but foci induced in a fraction of PBMC that were exposed while traveling through the irradiated thorax and receiving different doses, do not follow Poisson statistics. For these cells, we used gamma-distribution (Equation (3) from Section 4). The best fit values were obtained for the fraction of irradiated cells and the average number of radiation-induced foci in these cells. The results of this analysis for each patient are presented in Table S3.
These values were used in the correlation analysis with planned treatment volume (PTV) and mean lung dose (MLD). A weak association of the average fpc numbers with PTV (r = 0.235, p = 0.155) was observed. A statistically significant correlation was found between the fraction of irradiated PBMC and PTV (r = 0.417, p = 0.009). The product of the average radiation-induced fpc number and the fraction of irradiated PBMC demonstrated the best correlation with PTV (r = 0.586, p = 0.0001). This product equals to the excess foci number that is defined as a difference between mean fpc in PBMC collected at 1 h post first RT fraction and at baseline. The results are summarized in Table 2 and illustrated in Figure 5A.
We found a weaker association of the excess foci number with MLD (Table 2 and Figure 5B; r = 0.437, p = 0.006). MLD correlated significantly with PTV (r = 0.597, p < 0.0001), thus these values are interdependent. We also generated a combined PTV and MLD variable as a linear combination of these values that provides the best fit for the excess foci number. The excess foci number correlated with this combined variable better than with PTV or MLD (r = 0.601, p < 0.0001) indicating that the dose to both tumour and lung contributes to the induction of foci (Table 2).
We also calculated the number of RT-induced foci by taking into account PTV and MLD, as described in Text S1. Although, due to limited accurate information on blood flow in the thorax and treatment duration, it is difficult to obtain a reliable prediction of the fraction of irradiated cells and the average foci number, it is possible to establish the relationship between these values, using average values for PTV (500 cm3) and MLD (0.486 Gy/fraction). The results are shown in Figure S2. The average foci numbers obtained from experimental data (Table S3) correlated with calculated foci numbers (r = 0.604, p < 0.01). The values were calculated as described in Text S1 using treatment parameters for each patient, however, the calculated values underestimate the experimental values. This analysis also indicates that irradiation of both tumour and lung contributes to the induction of foci in PBMC to a similar extent, with average per irradiated cell doses of 33 and 49 mGy for tumour and lung, respectively.

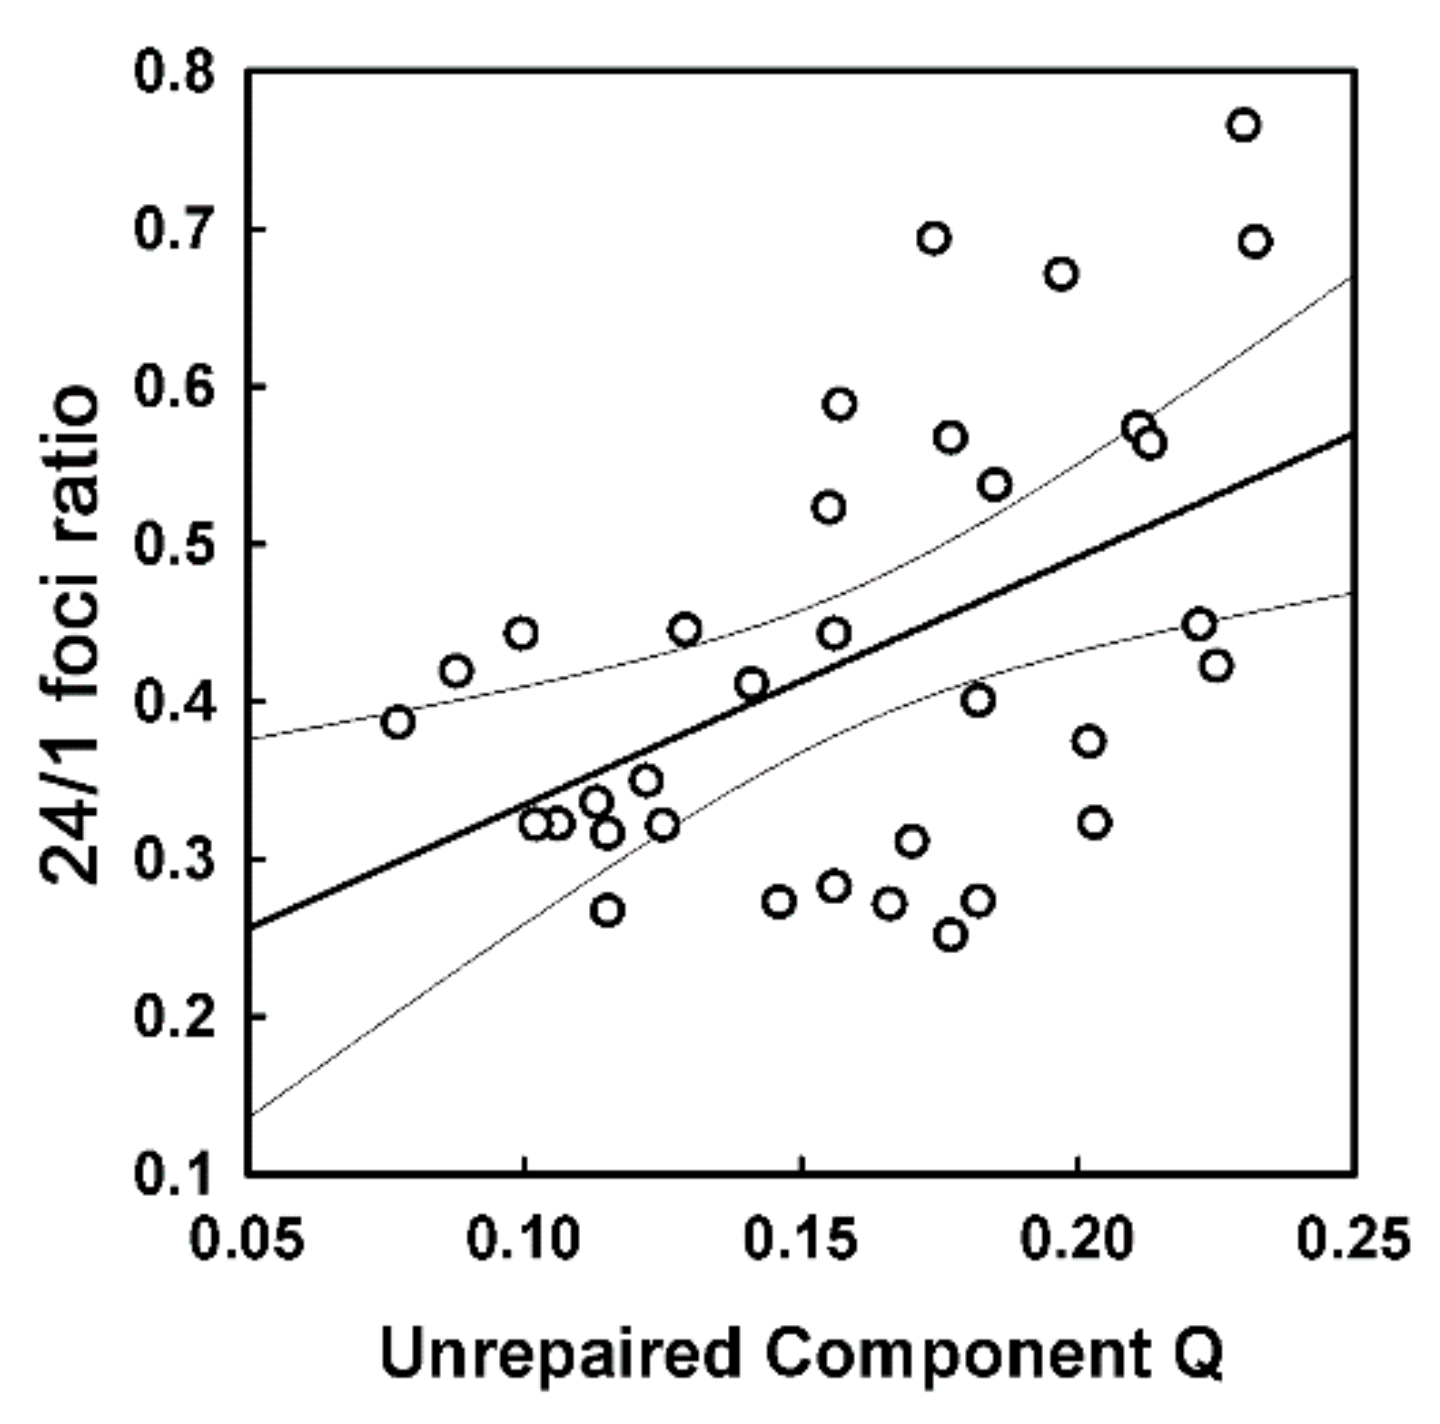
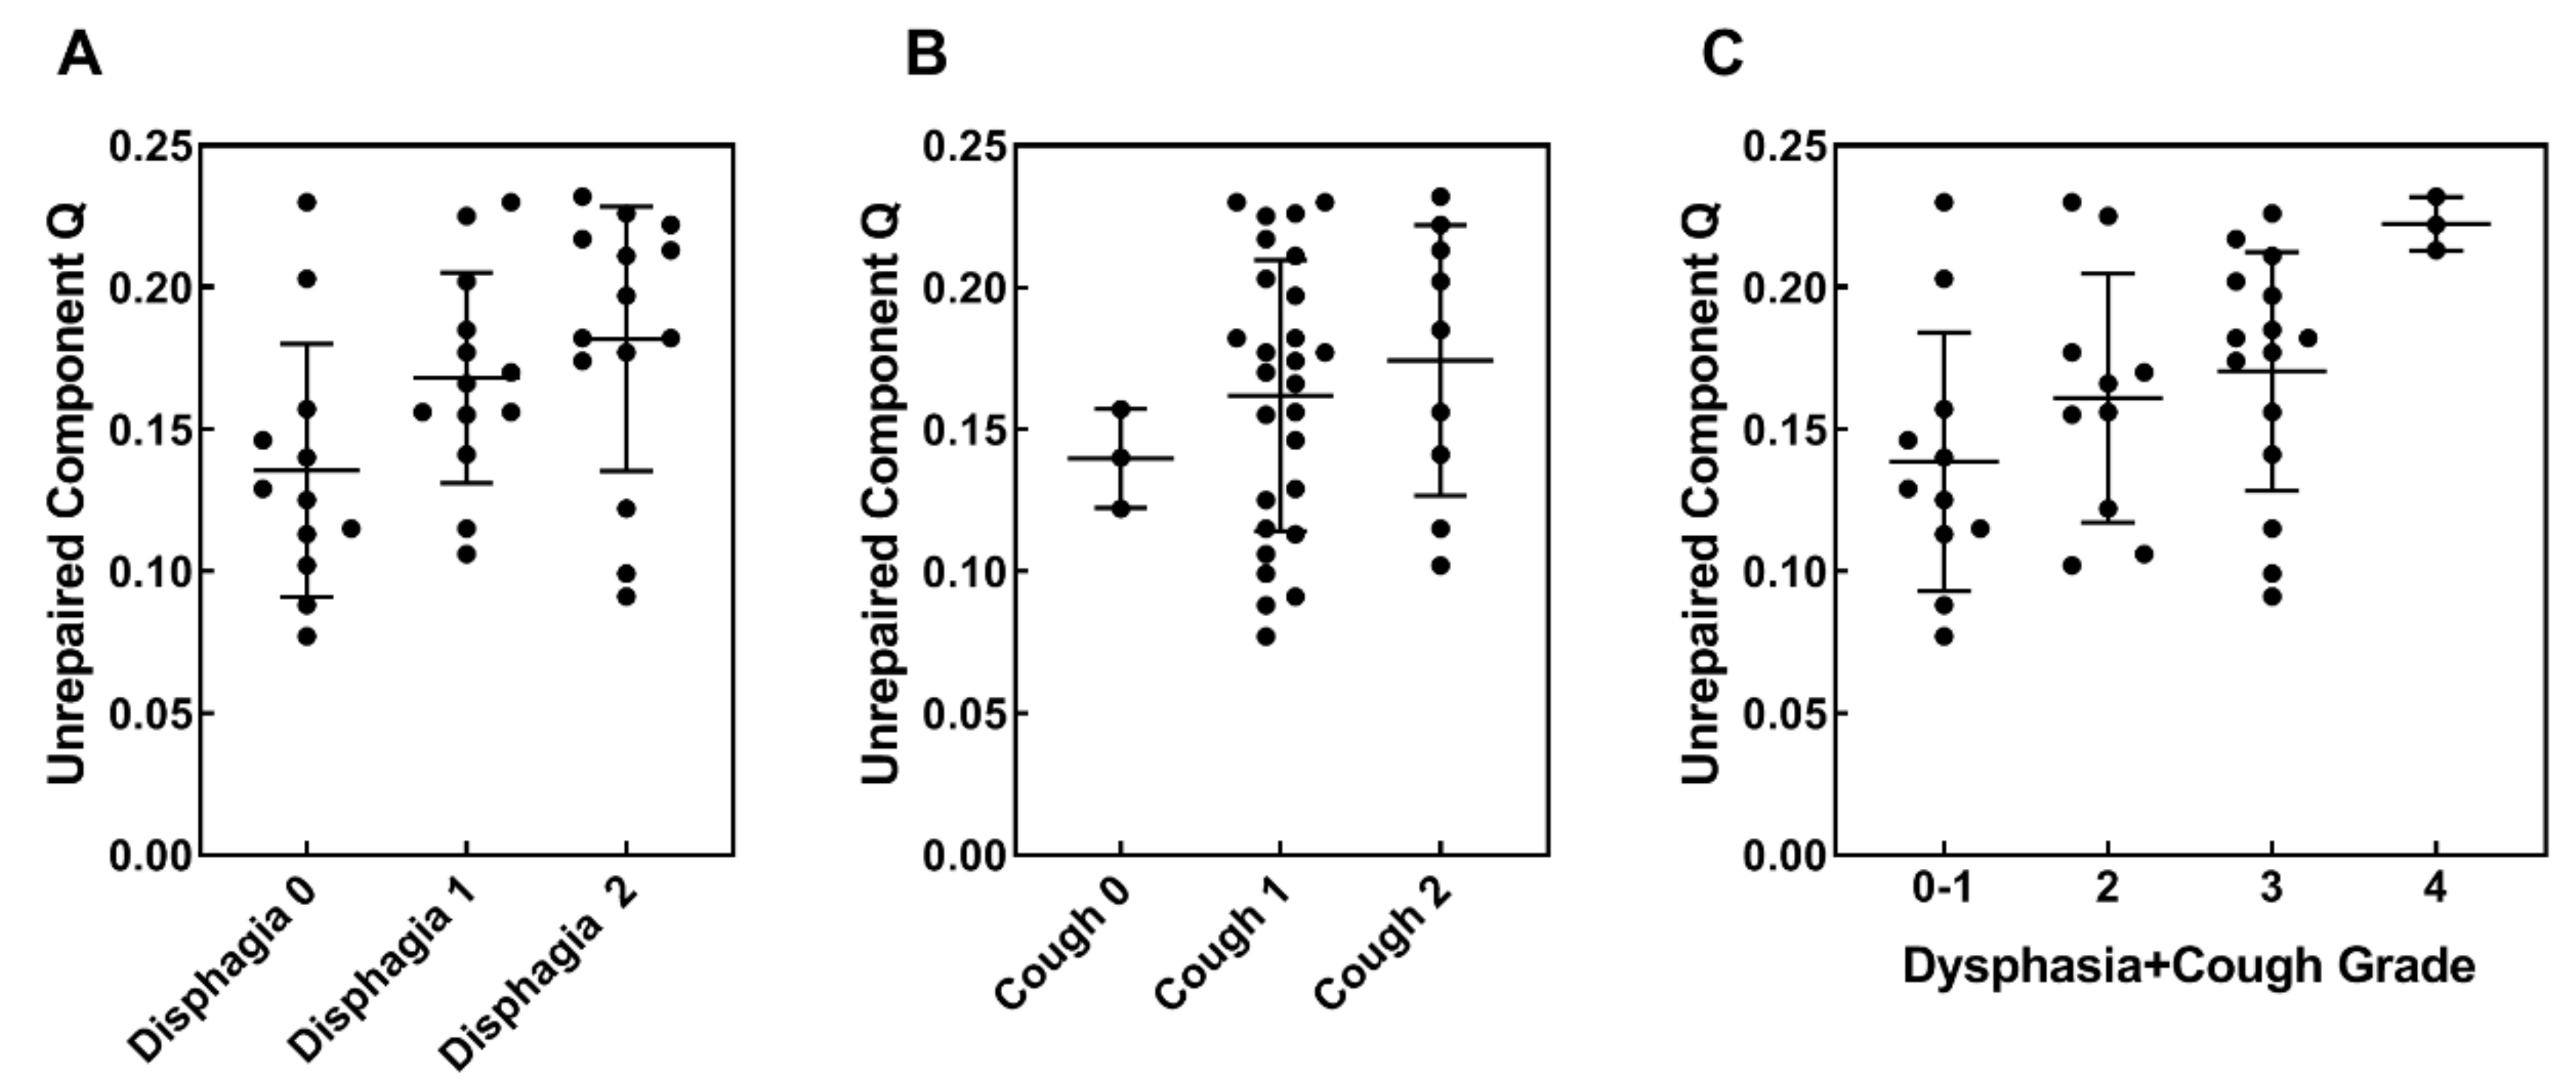
2.4. Correlation Studies with Treatment Outcomes; Baseline PBMC that Were Exposed to Ex Vivo Irradiation

We explored whether an association exists between the unrepairable component Q and repair rate R values across 7 types of RT-induced acute toxicity using CTCAE criteria. The severity of each type of toxicity was evaluated as a four-level grade score (0–3; there were no treatment-related CTCAE grade 4 or 5 toxicities in the cohort). For each patient, we first calculated the combined toxicity grade (the sum of grades for each type of toxicity, which varied from 3 to 11) and found a weak association of this parameter with Q-values (r = 0.152, p = 0.36, Figure S3). Then, we applied the t-test to compare Q-values in 3 subgroups of patients with different toxicity grades for each of the 7 types of toxicity. These subgroups corresponded to toxicity grades 0, 1 and combined 2 and 3, since only 5 cases of grade 3 toxicity were observed. The results including average values for each subgroup and p-values for comparison of grades 1 and 2 with grade 0 are summarised in Table 3. Scatter plots illustrating this analysis are presented in Figure S4.
For two types of toxicity, dysphagia and cough, a trend for increasing Q-values in subgroups with higher toxicity grades was observed. For the increase of Q-values for grade 1 and 2 cough, p-values were 0.155 and 0.098, respectively; for grade 1 dysphagia, p = 0.061 and statistically significant for grade 2 dysphagia (p = 0.016). Scatter plots illustrating this trend are presented in Figure 6A,B.
To look further into the relationship between Q-values and the severity of dysphagia and cough, we calculated the combined criterion as a sum of dysphagia and cough toxicity grades and analyzed four subgroups (grades 0–1, 2, 3 and 4). A similar trend for increasing Q-values was observed for this combined criterion with a statistically significant increase in grade 4 compared to grade 0–1 (p < 0.001) (Figure 6C). A positive correlation was found between Q and the combined dysphagia/cough toxicity grade (r = 0.412, p = 0.010, Figure S3). These results indicate that dysphagia and cough are not independent toxicities.
The analysis of the combined dysphagia/cough toxicity identified three patients with combined score 4 (GP53, GP62 and GP63) that have Q-values at the highest end of the range (0.21–0.23). Interestingly, for patients GP53 and GP62, the toxicity grade 2 was observed for 5 out of 7 toxicity criteria, including radiation-induced pneumonitis, and only for these patients, the overall combined toxicity grade reached 11. These patients map to the higher RS zone on the 2-D RS map (Figure 3D) and correspond to higher ratios of mean foci number in samples collected at 24 h vs. 1 h post first RT, reflecting compromised efficiency of the repair of RT-induced foci. This ratio is higher for GP53, GP62 and GP63 (0.69, 0.45 and 0.56, respectively) than the average ratio of 0.41 (Table S2). On a retrospective chart review for the presence of late toxicity (median follow up time 2 years), all three of these patients had unusual pulmonary toxicity, persistent grade 2 symptoms of cough and/or shortness of breath, and ultimately required ongoing medical interventions. All patients also demonstrated a complete metabolic response at 3 months post-treatment. At the time of last follow up, all patients were alive and only one patient developed a recurrence, which was able to be salvaged with curative intent.
No correlation was found between normal toxicity grades and values of repair rate R (Figure S5), as well as between metabolic response and both Q and R values, as evidenced from the data presented in Table 4.

3. Discussion

Contemporary practice in thoracic radiation oncology involves initially prescribing the established curative regime of 60–66 Gy in 30–33 fractions for all patients and planning the RT to determine if the volume can be safely treated with the prescribed dose. A complex interaction between radiation-induced damage to parenchymal cells, supporting vasculature and associated fibrotic reactions results in acute and late radiation toxicities. In the lung, these changes can manifest in reduced pulmonary function and in a chronic inflammatory cascade, which results in pneumonitis [21].
To date, the strongest predictors of radiation-induced lung injury are based on the volume of normal lung tissue irradiated. These parameters (V20 and MLD) have been validated on meta-analysis of multiple thoracic RT trials, and are often used as binary limits to select patients for the ability to tolerate curative intent treatment with an acceptable toxicity profile [6]. There are, however, a population of patients that experience significant toxicity without any clinical risk factors and with acceptable RT dosimetric parameters. It has been hypothesised that such patients may have inherent biological factors underlying their RS and that if detected with an assay before or early in course of RT, their treatment plans could be adapted to reduce risk of toxicity. The ideal biomarker would identify patients at higher risk of toxicity while also providing information on the likelihood of tumour response to treatment. A biomarker, if validated, would enhance the informed consent process where patients could be more accurately advised of the probability of developing treatment-related toxicity and of tumour control for a given prescribed dose. This would foster engagement in the process of planning and empower patients to have a greater say in their treatment.
A number of strategies have been proposed for such advances in personalized care in thoracic radiation oncology. These include the use of functional lung imaging to identify and avoid regions of working lung during the planning process, the use of early and mid-treatment cytokine levels to identify patients at increased risk of lung toxicity and the use of novel biomarkers to predict toxicity risk [11,22,23]. Previously, we have demonstrated that RT-related early changes in a panel of plasma cytokines were associated with higher grades of radiation-induced lung toxicity [23]. Changes in concentrations of IP-10, MCP-1, Eotaxin, IL-6 and TIMP-1 have also been associated with accumulation of DNA damage in normal tissues outside of the irradiated volume during RT treatment for NSCLC [14].
In a retrospective case-study of a patient with severe clinical RS, our group demonstrated inefficient repair of DNA damage, as assessed by the kinetics of the γ-H2AX response, in PBMC and hair follicles, following ex vivo irradiation [24]. This led to a more comprehensive retrospective study from which statistical criteria were proposed to define DNA repair deficiency [15,16]. However, we have subsequently found that RT itself modulates the repair capacity [25]. Thus, we can anticipate that the counterpart of the RS map published in our retrospective study [15], which would emerge from a prospective study, would have modified scales. The qualitative features of the map would be retained, e.g., the points for radiosensitive individuals would map the region in the top left-hand corner. In this context, the RS map has been helpful in the current study. More generally, a large prospective study will be required to refine our statistical criteria of severe clinical RS for the γ-H2AX-based predictive assay.
The published prospective studies that utilized γ-H2AX as a predictive biomarker for both acute and late normal tissue toxicity revealed mixed results. In clinical trials aiming to prospectively identify head and neck cancer RT patients with a higher degree of radiation-induced mucositis, Fleckenstein et al. [26] found a trend for delayed DSB repair. Similarly, Goutham et al. [27] and Li et al. [28] successfully separated overresponding and non-overresponding patients based on post irradiation γ-H2AX kinetics, and in one of these studies [27], also for residual foci. On the other hand, in a number of clinical studies, the assay failed to predict RS in prospective and retrospective patient cohorts, e.g., [29,30,31]. It is worthwhile to note that in some of the negative reports, the failure could be ascribed to suboptimal study design and analysis. None of the clinical RS studies published to date involve lung cancer RT patients. The GalliPET VQ-RT clinical trial that has been conducted at our institute provided an opportunity to study real-time dynamics of DNA damage accumulation and resolution in PBMC of 38 NSCLC patients that were collected before, during and after RT treatment and to associate the individual DDR with the patients’ clinical responses.
We found a substantial increase in the mean number of γ-H2AX foci in PBMC collected from patients at 1 h post first RT session compared to pre-treatment values. We concluded that these foci were induced by irradiation of cells while they were traveling within the RT treatment volume. The analysis of foci frequency distributions based on the proposed model allowed calculation of the fraction of cells subjected to irradiation and the average and excess foci number in these cells. The excess foci number correlated with PTV, MLD and a combined PTV/MLD parameter. This study indicated that irradiation of blood in both tumour and normal lung tissue is a source of DNA damage in PBMC. The numbers of induced foci obtained from experimental distributions exceeds those predicted from calculation based on RT treatment parameters, indicating that potentially substantial DNA damage may emerge from irradiation of other than lung normal tissues that are located within the irradiation beam.
An increased mean foci number was also observed in PBMC collected 4 weeks into RT. Given treatment logistics necessitated that some 4-week samples were collected before RT treatment and some were collected after RT treatment; we analyzed these two subgroups separately. A substantial and statistically significant increase of the mean foci number was found in samples collected after RT treatment, supporting the interpretation that irradiation of cells within the treatment volume accounts for these foci. A smaller, yet still statistically significant, increase of the mean foci number was also found in the subgroup of samples collected before the RT fraction in the 4-week group. This could be explained by induction of DNA damage by systemic (abscopal) effects in susceptible progenitor cells that is revealed later as increased unrepaired damage in PMBC [17,32].
In the study of ex vivo 2 Gy-irradiated PBMC, we considered the unrepairable component Q, the value derived from the nonlinear regression analysis of post irradiation foci kinetics, as an indicator of the efficiency of DNA repair and a predictor of radiotoxicity [15]. We found no obvious outliers in a set of Q-values, therefore, no patients predicted to have severe RS were revealed. In parallel with this finding, there were no unusually severe clinical toxicities in the patient cohort. However, evidence from preclinical and clinical observations suggests that normal tissue toxicity is multifactorial, dynamic and progressive process [33,34,35]. Accordingly, in subgroups of patients with various grades of radiotoxicity, we found a correlation between Q-values and the toxicity grade for cough and dysphagia. Q-values and the position in the 2-D RS map were in the high RS zone for three patients with the highest combined cough and dysphagia grade. These patients also demonstrated other types of toxicity and had persistent health problems that required clinical intervention. They demonstrated a complete metabolic response, suggesting that their tumours were also sensitive to radiation.
We also considered the ratio of the mean foci number in samples collected 24 and 1 h after the first RT session, which reflects the in vivo repair of DNA damage induced by RT. We found a good concordance of this ratio with Q-values (Figure 4). Indeed, the three patients with high grade of cough/dysphagia had higher than average ratio values, further supporting this concordance. Despite this trend, however, the ratio is not as accurate as Q-value, hence no statistically significant correlation between patient subgroups with different levels of toxicities was found, except for the trend of the increased ratio with the increased combined cough and dysphagia toxicity (similar to the foci numbers in PBMC collected at 24 h post first RT session). These values are simpler parameters than the in vitro Q-value and can be used as a triage, to reveal patients that are potential candidates for the more precise ex vivo irradiation test. Their accuracy could be improved by increasing the number of analyzed cells and by standardizing immunostaining/microscopy protocols to achieve high image reproducibility.

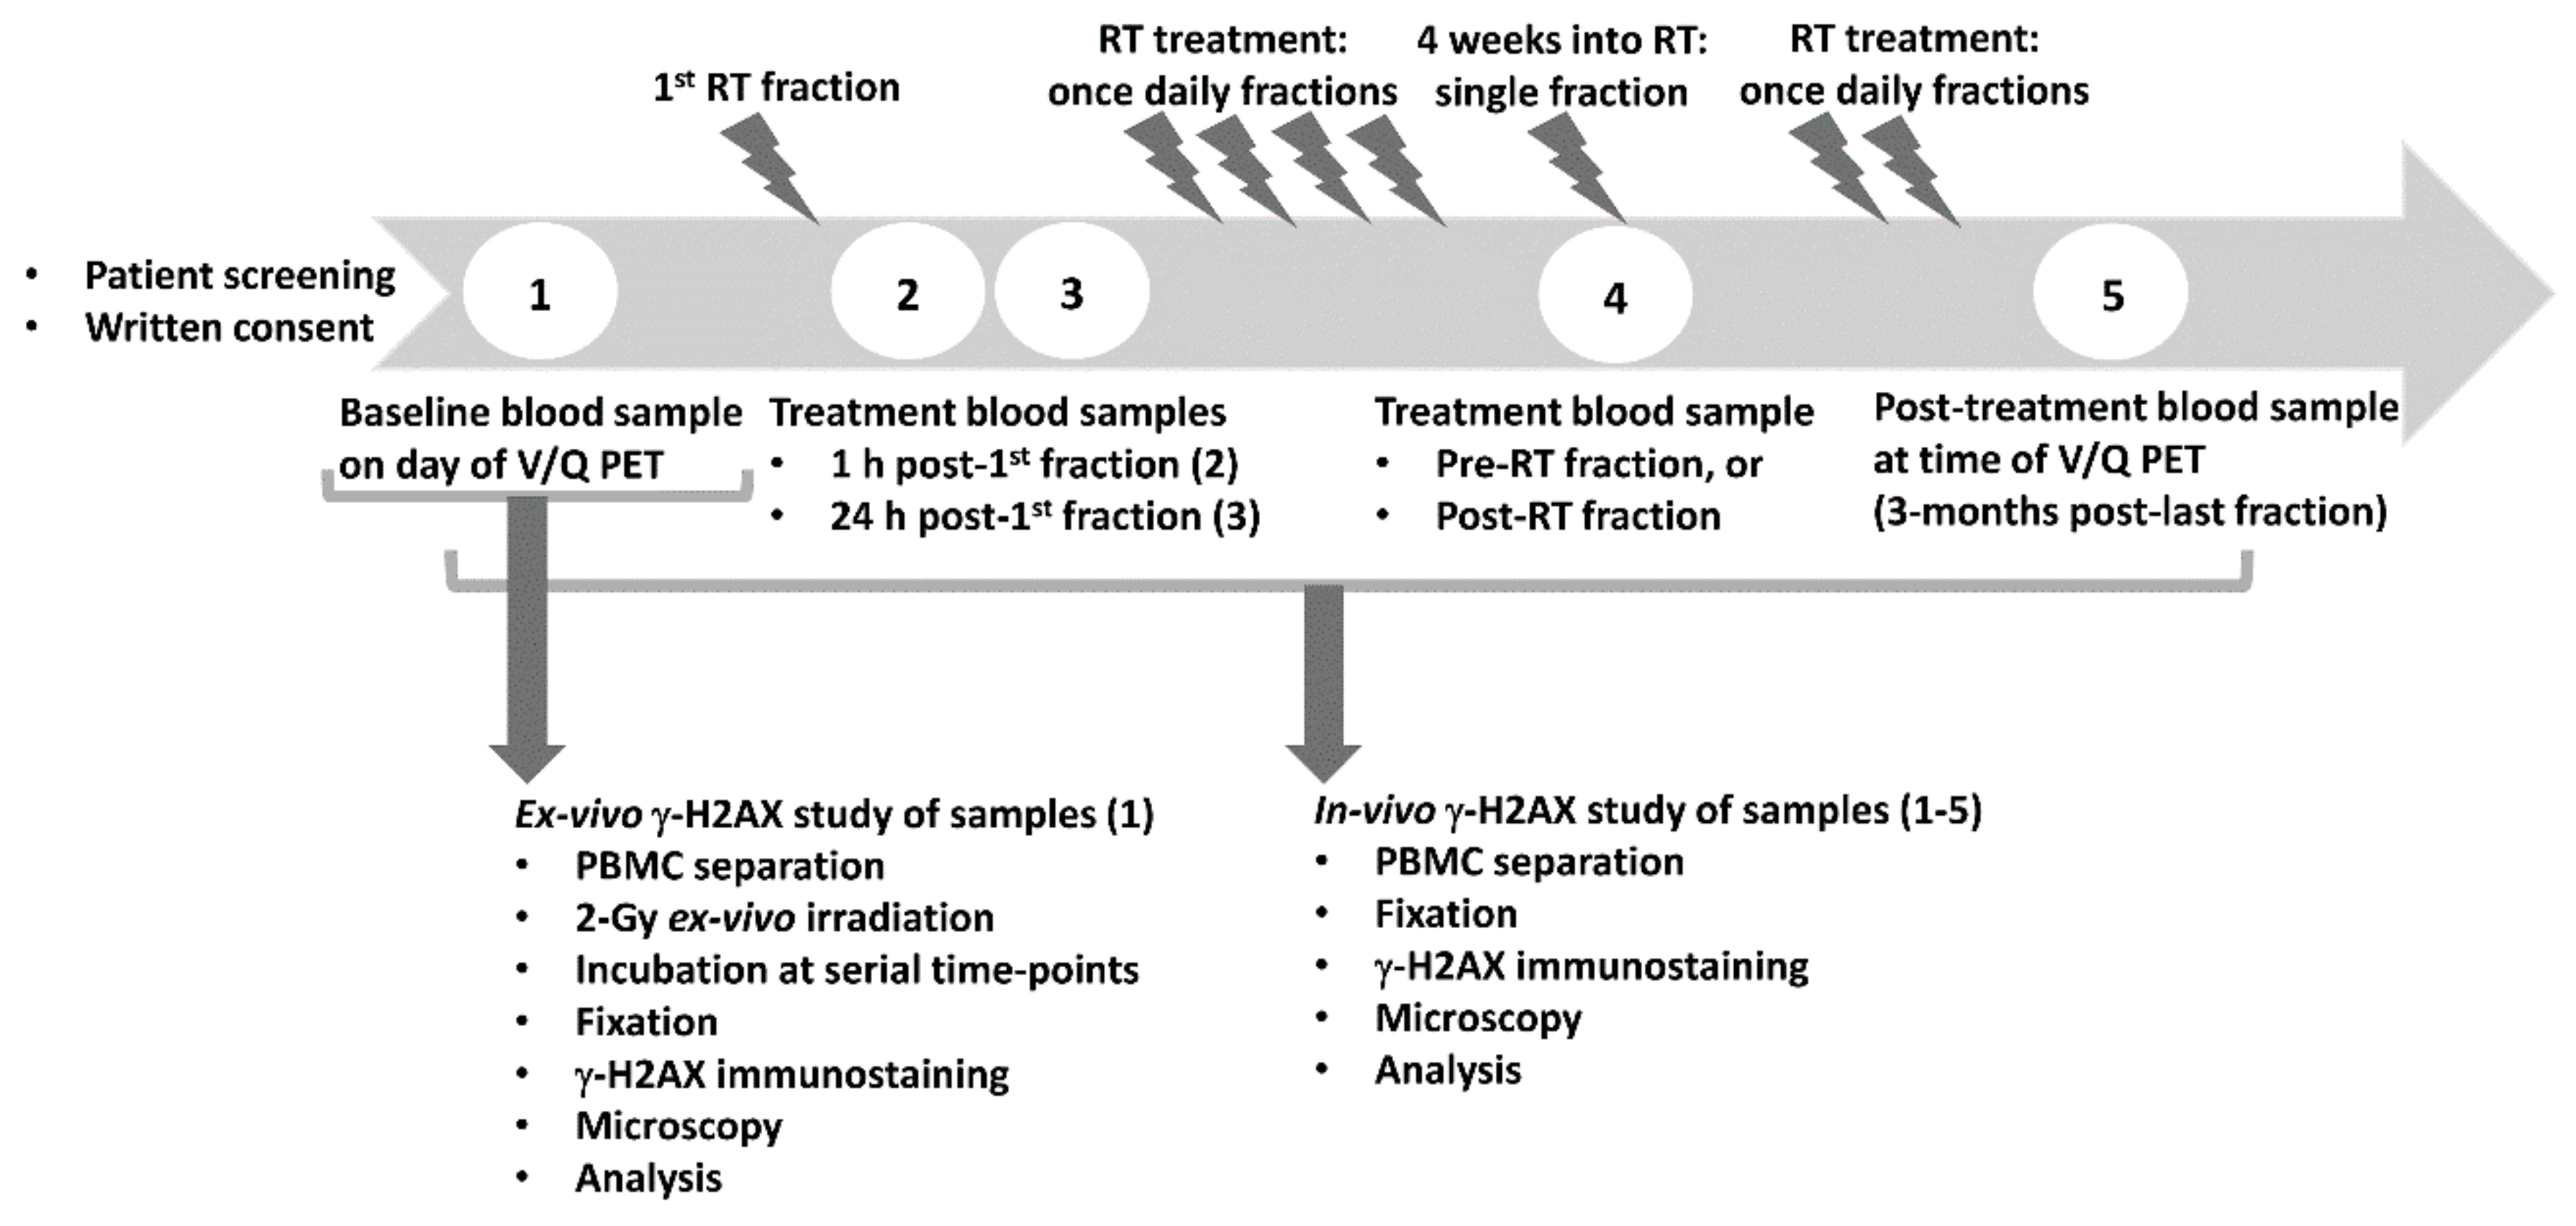
4. Materials and Methods

4.1. Patient Recruitment

Patients with NSCLC (n = 45) were recruited for the GalliPET VQ-RT clinical trial (ethics approval from the Peter MacCallum Cancer Centre; Universal Trial Number U1111-1138-4421, date of approval 7 July 2014). The patients were aged between 49 and 82 years (the median age was 68); 30 males and 15 females. A total dose of 60 Gy was delivered to all patients in 30 fractions over 6 weeks using a 3D conformal technique. Six patients received RT only; 39 received RT with concurrent chemotherapy. All patients gave written informed consent for participation in this trial. Patient information is presented in Table 4. Toxicities were recorded using Common Terminology Criteria for Adverse Events (CTCAE) v4.0. We did not assume that the gallium-68 perfusion protocol with the whole-body radiation dose of the PET scan ~50 mSv could interfere with the results of the study. The impact was controlled as all patients were exposed to the GalliPET protocol.

4.2. Blood Collection and Processing

Blood samples from 43 patients were analysed. Of the 45 recruited trial patients, 7 did not complete the full course of treatment (due to disease progression), changed to palliative treatment due to the extent of disease or lacked a full γ-H2AX dataset due to sample loss or processing failures. A complete dataset with a full complement of translational biomarker time points was, therefore, available for 38 patients.
The logistic of the study is presented in Figure 1. Venous blood (15 mL) was collected in ethylenediaminetetraacetic acid (EDTA) tubes at each time point: pre-treatment (baseline), 1 h after the first RT fraction, approximately 24 h after the first RT fraction (just before the second fraction), 4 weeks into the treatment course (before or after RT fraction) and 3 months after the final RT treatment (at the follow-up appointment). The protocol for blood processing has been described previously, i.e., [15]. As soon as possible after blood collection, PBMC were separated by centrifugation over Ficoll-Paque PLUS (GE Healthcare Life Sciences, Sheffeld, UK) at 600× g for 45 min (without brakes) and washed in the in-house phosphate buffered saline (PBS). Aliquots of isolated PBMC were fixed immediately post blood collection and also aliquots of the majority of PBMC samples were fixed at 24 h post blood collection.
Aliquots of PBMC from all baseline samples were incubated for 30 min at 37 °C in RPMI-1640 medium supplemented with 10% foetal bovine serum (Gibco Life Technologies, Mulgrave, VIC, Australia) and 0.1% gentamicin (Pfizer, Sydney, NSW, Australia). PBMC were then transferred into 15 mL tubes filled with fresh warm complete medium and irradiated to a dose of 2 Gy. Due to relocation of the research laboratory, initially a 137caesium source (GammaCell 40 Irradiator, Nordion International, Kanata, ON, Canada) at a dose-rate of 0.53 Gy/min, and later X-rays (X-RAD320 Irradiator, Precision X-ray, North Branford, CT, USA) at a dose-rate of 1.15 Gy/min, were used for irradiations. The two radiation sources were compared with respect to the γ-H2AX response in ex vivo 2-Gy irradiated PBMC. Fricke dosimetry was used in the comparison studies. The cells were then transferred to 25 cm 2-tissue culture flasks, incubated at 37 °C in 5% CO2 in air, sampled at 1, 3, 6, and 24 h post irradiation, fixed in 4% paraformaldehyde, washed in PBS and stored in 70% ethanol at −20 °C.
In addition, PBMC from all collected samples including baseline that were not exposed to ex vivo irradiation were fixed immediately after blood collection, and, when it was logistically possible, other aliquots were incubated overnight in the complete medium and subsequently fixed at 24 h postblood collection. All PBMC samples were stored in 70% ethanol at −20 °C until immunostaining.

4.3. Immunostaining, Microscopy and Image Analysis

PBMC were cytospun onto microscope slides (Menzel-Glaser Lomb, Braunscheig, Germany) using a Cytospin 4 cytocentrifuge (Thermo-Scientific, Waltham, MA, USA) for 4 min at 800× g. The cell spots were dried for 10 min, outlined with a PAP pen (ProSciTech, Kirwan, QLD, Australia) and blocked with 8% BSA (Sigma-Aldrich, St Louis, MO, USA) for 30 min prior to immunostaining. The slides were incubated with a mouse monoclonal anti-γ-H2AX antibody (Abcam, Cambridge, UK, 1:500) in a humidified chamber at room temperature for 2 h, then after washing, cells with PBS were incubated with Alexa Fluor 488-conjugated goat anti-mouse IgG secondary antibody (Invitrogen, Mulgrave, VIC, Australia, 1:500) for 1 h. Primary and secondary antibodies were diluted into 1% BSA in PBS-TT (PBS containing 0.5% Tween-20 and 0.1% Triton X-100, Sigma-Aldrich, St Louis, MO, USA). Slides were washed three times with PBS and mounted in 4′,6′-diamidino-2-phenylindole (DAPI)-containing Vectashield mounting medium (Vector Laboratories, Burlingame, CA, USA).
Microscopy was performed with an Olympus FV1000 laser confocal scanning microscope (Olympus, Tokyo, Japan). Serial optical sections were used to create a single maximum projection image for each field; these images contained all detected γ-H2AX foci throughout the nuclear volume. A minimum of 3 fields were analysed for each time/dose point; usually sufficient to count foci in at least 100 cells. The nuclei of mononuclear cells were identified, and γ-H2AX foci within these nuclei were counted automatically using the in-house developed software JQuantPro v2.0 [36,37].

4.4. Data Analysis

4.4.1. Distributions of Foci Numbers

We analysed foci frequency distribution for the sole purpose of evaluating the fraction of irradiated cells and the average number of radiation-induced foci in these cells. Distributions of foci frequencies in untreated PBMC from samples collected at 1 h post first fraction of RT were approximated by least squares regression using the following expression for the probability of a cell to have k foci:
P k λ , α , β , f = 1 f P k P λ + f i = 0 k P i P a G k i α , β
which assumes that γ-H2AX foci originate from two sources, randomly distributed background foci and foci that are induced by irradiation in PBMC, which are located within the irradiation volume in the course of RT. The parameter f denotes the fraction of PBMC that are subject to irradiation. The count of background foci is assumed to follow a Poisson distribution with average value of λ:
P k P λ = e λ λ k k !
and the number of radiation-induced foci are assumed to follow a gamma distribution with parameters α and β:
G k α , β = β Γ α k α 1 e β k
The purpose of least squares regression is to evaluate the fraction of irradiated PBMC (f) and the average number of induced foci in these cells (calculated as the ratio α/β). Gamma distribution is chosen as an empirical model suitable for the description of the distribution of foci in cells following irradiation with a range of doses without any implied biological background.

4.4.2. Analysis of Foci Kinetics

For the analysis of γ-H2AX kinetics in PBMC irradiated ex vivo with 2 Gy X-rays, we first calculated the modal average foci number values for each time point t (denoted below as N(t)) by applying least squares regression according to Equation (2) to the experimental foci frequency distributions. As we demonstrated previously, the Poisson modal parameter estimate provides a better description of the count of radiation-induced foci than an arithmetic mean. The kinetics of foci elimination was analysed using a least square with a model that assumes the exponential repair of DSB with a rate R and the presence of irreparable component Q as unknown parameters, according to the following equation:
N t = N m 1 Q e R t + Q

4.5. Statistical Analysis

Paired or unpaired t-tests were used for the comparison of patient foci numbers between groups. For correlation studies, we used Pearson product moment correlation (correlation coefficient r and corresponding p-value).

5. Conclusions

This study provided novel information on the clinical utility of the γ-H2AX assay to monitor DDR in a clinical setting. Our earlier retrospective studies [15,16] provided a starting point towards the objective of developing an assay to prospectively identify radiosensitive patients using the γ-H2AX-based assay to assess the efficiency of their DNA repair. The current study of 38 patients provided valuable information. The three NSCLC patients who scored highly on the assay could not be described as extremely radiosensitive, at least in the time-frame of 36 months between treatment and the present time. However, as survival in locally advanced NSCLC is poor, long-term survivorship and development of very late toxicities are rare. Based on our results, in a large prospective trial, we can expect that the number of patients with clinically proven normal tissue toxicities would be less than the number found to have compromised DNA repair, indicating the requirement for a more sophisticated approach to predict RS. This could be achieved by combining the γ-H2AX assay with other functional assays that showed a predictive potential, such as initial DNA damage assessment, e.g., ATM nucleo-shuttling [38], radiation-induced lymphocyte apoptosis (RILA) assay [39], or chromosome aberrations [40]. Nevertheless, the detection of compromised DNA repair in the three patients showing modest clinical RS, and requiring special follow-up, raises the possibility of prospective identification of modestly radiosensitive patients that could be of clinical benefit.

Supplementary Materials

The following are available online at https://www.mdpi.com/2072-6694/12/9/2517/s1, Figure S1: Frequency distribution histograms of Q- and R values based on the data in Table 3, Figure S2: Comparison of experimental (presented in Table S3) and calculated (as described in Text S1) foci numbers in peripheral blood mononuclear cells (PBMC) at 1 h post first RT session, Figure S3: Correlation of Q–values with normal tissue toxicity, Figure S4: Scatter plots of Q-values in subgroups of patients with different metabolic response and toxicity grades for seven toxicity criteria, Figure S5: Scatter plots of R values in subgroups of patients with different metabolic response and toxicity grades for seven toxicity criteria, Table S1: Statistics of γ-H2AX foci per cell (fpc) values in peripheral blood mononuclear cells (PBMC) collected at different time points and fixed 24 h after collection, Table S2: The values of foci kinetics parameters obtained from nonlinear regression analysis and the ratio of the mean foci number at 24 and 1 h post first radiotherapy (RT) treatment, Table S3: The results of the analysis of foci frequency distribution at 1 h post first RT, Text S1: Calculation of the number of foci induced in PBMC during local RT for NSCLC.

Author Contributions

Conceptualization, O.A.M. and S.S.; methodology: O.A.M. and P.N.L.; Software: P.N.L.; validation and formal analysis: P.N.L.; investigation: J.M., D.R. and X.Y.; data collection and curation: N.W.B. and L.S.; writing—Original draft preparation: N.W.B., O.A.M. and P.N.L.; writing—Review and editing: P.N.L., N.W.B., J.M., D.R., X.Y., D.L.B., T.K., M.H., S.S. and O.A.M.; project administration; L.S.; funding acquisition: M.H. and S.S. All authors have read and agreed to the published version of the manuscript.

Funding

This research was funded by CANCER AUSTRALIA Priority-drive Collaborative Cancer Research Scheme Grant 2013, grant number APP1060919

Acknowledgments

The authors thank Roger Martin (University of Melbourne), Alan Herschtal (Novotech, Australia) for critical reading of the manuscript; Benjamin Blyth (Peter MacCallum Cancer Centre) for help with experimental part and critical reading of the manuscript; Melissa Bruce (Peter MacCallum Cancer Centre) for her assistance preparing the final manuscript; and the Centre for Advanced Histology and Microscopy, Peter MacCallum Cancer Centre.

Conflicts of Interest

The authors declare no conflict of interest. The funders had no role in the design of the study; in the collection, analyses, or interpretation of data; in the writing of the manuscript; or in the decision to publish the results.

References

  1. Batumalai, V.; Wong, K.; Shafiq, J.; Hanna, T.P.; Gabriel, G.; Heberle, J.; Koprivic, I.; Kaadan, N.; King, O.; Tran, T.; et al. Estimating the cost of radiotherapy for 5-year local control and overall survival benefit. Radiother. Oncol. 2019, 136, 154–160. [Google Scholar] [CrossRef] [PubMed]
  2. Travis, L.B. The epidemiology of second primary cancers. Cancer Epidemiol. Prev. Biomark. 2006, 15, 2020–2026. [Google Scholar] [CrossRef] [PubMed] [Green Version]
  3. Travis, L.B.; Demark-Wahnefried, W.; Allan, J.M.; Wood, M.E.; Ng, A.K. Aetiology, genetics and prevention of secondary neoplasms in adult cancer survivors. Nat. Rev. Clin. Oncol. 2013, 10, 289–301. [Google Scholar] [CrossRef] [PubMed]
  4. Bradley, J.D.; Hu, C.; Komaki, R.R.; Masters, G.A.; Blumenschein, G.R.; Schild, S.E.; Bogart, J.A.; Forster, K.M.; Magliocco, A.M.; Kavadi, V.S.; et al. Long-Term Results of NRG Oncology RTOG 0617: Standard-Versus High-Dose Chemoradiotherapy With or Without Cetuximab for Unresectable Stage III Non-Small-Cell Lung Cancer. J. Clin. Oncol. 2020, 38, 706–714. [Google Scholar] [CrossRef]
  5. Antonia, S.J.; Villegas, A.; Daniel, D.; Vicente, D.; Murakami, S.; Hui, R.; Kurata, T.; Chiappori, A.; Lee, K.H.; de Wit, M.; et al. Overall Survival with Durvalumab after Chemoradiotherapy in Stage III NSCLC. N. Engl. J. Med. 2018, 379, 2342–2350. [Google Scholar] [CrossRef]
  6. Palma, D.A.; Senan, S.; Tsujino, K.; Barriger, R.B.; Rengan, R.; Moreno, M.; Bradley, J.D.; Kim, T.H.; Ramella, S.; Marks, L.B.; et al. Predicting radiation pneumonitis after chemoradiation therapy for lung cancer: An international individual patient data meta-analysis. Int. J. Radiat. Oncol. Biol. Phys. 2013, 85, 444–450. [Google Scholar] [CrossRef] [Green Version]
  7. Barnett, G.C.; West, C.M.; Dunning, A.M.; Elliott, R.M.; Coles, C.E.; Pharoah, P.D.; Burnet, N.G. Normal tissue reactions to radiotherapy: Towards tailoring treatment dose by genotype. Nat. Rev. Cancer 2009, 9, 134–142. [Google Scholar] [CrossRef] [Green Version]
  8. Siva, S.; Callahan, J.; Kron, T.; Martin, O.A.; MacManus, M.P.; Ball, D.L.; Hicks, R.J.; Hofman, M.S. A prospective observational study of Gallium-68 ventilation and perfusion PET/CT during and after radiotherapy in patients with non-small cell lung cancer. BMC Cancer 2014, 14, 1–8. [Google Scholar] [CrossRef] [Green Version]
  9. Martin, O.A.; Martin, R.F. Cancer Radiotherapy: Understanding the Price of Tumor Eradication. Front. Cell Dev. Biol. 2020, 8, 261. [Google Scholar] [CrossRef]
  10. Martin, O.A.; Yin, X.; Forrester, H.B.; Sprung, C.N.; Martin, R.F. Potential strategies to ameliorate risk of radiotherapy-induced second malignant neoplasms. Semin. Cancer Biol. 2016, 37, 65–76. [Google Scholar] [CrossRef]
  11. Sprung, C.N.; Forrester, H.B.; Siva, S.; Martin, O.A. Immunological markers that predict radiation toxicity. Cancer Lett. 2015, 368, 191–197. [Google Scholar] [CrossRef] [PubMed]
  12. Bonner, W.M.; Redon, C.E.; Dickey, J.S.; Nakamura, A.J.; Sedelnikova, O.A.; Solier, S.; Pommier, Y. GammaH2AX and cancer. Nat. Rev. Cancer 2008, 8, 957–967. [Google Scholar] [CrossRef] [PubMed]
  13. Ivashkevich, A.; Redon, C.E.; Nakamura, A.J.; Martin, R.F.; Martin, O.A. Use of the gamma-H2AX assay to monitor DNA damage and repair in translational cancer research. Cancer Lett. 2012, 327, 123–133. [Google Scholar] [CrossRef] [PubMed] [Green Version]
  14. Siva, S.; Lobachevsky, P.; MacManus, M.P.; Kron, T.; Moller, A.; Lobb, R.J.; Ventura, J.; Best, N.; Smith, J.; Ball, D.; et al. Radiotherapy for Non-Small Cell Lung Cancer Induces DNA Damage Response in Both Irradiated and Out-of-field Normal Tissues. Clin. Cancer Res. 2016, 22, 4817–4826. [Google Scholar] [CrossRef] [Green Version]
  15. Lobachevsky, P.; Leong, T.; Daly, P.; Smith, J.; Best, N.; Tomaszewski, J.; Thompson, E.R.; Li, N.; Campbell, I.G.; Martin, R.F.; et al. Compromized DNA repair as a basis for identification of cancer radiotherapy patients with extreme radiosensitivity. Cancer Lett. 2016, 383, 212–219. [Google Scholar] [CrossRef] [Green Version]
  16. Herschtal, A.; Martin, R.F.; Leong, T.; Lobachevsky, P.; Martin, O.A. A Bayesian Approach for Prediction of Patient Radiosensitivity. Int. J. Radiat. Oncol. Biol. Phys. 2018, 102, 627–634. [Google Scholar] [CrossRef]
  17. Denoyer, D.; Lobachevsky, P.; Jackson, P.; Thompson, M.; Martin, O.A.; Hicks, R.J. Analysis of 177Lu-DOTA-octreotate therapy-induced DNA damage in peripheral blood lymphocytes of patients with neuroendocrine tumors. J. Nucl. Med. 2015, 56, 505–511. [Google Scholar] [CrossRef] [Green Version]
  18. Bussink, J.; Span, P.N. gamma-H2AX foci in peripheral blood lymphocytes to quantify radiation-induced DNA damage after 177Lu-DOTA-octreotate peptide receptor radionuclide therapy. J. Nucl. Med. 2015, 56, 501–502. [Google Scholar] [CrossRef] [Green Version]
  19. Balasubramaniam, S.; Redon, C.E.; Peer, C.J.; Bryla, C.; Lee, M.J.; Trepel, J.B.; Tomita, Y.; Rajan, A.; Giaccone, G.; Bonner, W.M.; et al. Phase I trial of belinostat with cisplatin and etoposide in advanced solid tumors, with a focus on neuroendocrine and small cell cancers of the lung. Anticancer. Drugs 2018, 29, 457–465. [Google Scholar] [CrossRef]
  20. Wang, L.H.; Pfister, T.D.; Parchment, R.E.; Kummar, S.; Rubinstein, L.; Evrard, Y.A.; Gutierrez, M.E.; Murgo, A.J.; Tomaszewski, J.E.; Doroshow, J.H.; et al. Monitoring drug-induced gammaH2AX as a pharmacodynamic biomarker in individual circulating tumor cells. Clin. Cancer Res. 2010, 16, 1073–1084. [Google Scholar] [CrossRef] [Green Version]
  21. Palmer, J.D.; Zaorsky, N.G.; Witek, M.; Lu, B. Molecular markers to predict clinical outcome and radiation induced toxicity in lung cancer. J. Thorac. Dis. 2014, 6, 387–398. [Google Scholar] [PubMed]
  22. Gomolka, M.; Blyth, B.; Bourguignon, M.; Badie, C.; Schmitz, A.; Talbot, C.; Hoeschen, C.; Salomaa, S. Potential screening assays for individual radiation sensitivity and susceptibility and their current validation state. Int. J. Radiat. Biol. 2020, 96, 280–296. [Google Scholar] [CrossRef] [PubMed]
  23. Siva, S.; MacManus, M.; Kron, T.; Best, N.; Smith, J.; Lobachevsky, P.; Ball, D.; Martin, O. A pattern of early radiation-induced inflammatory cytokine expression is associated with lung toxicity in patients with non-small cell lung cancer. PLoS ONE 2014, 9, e109560. [Google Scholar] [CrossRef]
  24. Adams, G.; Martin, O.A.; Roos, D.E.; Lobachevsky, P.N.; Potter, A.E.; Zacest, A.C.; Bezak, E.; Bonner, W.M.; Martin, R.F.; Leong, T. Enhanced intrinsic radiosensitivity after treatment with stereotactic radiosurgery for an acoustic neuroma. Radiother. Oncol. 2012, 103, 410–414. [Google Scholar] [CrossRef] [PubMed]
  25. Yin, X.; Mason, J.; Lobachevsky, P.N.; Munforte, L.; Selbie, L.; Ball, D.L.; Martin, R.F.; Leong, T.; Siva, S.; Martin, O.A. Radiation Therapy Modulates DNA Repair Efficiency in Peripheral Blood Mononuclear Cells of Patients With Non-Small Cell Lung Cancer. Int. J. Radiat. Oncol. Biol. Phys. 2019, 103, 521–531. [Google Scholar] [CrossRef]
  26. Fleckenstein, J.; Kuhne, M.; Seegmuller, K.; Derschang, S.; Melchior, P.; Graber, S.; Fricke, A.; Rübe, C.E.; Rübe, C. The impact of individual in vivo repair of DNA double-strand breaks on oral mucositis in adjuvant radiotherapy of head-and-neck cancer. Int. J. Radiat. Oncol. Biol. Phys. 2011, 81, 1465–1472. [Google Scholar] [CrossRef]
  27. Goutham, H.V.; Mumbrekar, K.D.; Vadhiraja, B.M.; Fernandes, D.J.; Sharan, K.; Kanive-Parashiva, G.K.; Kapaettu, S.; Sadashiva, S.R. DNA double-strand break analysis by gamma-H2AX foci: A useful method for determining the overreactors to radiation-induced acute reactions among head-and-neck cancer patients. Int. J. Radiat. Oncol. Biol. Phys. 2012, 84, e607–e612. [Google Scholar] [CrossRef]
  28. Li, P.; Du, C.R.; Xu, W.C.; Shi, Z.L.; Zhang, Q.; Li, Z.B.; Fu, S. Correlation of dynamic changes in gamma-H2AX expression in peripheral blood lymphocytes from head and neck cancer patients with radiation-induced oral mucositis. Radiat. Oncol. 2013, 8, 155. [Google Scholar] [CrossRef] [Green Version]
  29. Finnon, P.; Kabacik, S.; MacKay, A.; Raffy, C.; A’Hern, R.; Owen, R.; Badie, C.; Yarnold, J.; Bouffler, S. Correlation of in vitro lymphocyte radiosensitivity and gene expression with late normal tissue reactions following curative radiotherapy for breast cancer. Radiother. Oncol. 2012, 105, 329–336. [Google Scholar] [CrossRef]
  30. Greve, B.; Bolling, T.; Amler, S.; Rossler, U.; Gomolka, M.; Mayer, C. Evaluation of different biomarkers to predict individual radiosensitivity in an inter-laboratory comparison—Lessons for future studies. PLoS ONE 2012, 7, e47185. [Google Scholar] [CrossRef]
  31. Markova, E.; Somsedikova, A.; Vasilyev, S.; Pobijakova, M.; Lackova, A.; Lukacko, P.; Popanda, O.; Dreffke, K.; Rickinger, A.; Fritz, E. DNA repair foci and late apoptosis/necrosis in peripheral blood lymphocytes of breast cancer patients undergoing radiotherapy. Int. J. Radiat. Biol. 2015, 91, 934–945. [Google Scholar] [CrossRef]
  32. Bryant, J.; Shields, L.; Hynes, C.; Howe, O.; McCleanc, B.; Lynga, F. DNA Damage and Cytokine Production in Non-Target Irradiated Lymphocytes. Radiat. Res. 2019, 191, 545–555. [Google Scholar] [CrossRef] [PubMed]
  33. Rodemann, H.P.; Blaese, M.A. Responses of normal cells to ionizing radiation. Semin. Radiat. Oncol. 2007, 17, 81–88. [Google Scholar] [CrossRef] [PubMed]
  34. Brush, J.; Lipnick, S.L.; Phillips, T.; Sitko, J.; McDonald, J.T.; McBride, W.H. Molecular mechanisms of late normal tissue injury. Semin. Radiat. Oncol. 2007, 17, 121–130. [Google Scholar] [CrossRef] [PubMed]
  35. Schuster, B.; Ellmann, A.; Mayo, T.; Auer, J.; Haas, M.; Hecht, M.; Fietkau, R.; Distel, L.V. Rate of individuals with clearly increased radiosensitivity rise with age both in healthy individuals and in cancer patients. BMC Geriatr. 2018, 18, 1–8. [Google Scholar] [CrossRef] [PubMed]
  36. Ivashkevich, A.N.; Martin, O.A.; Smith, A.J.; Redon, C.E.; Bonner, W.M.; Martin, R.F.; Lobachevsky, P.N. gammaH2AX foci as a measure of DNA damage: A computational approach to automatic analysis. Mutat. Res. 2011, 711, 49–60. [Google Scholar] [CrossRef] [Green Version]
  37. Jakl, L.; Lobachevsky, P.; Vokalova, L.; Durdik, M.; Markova, E.; Belyaev, I. Validation of JCountPro software for efficient assessment of ionizing radiation-induced foci in human lymphocytes. Int. J. Radiat. Biol. 2016, 92, 766–773. [Google Scholar] [CrossRef]
  38. Vogin, G.; Bastogne, T.; Bodgi, L.; Gillet-Daubin, J.; Canet, A.; Pereira, S.; Foray, N. The Phosphorylated ATM Immunofluorescence Assay: A High-performance Radiosensitivity Assay to Predict Postradiation Therapy Overreactions. Int. J. Radiat. Oncol. Biol. Phys. 2018, 101, 690–693. [Google Scholar] [CrossRef] [Green Version]
  39. Fhoghlu, M.N.; Barrett, S. A Review of Radiation-Induced Lymphocyte Apoptosis as a Predictor of Late Toxicity After Breast Radiotherapy. J. Med. Imaging Radiat. Sci. 2019, 50, 337–344. [Google Scholar] [CrossRef]
  40. Beaton, L.A.; Ferrarotto, C.; Marro, L.; Samiee, S.; Malone, S.; Grimes, S.; Malone, K.; Wilkins, R.C. Chromosome damage and cell proliferation rates in in vitro irradiated whole blood as markers of late radiation toxicity after radiation therapy to the prostate. Int. J. Radiat. Oncol. Biol. Phys. 2013, 85, 1346–1352. [Google Scholar] [CrossRef]
Figure 1. Experimental scheme of the study. Patients with non-small cell lung cancer (NSCLC) were recruited for the GalliPET VQ-RT clinical trial. The γ-H2AX biomarker study was a biological part of the clinical trial. Venous blood was collected at the indicated time points before, during and after radiotherapy (RT) treatment and processed as described in Section 4. Peripheral blood mononuclear cells (PBMC) collected at all time points were not exposed to ex vivo irradiation (in vivo γ-H2AX study), except an aliquot of a baseline PBMC sample that was subsequently ex vivo irradiated (ex vivo γ-H2AX study). Ventilation/perfusion (V/Q) positron emission tomography (PET) prior to treatment and post-treatment enabled assessment of treatment toxicity and tumour progression.
Cancers 12 02517 g001
Figure 2. γ-H2AX foci in PBMC not exposed to ex vivo irradiation. (A) γ-H2AX foci counts in PBMC for all time points and patients (PBMC were fixed immediately after blood collection). Scatter plots of γ-H2AX foci numbers from groups of samples obtained at different time points of radiotherapy (RT) treatment. For data obtained from samples collected at 4 weeks into RT, two subgroups are shown, samples obtained pre-RT session and post-RT session, as explained in the text. Each point represents the arithmetic mean of foci numbers counted in images from an individual patient. Bars show the mean values and standard deviations for each group. * Statistically significant. (B) Representative confocal microscopy images of PBMC immunostained with anti-γ-H2AX antibody from patient GP39 at baseline (top row), 1 h after the first RT session when PBMC were either fixed immediately after blood collection (fixed early; middle row) and when PBMC were fixed 24 h after blood collection (fixed late; bottom row). The left column shows green channel, γ-H2AX, and right column shows blue (DAPI) channel (nuclei). Objects (nuclei) selected for the analysis are outlined in pink. Scale bar, 10 μm. (C) Averaged γ-H2AX foci frequency distributions in PBMC collected at baseline (left panel) and 1 h post first RT (right panel). Solid lines are the best fit Poisson distributions. Arithmetic mean values are 1.08 and 3.18, best-fit Poisson average values 0.53 and 1.06 and R-squared values for the nonlinear regression are 0.975 and 0.853, for the baseline and 1-h groups, respectively.
Cancers 12 02517 g002
Figure 3. γ-H2AX foci kinetics following ex vivo irradiation of PBMC collected at baseline. PBMC were collected prior to RT, exposed to 2 Gy-irradiation and fixed at serial time points. (A) Average γ-H2AX foci kinetics for all patients. Data points and error bars represent the mean foci number across all patients and the standard deviation. (B) Representative examples of a large variation of foci kinetics between patients; with small Q (the fraction of irreparable DNA damage) and large R (the fraction of fpc per hour) (GP48) and large Q and small R (GP29). The symbols represent experimental points, and the lines are obtained as a result of nonlinear regression. Values of the best fit parameters Q and R are 0.225 ± 0.0624 and 0.199 ± 0.060, respectively, for GP29 and 0.077 ± 0.011 and 0.319 ± 0.018, respectively, for GP48. (C) Scatter plots of Q and R values obtained from nonlinear regression of foci kinetics. Each point on scatter diagrams represents an individual patient. Mean values ± standard deviations are 0.163 ± 0.046 and 0.254 ± 0.052 for Q and R values, respectively. (D) Q-R map (“RS map”) showing values of the parameters in R and Q coordinates. Each point represents an individual patient, and numerical values correspond to the patient numbers. The top left-hand region of the map corresponds to compromised DNA repair.
Cancers 12 02517 g003
Figure 4. Correlation between Q-values and the ratio of background foci in PBMC collected at 24 and 1 h post first radiotherapy (RT) session. The 24/1 h ratios for all patients are presented in Table S2. This ratio reflects the efficiency of in vivo repair of DNA damage induced in PBMC by RT treatment.
Cancers 12 02517 g004
Figure 5. Correlation of the excess foci number with planned treatment volume (PTV) and mean lung dose (MLD). (A) PTV and (B) MLD correlation analysis for a group of patients with blood samples collected at 1 h after first RT session. Each point represents the data for an individual patient. The excess foci number is calculated as the product of the average radiation-induced fpc and the fraction of irradiated cells from Table S3. The lines show the linear regression and 95% confidence intervals. Correlation coefficient r = 0.586, p = 0.00011 for PTV and r = 0.437, p = 0.0006 for MLD.
Cancers 12 02517 g005
Figure 6. Comparison of Q-values in subgroups of patients with acute normal tissue toxicity—Dysphagia and cough. Diagrams show scatter plots of Q-values in subgroups of patients with: (A) grades 0, 1 and 2 of dysphagia; (B) grades 0, 1 and 2 of cough; (C) combined grades of dysphagia and cough. Mean Q-values and their standard deviations for each subgroup are presented in Table 3.
Cancers 12 02517 g006
Table 1. Statistics of γ-H2AX foci per cell (fpc) values in peripheral blood mononuclear cells (PBMC) collected at different time points and fixed immediately after blood collection.
Time Points
of Blood Collection
Baseline1 H Post First RT24 H Post First RT4 Weeks (Sample Pre-RT)4 Weeks (Sample Post-RT)3 Months Post-Final RT
Mean Value, fpc1.113.241.261.572.391.09
Standard Deviation0.370.680.570.500.910.52
Number of samples433838181629
p-value 1 relative to baseline <0.0001 *0.1300.0089 *<0.0001 *0.688
1p-values are given for paired t-test. * Statistically significant. Due to treatment logistics some samples taken at 4 weeks were collected before the RT session (pre-RT) and some were collected after (post-RT).
Table 2. Pearson correlation of foci induction at 1 h post first radiotherapy (RT) with planned treatment volume (PTV) and mean lung dose (MLD).
ParameterPTVMLDCombined PTV and MLD
Correlation Coefficientp-ValueCorrelation Coefficientp-ValueCorrelation Coefficientp-Value
Average per cell number of induced foci0.2350.1550.2340.158
Fraction of affected cells0.4170.0100.2740.0955
Average per cell number of excess foci0.5860.000110.4370.000600.601<0.0001
MLD0.597<0.0001
Table 3. Summary of the statistics and comparison of Q- and R-values for subgroups of patients with various metabolic response and normal tissue toxicity grades for seven types of toxicity.
Tumour Response/ToxicityGradeNQ-ValuesR-Values
AverageSDp-ValueAverageSDp-Value
Tumour responseCMR 1120.1550.048 0.2460.048
PMR 2100.1590.0490.8270.2510.0610.821
PMD 370.1670.0480.6000.2770.0390.146
Dyspnoea070.1610.044 0.2260.050
1180.1750.0430.4880.2650.0480.110
2140.1490.0500.5860.2520.0550.299
Cough030.1400.018 0.2300.035
1270.1620.0480.1550.2560.0580.327
290.1740.0480.0980.2530.0360.383
Pneumonitis0200.1680.042 0.2670.055
170.1400.0390.1350.2270.0510.109
2120.1680.0560.9980.2470.0410.265
Dermatitis090.1700.044 0.2100.032
1220.1620.0470.6610.2700.0490.001
290.1410.0710.3140.2280.0980.630
Fatigue040.1710.046 0.2240.057
1270.1560.0470.5890.2680.0460.218
270.1890.0420.5510.2290.0400.878
Nausea0300.1570.048 0.2490.053
170.1860.0400.1310.2690.0460.348
220.1660.0160.5870.2670.0660.768
Dysphagia0120.1350.045 0.2530.069
1130.1680.0370.0610.2440.0440.690
2140.1820.0470.0160.2630.0420.697
Cough + dysphagia0-1110.1380.046 0.2570.072
2100.1610.0440.2640.2270.0380.251
3150.1700.0420.0830.2390.0980.583
430.2220.0100.000110.2420.0300.598
1 CMR = complete metabolic response; 2 PMR = partial metabolic response; 3 PMD = progressive metabolic disease.
Table 4. Patient characteristics.
Patient
ID
AgeGenderPathologyStagePTV (cm3)MLDRT/CRT4 Weeks Beforeore
or After RT
PET
Response
Dyspnoea
Grade
Cough
Grade
Pneumonitis
Grade
Dermatitis
Grade
Fatigue
Grade
Nausea
Grade
Dysphagia
Grade
GP2659MSCC N/A11.69 N/A1100000
GP2767MNSCLCT2N2M036019.79CRT: ca/paBeforeCMR0102112
GP2869MACT2N2M045315.73CRT: ca/pa N/A0100002
GP2949MACT4N0M03878.00CRT: cis/etBeforeN/A1100201
GP3048FACT3N3M04938.75CRT: cis/etAfterPMR0012102
GP3163MSCCT3N2M1b108120.45CRT: ca/paAfterPMD1221001
GP3264MSCCT1aN1M1b18414.79CRT: ca/paAfterPMR1122100
GP3369MAC 25112.29 N/A0100001
GP3460MACT2N2M1b49112.36CRT: ca/paBeforeN/A1102113
GP3570FSCCT4N0M0107419.86CRT: cis/etBeforePMD1101102
GP3675FACT2aN3M052113.34CRT: ca/palBeforePMR1221101
GP3778MACT2bN2M076315.79CRT: ca/paBeforeCMR1122202
GP3868FACT3N2M1b50817.28CRT: cis/etAfterN/A1101112
GP3975MNSCLCT2bN3M091319.81CRT: ca/paBeforeN/A0103123
GP4070MACT3N0M040915.63RTBeforeN/A3101201
GP4172MNSCLCT1N2M039916.55CRT: ca/paBeforePMR1101100
GP4264FAC N/A17.39 N/A1100000
GP4367MSCCT4N1M078015.05 N/A1100100
GP4462MNSCLCT1N2M041515.36CRT: ca/paBeforeCMR1113212
GP4574FACT1bN3M071817.10CRT: ca/paBeforeN/A1101102
GP4674FACT2N3M047717.50CRT: cis/etBeforePMR3101000
GP4768MSCCrT0N2M016010.55CRT: ca/paAfterPMR1121102
GP4863FACT1N2M025917.42RTAfterCMR2122100
GP4974MSCCT2aN0M01298.54RTBeforePMD2101201
GP5078FNSCLCT1N2M016113.23CRT: ca/paBeforeCMR1221111
GP5182MACT1cM0M01249.20RTAfterPMD2101100
GP5248MACT3N2M033813.86CRT: cis/etAfterCMR3112101
GP5367MSCCT1N0M011815.20CRT: cis/etBeforeCMR2221202
GP5468FACT1bN2M026413.69CRT: ca/paAfterPMR0111202
GP5582MSCCT2aN2M016513.65CRT: caAfterCMR0001110
GP5648MACT3N2M050215.04CRT: ca/paAfterPMR1101101
GP5768MACT3N0M022112.71CRT: ca/paBeforeCMR1220101
GP5868MACT2aN2M053716.97CRT: ca/paBeforePMD2101100
GP5971FSCCT4N0M020811.22CRT: ca/paBeforePMR2111300
GP6035MACT2bN2M1b53814.10CRT: cis/etBeforePMD1101112
GP6167MNSCLCT3N2M080417.45CRT: ca/paAfterCMR2110101
GP6280FACT1N2M029318.90CRT: ca/paAfterCMR2220212
GP6363FSCCT3N2M061916.43CRT: ca/pa PMR1211102
GP6484FSCCT4N0M0915.90RTAfterCMR1100202
GP6572MACT3N2M047615.57CRT: ca/paBeforePMR0211100
GP6671MNSCLCT4N0M047712.40CRT: ca/paAfterPMR1211102
GP6768FACT1aN1M026714.45RTBeforePMD2121102
GP6880MSCCT2BN2M028112.59CRT: ca/paAfterCMR2211101
GP6971MSCCT2N2M051117.94CRT: ca/paAfterCMR2120200
GP7064MACT4N2M1b82015.00CRT: ca/paAfterN/A1100121
Of the 45 patients recruited for the GalliPET VQ-RT clinical trial, 7 (data shaded grey) did not complete the full course of treatment due to disease progression (1 patient), changed to palliative treatment due to the extent of disease (1 patient), or lacked a full γ-H2AX dataset due to logistic errors, sample loss or processing failures (6 patients). The complete datasets for 38 patients were, therefore, analyzed for this translational study; M—male, F—female, SCC—squamous cell carcinoma, NSCLC—non-small cell lung cancer, AC—adenocarcinoma, ca/pa—carboplatin/paclitaxel, cis/et—cisplatin/etoposide, ca—carboplatin, N/A—not available.

