The Inhibitory Role of miR-486-5p on CSC Phenotype Has Diagnostic and Prognostic Potential in Colorectal Cancer

 , , , , , , , , and
Abstract
:Simple Summary
Abstract
1. Introduction
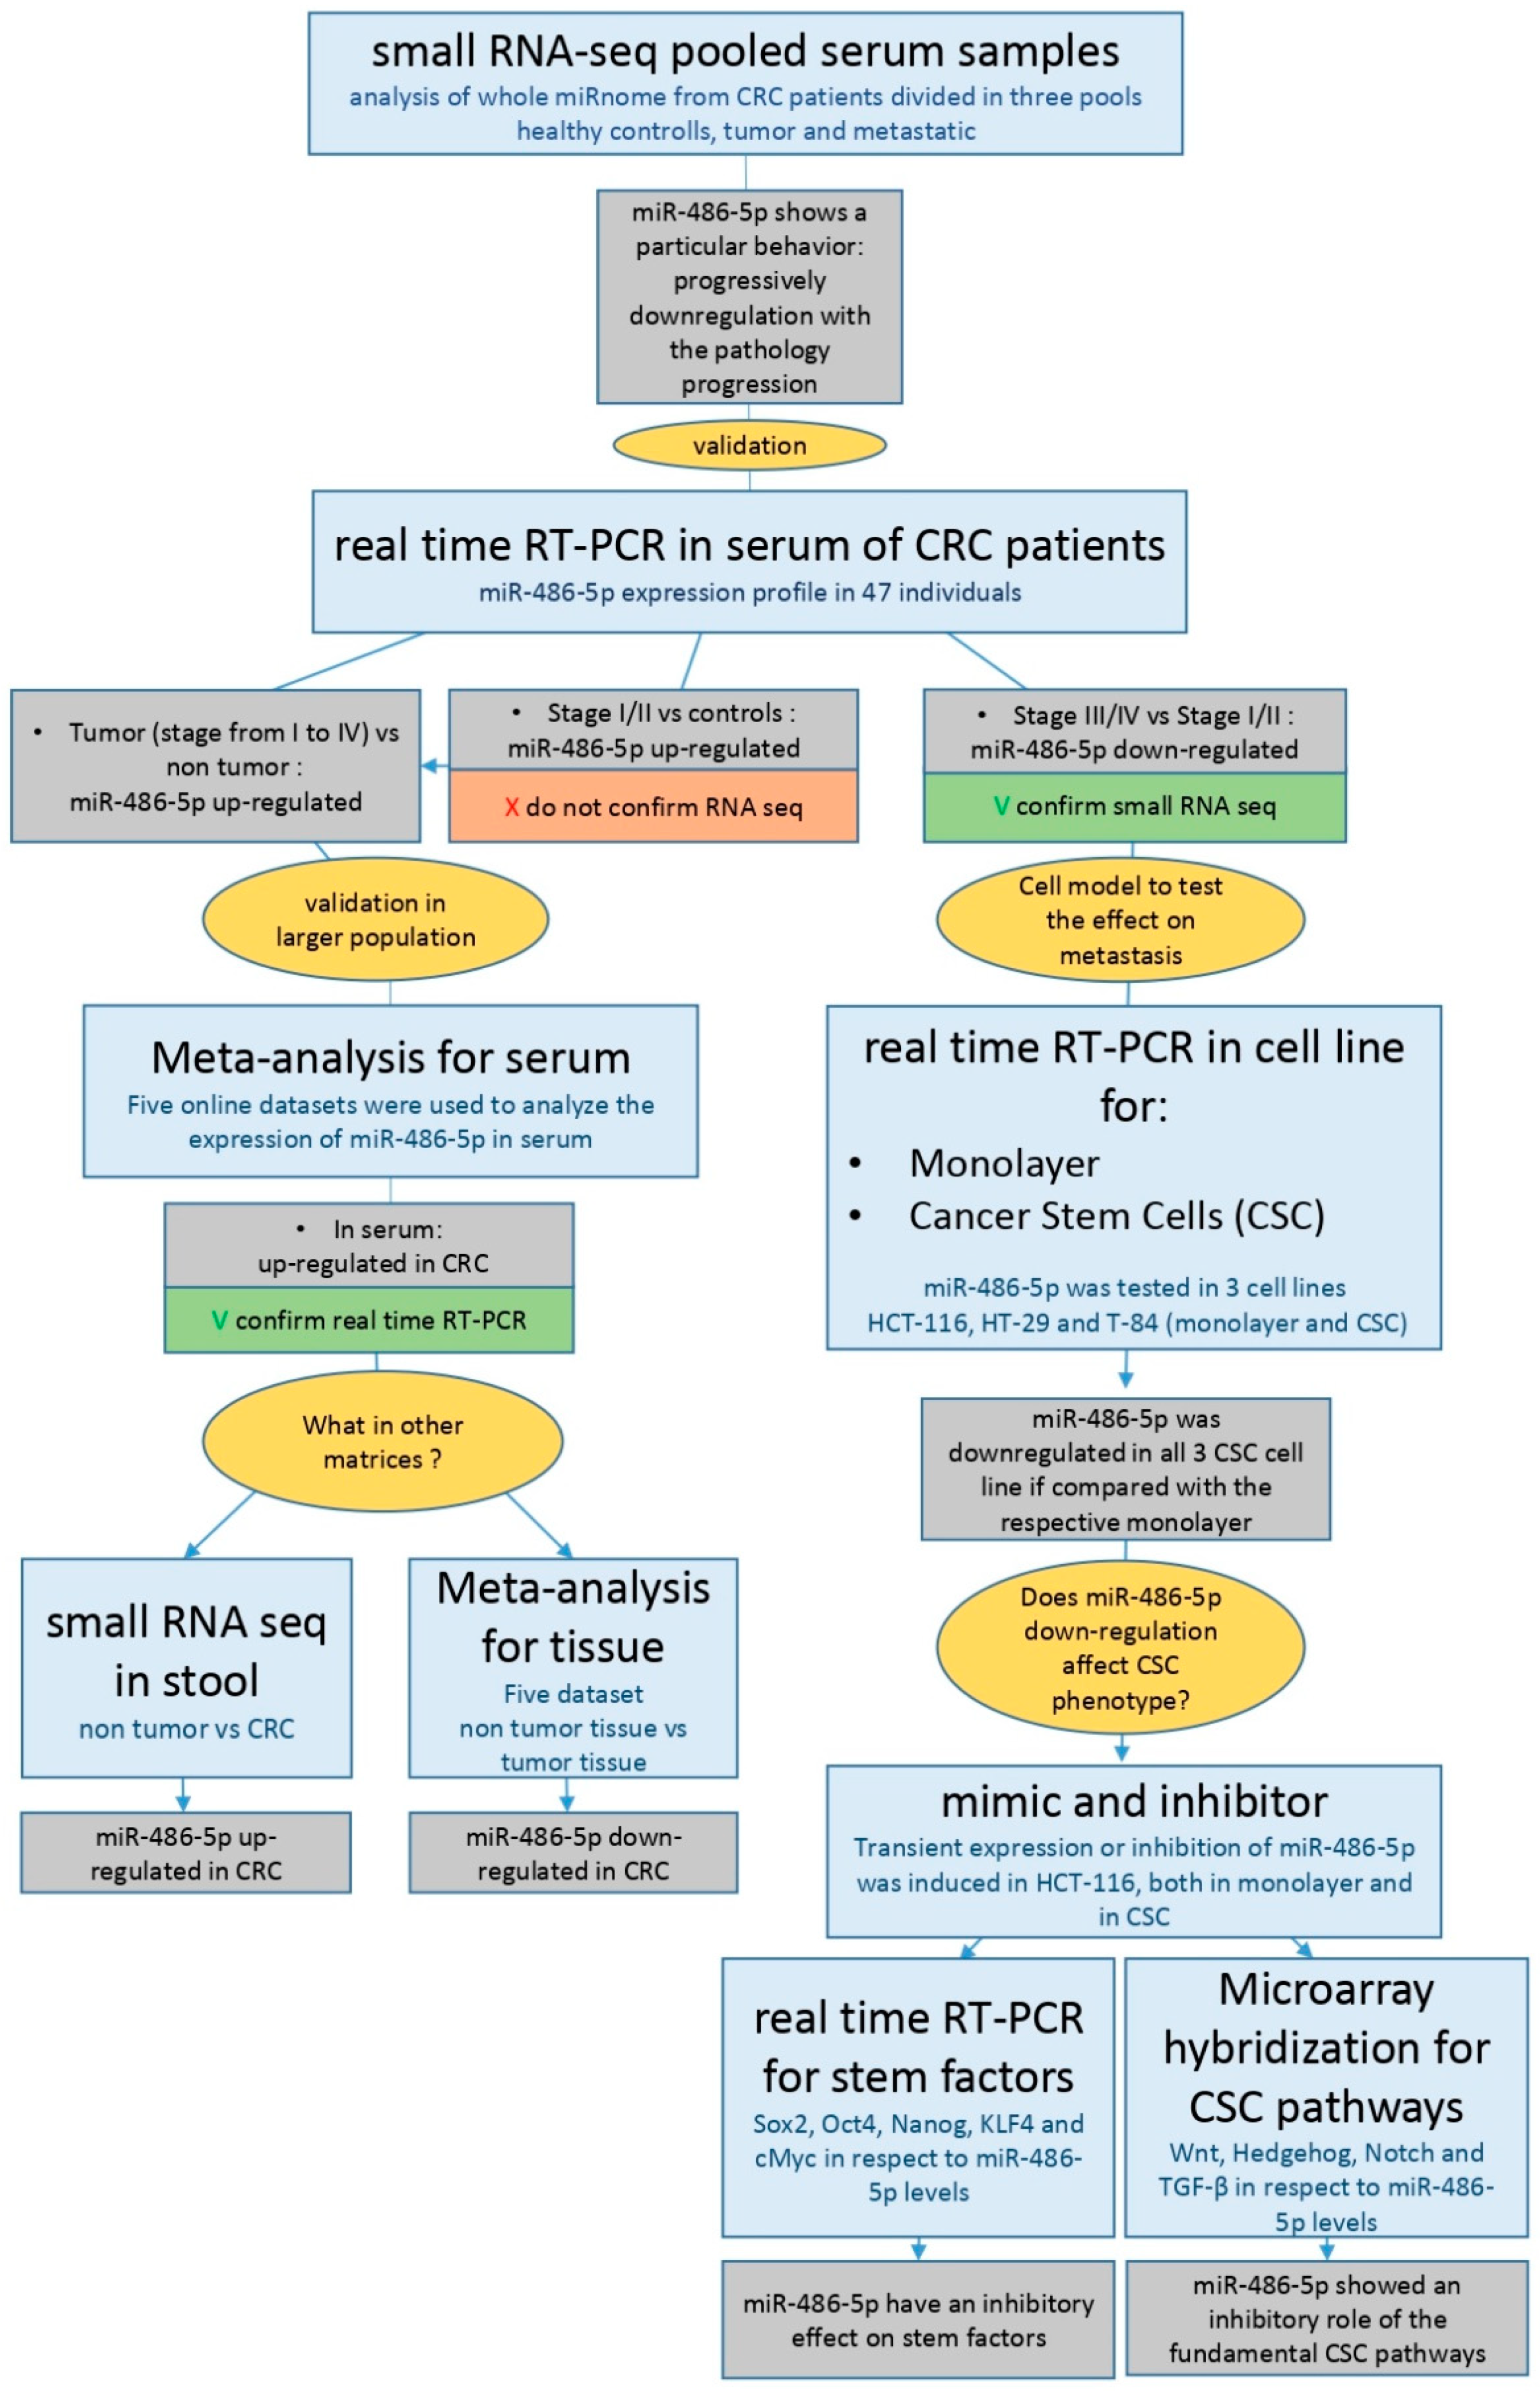
2. Results
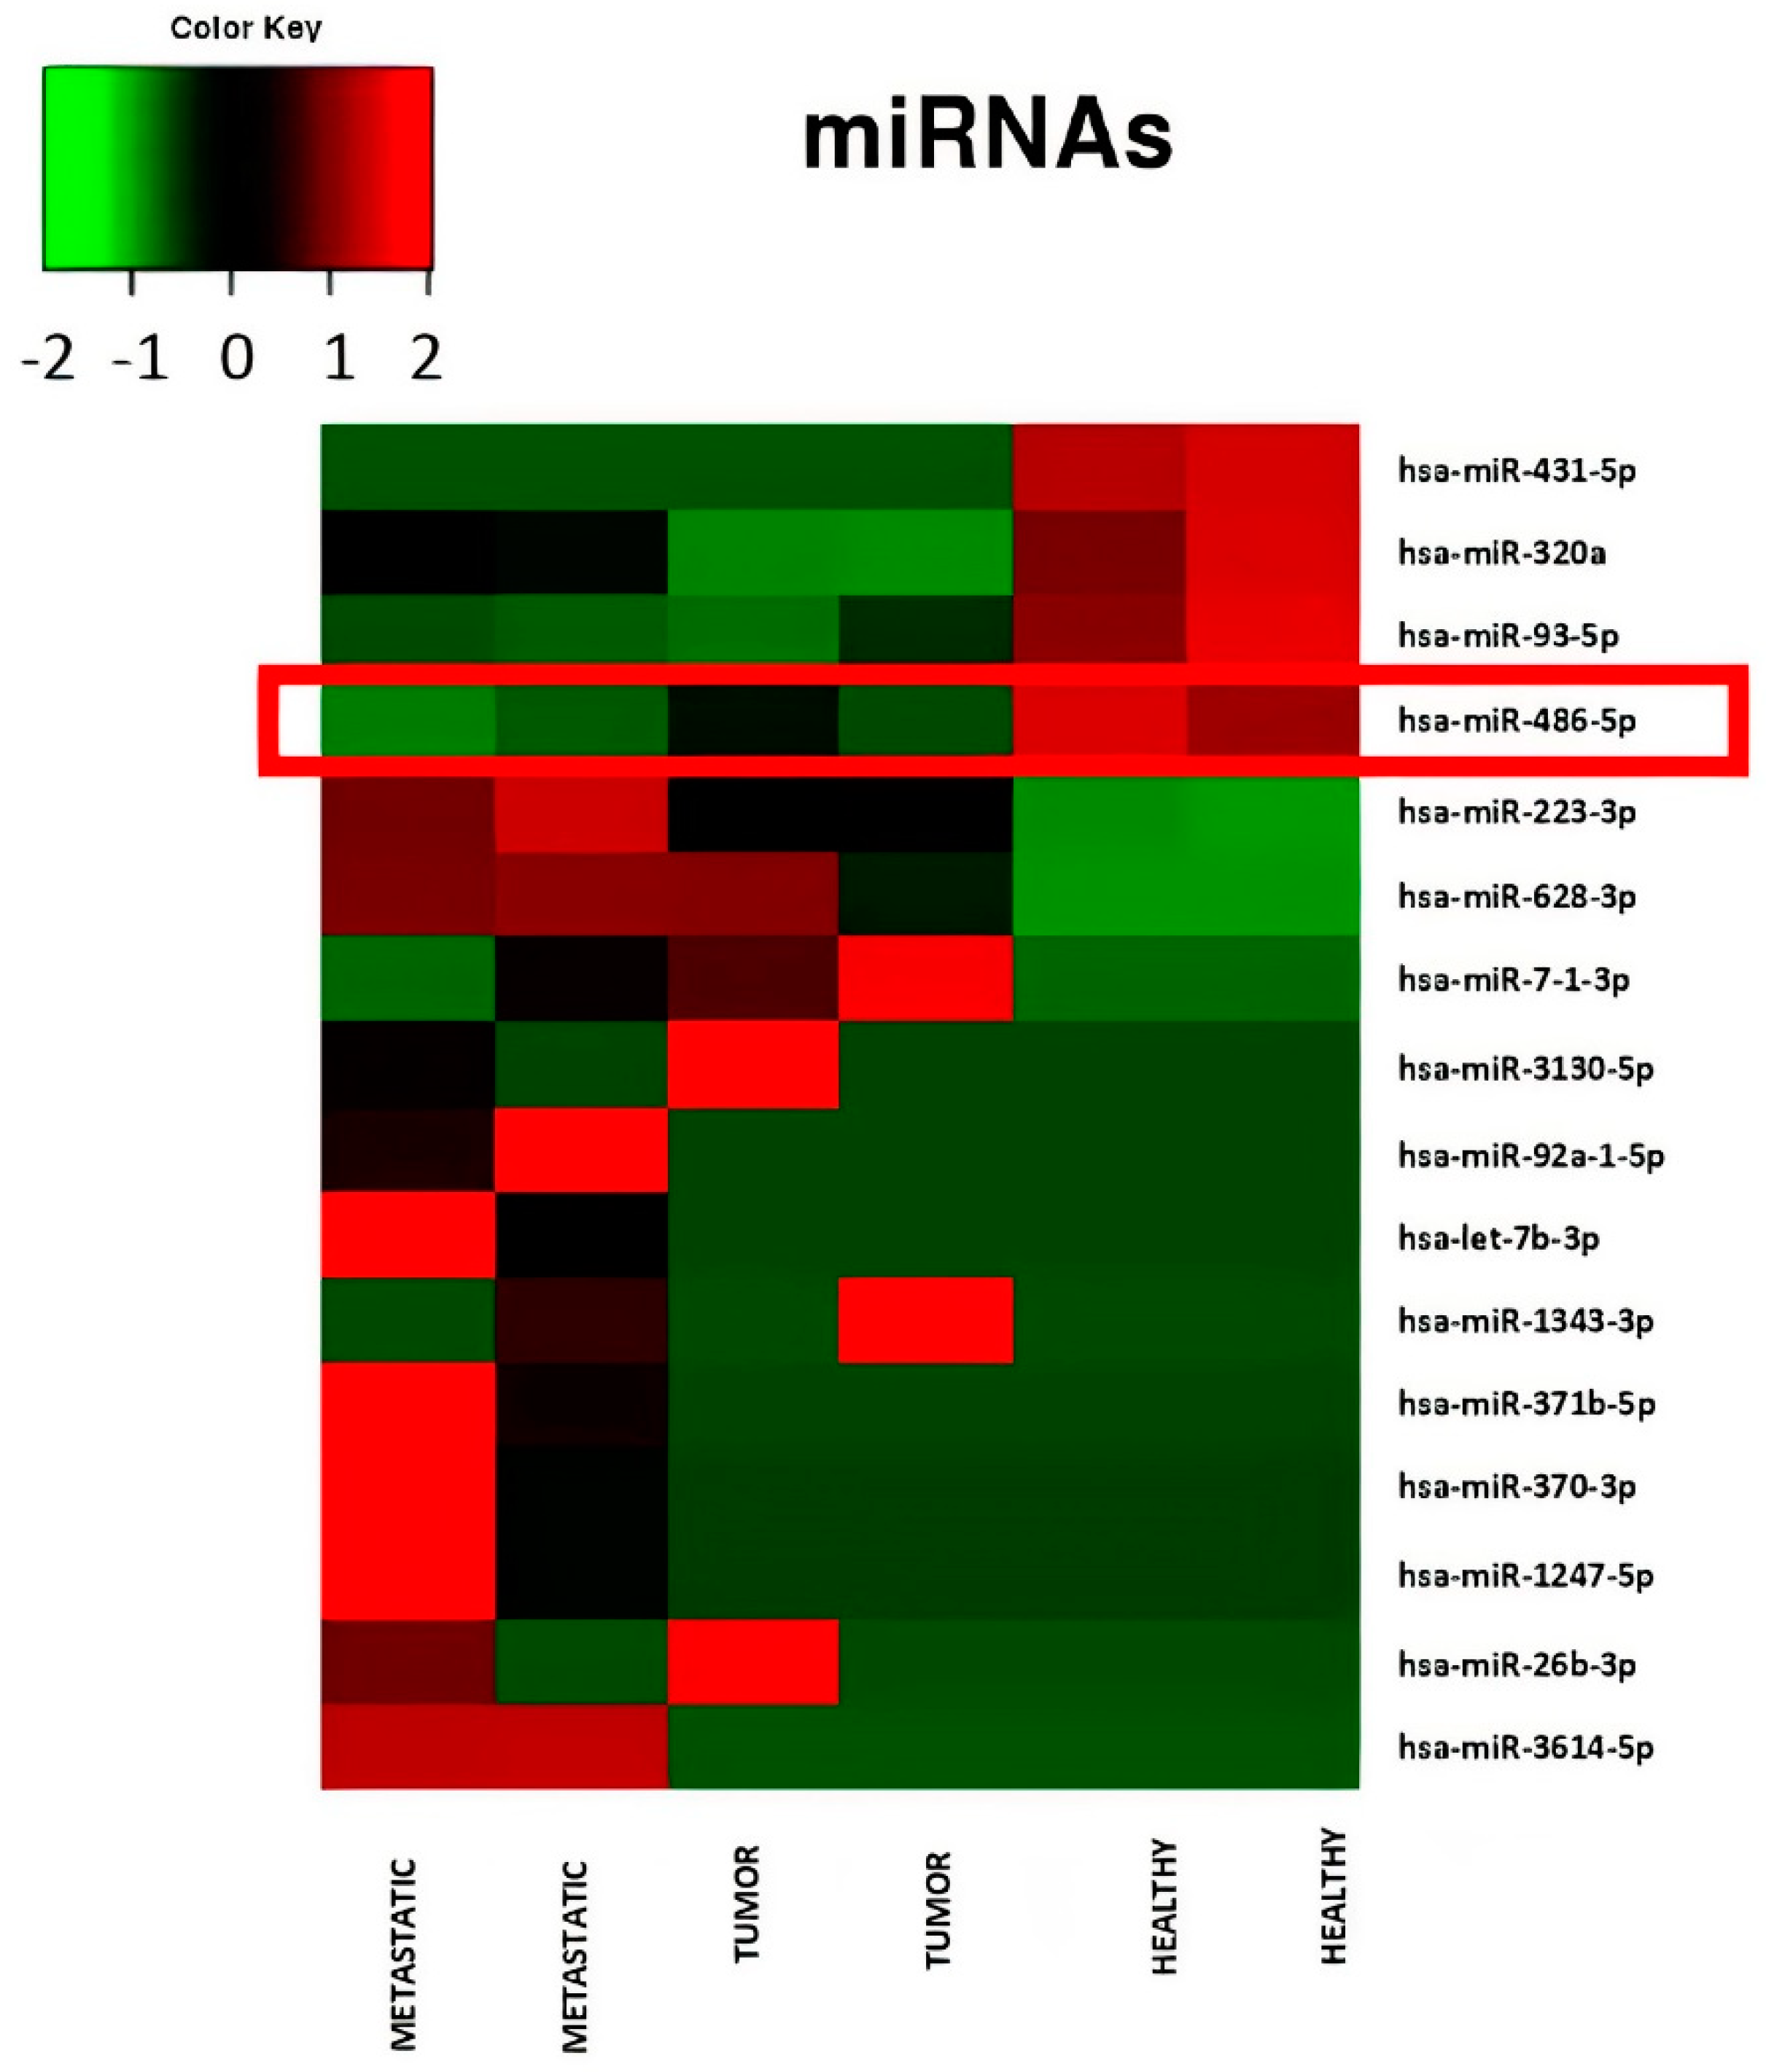
2.1. Serum Small RNA-Sequencing
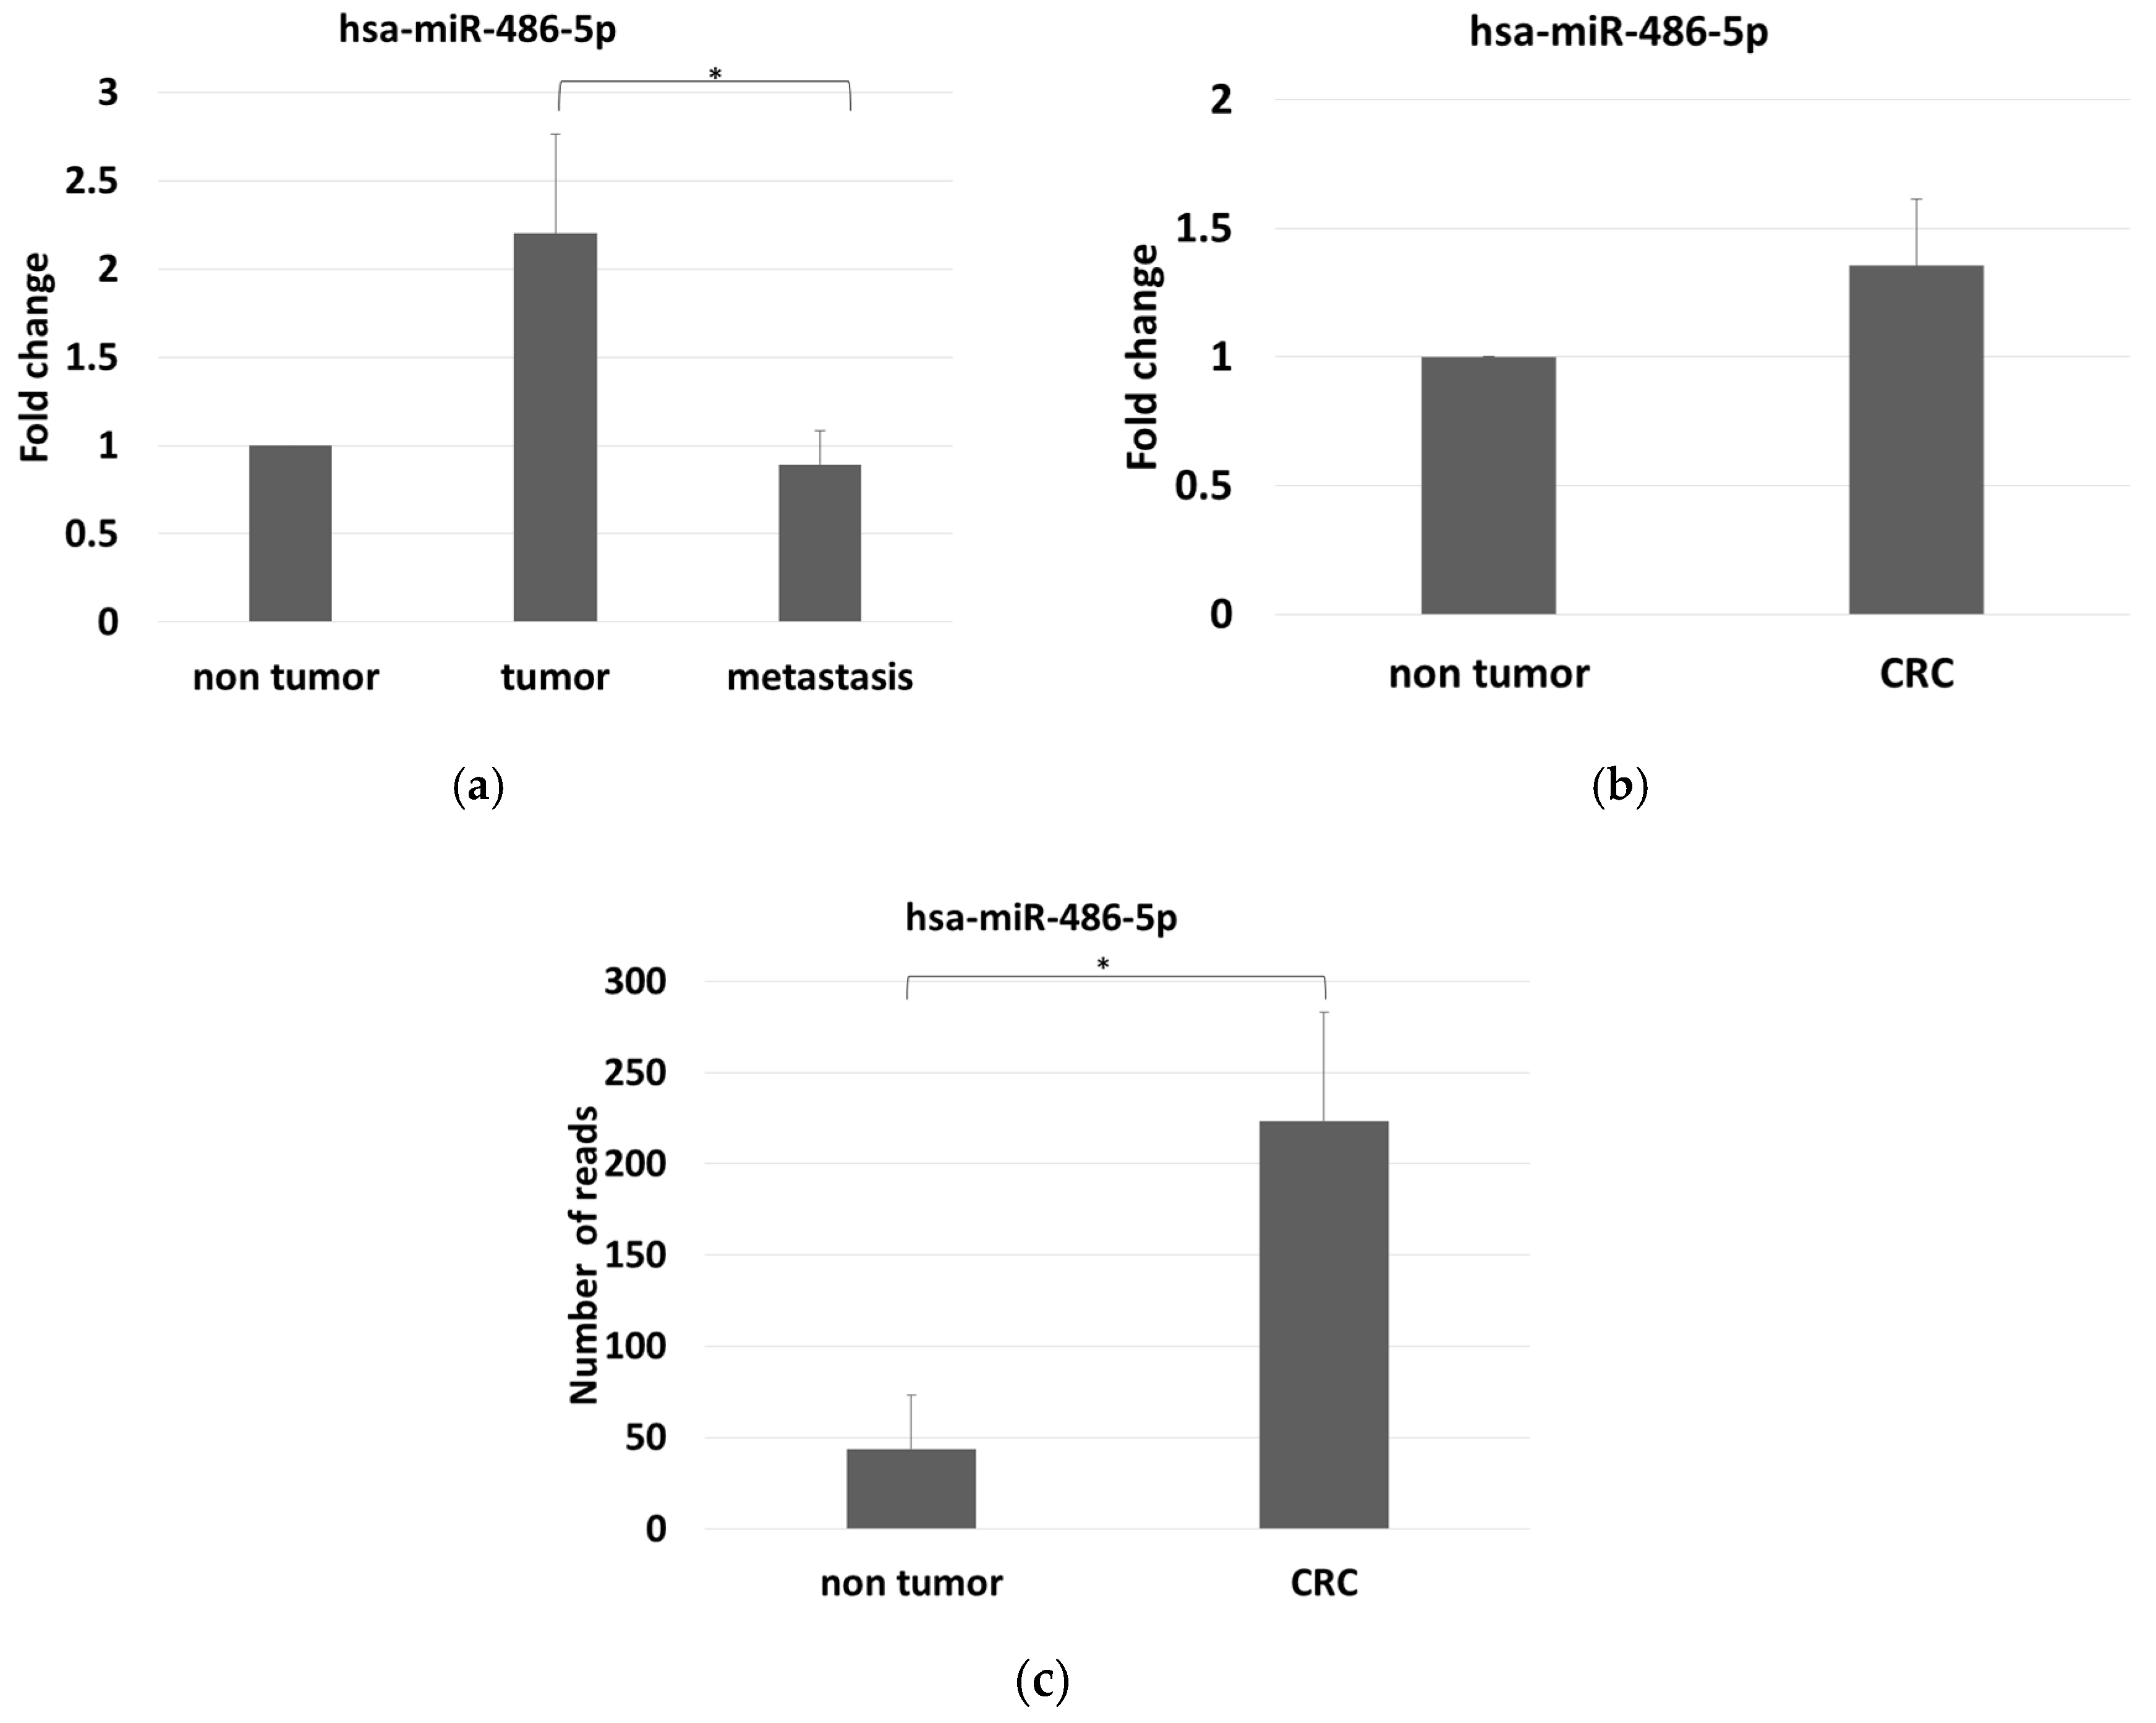
2.2. MiR-486-5p Expression in Sera Determined with Real-Time RT–PCR
2.3. Mir-486-5p Levels in Stool by Small RNA-Sequencing
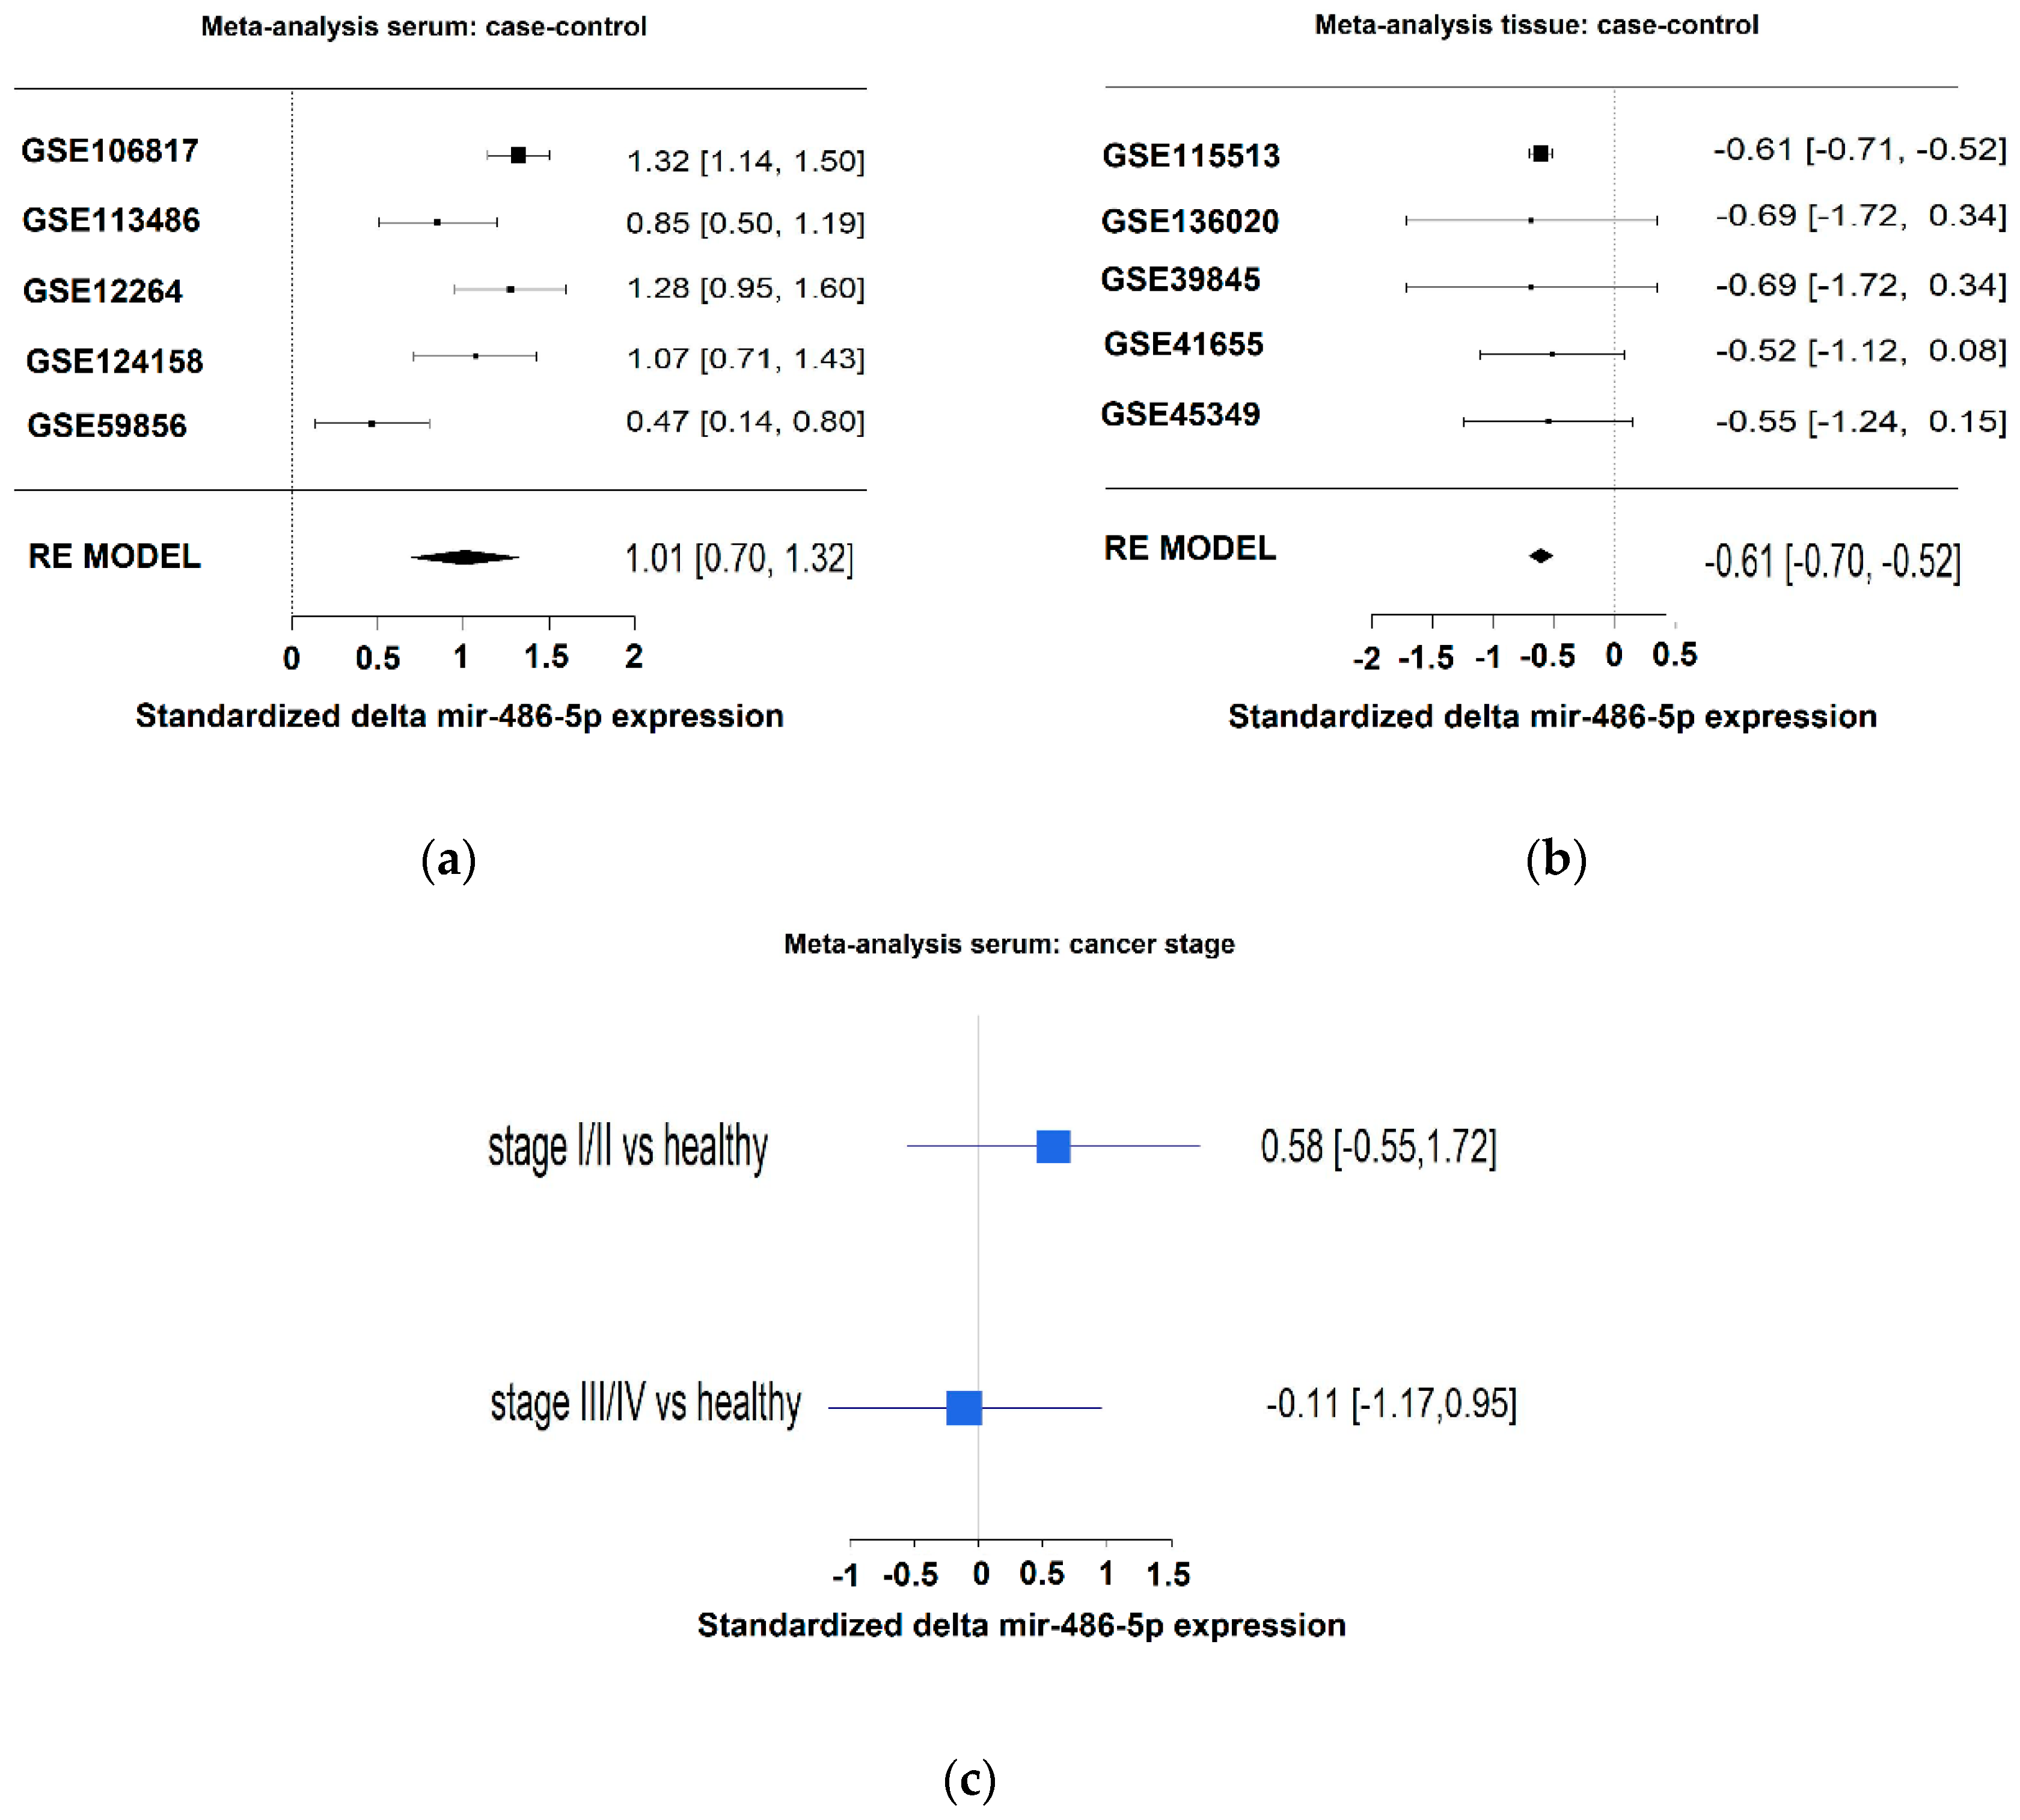
2.4. Meta-Analysis
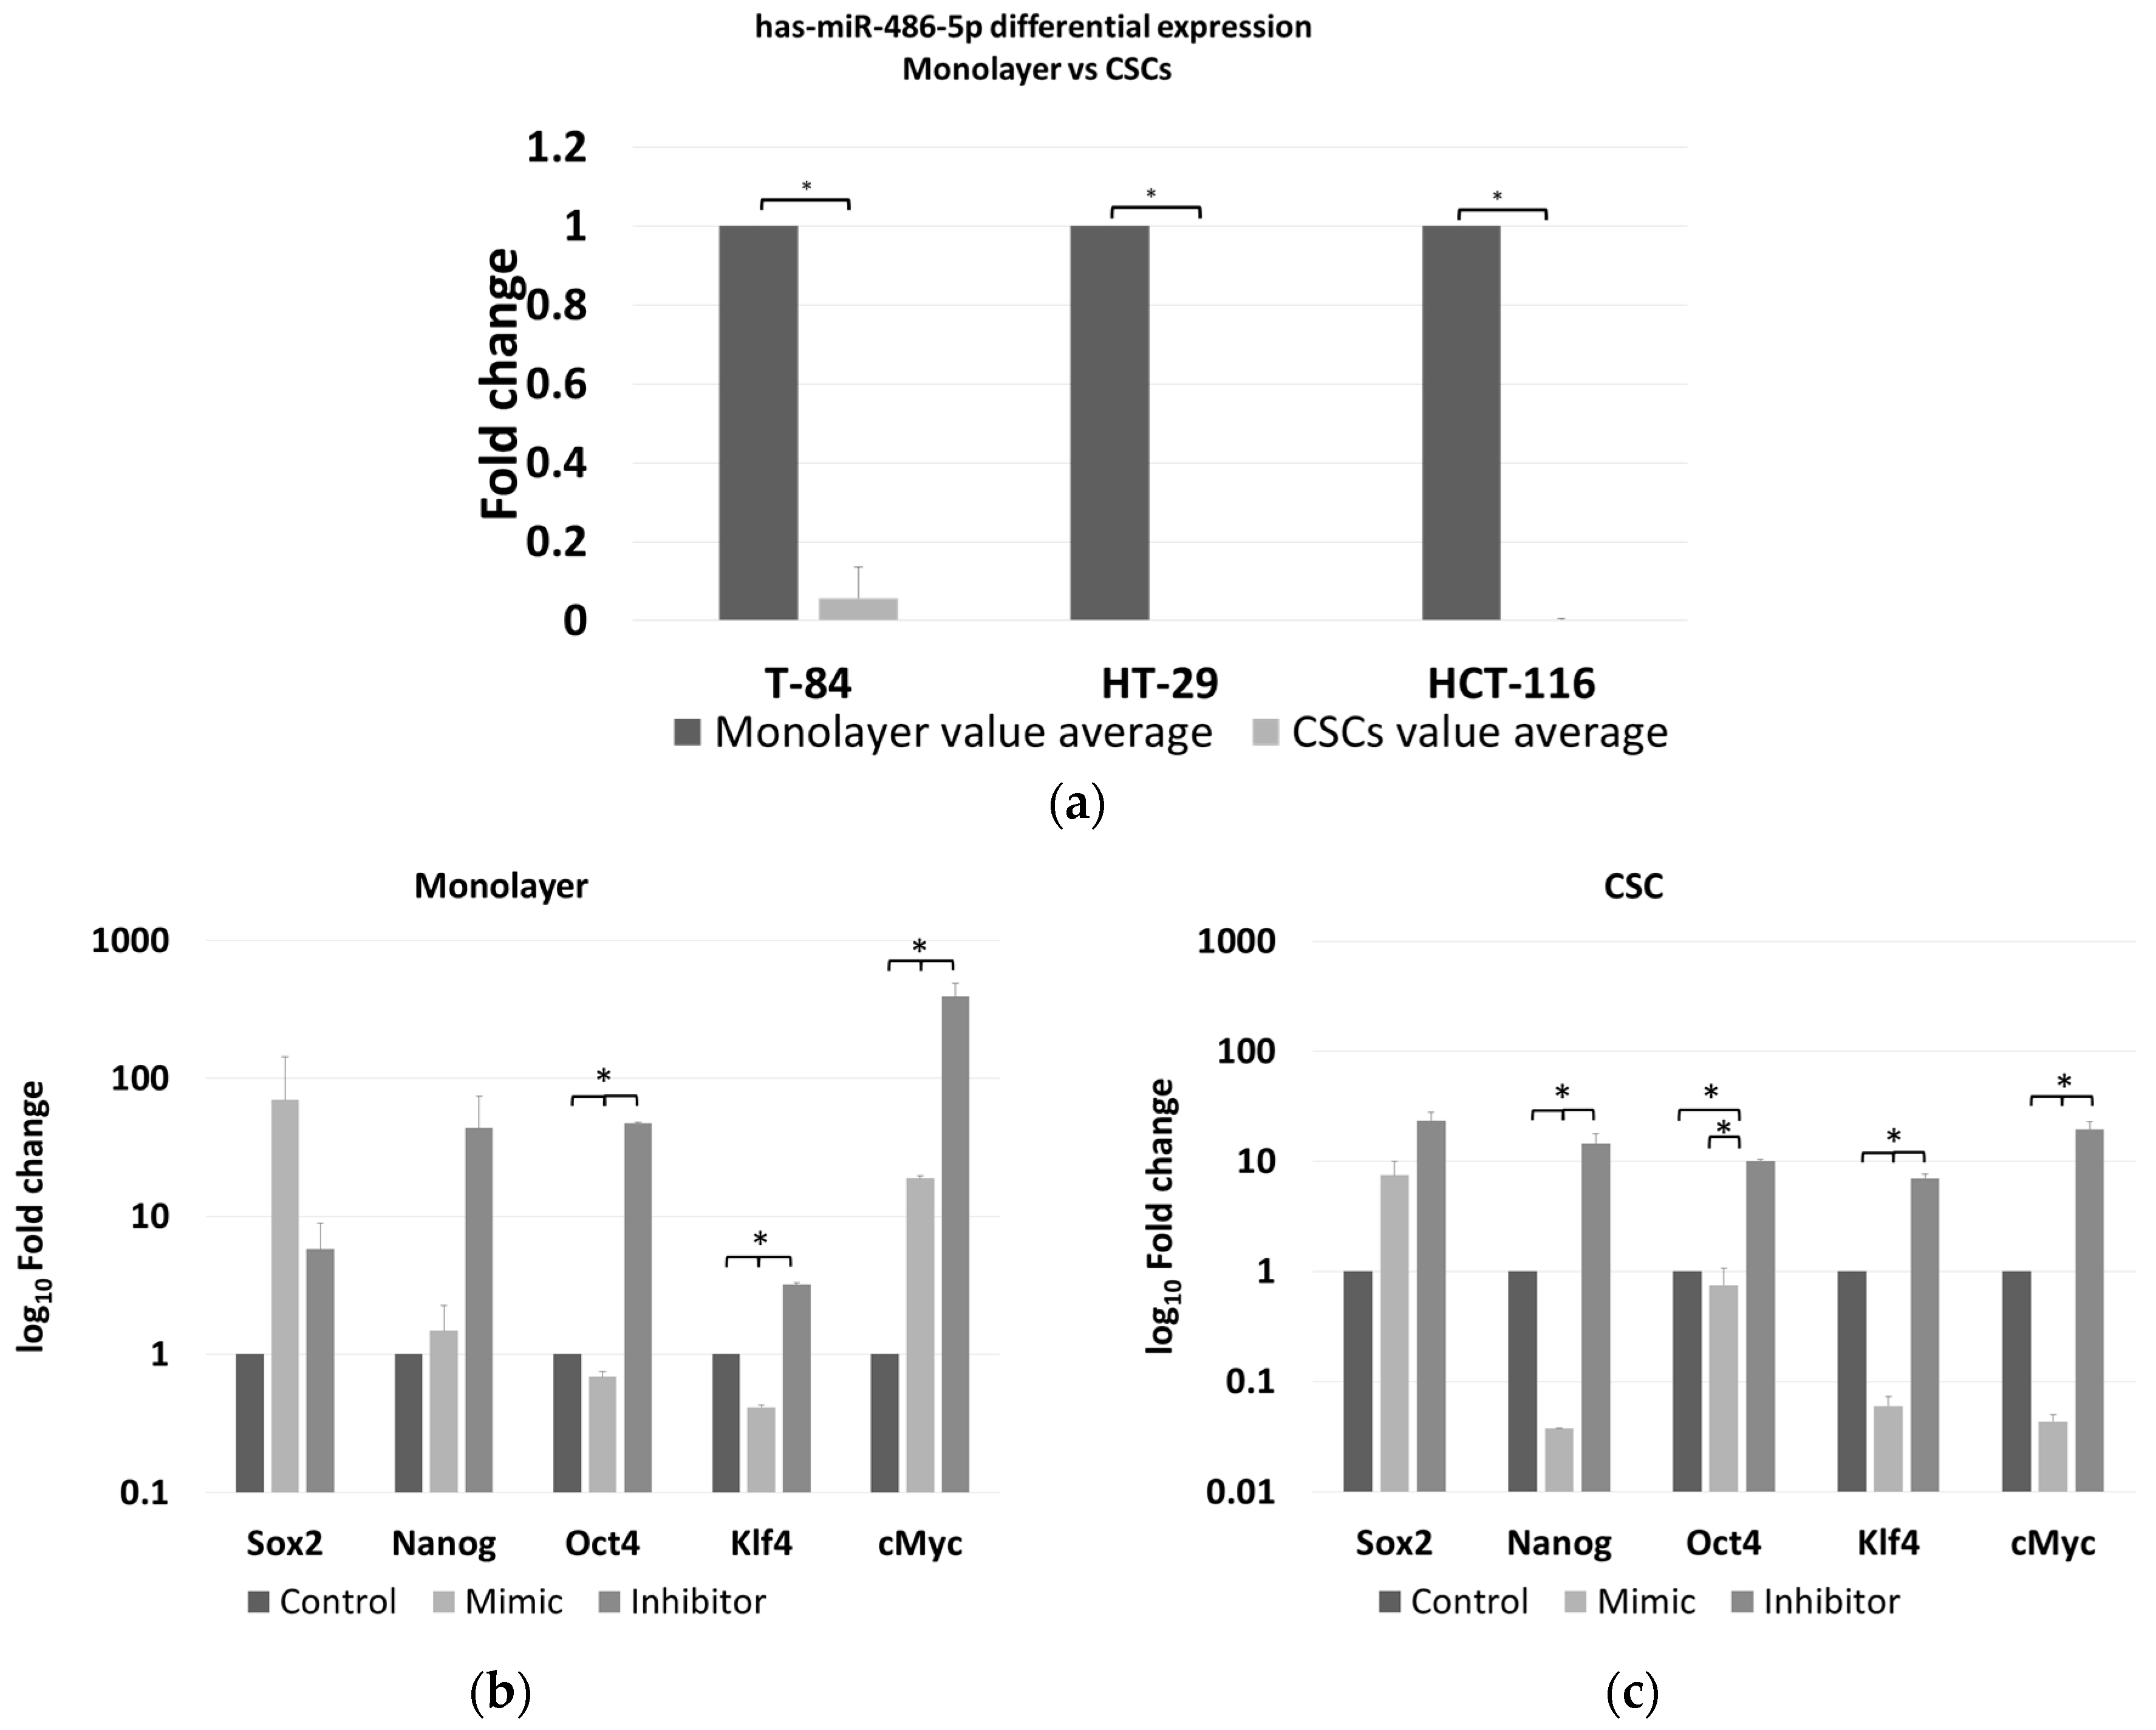
2.5. miR-486-5p Expression in Cell Lines by Real-Time RT–PCR Analysis
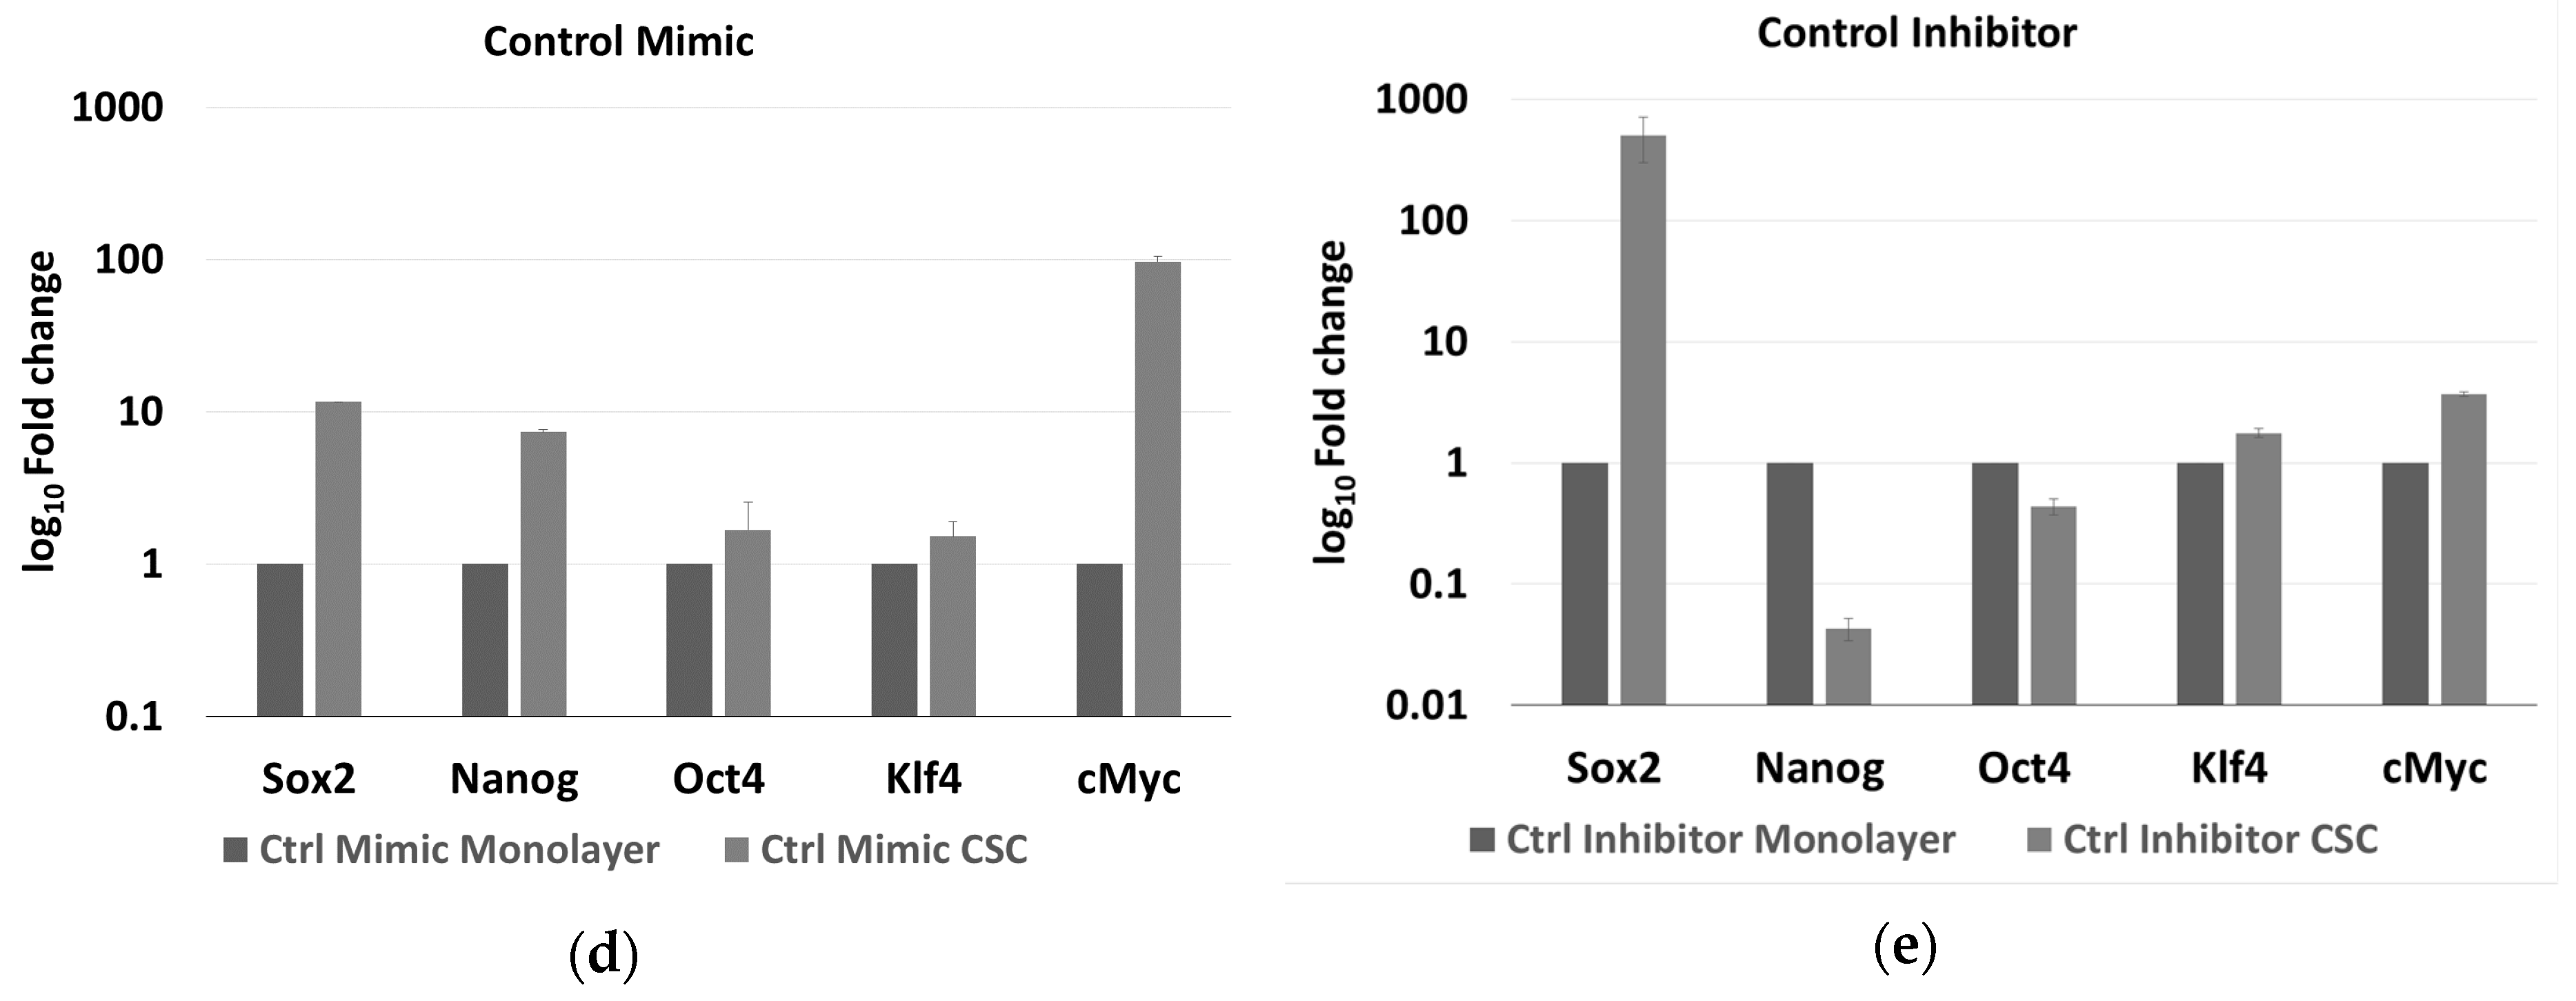
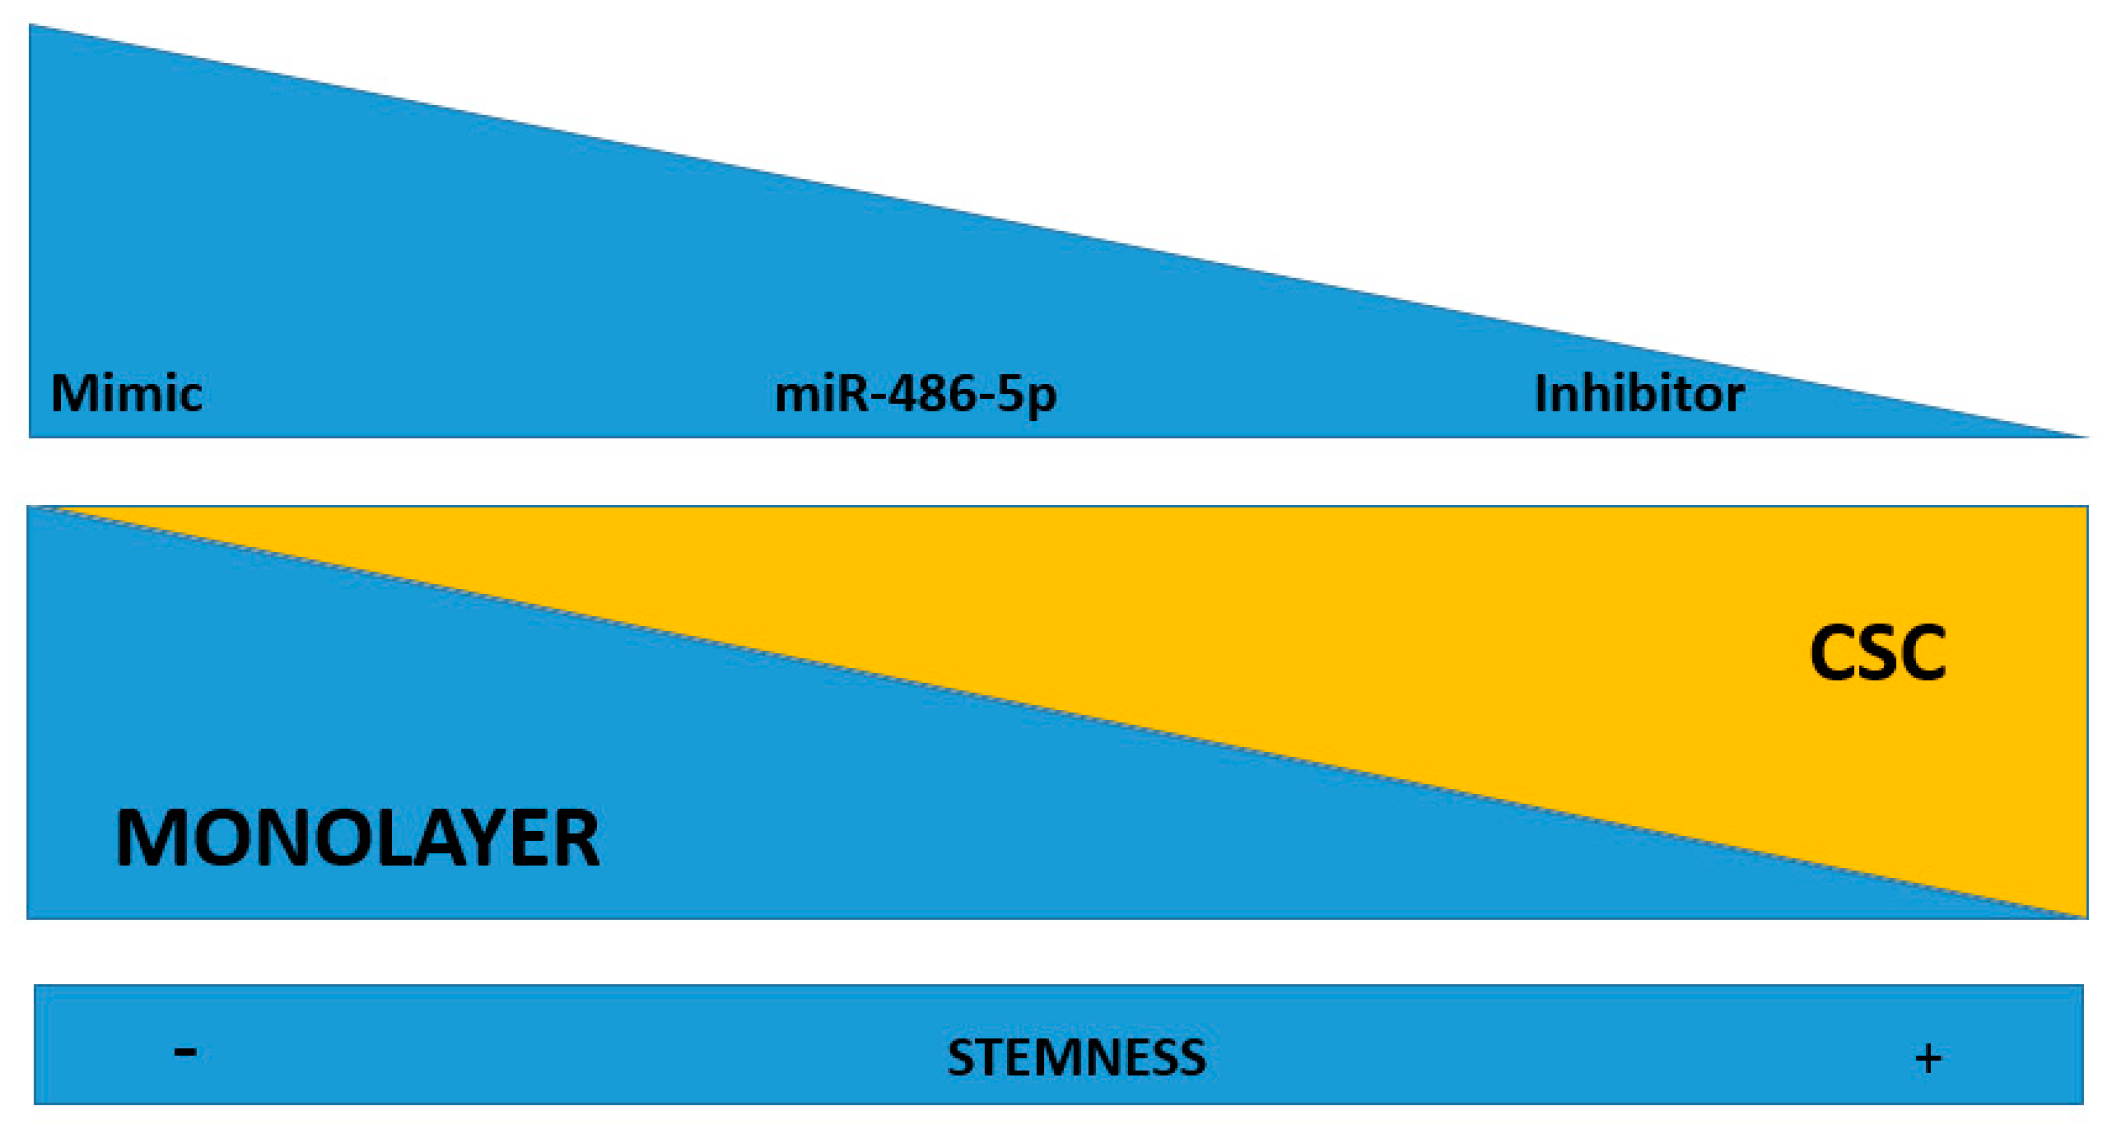
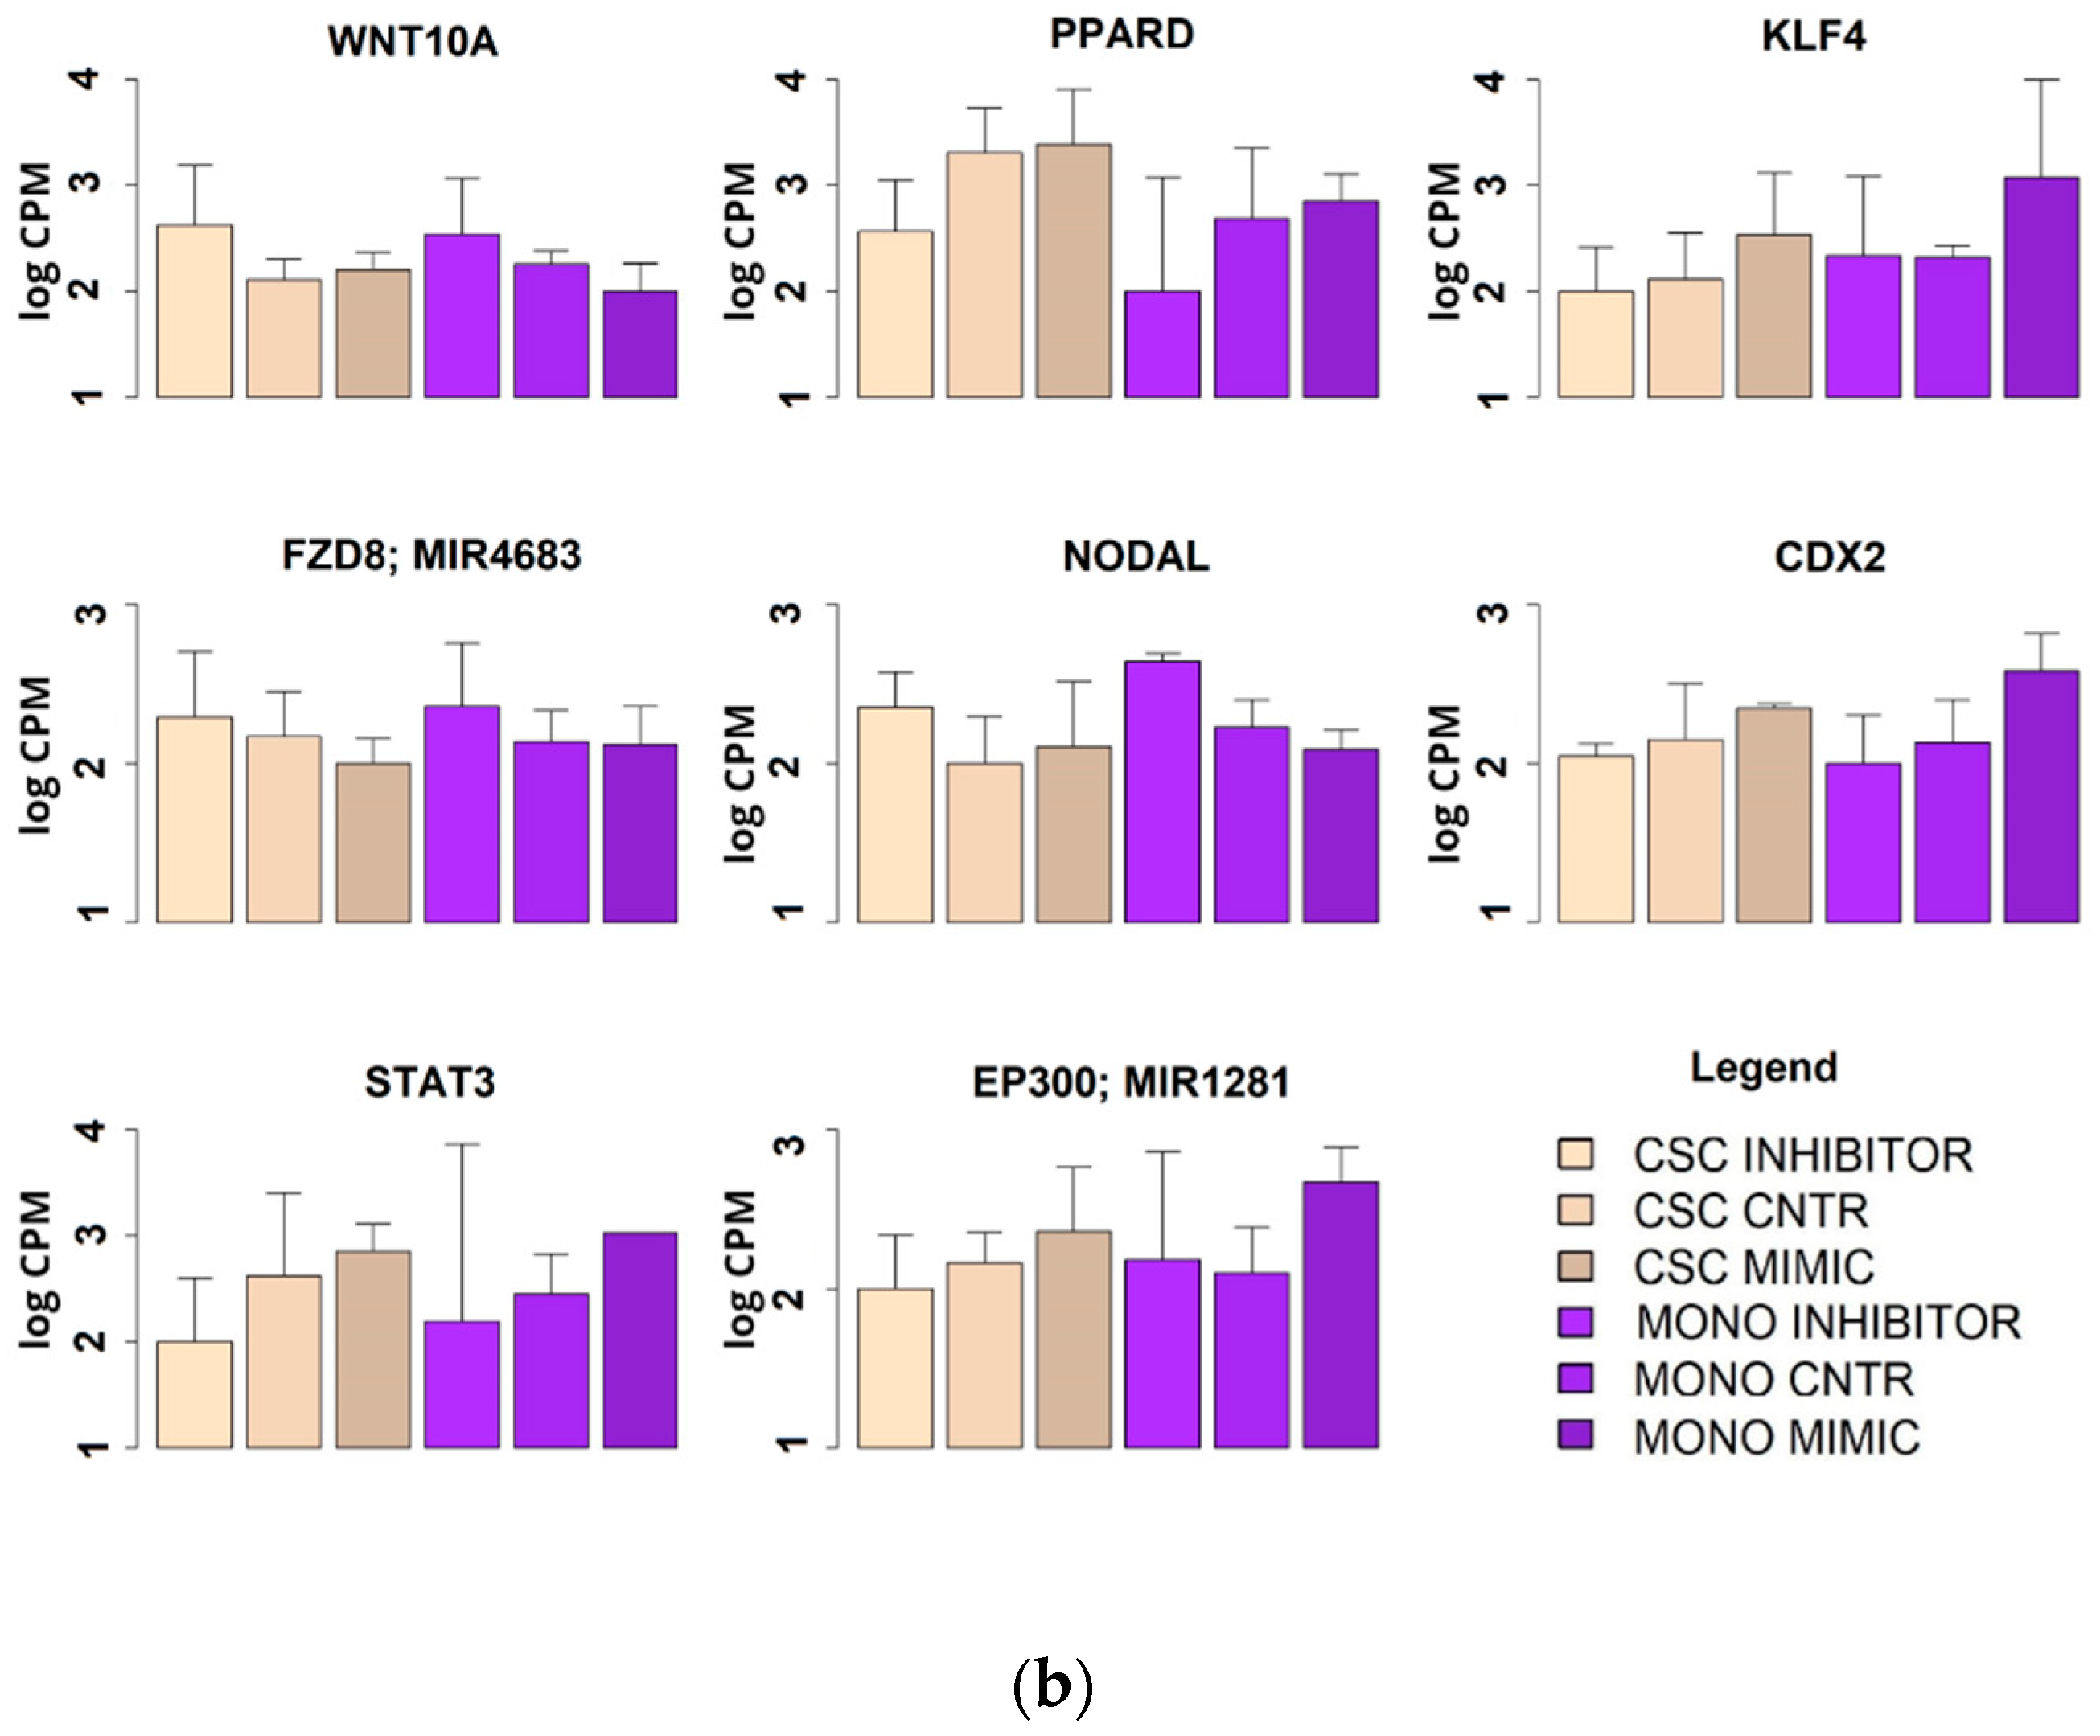
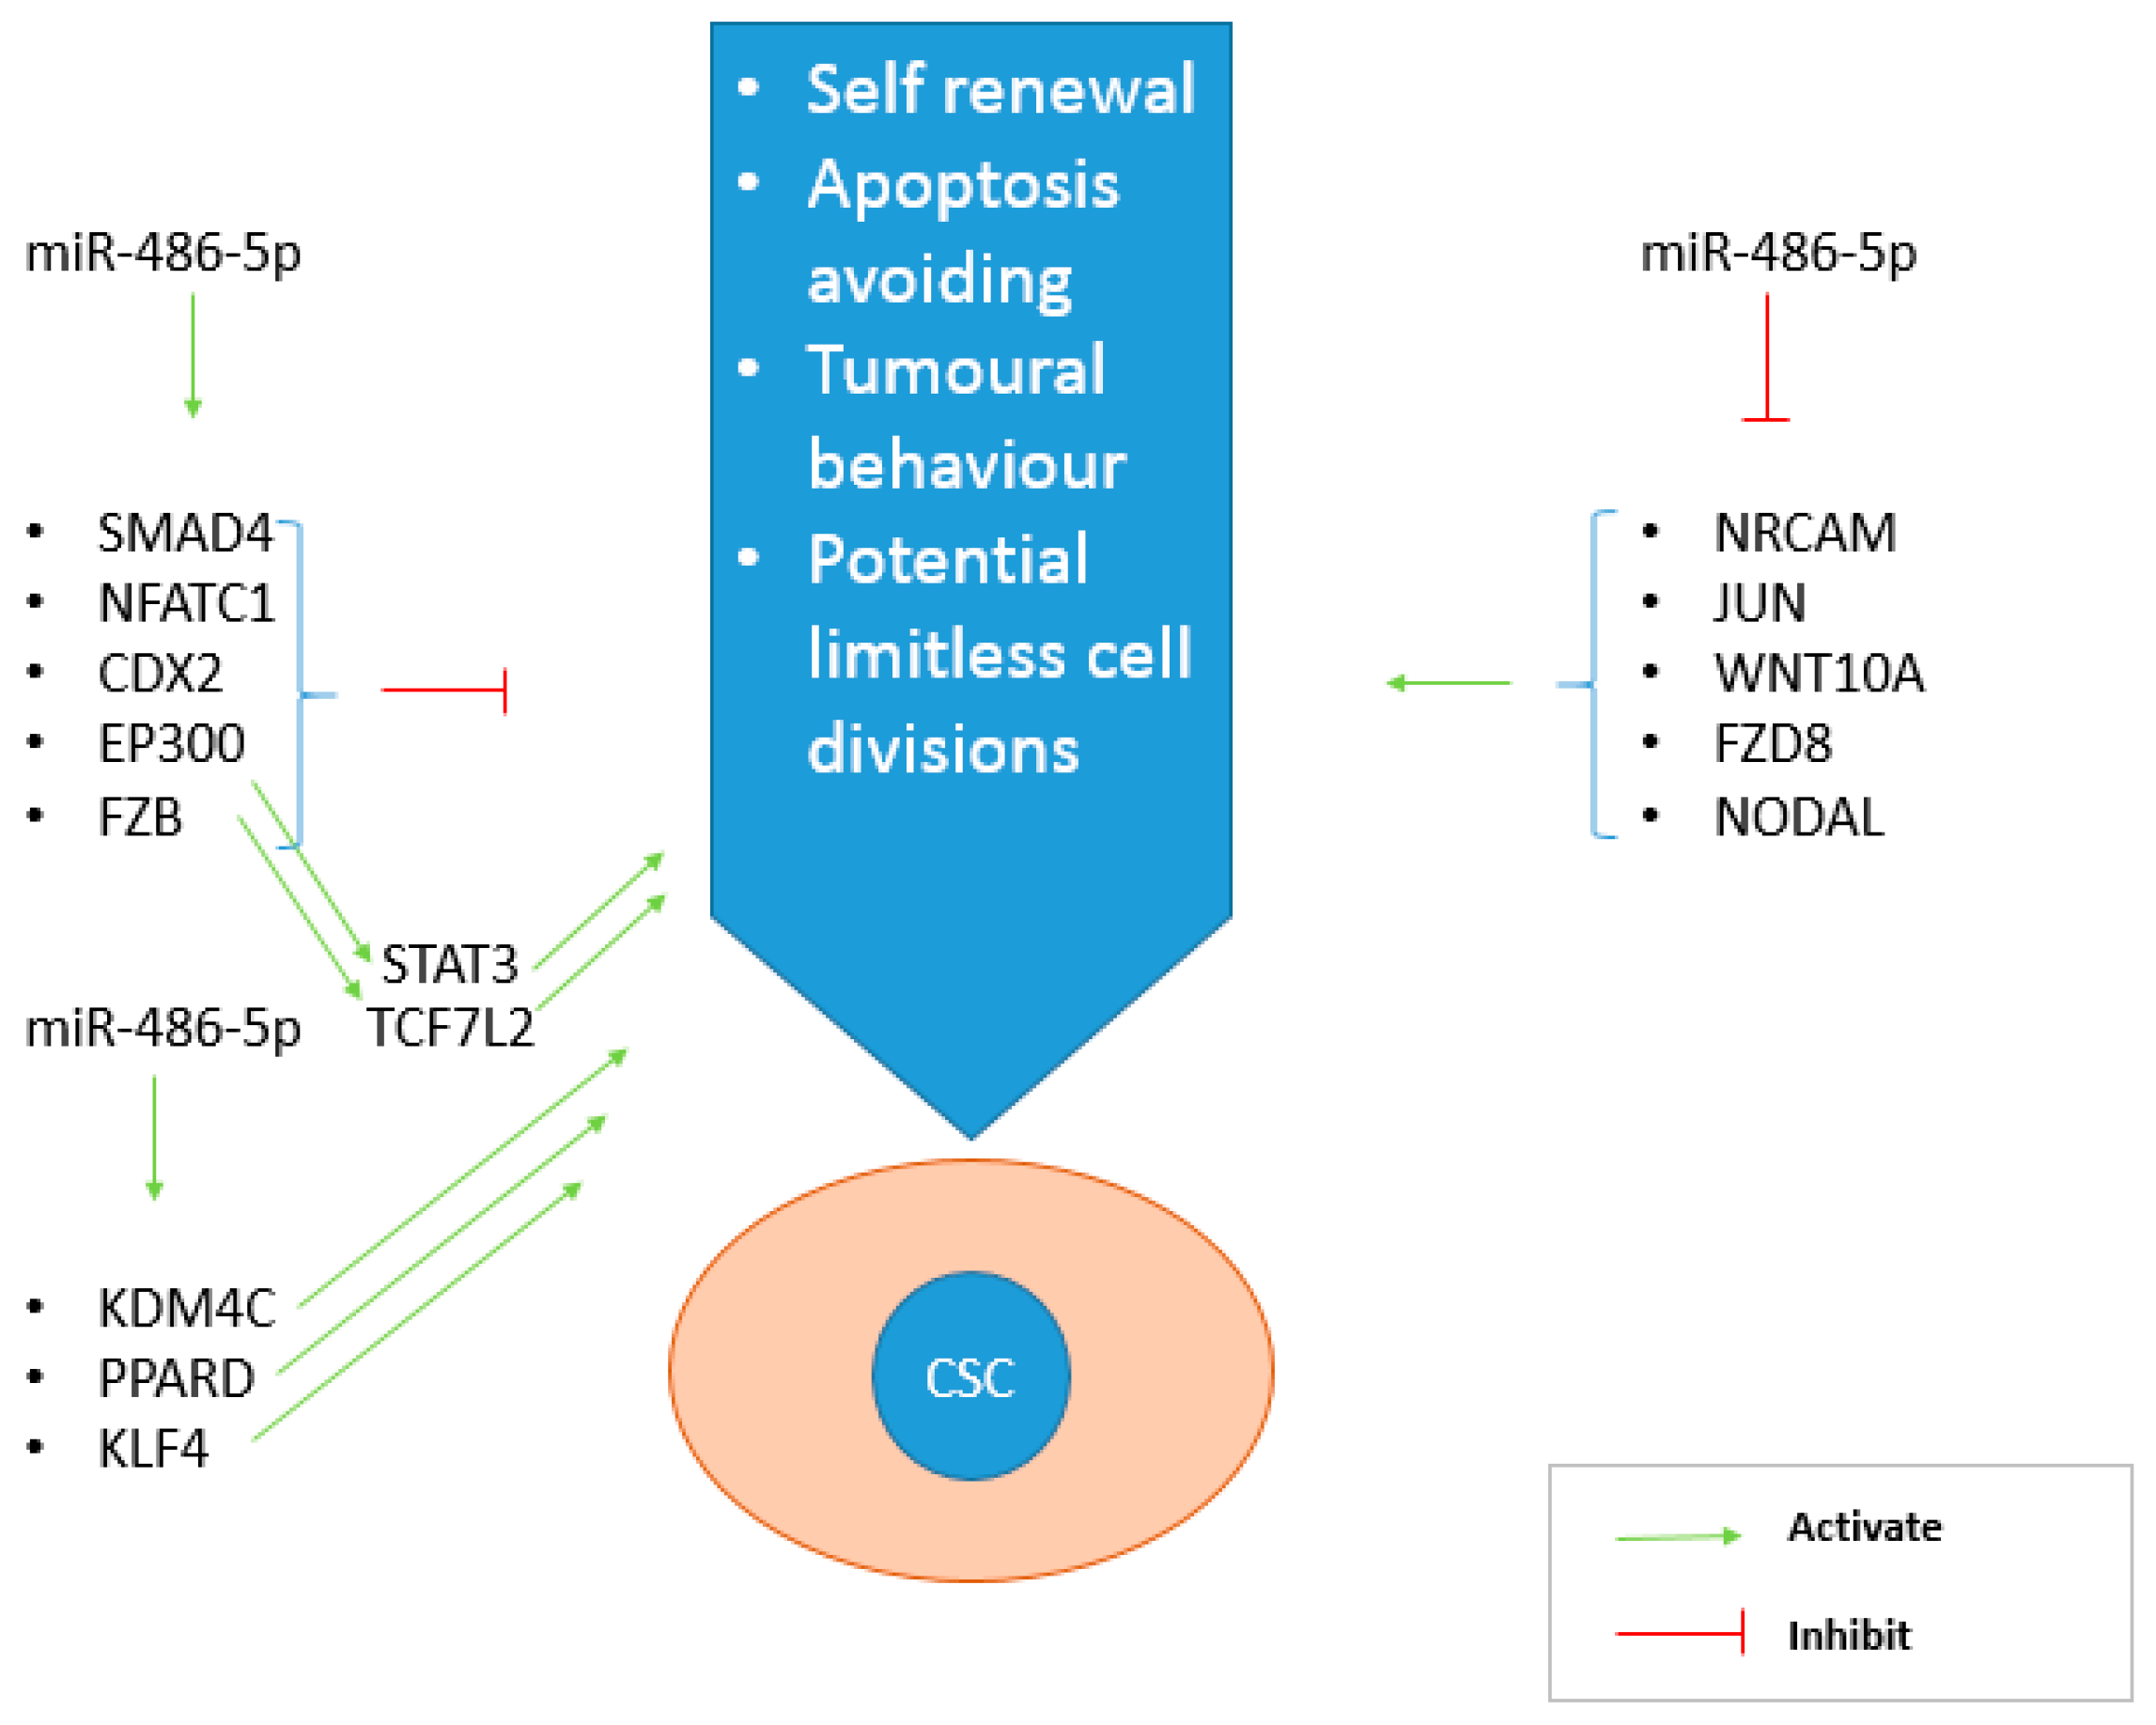
2.6. Effect of miR-486-5p Mimic and Inhibitor on Expression of Stemness Genes
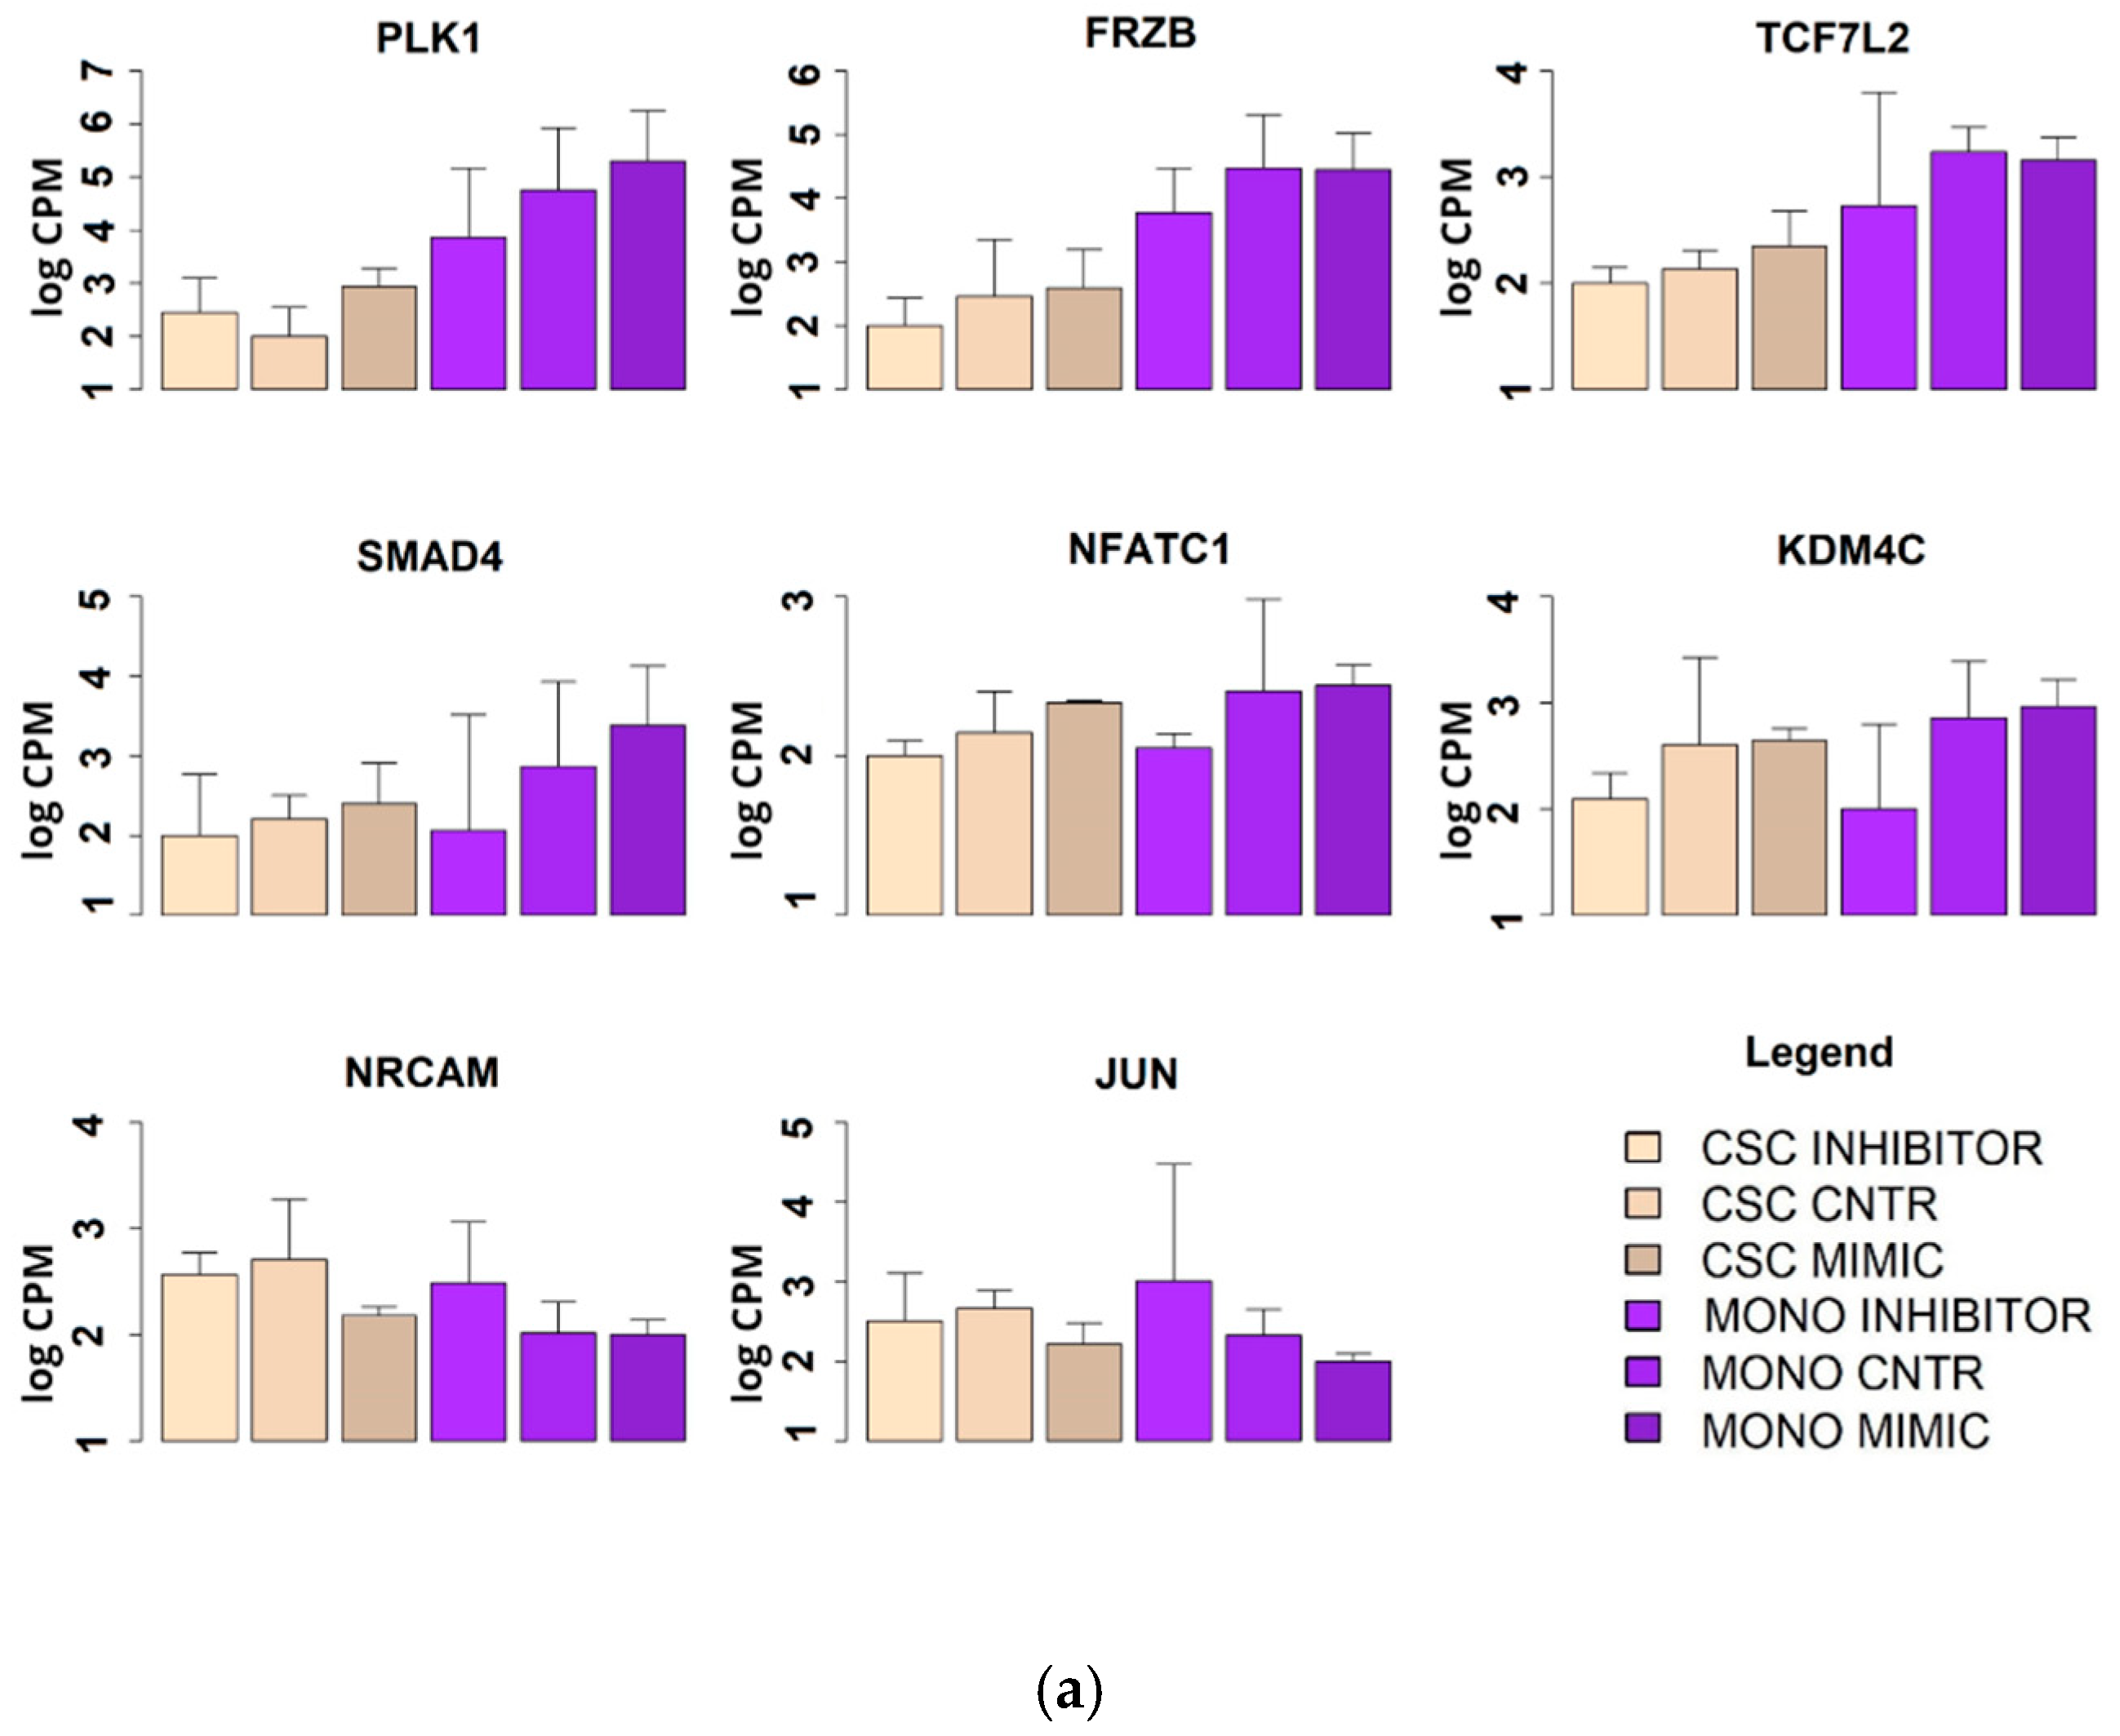
2.7. Microarray Genomic Analysis of the miR-486-5p Effect
3. Discussion
4. Materials and Methods
4.1. Patient Information
4.2. RNA Extraction from Patient Sera and Stool Samples
4.3. Small RNA-Sequencing in Serum
4.4. Real-Time RT-PCR Assay for miRNA Expression Profiling in Sera
4.5. Small RNA-Sequencing in Stool
4.6. Meta-Analysis of miR486-5p Serum and Tissues from public Database
4.7. CRC Cell Lines and CSC Models
4.8. RNA Extraction from Cells
4.9. Real-Time RT–PCR Assay for miRNA Expression in Cells
4.10. Transient Transfection with Synthetic miR-486-5p Mimics and Inhibitors
4.11. Real-Time RT–PCR Assay for Stemness Gene Expression after Treatment with miR-486-5p Mimic or Inhibitor
4.12. Microarray Hybridisation
4.13. Statistical Analysis
5. Conclusions
6. Strengths and Limitations of the Study
Supplementary Materials
Author Contributions
Funding
Conflicts of Interest
References
- Fleming, M.; Ravula, S.; Tatishchev, S.F.; Wang, H.L. Colorectal carcinoma: Pathologic aspects. J. Gastrointest. Oncol. 2012, 3, 153–173. [Google Scholar] [PubMed]
- Bray, F.; Ferlay, J.; Soerjomataram, I.; Siegel, R.L.; Torre, L.A.; Jemal, A. Global cancer statistics 2018: GLOBOCAN estimates of incidence and mortality worldwide for 36 cancers in 185 countries. CA Cancer J. Clin. 2018, 68, 394–424. [Google Scholar] [CrossRef] [PubMed] [Green Version]
- Arnold, M.; Sierra, M.S.; Laversanne, M.; Soerjomataram, I.; Jemal, A.; Bray, F. Global patterns and trends in colorectal cancer incidence and mortality. Gut 2017, 66, 683–691. [Google Scholar] [CrossRef] [PubMed] [Green Version]
- Wicha, M.S.; Liu, S.; Dontu, G. Cancer stem cells: An old idea—A paradigm shift. Cancer Res. 2006, 66, 1883–1890. [Google Scholar] [CrossRef] [Green Version]
- Lapidot, T.; Sirard, C.; Vormoor, J.; Murdoch, B.; Hoang, T.; Caceres-Cortes, J.; Minden, M.; Paterson, B.; Caligiuri, M.A.; Dick, J.E. A cell initiating human acute myeloid leukaemia after transplantation into SCID mice. Nature 1994, 367, 645–648. [Google Scholar] [CrossRef]
- Vaiopoulos, A.G.; Kostakis, I.D.; Koutsilieris, M.; Papavassiliou, A.G. Concise review: Colorectal cancer stem cells. Stem Cells 2012, 30, 363–371. [Google Scholar] [CrossRef]
- Marjanovic, N.D.; Weinberg, R.A.; Chaffer, C.L. Cell plasticity and heterogeneity in cancer. Clin. Chem. 2013, 59, 168–179. [Google Scholar] [CrossRef] [Green Version]
- Merlos-Suárez, A.; Barriga, F.M.; Jung, P.; Iglesias, M.; Céspedes, M.V.; Rossell, D.; Sevillano, M.; Hernando-Momblona, X.; Da Silva-Diz, V.; Muñoz, P.; et al. The intestinal stem cell signature identifies colorectal cancer stem cells and predicts disease relapse. Cell Stem Cell 2011, 8, 511–524. [Google Scholar] [CrossRef] [Green Version]
- Reya, T.; Morrison, S.J.; Clarke, M.F.; Weissman, I.L. Stem cells, cancer, and cancer stem cells. Nature 2001, 414, 105–111. [Google Scholar] [CrossRef] [Green Version]
- Singh, A.; Settleman, J. EMT, cancer stem cells and drug resistance: An emerging axis of evil in the war on cancer. Oncogene 2010, 29, 4741–4751. [Google Scholar] [CrossRef] [Green Version]
- Lansdorp-Vogelaar, I.; Karsa, L. Von European guidelines for quality assurance in colorectal cancer screening and diagnosis. First Edition Introduction. Endoscopy 2012, 44, SE65–SE87. [Google Scholar]
- Grossi, G. Linee Guida AIOM 2019 TUMORI DEL COLON; AIOM: Milan, Italy, 2019; pp. 1–25. [Google Scholar]
- Smith, R.A.; Andrews, K.S.; Brooks, D.; Fedewa, S.A.; Manassaram-Baptiste, D.; Saslow, D.; Wender, R.C. Cancer screening in the United States, 2019: A review of current American Cancer Society guidelines and current issues in cancer screening. CA Cancer J. Clin. 2019, 69, 184–210. [Google Scholar] [CrossRef] [PubMed]
- Walter, B.; Klare, P.; Strehle, K.; Aschenbeck, J.; Ludwig, L.; Dikopoulos, N.; Mayr, M.; Neu, B.; Hann, A.; Mayer, B.; et al. Improving the quality and acceptance of colonoscopy preparation by reinforced patient education with short message service: Results from a randomized, multicenter study (PERICLES-II). Gastrointest. Endosc. 2019. [Google Scholar] [CrossRef] [PubMed]
- Imaoka, H.; Toiyama, Y.; Fujikawa, H.; Hiro, J.; Saigusa, S.; Tanaka, K.; Inoue, Y.; Mohri, Y.; Mori, T.; Kato, T.; et al. Circulating microRNA-1290 as a novel diagnostic and prognostic biomarker in human colorectal cancer. Ann. Oncol. 2016, 27, 1879–1886. [Google Scholar] [CrossRef] [PubMed]
- Toden, S.; Kunitoshi, S.; Cardenas, J.; Gu, J.; Hutchins, E.; Van Keuren-Jensen, K.; Uetake, H.; Toiyama, Y.; Goel, A. Cancer stem cell–associated miRNAs serve as prognostic biomarkers in colorectal cancer. JCI Insight 2019, 4, e125294. [Google Scholar] [CrossRef] [Green Version]
- Gupta, S.K.; Bang, C.; Thum, T. Circulating MicroRNAs as biomarkers and potential paracrine mediators of cardiovascular disease. Circ. Cardiovasc. Genet. 2010, 3, 484–488. [Google Scholar] [CrossRef] [Green Version]
- Chakraborty, C.; Doss, C.G.P.; Bandyopadhyay, S.; Agoramoorthy, G. Influence of miRNA in insulin signaling pathway and insulin resistance: Micro-molecules with a major role in type-2 diabetes. Wiley Interdiscip. Rev. RNA 2014, 5, 697–712. [Google Scholar] [CrossRef]
- Farace, C.; Pisano, A.; Griñan-Lison, C.; Solinas, G.; Jiménez, G.; Serra, M.; Carrillo, E.; Scognamillo, F.; Attene, F.; Montella, A.; et al. Deregulation of cancer-stem-cell-associated miRNAs in tissues and sera of colorectal cancer patients. Oncotarget 2020, 11, 116–130. [Google Scholar] [CrossRef] [Green Version]
- Cottonham, C.L.; Kaneko, S.; Xu, L. miR-21 and miR-31 converge on TIAM1 to regulate migration and invasion of colon carcinoma cells. J. Biol. Chem. 2010, 285, 35293–35302. [Google Scholar] [CrossRef] [Green Version]
- Cai, M.H.; Xu, X.G.; Yan, S.L.; Sun, Z.; Ying, Y.; Wang, B.K.; Tu, Y.X. Regorafenib suppresses colon tumorigenesis and the generation of drug resistant cancer stem-like cells via modulation of miR-34a associated signaling. J. Exp. Clin. Cancer Res. 2018, 37, 151. [Google Scholar] [CrossRef] [Green Version]
- Yan, X.; Liu, X.; Wang, Z.; Cheng, Q.; Ji, G.; Yang, H.; Wan, L.; Ge, C.; Zeng, Q.; Huang, H.; et al. MicroRNA-486-5p functions as a tumor suppressor of proliferation and cancer stem-like cell properties by targeting Sirt1 in liver cancer. Oncol. Rep. 2019, 41, 1938–1948. [Google Scholar] [CrossRef] [PubMed] [Green Version]
- Zhang, X.; Zhang, T.; Yang, K.; Zhang, M.; Wang, K. miR-486-5p suppresses prostate cancer metastasis by targeting snail and regulating epithelial–mesenchymal transition. OncoTargets Ther. 2016, 9, 6909–6914. [Google Scholar] [CrossRef] [PubMed] [Green Version]
- Liu, X.; Chen, X.; Zeng, K.; Xu, M.; He, B.; Pan, Y.; Sun, H.; Pan, B.; Xu, X.; Xu, T.; et al. DNA-methylation-mediated silencing of miR-486-5p promotes colorectal cancer proliferation and migration through activation of PLAGL2/IGF2/β-catenin signal pathways. Cell Death Dis. 2018, 9, 1037. [Google Scholar] [CrossRef] [PubMed] [Green Version]
- Yan, S.; Han, B.; Gao, S.; Wang, X.; Wang, Z.; Wang, F.; Zhang, J.; Xu, D.; Sun, B. Exosome-encapsulated microRNAs as circulating biomarkers for colorectal cancer. Oncotarget 2017, 8, 60149–60158. [Google Scholar] [CrossRef] [PubMed] [Green Version]
- Barrett, T.; Wilhite, S.E.; Ledoux, P.; Evangelista, C.; Kim, I.F.; Tomashevsky, M.; Marshall, K.A.; Phillippy, K.H.; Sherman, P.M.; Holko, M.; et al. NCBI GEO: Archive for functional genomics data sets—Update. Nucleic Acids Res. 2013, 41, D991–D995. [Google Scholar] [CrossRef] [Green Version]
- Yao, K.; Gietema, J.A.; Shida, S.; Selvakumaran, M.; Fonrose, X.; Haas, N.B.; Testa, J.; O’Dwyer, P.J. In Vitro hypoxia-conditioned colon cancer cell lines derived from HCT116 and HT29 exhibit altered apoptosis susceptibility and a more angiogenic profile in Vivo. Br. J. Cancer 2005, 93, 1356–1363. [Google Scholar] [CrossRef] [Green Version]
- Świtlik, W.Z.; Karbownik, M.S.; Suwalski, M.; Kozak, J.; Szemraj, J. Serum miR-210-3p as a Potential Noninvasive Biomarker of Lung Adenocarcinoma: A Preliminary Study. Genet. Test. Mol. Biomark. 2019, 23, 353–358. [Google Scholar] [CrossRef]
- Wu, C.W.; Cao, X.; Berger, C.K.; Foote, P.H.; Mahoney, D.W.; Simonson, J.A.; Anderson, B.W.; Yab, T.C.; Taylor, W.R.; Boardman, L.A.; et al. Novel Approach to Fecal Occult Blood Testing by Assay of Erythrocyte-Specific microRNA Markers. Dig. Dis. Sci. 2017, 62, 1985–1994. [Google Scholar] [CrossRef]
- Pigati, L.; Yaddanapudi, S.C.S.; Iyengar, R.; Kim, D.J.; Hearn, S.A.; Danforth, D.; Hastings, M.L.; Duelli, D.M. Selective release of MicroRNA species from normal and malignant mammary epithelial cells. PLoS ONE 2010, 5, e13515. [Google Scholar] [CrossRef] [Green Version]
- Pardini, B.; Calin, G.A. MicroRNAs and long non-coding RNAs and their hormone-like activities in cancer. Cancers 2019, 11, 378. [Google Scholar] [CrossRef] [Green Version]
- Pardini, B.; Sabo, A.A.; Birolo, G.; Calin, G.A. Noncoding rnas in extracellular fluids as cancer biomarkers: The new frontier of liquid biopsies. Cancers 2019, 11, 1170. [Google Scholar] [CrossRef] [PubMed] [Green Version]
- Turchinovich, A.; Weiz, L.; Langheinz, A.; Burwinkel, B. Characterization of extracellular circulating microRNA. Nucleic Acids Res. 2011, 39, 7223–7233. [Google Scholar] [CrossRef] [PubMed]
- Kamal, N.N.S.B.N.M.; Shahidan, W.N.S. Non-exosomal and exosomal circulatory MicroRNAs: Which are more valid as biomarkers? Front. Pharmacol. 2020, 10, 1500. [Google Scholar] [CrossRef] [PubMed] [Green Version]
- Niculescu, L.S.; Simionescu, N.; Sanda, G.M.; Carnuta, M.G.; Stancu, C.S.; Popescu, A.C.; Popescu, M.R.; Vlad, A.; Dimulescu, D.R.; Simionescu, M.; et al. MiR-486 and miR-92a Identified in Circulating HDL Discriminate between Stable and Vulnerable Coronary Artery Disease Patients. PLoS ONE 2015, 10, e0140958. [Google Scholar] [CrossRef] [PubMed]
- Redis, R.S.; Calin, S.; Yang, Y.; You, M.J.; Calin, G.A. Cell-to-cell miRNA transfer: From body homeostasis to therapy. Pharmacol. Ther. 2012, 136, 169–174. [Google Scholar] [CrossRef] [Green Version]
- Arroyo, J.D.; Chevillet, J.R.; Kroh, E.M.; Ruf, I.K.; Pritchard, C.C.; Gibson, D.F.; Mitchell, P.S.; Bennett, C.F.; Pogosova-Agadjanyan, E.L.; Stirewalt, D.L.; et al. Argonaute2 complexes carry a population of circulating microRNAs independent of vesicles in human plasma. Proc. Natl. Acad. Sci. USA 2011, 108, 5003–5008. [Google Scholar] [CrossRef] [Green Version]
- Zhang, M.; Zhao, X.; Cai, X.; Wang, P.; Yu, M.; Wei, Z. Knockdown of long non-coding RNA plasmacytoma variant translocation 1 inhibits cell proliferation while promotes cell apoptosis via regulating miR-486-mediated CDK4 and BCAS2 in multiple myeloma. Ir. J. Med Sci. 2020, 189, 825–834. [Google Scholar] [CrossRef]
- Lopez-Bertoni, H.; Kotchetkov, I.S.; Mihelson, N.; Lal, B.; Rui, Y.; Ames, H.; Lugo-Fagundo, M.; Guerrero-Cazares, H.; Quinones-Hinojosa, A.; Green, J.J.; et al. A Sox2:miR-486-5p axis regulates survival of GBM cells by inhibiting tumor suppressor networks. Cancer Res. 2020, 80, 1644–1655. [Google Scholar] [CrossRef] [Green Version]
- Takahashi, K.; Yamanaka, S. Induction of Pluripotent Stem Cells from Mouse Embryonic and Adult Fibroblast Cultures by Defined Factors. Cell 2006, 126, 663–676. [Google Scholar] [CrossRef] [Green Version]
- Pan, G.; Thomson, J.A. Nanog and transcriptional networks in embryonic stem cell pluripotency. Cell Res. 2007, 17, 42–49. [Google Scholar] [CrossRef]
- Hadjimichael, C.; Chanoumidou, K.; Papadopoulou, N.; Arampatzi, P.; Papamatheakis, J.; Kretsovali, A. Common stemness regulators of embryonic and cancer stem cells. World J. Stem Cells 2015, 7, 1150–11584. [Google Scholar] [CrossRef] [PubMed]
- Leng, Z.; Tao, K.; Xia, Q.; Tan, J.; Yue, Z.; Chen, J.; Xi, H.; Li, J.; Zheng, H. Krüppel-Like Factor 4 Acts as an Oncogene in Colon Cancer Stem Cell-Enriched Spheroid Cells. PLoS ONE 2013, 8, e56082. [Google Scholar] [CrossRef] [PubMed] [Green Version]
- Dang, D.T.; Chen, X.; Feng, J.; Torbenson, M.; Dang, L.H.; Yang, V.W. Overexpression of Krüppel-like factor 4 in the human colon cancer cell line RKO leads to reduced tumorigenecity. Oncogene 2003, 22, 3424–3430. [Google Scholar] [CrossRef] [PubMed] [Green Version]
- Zhang, W.; Chen, X.; Kato, Y.; Evans, P.M.; Yuan, S.; Yang, J.; Rychahou, P.G.; Yang, V.W.; He, X.; Evers, B.M.; et al. Novel Cross Talk of Krüppel-Like Factor 4 and β-Catenin Regulates Normal Intestinal Homeostasis and Tumor Repression. Mol. Cell. Biol. 2006, 26, 2055–2064. [Google Scholar] [CrossRef] [Green Version]
- Kim, R.-J.; Nam, J.-S. OCT4 Expression Enhances Features of Cancer Stem Cells in a Mouse Model of Breast Cancer. Lab. Anim. Res. 2011, 27, 147. [Google Scholar] [CrossRef] [Green Version]
- Amini, S.; Fathi, F.; Mobalegi, J.; Sofimajidpour, H.; Ghadimi, T. The expressions of stem cell markers: Oct4, Nanog, Sox2, nucleostemin, Bmi, Zfx, Tcl1, Tbx3, Dppa4, and Esrrb in bladder, colon, and prostate cancer, and certain cancer cell lines. Anat. Cell Biol. 2014, 47, 1–11. [Google Scholar] [CrossRef] [Green Version]
- Ibrahim, E.E.; Babaei-Jadidi, R.; Saadeddin, A.; Spencer-Dene, B.; Hossaini, S.; Abuzinadah, M.; Li, N.; Fadhil, W.; Ilyas, M.; Bonnet, D.; et al. Embryonic NANOG activity defines colorectal cancer stem cells and modulates through AP1- and TCF-dependent mechanisms. Stem Cells 2012, 30, 2076–2087. [Google Scholar] [CrossRef]
- Klapproth, K.; Wirth, T. Advances in the understanding of MYC-induced lymphomagenesis. Br. J. Haematol. 2010, 149, 484–497. [Google Scholar] [CrossRef]
- Xu, B.S.; Chen, H.Y.; Que, Y.; Xiao, W.; Zeng, M.S.; Zhang, X. ALKATI interacts with c-Myc and promotes cancer stem cell-like properties in sarcoma. Oncogene 2020, 39, 151–163. [Google Scholar] [CrossRef]
- Su, C.; Li, D.; Li, N.; Du, Y.; Yang, C.; Bai, Y.; Lin, C.; Li, X.; Zhang, Y. Studying the mechanism of PLAGL2 overexpression and its carcinogenic characteristics based on 3’-untranslated region in colorectal cancer. Int. J. Oncol. 2018, 52, 1479–1490. [Google Scholar] [CrossRef] [Green Version]
- Vlachos, I.S.; Kostoulas, N.; Vergoulis, T.; Georgakilas, G.; Reczko, M.; Maragkakis, M.; Paraskevopoulou, M.D.; Prionidis, K.; Dalamagas, T.; Hatzigeorgiou, A.G. DIANA miRPath v.2.0: Investigating the combinatorial effect of microRNAs in pathways. Nucleic Acids Res. 2012, 40, W498–W504. [Google Scholar] [CrossRef] [PubMed]
- Meng, H.M.; Zheng, P.; Wang, X.Y.; Liu, C.; Sui, H.M.; Wu, S.J.; Zhou, J.; Ding, Y.Q.; Li, J.M. Overexpression of nanog predicts tumor progression and poor prognosis in colorectal cancer. Cancer Biol. Ther. 2010, 9, 295–302. [Google Scholar] [CrossRef] [PubMed] [Green Version]
- Nagata, T.; Shimada, Y.; Sekine, S.; Hori, R.; Matsui, K.; Okumura, T.; Sawada, S.; Fukuoka, J.; Tsukada, K. Prognostic significance of NANOG and KLF4 for breast cancer. Breast Cancer 2014, 21, 96–101. [Google Scholar] [CrossRef]
- Talebi, A.; Kianersi, K.; Beiraghdar, M. Comparison of gene expression of SOX2 and OCT4 in normal tissue, polyps, and colon adenocarcinoma using immunohistochemical staining. Adv. Biomed. Res. 2015, 4, 234. [Google Scholar] [CrossRef]
- Qu, Y.; Li, J.F.; Cai, Q.; Wang, Y.W.; Gu, Q.L.; Zhu, Z.G.; Liu, B.Y. Over-expression of FRZB in gastric cancer cell suppresses proliferation and induces differentiation. J. Cancer Res. Clin. Oncol. 2008, 134, 353–364. [Google Scholar] [CrossRef]
- Deshmukh, A.; Arfuso, F.; Newsholme, P.; Dharmarajan, A. Epigenetic demthylation of sFRPs, with emphasis on sFRP4 activation, leading to Wnt signalling suppression and histone modifications in breast, prostate, and ovary cancer stem cells. Int. J. Biochem. Cell Biol. 2019, 109, 23–32. [Google Scholar] [CrossRef]
- Zhao, M.; Mishra, L.; Deng, C.X. The role of TGF-β/SMAD4 signaling in cancer. Int. J. Biol. Sci. 2018, 14, 111–123. [Google Scholar] [CrossRef] [Green Version]
- Miyaki, M.; Iijima, T.; Konishi, M.; Sakai, K.; Ishii, A.; Yasuno, M.; Hishima, T.; Koike, M.; Shitara, N.; Iwama, T.; et al. Higher frequency of Smad4 gene mutation in human colorectal cancer with distant metastasis. Oncogene 1999, 18, 3098–3103. [Google Scholar] [CrossRef] [PubMed] [Green Version]
- Pudova, E.A.; Kudryavtseva, A.V.; Fedorova, M.S.; Zaretsky, A.R.; Shcherbo, D.S.; Lukyanova, E.N.; Popov, A.Y.; Sadritdinova, A.F.; Abramov, I.S.; Kharitonov, S.L.; et al. HK3 overexpression associated with epithelial-mesenchymal transition in colorectal cancer. BMC Genom. 2018, 19, 5–13. [Google Scholar] [CrossRef] [PubMed] [Green Version]
- Horsley, V.; Aliprantis, A.O.; Polak, L.; Glimcher, L.H.; Fuchs, E. NFATc1 Balances Quiescence and Proliferation of Skin Stem Cells. Cell 2008, 132, 299–310. [Google Scholar] [CrossRef] [Green Version]
- Suh, E.; Traber, P.G. An intestine-specific homeobox gene regulates proliferation and differentiation. Mol. Cell. Biol. 1996, 16, 619–625. [Google Scholar] [CrossRef] [PubMed] [Green Version]
- Sakamoto, N.; Feng, Y.; Stolfi, C.; Kurosu, Y.; Green, M.; Lin, J.; Green, M.E.; Sentani, K.; Yasui, W.; McMahon, M.; et al. BRAFV600E cooperates with CDX2 inactivation to promote serrated colorectal tumorigenesis. eLife 2017, 6, e20331. [Google Scholar] [CrossRef] [PubMed]
- Chan, H.M.; La Thangue, N.B. p300/CBP proteins: HATs for transcriptional bridges and scaffolds. J. Cell Sci. 2001, 114, 2363–2373. [Google Scholar] [PubMed]
- Krubasik, D.; Iyer, N.G.; English, W.R.; Ahmed, A.A.; Vias, M.; Roskelley, C.; Brenton, J.D.; Caldas, C.; Murphy, G. Absence of p300 induces cellular phenotypic changes characteristic of epithelial to mesenchyme transition. Br. J. Cancer 2006, 94, 1326–1332. [Google Scholar] [CrossRef]
- Conacci-Sorrell, M.E.; Ben-Yedidia, T.; Shtutman, M.; Feinstein, E.; Einat, P.; Ben-Ze’ev, A. Nr-CAM is a target gene of the β-catenin/LEF-1 pathway in melanoma and colon cancer and its expression enhances motility and confers tumorigenesis. Genes Dev. 2002, 16, 2058–2072. [Google Scholar] [CrossRef] [Green Version]
- Yu, J.C.; Hsiung, C.N.; Hsu, H.M.; Bao, B.Y.; Chen, S.T.; Hsu, G.C.; Chou, W.C.; Hu, L.Y.; Ding, S.L.; Cheng, C.W.; et al. Genetic variation in the genome-wide predicted estrogen response element-related sequences is associated with breast cancer development. Breast Cancer Res. 2011, 13, R13. [Google Scholar] [CrossRef] [Green Version]
- Vogt, P.K. Fortuitous convergences: The beginnings of JUN. Nat. Rev. Cancer 2002, 2, 465–469. [Google Scholar] [CrossRef]
- Dong, W.; Cao, Z.; Pang, Y.; Feng, T.; Tian, H. Carf, as an oncogene, promotes colorectal cancer stemness by activating erbb signaling pathway. Onco Targets Ther. 2019, 12, 9041–9051. [Google Scholar] [CrossRef] [Green Version]
- Long, A.; Giroux, V.; Whelan, K.A.; Hamilton, K.E.; Tétreault, M.P.; Tanaka, K.; Lee, J.S.; Klein-Szanto, A.J.; Nakagawa, H.; Rustgi, A.K. WNT10A promotes an invasive and self-renewing phenotype in esophageal squamous cell carcinoma. Carcinogenesis 2015, 36, 598–606. [Google Scholar] [CrossRef] [Green Version]
- Li, J.; Zhang, Z.; Wang, L.; Zhang, Y. The oncogenic role of wnt10a in colorectal cancer through activation of canonical Wnt/β-catenin signaling. Oncol. Lett. 2019, 17, 3657–3664. [Google Scholar] [CrossRef]
- Xu, L.; Wen, T.; Liu, Z.; Xu, F.; Yang, L.; Liu, J.; Feng, G.; An, G. MicroRNA-375 suppresses human colorectal cancer metastasis by targeting Frizzled 8. Oncotarget 2016, 7, 40644–40656. [Google Scholar] [CrossRef] [PubMed] [Green Version]
- Sun, S.; Liu, S.; Duan, S.Z.; Zhang, L.; Zhou, H.; Hu, Y.; Zhou, X.; Shi, C.; Zhou, R.; Zhang, Z. Targeting the c-Met/FZD8 signaling axis eliminates patient-derived cancer stem-like cells in head and neck squamous carcinomas. Cancer Res. 2014, 74, 7546–7559. [Google Scholar] [CrossRef] [PubMed] [Green Version]
- Xiao, L.; Yuan, X.; Sharkis, S.J. Activin A Maintains Self-Renewal and Regulates Fibroblast Growth Factor, Wnt, and Bone Morphogenic Protein Pathways in Human Embryonic Stem Cells. Stem Cells 2006, 24, 1476–1486. [Google Scholar] [CrossRef] [PubMed]
- Lonardo, E.; Hermann, P.C.; Mueller, M.T.; Huber, S.; Balic, A.; Miranda-Lorenzo, I.; Zagorac, S.; Alcala, S.; Rodriguez-Arabaolaza, I.; Ramirez, J.C.; et al. Nodal/activin signaling drives self-renewal and tumorigenicity of pancreatic cancer stem cells and provides a target for combined drug therapy. Cell Stem Cell 2011, 9, 433–446. [Google Scholar] [CrossRef] [PubMed] [Green Version]
- Barr, F.A.; Silljé, H.H.W.; Nigg, E.A. Polo-like kinases and the orchestration of cell division. Nat. Rev. Mol. Cell Biol. 2004, 5, 429–440. [Google Scholar] [CrossRef]
- Donizy, P.; Halon, A.; Surowiak, P.; Kaczorowski, M.; Kozyra, C.; Matkowski, R. Augmented expression of polo-like kinase 1 is a strong predictor of shorter cancer-specific overall survival in early stage breast cancer at 15-year follow-up. Oncol. Lett. 2016, 12, 1667–1674. [Google Scholar] [CrossRef] [Green Version]
- Strebhardt, K.; Raab, M.; Sanhaji, M. The role of PLK1 in cancer exhibiting chromosomal instability. Mol. Cell. Oncol. 2018, 5, e1485539. [Google Scholar] [CrossRef] [Green Version]
- Gregory, B.L.; Cheung, V.G. Natural variation in the histone demethylase, KDM4C, influences expression levels of specific genes including those that affect cell growth. Genome Res. 2014, 24, 52–63. [Google Scholar] [CrossRef] [Green Version]
- Yamamoto, S.; Tateishi, K.; Kudo, Y.; Yamamoto, K.; Isagawa, T.; Nagae, G.; Nakatsuka, T.; Asaoka, Y.; Ijichi, H.; Hirata, Y.; et al. Histone demethylase KDM4C regulates sphere formation by mediating the cross talk between Wnt and Notch pathways in colonic cancer cells. Carcinogenesis 2013, 34, 2380–2388. [Google Scholar] [CrossRef] [Green Version]
- Zuo, X.; Xu, W.; Xu, M.; Tian, R.; Moussalli, M.J.; Mao, F.; Zheng, X.; Wang, J.; Morris, J.S.; Gagea, M.; et al. Metastasis regulation by PPARD expression in cancer cells. JCI Insight 2017, 2, e91419. [Google Scholar] [CrossRef] [Green Version]
- Liu, Y.; Deguchi, Y.; Tian, R.; Wei, D.; Wu, L.; Chen, W.; Xu, W.; Xu, M.; Liu, F.; Gao, S.; et al. Pleiotropic effects of PPARD accelerate colorectal tumorigenesis, progression, and invasion. Cancer Res. 2019, 79, 954–969. [Google Scholar] [CrossRef] [Green Version]
- Tkach, M.; Rosemblit, C.; Rivas, M.A.; Proietti, C.J.; Flaqué, M.C.D.; Mercogliano, M.F.; Beguelin, W.; Maronna, E.; Guzmán, P.; Gercovich, F.G.; et al. P42/p44 MAPK-mediated Stat3Ser727 phosphorylation is required for progestin-induced full activation of Stat3 and breast cancer growth. Endocr.-Relat. Cancer 2013, 20, 197–212. [Google Scholar] [CrossRef] [PubMed] [Green Version]
- Shao, H.; Cheng, H.Y.; Cook, R.G.; Tweardy, D.J. Identification and characterization of signal transducer and activator of transcription 3 recruitment sites within the epidermal growth factor receptor. Cancer Res. 2003, 63, 3923–3930. [Google Scholar] [PubMed]
- Liang, C.J.; Wang, Z.W.; Chang, Y.W.; Lee, K.C.; Lin, W.H.; Lee, J.L. SFRPs Are Biphasic Modulators of Wnt-Signaling-Elicited Cancer Stem Cell Properties beyond Extracellular Control. Cell Rep. 2019, 28, 1511–1525. [Google Scholar] [CrossRef] [PubMed] [Green Version]
- Tarallo, S.; Ferrero, G.; Gallo, G.; Francavilla, A.; Clerico, G.; Realis Luc, A.; Manghi, P.; Thomas, A.M.; Vineis, P.; Segata, N.; et al. Altered Fecal Small RNA Profiles in Colorectal Cancer Reflect Gut Microbiome Composition in Stool Samples. mSystems 2019, 4, e00289-19. [Google Scholar] [CrossRef] [PubMed] [Green Version]
- Kok, M.G.M.; Halliani, A.; Moerland, P.D.; Meijers, J.C.M.; Creemers, E.E.; Pinto-Sietsma, S.J. Normalization panels for the reliable quantification of circulating microRNAs by RT-qPCR. FASEB J. 2015, 29, 3853–3862. [Google Scholar] [CrossRef] [PubMed]
- Mestdagh, P.; Van Vlierberghe, P.; De Weer, A.; Muth, D.; Westermann, F.; Speleman, F.; Vandesompele, J. A novel and universal method for microRNA RT-qPCR data normalization. Genome Biol. 2009, 10, R64. [Google Scholar] [CrossRef] [Green Version]
- Ferrero, G.; Cordero, F.; Tarallo, S.; Arigoni, M.; Riccardo, F.; Gallo, G.; Ronco, G.; Allasia, M.; Kulkarni, N.; Matullo, G.; et al. Small non-coding RNA profiling in human biofluids and surrogate tissues from healthy individuals: Description of the diverse and most represented species. Oncotarget 2018, 9, 3097–3111. [Google Scholar] [CrossRef] [Green Version]
- Jiménez, G.; Hackenberg, M.; Catalina, P.; Boulaiz, H.; Griñán-Lisón, C.; García, M.Á.; Perán, M.; López-Ruiz, E.; Ramírez, A.; Morata-Tarifa, C.; et al. Mesenchymal stem cell’s secretome promotes selective enrichment of cancer stem-like cells with specific cytogenetic profile. Cancer Lett. 2018, 429, 78–88. [Google Scholar] [CrossRef]
- Zheng-Bradley, X.; Streeter, I.; Fairley, S.; Richardson, D.; Clarke, L.; Flicek, P. Alignment of 1000 Genomes Project reads to reference assembly GRCh38. GigaScience 2017, 6, gix038. [Google Scholar] [CrossRef] [Green Version]
- Robinson, M.D.; Oshlack, A. A scaling normalization method for differential expression analysis of RNA-seq data. Genome Biol. 2010, 11, R25. [Google Scholar] [CrossRef] [PubMed] [Green Version]
- Benjamini, Y.; Hochberg, Y. Controlling the False Discovery Rate: A Practical and Powerful Approach to Multiple Testing. J. R. Stat. Soc. Ser. B (Methodol.) 1995, 57, 289–300. [Google Scholar] [CrossRef]
- Love, M.I.; Huber, W.; Anders, S. Moderated estimation of fold change and dispersion for RNA-seq data with DESeq2. Genome Biol. 2014, 15, 550. [Google Scholar] [CrossRef] [PubMed] [Green Version]
- Charmpi, K.; Ycart, B. Weighted kolmogorov smirnov testing: An alternative for gene set enrichment analysis. Stat. Appl. Genet. Mol. Biol. 2015, 14, 279–293. [Google Scholar] [CrossRef] [PubMed] [Green Version]


| miRNA | p Value | p Adj | Metastatic_1 | Metastatic_2 | Tumor_1 | Tumor_2 | Healthy_1 | Healthy_2 |
|---|---|---|---|---|---|---|---|---|
| hsa-miR-3614-5p | 7.57797 × 10⁻⁹ | 2.50831 × 10⁻⁶ | 588.15 | 602.64 | 0 | 0 | 0 | 0 |
| hsa-miR-1247-5p | 4.44313 × 10⁻⁸ | 3.91482 × 10⁻⁶ | 923.17 | 124.99 | 0 | 0 | 0 | 0 |
| hsa-miR-26b-3p | 2.49849 × 10⁻⁸ | 3.91482 × 10⁻⁶ | 405.75 | 0 | 693.60 | 0 | 0 | 0 |
| hsa-miR-370-3p | 4.7309 × 10⁻⁸ | 3.91482 × 10⁻⁶ | 930.61 | 138.38 | 0 | 0 | 0 | 0 |
| hsa-miR-371b-5p | 3.02639 × 10⁻⁷ | 2.00347 × 10⁻⁵ | 655.15 | 196.42 | 0 | 0 | 0 | 0 |
| hsa-miR-92a-1-5p | 1.18488 × 10⁻⁶ | 6.53656 × 10⁻⁵ | 201.01 | 620.50 | 0 | 0 | 0 | 0 |
| hsa-miR-1343-3p | 1.58942 × 10⁻⁶ | 7.51568 × 10⁻⁵ | 0 | 178.56 | 0 | 449.91 | 0 | 0 |
| hsa-let-7b-3p | 1.87635 × 10⁻⁶ | 7.76339 × 10⁻⁵ | 450.42 | 111.60 | 0 | 0 | 0 | 0 |
| hsa-miR-3130-5p | 3.90736 × 10⁻⁶ | 0.000143704 | 171.23 | 0 | 610.03 | 0 | 0 | 0 |
| hsa-miR-93-5p | 3.5912 × 10⁻⁵ | 0.001188687 | 23,101.53 | 21,016.67 | 18,685.45 | 26,506.86 | 47,283.15 | 57,832.90 |
| hsa-miR-223-3p | 0.000104139 | 0.003133635 | 355,620.64 | 417,538.85 | 288,671.90 | 294,471.36 | 175,026.35 | 162,243.02 |
| hsa-miR-431-5p | 0.000641093 | 0.017683487 | 0 | 0 | 0 | 0 | 660.62 | 748.75 |
| hsa-miR-320a | 0.00126751 | 0.032272748 | 129,310.50 | 120,542.28 | 57,794.55 | 53,603.04 | 191,473.93 | 241,138.63 |
| hsa-miR-486-5p | 0.001484273 | 0.03407904 | 708,832.85 | 796,133.48 | 937,832.71 | 815,698.98 | 1,422,293.08 | 1,307,148.95 |
| hsa-miR-628-3p | 0.001544367 | 0.03407904 | 416.91 | 437.47 | 434.54 | 183.78 | 0 | 0 |
| hsa-miR-7-1-3p | 0.002010025 | 0.041582387 | 0 | 441.94 | 626.75 | 1184.98 | 0 | 0 |
Publisher’s Note: MDPI stays neutral with regard to jurisdictional claims in published maps and institutional affiliations. |
© 2020 by the authors. Licensee MDPI, Basel, Switzerland. This article is an open access article distributed under the terms and conditions of the Creative Commons Attribution (CC BY) license (http://creativecommons.org/licenses/by/4.0/).
Share and Cite
Pisano, A.; Griñan-Lison, C.; Farace, C.; Fiorito, G.; Fenu, G.; Jiménez, G.; Scognamillo, F.; Peña-Martin, J.; Naccarati, A.; Pröll, J.; et al. The Inhibitory Role of miR-486-5p on CSC Phenotype Has Diagnostic and Prognostic Potential in Colorectal Cancer. Cancers 2020, 12, 3432. https://doi.org/10.3390/cancers12113432
Pisano A, Griñan-Lison C, Farace C, Fiorito G, Fenu G, Jiménez G, Scognamillo F, Peña-Martin J, Naccarati A, Pröll J, et al. The Inhibitory Role of miR-486-5p on CSC Phenotype Has Diagnostic and Prognostic Potential in Colorectal Cancer. Cancers. 2020; 12(11):3432. https://doi.org/10.3390/cancers12113432
Chicago/Turabian StylePisano, Andrea, Carmen Griñan-Lison, Cristiano Farace, Giovanni Fiorito, Grazia Fenu, Gema Jiménez, Fabrizio Scognamillo, Jesùs Peña-Martin, Alessio Naccarati, Johannes Pröll, and et al. 2020. "The Inhibitory Role of miR-486-5p on CSC Phenotype Has Diagnostic and Prognostic Potential in Colorectal Cancer" Cancers 12, no. 11: 3432. https://doi.org/10.3390/cancers12113432