
Prognostic and Clinicopathological Significance of CCND1/Cyclin D1 Upregulation in Melanomas: A Systematic Review and Comprehensive Meta-Analysis


 ,
, 
Abstract
:Simple Summary
Abstract
1. Introduction
2. Materials and Methods
2.1. Protocol
2.2. Search Strategy
2.3. Selection Criteria
2.4. Data Extraction
2.5. Evaluation of Quality and Risk of Bias
2.6. Statistical Analysis
3. Results
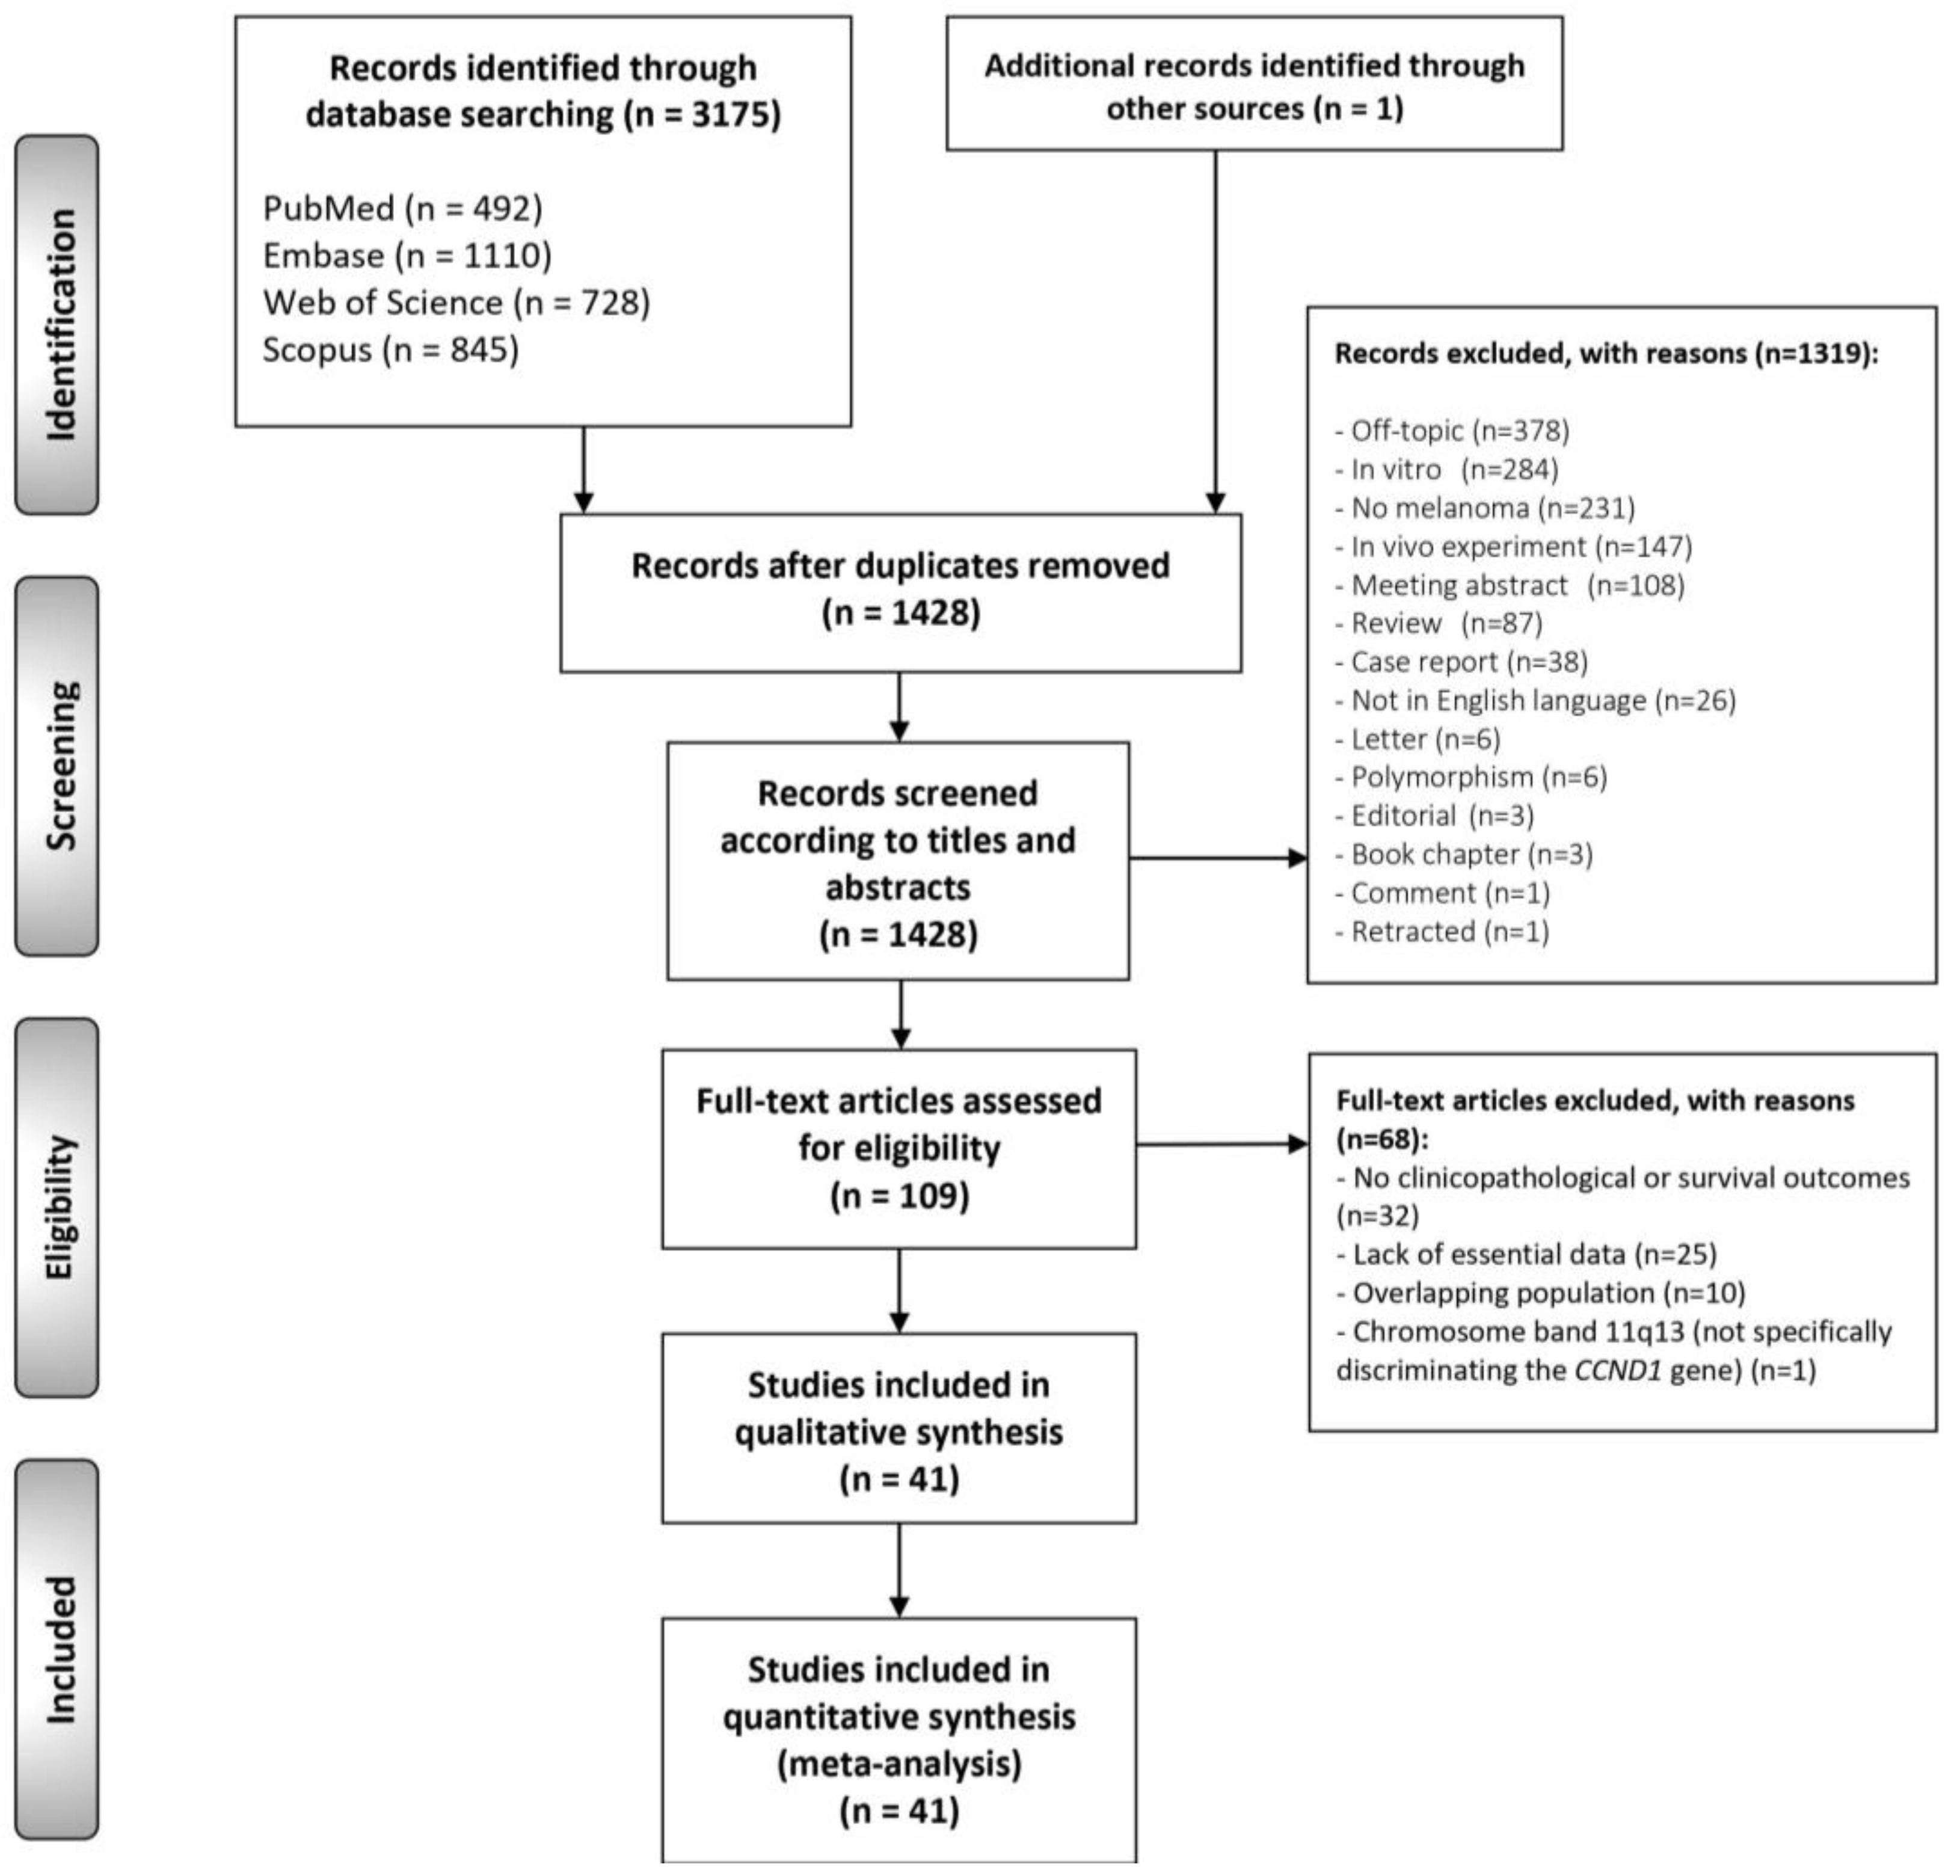
3.1. Literature Search
3.2. Study Characteristics
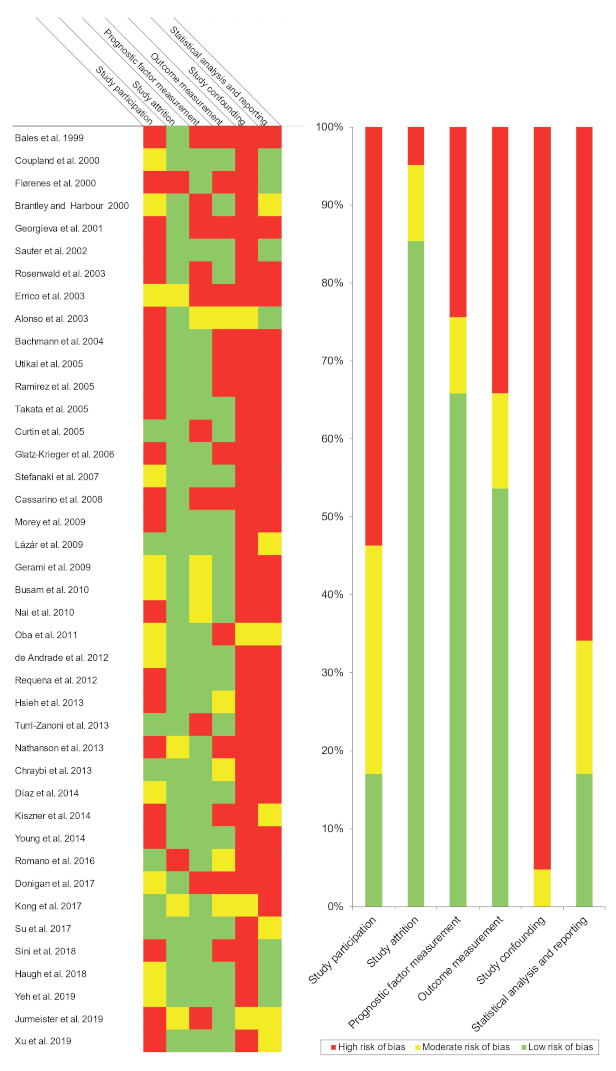
3.3. Qualitative Evaluation
4. Quantitative Evaluation (Meta-Analysis)
4.1. Association between CCND1/Cyclin D1 Upregulation and Cutaneous Melanoma
4.1.1. Upregulation Frequency
4.1.2. Overall Survival (OS)
4.1.3. Disease-Free Survival (DFS)
4.1.4. Breslow Thickness
4.1.5. Distance Metastatic vs. Primary Tissue
4.1.6. Additional Clinicopathological Variables
4.2. Association between CCND1/Cyclin D1 Upregulation and Uveal Melanoma
4.3. Association between CCND1/Cyclin D1 Upregulation and Mucosal Melanoma
4.3.1. Upregulation Frequency
4.3.2. Prognostic and Clinicopathological Variables
4.4. Quantitative Evaluation (Secondary Analyses)
4.4.1. Sensitivity Analysis
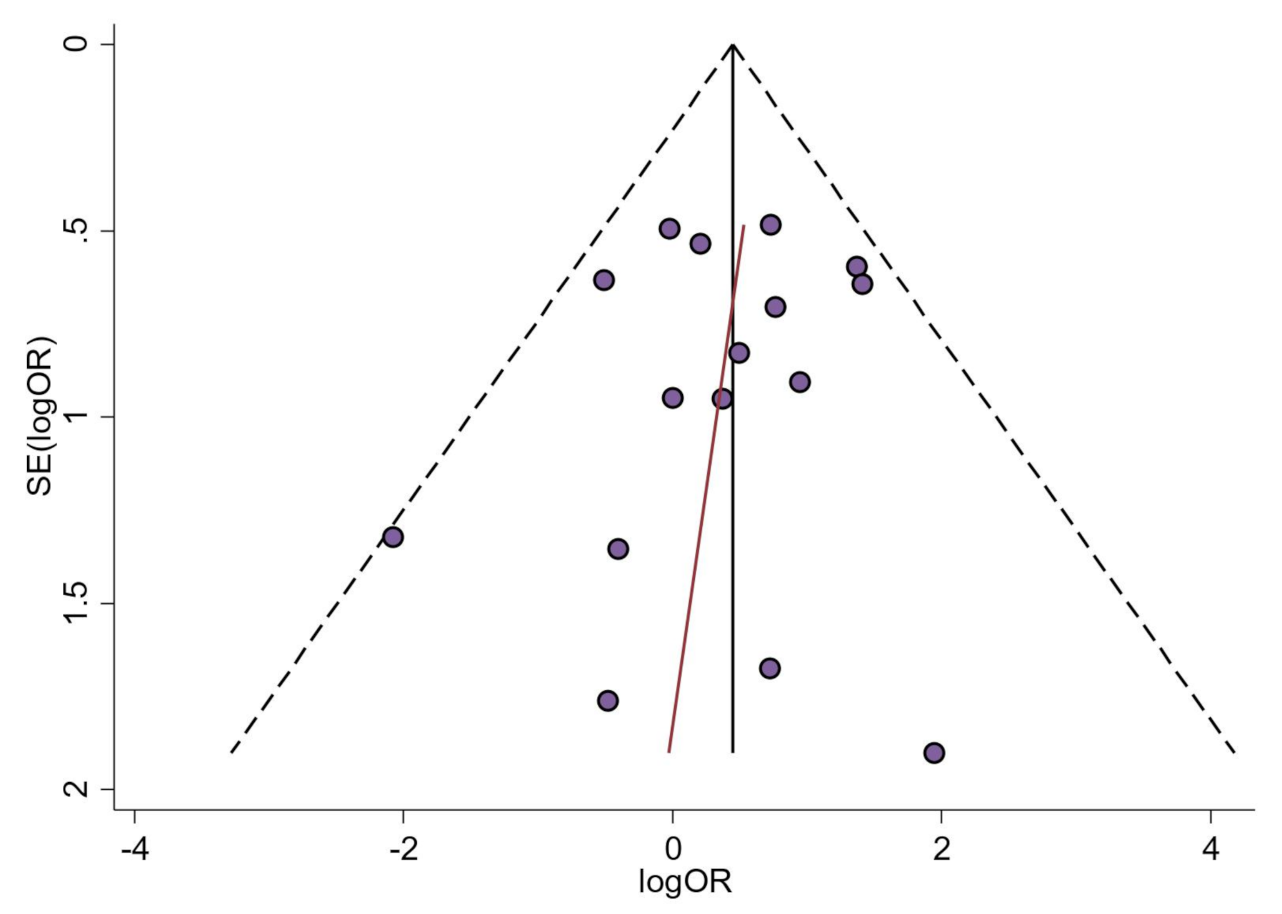
4.4.2. Analysis of Small-Study Effects
5. Discussion
6. Conclusions
Supplementary Materials
Author Contributions
Funding
Institutional Review Board Statement
Informed Consent Statement
Data Availability Statement
Acknowledgments
Conflicts of Interest
References
- Bray, F.; Ferlay, J.; Soerjomataram, I.; Siegel, R.L.; Torre, L.A.; Jemal, A. Global cancer statistics 2018: GLOBOCAN estimates of incidence and mortality worldwide for 36 cancers in 185 countries. CA. Cancer J. Clin. 2018, 68, 394–424. [Google Scholar] [CrossRef] [Green Version]
- Guy, G.P.; Thomas, C.C.; Thompson, T.; Watson, M.; Massetti, G.M.; Richardson, L.C. Vital signs: Melanoma incidence and mortality trends and projections—United States, 1982–2030. Morb. Mortal. Wkly. Rep. 2015, 64, 591–596. [Google Scholar]
- Ekwueme, D.U.; Guy, G.P.; Li, C.; Rim, S.H.; Parelkar, P.; Chen, S.C. The health burden and economic costs of cutaneous melanoma mortality by race/ethnicity–United States, 2000 to 2006. J. Am. Acad. Dermatol. 2011, 65, S133–S143. [Google Scholar] [CrossRef] [Green Version]
- Alicea, G.M.; Rebecca, V.W. Emerging strategies to treat rare and intractable subtypes of melanoma. Pigment. Cell Melanoma Res. 2020. [Google Scholar] [CrossRef] [PubMed]
- Ribas, A.; Flaherty, K.T. BRAF targeted therapy changes the treatment paradigm in melanoma. Nat. Rev. Clin. Oncol. 2011, 8, 426–433. [Google Scholar] [CrossRef] [PubMed]
- Sherr, C.J.; Roberts, J.M. Living with or without cyclins and cyclin-dependent kinases. Genes Dev. 2004, 18, 2699–2711. [Google Scholar] [CrossRef] [PubMed] [Green Version]
- Pestell, R.G. New roles of cyclin D1. Am. J. Pathol. 2013, 183, 3–9. [Google Scholar] [CrossRef] [PubMed] [Green Version]
- Zhu, Y.; Wen, X.; Zhao, P. MicroRNA-365 Inhibits Cell Growth and Promotes Apoptosis in Melanoma by Targeting BCL2 and Cyclin D1 (CCND1). Med. Sci. Monit. 2018, 24, 3679–3692. [Google Scholar] [CrossRef]
- Li, Z.; Jiang, K.; Zhu, X.; Lin, G.; Song, F.; Zhao, Y.; Piao, Y.; Liu, J.; Cheng, W.; Bi, X.; et al. Encorafenib (LGX818), a potent BRAF inhibitor, induces senescence accompanied by autophagy in BRAFV600E melanoma cells. Cancer Lett. 2016, 370, 332–344. [Google Scholar] [CrossRef] [PubMed]
- Fofaria, N.M.; Kim, S.H.; Srivastava, S.K. Piperine causes G1 phase cell cycle arrest and apoptosis in melanoma cells through checkpoint kinase-1 activation. PLoS ONE 2014, 9. [Google Scholar] [CrossRef] [PubMed]
- Chen, S.-H.; Gong, X.; Zhang, Y.; Van Horn, R.D.; Yin, T.; Huber, L.; Burke, T.F.; Manro, J.; Iversen, P.W.; Wu, W.; et al. RAF inhibitor LY3009120 sensitizes RAS or BRAF mutant cancer to CDK4/6 inhibition by abemaciclib via superior inhibition of phospho-RB and suppression of cyclin D1. Oncogene 2018, 37, 821–832. [Google Scholar] [CrossRef] [PubMed]
- Harris, A.L.; Lee, S.E.; Dawson, L.K.; Marlow, L.A.; Edenfield, B.H.; Durham, W.F.; Flotte, T.J.; Thompson, M.; Small, D.L.; Synnott, A.J.; et al. Targeting the cyclin dependent kinase and retinoblastoma axis overcomes standard of care resistance in BRAF V600E -mutant melanoma. Oncotarget 2018, 9, 10905–10919. [Google Scholar] [CrossRef] [Green Version]
- Yadav, V.; Burke, T.F.; Huber, L.; Van Horn, R.D.; Zhang, Y.; Buchanan, S.G.; Chan, E.M.; Starling, J.J.; Beckmann, R.P.; Peng, S.-B. The CDK4/6 Inhibitor LY2835219 Overcomes Vemurafenib Resistance Resulting from MAPK Reactivation and Cyclin D1 Upregulation. Mol. Cancer Ther. 2014, 13, 2253–2263. [Google Scholar] [CrossRef] [PubMed] [Green Version]
- Arioka, M.; Takahashi-Yanaga, F.; Kubo, M.; Igawa, K.; Tomooka, K.; Sasaguri, T. Anti-tumor effects of differentiation-inducing factor-1 in malignant melanoma: GSK-3-mediated inhibition of cell proliferation and GSK-3-independent suppression of cell migration and invasion. Biochem. Pharmacol. 2017, 138, 31–48. [Google Scholar] [CrossRef] [PubMed]
- Zheng, L.; Pan, J. The Anti-malarial Drug Artesunate Blocks Wnt/β-catenin Pathway and Inhibits Growth, Migration and Invasion of Uveal Melanoma Cells. Curr. Cancer Drug Targets 2018, 18. [Google Scholar] [CrossRef] [PubMed]
- Kaufmann, C.; Kempf, W.; Mangana, J.; Cheng, P.; Emberger, M.; Lang, R.; Kaiser, A.K.; Lattmann, E.; Levesque, M.; Dummer, R.; et al. The role of cyclin D1 and Ki-67 in the development and prognostication of thin melanoma. Histopathology 2020, 77, 460–470. [Google Scholar] [CrossRef] [PubMed]
- Lebe, B.; Pabuççuoğlu, U.; Ozer, E. The significance of Ki-67 proliferative index and cyclin D1 expression of dysplastic nevi in the biologic spectrum of melanocytic lesions. Appl. Immunohistochem. Mol. Morphol. AIMM 2007, 15, 160–164. [Google Scholar] [CrossRef] [PubMed]
- Miracco, C.; Pacenti, L.; Santopietro, R.; Biagioli, M.; Fimiani, M.; Perotti, R.; Rubegni, P.; Pirtoli, L.; Luzi, P. Detection of telomerase activity and correlation with mitotic and apoptotic indices, Ki-67 and expression of cyclins D1 and A in cutaneous melanoma. Int. J. Cancer 2000, 88, 411–416. [Google Scholar] [CrossRef]
- Ramos-García, P.; Gil-Montoya, J.A.; Scully, C.; Ayén, A.; González-Ruiz, L.; Navarro-Triviño, F.J.; González-Moles, M.A. An update on the implications of cyclin D1 in oral carcinogenesis. Oral Dis. 2017, 23. [Google Scholar] [CrossRef] [PubMed]
- Wilkerson, P.M.; Reis-Filho, J.S. The 11q13-q14 amplicon: Clinicopathological correlations and potential drivers. Genes. Chromosomes Cancer 2013, 52, 333–355. [Google Scholar] [CrossRef] [PubMed]
- Ramos-García, P.; Ruiz-Ávila, I.; Gil-Montoya, J.A.; Ayén, Á.; González-Ruiz, L.; Navarro-Triviño, F.J.; González-Moles, M.Á. Relevance of chromosomal band 11q13 in oral carcinogenesis: An update of current knowledge. Oral Oncol. 2017, 72. [Google Scholar] [CrossRef] [PubMed]
- González-Ruiz, L.; González-Moles, M.A.; González-Ruiz, I.; Ruiz-Ávila, I.; Ayén, Á.; Ramos-García, P. An update on the implications of cyclin D1 in melanomas. Pigment Cell Melanoma Res. 2020. [Google Scholar] [CrossRef] [PubMed] [Green Version]
- Smalley, K.S.M.; Lioni, M.; Palma, M.D.; Xiao, M.; Desai, B.; Egyhazi, S.; Hansson, J.; Wu, H.; King, A.J.; Van Belle, P.; et al. Increased cyclin D1 expression can mediate BRAF inhibitor resistance in BRAF V600E-mutated melanomas. Mol. Cancer Ther. 2008, 7, 2876–2883. [Google Scholar] [CrossRef] [PubMed] [Green Version]
- Sauter, E.R.; Yeo, U.-C.; Von Stemm, A.; Zhu, W.; Litwiin, S.; Tichansky, D.S.; Pistritto, G.; Nesbit, M.; Pinkel, D.; Herlyn, M.; et al. Cyclin D1 is a candidate oncogene in cutaneous melanoma. Cancer Res. 2002, 62, 3200–3206. [Google Scholar]
- Krayem, M.; Najem, A.; Journe, F.; Morandini, R.; Sales, F.; Awada, A.; Ghanem, G.E. Acquired resistance to BRAFi reverses senescence-like phenotype in mutant BRAF melanoma. Oncotarget 2018, 9. [Google Scholar] [CrossRef] [PubMed]
- Yoshida, A.; Lee, E.K.; Diehl, J.A. Induction of Therapeutic Senescence in Vemurafenib-Resistant Melanoma by Extended Inhibition of CDK4/6. Cancer Res. 2016, 76, 2990–3002. [Google Scholar] [CrossRef] [Green Version]
- Kiszner, G.; Wichmann, B.; Nemeth, I.B.; Varga, E.; Meggyeshazi, N.; Teleki, I.; Balla, P.; Maros, M.E.; Penksza, K.; Krenacs, T. Cell cycle analysis can differentiate thin melanomas from dysplastic nevi and reveals accelerated replication in thick melanomas. Virchows Arch. 2014, 464, 603–612. [Google Scholar] [CrossRef]
- Weissinger, S.E.; Frick, M.; Möller, P.; Horst, B.A.; Lennerz, J.K. Performance Testing of RREB1, MYB, and CCND1 Fluorescence In Situ Hybridization in Spindle-Cell and Desmoplastic Melanoma Argues for a Two-Step Test Algorithm. Int. J. Surg. Pathol. 2017, 25, 148–157. [Google Scholar] [CrossRef] [PubMed]
- Gammon, B.; Ali, L.; Guitart, J.; Gerami, P. Homogeneous staining regions for cyclin D1, a marker of poor prognosis in malignant melanoma. Am. J. Dermatopathol. 2012, 34, 487–490. [Google Scholar] [CrossRef]
- Kong, Y.; Sheng, X.; Wu, X.; Yan, J.; Ma, M.; Yu, J.; Si, L.; Chi, Z.; Cui, C.; Dai, J.; et al. Frequent genetic aberrations in the CDK4 pathway in acral melanoma indicate the potential for CDK4/6 inhibitors in targeted therapy. Clin. Cancer Res. 2017, 23, 6946–6957. [Google Scholar] [CrossRef] [Green Version]
- Bachmann, I.M.; Straume, O.; Akslen, L.A. Altered expression of cell cycle regulators Cyclin D1, p14, p16, CDK4 and Rb in nodular melanomas. Int. J. Oncol. 2004, 25, 1559–1565. [Google Scholar] [CrossRef] [PubMed]
- Moher, D.; Liberati, A.; Tetzlaff, J.; Altman, D.G. PRISMA Group Preferred reporting items for systematic reviews and meta-analyses: The PRISMA statement. PLoS Med. 2009, 6, 1000097. [Google Scholar] [CrossRef] [PubMed] [Green Version]
- Riley, R.D.; Ridley, G.; Williams, K.; Altman, D.G.; Hayden, J.; De Vet, H.C.W. Prognosis research: Toward evidence-based results and a Cochrane methods group. J. Clin. Epidemiol. 2007, 60, 863–865. [Google Scholar] [CrossRef] [PubMed]
- Higgins, J.P.; Green, S. Cochrane Handbook for Systematic Reviews of Interventions: Cochrane Book Series. Available online: http://handbook.cochrane.org/ (accessed on 11 March 2021).
- Centre for Reviews and Dissemination Group. Systematic Reviews: CRD’s Guidance for Undertaking Reviews in Health Care; York Publishing Services Ltd.: York, UK, 2009. [Google Scholar]
- Booth, A.; Clarke, M.; Dooley, G.; Ghersi, D.; Moher, D.; Petticrew, M.; Stewart, L. The nuts and bolts of PROSPERO: An international prospective register of systematic reviews. Syst. Rev. 2012, 1, 2. [Google Scholar] [CrossRef] [PubMed] [Green Version]
- Shamseer, L.; Moher, D.; Clarke, M.; Ghersi, D.; Liberati, A.; Petticrew, M.; Shekelle, P.; Stewart, L.A. PRISMA-P Group Preferred reporting items for systematic review and meta-analysis protocols (PRISMA-P) 2015: Elaboration and explanation. BMJ 2015, 350, 7647. [Google Scholar] [CrossRef] [Green Version]
- Hayden, J.A.; Van der Windt, D.A.; Cartwright, J.L.; Côté, P.; Bombardier, C. Assessing bias in studies of prognostic factors. Ann. Intern. Med. 2013, 158, 280–286. [Google Scholar] [CrossRef]
- Hayden, J.A.; Côté, P.; Bombardier, C. Evaluation of the quality of prognosis studies in systematic reviews. Ann. Intern. Med. 2006, 144, 427–437. [Google Scholar] [CrossRef] [PubMed]
- Parmar, M.K.; Torri, V.; Stewart, L. Extracting summary statistics to perform meta-analyses of the published literature for survival endpoints. Stat. Med. 1998, 17, 2815–2834. [Google Scholar] [CrossRef]
- Tierney, J.F.; Stewart, L.A.; Ghersi, D.; Burdett, S.; Sydes, M.R. Practical methods for incorporating summary time-to-event data into meta-analysis. Trials 2007, 8, 16. [Google Scholar] [CrossRef] [PubMed] [Green Version]
- Dekkers, O.M.; Vandenbroucke, J.P.; Cevallos, M.; Renehan, A.G.; Altman, D.G.; Egger, M. COSMOS-E: Guidance on conducting systematic reviews and meta-analyses of observational studies of etiology. PLoS Med. 2019, 16, 1002742. [Google Scholar] [CrossRef] [PubMed]
- Sweeting, M.J.; Sutton, A.J.; Lambert, P.C. What to add to nothing? Use and avoidance of continuity corrections in meta-analysis of sparse data. Stat. Med. 2004, 23, 1351–1375. [Google Scholar] [CrossRef] [PubMed]
- Agresti, A.; Coull, B.A. Approximate is Better than “Exact” for Interval Estimation of Binomial Proportions. Am. Stat. 1998, 52, 119–126. [Google Scholar] [CrossRef]
- Freeman, M.; Tuckey, J. Transformations Related to the Angular and the Square Root. Ann. Math. Stat. 1950, 21, 607–611. [Google Scholar] [CrossRef]
- Higgins, J.P.T.; Thompson, S.G. Quantifying heterogeneity in a meta-analysis. Stat. Med. 2002, 21, 1539–1558. [Google Scholar] [CrossRef] [PubMed]
- Higgins, J.P.T.; Thompson, S.G.; Deeks, J.J.; Altman, D.G. Measuring inconsistency in meta-analyses. BMJ 2003, 327, 557–560. [Google Scholar] [CrossRef] [PubMed] [Green Version]
- Viechtbauer, W.; Cheung, M.W.-L. Outlier and influence diagnostics for meta-analysis. Res. Synth. Methods 2010, 1, 112–125. [Google Scholar] [CrossRef] [PubMed]
- Egger, M.; Davey Smith, G.; Schneider, M.; Minder, C. Bias in meta-analysis detected by a simple, graphical test. BMJ 1997, 315, 629–634. [Google Scholar] [CrossRef] [PubMed] [Green Version]
- Sterne, J.A.C.; Sutton, A.J.; Ioannidis, J.P.A.; Terrin, N.; Jones, D.R.; Lau, J.; Carpenter, J.; Rücker, G.; Harbord, R.M.; Schmid, C.H.; et al. Recommendations for examining and interpreting funnel plot asymmetry in meta-analyses of randomised controlled trials. BMJ 2011, 343, 4002. [Google Scholar] [CrossRef] [PubMed] [Green Version]
- Chraybi, M.; Abd Alsamad, I.; Copie-Bergman, C.; Baia, M.; André, J.; Dumaz, N.; Ortonne, N. Oncogene abnormalities in a series of primary melanomas of the sinonasal tract: NRAS mutations and cyclin D1 amplification are more frequent than KIT or BRAF mutations. Hum. Pathol. 2013, 44, 1902–1911. [Google Scholar] [CrossRef] [Green Version]
- Ramos-García, P.; González-Moles, M.; González-Ruiz, L.; Ruiz-Ávila, I.; Ayén, Á.; Gil-Montoya, J.A. Prognostic and clinicopathological significance of cyclin D1 expression in oral squamous cell carcinoma: A systematic review and meta-analysis. Oral Oncol. 2018, 83. [Google Scholar] [CrossRef] [PubMed]
- Cohen, C.; Zavala-Pompa, A.; Sequeira, J.H.; Shoji, M.; Sexton, D.G.; Cotsonis, G.; Cerimele, F.; Govindarajan, B.; Macaron, N.; Arbiser, J.L. Mitogen-actived protein kinase activation is an early event in melanoma progression. Clin. Cancer Res. 2002, 8, 3728–3733. [Google Scholar] [PubMed]
- Bhatt, K.V.; Spofford, L.S.; Aram, G.; McMullen, M.; Pumiglia, K.; Aplin, A.E. Adhesion control of cyclin D1 and p27Kip1 levels is deregulated in melanoma cells through BRAF-MEK-ERK signaling. Oncogene 2005, 24, 3459–3471. [Google Scholar] [CrossRef] [Green Version]
- Sekulic, A.; De Lamo, G.J.; Ejadi, S.; Pulido, J.S.; Diva, R.; Thorland, E.C.; Vile, R.G.; Swanson, D.L.; Pockaj, B.A.; Laman, S.D.; et al. Malignant Melanoma in the 21st Century: The Emerging Molecular Landscape. Mayo Clin. Proc. 2009, 83, 825–846. [Google Scholar] [CrossRef] [PubMed] [Green Version]
- ICGC/TCGA Pan-Cancer Analysis of Whole Genomes Consortium Pan-cancer analysis of whole genomes. Nature 2020, 578, 82–93. [CrossRef] [Green Version]
- Akbani, R.; Akdemir, K.C.; Aksoy, B.A.; Albert, M.; Ally, A.; Amin, S.B.; Arachchi, H.; Arora, A.; Auman, J.T.; Ayala, B.; et al. Genomic Classification of Cutaneous Melanoma. Cell 2015, 161, 1681–1696. [Google Scholar] [CrossRef] [PubMed] [Green Version]
- Ramos-García, P.; Bravo, M.; González-Ruiz, L.; González-Moles, M. Significance of cytoplasmic cyclin D1 expression in oral oncogenesis. Oral Dis. 2018, 24, 98–102. [Google Scholar] [CrossRef] [PubMed]
- Musgrove, E.A.; Caldon, C.E.; Barraclough, J.; Stone, A.; Sutherland, R.L. Cyclin D as a therapeutic target in cancer. Nat. Rev. Cancer 2011, 11, 558–572. [Google Scholar] [CrossRef] [PubMed]
- Weinstein, I.B.; Joe, A.K. Mechanisms of disease: Oncogene addiction–A rationale for molecular targeting in cancer therapy. Nat. Clin. Pract. Oncol. 2006, 3, 448–457. [Google Scholar] [CrossRef] [PubMed]


| Total | 41 Studies |
|---|---|
| Year of publication | 1999–2019 |
| Number of melanomas analyzed | |
| Total | 3451 |
| Sample size, range | 6–514 |
| Cyclin D1 protein overexpression * | |
| Total | 21 studies (1473 melanomas) |
| Sample size, range | 7–245 |
| CCND1 gene amplification * | |
| Total | 22 studies (2096 melanomas) |
| Sample size, range | 6–514 |
| Geographical region | |
| Europe | 17 studies (1727 melanomas) |
| North America | 12 studies (498 melanomas) |
| Asia | 5 studies (893 melanomas) |
| South and Central America | 3 studies (110 melanomas) |
| Australia | 2 studies (163 melanomas) |
| Global multicentric | 2 studies (60 melanomas) |
| Total | 6 continents, 17 countries |
| Meta-Analyses | No. of Studies | No. of Cases | Wt | Stat. Model | Pooled Data | Hetero Geneity | Supplementary Materialsa | ||
|---|---|---|---|---|---|---|---|---|---|
| ES (95% CI) | p-value | phet | I2(%) | ||||||
| CUTANEOUS MELANOMA | |||||||||
| Frequency of cyclin D1/CCND1 upregulation | |||||||||
| Nodular melanoma b | 15 | 219 | D-L | REM | PP = 19.19% (7.12–34.06) | - | <0.001 | 70.63 | Figure S1, p. 13 |
| Nodular melanoma by alteration c | Figure S1, p. 13 | ||||||||
| Cyclin D1 overexpression | 7 | 103 | D-L | REM | PP = 13.69% (2.33–29.67) | - | 0.13 | 39.69 | |
| CCND1 amplification | 8 | 116 | D-L | REM | PP = 22.66% (3.65–48.29) | - | <0.001 | 80.92 | |
| Superficial spreading melanoma b | 15 | 553 | D-L | REM | PP = 24.71% (13.29–37.84) | - | <0.001 | 86.26 | Figure S2, p. 14 |
| Superficial spreading melanoma by alteration c | Figure S2, p. 14 | ||||||||
| Cyclin D1 overexpression | 7 | 325 | D-L | REM | PP = 36.72% (17.57–57.90) | - | <0.001 | 88.53 | |
| CCND1 amplification | 8 | 228 | D-L | REM | PP = 15.79% (3.44–32.85) | - | <0.001 | 83.30 | |
| Lentigo malignant melanoma b | 5 | 63 | D-L | REM | PP = 34.73% (10.61–63.09) | <0.001 | 76.77 | Figure S3, p. 15 | |
| Lentigo malignant melanoma by alteration c | - | Figure S3, p. 15 | |||||||
| Cyclin D1 overexpression | 2 | 29 | D-L | REM | PP = 52.24% (33.36–70.82) | - | - | - | |
| CCND1 amplification | 3 | 34 | D-L | REM | PP = 16.16% (2.53–35.62) | - | 0.27 | 23.42 | |
| Acral melanoma b | 7 | 98 | D-L | REM | PP = 30.90% (18.27–44.86) | - | 0.15 | 36.98 | Figure S4, p. 16 |
| Acral melanoma by alteration c | Figure S4, p. 16 | ||||||||
| Cyclin D1 overexpression | 2 | 13 | D-L | REM | PP = 62.07% (31.17–89.27) | - | - | - | |
| CCND1 amplification | 5 | 85 | D-L | REM | PP = 25.06% (15.80–35.44) | - | 0.44 | 0.00 | |
| Survival parameters | |||||||||
| Overall survival d | 7 | 1022 | D-L | REM | HR = 1.11 (0.81–1.52) | 0.51 | 0.30 | 16.7 | Figure S5, p. 17 |
| Overall survival by alteration e | Figure S5, p. 17 | ||||||||
| Cyclin D1 overexpression | 5 | 399 | D-L | REM | HR = 1.00 (0.64–1.58) | 0.99 | 0.26 | 24.3 | |
| CCND1 amplification | 2 | 623 | D-L | REM | HR = 1.32 (0.81–1.52) | 0.11 | - | - | |
| Overall survival by geographic area e | Figure S6, p. 18 | ||||||||
| Asian | 2 | 592 | D-L | REM | HR = 1.30 (0.92–1.82) | 0.13 | - | - | |
| Non-Asian | 5 | 430 | D-L | REM | HR = 1.03 (0.63–1.69) | 0.90 | 0.23 | 28.3 | |
| Overall survival by IHQ pattern e | Figure S7, p. 19 | ||||||||
| Nuclear | 3 | 235 | D-L | REM | HR = 0.77 (0.50–1.17) | 0.22 | 0.58 | 0.0 | |
| Nuclear and cytoplasmic | 1 | 78 | - | - | - | - | - | - | |
| Not available | 1 | 86 | - | - | - | - | - | - | |
| Clinicopathological parameters | |||||||||
| Disease-free survival d | 2 | 70 | D-L | REM | HR = 1.45 (0.60–3.51) | 0.41 | - | - | Figure S8, p. 20 |
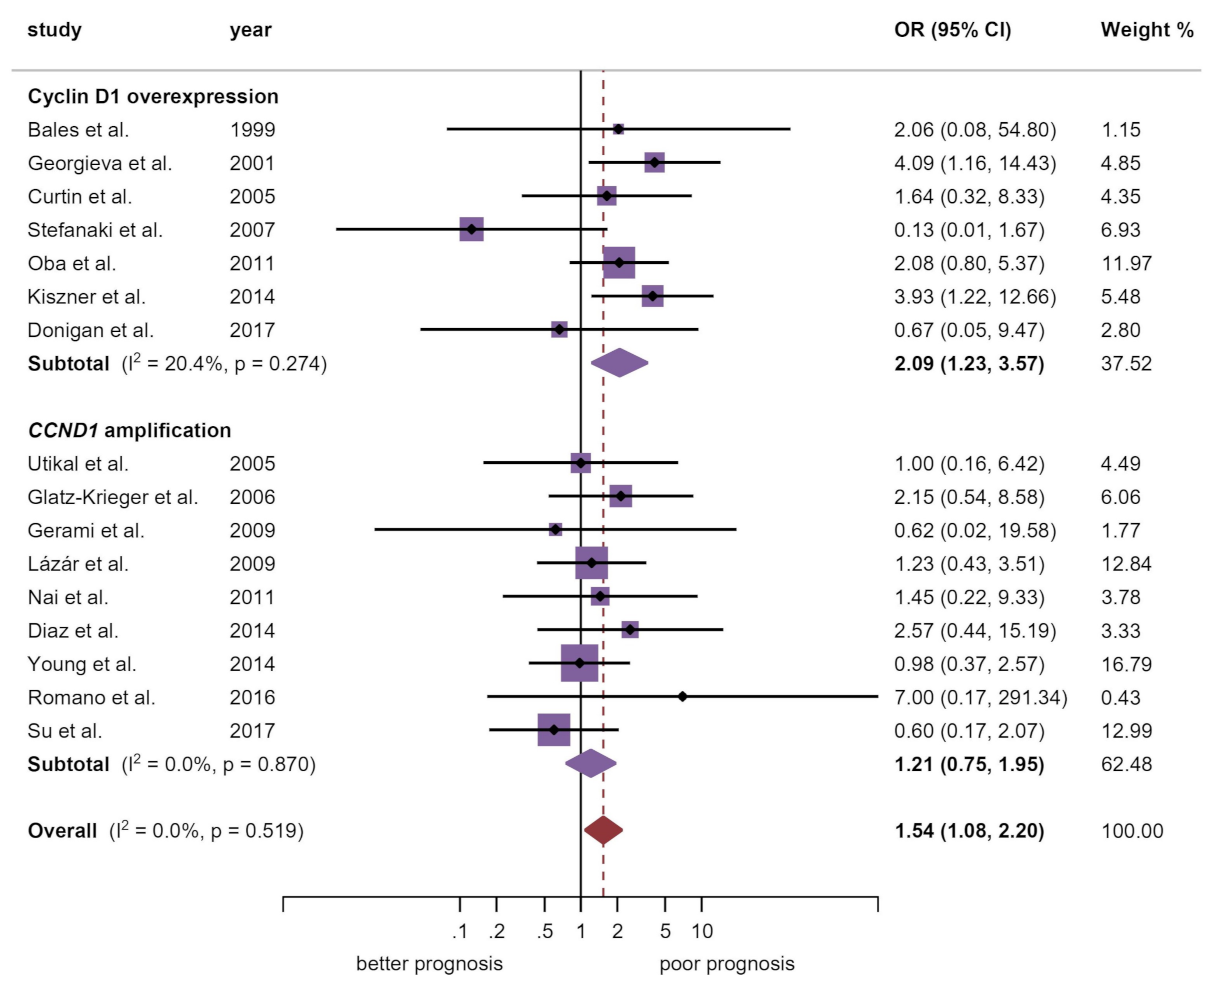
| Breslow thickness d | 16 | 760 | M-H | FEM | OR = 1.54 (1.08–2.20) | 0.02 | 0.52 | 0.0 | Manuscript, Figure 3 |
| Breslow thickness by alteration e | |||||||||
| Cyclin D1 overexpression | 7 | 264 | M-H | FEM | OR = 2.09 (1.23–3.57) | 0.007 | 0.27 | 20.4 | |
| CCND1 amplification | 9 | 496 | M-H | FEM | OR = 1.21 (0.75–1.95) | 0.43 | 0.87 | 0.0 | |
| Breslow thickness by geographic area e | Figure S9, p. 21 | ||||||||
| Asia | 2 | 120 | M-H | FEM | OR = 1.31 (0.63–2.74) | 0.47 | - | - | |
| Australia | 1 | 143 | - | - | - | - | - | - | |
| Europe | 7 | 355 | M-H | FEM | OR = 1.91 (1.15–3.19) | 0.01 | 0.21 | 28.4 | |
| Global multicentric | 1 | 39 | - | - | - | - | - | - | |
| North America | 4 | 41 | M-H | FEM | OR = 1.36 (0.31–5.90) | 0.68 | 0.73 | 0.0 | |
| South America | 1 | 62 | - | - | - | - | - | - | |
| Breslow thickness by IHQ pattern e | Figure S10, p. 22 | ||||||||
| Nuclear | 3 | 89 | M-H | FEM | OR = 1.83 (0.72–4.61) | 0.20 | 0.06 | 65.3 | |
| Nuclear and cytoplasmic | 1 | 78 | - | - | - | - | - | - | |
| Not available | 3 | 97 | M-H | FEM | OR = 2.41 (0.98–5.90) | 0.06 | 0.41 | 0.0 | |
| Ulceration d | 4 | 759 | M-H | FEM | OR = 0.99 (0.70–1.42) | 0.97 | 0.40 | 0.0 | Figure S11, p. 23 |
| N Status d | 2 | 16 | M-H | FEM | OR = 0.77 (0.06–9.14) | 0.83 | - | - | Figure S12, p. 24 |
| M Status d | 2 | 34 | M-H | FEM | OR = 0.86 (0.15–5.02) | 0.87 | - | - | Figure S13, p. 25 |
| Clinical Stage d | 3 | 585 | M-H | FEM | OR = 1.13 (0.78–1.66) | 0.51 | 0.03 | 70.5 | Figure S14, p. 26 |
| Mitotic rate d | 2 | 117 | M-H | FEM | OR = 1.66 (0.72–3.84) | 0.23 | 0.71 | 0.0 | Figure S15, p. 27 |
| Clark levels d | 7 | 195 | M-H | FEM | OR = 1.10 (0.59–2.06) | 0.76 | 0.34 | 12.1 | Figure S16, p. 28 |
| Type (nodular vs. SSM/LMM/AM) d | 13 | 646 | M-H | FEM | OR = 0.84 (0.52–1.35) | 0.47 | 0.14 | 30.4 | Figure S17, p. 29 |
| Type by alteration e | Figure S17, p. 29 | ||||||||
| Cyclin D1 overexpression | 6 | 337 | M-H | FEM | OR = 0.53 (0.26–1.08) | 0.08 | 0.30 | 17.1 | |
| CCND1 amplification | 7 | 309 | M-H | FEM | OR = 1.29 (0.66–2.51) | 0.45 | 0.23 | 26.4 | |
| Type by geographic area e | Figure S18, p. 30 | ||||||||
| Australia | 1 | 9 | - | - | - | - | - | - | |
| Europe | 4 | 275 | M-H | FEM | OR = 1.54 (0.80–2.97) | 0.19 | 0.52 | 0.0 | |
| Global multicentric | 1 | 33 | - | - | - | - | - | - | |
| North America | 6 | 268 | M-H | FEM | OR = 0.34 (0.14–0.84) | 0.02 | 0.08 | 50.1 | |
| South America | 1 | 61 | - | - | - | - | - | - | |
| Type by IHQ pattern e | Figure S19, p. 31 | ||||||||
| Nuclear | 5 | 304 | M-H | FEM | OR = 0.54 (0.26–1.11) | 0.09 | 0.20 | 33.5 | |
| Not available | 1 | 33 | - | - | - | - | - | - | |
| Lymph node metastasis vs. primary tissue d | 2 | 184 | M-H | FEM | OR = 1.07 (0.43–2.68) | 0.88 | 0.21 | 35.7 | Figure S20, p. 32 |
| Distance metastasis vs. primary tissue d | 16 | 1651 | M-H | FEM | OR = 0.70 (0.55–0.89) | 0.004 | <0.001 | 68.5 | Figure S21, p. 33 |
| By alteration e | Figure S21, p. 33 | ||||||||
| Cyclin D1 overexpression | 9 | 987 | M-H | FEM | OR = 0.53 (0.40–0.71) | <0.001 | <0.001 | 71.8 | |
| CCND1 amplification | 7 | 664 | M-H | FEM | OR = 1.70 (1.01–2.85) | 0.04 | 0.16 | 35.5 | |
| By geographic area e | Figure S22, p. 34 | ||||||||
| Asia | 2 | 122 | M-H | FEM | OR = 0.42 (0.18–1.00) | 0.05 | - | - | |
| Australia | 1 | 20 | - | - | - | - | - | - | |
| Europe | 9 | 1237 | M-H | FEM | OR = 0.73 (0.55–0.97) | 0.03 | <0.001 | 73.0 | |
| North America | 4 | 272 | M-H | FEM | OR = 0.72 (0.39–1.34) | 0.30 | 0.001 | 82.2 | |
| By IHQ pattern e | Figure S23, p. 35 | ||||||||
| Nuclear | 7 | 826 | M-H | FEM | OR = 0.56 (0.41–0.76) | <0.001 | <0.001 | 78.3 | |
| Nuclear and cytoplasmic | 1 | 101 | - | - | - | - | - | - | |
| Not available | 1 | 60 | - | - | - | - | - | - | |
| UVEAL MELANOMA | |||||||||
| Frequency of cyclin D1/CCND1 upregulation | |||||||||
| Uveal melanoma b | 3 | 197 | D-L | REM | PP = 14.42% (0.00–46.91) | - | <0.001 | 95.91 | Figure S24, p. 36 |
| Survival parameters | |||||||||
| OS | 0 | 0 | - | - | - | - | - | - | - |
| DFS d | 1 | 45 | - | - | - | - | - | - | - |
| Clinicopathological parameters | |||||||||
| Thickness | 1 | 32 | - | - | - | - | - | - | - |
| Distance metastasis | 1 | 82 | - | - | - | - | - | - | - |
| Sclera infiltration | 1 | 45 | - | - | - | - | - | - | - |
| Largest basal dimensiond | 2 | 77 | M-H | FEM | OR = 2.78 (0.950–8.16) | 0.06 | - | - | Figure S25, p. 37 |
| Pathology (epithelioid vs. spindle/mixed) d | 2 | 77 | M-H | FEM | OR = 4.59 (1.47–14.36) | 0.009 | - | - | Figure S26, p. 38 |
| MUCOSAL MELANOMA | |||||||||
| Frequency of cyclin D1/CCND1 upregulation | |||||||||
| Mucosal melanoma b | 12 | 356 | D-L | REM | PP = 42.33% (27.24–58.12) | - | <0.001 | 86.76 | Figure S27, p. 39 |
| Mucosal melanoma by alteration c | Figure S27, p. 39 | ||||||||
| Cyclin D1 overexpression | 4 | 94 | D-L | REM | PP = 75.69% (55.48–91.63) | - | 0.01 | 74.22 | |
| CCND1 amplification | 8 | 262 | D-L | REM | PP = 25.08% (17.29–33.66) | - | 0.09 | 42.72 | |
| Mucosal melanoma by anatomical site c | Figure S28, p. 40 | ||||||||
| Ano-rectal | 1 | 45 | - | - | - | - | - | - | |
| Conjunctival | 1 | 6 | - | - | - | - | - | - | |
| Head and neck mixed | 1 | 94 | - | - | - | - | - | - | |
| Esophageal | 2 | 29 | D-L | REM | PP = 13.51% (2.47–29.52) | - | - | - | |
| Genitourinary | 1 | 55 | - | - | - | - | - | - | |
| Oral cavity | 2 | 46 | D-L | REM | PP = 80.05% (66.67–90.94) | - | - | - | |
| Sinonasal | 4 | 81 | D-L | REM | PP = 41.47% (14.11–71.73) | - | <0.001 | 86.1 | |
| Survival parameters | |||||||||
| OS | 0 | 0 | - | - | - | - | - | - | - |
| DFS | 0 | 0 | - | - | - | - | - | - | - |
| Recurrence d | 2 | 41 | M-H | FEM | OR = 0.90 (0.18–4.38) | 0.89 | - | - | Figure S29, p. 41 |
| Clinicopathological parameters | |||||||||
| Thickness d | 4 | 241 | M-H | FEM | OR = 1.19 (0.67–2.11) | 0.56 | 0.17 | 39.6 | Figure S30, p. 42 |
| N Status | 0 | 0 | - | - | - | - | - | - | - |
| M Status d | 2 | 40 | M-H | FEM | OR = 1.95 (0.21–18.30) | 0.56 | 0.77 | 0.0 | Figure S31, p. 43 |
| Necrosis d | 3 | 65 | M-H | FEM | OR = 0.90 (0.30–2.70) | 0.85 | 0.70 | 0.0 | Figure S32, p. 44 |
Publisher’s Note: MDPI stays neutral with regard to jurisdictional claims in published maps and institutional affiliations. |
© 2021 by the authors. Licensee MDPI, Basel, Switzerland. This article is an open access article distributed under the terms and conditions of the Creative Commons Attribution (CC BY) license (http://creativecommons.org/licenses/by/4.0/).
Share and Cite
González-Ruiz, L.; González-Moles, M.Á.; González-Ruiz, I.; Ruiz-Ávila, I.; Ramos-García, P. Prognostic and Clinicopathological Significance of CCND1/Cyclin D1 Upregulation in Melanomas: A Systematic Review and Comprehensive Meta-Analysis. Cancers 2021, 13, 1314. https://doi.org/10.3390/cancers13061314
González-Ruiz L, González-Moles MÁ, González-Ruiz I, Ruiz-Ávila I, Ramos-García P. Prognostic and Clinicopathological Significance of CCND1/Cyclin D1 Upregulation in Melanomas: A Systematic Review and Comprehensive Meta-Analysis. Cancers. 2021; 13(6):1314. https://doi.org/10.3390/cancers13061314
Chicago/Turabian StyleGonzález-Ruiz, Lucía, Miguel Ángel González-Moles, Isabel González-Ruiz, Isabel Ruiz-Ávila, and Pablo Ramos-García. 2021. "Prognostic and Clinicopathological Significance of CCND1/Cyclin D1 Upregulation in Melanomas: A Systematic Review and Comprehensive Meta-Analysis" Cancers 13, no. 6: 1314. https://doi.org/10.3390/cancers13061314