Article

Functional Genetic Variants in ATG10 Are Associated with Acute Myeloid Leukemia

by
Isabel Castro
1,2,†,
Belém Sampaio-Marques
1,2,†,
Anabela C. Areias
1,2,†,
Hugo Sousa
1,2,3,
Ângela Fernandes
1,2,4,
José Manuel Sanchez-Maldonado
5,6,7,
Cristina Cunha
1,2,
Agostinho Carvalho
1,2,
Juan Sainz
5,6,7,8 and
Paula Ludovico
1,2,*
1
Life and Health Sciences Research Institute (ICVS), School of Medicine, University of Minho, 4710-057 Braga, Portugal
2
ICVS/3B’s-PT Government Associate Laboratory, 4806-909 Braga/Guimarães, Portugal
3
Virology Service and Molecular Oncology and Viral Pathology Group (CI-IPOP), Portuguese Oncology Institute of Porto (IPO Porto), 4200-072 Porto, Portugal
4
Institute for Research and Innovation in Health (i3S), University of Porto, 4200-135 Porto, Portugal
5
Genomic Oncology Area, GENYO, Centre for Genomics and Oncological Research, Pfizer/University of Granada/Andalusian Regional Government, PTS, Avda. de la Ilustración, 114, 18016 Granada, Spain
6
Hematology Department, Virgen de las Nieves University Hospital, Avda. Fuerzas Armadas s/n, 18012 Granada, Spain
7
Instituto de Investigación Biosanataria (IBs. Granada), 18012 Granada, Spain
8
Department of Medicine, University of Granada, Avda. De la Investigación, 11, 18016 Granada, Spain
*
Author to whom correspondence should be addressed.
These authors contributed equally to this work.
Cancers 2021, 13(6), 1344; https://doi.org/10.3390/cancers13061344
Submission received: 3 February 2021 / Revised: 5 March 2021 / Accepted: 12 March 2021 / Published: 16 March 2021
(This article belongs to the Special Issue Feature Paper from Journal Reviewers)

Abstract

:

Simple Summary

Acute myeloid leukemia (AML) is a hematological neoplasm with a very poor survival rate. To date, diagnostic tools to monitor individuals at higher risk of developing AML are scarce. Single nucleotide polymorphisms (SNPs) have emerged as good candidates for disease prevention. AML is characterized by altered autophagy, a vital mechanism to remove and recycle unnecessary or dysfunctional cellular components. ATG10 is one of the autophagy core genes involved in the autophagosome formation. We hypothesize that SNPs located in regulatory regions of the ATG10 gene could predispose individuals to AML development. We therefore genotyped three SNPs within the ATG10 locus. We identified the ATG10rs3734114 as a potential risk factor for developing AML, whereas the ATG10rs1864182 was associated with decreased risk. These findings highlight ATG10 as a key regulator of susceptibility to AML. Furthermore, we believe that ATG10 SNPs could be exploited in the clinical setting as an AML prevention strategy.

Abstract

Acute myeloid leukemia (AML) is the most common acute leukemia, characterized by a heterogeneous genetic landscape contributing, among others, to the occurrence of metabolic reprogramming. Autophagy, a key player on metabolism, plays an essential role in AML. Here, we examined the association of three potentially functional genetic polymorphisms in the ATG10 gene, central for the autophagosome formation. We screened a multicenter cohort involving 309 AML patients and 356 healthy subjects for three ATG10 SNPs: rs1864182T>G, rs1864183C>T and rs3734114T>C. The functional consequences of the ATG10 SNPs in its canonical function were investigated in vitro using peripheral blood mononuclear cells from a cohort of 46 healthy individuals. Logistic regression analysis adjusted for age and gender revealed that patients carrying the ATG10rs1864182G allele showed a significantly decreased risk of developing AML (OR [odds ratio] = 0.58, p = 0.001), whereas patients carrying the homozygous ATG10rs3734114C allele had a significantly increased risk of developing AML (OR = 2.70, p = 0.004). Functional analysis showed that individuals carrying the ATG10rs1864182G allele had decreased autophagy when compared to homozygous major allele carriers. Our results uncover the potential of screening for ATG10 genetic variants in AML prevention strategies, in particular for subjects carrying other AML risk factors such as elderly individuals with clonal hematopoiesis of indeterminate potential.

1. Introduction

Acute myeloid leukemia (AML) is the most common acute leukemia in adults with an average age of disease diagnosis above 65 years old [1]. It is a highly heterogeneous clonal disorder characterized by an impairment in myeloid cellular differentiation and deregulated proliferation, leading to an accumulation of immature myeloid progenitor cells in the bone marrow (BM), peripheral blood, and other tissues. Patients undergoing chemotherapy, radiation, or with a genetic predisposition to myeloid neoplasms are at a higher risk of developing AML [2]. Furthermore, it has been reported that individuals presenting an age-related condition named clonal hematopoiesis of indeterminate potential (CHIP), are also at higher risk of developing AML. CHIP is characterized by the expansion of hematopoietic stem cell (HSC) clones, harboring specific, disruptive, and recurrent somatic mutations [3]. Thus, searching for markers of AML predisposition and progression is of important clinical relevance.
Single nucleotide polymorphisms (SNPs) have emerged as new predictors of diseases like cancer and as indicators of effectiveness of chemotherapy response. To date, the majority of SNPs reported in association with AML are focused on the response to oncological therapies [4,5,6,7]. For example, the STAT3rs9909659 could be used to predict the treatment outcome to chemotherapy with daunorubicin and cytarabine [8]. Moreover, a SNP located in the mutational hotspot of Wilms tumor 1 (WT1) was identified as a novel favorable prognostic marker in cytogenetically normal AML [9]. The SNP rs11554137 present at the isocitrate dehydrogenase 1 (IDH1) gene, a citric acid cycle enzyme involved in metabolism, was shown to be a negative outcome predictor of AML [10,11]. The presence of IDH1rs11554137 results in the production of the oncometabolite (R)-2-hydroxyglutarate leading to the poor prognosis of normal karyotype adult AML. This particular finding may indicate the potential presence of other SNPs involved in the complex pathways of metabolism and perhaps in cellular recycling mechanisms such as autophagy. Interestingly, AML is characterized by changes in autophagy flux in both pre-leukemic cells as well as in leukemic stem cells, as a consequence of acquired somatic mutations, a process associated with increased age [12]. Despite these advances, the need for finding novel SNPs associated with AML predisposition remains. Only few SNPs have been associated with higher risk of developing myeloid leukemia [13]. As an example, the presence of the B-cell lymphoma 2 (BCL2) polymorphism, BCL2938C/A and the BCL2-associated X protein (BAX) polymorphism, BAX248GG were significantly associated with an increased risk of AML occurrence [14]. Furthermore, two SNPs in CASP9 gene (rs1263 and rs712) are associated with AML susceptibility [15].
Autophagy is a coordinated process responsible for the removal of misfolded proteins and dysfunctional organelles from cells by means of lysosomal degradation [16]. Autophagy plays a key role in cancer since it can either suppress tumorigenesis by inhibiting cancer cell survival, or facilitate tumorigenesis by promoting cancer cell proliferation and tumor growth [17,18]. Recent studies have shown autophagy-related prognostic signature for AML prediction [19]. An important step in autophagy is the autophagosome formation, which is mediated by a set of ATG proteins such as ATG10. ATG10 is an E2-like enzyme that catalyzes the conjugation reaction between ATG12 and ATG5, when interacting with ATG7, an essential set for autophagy vesicle formation [20]. Interestingly, apart from ATG10’s role in autophagy, ATG10 seems to have a non-canonical function in inflammation [21,22].
The Human Genome Project has identified many ATG10 SNPs, but to date only few were investigated in AML research [23]. The two missense ATG10rs1864182 and ATG10rs1864183 were shown to be situated in the region containing enhancer histone markers in induced pluripotent stem cells (iPSCs), and they are possible motifs altering binding of the transcription factors DMRT1 and Myc [24]. Curiously, DMRT1 and Myc are key players in the development of AML [25,26]. Another missense ATG10 SNP, the ATG10rs3734114, was described for its putative involvement in lung, thyroid, brain and bladder cancers [27,28,29,30]. For these reasons, in this work we studied the association of AML development with these three ATG10 SNPs (ATG10rs1864182, ATG10rs1864183 and ATG10rs3734114), using a Spanish cohort of AML patients and healthy donors, with a total of 665 participants. We further evaluated the autophagic function of the associated SNPs using an independent cohort of 46 healthy donors. Our results demonstrate the importance of autophagy-related ATG10 SNPs in AML development.

2. Materials and Methods

2.1. Ethics Statement

Two independent cohorts were used for this study. Cohort 1 consisted of 665 Spanish subjects, including 309 AML subjects and 356 healthy subjects that were ascertained through the NuCLEAR consortium [31]. All ethical issues concerning this cohort are described in [31]. Cohort 2 included 46 healthy Portuguese subjects. The study was approved by the Ethics Committee for Research in Life and Health Sciences (CEICVS) at University of Minho (SECVS 010/2015).

2.2. DNA Extraction, SNP Selection Criteria and Genotyping

Genomic DNA from whole blood samples was isolated using the NZY Blood gDNA Isolation kit (NZYTech, Lisbon, Portugal) according to the manufacturer’s instructions. The frequency of each selected SNP in the Caucasian population was considered, based on the International HapMap Project (HapMap-CEU). Genotyping of the ATG10rs1864182 and ATG10rs1864183 was performed using the KASPar genotyping chemistry (LGC Genomics, Hoddesdon, UK) and ATG10rs3734114 using TaqMan SNP Genotyping Assay (Thermo Fisher Scientific, MA, USA), following the manufacturer’s instructions. Call rate for all tested SNPs was >98%. Quality control for the genotyping results were achieved with negative controls and randomly selected samples included as duplicates.

2.3. Association Studies

For both cohorts, contingency tables were calculated. Association studies were performed following the methods described in [32] using Rstudio version 1.4.1103. The major allele was considered the most frequent allele in the European population based on National Library of Medicine (NIH). Hardy–Weinberg Equilibrium (HWE) and corresponding significant differences were calculated for the control population of each SNP using a standard observed-expected chi-square (χ2) test. The genotypic odds ratios (OR) for the dominant and recessive model as well as the corresponding confidence intervals were calculated, and both χ2 and Fischer exact (FE) test were performed. Logistic regression for the dominant and recessive model adjusted for age and gender was performed to control for these possible confounding factors. Since we simultaneously assessed other autophagy SNPs in this study, we performed a correction for multiple testing using the Bonferroni method (Supplementary Table S1). Linkage Disequilibrium (LD) between the three studied ATG10 SNPs studied was analyzed using Haploview software.

2.4. mRNA Expression Analysis by qRT-PCR

Analysis of quantitative mRNA expression was accomplished according to MIQE guidelines [33]. In brief, ATG10 mRNA transcripts expression levels were measured by quantitative real-time PCR (qPCR) (Supplementary Table S2). The expression levels of these transcripts were normalized against that of three reference genes: β-2-microglobulin (B2M), ribosomal protein L13a (RPL13A), Glyceraldehyde 3-phosphate dehydrogenase (GAPDH) (Supplementary Table S2).
The RNA extraction was performed using the NZYol RNA Isolation Reagent (NZYTech). Total RNA (250 ng) was reverse-transcribed into cDNA in a 20 μL reaction mixture using the NZY First-Strand cDNA Synthesis kit (NZYTech). Then, in a 20 μL reaction mixture, 50 ng of cDNA, of each sample, were tested in duplicate in a 96-well plate (Bio-Rad, CA, USA). The qPCR was processed in a CFX96™ Real Time System (Bio-Rad), with the NZY qPCR Green Master Mix (NZYTech), according to the manufacturer’s instructions. A blank (no-template control) was also included in each assay run. The qPCR conditions consisted of one hold at 95 °C for 1 min, followed by 45 cycles of 15 min at 95 °C, 20 s at 60 °C and 20 s at 72 °C. At the end, a melting-curve was acquired to evaluate the PCR specificity, contamination and the absence of primer dimers. Furthermore, the PCR efficiency was also tested according to methods described in [33]. Final values of relative expression levels of ATG10 mRNA transcripts were determined by correcting for the differences in efficiencies between target and reference genes using the gene expression software of the CFX manager program (Bio-Rad).

2.5. Protein Expression and Immunoblot Analysis

For protein extraction, 50 µL of lysis buffer was used, containing 1% NP-40, 500 mM Tris HCL, 2.5 M NaCl, 20 mM EDTA, Phosphatase and Protease inhibitors (Roche, Mannheim, Germany), at pH 7.2, followed by a sonication process. For the immunoblotting assay, 20 µg of total protein extract were resolved in a 12% SDS gel and transferred to a nitrocellulose membrane during 10 min, using the Trans-Blot Turbo transfer system (Bio-Rad). Then, membranes were blocked using Tris-buffered saline (TBS) with 0.1% tween 20 (TBS-T) plus 5% bovine serum albumin (BSA) and incubated overnight at 4 °C. This incubation was performed with the polyclonal primary antibodies resuspended in 1% BSA: Rabbit anti-LC3A/B Antibody (1:1000, Cell-Signaling, MA, USA), mouse anti-p62 (1:1000, Abcam, Cambridge, UK), anti-mono and polyubiquitination conjugated (1:1000, Enzo Biochem, NY, USA ) or mouse anti-alpha-actin (1:1000, Millipore, MA, USA), followed by one hour incubation with the secondary antibodies (HRP, anti-rabbit, anti-mouse 1:5000) (Bio-Rad). Blots were developed with the SuperSignal West Femto Maximum Sensitivity Substrate (Thermo Fisher Scientific) or the Clarity Western ECL Substrate (Bio-Rad). Digital images were obtained in a ChemiDoc XRS System (Bio-Rad) and the densitometry analysis of the bands was performed with the Quantity One software V4.6.5 (Bio-Rad).

2.6. Peripheral Blood Mononuclear Cells (PBMC) Isolation

Venous blood was drawn into 10 mL EDTA tubes. Blood was diluted in PBS (1:1) and fractions were separated by Histopaque®-1077 (Sigma-Aldrich, MO, USA) density gradient centrifugation according to the protocol of the manufacturer. PBMCs were washed twice with PBS and resuspended in RPMI-1640 medium (Gibco, Paisley, UK) supplemented 10% FBS (Gibco) and antibiotic-antimycotic solution (Sigma-Aldrich).

2.7. Autophagy Flux Analysis

Briefly, PBMCs were plated in 12-well round-bottom plates (Corning, NY, USA) at a concentration of 5 × 10⁵ cell/mL and incubated, with or without 10 µM of metformin (Sigma-Aldrich), for 4 h. Furthermore, in order to block the autophagy flux and to allow the accumulation of LC3-II [34], 2 h before the end of the treatment, in each condition, cells were also incubated with 10 nM of bafilomycin (Baf A1) (Sigma-Aldrich). After incubation, cells were lysed and immunoblotting assays were performed for autophagy-related proteins, as described in 2.5. To quantify autophagy synthesis, the ratio of the values of the cells treated with metformin and Baf A1 against those for condition without metformin but with Baf A1 treatment was determined. To quantify autophagy degradation, the ratio between the densitometric values of cells treated with metformin in the presence or absence of Baf A1 was determined, according to autophagy standard guidelines [34]. Due to the number of samples in our study and the limited amount of protein per sample, technical replicates of the blots were not performed, however most conditions contain enough samples to warrant a reliable statistical analysis, with exception of samples for ATG10rs3734114C/C for which statistical tests were not performed.

2.8. Statistical Analysis

Each condition was tested for normality before statistical analysis using a Shapiro-Wilk test. To compare one or two normally distributed samples a t-test was performed. For more than two samples an ANOVA test was performed. When at least one of the samples was non-normally distributed, the Kruskal–Wallis test was performed. All statistical procedures were conducted using GraphPad Prism.

3. Results

3.1. Demographic Characterization of the Cohorts

Two European cohorts were used, one for SNP analysis (cohort 1) and the other for functional studies (cohort 2). Demographic characterization of the cohorts is detailed in Table 1. Cohort 1 consisted of 665 Spanish subjects from the NuCLEAR consortium [31] comprising 309 AML patients and 356 healthy subjects. Gender balance was observed in cohort 1 (χ2 test, p = 0.612), while age distribution was statistically different between AML cases and healthy controls (56 ± 6 and 58 ± 17 years mean age, respectively, p < 0.05). The association analyses were adjusted for age and gender. Cohort 2, which included 46 healthy subjects, was used for functional studies (Table 1).

3.2. Linkage Analysis of ATG10 SNPs

The ATG10 polymorphisms studied are located on the chromosome 5, at the positions 82253421, 82253397 and 82058570 for the ATG10rs1864182, ATG10rs1864183 and ATG10rs3734114, respectively (Table 2, Supplementary Figure S1A). Random association of the SNPs alleles in the ATG10 locus was analyzed by calculating the allelic linkage (Supplementary Figure S1B). Linkage disequilibrium (LD) analysis showed a close association of ATG10rs1864182 with ATG10rs1864183 (coefficient of LD (D’) of 0.93 and r2 of 0.62). A moderate linkage between these two SNPs was expected due to their loci proximity. For the linkage between ATG10rs3734114 and ATG10rs1864183 or ATG10rs1864182, D’ and r2 values were low, ranging from 0.17–0.26 and 0.0–0.02 respectively, showing that the ATG10rs3734114 represents an independent signal.

3.3. Associations of Genetic Variants on ATG10 with AML

Associations of ATG10rs1864182, ATG10rs1864183 and ATG10rs3734114 with AML were studied in cohort 1. Minor allele frequencies in the control population, as well as the nucleotide changes for each SNP are presented in Table 2 and Supplementary Figure S1A, respectively. All SNPs were in Hardy–Weinberg equilibrium (HWE) (Table 2).
Allele and genotype frequencies were in line with those reported by the NIH for the CEU population (https://www.ncbi.nlm.nih.gov/snp/, accessed 12 January 2021) (Table 2 and Table 3). The genotype distributions for the ATG10rs3734114 were different between patients and controls (χ2 test, padjusted = 0.012, respectively) (Table 3). Logistic regression analysis adjusted for age and gender revealed that AML patients carrying the ATG10rs1864182G allele showed a significant decreased risk of developing AML (ORDominant = 0.58, with a 95% confidence interval [CI] = 0.42–0.80, Table 3), whereas patients carrying the ATG10rs3734114C/C genotype had a significant increased risk of developing AML when compared with those carrying the most common allele (ORRecessive = 2.70, 95% CI = 1.36–5.34, Table 3). All results were corrected for multiple testing using Bonferroni correction (Supplementary Table S1). Our analysis confirmed that older subjects [35,36] and males [37] are at higher risk of developing AML. In summary, our results proposed a decreased risk of developing AML when carrying the ATG10rs1864182G, whereas identified ATG10rs3734114C/C as a risk factor for the development of AML.

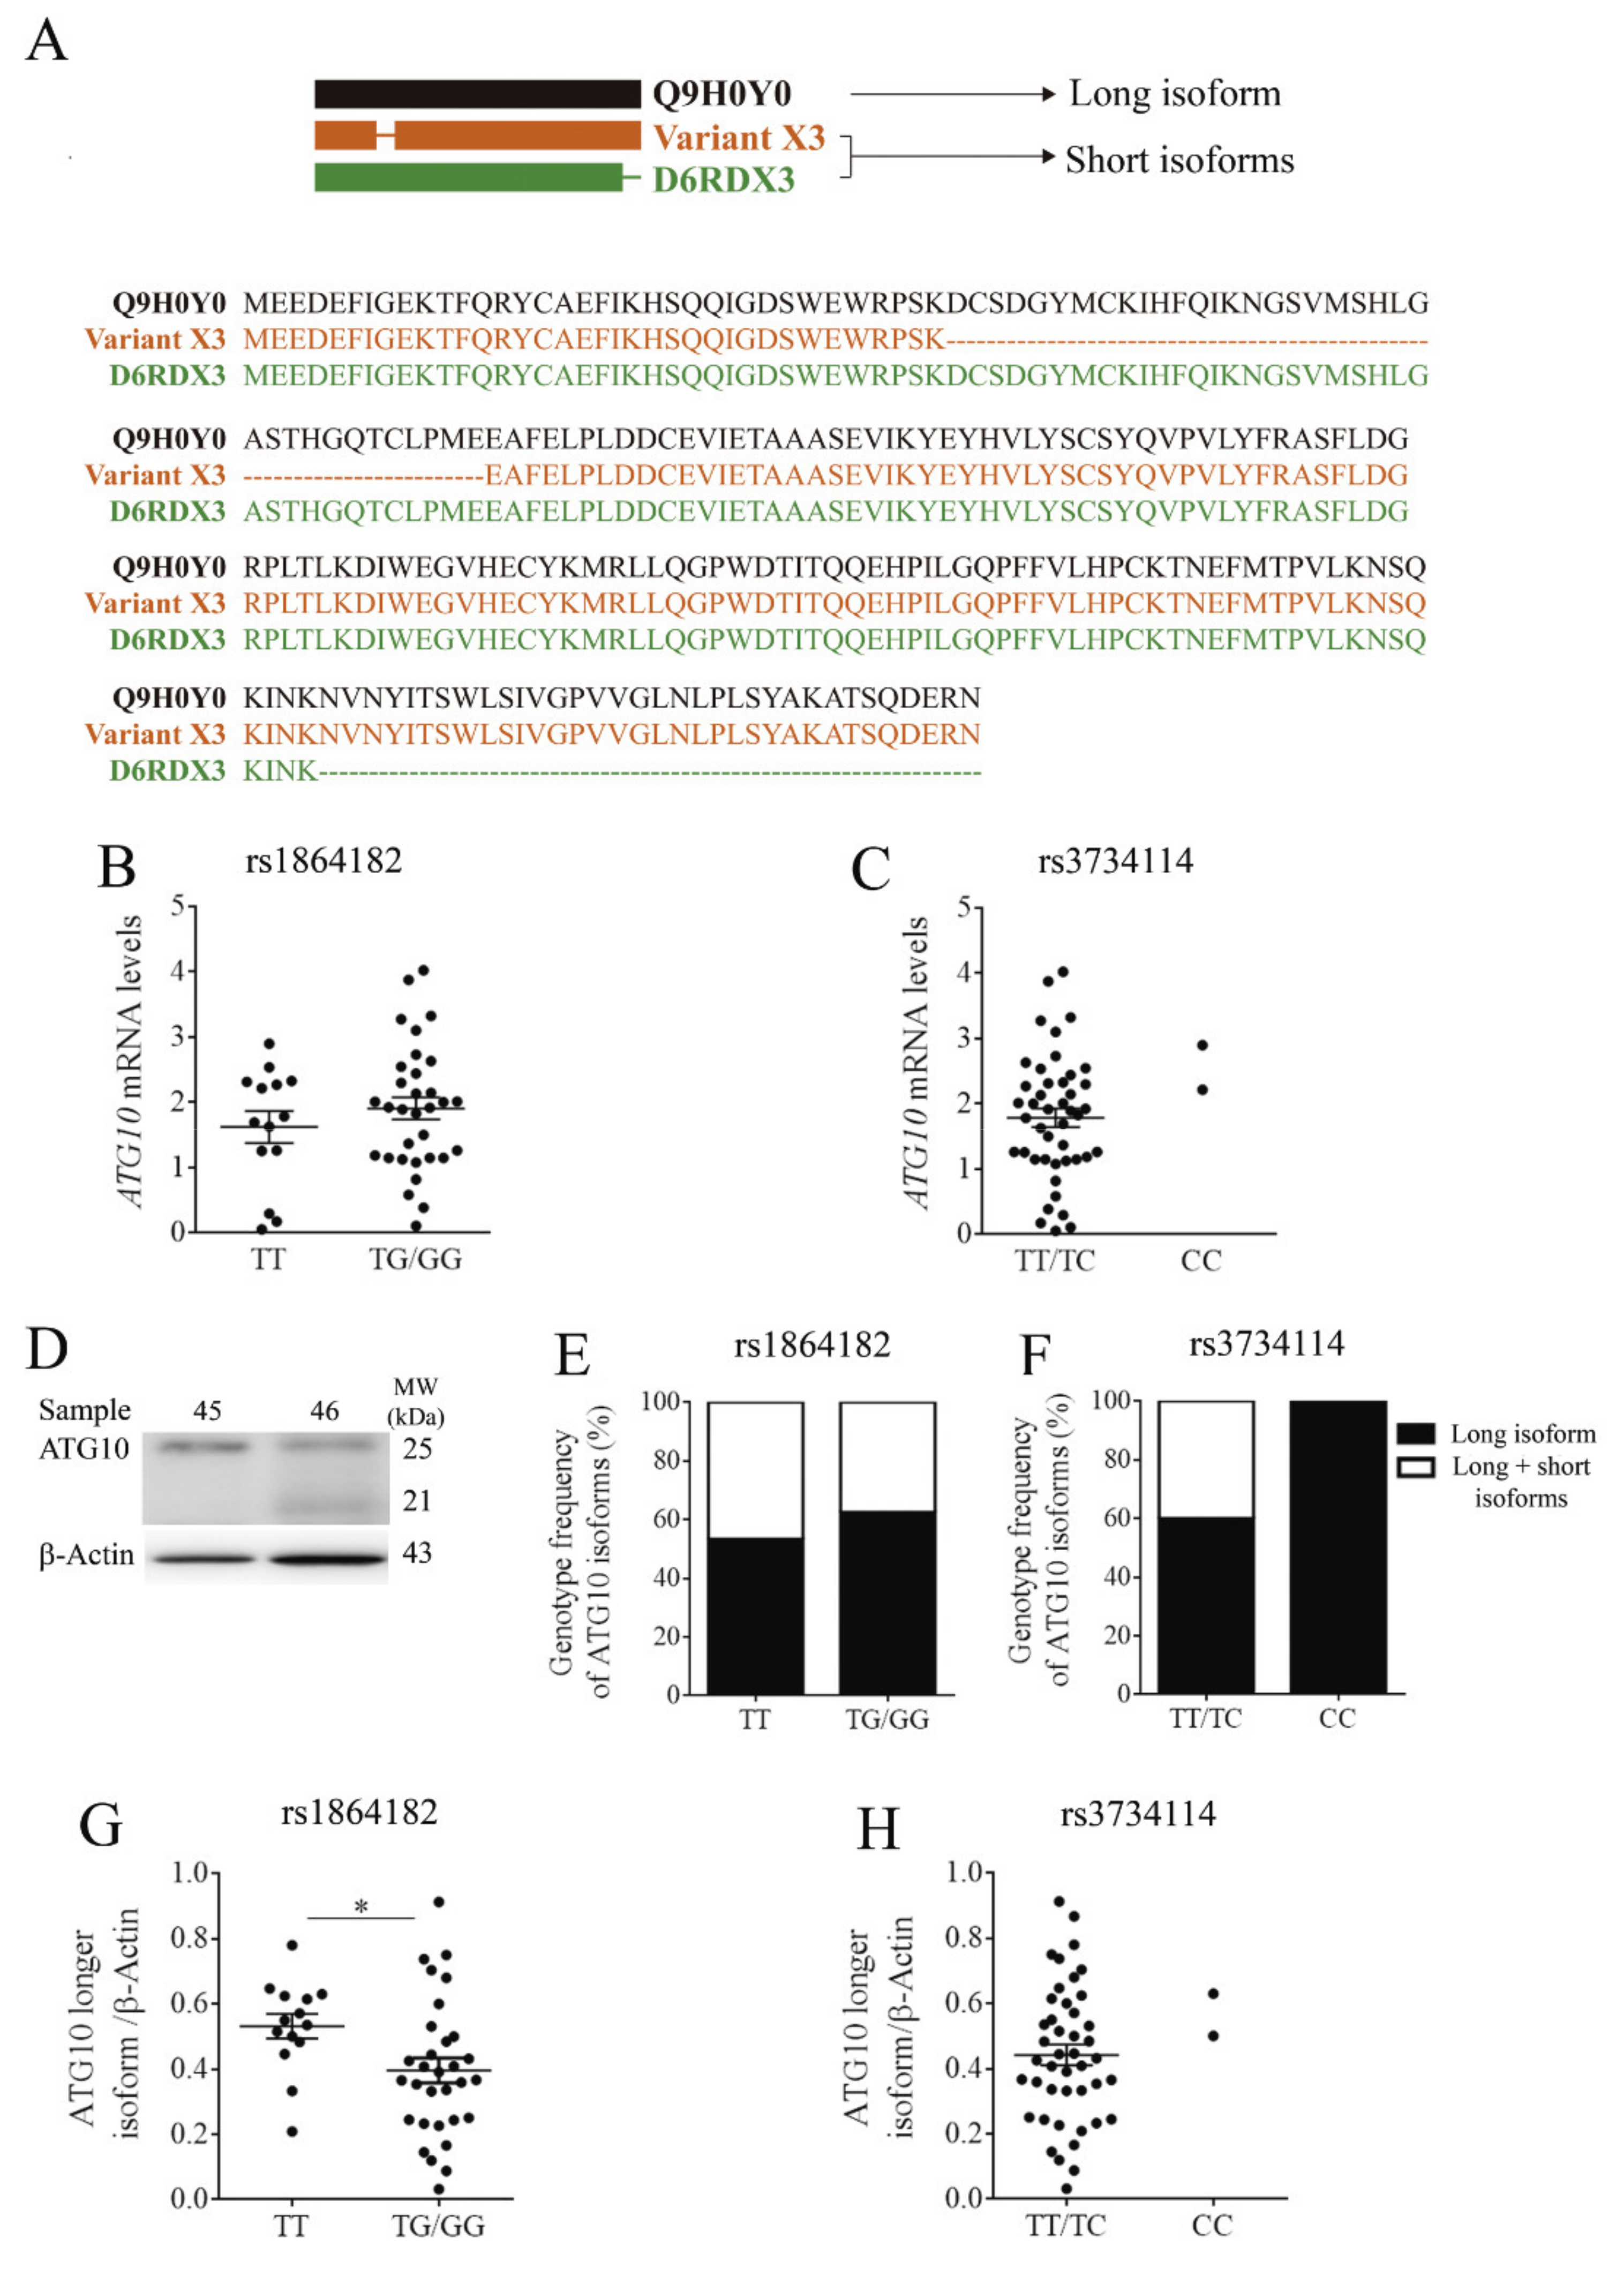
3.4. Impact of ATG10rs1864182 and ATG10rs3734114 in mRNA and Protein Levels

The impact of ATG10 SNPs associated with AML on mRNA expression and on the protein levels of ATG10 isoforms was assessed in PBMCs of healthy donors from cohort 2. The genotype characterization of ATG10 SNPs in cohort 2 is presented in Table 4. The similarity in genotype frequencies between cohort 2 and the CEU population (https://www.ncbi.nlm.nih.gov/snp/, accessed 12 January 2021) supported the use of this cohort. For the ATG10rs1864182, we followed the predicted dominant model as indicated by our analysis (Table 3) and therefore, TG and GG genotypes were combined in one group. Regarding ATG10rs3734114, the predictive model suggested a recessive behavior of the alternative C allele and therefore both TT and TC genotypes were combined. However, due to the low frequency of CC (4.3% in cohort 2), statistical analysis was not conducted for this SNP.
As mentioned earlier, ATG10 is an E2-like enzyme involved in E2 ubiquitin-like modifications, crucial for autophagosome formation [38]. Previous studies showed the existence of at least three different ATG10 protein isoforms, Q9H0Y0 (the longest isoform) and variants X3 and D6RDX3 (shorter isoforms) (Figure 1A) [22]. Q9H0Y0 is composed of 663 nucleotides, encoding 220 amino acids, whereas the isoform Variant X3 has 555 nucleotides coding for 184 amino acids (from www.ncbi.nlm.nih.gov/CCDS/, accessed 12 January 2021). Both short isoforms present identical sequences with the exception of a deletion of 36 amino acids in the N-terminal of Variant X3 [21,22]. The D6RDX3 isoform also has 555 nucleotides coding for 184 amino acids, but the 36 amino acids deletion occur at the C-terminal region. As a result of these deletions, isoforms Variant X3 and D6RDX3 have the same molecular weight of 21 kDa, whereas the long isoform has a molecular weight of 25 kDa.
Despite the ATG10 isoforms described, the study of the ATG10 mRNA levels was performed using a set of primers allowing for the amplification of a region common to all isoforms (Supplementary Table S2). The results demonstrated that the presence of the ATG10rs1864182 did not have any significant impact on ATG10 mRNA levels (Figure 1B). With regards to the presence of ATG10rs3734114, the two recessive individuals for the alternative allele C had a higher mRNA expression than heterozygous individuals, although the significance of this trend could not be verified by statistical analysis (Figure 1C).
The selected ATG10 antibody allowed distinguishing the longest from the shorter isoforms (Figure 1D). Immunoblot analysis revealed that none of the ATG10 isoforms are predominantly associated with a particular ATG10rs1864182 genotype (Figure 1E). No conclusions could be drawn for ATG10rs3734114, but it is nonetheless interesting to note that the two individuals carrying the homozygous alternative allele C only displayed the longest ATG10 isoform (Figure 1F).
We next evaluated the protein levels of the ATG10 long isoform, which is mainly involved in autophagy catalytic function [21,22]. In the presence of the ATG10rs1864182G, a statistically significant decrease of 25% in the ATG10 long isoform levels was observed (Figure 1G). It is interesting to note that both healthy donors with homozygous high-risk ATG10rs3734114 genotype showed a higher mean value of ATG10 long isoform levels than when in the presence of major allele (Figure 1H). These results are in accordance with the higher mRNA expression levels observed (Figure 1C). Based on these results, we further evaluated the functional impact of these ATG10 SNPs on ATG10 canonical function in autophagy.

3.5. Functional Effects of ATG10rs1864182 and ATG10rs3734114 on Autophagy

To investigate whether autophagy is affected by the presence of the protective or risk in ATG10 SNPs identified in our association analysis, we evaluated autophagic flux in PBMCs from healthy donors. Measurements were performed in both basal and stimulated conditions. For the latter, cells were treated with the autophagy inducer metformin during 4 h [39]. Autophagy flux was assessed by LC3 processing performed according to gold standard guidelines [34]. During autophagy, LC3-I is conjugated to phosphatidylethanolamine (PE) to form LC3-II, which co-localizes at the autophagosome membranes thus reflecting the number of autophagosomes and autophagy-related structures. When analyzing LC3-II levels in PBMCs of healthy donors (Figure 2A) carrying either ATG10rs1864182 or ATG10rs3734114, no significant differences were found in both basal and stimulated conditions between genotypes (Figure 2B,C). LC3-II has a high recycling turnover, synthesis and degradation. Therefore, we used an autophagosome-lysosome fusion inhibitor, bafilomycin A1 (Baf A1), to block this process, allowing the accumulation of autophagosomes. Under normal autophagic flux an accumulation of LC3-II is expected, and alterations in LC3-II accumulation suggest an imbalance by defaulted synthesis and/or degradation. LC3-II synthesis was assessed by computing the ratio of the LC3-II protein levels from stimulated conditions (treated with metformin) plus Baf A1 over the LC3-II protein levels of the samples under basal conditions with Baf A1 alone. The LC3-II degradation was also assessed by computing the ratio of the LC3-II protein levels in stimulated conditions plus Baf A1 over the LC3-II protein levels obtained under stimulated conditions only (Figure 2A) [34].
For the ATG10rs1864182, LC3-II synthesis was not significantly affected by the presence of the alternative allele (Figure 2D). On the other hand, the LC3-II degradation was reduced in individuals with this SNP, although this trend did not achieve statistical significance (Figure 2E). These observations suggested that the ATG10rs1864182G may be associated with a decreased autophagy flux. No differences were observed when evaluating LC3-II synthesis and degradation in individuals with and without the ATG10rs374114C/C. However, note the sample size of n = 2 in this case (Figure 2F,G).
p62 is a multifunctional protein involved in different pathways, including autophagy and the proteasomal degradation of ubiquitinated proteins. p62 is an autophagy substrate and like LC3-II has been extensively used as a reporter of autophagy activity [40]. Alterations in p62 accumulation and degradation also suggest changes in autophagic flux. Indeed, LC3 co-localizes and is immunoprecipitated with p62, suggesting that these two proteins are involved in the same complexes [41]. Furthermore, it is described that the turnover of p62 occurs in the same conditions as LC3 [41]. Altogether, autophagy inhibition leads to an increase of p62 protein levels. We next examined the accumulation and the degradation of p62 (Figure 2H). The total p62 levels for both of the studied SNPs did not reveal significant differences when comparing individuals with the presence of minor alleles (Figure 2I,J). However, when analyzing p62 accumulation and degradation, as done for LC3-II [41], in the presence of ATG10rs1864182G, we found a significant increase in the p62 accumulation (Figure 2K), without major alterations on p62 degradation (Figure 2L). Decrease of LC3-II degradation and an increase of p62 accumulation is associated with a reduction of autophagy flux [34]. No differences in p62 were observed between the two groups with ATG10rs374114C/C (Figure 2M,N, note n = 2).
Impaired autophagy leads to an accumulation of ubiquitinated proteins [42], which could be associated with a faulty degradative process such as the ubiquitin proteasome system (UPS). Ubiquitination is a well-known post-translational modification, involving the conjugation of different ubiquitin length chains to proteins [43]. Depending on the distinct structure of the ubiquitin chains, the protein outcome will be different (degradation, signal transduction or subcellular localization) [44]. Thus, to further support the defective autophagy observed in individuals presenting the ATG10rs1864182G and to evaluate its impact on the proteasomal degradation, we evaluated the total ubiquitination profile by immunoblot analysis (Figure 2O). Our results revealed that individuals carrying the ATG10rs1864182G tended to present increased levels of ubiquitinated proteins (Figure 2P). Regarding the ATG10rs374114C/C no major conclusions could be drawn (Figure 2Q).
In summary, concerning the ATG10rs1864182, the results herein suggest a diminished autophagic flux in individuals with the protective G allele, resulting from decreased LC3-II degradation and consequent p62 accumulation. This also suggests that individuals who do not display the protective allele exhibit higher autophagy activity. Furthermore, these changes in autophagy appear to have a mild impact on the UPS system, since individuals presenting the ATG10rs1864182G appear to have increased levels of ubiquitinated proteins. For the ATG10rs374114, no major conclusions could be drawn, due to the low frequency of the risk homozygous allele in the population.

4. Discussion

AML is a severe disease with a rapid progression and a high fatality rate, particularly in the elderly. AML affects 3 to 4 persons per 100,000 per year (https://seer.cancer.gov/statfacts/html/amyl.html, accessed 12 January 2021). The existence of a familiar or personal medical history (e.g., close relatives with AML, blood disorders, and genetic syndromes), the incidence of a primary cancer undergoing chemotherapy, and the presence of clonal hematopoiesis of indeterminate potential (CHIP) are well-known risk factors for AML development. Therefore, the development of new strategies for risk stratification of individuals at higher risk will be important to place them on the medical radar.
After studying the impact of different SNPs on autophagy and other-related processes (Supplementary Table S1), in this study, we evaluated the association between three SNPs in the ATG10 gene with AML in a case-control study. SNPs have been recognized as risk factors for disease development and are an excellent tool to investigate etiology, inter-individual differences in treatment response, and outcomes of cancers [45]. Genetic variations of autophagy core genes have been the focus of research in several human cancers [46]. The ATG10rs1864182 has been previously associated with decreased risk of breast cancer [47] and melanoma [48]. However, other studies have shown the association of the ATG10rs1864182 with poor lung cancer survival in particular on the non-small cell lung cancer (NSCLC) [24]. To the best of our knowledge, our study is the first to examine the association of ATG10 SNPs with AML and to explore the functional implications of these SNPs on autophagy. We described the association of ATG10rs1864182G with a decreased probability of developing AML. ATG10rs1864182 was also shown to serve as biomarker for primary or acquired resistance to chemotherapy when using gefitinib (an epidermal growth factor receptor (EGFR)-TKI drug) in advanced lung adenocarcinoma patients with EGFR mutations [49]. Studying the involvement of ATG10rs1864182 in the resistance to chemotherapy may be a useful future biomarker for tailoring AML treatments.
ATG10rs3734114 was recently associated with increased brain metastasis in NSCLC patients [30]. The study showed that patients carrying the ATG10rs3734114CT/CC genotypes had an increased cumulative brain metastasis hazard of 46% compared to 13% in patients with the TT genotype [30]. In our studies, we found for the first time an association of the ATG10rs3734114C/C with a higher risk of developing AML, suggesting that the ATG10rs3734114C/C variant could be a risk factor for AML.
Finally, in our study, we did not find any association between the ATG10rs1864183 and AML. Nevertheless, its association with the development of pharyngeal cancer has been previously described [50]. Altogether, our results show the potential application of the ATG10rs1864182 and ATG10rs3734114 as risk biomarkers for AML.
Random association between ATG10rs1864182 and ATG10rs3734114 was observed when analyzing the LD between the two alleles. This indicates that the SNPs are not mutually exclusive, even though they have opposite association with AML. Because of the low probability of ATG10rs3734114, we do not have enough subjects to evaluate which effect (protective or risk) prevails in case of co-occurrence, but it would be interesting to address this in the future. It would also be interesting to explore association between these two SNPs and other described SNPs impacting AML [19].
After flagging the association of ATG10rs1864182G and ATG10rs3734114C/C with AML, we explored which potential impact those sequence variations might have on mRNA expression and protein function in healthy individuals. Although we were able to detect alterations in the ATG10 protein, with decreased levels of the long isoform in the presence of ATG10rs1864182G, the amount of ATG10 transcripts was not altered. It is important to note that the primers used in our study amplify all the isoforms and do not allow a selective quantification of the different ATG10 transcripts. A putative differential expression between transcripts could justify why ATG10rs1864182 is described to act as an expression quantitative trait locus across multiple tissues, including whole blood, in the Genotype-Tissue Expression (GTEx) project [51].
The decreased protein levels of ATG10 long isoform in ATG10rs1864182G carriers were associated with the reduction of autophagic flux, its canonical function, in agreement with previous observations [21]. Given the role of autophagy in leukemia [52], and in chemotherapy susceptibility and resistance [53,54,55], this reduction in autophagy could potentially be beneficial to lower the probability of developing AML. In the ATG10 immunoblot profile (Supplementary Figure S2), we detected bands with a similar molecular weight as ATG10 isoforms. Although not described in literature, we hypothesize that these other detected bands could correspond to yet unknown ATG10 isoforms or even ATG10 isoforms that underwent post-translational modifications, which may alter their mobility in the SDS-Page gel. This hypothesis should be explored further in future studies.
Regarding ATG10rs3734114C/C, due to the low number of individuals in the cohort, no conclusions can be drawn with respect to mRNA levels, protein levels and autophagy. For this reason, an increased number of homozygous mutants for ATG10rs3734114 are needed, or alternatively an in vitro approach using gene editing could be adopted.
As with ATG10rs1864182, the ATG10rs3734114 is characterized by a missense mutation resulting in a codon for a different amino acid. These mutations can potentially change the functional role of ATG10 in autophagy and/or in other non-canonical processes in which it may be involved. Hopefully, with advances in artificial intelligence tools uncovering the 3D shapes of proteins such as AlphaFold [56], accurate predictions of protein structural changes due to SNPs will enable a better understanding of the biological implications of these mutations. Future studies should also aim to understand if any of the ATG10 isoforms is involved in non-canonical roles [57] affecting the likelihood of AML.

5. Conclusions

In conclusion, we found an association between ATG10rs1864182G and a lower-risk of developing AML, which is accompanied by an impairment of ATG10’s autophagy function. In addition, we describe an increased risk of developing AML in individuals carrying the ATG10rs3734114C/C. Our work reveals new mechanisms by which genetic variations in ATG10 may coordinate the development of AML. The gathered evidence could be further exploited in prevention strategies or screening protocols of subjects carrying other risk factors for AML, such as CHIP individuals.

Supplementary Materials

The following are available online at https://www.mdpi.com/2072-6694/13/6/1344/s1, Figure S1: Schematic representation of ATG10 and the three-studied SNPs; Figure S2. The whole Western blot showing all bands and molecular weight markers of the blot represented in Figure 1D. Figure S3. The whole Western blot showing all bands and molecular weight markers of the blot represented in Figure 2A and 2H. Figure S4. The whole Western blot showing all bands and molecular weight markers of the blot represented in Figure 2O. Table S1: Association of autophagy SNPs with Acute Myeloid Leukemia (AML); Table S2: Primer sets used to perform the qPCR to evaluate ATG10 expression (housekeepers: GAPDH, RPL13A and B2M).

Author Contributions

I.C., B.S.-M., and A.C.A. made equal contributions; conceptualization, P.L. and I.C.; methodology, B.S.-M., A.C.A., H.S., Â.F., C.C., and A.C.; software, A.C.A.; formal analysis, A.C.A., B.S.-M., and P.L.; investigation, B.S.-M., A.C.A., H.S., Â.F., and J.M.S.-M.; resources, H.S., A.C., J.S., and P.L.; data curation, A.C.A., B.S.-M., and P.L.; writing—original draft preparation, A.C.A. and B.S.-M.; writing—review and editing, I.C., C.C., A.C., J.S., and P.L.; supervision, P.L.; project administration, P.L.; funding acquisition, P.L. All authors have read and agreed to the published version of the manuscript.

Funding

This research was funded by FEDER and Foundation for Science and Technology (FCT), grant number POCI-01-0145-FEDER-028159 and POCI-01-0145-FEDER-030782); by Fondo de Investigaciones Sanitarias (Madrid, Spain), grant number ISCIII-FEDER PI20/01845, ISCIII-FEDER PI12/02688, and ISCIII-FEDER PI17/02276. B.S.M. was funded by FCT, grant number DL 57/2016. A.C.A. was funded by FCT, grant number POCI-01-0145-FEDER-028159. C.C. was funded by FCT, grant number CEECIND/04058/2018. A.C. was funded by FCT, grant number CEECIND/03628/2017.

Institutional Review Board Statement

The study was conducted according to the guidelines of the Declaration of Helsinki, and approved by the Ethics Committee of CEICVS (SECVS 010/2015) and (202112715517/2020).

Informed Consent Statement

Informed consent was obtained from all subjects involved in the study.

Data Availability Statement

The data presented in this study are available on request from the corresponding author. The data are not publicly available due to ethical reasons.

Conflicts of Interest

The authors declare no conflict of interest.

References

  1. Estey, E.; Dohner, H. Acute myeloid leukaemia. Lancet 2006, 368, 1894–1907. [Google Scholar] [CrossRef]
  2. Klco, J.M.; Mullighan, C.G. Advances in germline predisposition to acute leukaemias and myeloid neoplasms. Nat. Rev. Cancer 2020. [Google Scholar] [CrossRef]
  3. Steensma, D.P. Clinical consequences of clonal hematopoiesis of indeterminate potential. Blood Adv. 2018, 2, 3404–3410. [Google Scholar] [CrossRef]
  4. Chen, D.P.; Chang, S.W.; Wang, P.N.; Hus, F.P.; Tseng, C.P. Association between single nucleotide polymorphisms within HLA region and disease relapse for patients with hematopoietic stem cell transplantation. Sci. Rep. 2019, 9, 13731. [Google Scholar] [CrossRef] [Green Version]
  5. Illmer, T.; Schuler, U.S.; Thiede, C.; Schwarz, U.I.; Kim, R.B.; Gotthard, S.; Freund, D.; Schakel, U.; Ehninger, G.; Schaich, M. MDR1 gene polymorphisms affect therapy outcome in acute myeloid leukemia patients. Cancer Res. 2002, 62, 4955–4962. [Google Scholar]
  6. Kim, D.H.; Park, J.Y.; Sohn, S.K.; Lee, N.Y.; Baek, J.H.; Jeon, S.B.; Kim, J.G.; Suh, J.S.; Do, Y.R.; Lee, K.B. Multidrug resistance-1 gene polymorphisms associated with treatment outcomes in de novo acute myeloid leukemia. Int. J. Cancer 2006, 118, 2195–2201. [Google Scholar] [CrossRef] [PubMed]
  7. Shi, J.Y.; Shi, Z.Z.; Zhang, S.J.; Zhu, Y.M.; Gu, B.W.; Li, G.; Bai, X.T.; Gao, X.D.; Hu, J.; Jin, W.; et al. Association between single nucleotide polymorphisms in deoxycytidine kinase and treatment response among acute myeloid leukaemia patients. Pharmacogenetics 2004, 14, 759–768. [Google Scholar] [CrossRef] [PubMed]
  8. Xu, P.; Wang, X.; Xu, Y.; Chen, B.; Ouyang, J. The rs9909659G/A polymorphisms of the STAT3 gene provide prognostic information in acute myeloid leukemia. Transl. Cancer Res. 2016, 5, 448–457. [Google Scholar] [CrossRef]
  9. Damm, F.; Heuser, M.; Morgan, M.; Yun, H.; Grosshennig, A.; Gohring, G.; Schlegelberger, B.; Dohner, K.; Ottmann, O.; Lubbert, M.; et al. Single nucleotide polymorphism in the mutational hotspot of WT1 predicts a favorable outcome in patients with cytogenetically normal acute myeloid leukemia. J. Clin. Oncol. 2010, 28, 578–585. [Google Scholar] [CrossRef] [PubMed]
  10. AbdElMaksoud, S.S.; ElGamal, R.A.E.; Pessar, S.A.; Salem, D.D.E.; Abdelsamee, H.F.; Agamy, H.S. Prognostic implications of IDH1rs11554137 and IDH2R140Q SNPs mutations in cytogenetically normal acute myeloid leukemia. Egypt. J. Med. Hum. Genet. 2019, 20. [Google Scholar] [CrossRef] [Green Version]
  11. Ho, P.A.; Kopecky, K.J.; Alonzo, T.A.; Gerbing, R.B.; Miller, K.L.; Kuhn, J.; Zeng, R.; Ries, R.E.; Raimondi, S.C.; Hirsch, B.A.; et al. Prognostic implications of the IDH1 synonymous SNP rs11554137 in pediatric and adult AML: A report from the Children’s Oncology Group and SWOG. Blood 2011, 118, 4561–4566. [Google Scholar] [CrossRef]
  12. Castro, I.; Sampaio-Marques, B.; Ludovico, P. Targeting Metabolic Reprogramming in Acute Myeloid Leukemia. Cells 2019, 8, 967. [Google Scholar] [CrossRef] [PubMed] [Green Version]
  13. Schnittger, S.; Kohl, T.M.; Leopold, N.; Schoch, C.; Wichmann, H.E.; Kern, W.; Lohse, P.; Hiddemann, W.; Haferlach, T.; Spiekermann, K. D324N single-nucleotide polymorphism in the FLT3 gene is associated with higher risk of myeloid leukemias. Genes Chromosomes Cancer 2006, 45, 332–337. [Google Scholar] [CrossRef] [PubMed]
  14. Cingeetham, A.; Vuree, S.; Dunna, N.R.; Gorre, M.; Nanchari, S.R.; Edathara, P.M.; Meka, P.; Annamaneni, S.; Digumarthi, R.; Sinha, S.; et al. Influence of BCL2-938C>A and BAX-248G>A promoter polymorphisms in the development of AML: Case-control study from South India. Tumour Biol. J. Int. Soc. Oncodev. Biol. Med. 2015, 36, 7967–7976. [Google Scholar] [CrossRef] [PubMed]
  15. Cingeetham, A.; Vuree, S.; Dunna, N.R.; Gorre, M.; Nanchari, S.R.; Edathara, P.M.; Mekkaw, P.; Annamaneni, S.; Digumarthi, R.R.; Sinha, S.; et al. Association of caspase9 promoter polymorphisms with the susceptibility of AML in south Indian subjects. Tumour Biol. J. Int. Soc. Oncodev. Biol. Med. 2014, 35, 8813–8822. [Google Scholar] [CrossRef]
  16. Mizushima, N. Autophagy: Process and function. Genes Dev. 2007, 21, 2861–2873. [Google Scholar] [CrossRef] [Green Version]
  17. Yun, C.W.; Lee, S.H. The Roles of Autophagy in Cancer. Int. J. Mol. Sci. 2018, 19, 3466. [Google Scholar] [CrossRef] [Green Version]
  18. Du, W.; Xu, A.; Huang, Y.; Cao, J.; Zhu, H.; Yang, B.; Shao, X.; He, Q.; Ying, M. The role of autophagy in targeted therapy for acute myeloid leukemia. Autophagy 2020, 1–15. [Google Scholar] [CrossRef]
  19. Chen, X.X.; Li, Z.P.; Zhu, J.H.; Xia, H.T.; Zhou, H. Systematic Analysis of Autophagy-Related Signature Uncovers Prognostic Predictor for Acute Myeloid Leukemia. DNA Cell Biol. 2020, 39, 1595–1605. [Google Scholar] [CrossRef]
  20. Phillips, A.R.; Suttangkakul, A.; Vierstra, R.D. The ATG12-conjugating enzyme ATG10 Is essential for autophagic vesicle formation in Arabidopsis thaliana. Genetics 2008, 178, 1339–1353. [Google Scholar] [CrossRef] [PubMed] [Green Version]
  21. Li, Y.C.; Zhang, M.Q.; Zhang, J.P. Opposite Effects of Two Human ATG10 Isoforms on Replication of a HCV Sub-genomic Replicon Are Mediated via Regulating Autophagy Flux in Zebrafish. Front. Cell Infect. Microbiol. 2018, 8, 109. [Google Scholar] [CrossRef]
  22. Zhao, Q.; Hu, Z.Y.; Zhang, J.P.; Jiang, J.D.; Ma, Y.Y.; Li, J.R.; Peng, Z.G.; Chen, J.H. Dual Roles of Two Isoforms of Autophagy-related Gene ATG10 in HCV-Subgenomic replicon Mediated Autophagy Flux and Innate Immunity. Sci. Rep. 2017, 7, 11250. [Google Scholar] [CrossRef]
  23. Jiang, P.; Mizushima, N. Autophagy and human diseases. Cell Res. 2014, 24, 69–79. [Google Scholar] [CrossRef] [Green Version]
  24. Xie, K.; Liang, C.; Li, Q.; Yan, C.; Wang, C.; Gu, Y.; Zhu, M.; Du, F.; Wang, H.; Dai, J.; et al. Role of ATG10 expression quantitative trait loci in non-small cell lung cancer survival. Int. J. Cancer 2016, 139, 1564–1573. [Google Scholar] [CrossRef] [PubMed] [Green Version]
  25. Salvatori, B.; Iosue, I.; Djodji Damas, N.; Mangiavacchi, A.; Chiaretti, S.; Messina, M.; Padula, F.; Guarini, A.; Bozzoni, I.; Fazi, F.; et al. Critical Role of c-Myc in Acute Myeloid Leukemia Involving Direct Regulation of miR-26a and Histone Methyltransferase EZH2. Genes Cancer 2011, 2, 585–592. [Google Scholar] [CrossRef] [Green Version]
  26. Zhu, F.; Huang, R.; Li, J.; Liao, X.; Huang, Y.; Lai, Y. Identification of Key Genes and Pathways Associated with RUNX1 Mutations in Acute Myeloid Leukemia Using Bioinformatics Analysis. Med. Sci. Monit. 2018, 24, 7100–7108. [Google Scholar] [CrossRef] [PubMed]
  27. Buffen, K.; Oosting, M.; Quintin, J.; Ng, A.; Kleinnijenhuis, J.; Kumar, V.; van de Vosse, E.; Wijmenga, C.; van Crevel, R.; Oosterwijk, E.; et al. Autophagy controls BCG-induced trained immunity and the response to intravesical BCG therapy for bladder cancer. PLoS Pathog. 2014, 10, e1004485. [Google Scholar] [CrossRef]
  28. Li, Q.X.; Zhou, X.; Huang, T.T.; Tang, Y.; Liu, B.; Peng, P.; Sun, L.; Wang, Y.H.; Yuan, X.L. The Thr300Ala variant of ATG16L1 is associated with decreased risk of brain metastasis in patients with non-small cell lung cancer. Autophagy 2017, 13, 1053–1063. [Google Scholar] [CrossRef] [PubMed] [Green Version]
  29. Plantinga, T.S.; van de Vosse, E.; Huijbers, A.; Netea, M.G.; Joosten, L.A.; Smit, J.W.; Netea-Maier, R.T. Role of genetic variants of autophagy genes in susceptibility for non-medullary thyroid cancer and patients outcome. PLoS ONE 2014, 9, e94086. [Google Scholar] [CrossRef] [PubMed] [Green Version]
  30. Yuan, Y.; Han, H.; Jin, Y.; Zhou, X.; Yi, M.; Tang, Y.; Li, Q. Implications of the autophagy core gene variations on brain metastasis risk in non-small cell lung cancer treated with EGFR-TKI. Oncol. Transl. Med. 2020, 5, 185–192. [Google Scholar]
  31. Sanchez-Maldonado, J.M.; Campa, D.; Springer, J.; Badiola, J.; Niazi, Y.; Moniz-Diez, A.; Hernandez-Mohedo, F.; Gonzalez-Sierra, P.; Ter Horst, R.; Macauda, A.; et al. Host immune genetic variations influence the risk of developing acute myeloid leukaemia: Results from the NuCLEAR consortium. Blood Cancer J. 2020, 10, 75. [Google Scholar] [CrossRef]
  32. Clarke, G.M.; Anderson, C.A.; Pettersson, F.H.; Cardon, L.R.; Morris, A.P.; Zondervan, K.T. Basic statistical analysis in genetic case-control studies. Nat. Protoc. 2011, 6, 121–133. [Google Scholar] [CrossRef] [Green Version]
  33. Bustin, S.A.; Benes, V.; Garson, J.A.; Hellemans, J.; Huggett, J.; Kubista, M.; Mueller, R.; Nolan, T.; Pfaffl, M.W.; Shipley, G.L.; et al. The MIQE guidelines: Minimum information for publication of quantitative real-time PCR experiments. Clin. Chem. 2009, 55, 611–622. [Google Scholar] [CrossRef] [Green Version]
  34. Klionsky, D.J.; Abdelmohsen, K.; Abe, A.; Abedin, M.J.; Abeliovich, H.; Acevedo Arozena, A.; Adachi, H.; Adams, C.M.; Adams, P.D.; Adeli, K.; et al. Guidelines for the use and interpretation of assays for monitoring autophagy (3rd edition). Autophagy 2016, 12, 1–222. [Google Scholar] [CrossRef] [PubMed] [Green Version]
  35. Juliusson, G.; Antunovic, P.; Derolf, A.; Lehmann, S.; Mollgard, L.; Stockelberg, D.; Tidefelt, U.; Wahlin, A.; Hoglund, M. Age and acute myeloid leukemia: Real world data on decision to treat and outcomes from the Swedish Acute Leukemia Registry. Blood 2009, 113, 4179–4187. [Google Scholar] [CrossRef] [Green Version]
  36. Siegel, R.L.; Miller, K.D.; Jemal, A. Cancer statistics, 2016. Ca A Cancer J. Clin. 2016, 66, 7–30. [Google Scholar] [CrossRef] [Green Version]
  37. De-Morgan, A.; Meggendorfer, M.; Haferlach, C.; Shlush, L. Male predominance in AML is associated with specific preleukemic mutations. Leukemia 2020. [Google Scholar] [CrossRef] [PubMed]
  38. Flanagan, M.D.; Whitehall, S.K.; Morgan, B.A. An Atg10-like E2 enzyme is essential for cell cycle progression but not autophagy in Schizosaccharomyces pombe. Cell Cycle 2013, 12, 271–277. [Google Scholar] [CrossRef] [PubMed] [Green Version]
  39. Levine, B.; Packer, M.; Codogno, P. Development of autophagy inducers in clinical medicine. J. Clin. Investig. 2015, 125, 14–24. [Google Scholar] [CrossRef] [Green Version]
  40. Liu, W.J.; Ye, L.; Huang, W.F.; Guo, L.J.; Xu, Z.G.; Wu, H.L.; Yang, C.; Liu, H.F. p62 links the autophagy pathway and the ubiqutin-proteasome system upon ubiquitinated protein degradation. Cell. Mol. Biol. Lett. 2016, 21, 29. [Google Scholar] [CrossRef] [PubMed] [Green Version]
  41. Martin-Maestro, P.; Gargini, R.; A Sproul, A.; Garcia, E.; Anton, L.C.; Noggle, S.; Arancio, O.; Avila, J.; Garcia-Escudero, V. Mitophagy Failure in Fibroblasts and iPSC-Derived Neurons of Alzheimer’s Disease-Associated Presenilin 1 Mutation. Front. Mol. Neurosci. 2017, 10, 291. [Google Scholar] [CrossRef] [Green Version]
  42. Hara, T.; Nakamura, K.; Matsui, M.; Yamamoto, A.; Nakahara, Y.; Suzuki-Migishima, R.; Yokoyama, M.; Mishima, K.; Saito, I.; Okano, H.; et al. Suppression of basal autophagy in neural cells causes neurodegenerative disease in mice. Nature 2006, 441, 885–889. [Google Scholar] [CrossRef]
  43. Chen, R.H.; Chen, Y.H.; Huang, T.Y. Ubiquitin-mediated regulation of autophagy. J. Biomed. Sci. 2019, 26, 80. [Google Scholar] [CrossRef]
  44. Tan, J.M.M.; Wong, E.S.P.; Dawson, V.L.; Dawson, T.; Lim, K.-L. Lysine 63-linked polyubiquitin potentially partners with p62 to promote the clearance of protein inclusions by autophagy. Autophagy 2008, 4, 251–253. [Google Scholar] [CrossRef] [Green Version]
  45. Erichsen, H.C.; Chanock, S.J. SNPs in cancer research and treatment. Br. J. Cancer 2004, 90, 747–751. [Google Scholar] [CrossRef] [Green Version]
  46. Shastry, B.S. SNPs in disease gene mapping, medicinal drug development and evolution. J. Hum. Genet. 2007, 52, 871–880. [Google Scholar] [CrossRef] [PubMed] [Green Version]
  47. Qin, Z.; Xue, J.; He, Y.; Ma, H.; Jin, G.; Chen, J.; Hu, Z.; Liu, X.; Shen, H. Potentially functional polymorphisms in ATG10 are associated with risk of breast cancer in a Chinese population. Gene 2013, 527, 491–495. [Google Scholar] [CrossRef] [PubMed]
  48. White, K.A.; Luo, L.; Thompson, T.A.; Torres, S.; Hu, C.A.; Thomas, N.E.; Lilyquist, J.; Anton-Culver, H.; Gruber, S.B.; From, L.; et al. Variants in autophagy-related genes and clinical characteristics in melanoma: A population-based study. Cancer Med. 2016, 5, 3336–3345. [Google Scholar] [CrossRef] [Green Version]
  49. Yuan, J.; Zhang, N.; Yin, L.; Zhu, H.; Zhang, L.; Zhou, L.; Yang, M. Clinical Implications of the Autophagy Core Gene Variations in Advanced Lung Adenocarcinoma Treated with Gefitinib. Sci. Rep. 2017, 7, 17814. [Google Scholar] [CrossRef] [Green Version]
  50. Fernandez-Mateos, J.; Seijas-Tamayo, R.; Klain, J.C.A.; Borgonon, M.P.; Perez-Ruiz, E.; Mesia, R.; Del Barco, E.; Coloma, C.S.; Dominguez, A.R.; Daroqui, J.C.; et al. Analysis of autophagy gene polymorphisms in Spanish patients with head and neck squamous cell carcinoma. Sci. Rep. 2017, 7, 6887. [Google Scholar] [CrossRef] [Green Version]
  51. Consortium, G.T. The GTEx Consortium atlas of genetic regulatory effects across human tissues. Science 2020, 369, 1318–1330. [Google Scholar] [CrossRef] [PubMed]
  52. Zhang, S.P.; Niu, Y.N.; Yuan, N.; Zhang, A.H.; Chao, D.; Xu, Q.P.; Wang, L.J.; Zhang, X.G.; Zhao, W.L.; Zhao, Y.; et al. Role of autophagy in acute myeloid leukemia therapy. Chin. J. Cancer 2013, 32, 130–135. [Google Scholar] [CrossRef] [PubMed] [Green Version]
  53. Evangelisti, C.; Evangelisti, C.; Chiarini, F.; Lonetti, A.; Buontempo, F.; Neri, L.M.; McCubrey, J.A.; Martelli, A.M. Autophagy in acute leukemias: A double-edged sword with important therapeutic implications. Biochim. Biophys. Acta 2015, 1853, 14–26. [Google Scholar] [CrossRef] [PubMed] [Green Version]
  54. Amaravadi, R.K.; Kimmelman, A.C.; Debnath, J. Targeting Autophagy in Cancer: Recent Advances and Future Directions. Cancer Discov. 2019, 9, 1167–1181. [Google Scholar] [CrossRef] [Green Version]
  55. Fernandes, A.; Azevedo, M.M.; Pereira, O.; Sampaio-Marques, B.; Paiva, A.; Correia-Neves, M.; Castro, I.; Ludovico, P. Proteolytic systems and AMP-activated protein kinase are critical targets of acute myeloid leukemia therapeutic approaches. Oncotarget 2015, 6, 31428–31440. [Google Scholar] [CrossRef] [PubMed] [Green Version]
  56. Callaway, E. ‘It will change everything’: DeepMind’s AI makes gigantic leap in solving protein structures. Nature 2020, 588, 203–204. [Google Scholar] [CrossRef]
  57. Galluzzi, L.; Green, D.R. Autophagy-Independent Functions of the Autophagy Machinery. Cell 2019, 177, 1682–1699. [Google Scholar] [CrossRef]
Figure 1. (A) Schematic representation of ATG10 protein sequence and the corresponding long (Q9H0Y0, black) and short (Variant X3 and D6RDX3, orange and green, respectively) isoforms. (B,C) ATG10 mRNA levels of individuals carrying ATG10rs1864182 and ATG10rs374114, respectively. (D) Illustrative western blot analysis of ATG10 isoforms: long (25kDa, sample 45) and short (21kDa, sample 46). (E,F) Genotype frequencies of short and long ATG10 isoforms in the dominant model for rs1864182 and recessive model for rs374114, respectively. Black squares represent the percentage of individuals with the presence of the long isoform, whereas white squares correspond to the percentage of individuals with long and short isoforms. (G) Levels of ATG10 long isoform for the ATG10rs1864182 carriers (* denotes p < 0.05, unpaired t-test). (H) ATG10 long isoform levels for the ATG10rs3734114 carriers. Protein levels were normalized by β-actin level. Error bars denote one standard deviation.
Cancers 13 01344 g001
Figure 2. (A) Representative blot for study of LC3 processing. For ATG10rs1864182 and ATG10rs3734114: (B,C) LC3-II levels; (D,F) LC3 synthesis and (E,G) degradation. (H) Representative blot for p62 levels. For ATG10rs1864182 and ATG10rs3734114: (I,J) p62 levels; (K,M) p62 accumulation and (L,N) degradation. (O) Representative blot for ubiquitination profile and (P,Q) graphical representation of the intensity of total UB/β-actin obtained by densitometric analysis, for ATG10rs1864182 and ATG10rs3734114, respectively. Statistical significance of the data was determined by Mann Whitney test (* p ≤ 0.05). The error bars represent one standard error of the mean (SEM).
Cancers 13 01344 g002
Table 1. Demographic characterization of the two cohorts studied.
Cohort 1—Spanish Multicenter
Healthy Donors 356
Gender166 male
187 female
3 NA
Age56 ± 6 years mean age
Acute Myeloid Leukemia 309
Gender167 male
133 female
9 NA
Age58 ± 17 years mean age
Cohort 2—Portuguese Donors
Healthy Donors 46
Gender12 male
34 female
Age39 ± 14 years mean age
NA denotes non-available.
Table 2. Information regarding the ATG10 polymorphisms. Major allele was considered the most frequent allele in the European population based on the National Library of Medicine for the corresponding SNP.
Genotyped SNPsrs1864182rs1864183rs3734114
Chromosome555
Chromosome Position822534218225339782058570
Major AlleleTCT
Base changeT > GC > TT > C
Minor Allele Frequency (MAF) in the controls0.5080.4290.202
p value for HWE test in our controls0.8210.3020.365
Table 3. Association of ATG10 SNPs with Acute Myeloid Leukemia (AML). Adjusted odds ratio (OR) and 95% confidence intervals (CIs) for association between SNPs and AML were estimated using logistic regression.
SNPsGenotypesDonors No. (%)χ2
(pad)
LR
Dominant
LR
Recessive
ControlAMLOR (CI)OR (CI)
rs1864182TT77 (25)87 (35)0.1740.58
(0.42–0.80)
p = 0.001; pad = 0.006
0.70
(0.47–1.04)
p = 0.077; pad = 0.462
TG154 (49)110 (44)
GG81 (26)53 (21)
rs1864183CC109 (34)77 (29)1.5061.29
(0.94–1.78)
p = 0.113; pad = 0.678
1.31
(0.88–1.94)
p = 0.180; pad = 1.080
CT146 (46)126 (47)
TT63 (20)65 (24)
rs3734114TT204 (66)168 (68)0.0120.86
(0.61–1.22)
p = 0.414; pad = 2.484
2.70
(1.36–5.34)
p = 0.004; pad = 0.024
TC92 (30)53 (21)
CC14 (4)28 (11)
Abbreviations: Logistic Regression (LR), Fisher Exact Test (FE), Chi-Square test (χ2), p value (p), adjusted p value using Bonferroni method for multiple testing (pad).
Table 4. Genotype frequencies for the ATG10rs1864182 and ATG10rs3734114 in cohort 2.
SNPGenotypeCounts (%)
rs1864182TT14 (30.4)
TG18 (39.1)
GG14 (30.4)
rs374114TT26 (56.5)
TC18 (39.1)
CC2 (4.3)
Publisher’s Note: MDPI stays neutral with regard to jurisdictional claims in published maps and institutional affiliations.

