
Amyloid Precursor-like Protein 2 Expression Increases during Pancreatic Cancer Development and Shortens the Survival of a Spontaneous Mouse Model of Pancreatic Cancer

 ,
,  ,
,
Abstract
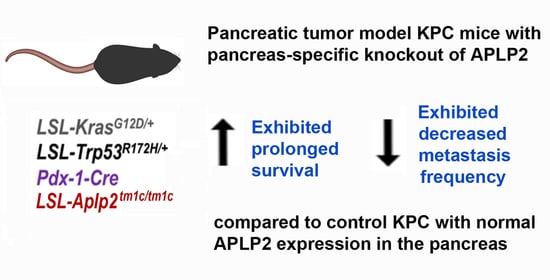
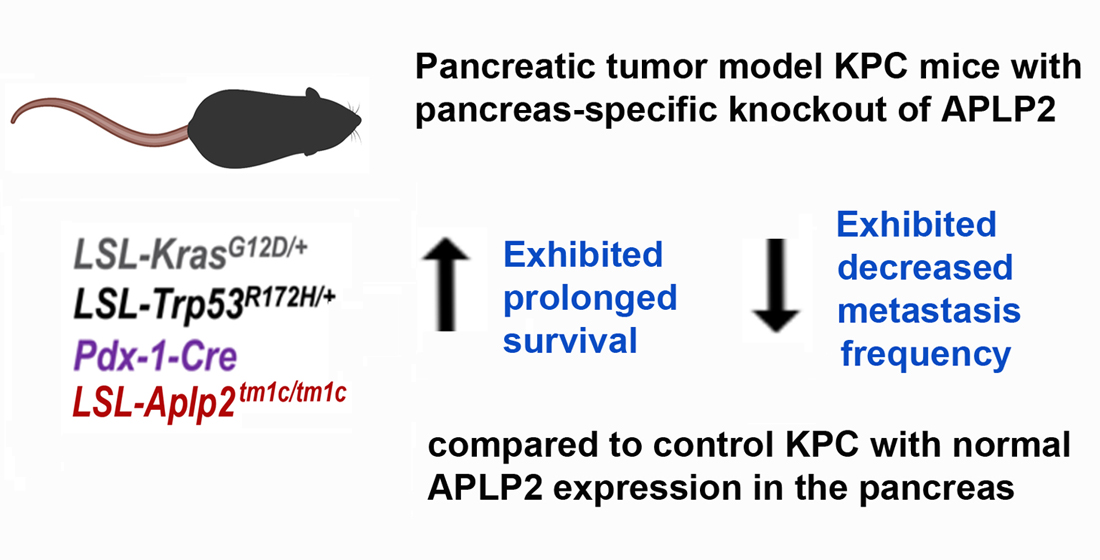
:Simple Summary
Abstract
1. Introduction
2. Results
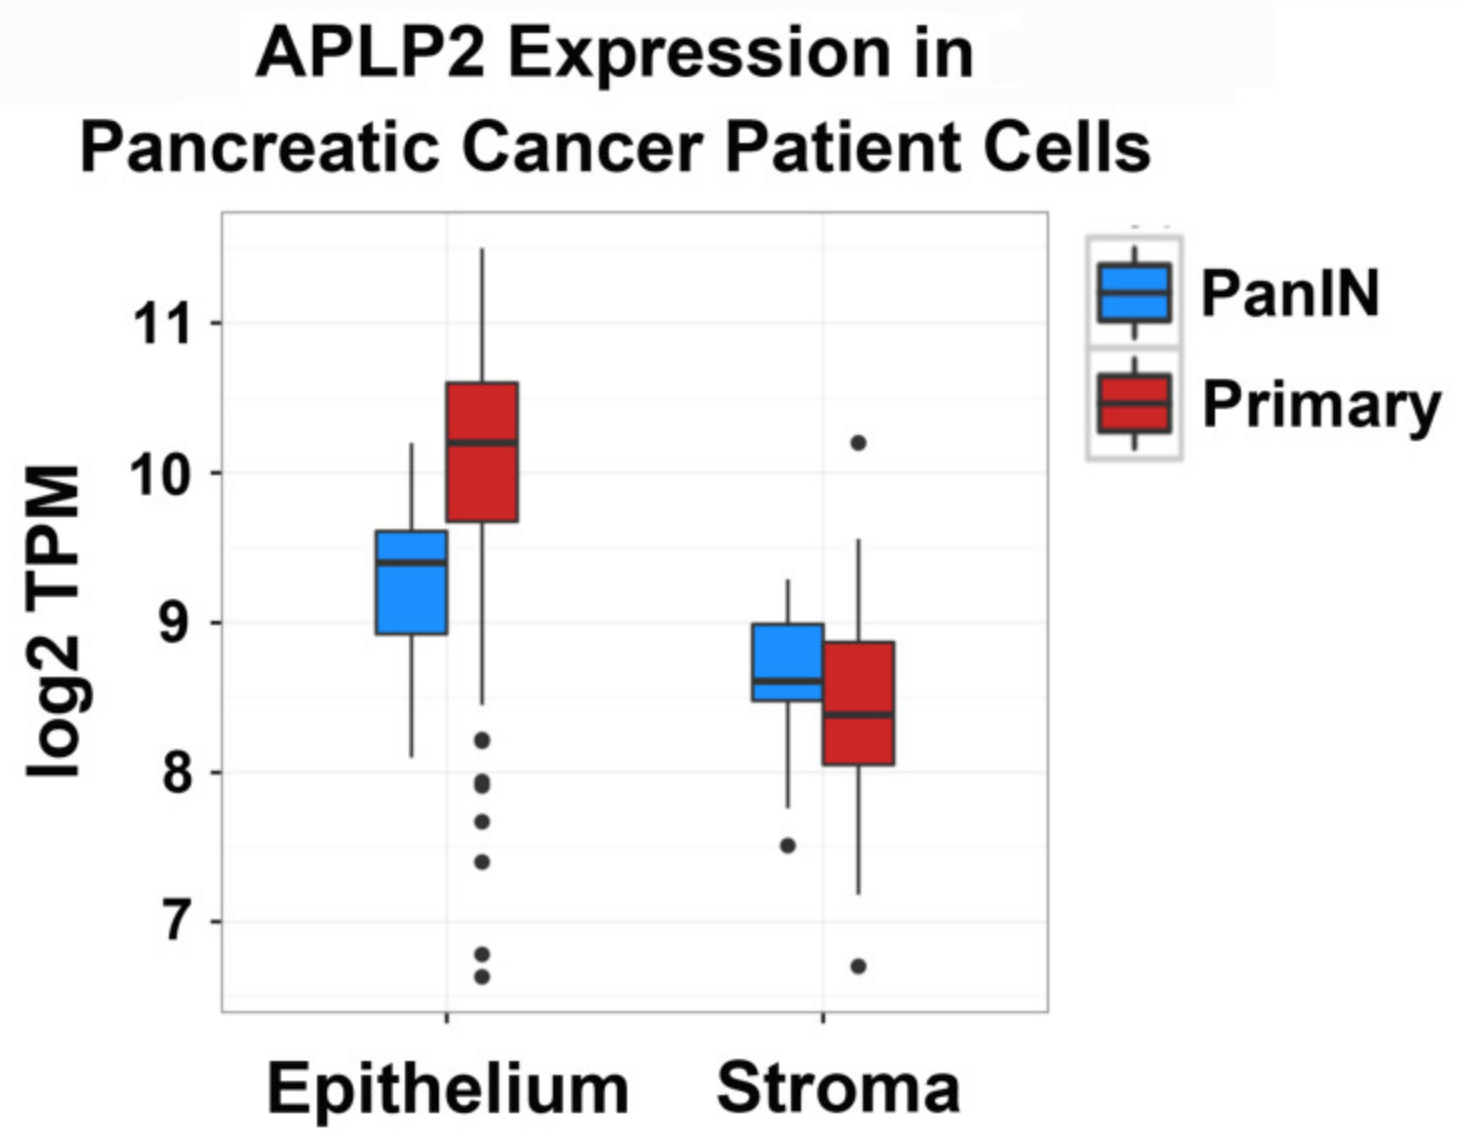
2.1. APLP2 mRNA Expression Is Higher in Human Primary Pancreatic Tumors Relative to PanIN Epithelial and Stromal Cells
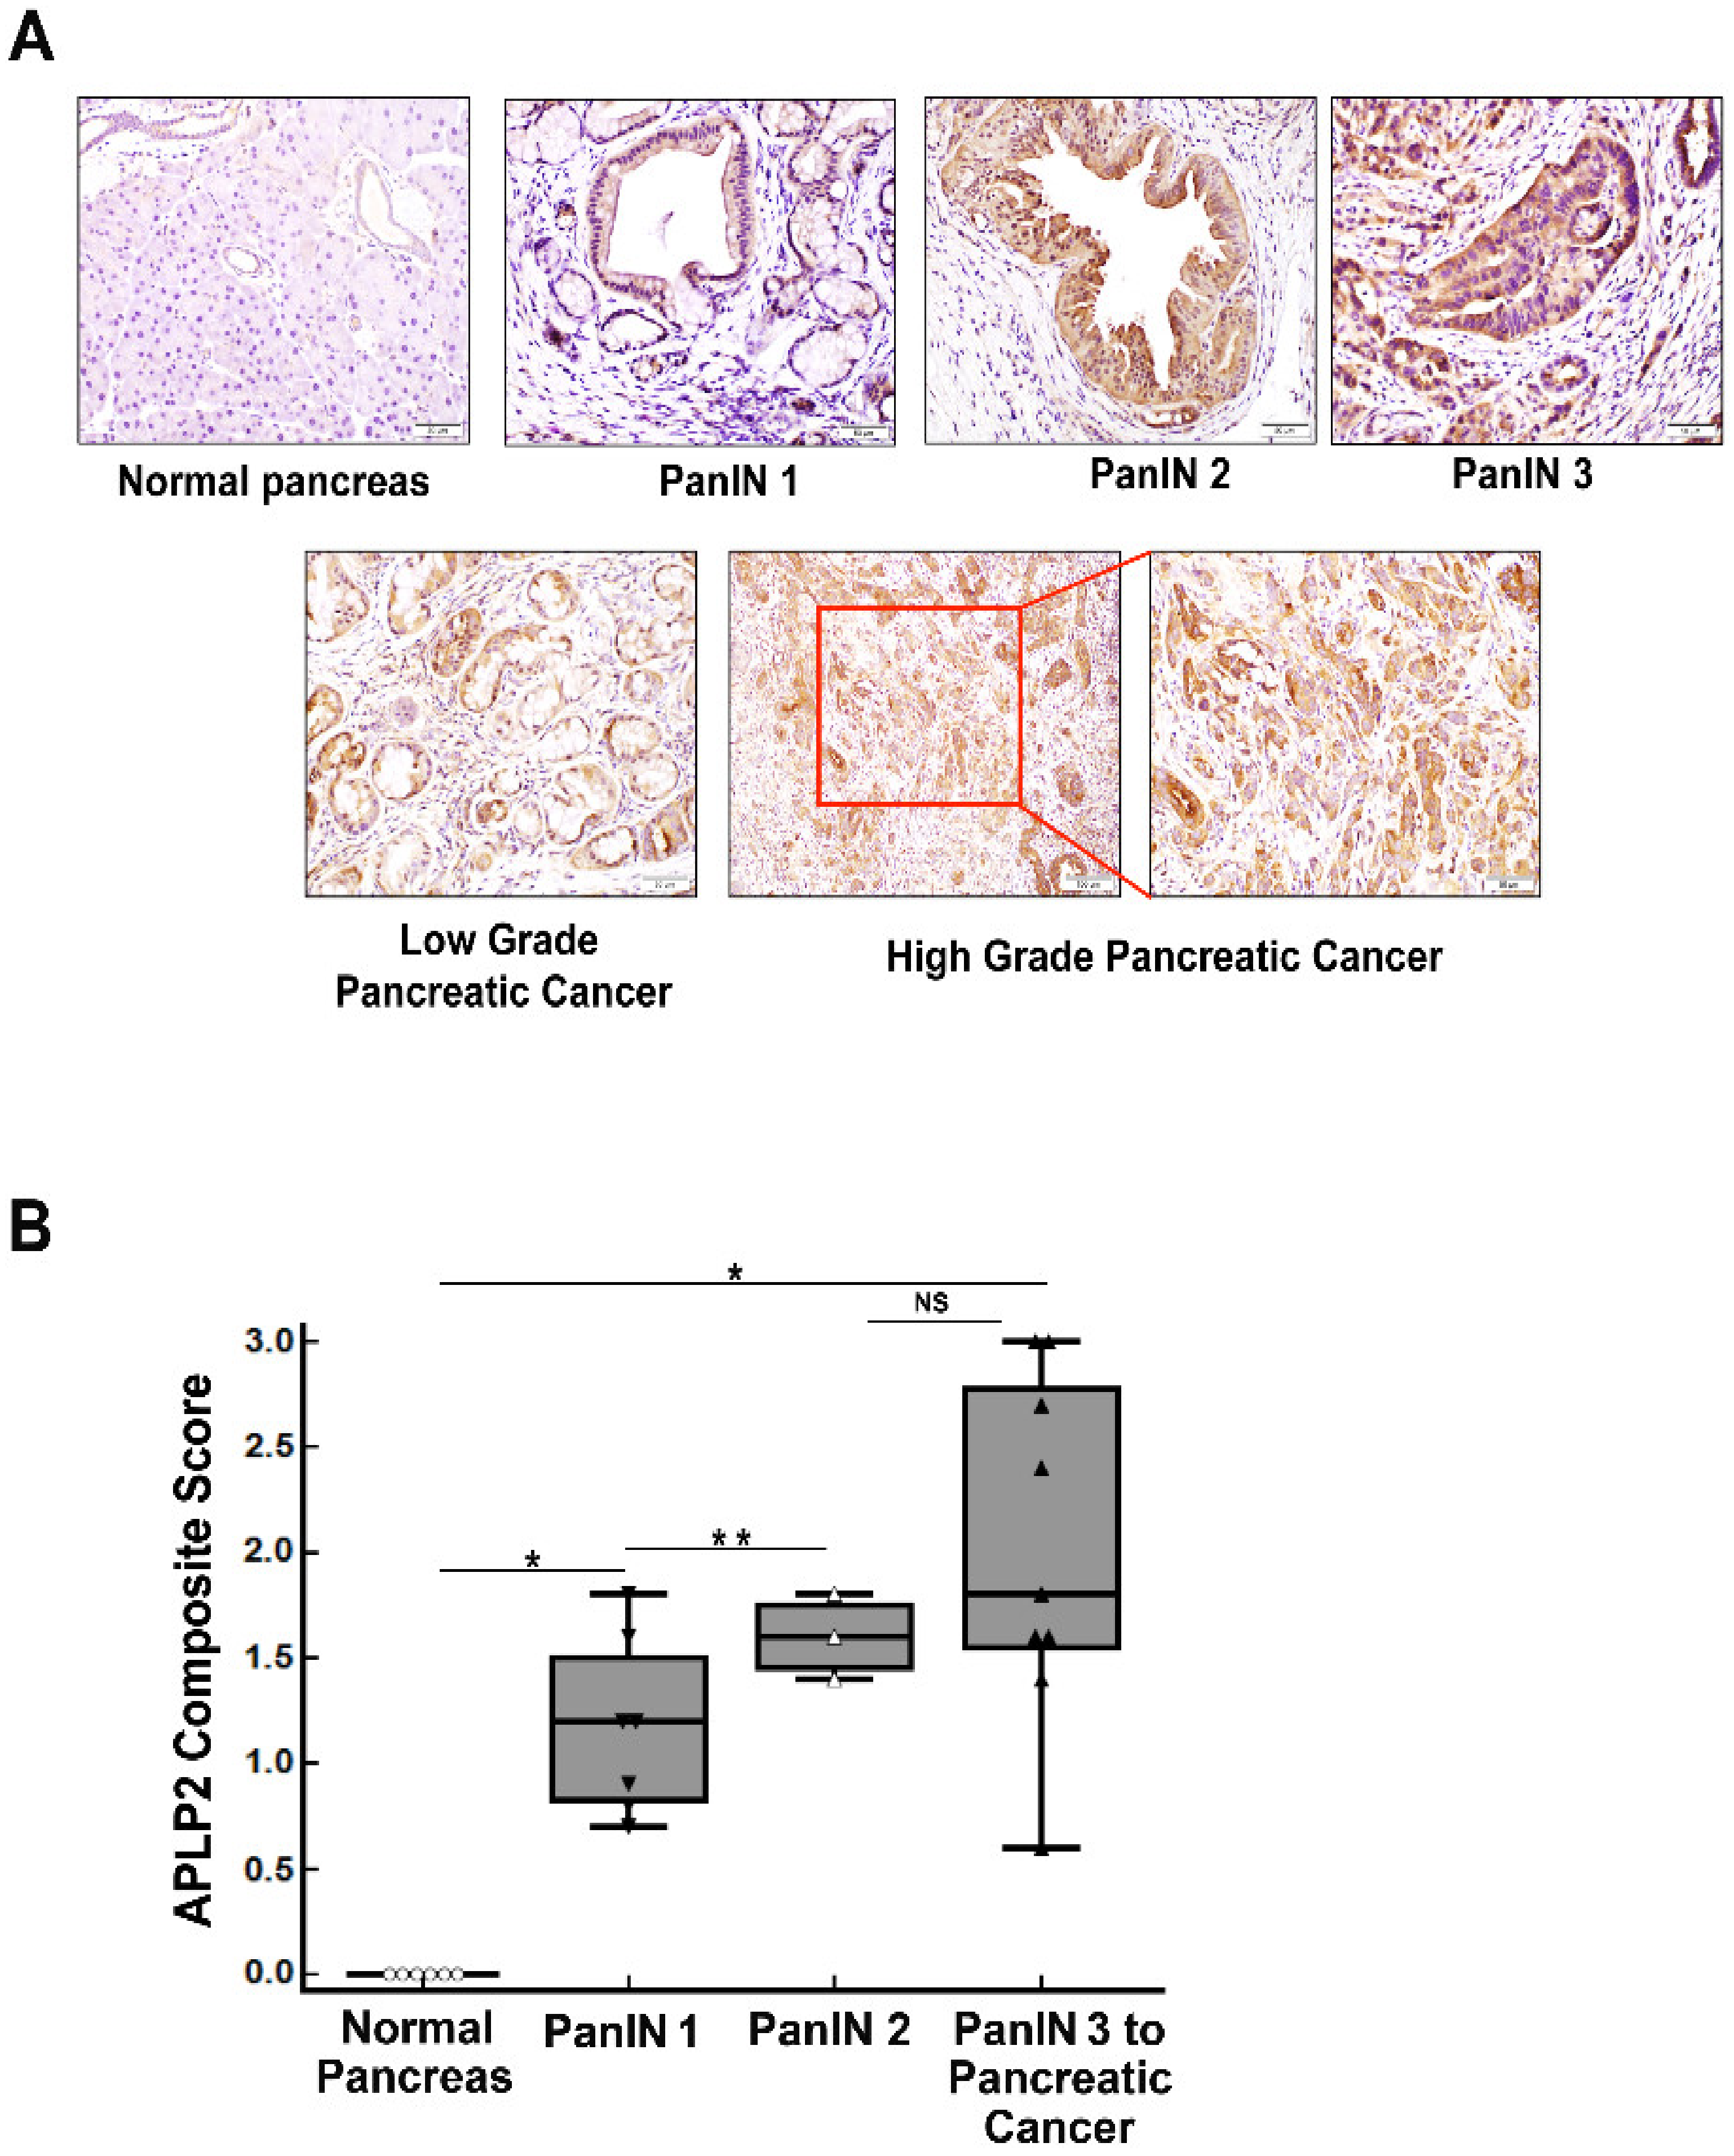
2.2. Murine KPC Primary Pancreatic Tumor Tissue Has Increased Expression of APLP2 Protein Compared to PanINs
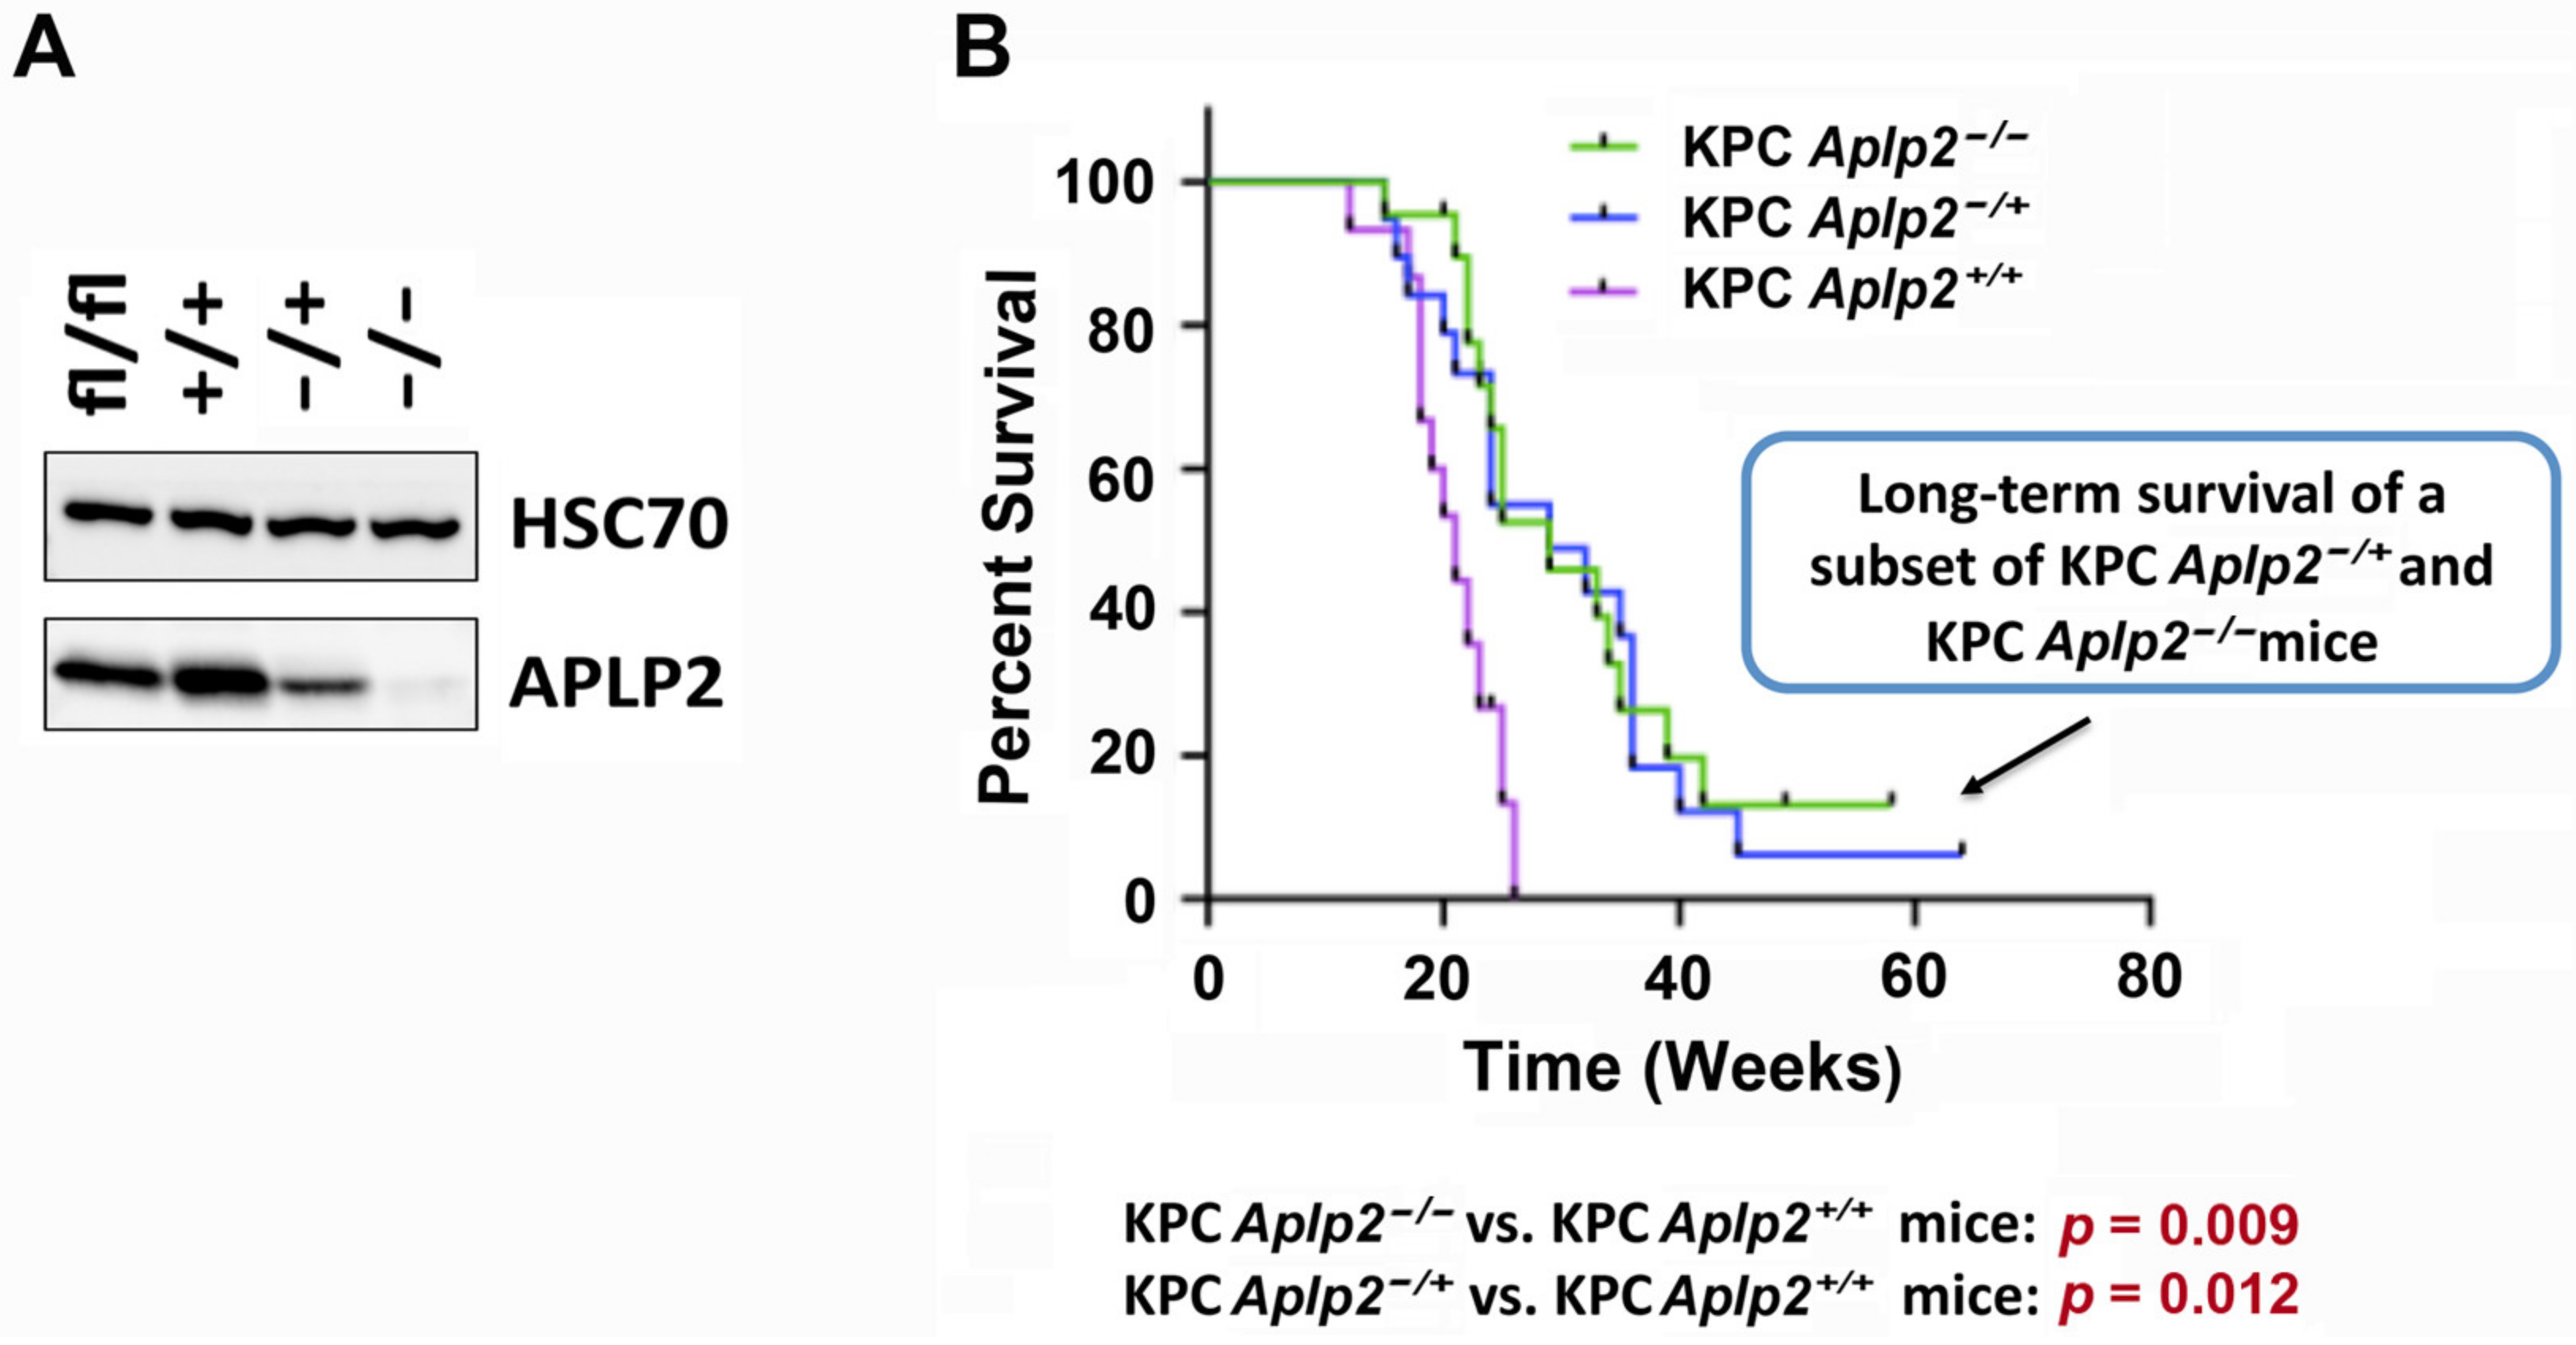
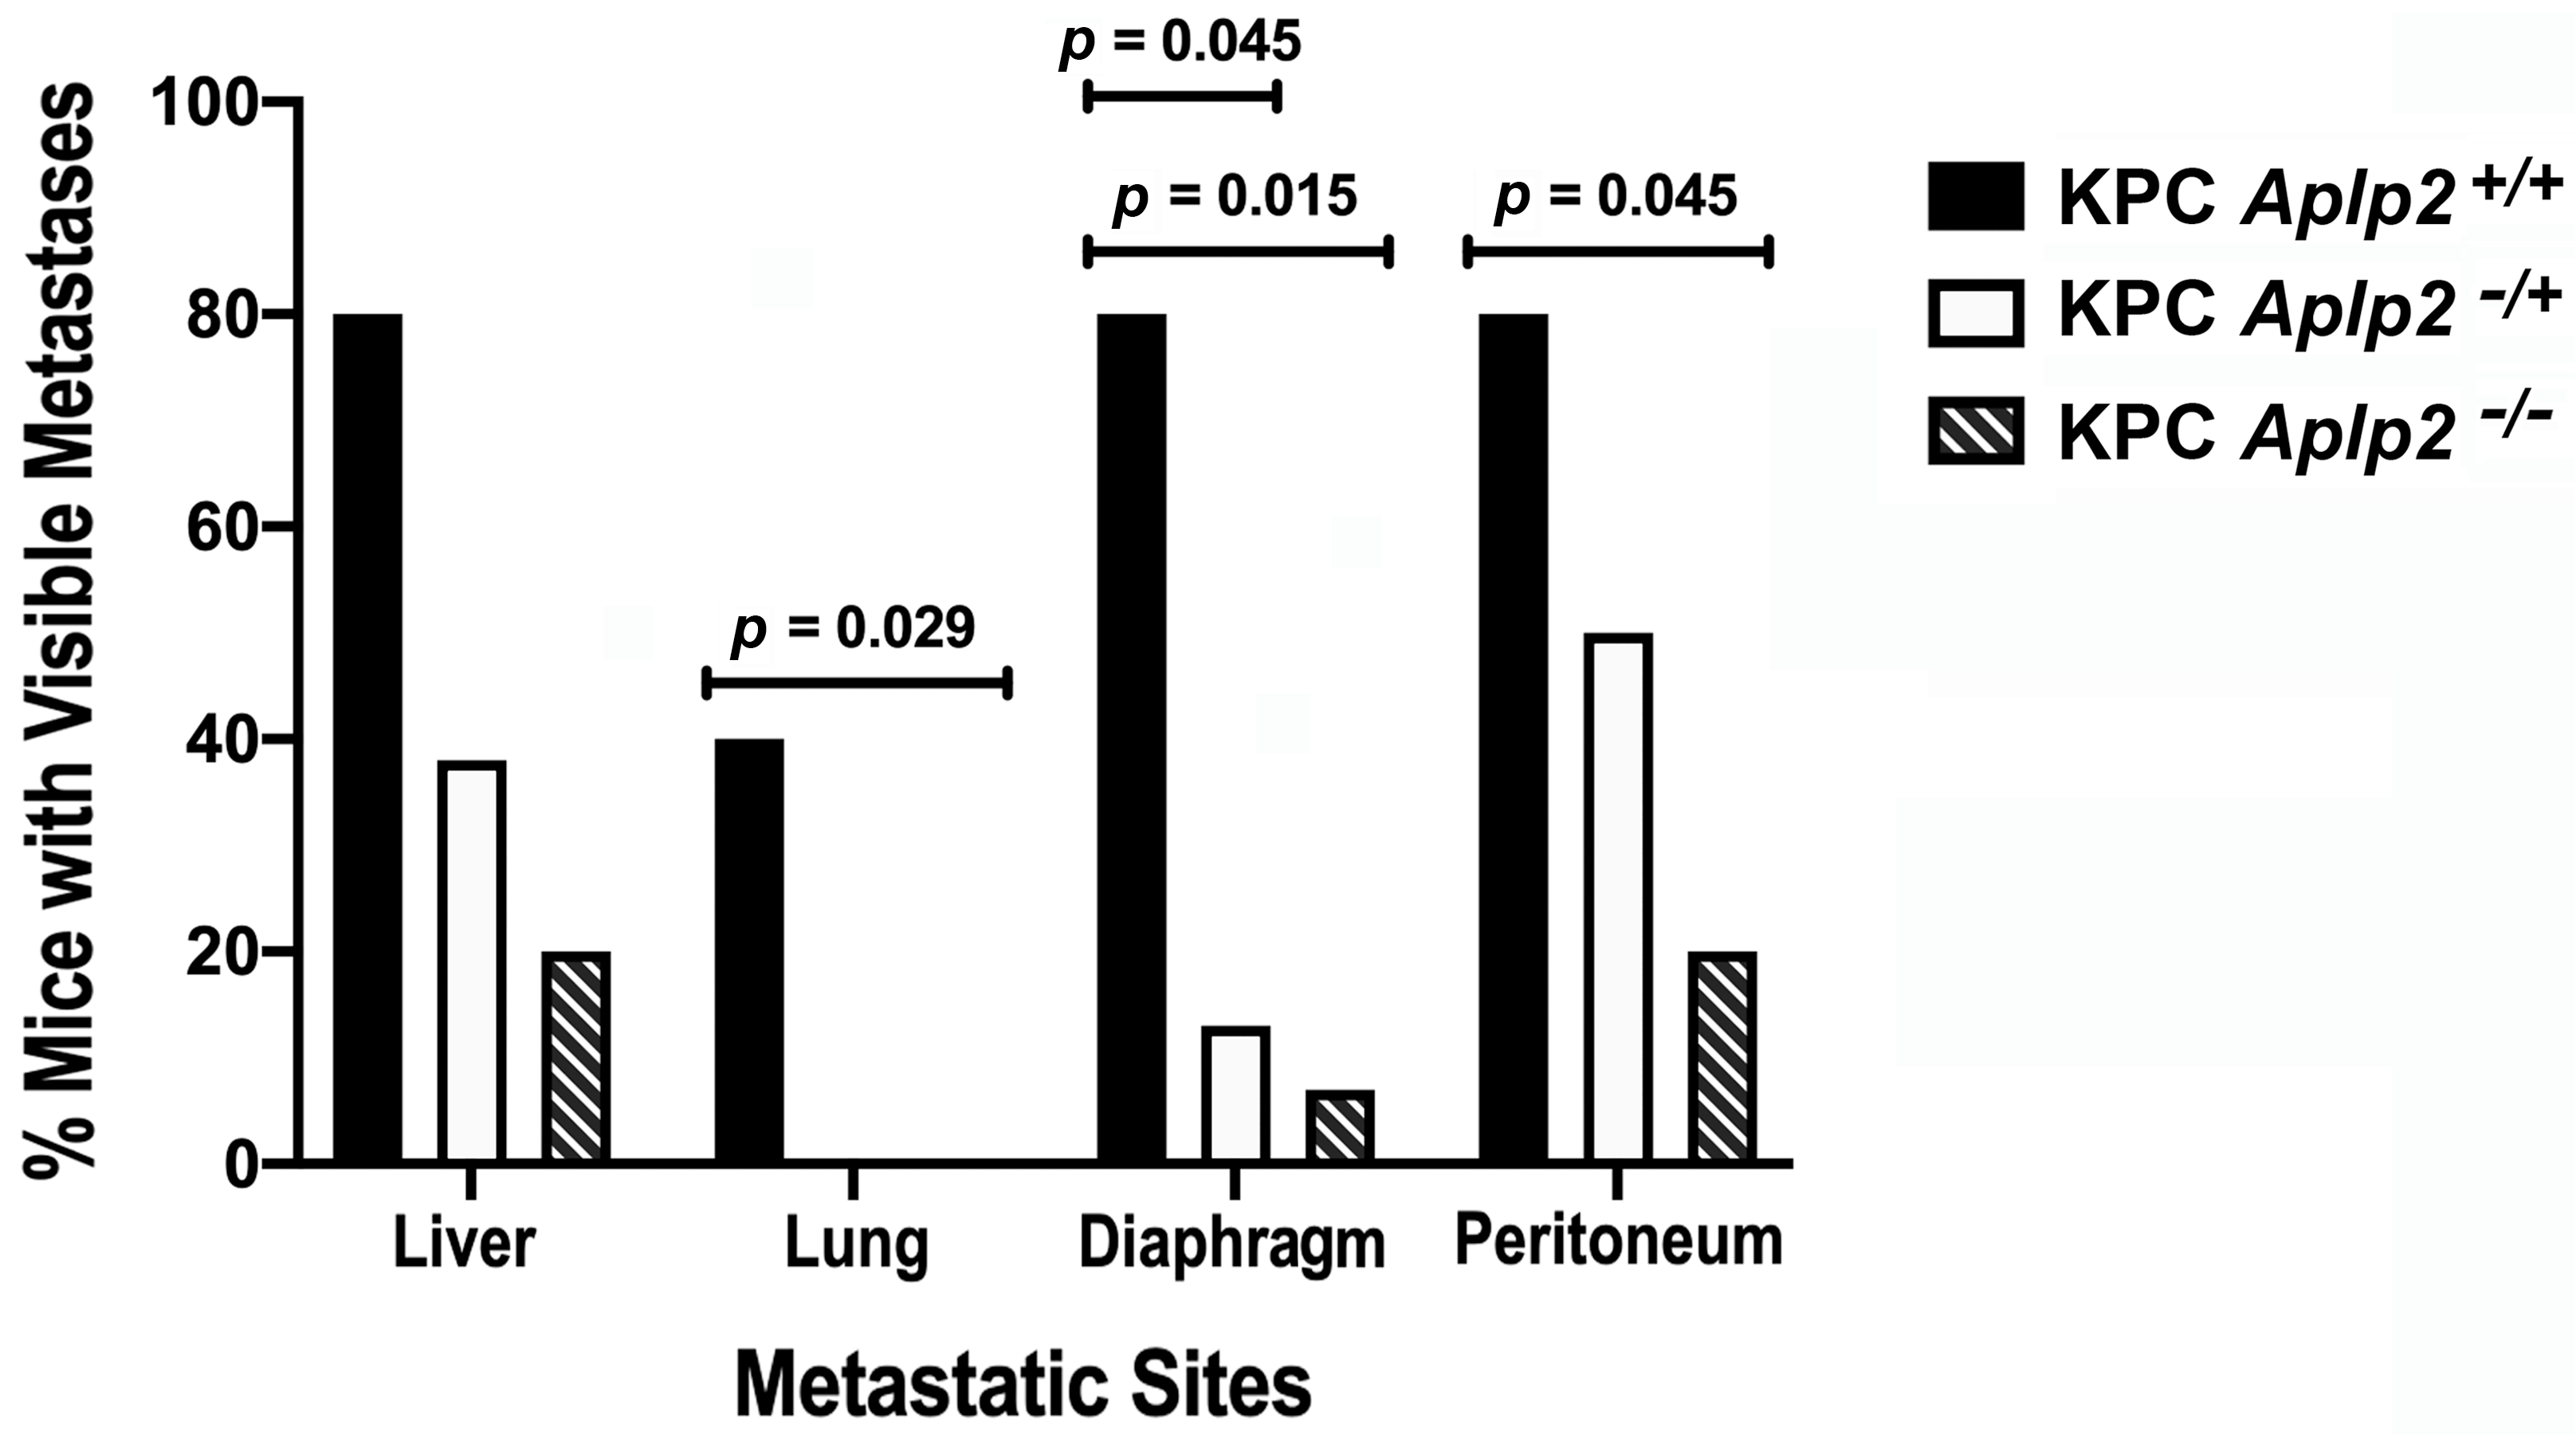
2.3. Loss of APLP2 Specifically in the Pancreas Prolongs the Survival of KPC Mice
3. Discussion
4. Materials and Methods
4.1. RNA-Seq
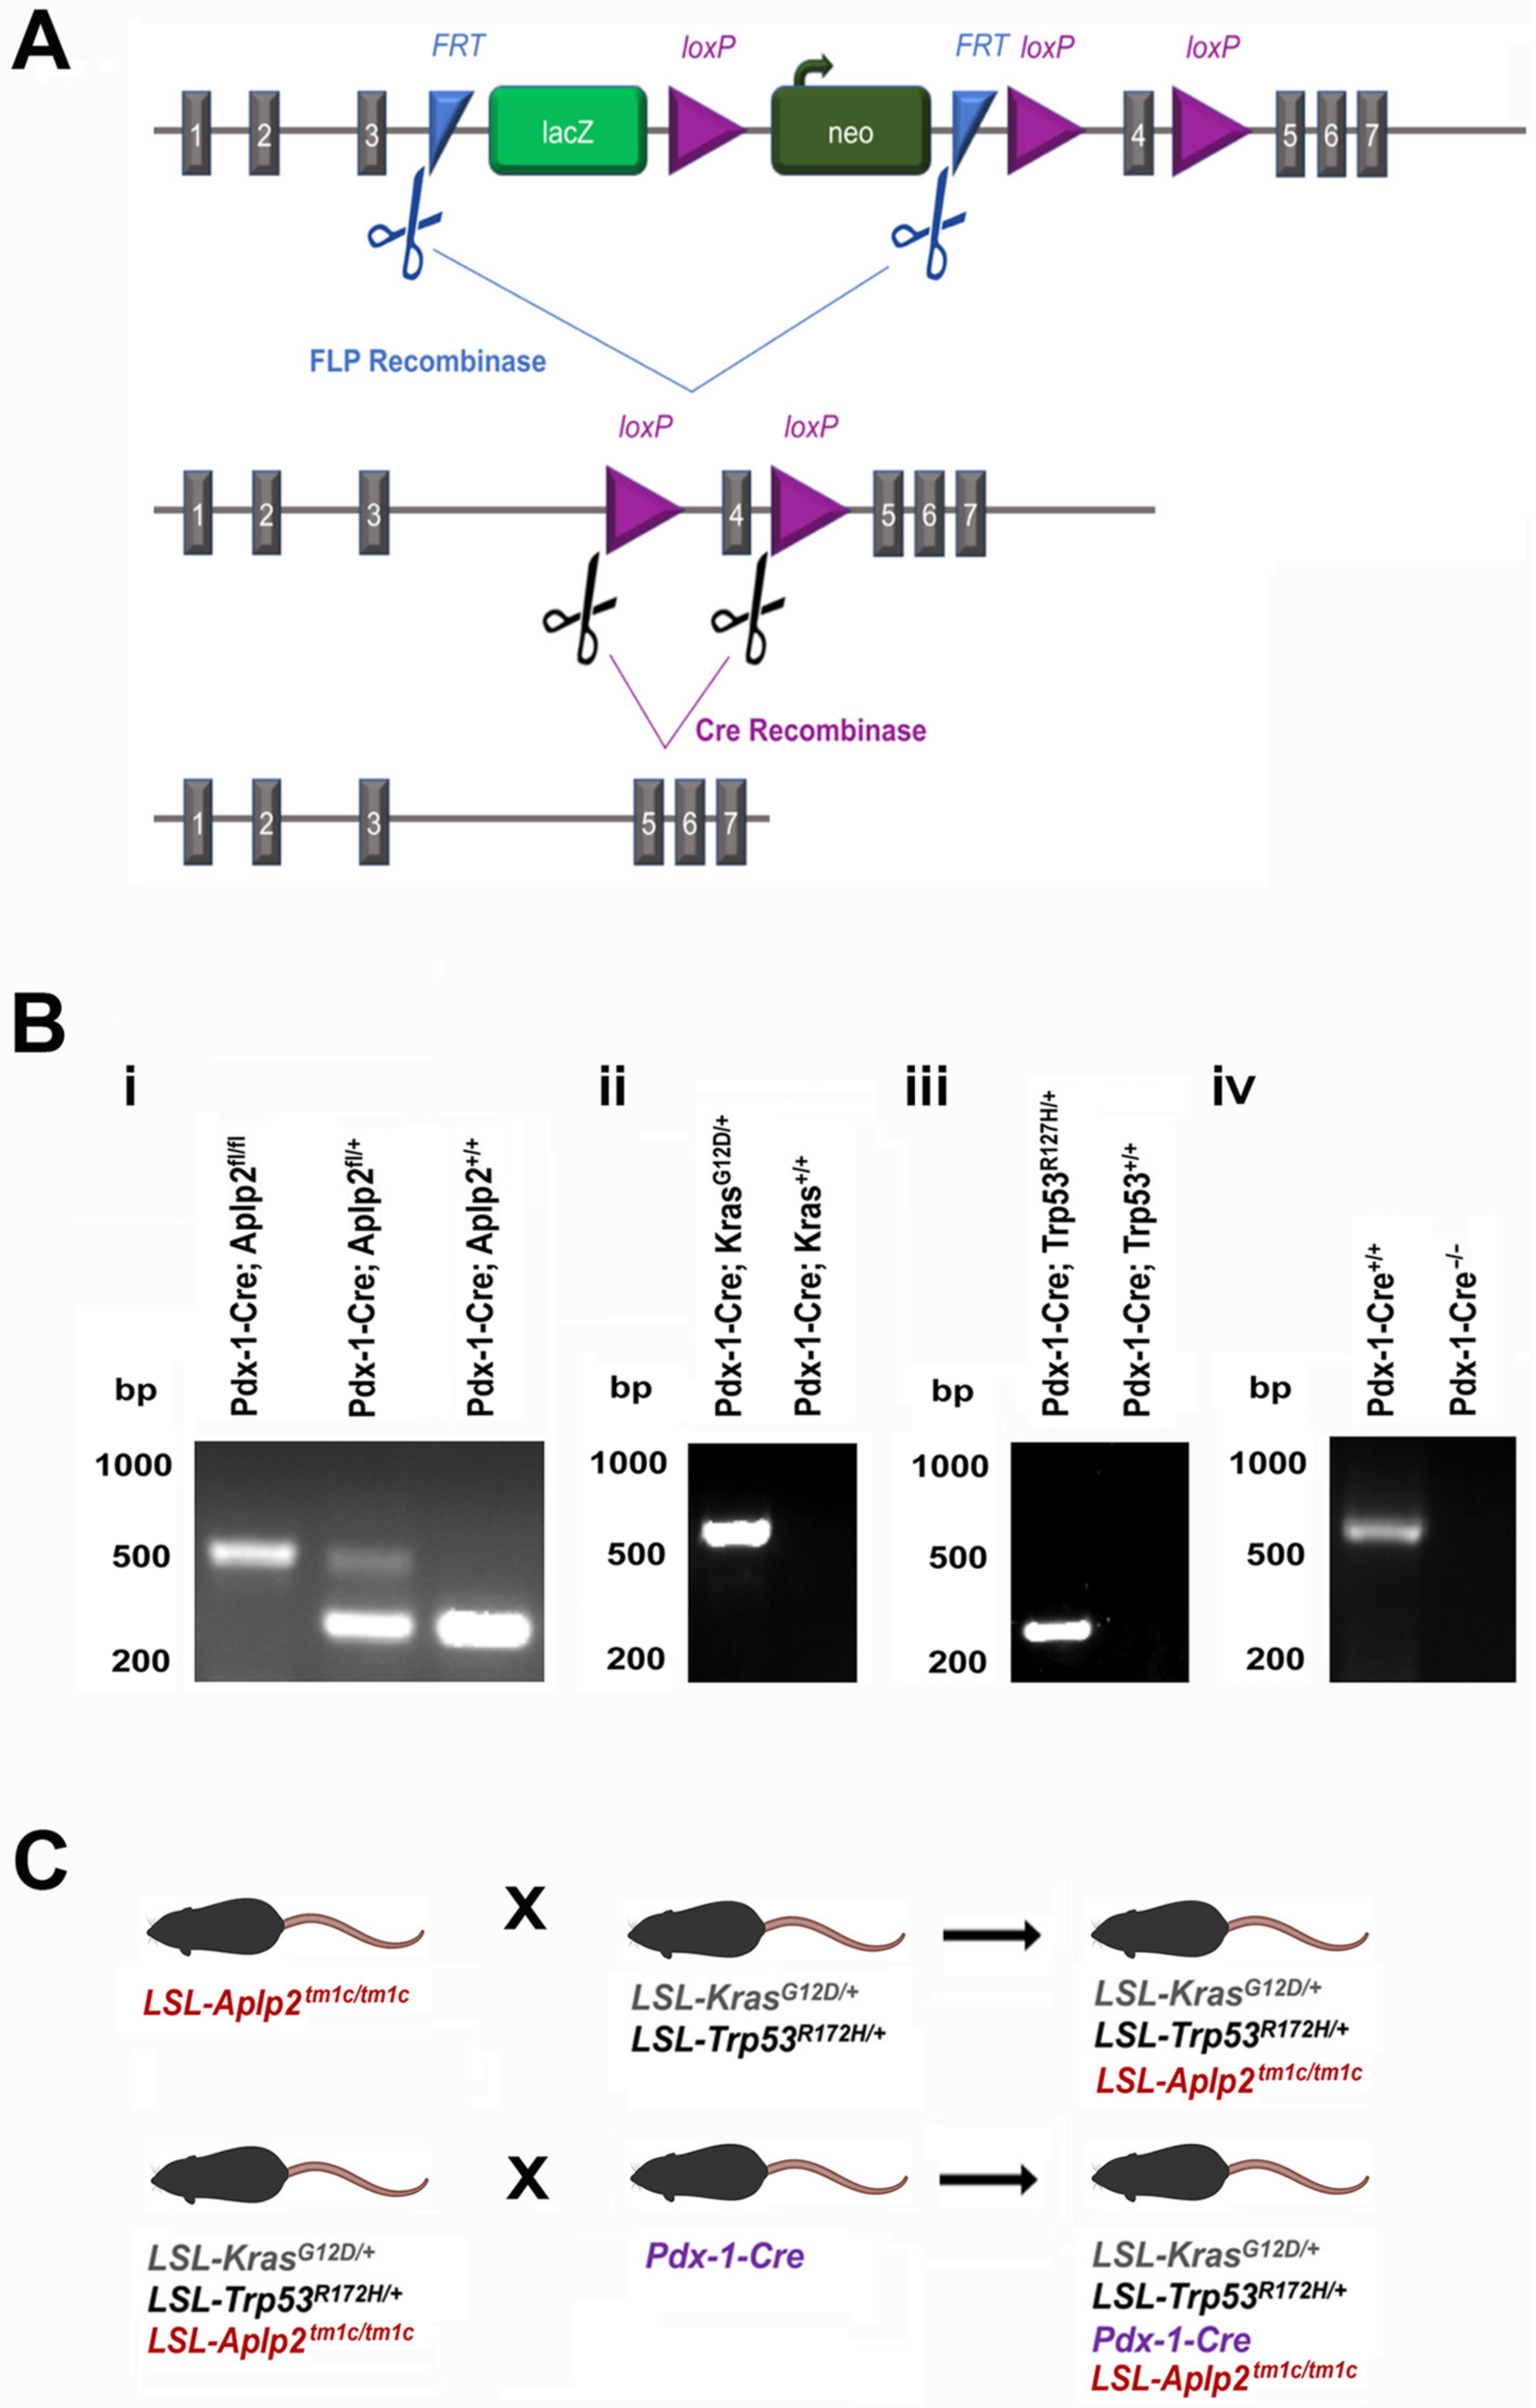
4.2. Mice Breeding and Genotyping
4.3. Immunohistochemistry
4.4. Tissue Collection, Protein Quantification, and Immunoblotting
4.5. Statistical Analysis
5. Conclusions
Supplementary Materials
Author Contributions
Funding
Institutional Animal Care and Use Committee Statement
Institutional Review Board Statement
Informed Consent Statement
Data Availability Statement
Acknowledgments
Conflicts of Interest
References
- Siegel, R.L.; Miller, K.D.; Jemal, A. Cancer statistics, 2020. CA Cancer J. Clin. 2020, 70, 7–30. [Google Scholar] [CrossRef]
- Wasco, W.; Gurubhagavatula, S.; Paradis, M.D.; Romano, D.M.; Sisodia, S.S.; Hyman, B.T.; Neve, R.L.; Tanzi, R.E. Isolation and characterization of APLP2 encoding a homologue of the Alzheimer’s associated amyloid β protein precursor. Nat. Genet. 1993, 5, 95–100. [Google Scholar] [CrossRef] [PubMed]
- Shariati, S.A.; De Strooper, B. Redundancy and divergence in the amyloid precursor protein family. FEBS Lett. 2013, 587, 2036–2045. [Google Scholar] [CrossRef] [Green Version]
- Ludewig, S.; Korte, M. Novel insights into the physiological function of the APP (gene) family and its proteolytic fragments in synaptic plasticity. Front. Mol. Neurosci. 2017, 9, 161. [Google Scholar] [CrossRef] [PubMed] [Green Version]
- Abba, M.C.; Drake, J.A.; Hawkins, K.A.; Hu, Y.; Sun, H.; Notcovich, C.; Gaddis, S.; Sahin, A.; Baggerly, K.; Aldaz, C.M. Transcriptomic changes in human breast cancer progression as determined by serial analysis of gene expression. Breast Cancer Res. 2004, 6, 499–513. [Google Scholar] [CrossRef]
- Peters, H.L.; Tuli, A.; Wang, X.; Liu, C.; Pan, Z.; Ouellette, M.M.; Hollingsworth, M.A.; MacDonald, R.G.; Solheim, J.C. Relevance of amyloid precursor-like protein 2 C-terminal fragments in pancreatic cancer cells. Int. J. Oncol. 2012, 41, 1464–1474. [Google Scholar] [CrossRef] [PubMed] [Green Version]
- Peters, H.L.; Yan, Y.; Nordgren, T.M.; Cutucache, C.E.; Joshi, S.S.; Solheim, J.C. Amyloid precursor-like protein 2 suppresses irradiation-induced apoptosis in Ewing sarcoma cells and is elevated in immune-evasive Ewing sarcoma cells. Cancer Biol. Ther. 2013, 14, 752–760. [Google Scholar] [CrossRef] [Green Version]
- Long, N.P.; Jung, K.H.; Anh, N.H.; Yan, H.H.; Nghi, T.D.; Park, S.; Yoon, S.J.; Min, J.E.; Kim, H.M.; Lim, J.H.; et al. An integrative data mining and omics-based translation model for the identification and validation of oncogenic biomarkers of pancreatic cancer. Cancers 2019, 11, 155. [Google Scholar] [CrossRef] [Green Version]
- Pandey, P.; Sliker, B.; Peters, H.L.; Tuli, A.; Herskovitz, J.; Smits, K.; Purohit, A.; Singh, R.K.; Dong, J.; Batra, S.K.; et al. Amyloid precursor protein and amyloid precursor-like protein 2 in cancer. Oncotarget 2016, 7, 19430–19444. [Google Scholar] [CrossRef] [Green Version]
- Pandey, P.; Rachagani, S.; Das, S.; Seshacharyulu, P.; Sheinin, Y.; Naslavsky, N.; Pan, Z.; Smith, B.L.; Peters, H.L.; Radhakrishnan, P.; et al. Amyloid precursor-like protein 2 (APLP2) affects the actin cytoskeleton and increases pancreatic cancer growth and metastasis. Oncotarget 2015, 6, 2064–2075. [Google Scholar] [CrossRef] [PubMed] [Green Version]
- Hingorani, S.R.; Wang, L.; Multani, A.S.; Combs, C.; Deramaudt, T.B.; Hruban, R.H.; Rustgi, A.K.; Chang, S.; Tuveson, D.A. Trp53R172H and KrasG12D cooperate to promote chromosomal instability and widely metastatic pancreatic ductal adenocarcinoma in mice. Cancer Cell 2005, 7, 469–483. [Google Scholar] [CrossRef] [PubMed] [Green Version]
- Olive, K.P.; Tuveson, D.A. The use of targeted mouse models for preclinical testing of novel cancer therapeutics. Clin. Cancer Res. 2006, 12, 5277–5287. [Google Scholar] [CrossRef] [Green Version]
- Maurer, C.; Holmstrom, S.R.; He, J.; Laise, P.; Su, T.; Ahmed, A.; Hibshoosh, H.; Chabot, J.A.; Oberstein, P.E.; Sepulveda, A.R.; et al. Experimental microdissection enables functional harmonization of pancreatic cancer subtypes. Gut 2019, 68, 1034–1043. [Google Scholar] [CrossRef]
- Laise, P.; Turunen, M.; Maurer, H.C.; Curiel, A.G.; Elyada, E.; Schmierer, B.; Tomassoni, L.; Worley, J.; Alvarez, M.J.; Kesner, J.; et al. Pancreatic ductal adenocarcinoma comprises coexisting regulatory states with both common and distinct dependencies. bioRxiv 2020, preprint. [Google Scholar] [CrossRef]
- Heber, S.; Herms, J.; Gajic, V.; Hainfellner, J.; Aguzzi, A.; Rlicke, T.; Kretzschmar, H.; von Koch, C.; Sisodia, S.; Tremml, P.; et al. Mice with combined gene knock-outs reveal essential and partially redundant functions of amyloid precursor protein family members. J. Neurosci. 2000, 20, 7951–7963. [Google Scholar] [CrossRef] [Green Version]
- Erratum: Heber et al., “Mice with Combined Gene Knock-Outs Reveal Essential and Partially Redundant Functions of Amyloid Pre-cursor Protein Family Members”. J. Neurosci. 2020, 40, 7375. [CrossRef]
- Hafeez, B.B.; Zhong, W.; Weichert, J.; Dreckschmidt, N.E.; Jamal, M.S.; Verma, A.K. Genetic ablation of PKC epsilon inhibits prostate cancer development and metastasis in transgenic mouse model of prostate adenocarcinoma. Cancer Res. 2011, 71, 2318–2327. [Google Scholar] [CrossRef] [Green Version]
- Skarnes, W.C.; Rosen, B.; West, A.P.; Koutsourakis, M.; Bushell, W.; Iyer, V.; Mujica, A.O.; Thomas, M.; Harrow, J.; Cox, T.; et al. A conditional knockout resource for the genome-wide study of mouse gene function. Nature 2011, 474, 337–342. [Google Scholar] [CrossRef] [Green Version]
- Coleman, J.L.J.; Brennan, K.; Ngo, T.; Balaji, P.; Graham, R.M.; Smith, N.J. Rapid knockout and reporter mouse line generation and breeding colony and establishment using EUCOMM conditional-ready embryonic stem cells: A case study. Front. Endocrinol. 2015, 6, 105. [Google Scholar] [CrossRef] [PubMed] [Green Version]
- Pandey, P.; Seshacharyulu, P.; Das, S.; Rachagani, S.; Ponnusamy, M.P.; Yan, Y.; Johansson, S.L.; Datta, K.; Lin, M.-F.; Batra, S.K. Impaired expression of protein phosphatase 2A subunits enhances metastatic potential of human prostate cancer cells through activation of AKT pathway. Br. J. Cancer 2013, 108, 2590–2600. [Google Scholar] [CrossRef] [Green Version]
- Sliker, B.H.; Goetz, B.T.; Peters, H.L.; Poelaert, B.J.; Borgstahl, G.E.O.; Solheim, J.C. Beta 2-microglobulin regulates amyloid precursor-like protein 2 expression and the migration of pancreatic cancer cells. Cancer Biol. Ther. 2019, 20, 931–940. [Google Scholar] [CrossRef]
- Siemes, C.; Quast, T.; Kummer, C.; Wehner, S.; Kirfel, G.; Müller, U.; Herzog, V. Keratinocytes from APP/APLP2-deficient mice are impaired in proliferation, adhesion and migration in vitro. Exp. Cell Res. 2006, 312, 1939–1949. [Google Scholar] [CrossRef]
- Li, X.F.; Thinakaran, G.; Sisodia, S.S.; Yu, F.S. Amyloid precursor-like protein 2 promotes cell migration toward fibronectin and collagen IV. J. Biol. Chem. 1999, 274, 27249–27256. [Google Scholar] [CrossRef] [Green Version]
- Guo, J.; Thinakaran, G.; Guo, Y.; Sisodia, S.S.; Yu, F.S. A role for amyloid precursor-like protein 2 in corneal epithelial wound healing. Investig. Ophthalmol. Vis. Sci. 1998, 39, 292–300. [Google Scholar]
- Choi, J.-H.; Lee, M.-Y.; Kim, Y.; Shim, J.-Y.; Han, S.-M.; Lee, K.-A.; Choi, Y.-K.; Jeon, H.-M.; Baek, K.-H. Isolation of genes involved in pancreas regeneration by subtractive hybridization. Biol. Chem. 2010, 291, 1019–1029. [Google Scholar] [CrossRef]
- Needham, B.E.; Wlodek, M.E.; Ciccotosto, G.D.; Fam, B.C.; Masters, C.L.; Proietto, J.; Andrikopoulos, S.; Cappai, R. Identification of the Alzheimer’s disease amyloid precursor protein (APP) and its homologue APLP2 as essential modulators of glucose and insulin homeostasis and growth. J. Pathol. 2008, 215, 155–163. [Google Scholar] [CrossRef]
- Kummer, C.; Wehner, S.; Quast, T.; Werner, S.; Herzog, V. Expression and potential function of beta-amyloid precursor proteins during cutaneous wound repair. Exp. Cell Res. 2002, 280, 222–232. [Google Scholar] [CrossRef] [PubMed] [Green Version]
- Shen, Y.; Yu, Y.; Guo, H.; Tang, Z.; Yu, F.-S.X.; Zhou, J. Identification and comparative analysis of differentially expressed proteins in rat striatum following 6-hydroxydopamine lesions of the nigrostriatal pathway: Up-regulation of amyloid precursor-like protein 2 expression. Eur. J. Neurosci. 2002, 16, 896–906. [Google Scholar] [CrossRef] [PubMed]
- Cappai, R.; Mok, S.S.; Galatis, D.; Tucker, D.F.; Henry, A.; Beyreuther, K.; Small, D.H.; Masters, C.L. Recombinant human amyloid precursor-like protein 2 (APLP2) expressed in the yeast Pichia pastoris can stimulate neurite outgrowth. FEBS Lett. 1999, 442, 95–98. [Google Scholar] [CrossRef] [Green Version]
- Tkatchenko, A.V.; Tkatchenko, T.V.; Guggenheim, J.A.; Verhoeven, V.J.M.; Hysi, P.G.; Wojciechowski, R.; Singh, P.K.; Kumar, A.; Thinakaran, G.; Consortium for Refractive Error and Myopia (CREAM); et al. APLP2 regulates refractive error and myopia development in mice and human. PLoS Genet. 2015, 11, e1005432. [Google Scholar] [CrossRef] [Green Version]
- Truong, P.H.; Ciccotosto, G.D.; Merson, T.D.; Spoerri, L.; Chuei, M.J.; Ayers, M.; Xing, Y.L.; Emery, B.; Cappai, R. Amyloid precursor protein and amyloid precursor-like protein 2 have distinct roles in modulating myelination, demyelination, and remyelination of axons. Glia 2019, 67, 525–538. [Google Scholar] [CrossRef]
- Sandbrink, R.; Mönning, U.; Masters, C.L.; Beyreuther, K. Expression of the APP gene family in brain cells, brain development and aging. Gerontology 1997, 43, 119–131. [Google Scholar] [CrossRef]


| Group 1 | Group 2 | Mean Group 1 | Mean Group 2 | logFC * | t-Statistic | FDR ** |
|---|---|---|---|---|---|---|
| PanIN Epi *** | PanIN Stroma | 9.82 | 9.10 | −0.719 | −5.37 | 8.87 × 10⁻⁶ |
| PDA Epi **** | PDA Stroma | 10.45 | 8.89 | −1.560 | −18.80 | 4.71 × 10−52 |
| PanIn Epi | PDA Epi | 9.82 | 10.45 | 0.637 | 3.84 | 1.58 × 10−03 |
| PanIN Stroma | PDA Stroma | 9.10 | 8.89 | −0.211 | −1.78 | 2.46 × 10⁻¹ |
| All Epi | All Stroma | 10.39 | 8.93 | −1.460 | −19.40 | 6.54 × 10−57 |
| Gene | Primer Sequence |
| K-ras | 5′-GTCGACAAGCTCATGCGGGTG-3′ |
| K-ras | 5′-CCTTTACAAGCGCACGCAGACTGTAGA-3′ |
| K-ras | 5′-AGCTAGCCACCATGGCTTGAGTAAGTCTGCA-3′ |
| Trp53 | 5′-CTTGGAGACATAGCCACACTG-3′ |
| Trp53 | 5′-AGCTAGCCACCATGGCTTGAGTAAGTCTGCA-3′ |
| Trp53 | 5′-TTACACATCCAGCCTCTGTGG-3′ |
| Pdx-1-Cre | 5′-CTGGACTACAATCTTGAGTTGC-3′ |
| Pdx-1-Cre | 5′-GGTGTACGGTCAGTAAATTTG-3′ |
| APLP2 | 5′-ACATTTCCTGGCTACAATCCTGTGC-3′ |
| APLP2 | 5′-ATTATTAGACTTGGCAGGCATGCTG-3′ |
Publisher’s Note: MDPI stays neutral with regard to jurisdictional claims in published maps and institutional affiliations. |
© 2021 by the authors. Licensee MDPI, Basel, Switzerland. This article is an open access article distributed under the terms and conditions of the Creative Commons Attribution (CC BY) license (http://creativecommons.org/licenses/by/4.0/).
Share and Cite
Poelaert, B.J.; Knoche, S.M.; Larson, A.C.; Pandey, P.; Seshacharyulu, P.; Khan, N.; Maurer, H.C.; Olive, K.P.; Sheinin, Y.; Ahmad, R.; et al. Amyloid Precursor-like Protein 2 Expression Increases during Pancreatic Cancer Development and Shortens the Survival of a Spontaneous Mouse Model of Pancreatic Cancer. Cancers 2021, 13, 1535. https://doi.org/10.3390/cancers13071535
Poelaert BJ, Knoche SM, Larson AC, Pandey P, Seshacharyulu P, Khan N, Maurer HC, Olive KP, Sheinin Y, Ahmad R, et al. Amyloid Precursor-like Protein 2 Expression Increases during Pancreatic Cancer Development and Shortens the Survival of a Spontaneous Mouse Model of Pancreatic Cancer. Cancers. 2021; 13(7):1535. https://doi.org/10.3390/cancers13071535
Chicago/Turabian StylePoelaert, Brittany J., Shelby M. Knoche, Alaina C. Larson, Poomy Pandey, Parthasarathy Seshacharyulu, Nuzhat Khan, H. Carlo Maurer, Kenneth P. Olive, Yuri Sheinin, Rizwan Ahmad, and et al. 2021. "Amyloid Precursor-like Protein 2 Expression Increases during Pancreatic Cancer Development and Shortens the Survival of a Spontaneous Mouse Model of Pancreatic Cancer" Cancers 13, no. 7: 1535. https://doi.org/10.3390/cancers13071535