
Impact of Grade Groups on Prostate Cancer-Specific and Other-Cause Mortality: Competing Risk Analysis from a Large Single Institution Series

 , ,
, ,
Abstract
:Simple Summary
Abstract
1. Introduction
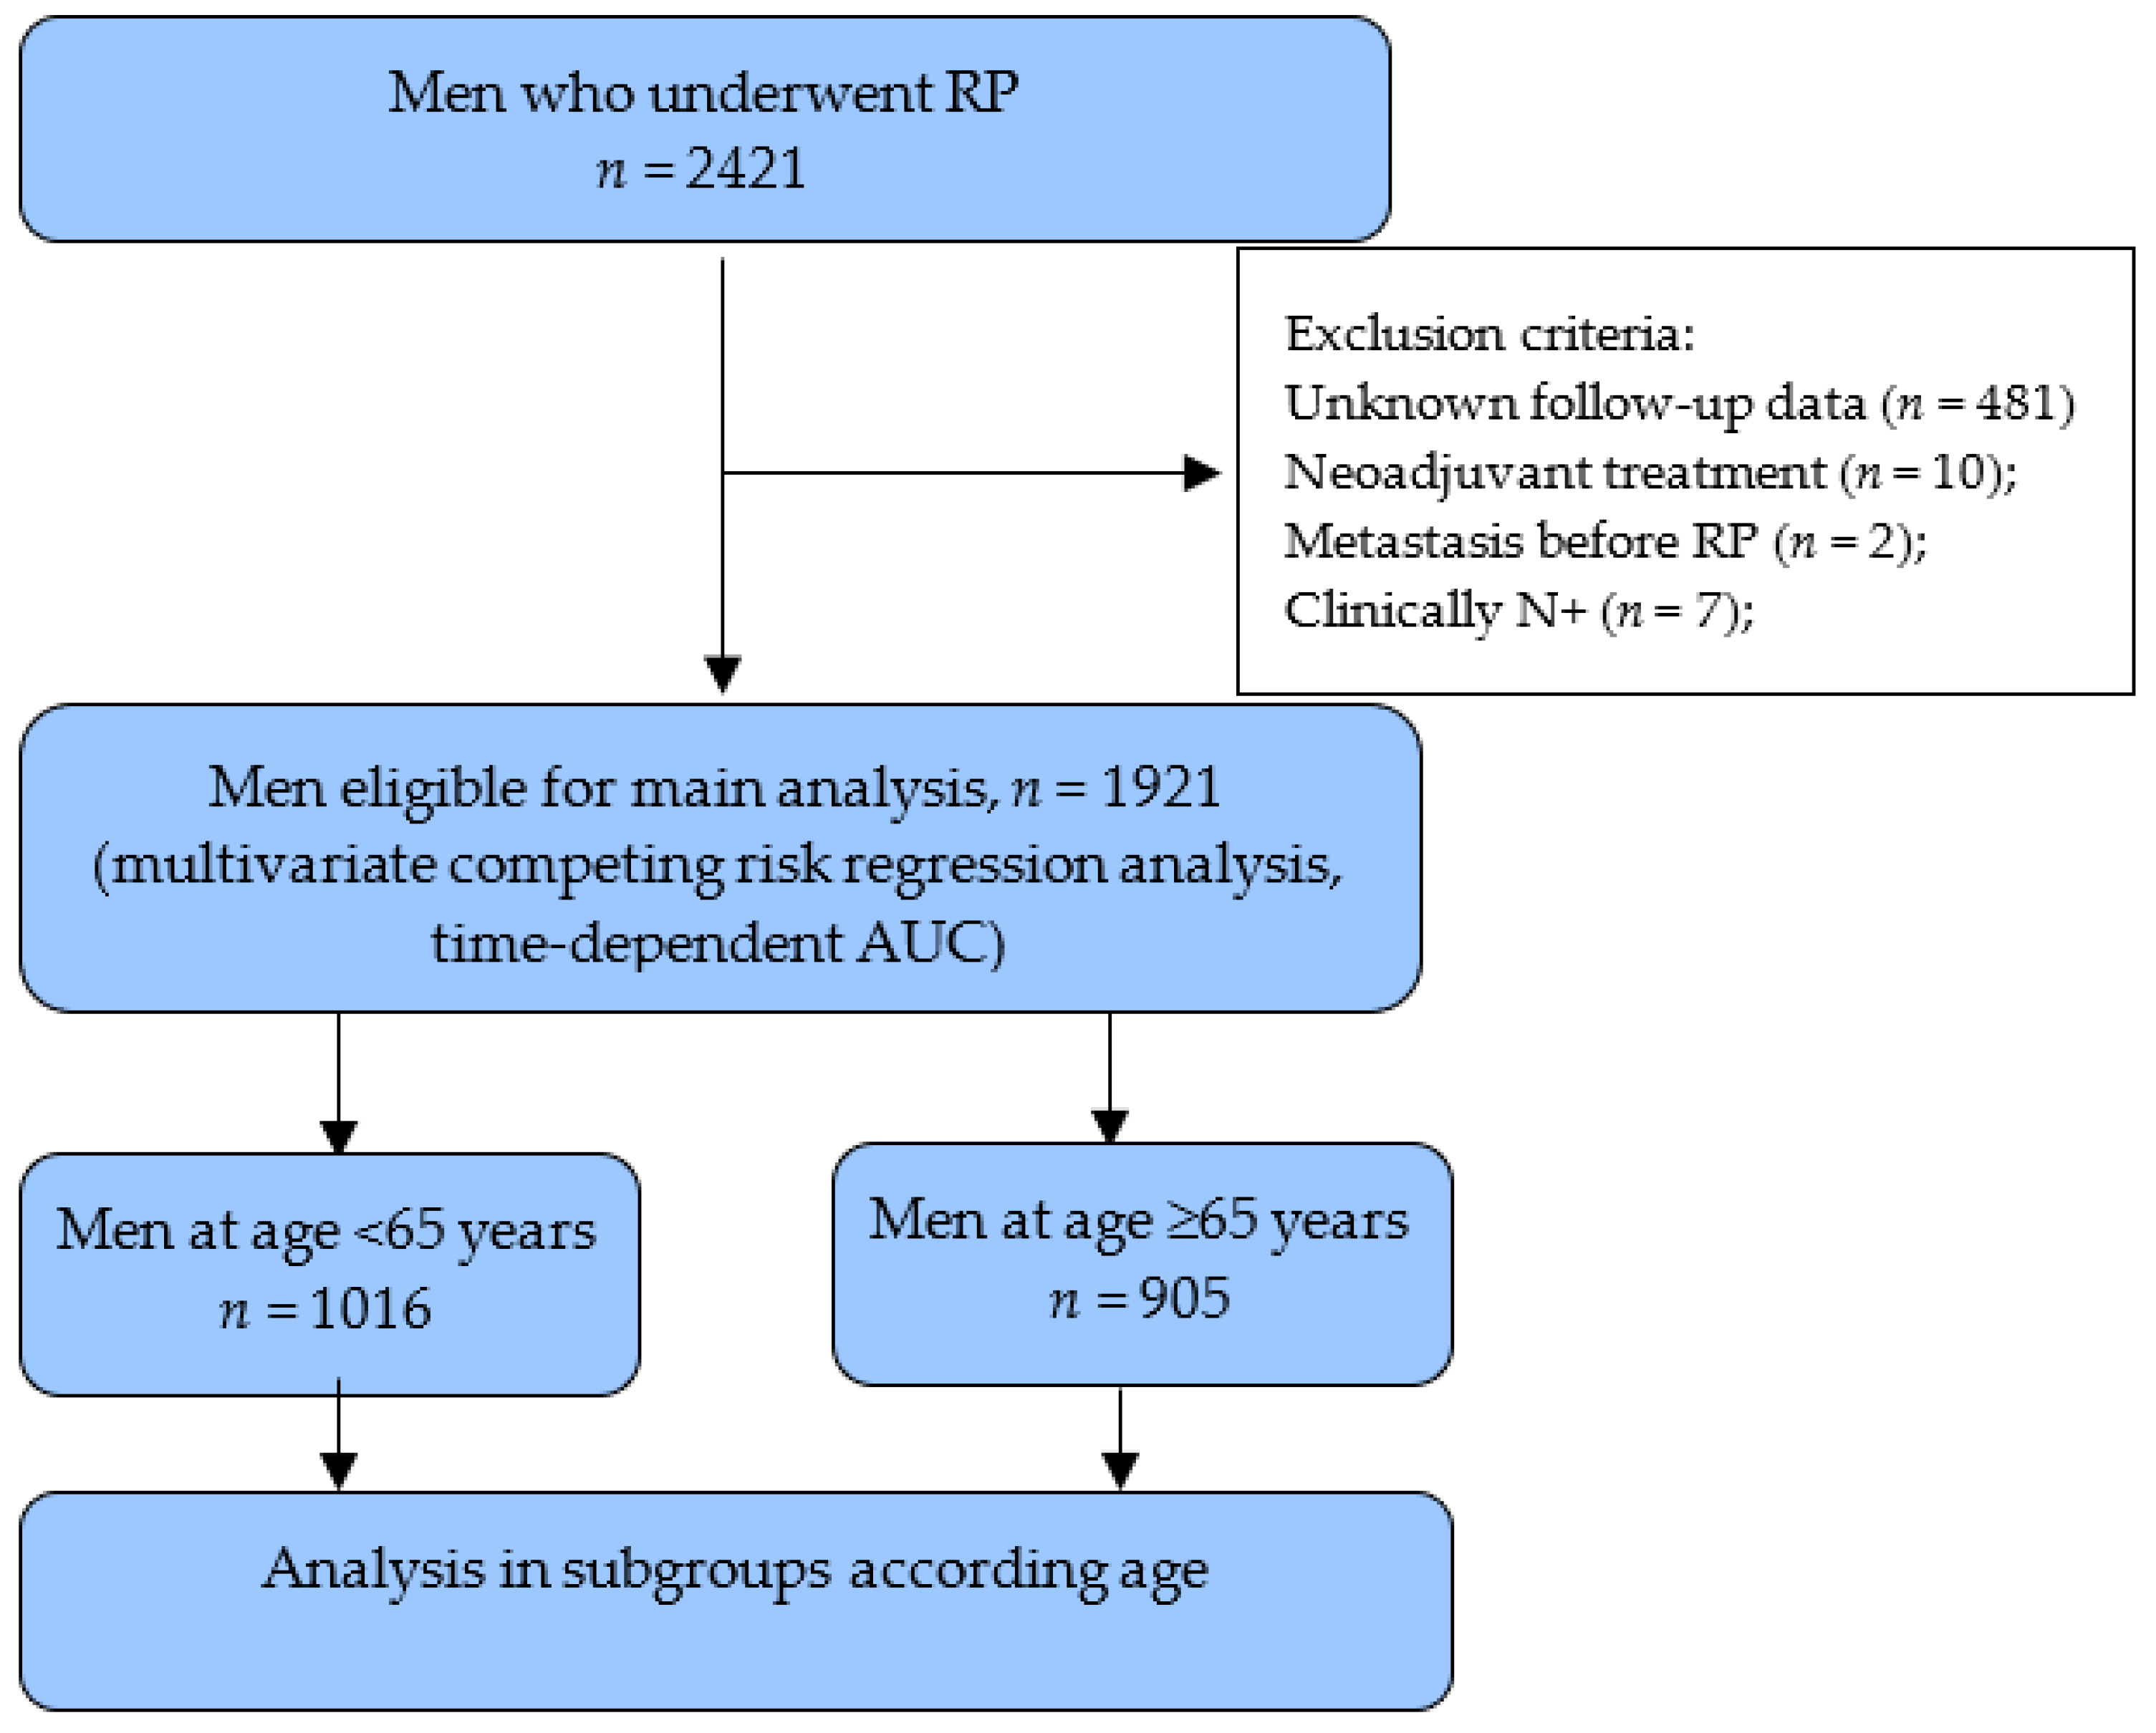
2. Patients and Methods
3. Results
4. Discussion
5. Conclusions
Author Contributions
Funding
Institutional Review Board Statement
Informed Consent Statement
Data Availability Statement
Acknowledgments
Conflicts of Interest
References
- Rider, J.R.; Sandin, F.; Andrén, O.; Wiklund, P.; Hugosson, J.; Stattin, P. Long-term outcomes among noncuratively treated men according to prostate cancer risk category in a nationwide, population-based study. Eur. Urol. 2013, 63, 88–96. [Google Scholar] [CrossRef]
- Abdollah, F.; Sun, M.; Schmitges, J.; Tian, Z.; Jeldres, C.; Briganti, A.; Shariat, S.F.; Perrotte, P.; Montorsi, F.; Karakiewicz, P.I. Cancer-Specific and Other-Cause Mortality After Radical Prostatectomy Versus Observation in Patients with Prostate Cancer: Competing-Risks Analysis of a Large North American Population-Based Cohort. Eur. Urol. 2011, 60, 920–930. [Google Scholar] [CrossRef] [PubMed]
- Briganti, A.; Spahn, M.; Joniau, S.; Gontero, P.; Bianchi, M.; Kneitz, B.; Chun, F.K.; Sun, M.; Graefen, M.; Abdollah, F.; et al. Impact of Age and Comorbidities on Long-term Survival of Patients with High-risk Prostate Cancer Treated with Radical Prostatectomy: A Multi-institutional Competing-risks Analysis. Eur. Urol. 2013, 63, 693–701. [Google Scholar] [CrossRef] [PubMed]
- Van Hemelrijck, M.; Folkvaljon, Y.; Adolfsson, J.; Akre, O.; Holmberg, L.; Garmo, H.; Stattin, P. Causes of death in men with localized prostate cancer: A nationwide, population-based study. BJU Int. 2016, 117, 507–514. [Google Scholar] [CrossRef] [Green Version]
- D’Amico, A.V.; Whittington, R.; Malkowicz, S.B.; Schultz, D.; Blank, K.; Broderick, G.A.; Tomaszewski, J.E.; Renshaw, A.A.; Kaplan, I.; Beard, C.J.; et al. Biochemical Outcome After Radical Prostatectomy, External Beam Radiation Therapy, or Interstitial Radiation Therapy for Clinically Localized Prostate Cancer. J. Urol. 1999, 16, 1393. [Google Scholar] [CrossRef]
- Mottet, N.; Bellmunt, J.; Bolla, M.; Briers, E.; Cumberbatch, M.G.; De Santis, M.; Fossati, N.; Gross, T.; Henry, A.; Joniau, S.; et al. EAU-ESTRO-SIOG Guidelines on Prostate Cancer. Part 1: Screening, Diagnosis, and Local Treatment with Curative Intent. Eur. Urol. 2017, 71, 618–629. [Google Scholar] [CrossRef]
- Chys, B.; Devos, G.; Everaerts, W.; Albersen, M.; Moris, L.; Claessens, F.; De Meerleer, G.; Haustermans, K.; Briganti, A.; Chlosta, P.; et al. Preoperative Risk-Stratification of High-Risk Prostate Cancer: A Multicenter Analysis. Front. Oncol. 2020, 10. [Google Scholar] [CrossRef] [PubMed]
- Joniau, S.; Briganti, A.; Gontero, P.; Gandaglia, G.; Tosco, L.; Fieuws, S.; Tombal, B.; Marchioro, G.; Walz, J.; Kneitz, B.; et al. Stratification of high-risk prostate cancer into prognostic categories: A European multi-institutional study. Eur. Urol. 2015, 67, 157–164. [Google Scholar] [CrossRef]
- Tosco, L.; Laenen, A.; Briganti, A.; Gontero, P.; Karnes, R.J.; Bastian, P.J.; Chlosta, P.; Claessens, F.; Chun, F.K.; Everaerts, W.; et al. The EMPaCT Classifier: A Validated Tool to Predict Postoperative Prostate Cancer-related Death Using Competing-risk Analysis. Eur. Urol. Focus 2018, 4, 369–375. [Google Scholar] [CrossRef]
- Offermann, A.; Hupe, M.C.; Sailer, V.; Merseburger, A.S.; Perner, S. The new ISUP 2014/WHO 2016 prostate cancer grade group system: First résumé 5 years after introduction and systemic review of the literature. World J. Urol. 2019, 38, 657–662. [Google Scholar] [CrossRef]
- Epstein, J.I.; Zelefsky, M.J.; Sjoberg, D.D.; Nelson, J.B.; Egevad, L.; Magi-Galluzzi, C.; Vickers, A.J.; Parwani, A.V.; Reuter, V.E.; Fine, S.W.; et al. A Contemporary Prostate Cancer Grading System: A Validated Alternative to the Gleason Score. Eur. Urol. 2016, 69, 428–435. [Google Scholar] [CrossRef] [Green Version]
- Spratt, D.E.; Cole, A.I.; Palapattu, G.S.; Weizer, A.Z.; Jackson, W.C.; Montgomery, J.S.; Dess, R.T.; Zhao, S.G.; Lee, J.Y.; Wu, A.; et al. Independent surgical validation of the new prostate cancer grade-grouping system. BJU Int. 2016, 118, 763–769. [Google Scholar] [CrossRef] [Green Version]
- Grogan, J.; Gupta, R.; Mahon, K.L.; Stricker, P.D.; Haynes, A.-M.; Delprado, W.; Turner, J.; Horvath, L.G.; Kench, J.G. Predictive value of the 2014 International Society of Urological Pathology grading system for prostate cancer in patients undergoing radical prostatectomy with long-term follow-up. BJU Int. 2017, 120, 651–658. [Google Scholar] [CrossRef]
- Milonas, D.; Muilwijk, T.; Venclovas, Z.; Devos, G.; Joniau, S. Benefits and harms of the new prostate cancer grade grouping on the prediction of long-term oncological outcomes in patients after radical prostatectomy. Int. J. Urol. 2021, 28, 390–395. [Google Scholar] [CrossRef] [PubMed]
- Epstein, J.; Allsbrook, W.C.; Amin, M.B.; Egevad, L.L. The 2005 International Society of Urological Pathology (ISUP) Consensus Conference on Gleason Grading of Prostatic Carcinoma. Am. J. Surg. Pathol. 2005, 29, 1228–1242. [Google Scholar] [CrossRef] [PubMed] [Green Version]
- Epstein, J.I.; Egevad, L.; Amin, M.B.; Delahunt, B.; Srigley, J.R.; Humphrey, P.A. The 2014 International Society of Urological Pathology (ISUP) Consensus Conference on Gleason Grading of Prostatic Carcinoma: Definition of Grading Patterns and Proposal for a New Grading System. Am. J. Surg. Pathol. 2016, 40, 244–252. [Google Scholar] [CrossRef]
- Van den Broeck, T.; Moris, L.; Gevaert, T.; Tosco, L.; Smeets, E.; Fishbane, N.; Liu, Y.; Helsen, C.; Margrave, J.; Buerki, C.; et al. Validation of the Decipher Test for Predicting Distant Metastatic Recurrence in Men with High-risk Nonmetastatic Prostate Cancer 10 Years After Surgery. Eur. Urol. Oncol. 2019, 2, 589–596. [Google Scholar] [CrossRef]
- Hofman, M.S.; Lawrentschuk, N.; Francis, R.J.; Tang, C.; Vela, I.; Thomas, P.; Rutherford, N.; Martin, J.M.; Frydenberg, M.; Shakher, R.; et al. Prostate-specific membrane antigen PET-CT in patients with high-risk prostate cancer before curative-intent surgery or radiotherapy (proPSMA): A prospective, randomised, multicentre study. Lancet 2020, 395, 1208–1216. [Google Scholar] [CrossRef]
- Spratt, D.E.; Jackson, W.C.; Abugharib, A.; Tomlins, S.; Dess, R.T.; Soni, P.D.; Lee, J.Y.; Zhao, S.G.; Cole, A.; Zumsteg, Z.S.; et al. Independent validation of the prognostic capacity of the ISUP prostate cancer grade grouping system for radiation treated patients with long-term follow-up. Prostate Cancer Prostatic Dis. 2016, 19, 292–297. [Google Scholar] [CrossRef]
- Pompe, R.S.; Davis-Bondarenko, H.; Zaffuto, E.; Tian, Z.; Shariat, S.F.; Leyh-Bannurah, S.R.; Schiffmann, J.; Saad, F.; Huland, H.; Graefen, M.; et al. Population-Based Validation of the 2014 ISUP Gleason Grade Groups in Patients Treated With Radical Prostatectomy, Brachytherapy, External Beam Radiation, or no Local Treatment. Prostate 2017, 77, 686–693. [Google Scholar] [CrossRef]
- Milonas, D.; Venclovas, Ž.; Gudinaviciene, I.; Auskalnis, S.; Zviniene, K.; Jurkiene, N.; Basevicius, A.; Patasius, A.; Jievaltas, M.; Joniau, S. Impact of the 2014 International Society of Urological Pathology Grading System on Concept of High-Risk Prostate Cancer: Comparison of Long-Term Oncological Outcomes in Patients Undergoing Radical Prostatectomy. Front. Oncol. 2019, 19, 1272. [Google Scholar] [CrossRef]
- He, J.; Albertsen, P.C.; Moore, D.; Rotter, D.; Demissie, K.; Lu-Yao, G. Validation of a Contemporary Five-tiered Gleason Grade Grouping Using Population-based Data. Eur. Urol. 2017, 71, 760–763. [Google Scholar] [CrossRef] [PubMed]
- Wilt, T.J.; Vo, T.N.; Langsetmo, L.; Dahm, P.; Wheeler, T.; Aronson, W.J.; Cooperberg, M.R.; Taylor, B.C.; Brawer, M.K. Radical Prostatectomy or Observation for Clinically Localized Prostate Cancer: Extended Follow-up of the Prostate Cancer Intervention Versus Observation Trial (PIVOT). Eur. Urol. 2020, 77, 713–724. [Google Scholar] [CrossRef] [PubMed]
- Bill-Axelson, A.; Holmberg, L.; Garmo, H.; Taari, K.; Busch, C.; Nordling, S.; Häggman, M.; Andersson, S.-O.; Andrén, O.; Steineck, G.; et al. Radical Prostatectomy or Watchful Waiting in Prostate Cancer—29-Year Follow-up. N. Engl. J. Med. 2018, 379, 2319–2329. [Google Scholar] [CrossRef] [PubMed]
- Milonas, D.; Venclovas, Z.; Jievaltas, M. Age and aggressiveness of prostate cancer: Analysis of clinical and pathological characteristics after radical prostatectomy for men with localized prostate cancer. Cent. Eur. J. Urol. 2019, 72, 240–246. [Google Scholar] [CrossRef]
- Kinnear, N.J.; Kichenadasse, G.; Plagakis, S.; O’Callaghan, M.E.; Kopsaftis, T.; Walsh, S.; Foreman, D. Prostate cancer in men aged less than 50 years at diagnosis. World J. Urol. 2016, 34, 1533–1539. [Google Scholar] [CrossRef]
- Boehm, K.; Larcher, A.; Tian, Z.; Mandel, P.; Schiffmann, J.; Karakiewicz, P.I.; Graefen, M.; Huland, H.; Tilki, D. Low Other Cause Mortality Rates Reflect Good Patient Selection in Patients with Prostate Cancer Treated with Radical Prostatectomy. J. Urol. 2016, 196, 82–88. [Google Scholar] [CrossRef]
- Ham, W.S.; Chalfin, H.J.; Feng, Z.; Trock, B.J.; Epstein, J.I.; Cheung, C.; Humphreys, E.; Partin, A.W.; Han, M. New Prostate Cancer Grading System Predicts Long-term Survival Following Surgery for Gleason Score 8–10 Prostate Cancer. Eur. Urol. 2017, 71, 907–912. [Google Scholar] [CrossRef] [PubMed]
- Loeb, S.; Folkvaljon, Y.; Robinson, D.; Lissbrant, I.F.; Egevad, L.; Stattin, P. Evaluation of the 2015 Gleason Grade Groups in a Nationwide Population-based Cohort. Eur. Urol. 2016, 69, 1135–1141. [Google Scholar] [CrossRef] [Green Version]


| Parameter | All Patients n = 1921 | Age <65-Year n = 1016 | Age ≥65-Year n = 905 | p |
|---|---|---|---|---|
| Age, years—median (IQR) | 64 (59–68) | 59 (56–62) | 68 (67–71) | <0.001 |
| PSA, ng/mL—median (IQR) | 6.6 (4.8–10.1) | 6.2 (4.6–9.8) | 6.9 (51–10.4) | <0.001 |
| Clinical stage (cT), n (%) | ||||
| T1 | 522 (27.2) | 294 (28.9) | 228 (25.2) | |
| T2 | 1092 (56.9) | 563 (55.4) | 529 (58.5) | |
| T3 | 304 (15.8) | 158 (15.6) | 147 (16.2) | 0.2 |
| Unknown | 2 (0.1) | 1 (0.1) | 1 (0.1) | |
| Biopsy Gleason score (ISUP GG), n (%) | ||||
| 1 | 1099 (57.2) | 591 (58.2) | 508 (56.1) | |
| 2 | 583 (30.3) | 318 (31.3) | 265 (29.3) | |
| 3 | 88 (4.6) | 47 (4.6) | 41 (4.5) | 0.003 |
| 4 | 99 (5.2) | 33 (3.2) | 66 (7.3) | |
| 5 | 52 (2.7) | 27 (2.7) | 25 (2.8) | |
| Pathological stage (pT), n (%) | ||||
| T2 | 1169 (60.9) | 633 (62.3) | 536 (59.2) | |
| T3a | 579 (30.1) | 299 (29.4) | 280 (30.9) | 0.3 |
| T3b-4 | 173 (9.0) | 84 (8.3) | 89 (9.8) | |
| Pathological Gleason score, (ISUP GG), n (%) | ||||
| 1 | 502 (26.1) | 268 (26.4) | 234 (25.9) | |
| 2 | 975 (50.8) | 534 (52.6) | 441 (48.7) | |
| 3 | 210 (10.9) | 125 (12.3) | 85 (9.4) | <0.001 |
| 4 | 103 (5.4) | 38 (3.7) | 65 (7.2) | |
| 5 | 131 (6.8) | 51 (5.0) | 80 (8.8) | |
| Surgical margins status, n (%) | ||||
| Negative | 1234 (64.2) | 668 (65.7) | 566 (62.5) | |
| Positive | 606 (31.5) | 306 (30.2) | 300 (33.1) | 0.3 |
| Unknown | 81(4.2) | 42 (4.1) | 39 (4.3) | |
| Lymph nodes status, n (%) | ||||
| pN0 | 651 (33.9) | 306 (30.1) | 345 (38.1) | |
| pN1 | 81 (4.2) | 37 (3.7) | 44 (4.9) | <0.001 |
| Unknown | 1189 (61.9) | 673 (66.2) | 516 (57.0) | |
| Post RP treatment, n (%) | ||||
| Adjuvant | 63 (3.3) | 28 (2.8) | 40 (4.4) | 0.4 |
| Salvage ADT | 75 (3.9) | 29 (2.8) | 46 (5.1) | 0.1 |
| Salvage RT ± ADT | 291 (15.1) | 128 (12.6) | 163 (18.0) | 0.08 |
| Cancer Specific Mortality | |||
|---|---|---|---|
| Pathological Parameter | HR | 95% CI | p |
| Preoperative PSA (ng/mL) | 0.99 | 0.95–1.02 | 0.4 |
| Age (year) | 1.1 | 1.03–1.14 | 0.001 |
| Pathological stage | |||
| pT2 | Referent | ||
| pT3a | 1.02 | 0.43–2.41 | 0.9 |
| pT3b-4 | 3.1 | 1.28–7.49 | 0.01 |
| Pathological ISUP GG | |||
| GG 1 | Referent | ||
| GG 2 | 1.9 | 0.58–6.02 | 0.3 |
| GG 3 | 4.7 | 1.18–18.47 | 0.03 |
| GG 4 | 6.8 | 1.87–24.76 | 0.004 |
| GG 5 | 20.3 | 5.55–74.31 | <0.0001 |
| SM status | |||
| Negative | Referent | ||
| Positive | 2.3 | 1.16–4.64 | 0.02 |
| Unknown | 2.2 | 0.47–9.91 | 0.3 |
| LN status | |||
| Negative | Referent | ||
| Positive | 3.2 | 1.47–6.88 | 0.003 |
| Unknown | 0.8 | 0.38–1.59 | 0.5 |
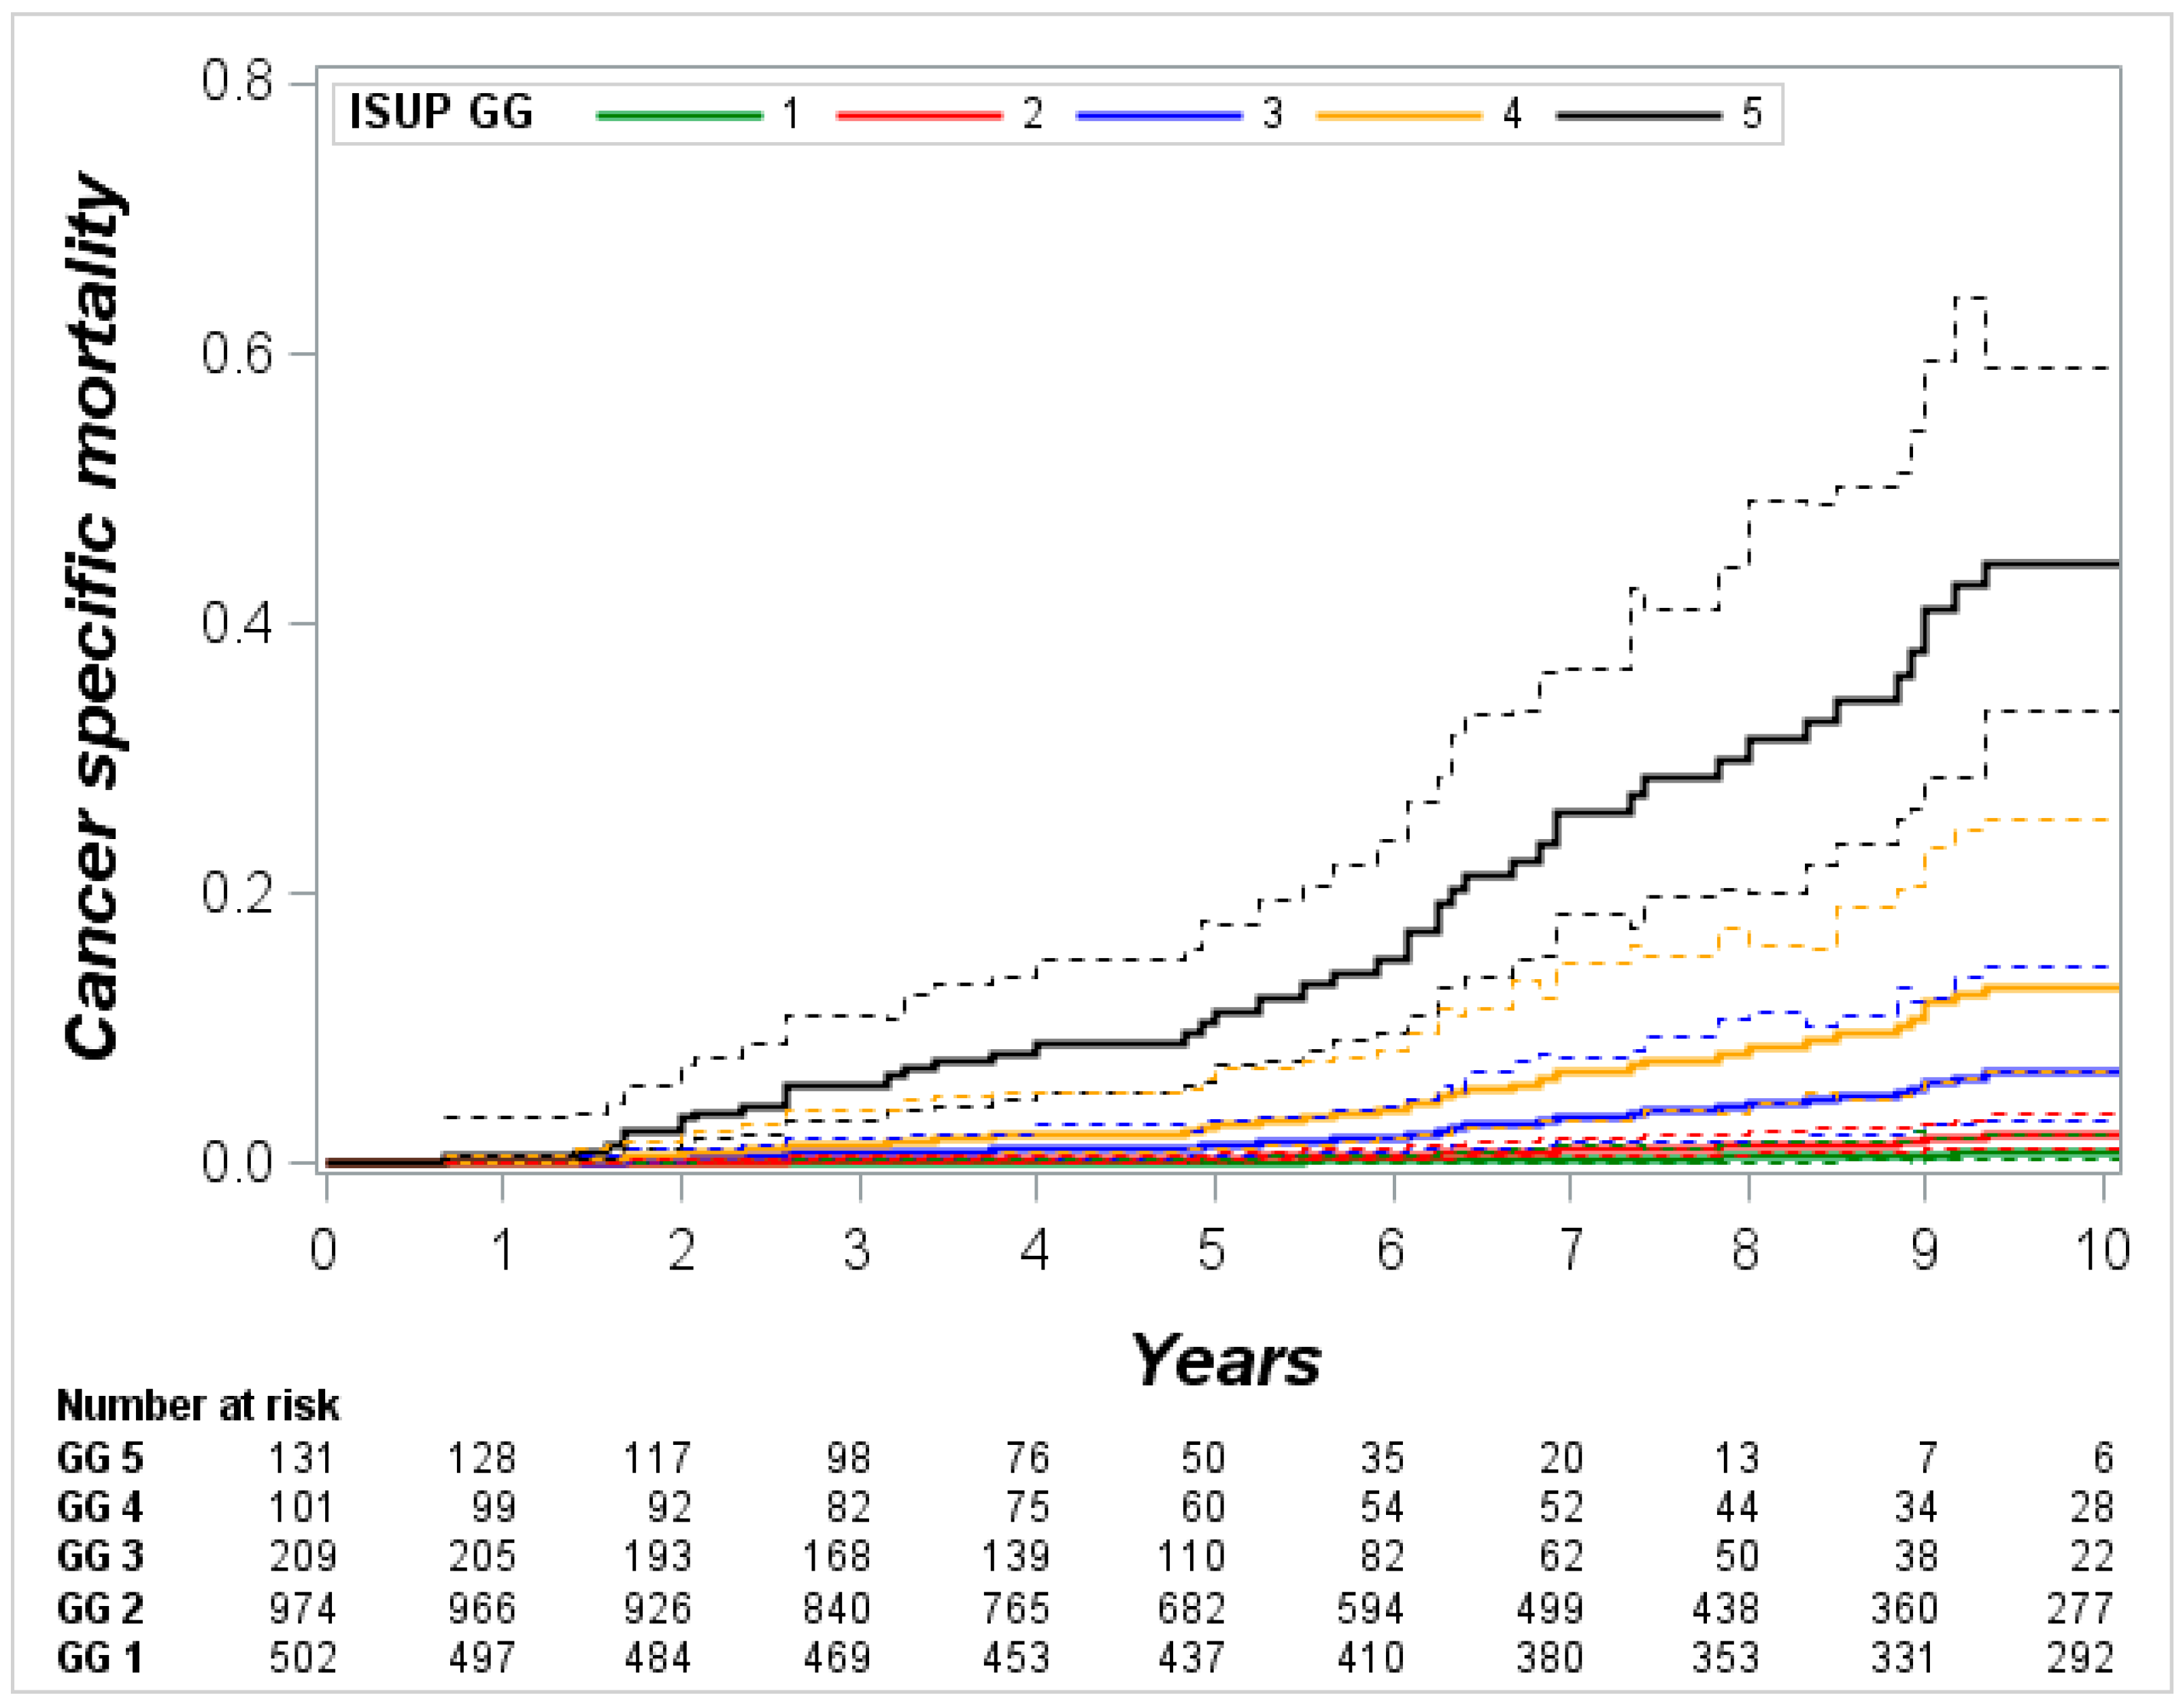
| ISUP GG | 5-Year Mortality (95% CI) | 10-Year Mortality (95% CI) | ||
|---|---|---|---|---|
| Prostate Cancer | Other Causes | Prostate Cancer | Other Causes | |
| Pathological ISUP GG, all patients | ||||
| 1 | 0.2 (0.05–0.4) | 4.5 (3.7–6.1) | 0.9 (0.3–2.2) | 15.5 (11.8–18.4) |
| 2 | 0.4 (0.2–0.8) | 4.8 (3.9–6.3) | 2.3 (1.3–3.9) | 16.1 (12.8–18.7) |
| 3 | 1.4 (0.6–3.0) | 4.4 (2.4–7.7) | 7.6 (3.9–14.8) | 12.6 (7.9–22.9) |
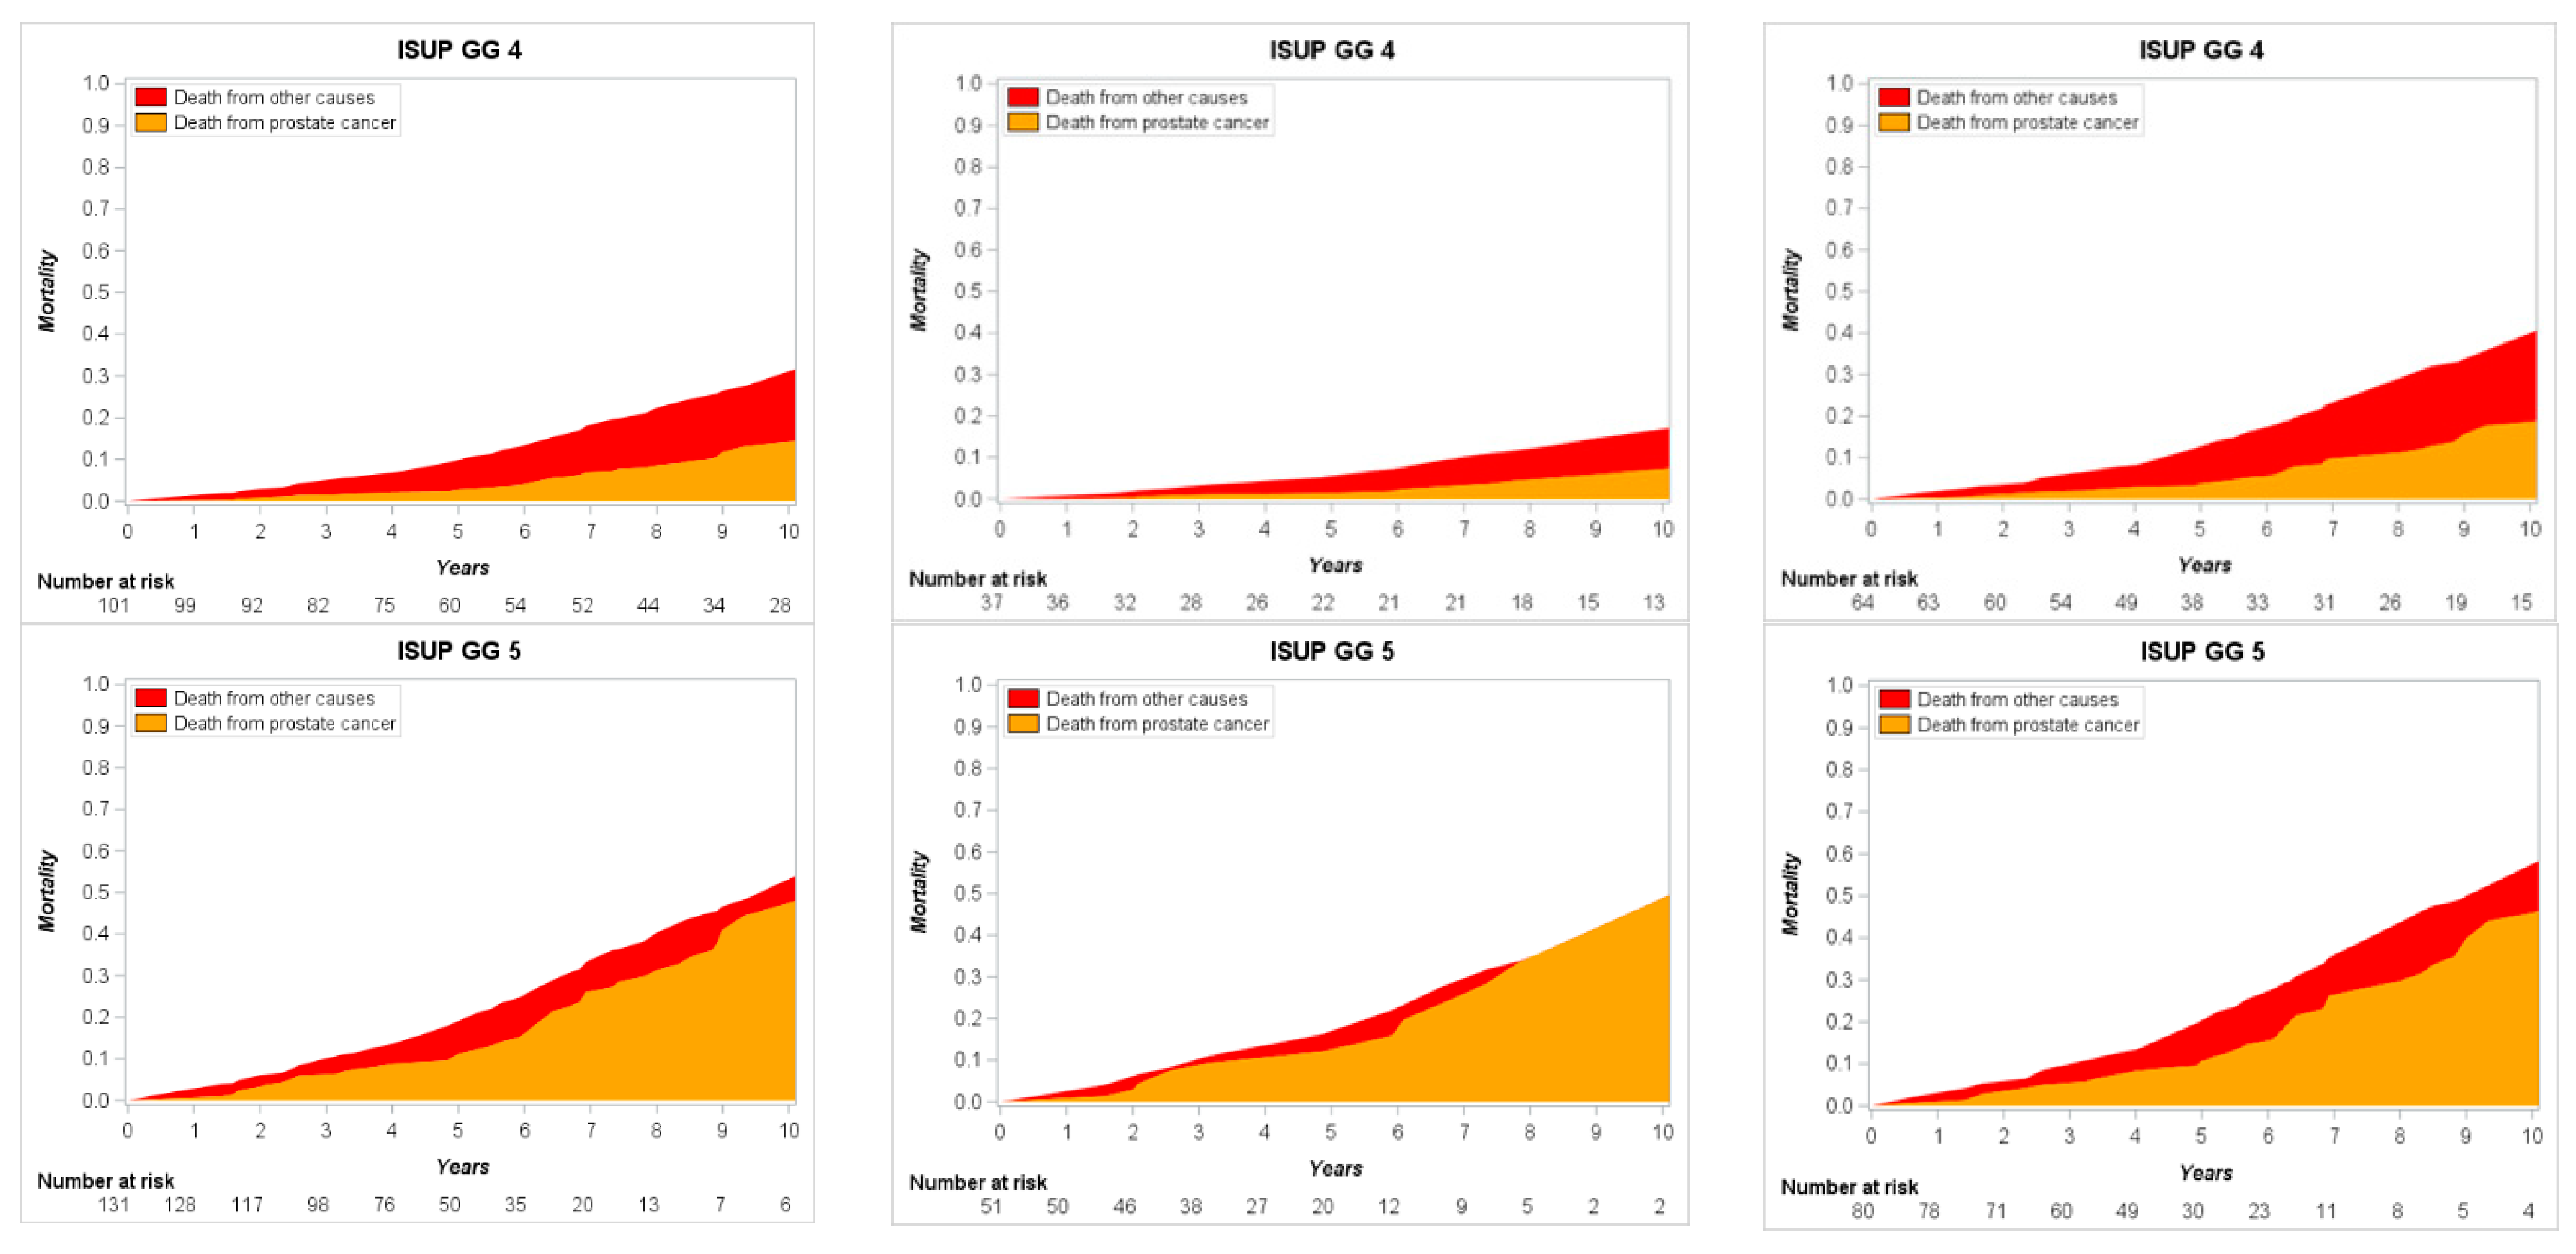
| 4 | 2.8 (1.1–7.1) | 7.1 (4.0–11.2) | 14.7 (7.3–29.3) | 17.7 (12.6–32.7) |
| 5 | 11.3 (7.2–17.6) | 7.9 (4.1–12.1) | 48.6 (33.9–69.7) | 6.5 (2.6–21.2) |
| Pathological ISUP GG (<65-year) | ||||
| 1 | 0.1 (0.0–1.2) | 3.8 (2.0–4.8) | 0.4 (0.0–3.0) | 9.4 (5.9–14.2) |
| 2 | 0.1 (0.0–0.4) | 4.7 (2.6–5.5) | 0.3 (0.0–2.1) | 11.3 (7.9–14.9) |
| 3 | 1.8 (0.6–5.3) | 4.0 (1.1–7.9) | 7.3 (2.1–25.7) | 7.0 (3.9–18.8) |
| 4 | 1.9 (0.2–14.3) | 5.3 (1.0–12.5) | 7.6 (1.4–41.9) | 9.8 (3.4–31.7) |
| 5 | 15.9 (6.8–37.2) | 6.1 (0.9–15.3) | 50.7 (27.6–93.3) | 0.0 (0.0–38.9) |
| Pathological ISUP GG (≥65-year) | ||||
| 1 | 0.3 (0.0–0.8) | 6.3 (4.7–9.3) | 1.4 (0.5–4.2) | 22.1 (16.7–26.8) |
| 2 | 0.8 (0.4–1.6) | 6.2 (4.8–8.4) | 4.3 (2.4–7.6) | 20.6 (16.8–24.7) |
| 3 | 1.5 (0.4–5.6) | 5.9 (3.0–11.4) | 8.1 (2.8–23.4) | 18.1 (10.1–35.5) |
| 4 | 3.7 (1.5–9.5) | 8.9 (4.6–16.6) | 18.9 (9.9–36.1) | 22.6 (16.9–43.3) |
| 5 | 10.7 (6.0–19.0) | 9.7 (4.6–17.9) | 46.7 (30.2–72.0) | 12.8 (6.8–56.9) |
| ISUP GG | OM (%) | Proportion of CSM (%) | Proportion of OCM (%) | Ratio CSM/OCM |
|---|---|---|---|---|
| Pathological ISUP GG, all patients | ||||
| 1 | 16.4 | 5.5 | 94.5 | 1:17 |
| 2 | 18.4 | 12.5 | 87.5 | 1:7 |
| 3 | 20.2 | 37.6 | 62.4 | 1:2 |
| 4 | 32.4 | 45.4 | 54.6 | 1:1 |
| 5 | 55.1 | 88.2 | 11.8 | 7:1 |
| Pathological ISUP GG (<65-year) | ||||
| 1 | 9.8 | 4.1 | 95.9 | 1:23 |
| 2 | 11.6 | 2.6 | 97.4 | 1:37 |
| 3 | 14.3 | 51 | 49 | 1:1 |
| 4 | 17.4 | 43.7 | 56.3 | 1:1 |
| 5 | 50.7 | 100 | 0 | 100:0 |
| Pathological ISUP GG (≥65-year) | ||||
| 1 | 23.5 | 6 | 94 | 1:16 |
| 2 | 24.9 | 17.3 | 82.7 | 1:5 |
| 3 | 26.2 | 30.9 | 69.1 | 1:2 |
| 4 | 41.5 | 45.5 | 54.5 | 1:1 |
| 5 | 59.5 | 78.5 | 11.5 | 7:1 |
Publisher’s Note: MDPI stays neutral with regard to jurisdictional claims in published maps and institutional affiliations. |
© 2021 by the authors. Licensee MDPI, Basel, Switzerland. This article is an open access article distributed under the terms and conditions of the Creative Commons Attribution (CC BY) license (https://creativecommons.org/licenses/by/4.0/).
Share and Cite
Milonas, D.; Ruzgas, T.; Venclovas, Z.; Jievaltas, M.; Joniau, S. Impact of Grade Groups on Prostate Cancer-Specific and Other-Cause Mortality: Competing Risk Analysis from a Large Single Institution Series. Cancers 2021, 13, 1963. https://doi.org/10.3390/cancers13081963
Milonas D, Ruzgas T, Venclovas Z, Jievaltas M, Joniau S. Impact of Grade Groups on Prostate Cancer-Specific and Other-Cause Mortality: Competing Risk Analysis from a Large Single Institution Series. Cancers. 2021; 13(8):1963. https://doi.org/10.3390/cancers13081963
Chicago/Turabian StyleMilonas, Daimantas, Tomas Ruzgas, Zilvinas Venclovas, Mindaugas Jievaltas, and Steven Joniau. 2021. "Impact of Grade Groups on Prostate Cancer-Specific and Other-Cause Mortality: Competing Risk Analysis from a Large Single Institution Series" Cancers 13, no. 8: 1963. https://doi.org/10.3390/cancers13081963