
Prognosis Parameters of Oral Carcinomas Developed in Proliferative Verrucous Leukoplakia: A Systematic Review and Meta-Analysis


Abstract
:Simple Summary
Abstract
1. Introduction
2. Materials and Methods
2.1. Protocol
2.2. Search Strategy
2.3. Eligibility Criteria
2.4. Study Selection Process
2.5. Data Extraction
2.6. Evaluation of Quality and Risk of Bias
2.7. Statistical Analysis
3. Results
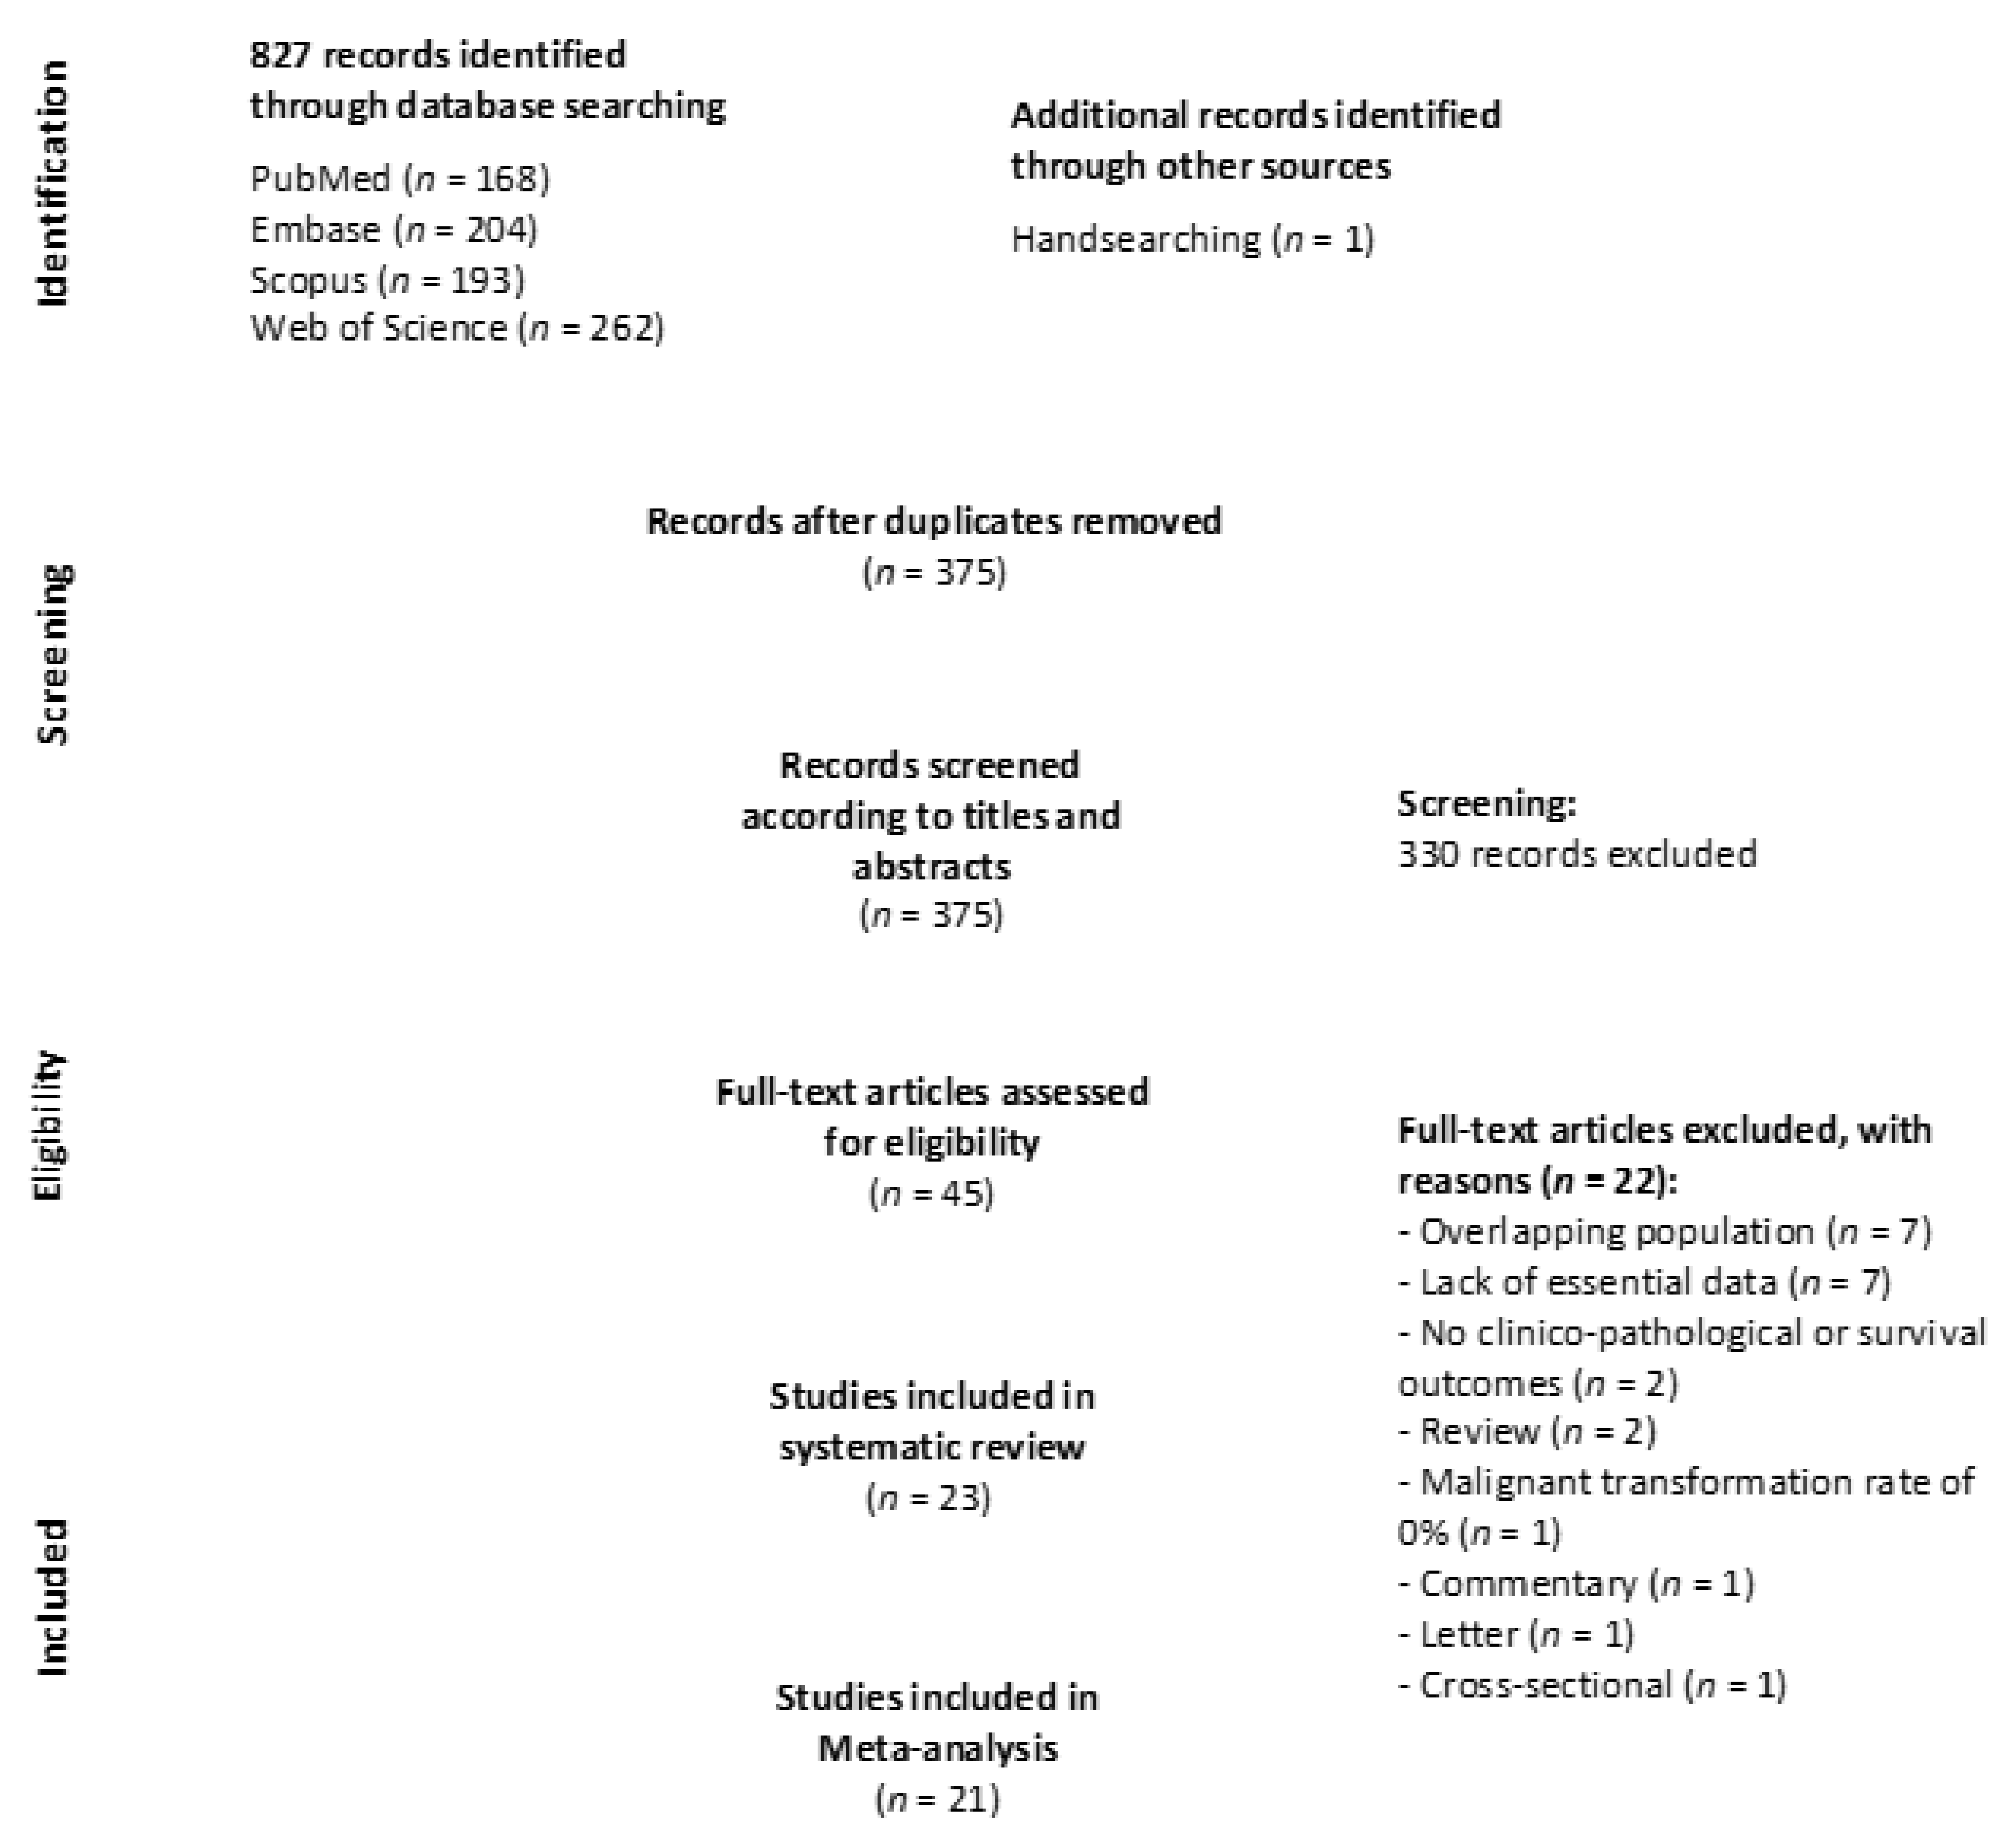
3.1. Results of the Literature Search
3.2. Study Characteristics
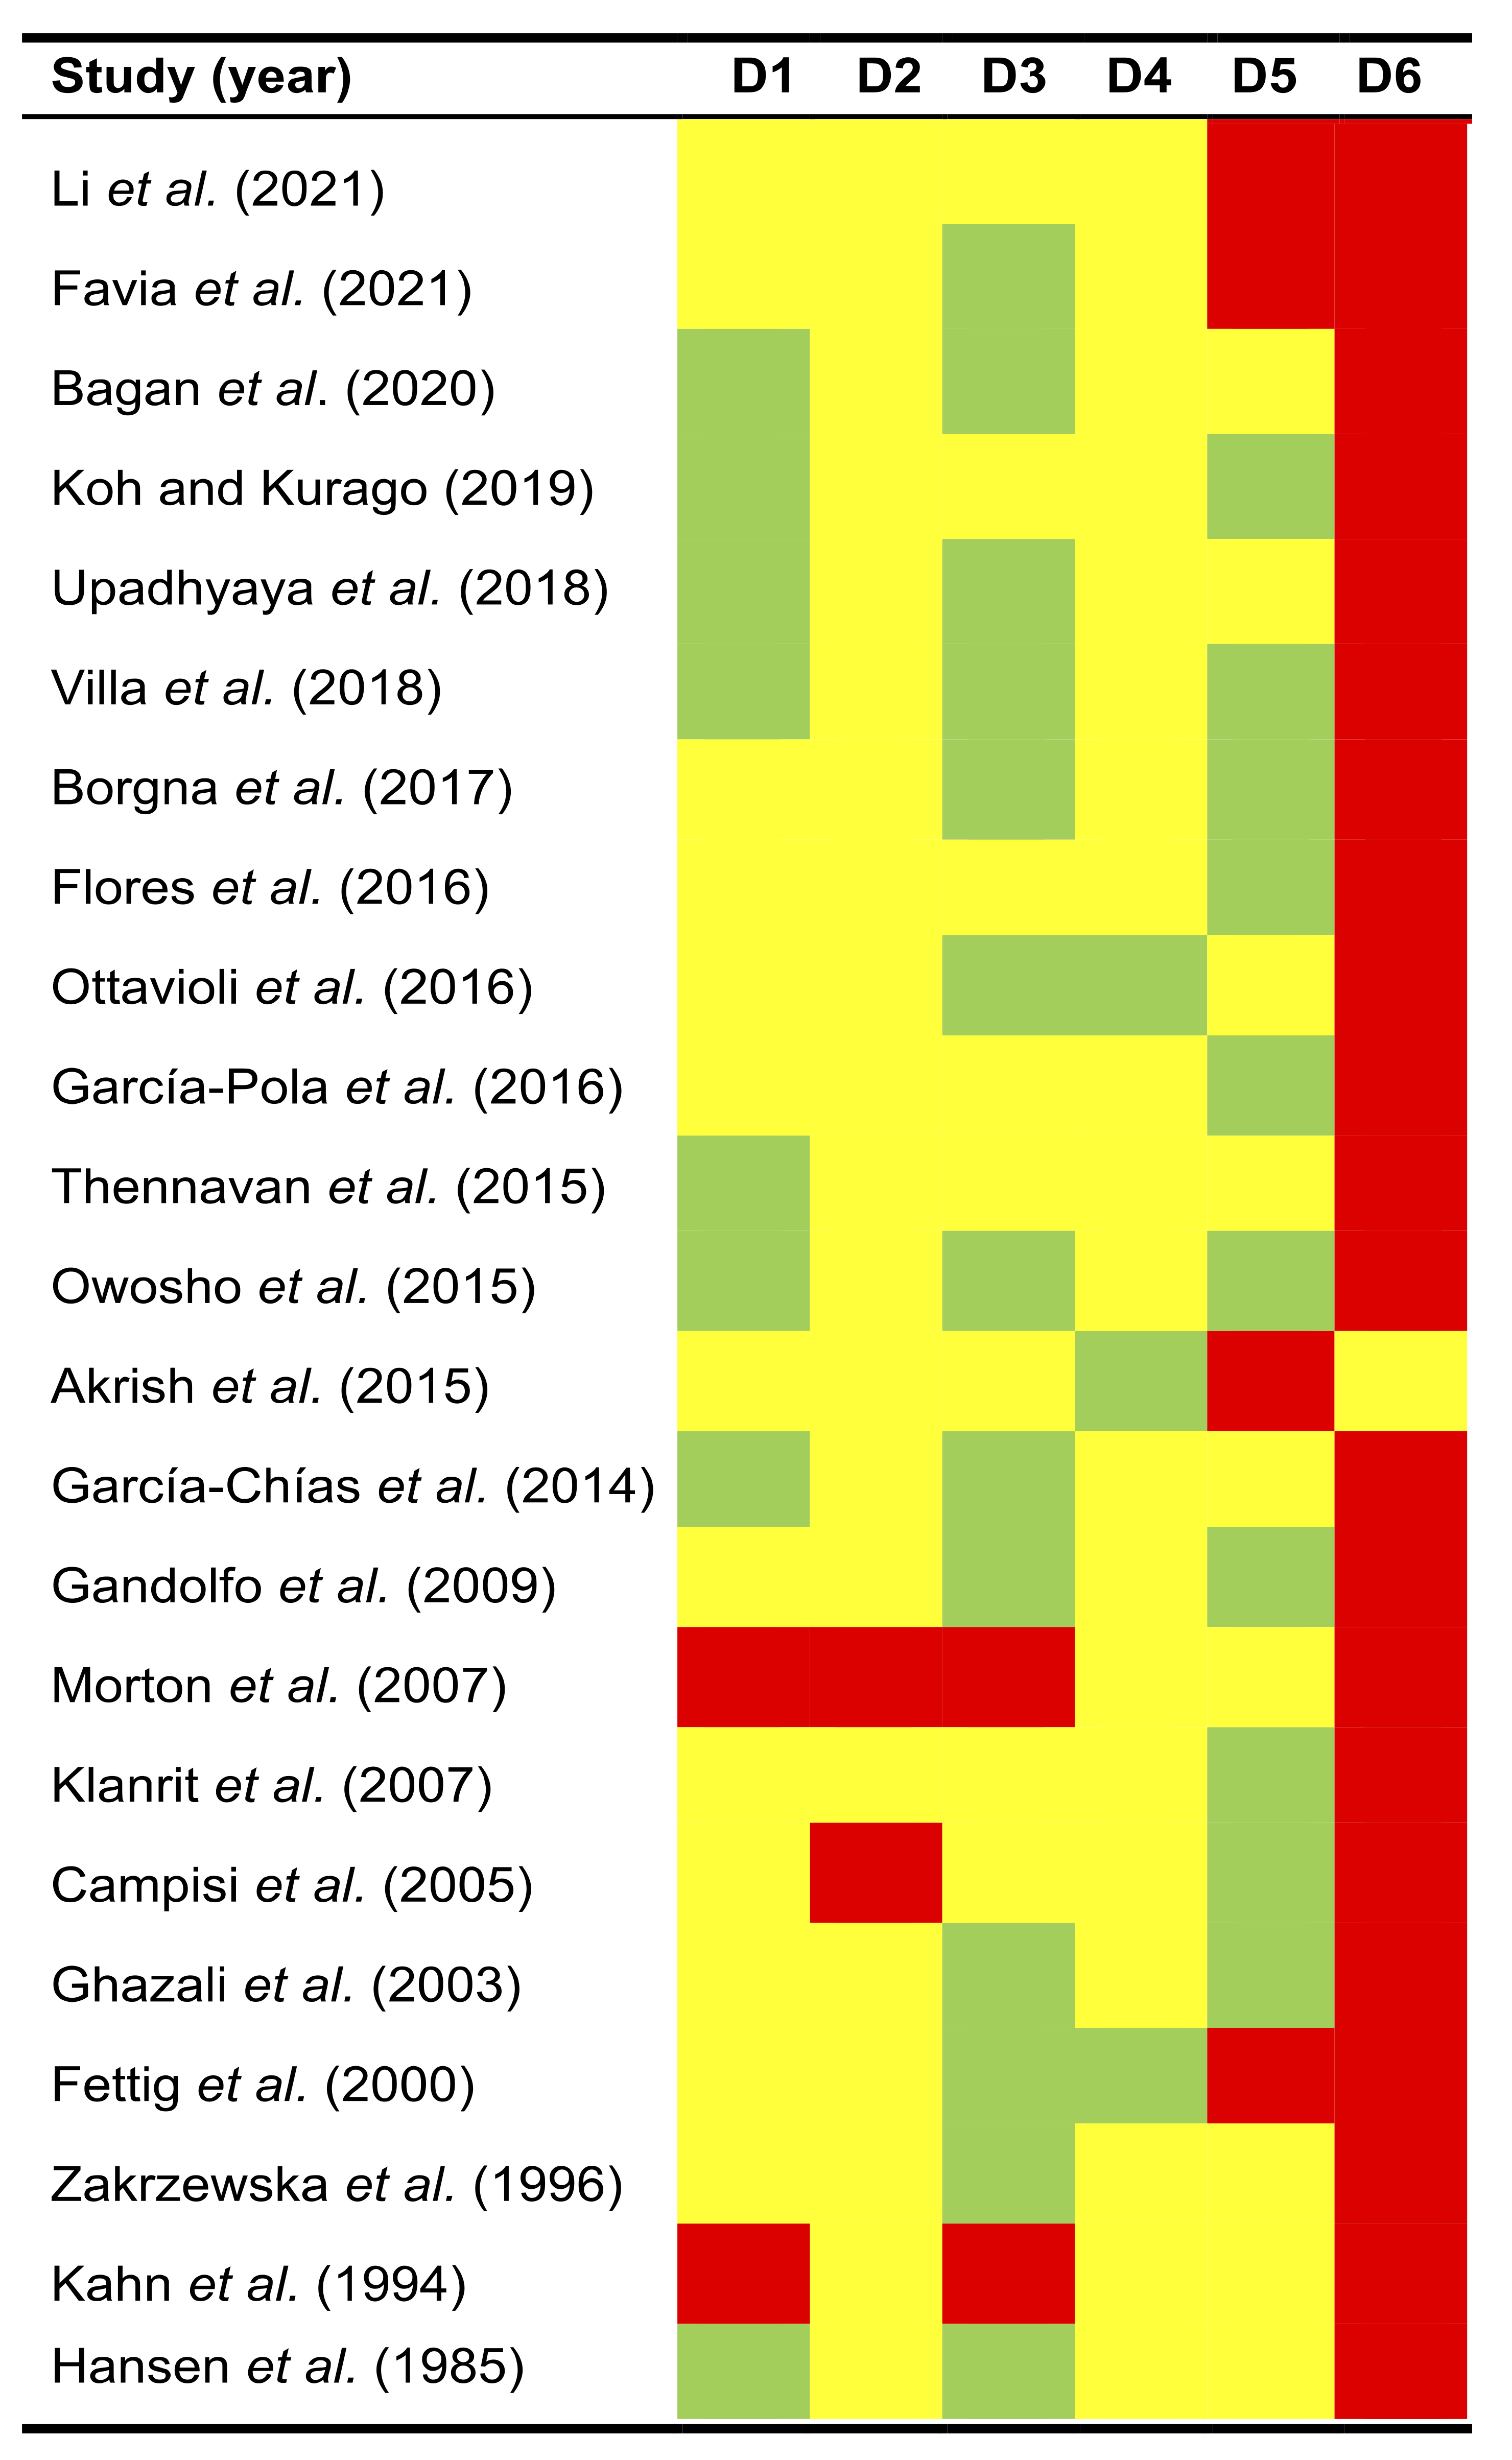
3.3. Qualitative Evaluation
3.4. Quantitative Evaluation (Meta-Analysis)
3.4.1. Quantitative Evaluation of Survival Parameters of Patients with PVL-OC
3.4.2. Quantitative Evaluation of Clinicopathological Parameters of Patients with PVL-OC
3.5. Quantitative Evaluation (Secondary Analyses)
3.5.1. Sensitivity Analysis
3.5.2. Analysis of Small-Study Effects
4. Discussion
5. Conclusions
Supplementary Materials
Author Contributions
Funding
Data Availability Statement
Acknowledgments
Conflicts of Interest
References
- Warnakulasuriya, S.; Kujan, O.; Aguirre-Urizar, J.M.; Bagan, J.V.; González-Moles, M.Á.; Kerr, A.R.; Lodi, G.; Mello, F.W.; Monteiro, L.; Ogden, G.R.; et al. Oral potentially malignant disorders: A consensus report from an international seminar on nomenclature and classification, convened by the WHO Collaborating Centre for Oral Cancer. Oral Dis. 2020, in press. [Google Scholar] [CrossRef]
- Ramos-García, P.; González-Moles, M.Á.; Mello, F.W.; Bagan, J.V.; Warnakulasuriya, S. Malignant transformation of oral proliferative verrucous leukoplakia: A systematic review and meta-analysis. Oral Dis. 2021, in press. [Google Scholar] [CrossRef] [PubMed]
- Iocca, O.; Sollecito, T.P.; Alawi, F.; Weinstein, G.S.; Newman, J.G.; De Virgilio, A.; Di Maio, P.; Spriano, G.; Pardiñas López, S.; Shanti, R.M. Potentially malignant disorders of the oral cavity and oral dysplasia: A systematic review and meta-analysis of malignant transformation rate by subtype. Head Neck 2019, 42, 539–555. [Google Scholar] [CrossRef] [PubMed]
- Mehrotra, D.; Goel, M.; Kumar, S.; Pandey, R.; Ram, H. Oral verrucous lesions: Controversies in diagnosis and management. J. Oral Biol. Craniofacial Res. 2012, 2, 163–169. [Google Scholar] [CrossRef] [Green Version]
- Zakrzewska, J.M.; Lopes, V.; Speight, P.; Hopper, C. Proliferative verrucous leukoplakia: A report of ten cases. Oral Surg. Oral Med. Oral Pathol. Oral Radiol. Endod. 1996, 82, 396–401. [Google Scholar] [CrossRef]
- Thennavan, A.; Byatnal, A.; Solomon, M.; Radhakrishnan, R. The role of Ki-67, p16, CD34, Bcl-2, cyclooxygenase-2 in the pathogenesis of proliferative verrucous leukoplakia. Indian J. Cancer 2015, 52, 498–502. [Google Scholar] [CrossRef] [PubMed]
- Kahn, M.A.; Dockter, M.E.; Hermann-Petrin, J.M. Proliferative verrucous leukoplakia. Four cases with flow cytometric analysis. Oral Surg. Oral Med. Oral Pathol. 1994, 78, 469–475. [Google Scholar] [CrossRef]
- Bagan, J.V.; Jiménez-Soriano, Y.; Diaz-Fernandez, J.M.; Murillo-Cortés, J.; Sanchis-Bielsa, J.M.; Poveda-Roda, R.; Bagan, L. Malignant transformation of proliferative verrucous leukoplakia to oral squamous cell carcinoma: A series of 55 cases. Oral Oncol. 2011, 47, 732–735. [Google Scholar] [CrossRef]
- Bagán, J.V.; Murillo, J.; Poveda, R.; Gavaldá, C.; Jiménez, Y.; Scully, C. Proliferative verrucous leukoplakia: Unusual locations of oral squamous cell carcinomas, and field cancerization as shown by the appearance of multiple OSCCs. Oral Oncol. 2004, 40, 440–443. [Google Scholar] [CrossRef]
- Available online: https://seer.cancer.gov (accessed on 13 August 2021).
- Warnakulasuriya, S. Global epidemiology of oral and oropharyngeal cancer. Oral Oncol. 2009, 45, 309–316. [Google Scholar] [CrossRef]
- Higgins, J.P.; Green, S. Cochrane Handbook for Systematic Reviews of Interventions: Cochrane Book Series; John Wiley & Sons Ltd.: Chichester, UK, 2008; Available online: http://handbook.cochrane.org/ (accessed on 10 August 2021).
- Riley, R.D.; Ridley, G.; Williams, K.; Altman, D.G.; Hayden, J.; de Vet, H.C.W. Prognosis research: Toward evidence-based results and a Cochrane methods group. J. Clin. Epidemiol. 2007, 60, 863–865. [Google Scholar] [CrossRef]
- Centre for Reviews and Dissemination Group. Systematic Reviews: CRD’s Guidance for Undertaking Reviews in Health Care; York Publishing Services Ltd.: York, UK, 2009. [Google Scholar]
- Stroup, D.F.; Berlin, J.A.; Morton, S.C.; Olkin, I.; Williamson, G.D.; Rennie, D.; Moher, D.; Becker, B.J.; Sipe, T.A.; Thacker, S.B. Meta-analysis of observational studies in epidemiology: A proposal for reporting. J. Am. Med. Assoc. 2000, 283, 2008–2012. [Google Scholar] [CrossRef] [PubMed]
- Moher, D.; Liberati, A.; Tetzlaff, J.; Altman, D.G.; PRISMA Group. Preferred reporting items for systematic reviews and meta-analyses: The PRISMA statement. PLoS Med. 2009, 6, e1000097. [Google Scholar] [CrossRef] [Green Version]
- Booth, A.; Clarke, M.; Dooley, G.; Ghersi, D.; Moher, D.; Petticrew, M.; Stewart, L. The nuts and bolts of PROSPERO: An international prospective register of systematic reviews. Syst. Rev. 2012, 1, 2. [Google Scholar] [CrossRef] [PubMed] [Green Version]
- Shamseer, L.; Moher, D.; Clarke, M.; Ghersi, D.; Liberati, A.; Petticrew, M.; Shekelle, P.; Stewart, L.A.; PRISMA-P Group. Preferred reporting items for systematic review and meta-analysis protocols (PRISMA-P) 2015: Elaboration and explanation. BMJ 2015, 350, g7647. [Google Scholar] [CrossRef] [Green Version]
- Cohen, J. A Coefficient of Agreement for Nominal Scales. Educ. Psychol. Meas. 1960, 20, 37–46. [Google Scholar] [CrossRef]
- Luo, D.; Wan, X.; Liu, J.; Tong, T. Optimally estimating the sample mean from the sample size, median, mid-range, and/or mid-quartile range. Stat. Methods Med. Res. 2018, 27, 1785–1805. [Google Scholar] [CrossRef] [Green Version]
- Wan, X.; Wang, W.; Liu, J.; Tong, T. Estimating the sample mean and standard deviation from the sample size, median, range and/or interquartile range. BMC Med. Res. Methodol. 2014, 14, 1–13. [Google Scholar] [CrossRef] [Green Version]
- Akrish, S.; Ben-Izhak, O.; Sabo, E.; Rachmiel, A. Oral squamous cell carcinoma associated with proliferative verrucous leukoplakia compared with conventional squamous cell carcinoma—A clinical, histologic and immunohistochemical study. Oral Surg. Oral Med. Oral Pathol. Oral Radiol. 2015, 119, 318–325. [Google Scholar] [CrossRef]
- Hayden, J.A.; van der Windt, D.A.; Cartwright, J.L.; Côté, P.; Bombardier, C. Assessing bias in studies of prognostic factors. Ann. Intern. Med. 2013, 158, 280–286. [Google Scholar] [CrossRef]
- Hayden, J.A.; Côté, P.; Bombardier, C. Evaluation of the quality of prognosis studies in systematic reviews. Ann. Intern. Med. 2006, 144, 427–437. [Google Scholar] [CrossRef] [PubMed]
- Agresti, A.; Coull, B.A. Approximate is Better than “Exact” for Interval Estimation of Binomial Proportions. Am. Stat. 1998, 52, 119–126. [Google Scholar] [CrossRef]
- Freeman, M.; Tuckey, J. Transformations Related to the Angular and the Square Root. Ann. Math. Stat. 1950, 21, 607–611. [Google Scholar] [CrossRef]
- Higgins, J.P.T.; Thompson, S.G. Quantifying heterogeneity in a meta-analysis. Stat. Med. 2002, 21, 1539–1558. [Google Scholar] [CrossRef]
- Higgins, J.P.T.; Thompson, S.G.; Deeks, J.J.; Altman, D.G. Measuring inconsistency in meta-analyses. BMJ 2003, 327, 557–560. [Google Scholar] [CrossRef] [Green Version]
- Thompson, S.G.; Higgins, J.P.T. How should meta-regression analyses be undertaken and interpreted? Stat. Med. 2002, 21, 1559–1573. [Google Scholar] [CrossRef]
- Higgins, J.P.T.; Thompson, S.G. Controlling the risk of spurious findings from meta-regression. Stat. Med. 2004, 23, 1663–1682. [Google Scholar] [CrossRef]
- Manly, B.F.J. Randomization, Bootstrap and Monte Carlo Methods in Biology; CRC Press: Boca Raton, FL, USA, 2008; ISBN 9780367349943. [Google Scholar]
- Parmar, M.K.; Torri, V.; Stewart, L. Extracting summary statistics to perform meta-analyses of the published literature for survival endpoints. Stat. Med. 1998, 17, 2815–2834. [Google Scholar] [CrossRef]
- Tierney, J.F.; Stewart, L.A.; Ghersi, D.; Burdett, S.; Sydes, M.R. Practical methods for incorporating summary time-to-event data into meta-analysis. Trials 2007, 8, 16. [Google Scholar] [CrossRef] [Green Version]
- Viechtbauer, W.; Cheung, M.W.-L. Outlier and influence diagnostics for meta-analysis. Res. Synth. Methods 2010, 1, 112–125. [Google Scholar] [CrossRef]
- Egger, M.; Davey Smith, G.; Schneider, M.; Minder, C. Bias in meta-analysis detected by a simple, graphical test. BMJ 1997, 315, 629–634. [Google Scholar] [CrossRef] [Green Version]
- Duval, S.; Tweedie, R. A non-parametric “trim and fill” method of assessing publication bias in meta-analysis. J. Am. Stat. Assoc. 2000, 95, 89–98. [Google Scholar] [CrossRef]
- Borgna, S.C.; Clarke, P.T.; Schache, A.G.; Lowe, D.; Ho, M.W.; McCarthy, C.E.; Adair, S.; Field, E.A.; Field, J.K.; Holt, D.; et al. Management of proliferative verrucous leukoplakia: Justification for a conservative approach. Head Neck 2017, 39, 1997–2003. [Google Scholar] [CrossRef]
- Garcia-Pola, M.-J.; Llorente-Pendás, S.; González-Garcia, M.; García-Martín, J.-M. The development of proliferative verrucous leukoplakia in oral lichen planus. A preliminary study. Med. Oral Patol. Oral Cir. Bucal 2016, 21, e328–e334. [Google Scholar] [CrossRef]
- Ottavioli, A.; Campana, F.; Catherine, J.-H.; Massereau, E.; Del Grande, J.; Ordioni, U. Proliferative verrucous leukoplakia: Three cases and literature review. Ann. Dermatol. Venereol. 2016, 143, 187–196. [Google Scholar] [CrossRef]
- Flores, I.L.; Santos-Silva, A.R.; Della Coletta, R.; Leme, A.F.P.; Lopes, M.A. Low expression of angiotensinogen and dipeptidyl peptidase 1 in saliva of patients with proliferative verrucous leukoplakia. World J. Clin. Cases 2016, 4, 356. [Google Scholar] [CrossRef] [PubMed]
- Owosho, A.; Bilodeau, E.A.; Summersgill, K.F. Seven Cases of Proliferative Verrucous Leukoplakia: The Need for a High Clinical Suspicion Among Dental Practitioners. J. Mich. Dent. Assoc. 2015, 97, 48–51, 95. [Google Scholar] [PubMed]
- García-Chías, B.; Casado-De La Cruz, L.; Esparza-Gómez, G.-C.; Cerero-Lapiedra, R. Diagnostic criteria in proliferative verrucous leukoplakia: Evaluation. Med. Oral Patol. Oral Cir. Bucal 2014, 19, e335–e339. [Google Scholar] [CrossRef] [PubMed]
- Gandolfo, S.; Castellani, R.; Pentenero, M. Proliferative verrucous leukoplakia: A potentially malignant disorder involving periodontal sites. J. Periodontol. 2009, 80, 274–281. [Google Scholar] [CrossRef]
- Klanrit, P.; Sperandio, M.; Brown, A.L.; Shirlaw, P.J.; Challacombe, S.J.; Morgan, P.R.; Odell, E.W. DNA ploidy in proliferative verrucous leukoplakia. Oral Oncol. 2007, 43, 310–316. [Google Scholar] [CrossRef]
- Morton, T.H.; Cabay, R.J.; Epstein, J.B. Proliferative verrucous leukoplakia and its progression to oral carcinoma: Report of three cases. J. Oral Pathol. Med. 2007, 36, 315–318. [Google Scholar] [CrossRef] [PubMed]
- Campisi, G.; Giovannelli, L.; Ammatuna, P.; Capra, G.; Colella, G.; Di Liberto, C.; Gandolfo, S.; Pentenero, M.; Carrozzo, M.; Serpico, R.; et al. Proliferative verrucous vs. conventional leukoplakia: No significantly increased risk of HPV infection. Oral Oncol. 2004, 40, 835–840. [Google Scholar] [CrossRef] [PubMed]
- Ghazali, N.; Bakri, M.M.; Zain, R.B. Aggressive, multifocal oral verrucous leukoplakia: Proliferative verrucous leukoplakia or not? J. Oral Pathol. Med. 2003, 32, 383–392. [Google Scholar] [CrossRef] [PubMed] [Green Version]
- Fettig, A.; Pogrel, M.A.; Silverman, S.; Bramanti, T.E.; Da Costa, M.; Regezi, J.A. Proliferative verrucous leukoplakia of the gingiva. Oral Surg. Oral Med. Oral Pathol. Oral Radiol. Endod. 2000, 90, 723–730. [Google Scholar] [CrossRef] [Green Version]
- Hansen, L.S.; Olson, J.A.; Silverman, S. Proliferative verrucous leukoplakia. A long-term study of thirty patients. Oral Surg. Oral Med. Oral Pathol. 1985, 60, 285–298. [Google Scholar] [CrossRef]
- Favia, G.; Capodiferro, S.; Limongelli, L.; Tempesta, A.; Maiorano, E. Malignant transformation of oral proliferative verrucous leukoplakia: A series of 48 patients with suggestions for management. Int. J. Oral Maxillofac. Surg. 2021, 50, 14–20. [Google Scholar] [CrossRef]
- Li, C.-C.; Almazrooa, S.; Carvo, I.; Salcines, A.; Woo, S.-B. Architectural Alterations in Oral Epithelial Dysplasia are Similar in Unifocal and Proliferative Leukoplakia. Head Neck Pathol. 2021, 15, 443–460. [Google Scholar] [CrossRef]
- Bagan, J.; Murillo-Cortes, J.; Poveda-Roda, R.; Leopoldo-Rodado, M.; Bagan, L. Second primary tumors in proliferative verrucous leukoplakia: A series of 33 cases. Clin. Oral Investig. 2020, 24, 1963–1969. [Google Scholar] [CrossRef]
- Koh, J.; Kurago, Z.B. Expanded Expression of Toll-Like Receptor 2 in Proliferative Verrucous Leukoplakia. Head Neck Pathol. 2019, 13, 635–642. [Google Scholar] [CrossRef]
- Upadhyaya, J.D.; Fitzpatrick, S.G.; Islam, M.N.; Bhattacharyya, I.; Cohen, D.M. A Retrospective 20-Year Analysis of Proliferative Verrucous Leukoplakia and Its Progression to Malignancy and Association with High-risk Human Papillomavirus. Head Neck Pathol. 2018, 12, 500–510. [Google Scholar] [CrossRef]
- Villa, A.; Menon, R.; Kerr, A.; De Abreu Alves, F.; Guollo, A.; Ojeda, D.; Woo, S. Proliferative leukoplakia: Proposed new clinical diagnostic criteria. Oral Dis. 2018, 24, 749–760. [Google Scholar] [CrossRef]
- Gonzalez-Moles, M.A.; Scully, C.; Ruiz-Avila, I. Molecular findings in oral premalignant fields: Update on their diagnostic and clinical implications. Oral Dis. 2012, 18, 40–47. [Google Scholar] [CrossRef]
- Bagan, J.; Scully, C.; Jimenez, Y.; Martorell, M. Proliferative verrucous leukoplakia: A concise update. Oral Dis. 2010, 16, 328–332. [Google Scholar] [CrossRef]
- Proaño-Haro, A.; Bagan, L.; Bagan, J.V. Recurrences following treatment of proliferative verrucous leukoplakia: A systematic review and meta-analysis. J. Oral Pathol. Med. 2021, in press. [Google Scholar] [CrossRef]
- González-Moles, M.Á.; Ramos-García, P.; Warnakulasuriya, S. A Scoping Review on Gaps in the Diagnostic Criteria for Proliferative Verrucous Leukoplakia: A Conceptual Proposal and Diagnostic Evidence-Based Criteria. Cancers 2021, 13, 3669. [Google Scholar] [CrossRef] [PubMed]
- González-Moles, M.Á.; Warnakulasuriya, S.; González-Ruiz, I.; González-Ruiz, L.; Ayén, Á.; Lenouvel, D.; Ruiz-Ávila, I.; Ramos-García, P. Clinicopathological and prognostic characteristics of oral squamous cell carcinomas arising in patients with oral lichen planus: A systematic review and a comprehensive meta-analysis. Oral Oncol. 2020, 106, 104688. [Google Scholar] [CrossRef] [PubMed]
- Ndiaye, C.; Mena, M.; Alemany, L.; Arbyn, M.; Castellsagué, X.; Laporte, L.; Bosch, F.X.; de Sanjosé, S.; Trottier, H. HPV DNA, E6/E7 mRNA, and p16INK4a detection in head and neck cancers: A systematic review and meta-analysis. Lancet Oncol. 2014, 15, 1319–1331. [Google Scholar] [CrossRef]


| Total | 23 Studies |
|---|---|
| Year of publication | 1985–2021 |
| Number of patients | |
| PVL | 543 |
| Developing oral cancer | 288 |
| Number of tumors | 504 |
| Sample size, range | |
| PVL | 3–81 |
| Developing oral cancer | 1–48 |
| Number of tumors | 1–130 |
| Study design | |
| Retrospective longitudinal | 23 studies |
| Prospective longitudinal | 1 studies |
| Follow up periods | |
| Mean of means | 65.63 months |
| Range | 14–174 |
| Geographical region | |
| Europe | 9 studies, 4 countries: France, Italy, Spain, UK |
| North America | 9 studies, 1 country: USA |
| Asia | 3 studies, 3 countries: India, Israel, Malaysia |
| South America | 1 study, 1 country: Brazil |
| Multicontinent | 1 study, 2 countries: Brazil-USA |
| Total | 4 continents (9 countries) |
| Pooled Data | Heterogeneity | ||||||||||
|---|---|---|---|---|---|---|---|---|---|---|---|
| Meta-Analyses | No. of Studies | No. of Patients | Stat. Model | Wt | ES (95% CI) | p-Value | phet | I2 (%) | Supplementary Materials a | ||
| SURVIVAL PARAMETERS | |||||||||||
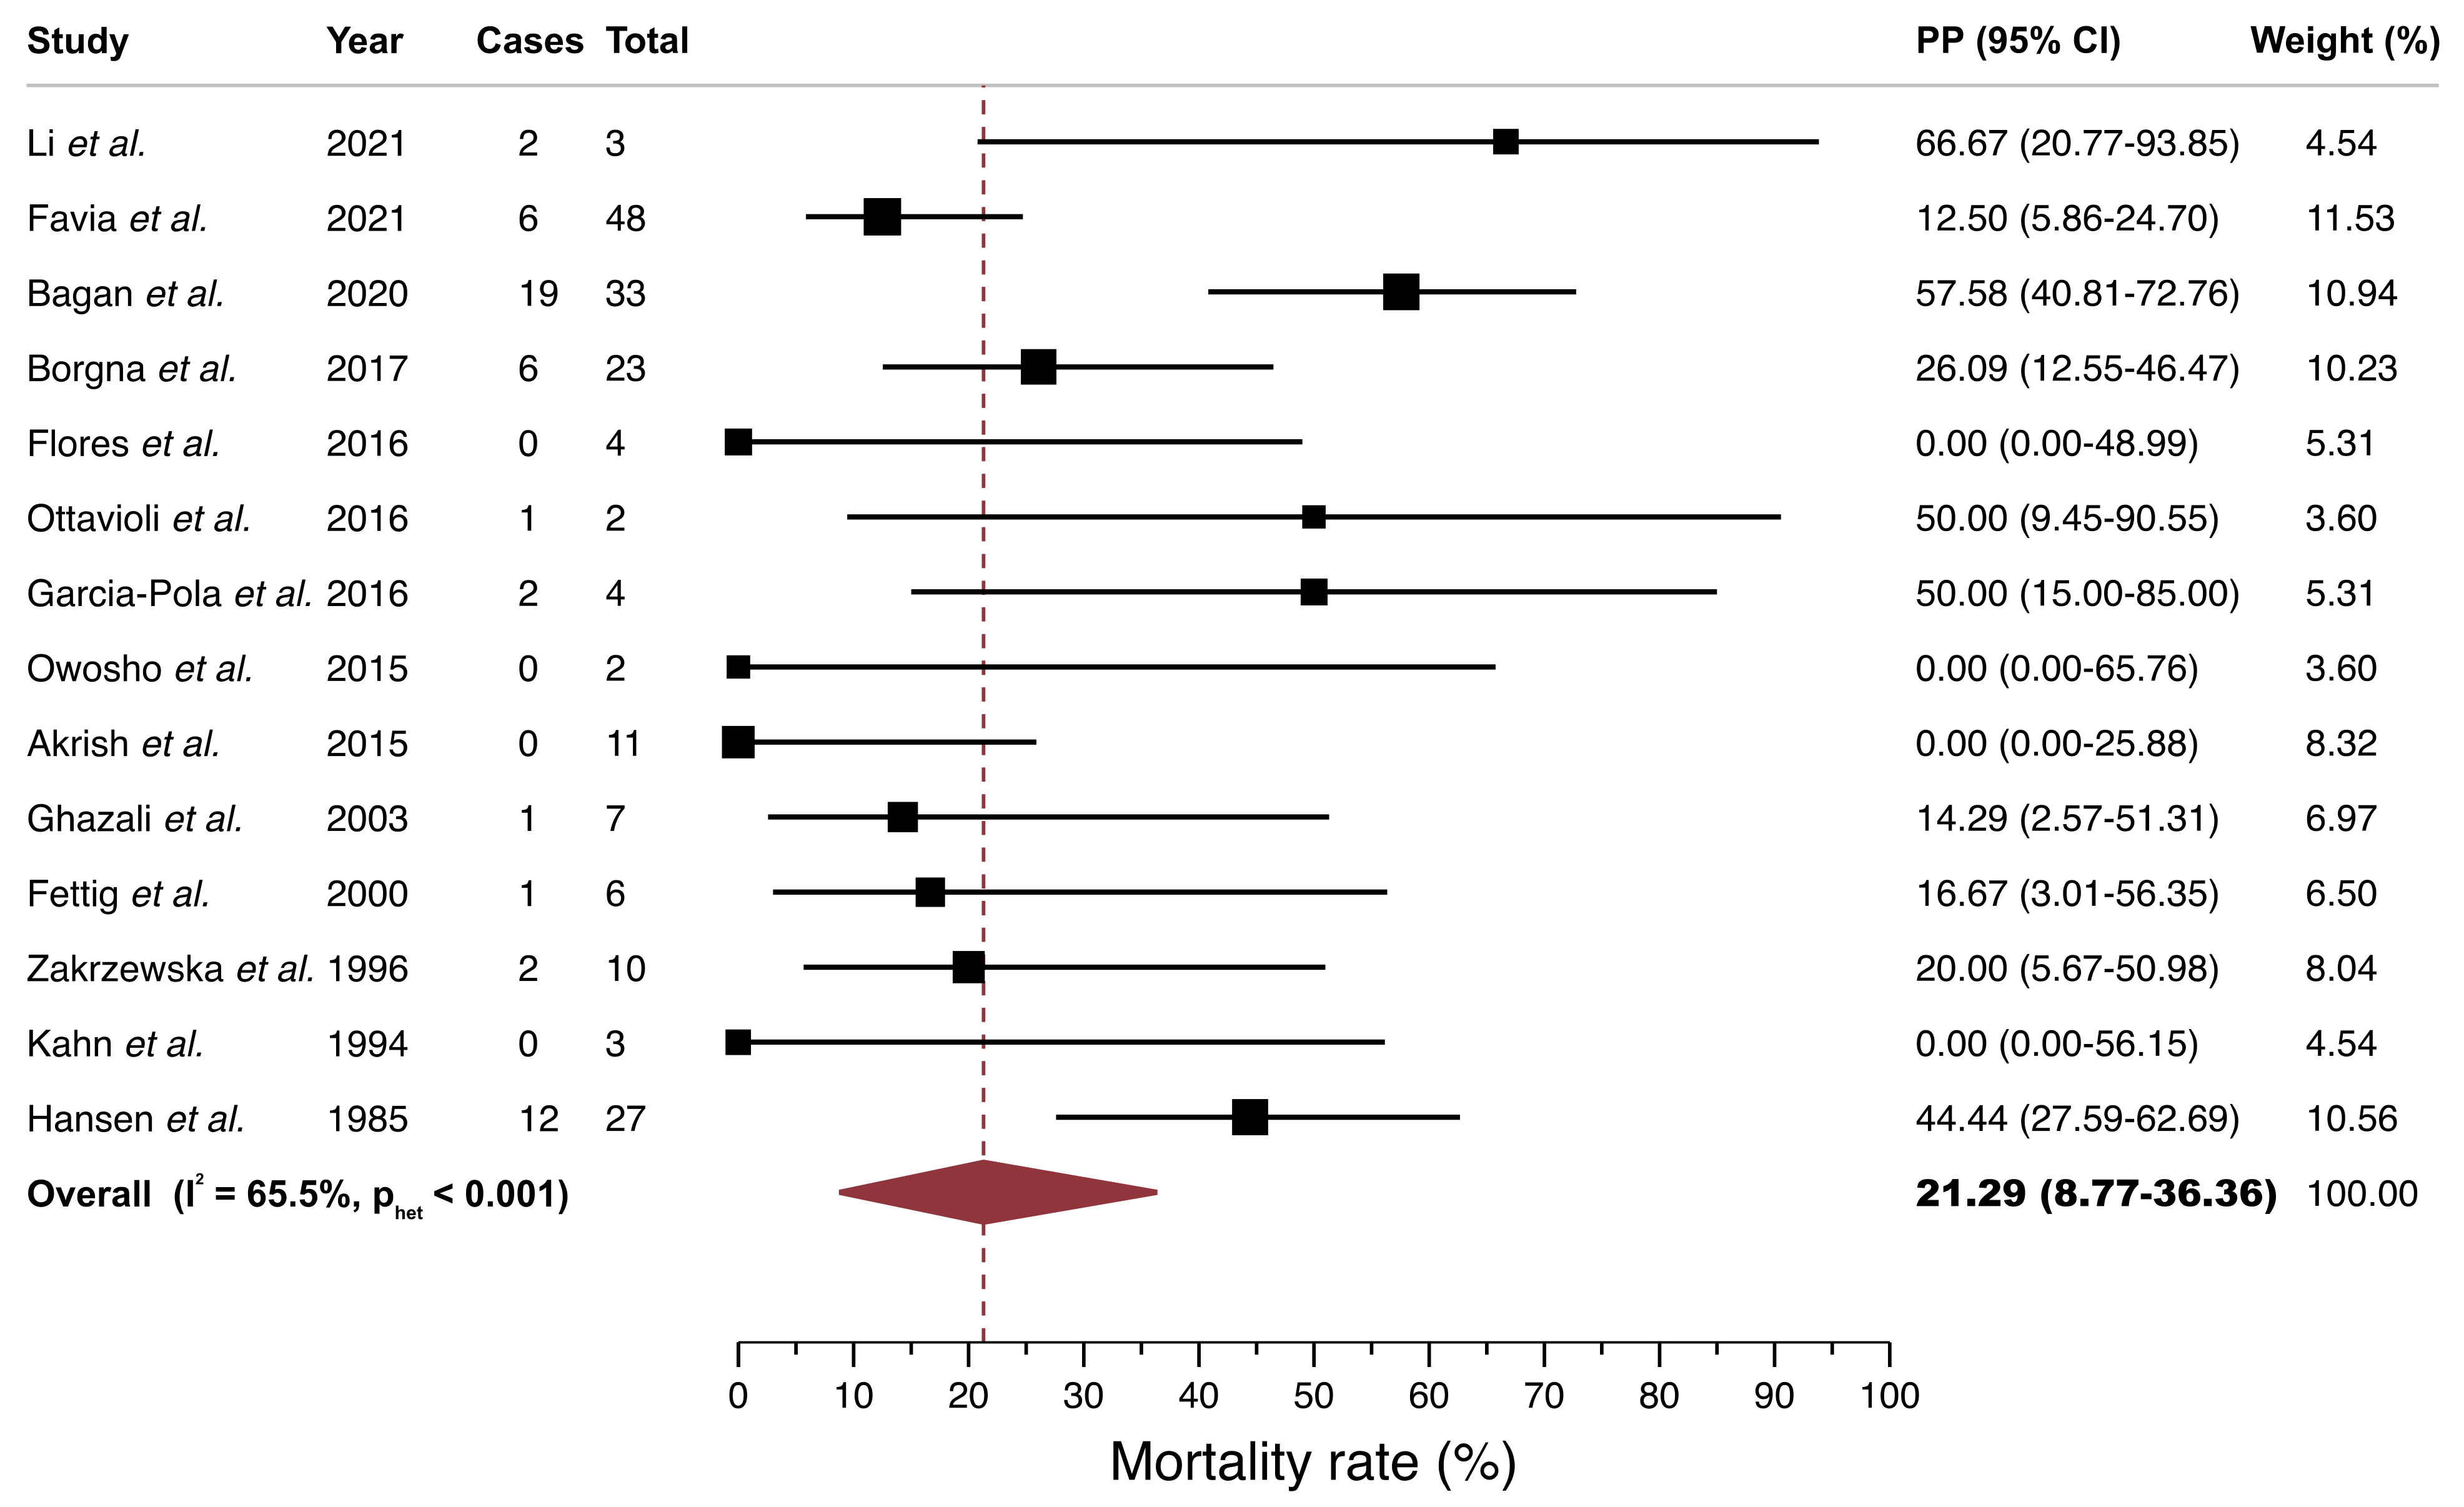
| Mortality of patients with PVL-OC b | 14 | 183 | REM | D-L | PP = 21.29% (8.77–36.36) | — | <0.001 | 65.49 | Manuscript, Figure 3 | ||
| Subgroup analysis by geographical region c | 0.06 | Figure S1, p. 6 | |||||||||
| Europe | 6 | 120 | REM | D-L | PP = 30.46% (10.90–53.57) | — | <0.001 | 75.44 | |||
| North America | 5 | 41 | REM | D-L | PP = 27.40% (6.57–53.27) | — | 0.22 | 30.97 | |||
| Asia | 2 | 18 | REM | D-L | PP = 2.78% (0.00–18.97) | — | — | — | |||
| South America | 1 | 4 | — | — | PP = 0.00% (0.00–48.99) | — | — | — | |||
| Univariable meta-regression e | |||||||||||
| Follow up (months, mean) | 14 | 183 | random-effects meta-regression | Coef = 0.003 (−0.005 to 0.011) | 0.44 ± 0.005 f | hetexplained = 12.34% g | Figure S2, p. 7 | ||||
| Multiple tumor development (tumors per patient, ratio) | 12 | 150 | random-effects meta-regression | Coef = −0.04 (−0.237 to 0.157) | 0.74 ± 0.004 f | hetexplained = −35.94% g | Figure S3, p. 8 | ||||
| Verrucous carcinomas (proportion of tumors, %) | 12 | 150 | random-effects meta-regression | Coef = −0.009 (−0.019 to 0.001) | 0.05 ± 0.002 f | hetexplained = 100%g | Figure S4, p. 9 | ||||
| Oral squamous cell carcinomas (proportion of tumors, %) | 12 | 150 | random-effects meta-regression | Coef = 0.001 (−0.007 to 0.009) | 0.74 ± 0.004 f | hetexplained = −52.34% g | Figure S5, p. 10 | ||||
| Prognostic value of PVL-OC (vs canonical OC) d | |||||||||||
| Overall survival | 1 | 60 | — | — | HR = 0.29 (0.10–0.89) | 0.03 | — | — | — | ||
| CLINICO-PATHOLOGICAL PARAMETERS | |||||||||||
| Verrucous carcinomas b (VC PVL-OC, %) | 20 | 255 | REM | D-L | PP = 33.66% (17.58–51.43) | — | <0.001 | 81.72 | Figure S6, p. 11 | ||
| Squamous cell carcinomas b (OSCC PVL-OC, %) | 20 | 255 | REM | D-L | PP = 72.21% (52.95–88.64) | — | <0.001 | 85.26 | Figure S7, p. 12 | ||
| Differentiation grade b (Well-differentiated SCC PVL-OC, %) | 8 | 49 | REM | D-L | PP = 78.41% (37.24–100.0) | — | <0.001 | 81.55 | Figure S8, p. 13 | ||
| T status b (T1/2 PVL-OC, %) | 2 | 13 | REM | D-L | PP = 99.93% (81.37–100.0) | — | — | — | Figure S9, p. 14 | ||
| N status b (Lymph node(+) PVL-OC, %) | 3 | 19 | REM | D-L | PP = 0.60% (0.00–15.86) | — | 0.40 | 0.00 | Figure S10, p. 15 | ||
| M status b (Distance Metastasis(+) PVL-OC, %) | 2 | 13 | REM | D-L | PP = 0.07% (0.00–18.63) | — | — | — | Figure S11, p. 16 | ||
| Clinical stage b (Early stage (I/II) PVL-OC, %) | 3 | 46 | REM | D-L | PP = 89.88% (59.21–100.0) | — | 0.07 | 63.03 | Figure S12, p. 17 | ||
Publisher’s Note: MDPI stays neutral with regard to jurisdictional claims in published maps and institutional affiliations. |
© 2021 by the authors. Licensee MDPI, Basel, Switzerland. This article is an open access article distributed under the terms and conditions of the Creative Commons Attribution (CC BY) license (https://creativecommons.org/licenses/by/4.0/).
Share and Cite
González-Moles, M.Á.; Warnakulasuriya, S.; Ramos-García, P. Prognosis Parameters of Oral Carcinomas Developed in Proliferative Verrucous Leukoplakia: A Systematic Review and Meta-Analysis. Cancers 2021, 13, 4843. https://doi.org/10.3390/cancers13194843
González-Moles MÁ, Warnakulasuriya S, Ramos-García P. Prognosis Parameters of Oral Carcinomas Developed in Proliferative Verrucous Leukoplakia: A Systematic Review and Meta-Analysis. Cancers. 2021; 13(19):4843. https://doi.org/10.3390/cancers13194843
Chicago/Turabian StyleGonzález-Moles, Miguel Ángel, Saman Warnakulasuriya, and Pablo Ramos-García. 2021. "Prognosis Parameters of Oral Carcinomas Developed in Proliferative Verrucous Leukoplakia: A Systematic Review and Meta-Analysis" Cancers 13, no. 19: 4843. https://doi.org/10.3390/cancers13194843