
Prospective Evaluation over 15 Years of Six Breast Cancer Risk Models

 , , , ,
Abstract
:Simple Summary
Abstract
1. Introduction
2. Materials and Methods
2.1. Study Design and Participants
2.2. Risk Assessment
2.3. Outcome Assessment
2.4. Statistical Analysis
3. Results
4. Discussion
5. Conclusions
Supplementary Materials
Author Contributions
Funding
Institutional Review Board Statement
Informed Consent Statement
Data Availability Statement
Acknowledgments
Conflicts of Interest
References
- Cancer Today, GLOBOCAN 2018. Global Cancer Observatory. Available online: http://gco.iarc.fr/ (accessed on 28 October 2019).
- Fitzmaurice, C.; Abate, D.; Abbasi, N.; Abbastabar, H.; Abd-Allah, F.; Abdel-Rahman, O.; Abdelalim, A.; Abdoli, A.; Abdollahpour, I.; Abdulle, A.S.M.; et al. Global, Regional, and National Cancer Incidence, Mortality, Years of Life Lost, Years Lived With Disability, and Disability-Adjusted Life-Years for 29 Cancer Groups, 1990 to 2017. JAMA Oncol. 2019, 5, 1749–1768. [Google Scholar] [PubMed] [Green Version]
- Cintolo-Gonzalez, J.A.; Braun, D.; Blackford, A.L.; Mazzola, E.; Acar, A.; Plichta, J.K.; Griffin, M.; Hughes, K.S. Breast cancer risk models: A comprehensive overview of existing models, validation, and clinical applications. Breast Cancer Res. Treat. 2017, 164, 263–284. [Google Scholar] [CrossRef] [PubMed]
- Shieh, Y.; Eklund, M.; Madlensky, L.; Sawyer, S.D.; Thompson, C.K.; Stover Fiscalini, A.; Ziv, E.; Van’t Veer, L.J.; Esserman, L.J.; Tice, J.A. Breast Cancer Screening in the Precision Medicine Era: Risk-Based Screening in a Population-Based Trial. J. Natl. Cancer Inst. 2017, 109, 1–8. [Google Scholar] [CrossRef] [PubMed] [Green Version]
- Li, S.X.; Milne, R.L.; Nguyen-Dumont, T.; Wang, X.; English, D.R.; Giles, G.G.; Southey, M.C.; Antoniou, A.C.; Lee, A.; Li, S.; et al. Prospective Evaluation of the Addition of Polygenic Risk Scores to Breast Cancer Risk Models. JNCI Cancer Spectr. 2021, 5, 1–8. [Google Scholar] [CrossRef] [PubMed]
- Gail, M.H.; Brinton, L.A.; Byar, D.P.; Corle, D.K.; Green, S.B.; Schairer, C.; Mulvihill, J.J. Projecting individualized probabilities of developing breast cancer for white females who are being examined annually. J. Natl. Cancer Inst. 1989, 81, 1879–1886. [Google Scholar] [CrossRef] [PubMed]
- Hurson, A.N.; Pal Choudhury, P.; Gao, C.; Hüsing, A.; Eriksson, M.; Shi, M.; Jones, M.E.; Evans, D.G.R.; Milne, R.L.; Gaudet, M.M.; et al. Prospective evaluation of a breast-cancer risk model integrating classical risk factors and polygenic risk in 15 cohorts from six countries. Int. J. Epidemiol. 2021, dyab036. [Google Scholar] [CrossRef] [PubMed]
- Guan, Z.; Huang, T.; McCarthy, A.M.; Hughes, K.S.; Semine, A.; Uno, H.; Trippa, L.; Parmigiani, G.; Braun, D. Combining Breast Cancer Risk Prediction Models. arXiv 2020, arXiv:2008.01019. [Google Scholar]
- Terry, M.B.; Liao, Y.; Whittemore, A.S.; Leoce, N.; Buchsbaum, R.; Zeinomar, N.; Dite, G.S.; Chung, W.K.; Knight, J.A.; Southey, M.C.; et al. 10-Year Performance of Four Models of Breast Cancer Risk: A Validation Study. Lancet Oncol. 2019, 20, 504–517. [Google Scholar] [CrossRef]
- Milne, R.L.; Fletcher, A.S.; MacInnis, R.J.; Hodge, A.M.; Hopkins, A.H.; Bassett, J.K.; Bruinsma, F.J.; Lynch, B.M.; Dugué, P.A.; Jayasekara, H.; et al. Cohort Profile: The Melbourne Collaborative Cohort Study (Health 2020). Int. J. Epidemiol. 2017, 46, 1757–1757i. [Google Scholar] [CrossRef] [PubMed]
- Carver, T.; Hartley, S.; Lee, A.; Cunningham, A.P.; Archer, S.; de Villiers, C.B.; Roberts, J.; Ruston, R.; Walter, F.M.; Tischkowitz, M.; et al. Canrisk tool—A web interface for the prediction of breast and ovarian cancer risk and the likelihood of carrying genetic pathogenic variants. Cancer Epidemiol. Biomarkers Prev. 2021, 30, 469–473. [Google Scholar] [CrossRef] [PubMed]
- Tyrer, J.; Duffy, S.W.; Cuzick, J. A breast cancer prediction model incorporating familial and personal risk factors. Stat. Med. 2004, 23, 1111–1130. [Google Scholar] [CrossRef] [PubMed] [Green Version]
- Newson, R.B. Comparing the predictive powers of survival models using Harrell’s C or Somers’ D. Stata J. 2010, 10, 339–358. [Google Scholar] [CrossRef] [Green Version]
- Antoniou, A.C.; Pharoah, P.P.D.; Smith, P.; Easton, D.F. The BOADICEA model of genetic susceptibility to breast and ovarian cancer. Br. J. Cancer 2004, 91, 1580–1590. [Google Scholar] [CrossRef] [PubMed] [Green Version]
- McCarthy, A.M.; Guan, Z.; Welch, M.; Griffin, M.E.; Sippo, D.A.; Deng, Z.; Coopey, S.; Acar, A.; Semine, A.; Parmigiani, G.; et al. Performance of breast cancer risk assessment models in a large mammography cohort. J. Natl. Cancer Inst. 2020, 112, 489–497. [Google Scholar] [CrossRef] [PubMed]
- Louro, J.; Posso, M.; Hilton Boon, M.; Román, M.; Domingo, L.; Castells, X.; Sala, M. A systematic review and quality assessment of individualised breast cancer risk prediction models. Br. J. Cancer 2019, 121, 76–85. [Google Scholar] [CrossRef] [PubMed] [Green Version]
- MacInnis, R.J.; Knight, J.A.; Chung, W.K.; Milne, R.L.; Whittemore, A.S.; Buchsbaum, R.; Liao, Y.; Zeinomar, N.; Dite, G.S.; Southey, M.C.; et al. Comparing 5-Year and Lifetime Risks of Breast Cancer using the Prospective Family Study Cohort. JNCI J. Natl. Cancer Inst. 2021, 113, 785–791. [Google Scholar] [CrossRef] [PubMed]
- Pal Choudhury, P.; Brook, M.N.; Hurson, A.N.; Lee, A.; Mulder, C.V.; Coulson, P.; Schoemaker, M.J.; Jones, M.E.; Swerdlow, A.J.; Chatterjee, N.; et al. Comparative validation of the BOADICEA and Tyrer-Cuzick breast cancer risk models incorporating classical risk factors and polygenic risk in a population-based prospective cohort of women of European ancestry. Breast Cancer Res. 2021, 23, 1–5. [Google Scholar] [CrossRef] [PubMed]
- Nguyen, T.L.; Schmidt, D.F.; Makalic, E.; Maskarinec, G.; Li, S.; Dite, G.S.; Aung, Y.K.; Evans, C.F.; Trinh, H.N.; Baglietto, L.; et al. Novel mammogram-based measures improve breast cancer risk prediction beyond an established mammographic density measure. Int. J. Cancer 2021, 148, 2193–2202. [Google Scholar] [CrossRef] [PubMed]


| Characteristics | Mean | SD | |
|---|---|---|---|
| Age (years) | 58.5 | 4.3 | |
| Height (cm) | 162.0 | 6.6 | |
| Weight (kg) | 71.3 | 13.9 | |
| BMI (kg/m2) | 27.2 | 5.3 | |
| Alcohol intake (ethanol g/d) | 8.9 | 11.9 | |
| Menarche age (years) | 12.9 | 1.6 | |
| Number of live births | 2.1 | 1.4 | |
| Age at first birth (years) | 25.4 | 4.8 | |
| Age of menopause (years) 1 | 49.5 | 4.8 | |
| Incidence of breast cancer per 1000 person-years 2 | 3.35 (95% CI: 3.01, 3.72) | ||
| Characteristics | Number of women | % | |
| Oral Contraceptive Use | |||
| Never | 1377 | 18.1 | |
| Former | 6187 | 81.3 | |
| Current | 37 | 0.5 | |
| Missing | 7 | 0.1 | |
| Menopausal status 3 | |||
| Premenopausal | 37 | 0.5 | |
| Postmenopausal | 5962 | 78.4 | |
| Missing | 1 | 0.0 | |
| Unable to determine | 1608 | 21.1 | |
| Menopausal hormone therapy use 4 | |||
| Never | 3848 | 50.6 | |
| Former | 1643 | 21.6 | |
| Current Oestrogen | 121 | 1.6 | |
| Current Oestrogen and Progesterone | 752 | 9.9 | |
| Current hormone replacement therapy type missing | 477 | 6.3 | |
| Missing 5 | 767 | 10.1 | |
| Family history of breast cancer 6 | |||
| No | 5888 | 77.4 | |
| Yes | 1720 | 22.6 | |
| Risk Model | Number of Women | Expected Number of Cases | Observed Number of Cases | Expected/Observed Ratio (95%CI) | Concordance Statistic (95% CI) |
|---|---|---|---|---|---|
| Overall | 7608 | ||||
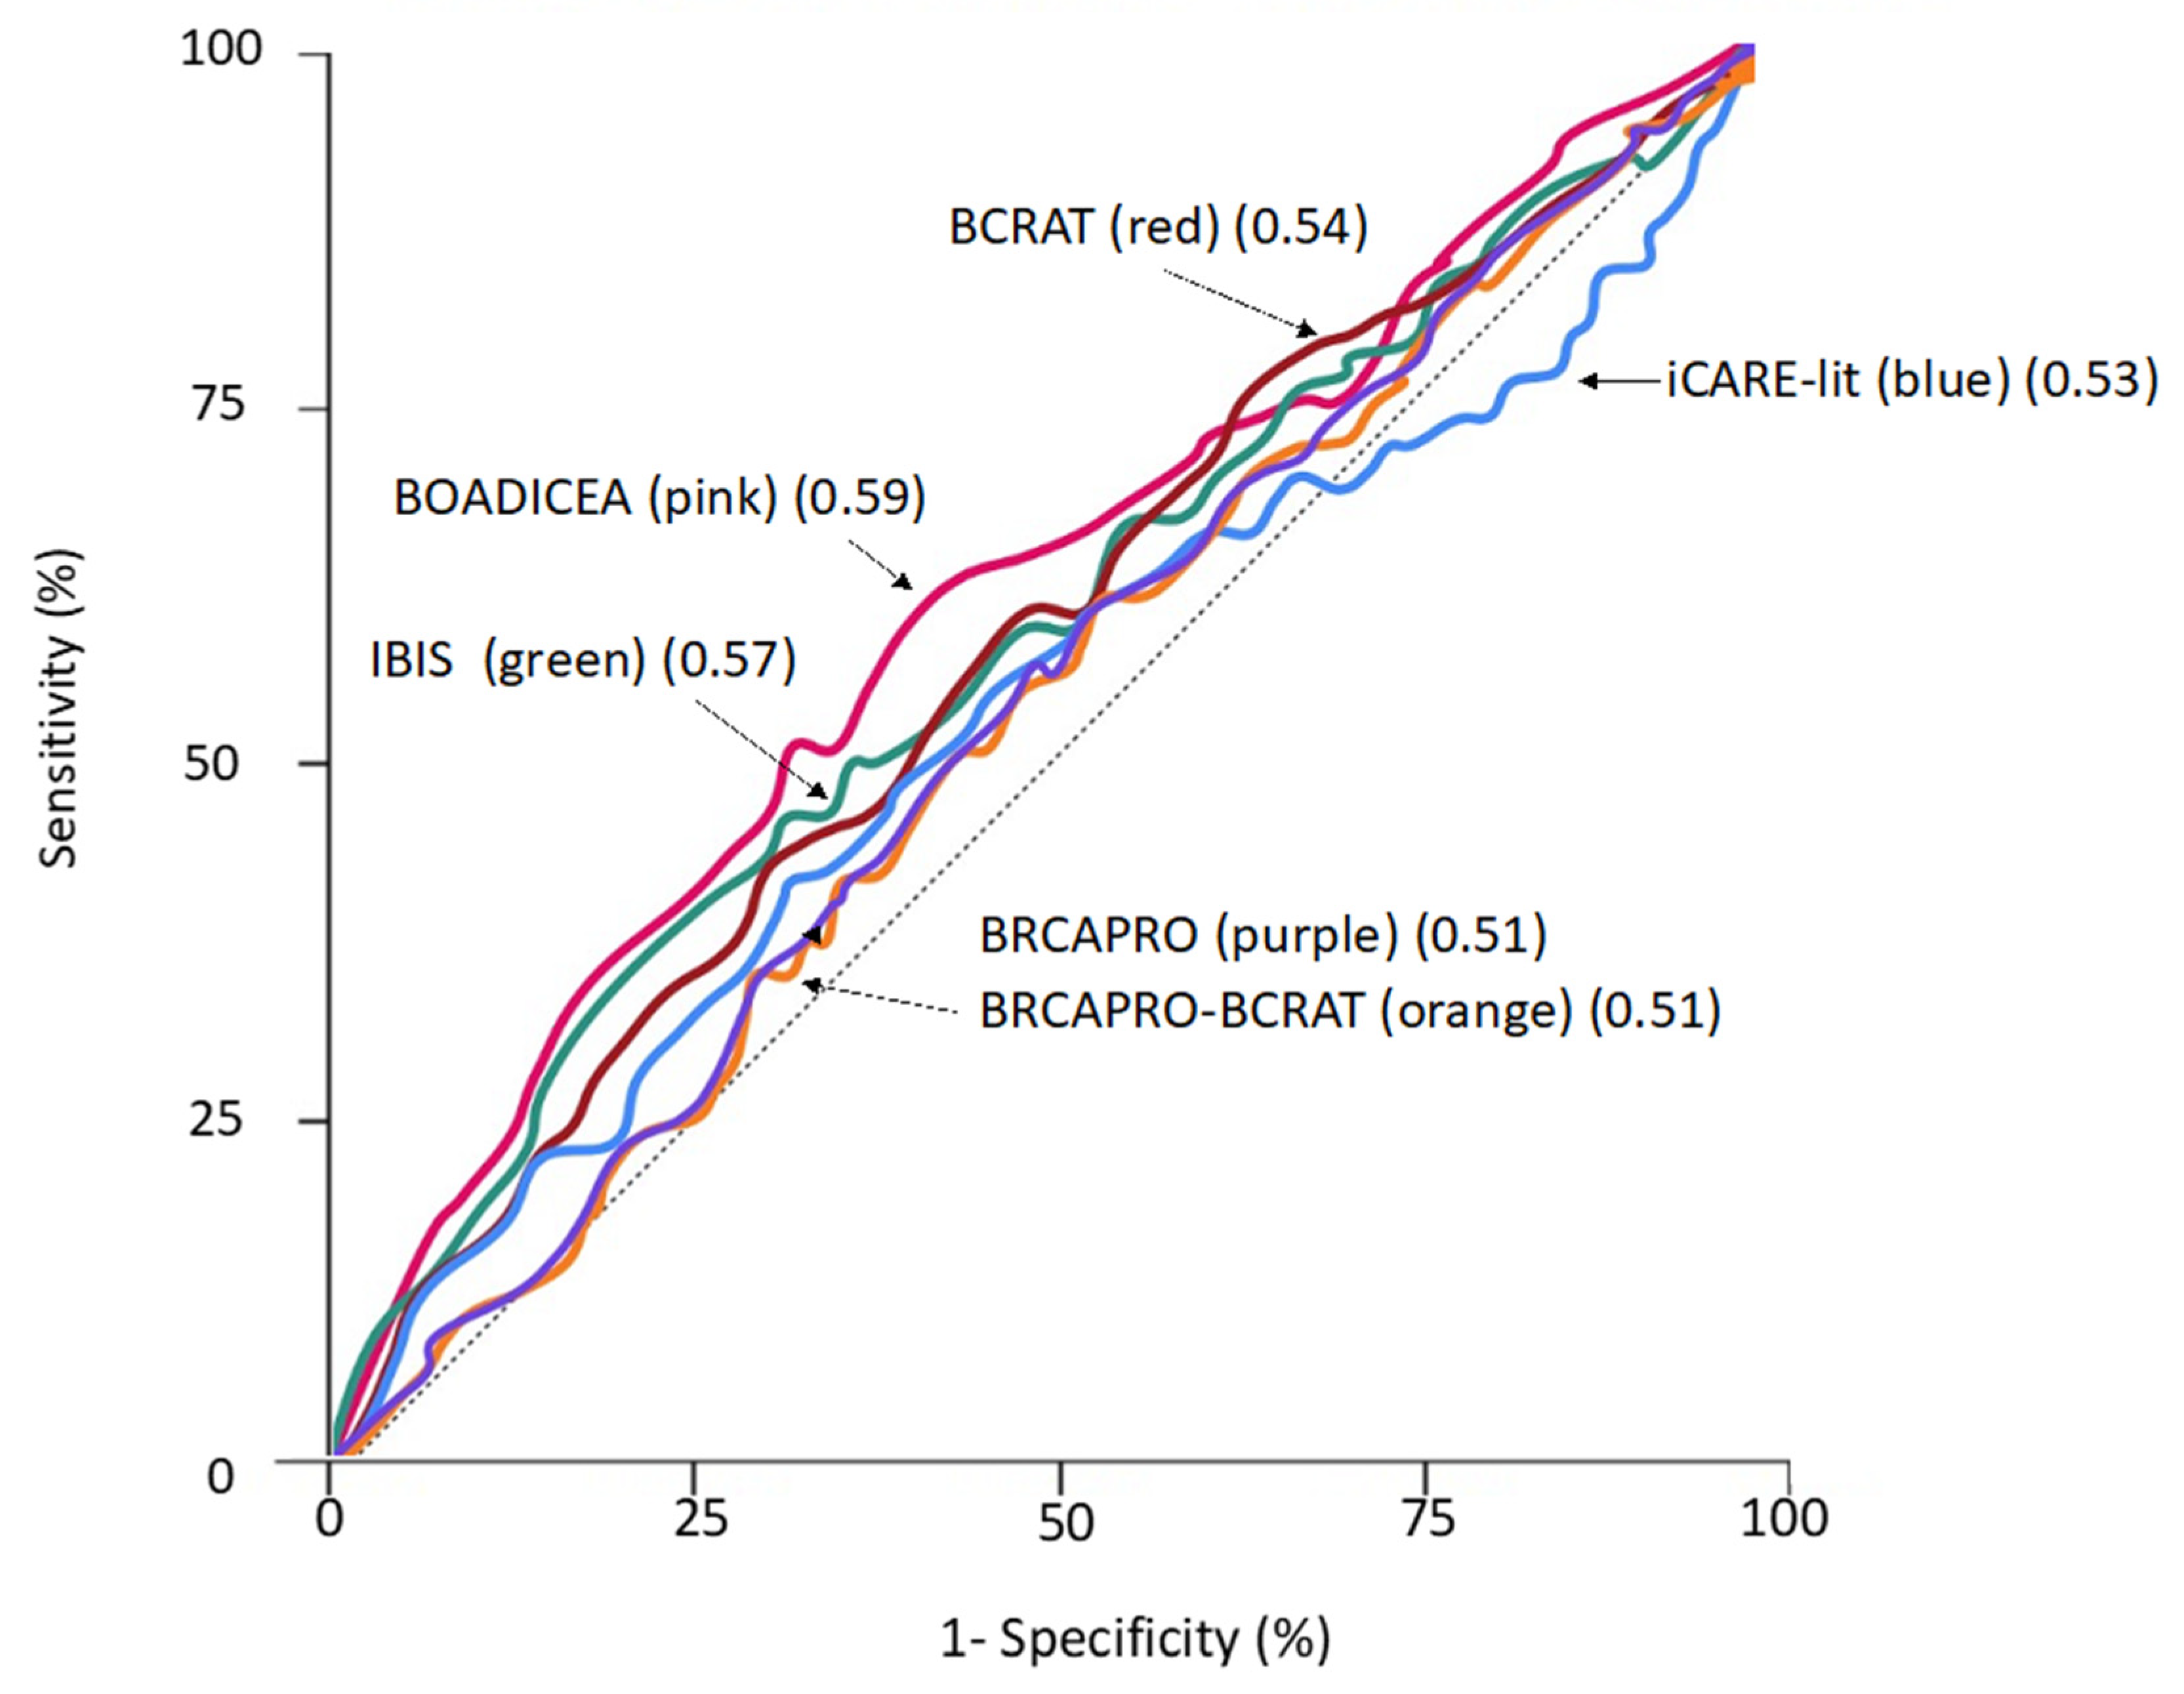
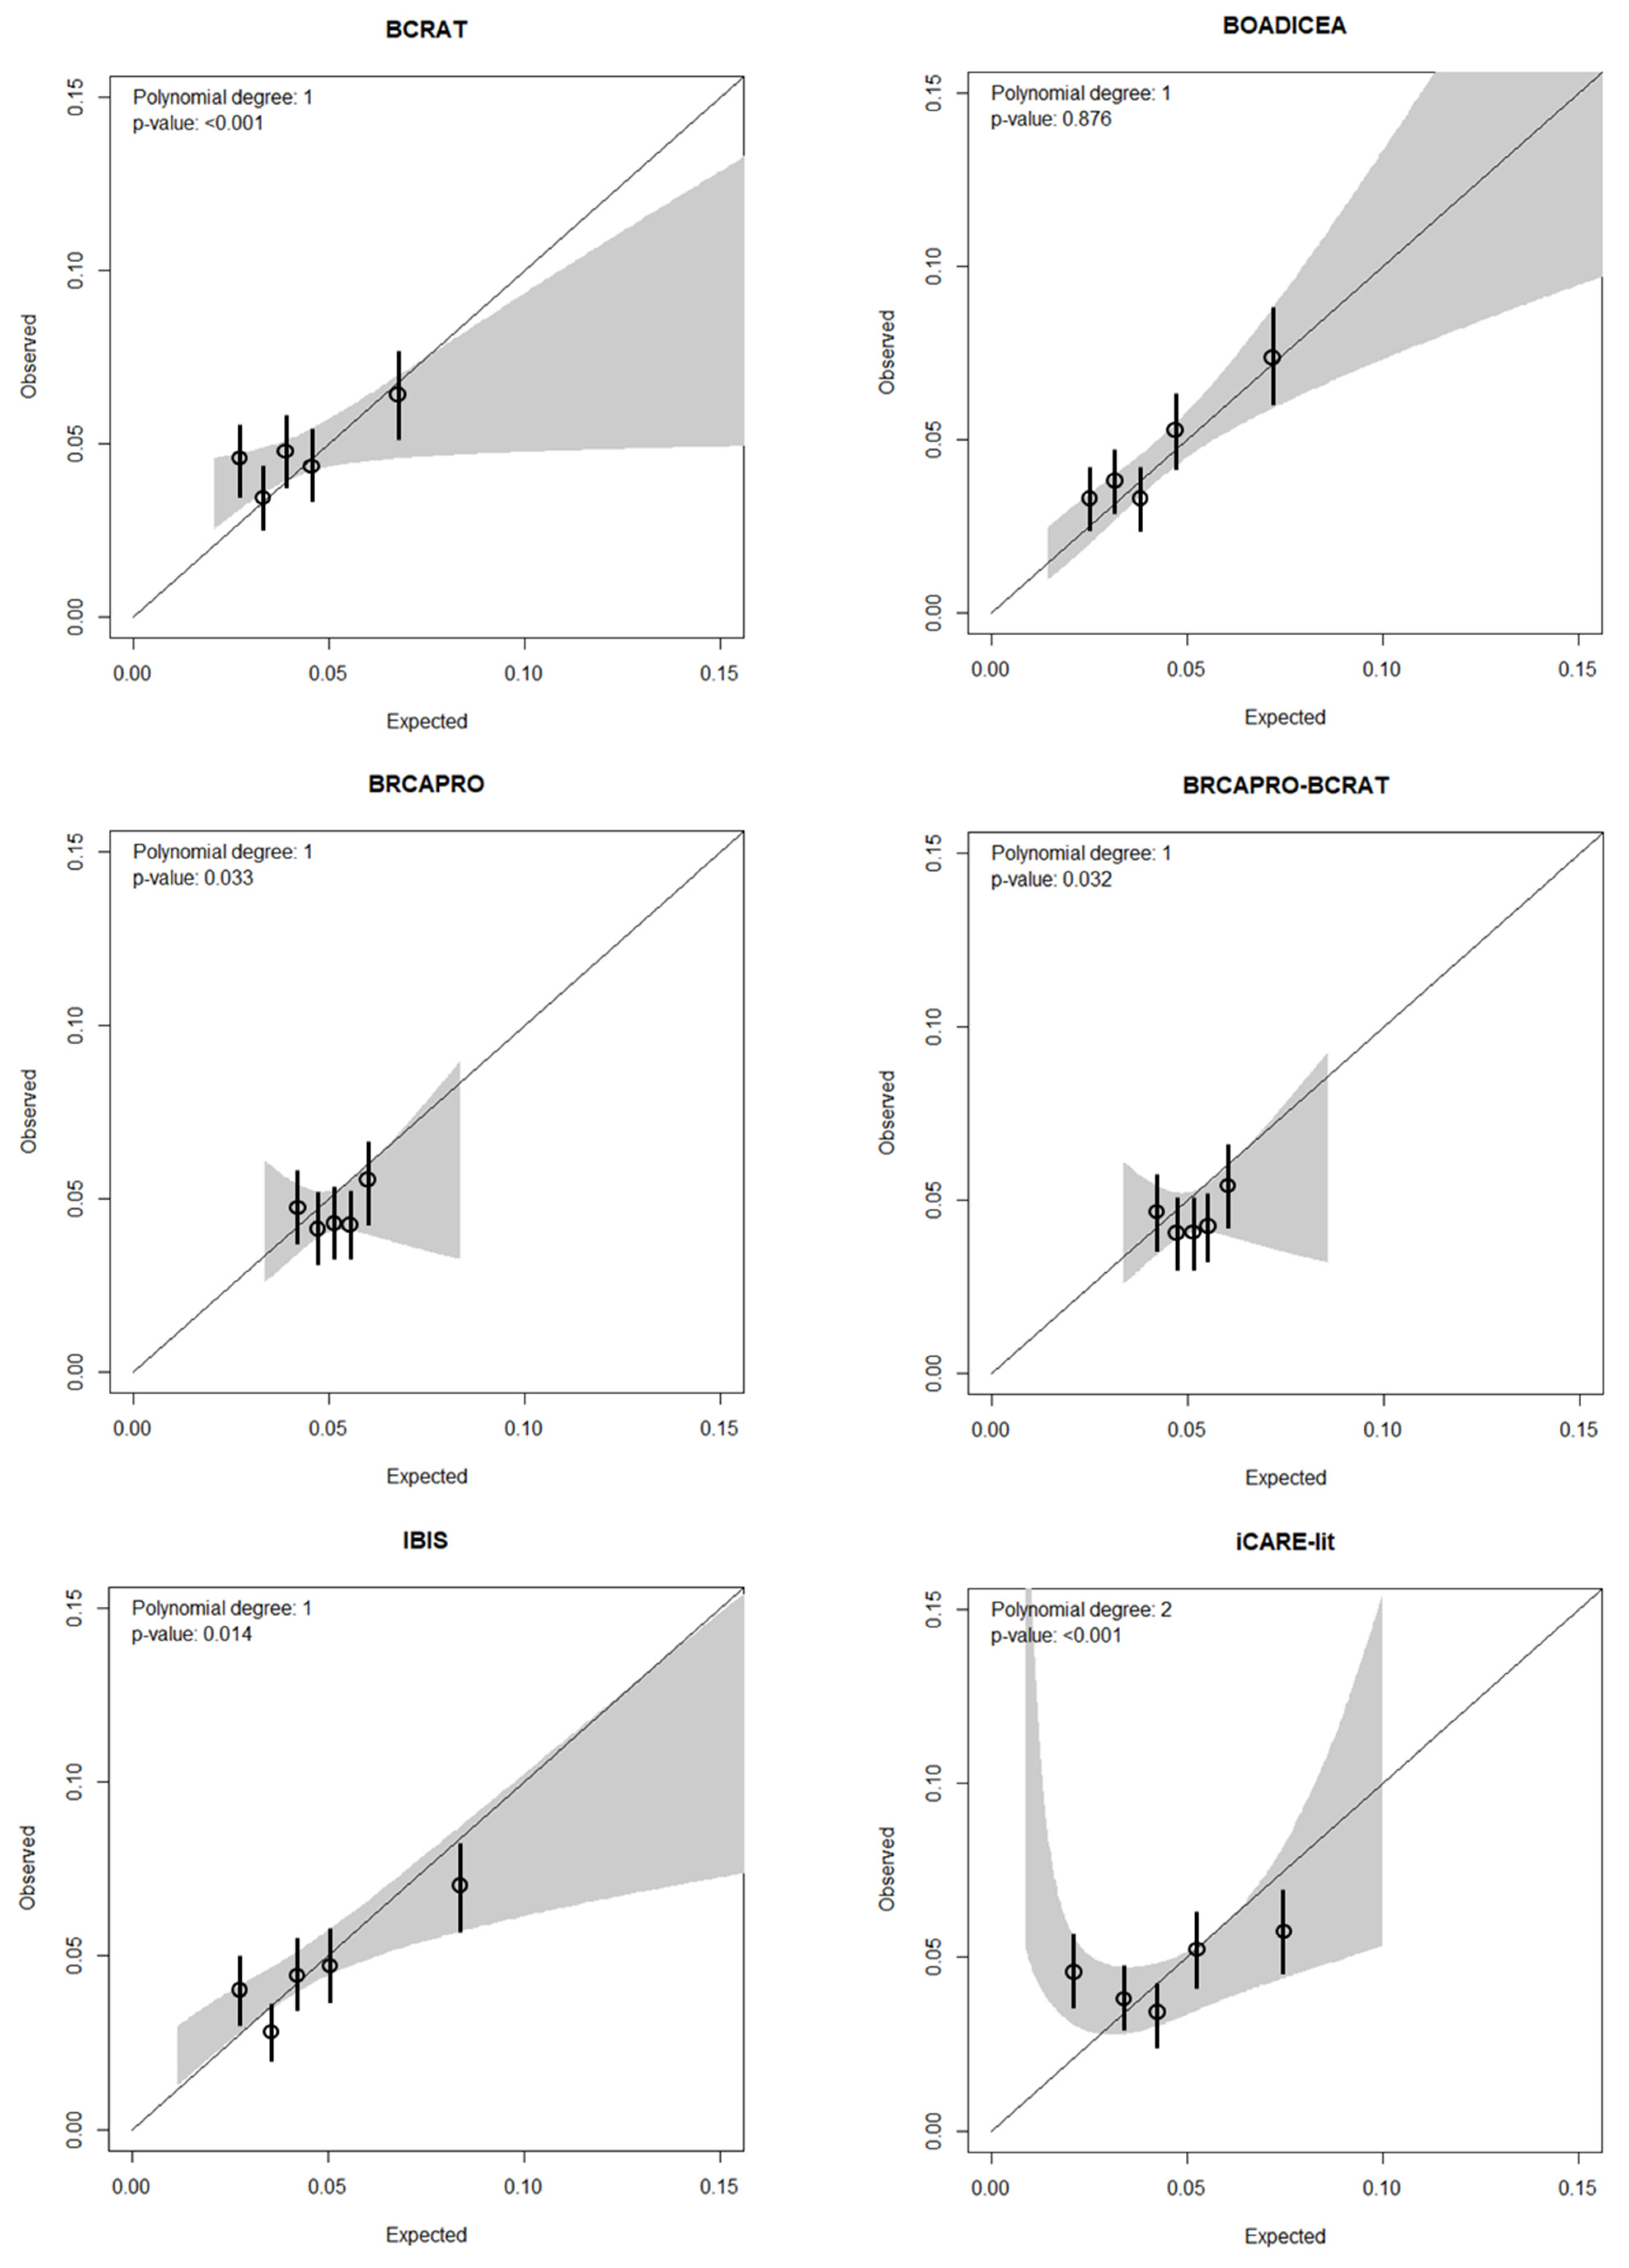
| IBIS | 341.5 | 351 | 0.97 (0.88,1.08) | 0.57 (0.54,0.61) | |
| BOADICEA | 342.4 | 351 | 0.98 (0.88,1.08) | 0.59 (0.56,0.62) | |
| BRCAPRO | 389.3 | 351 | 1.11 (1.00,1.23) | 0.51 (0.48,0.54) | |
| BRCAPRO-BCRAT | 389.7 | 351 | 1.11 (1.00,1.23) | 0.51 (0.48,0.54) | |
| BCRAT | 327.9 | 351 | 0.93 (0.84,1.04) | 0.54 (0.51,0.57) | |
| iCARE-lit | 339.5 | 351 | 0.97 (0.87,1.07) | 0.53 (0.50,0.56) | |
| Age 50–54 years | 1912 | ||||
| IBIS | 90.0 | 91 | 0.99 (0.81,1.21) | 0.59 (0.53,0.65) | |
| BOADICEA | 82.9 | 91 | 0.91 (0.74,1.12) | 0.60 (0.54,0.66) | |
| BRCAPRO | 82.7 | 91 | 0.91 (0.74,1.12) | 0.49 (0.43,0.55) | |
| BRCAPRO-BCRAT | 82.8 | 91 | 0.91 (0.74,1.12) | 0.49 (0.43,0.55) | |
| BCRAT | 76.1 | 91 | 0.84 (0.68,1.03) | 0.54 (0.48,0.60) | |
| iCARE-lit | 85.7 | 91 | 0.94 (0.77,1.16) | 0.55 (0.49,0.62) | |
| Age 55–59 years | 2679 | ||||
| IBIS | 122.1 | 116 | 1.05 (0.88,1.26) | 0.56 (0.50,0.61) | |
| BOADICEA | 124.2 | 116 | 1.07 (0.89,1.28) | 0.59 (0.54,0.65) | |
| BRCAPRO | 134.9 | 116 | 1.16 (0.97,1.39) | 0.54 (0.49,0.59) | |
| BRCAPRO-BCRAT | 135.0 | 116 | 1.16 (0.97,1.40) | 0.54 (0.49,0.59) | |
| BCRAT | 114.7 | 116 | 0.99 (0.82,1.19) | 0.58 (0.53,0.63) | |
| iCARE-lit | 120.4 | 116 | 1.04 (0.86,1.24) | 0.51 (0.46,0.57) | |
| Age 60–65 years | 3017 | ||||
| IBIS | 129.4 | 144 | 0.90 (0.76,1.06) | 0.58 (0.53,0.63) | |
| BOADICEA | 135.4 | 144 | 0.94 (0.80,1.11) | 0.59 (0.54,0.64) | |
| BRCAPRO | 171.8 | 144 | 1.19 (1.01,1.40) | 0.51 (0.46,0.56) | |
| BRCAPRO-BCRAT | 171.9 | 144 | 1.19 (1.01,1.41) | 0.49 (0.44,0.54) | |
| BCRAT | 137.2 | 144 | 0.95 (0.81,1.12) | 0.51 (0.46,0.56) | |
| iCARE-lit | 133.5 | 144 | 0.93 (0.79,1.09) | 0.55 (0.50,0.60) | |
| No family history of breast cancer 1 | 5888 | ||||
| IBIS | 217.7 | 241 | 0.90 (0.80,1.02) | 0.54 (0.50,0.58) | |
| BOADICEA | 241.1 | 241 | 1.00 (0.88,1.13) | 0.56 (0.52,0.59) | |
| BRCAPRO | 300.5 | 241 | 1.25 (1.10,1.41) | 0.50 (0.46,0.54) | |
| BRCAPRO-BCRAT | 300.7 | 241 | 1.25 (1.10,1.42) | 0.50 (0.46,0.54) | |
| BCRAT | 229.8 | 241 | 0.95 (0.84,1.08) | 0.53 (0.49,0.56) | |
| iCARE-lit | 255.4 | 241 | 1.06 (0.93,1.20) | 0.52 (0.48,0.56) | |
| Family history of breast cancer 1 | 1720 | ||||
| IBIS | 123.8 | 110 | 1.13 (0.93,1.36) | 0.57 (0.52,0.62) | |
| BOADICEA | 101.4 | 110 | 0.92 (0.76,1.11) | 0.60 (0.55,0.65) | |
| BRCAPRO | 88.8 | 110 | 0.81 (0.67,0.97) | 0.53 (0.47,0.58) | |
| BRCAPRO-BCRAT | 89.0 | 110 | 0.81 (0.67,0.97) | 0.52 (0.47,0.58) | |
| BCRAT | 98.2 | 110 | 0.89 (0.74,1.08) | 0.52 (0.46,0.57) | |
| iCARE-lit | 84.2 | 110 | 0.77 (0.63,0.92) | 0.53 (0.47,0.59) |
| Risk Model | Number of Women | Expected Number of Cases | Observed Number of Cases | Expected/Observed Ratio (95%CI) | Concordance Statistic (95% CI) |
|---|---|---|---|---|---|
| 5-year risk | 7608 | ||||
| IBIS | 121.8 | 124 | 0.98 (0.82,1.17) | 0.57 (0.54,0.61) | |
| BOADICEA | 118.4 | 124 | 0.95 (0.80,1.14) | 0.59 (0.56,0.62) | |
| BRCAPRO | 119.7 | 124 | 0.97 (0.81,1.15) | 0.51 (0.48,0.54) | |
| BRCAPRO-BCRAT | 119.8 | 124 | 0.97 (0.81,1.15) | 0.51 (0.48,0.54) | |
| BCRAT | 111.1 | 124 | 0.90 (0.75,1.07) | 0.54 (0.51,0.57) | |
| iCARE-lit | 181.6 | 124 | 1.46 (1.23,1.75) | 0.59 (0.56,0.62) | |
| 10-year risk | 7608 | ||||
| IBIS | 245.7 | 252 | 0.97 (0.86,1.10) | 0.58 (0.54,0.61) | |
| BOADICEA | 237.6 | 252 | 0.94 (0.83,1.07) | 0.59 (0.56,0.62) | |
| BRCAPRO | 260.9 | 252 | 1.04 (0.92,1.17) | 0.51 (0.48,0.54) | |
| BRCAPRO-BCRAT | 261.1 | 252 | 1.04 (0.92,1.17) | 0.51 (0.48,0.54) | |
| BCRAT | 230.6 | 252 | 0.92 (0.81,1.04) | 0.54 (0.51,0.57) | |
| iCARE-lit | 290.6 | 252 | 1.15 (1.02,1.30) | 0.58 (0.55,0.61) | |
| 15-year risk | 7608 | ||||
| IBIS | 341.5 | 351 | 0.97 (0.88,1.08) | 0.57 (0.54,0.61) | |
| BOADICEA | 342.4 | 351 | 0.98 (0.88,1.08) | 0.59 (0.56,0.62) | |
| BRCAPRO | 389.4 | 351 | 1.11 (1.00,1.23) | 0.51 (0.48,0.54) | |
| BRCAPRO-BCRAT | 389.7 | 351 | 1.11 (1.00,1.23) | 0.51 (0.48,0.54) | |
| BCRAT | 327.9 | 351 | 0.93 (0.84,1.04) | 0.54 (0.51,0.57) | |
| iCARE-lit | 339.5 | 351 | 0.97 (0.87,1.07) | 0.53 (0.50,0.56) |
Publisher’s Note: MDPI stays neutral with regard to jurisdictional claims in published maps and institutional affiliations. |
© 2021 by the authors. Licensee MDPI, Basel, Switzerland. This article is an open access article distributed under the terms and conditions of the Creative Commons Attribution (CC BY) license (https://creativecommons.org/licenses/by/4.0/).
Share and Cite
Li, S.X.; Milne, R.L.; Nguyen-Dumont, T.; English, D.R.; Giles, G.G.; Southey, M.C.; Antoniou, A.C.; Lee, A.; Winship, I.; Hopper, J.L.; et al. Prospective Evaluation over 15 Years of Six Breast Cancer Risk Models. Cancers 2021, 13, 5194. https://doi.org/10.3390/cancers13205194
Li SX, Milne RL, Nguyen-Dumont T, English DR, Giles GG, Southey MC, Antoniou AC, Lee A, Winship I, Hopper JL, et al. Prospective Evaluation over 15 Years of Six Breast Cancer Risk Models. Cancers. 2021; 13(20):5194. https://doi.org/10.3390/cancers13205194
Chicago/Turabian StyleLi, Sherly X., Roger L. Milne, Tú Nguyen-Dumont, Dallas R. English, Graham G. Giles, Melissa C. Southey, Antonis C. Antoniou, Andrew Lee, Ingrid Winship, John L. Hopper, and et al. 2021. "Prospective Evaluation over 15 Years of Six Breast Cancer Risk Models" Cancers 13, no. 20: 5194. https://doi.org/10.3390/cancers13205194