
Raman Imaging and Fluorescence Lifetime Imaging Microscopy for Diagnosis of Cancer State and Metabolic Monitoring

 , and
, and 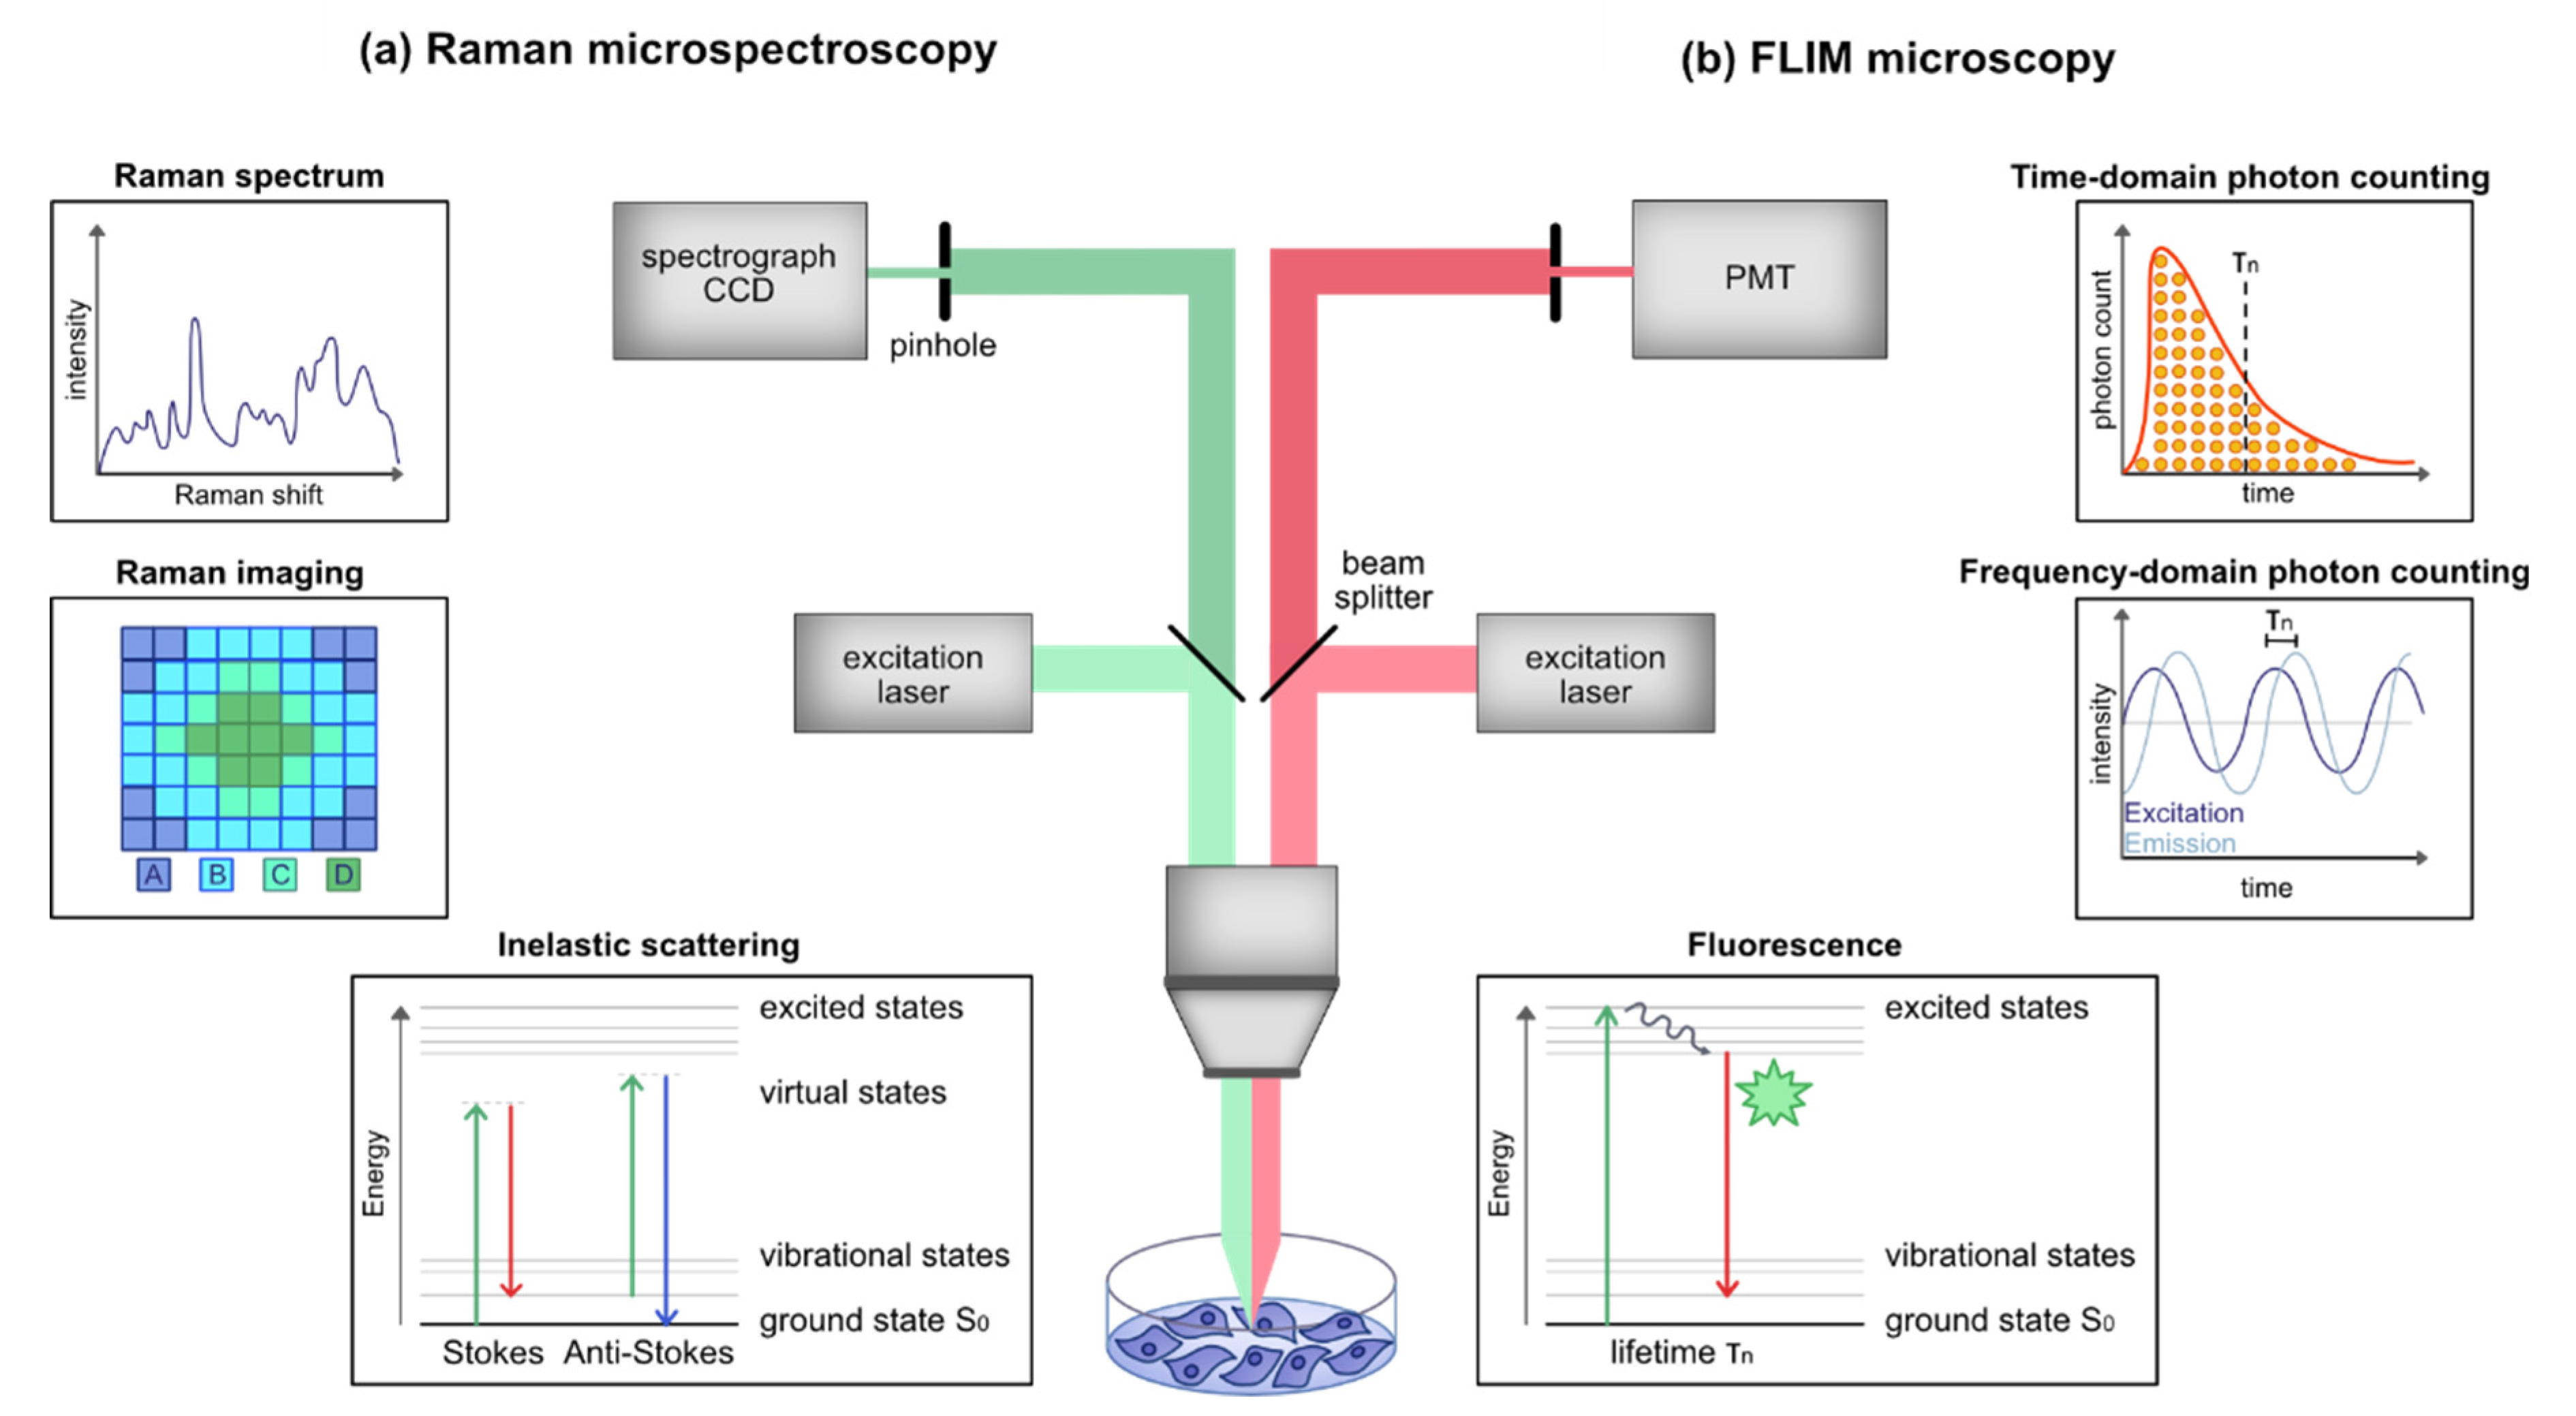
Abstract
:Simple Summary
Abstract
1. Introduction
2. Raman Microspectroscopy and Imaging
2.1. Physical Principle and Background
2.2. Instrumentation
2.3. Modifications
2.3.1. CARS
2.3.2. SERS
3. Fluorescence Lifetime Imaging Microscopy
3.1. Physical Principle and Background
3.2. Instrumentation
3.3. FLIM Readouts
3.3.1. Endogenous FLIM
3.3.2. FLIM-FRET
3.3.3. FLIM Probes
4. Cellular and Tissue Diagnostics
4.1. Identification of Cancer Stages
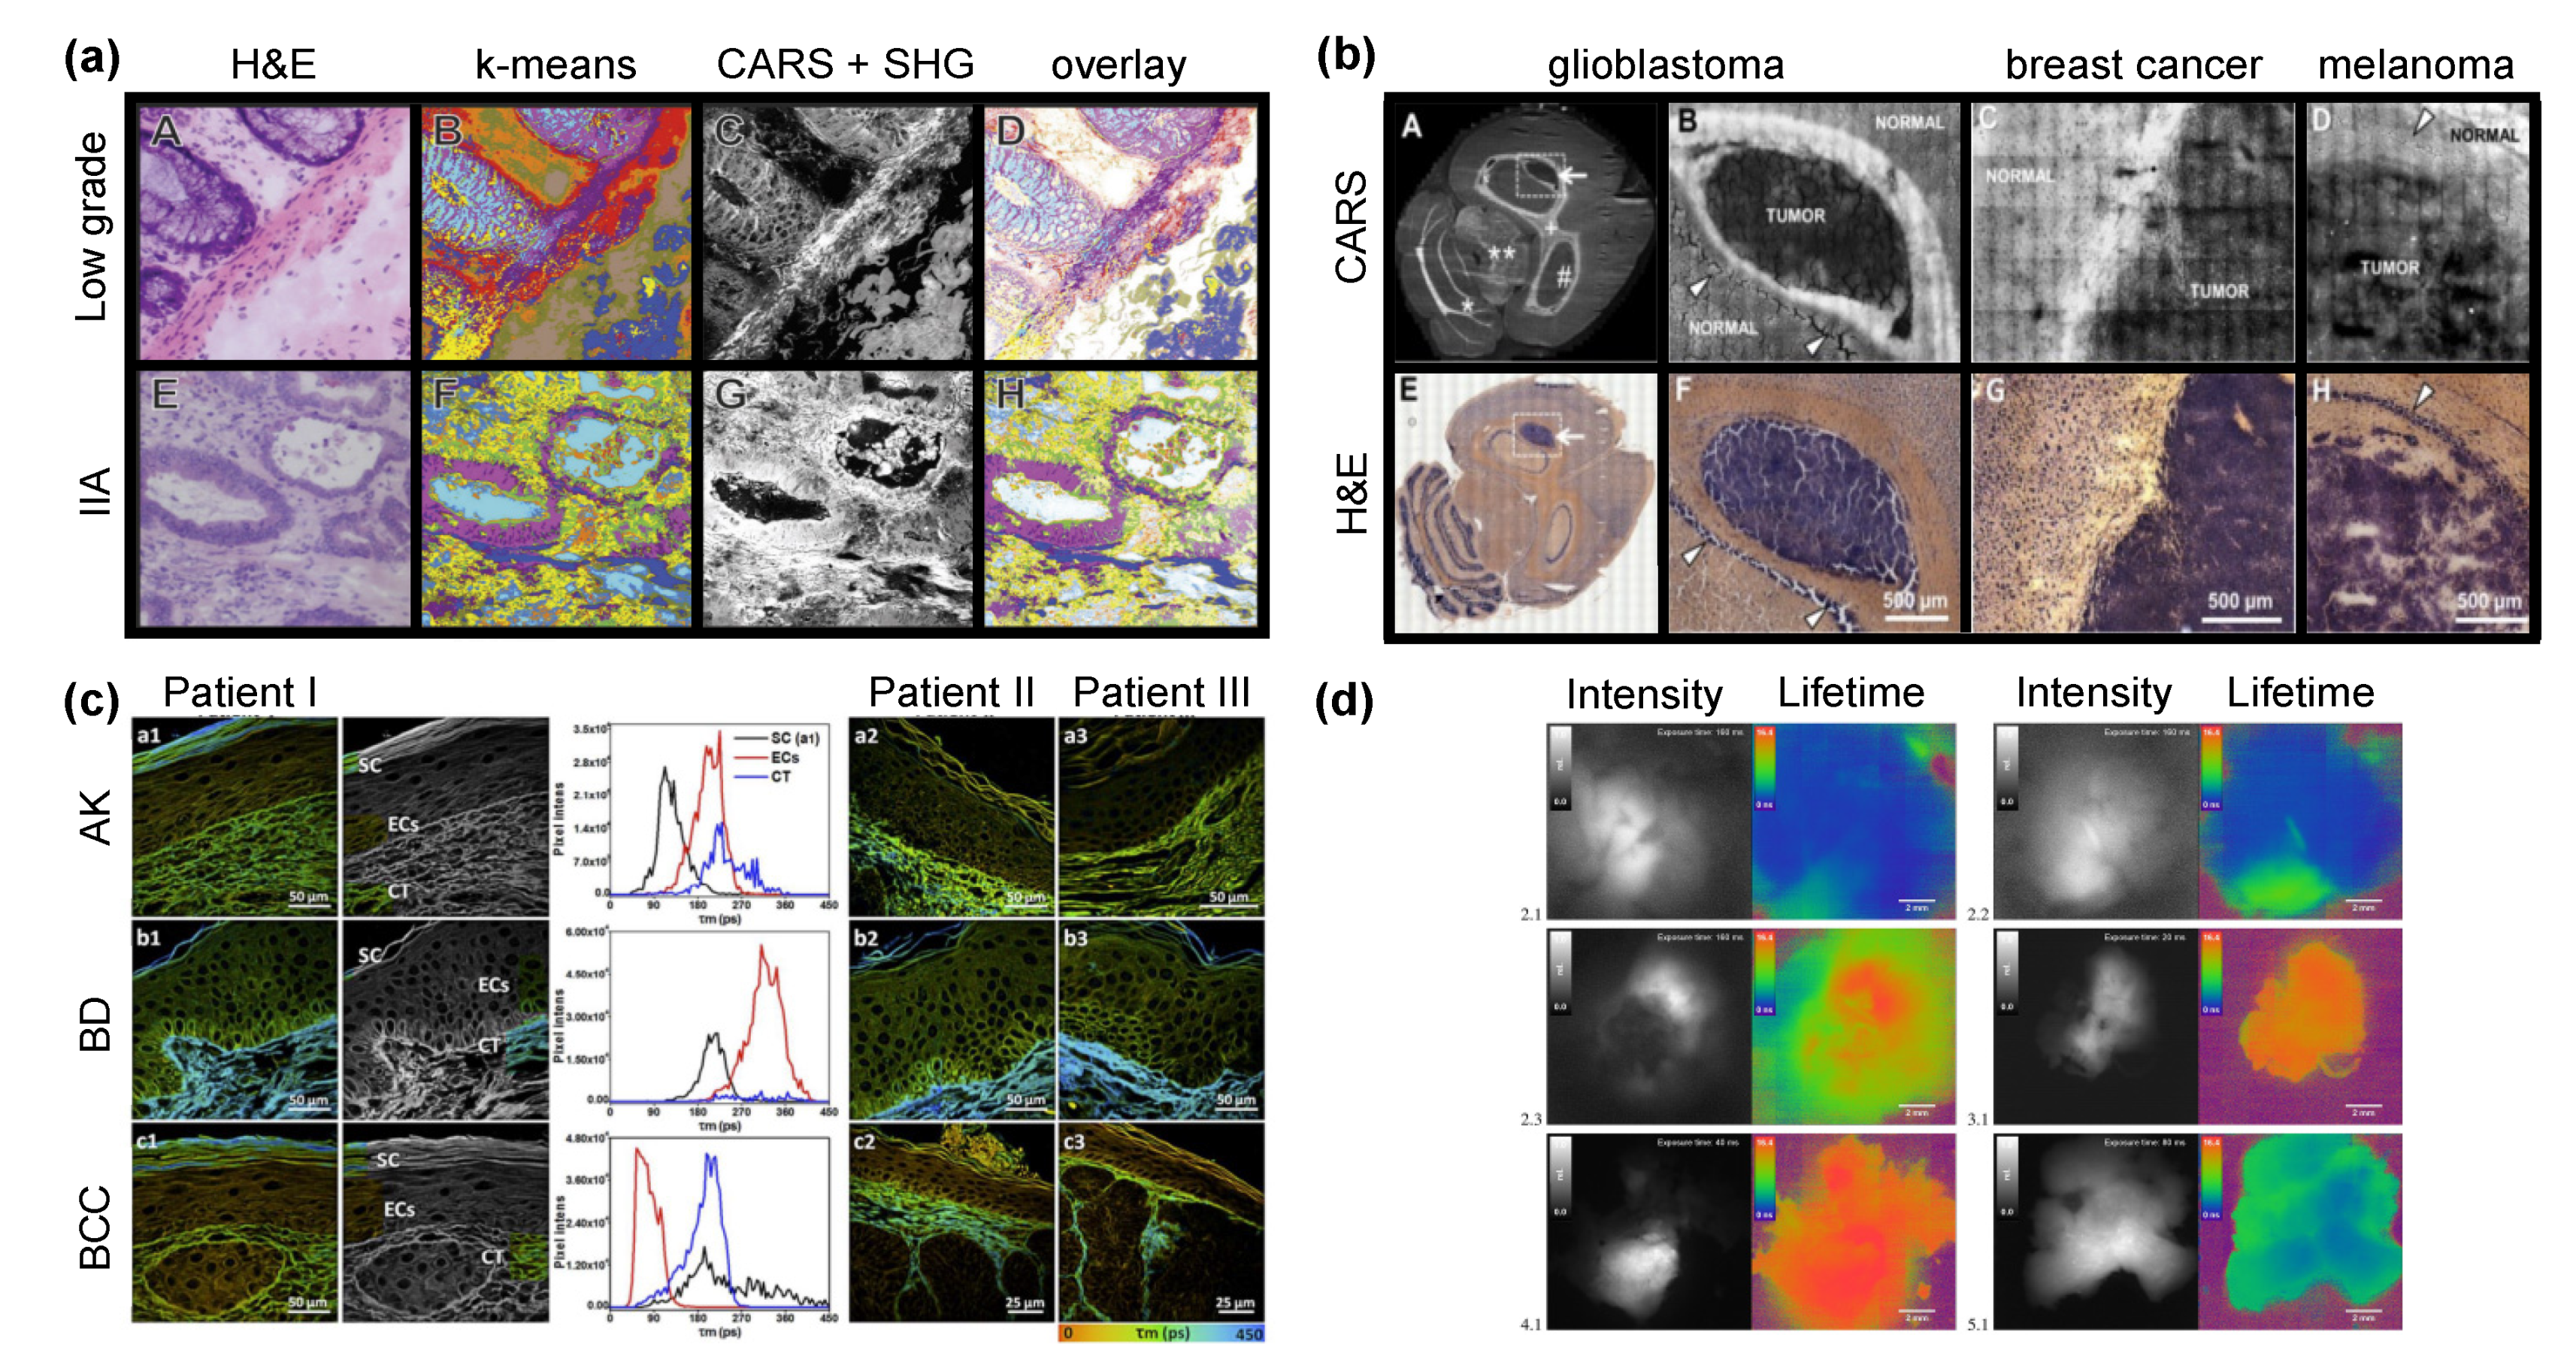
4.1.1. Breast Cancer
4.1.2. Colorectal Cancer
4.1.3. Prostate Cancer
4.1.4. Brain Cancer

4.2. Discrimination of Tumor Borders
4.3. Endoscopy
4.3.1. FLIM Endoscopy
4.3.2. Raman Endoscopy
5. Monitoring of Metabolic Processes and Pharmacokinetics
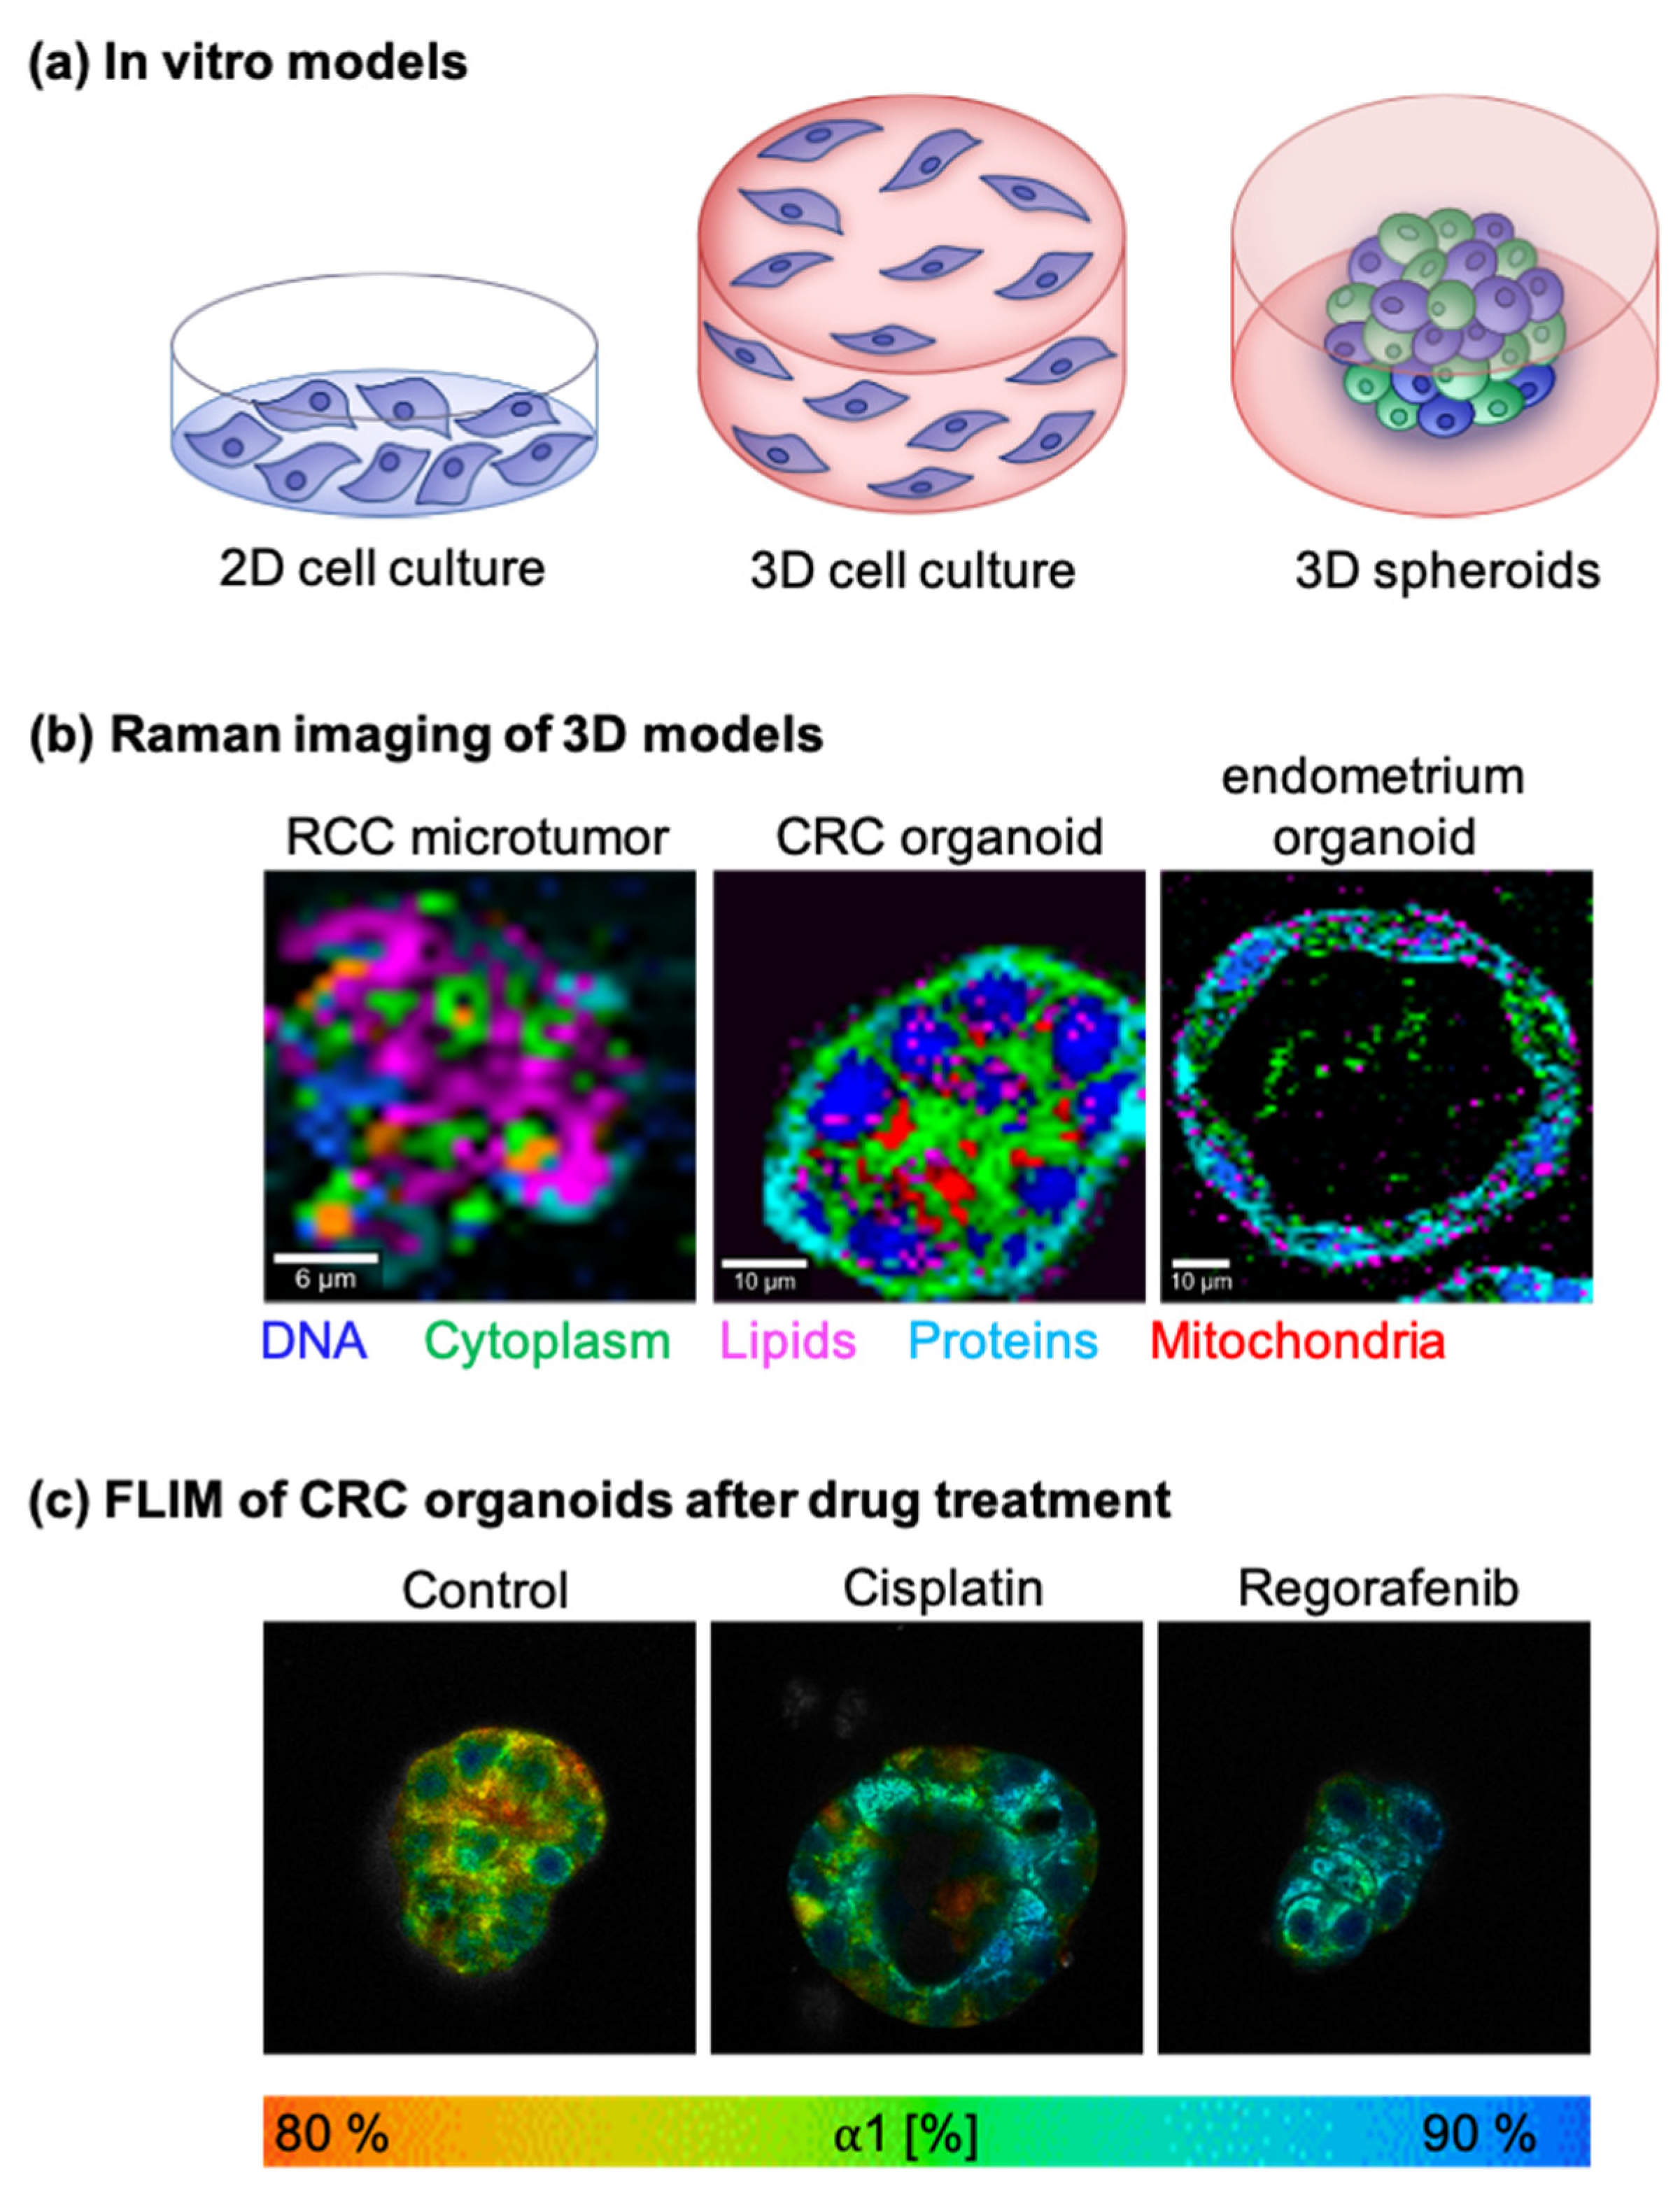
5.1. In Vitro Tumor Models
5.1.1. Two-Dimensional Cell Cultures
5.1.2. Three-Dimensional Cell Cultures
5.1.3. Other 3D Models

5.2. Tumor Metabolism
5.3. Drug Monitoring
5.3.1. Raman Spectroscopy-Based Drug Monitoring
5.3.2. SERS-Based Drug Monitoring
5.3.3. FLIM-Based Drug Monitoring
6. Challenges and Limitations
7. Conclusions
Author Contributions
Funding
Conflicts of Interest
References
- Klein, C.A. Cancer progression and the invisible phase of metastatic colonization. Nat. Rev. Cancer 2020, 20, 681–694. [Google Scholar] [CrossRef] [PubMed]
- Del Monte, U. Does the cell number 109 still really fit one gram of tumor tissue? Cell Cycle 2009, 8, 505–506. [Google Scholar] [CrossRef] [PubMed] [Green Version]
- D’Acunto, M.; Gaeta, R.; Capanna, R.; Franchi, A. Contribution of raman spectroscopy to diagnosis and grading of chondrogenic tumors. Sci. Rep. 2020, 10, 2155. [Google Scholar] [CrossRef]
- Vander Heiden, M.G.; Cantley, L.C.; Thompson, C.B. Understanding the Warburg effect: The metabolic requirements of cell proliferation. Science 2009, 324, 1029–1033. [Google Scholar] [CrossRef] [Green Version]
- Warburg, O.; Wind, F.; Negelein, E. The metabolism of tumors in the body. J. Gen. Physiol. 1927, 8, 519–530. [Google Scholar] [CrossRef] [PubMed] [Green Version]
- Warburg, O. On the origin of cancer cells. Science 1956, 123, 309–314. [Google Scholar] [CrossRef]
- Pettit, F.H.; Pelley, J.W.; Reed, L.J. Regulation of pyruvate dehydrogenase kinase and phosphatase by acetyl-CoA/CoA and NADH/NAD ratios. Biochem. Biophys. Res. Commun. 1975, 65, 575–582. [Google Scholar] [CrossRef]
- Niaura, G. R aman spectroscopy in analysis of biomolecules. Encycl. Anal. Chem. Appl. Theory Instrum. 2006. [Google Scholar] [CrossRef]
- Stone, N.; Kendall, C.; Smith, J.; Crow, P.; Barr, H. Raman spectroscopy for identification of epithelial cancers. Faraday Discuss. 2004, 126, 141–157. [Google Scholar] [CrossRef]
- Shafer-Peltier, K.E.; Haka, A.S.; Fitzmaurice, M.; Crowe, J.; Myles, J.; Dasari, R.R.; Feld, M.S. Raman microspectroscopic model of human breast tissue: Implications for breast cancer diagnosis in vivo. J. Raman Spectrosc. 2002, 33, 552–563. [Google Scholar] [CrossRef]
- Marzi, J.; Brauchle, E.M.; Schenke-Layland, K.; Rolle, M.W. Non-invasive functional molecular phenotyping of human smooth muscle cells utilized in cardiovascular tissue engineering. Acta Biomater. 2019, 89, 193–205. [Google Scholar] [CrossRef]
- Jones, R.R.; Hooper, D.C.; Zhang, L.; Wolverson, D.; Valev, V.K. Raman techniques: Fundamentals and frontiers. Nanoscale Res. Lett. 2019, 14, 231. [Google Scholar] [CrossRef] [PubMed] [Green Version]
- Auner, G.W.; Koya, S.K.; Huang, C.; Broadbent, B.; Trexler, M.; Auner, Z.; Elias, A.; Mehne, K.C.; Brusatori, M.A. Applications of Raman spectroscopy in cancer diagnosis. Cancer Metastasis Rev. 2018, 37, 691–717. [Google Scholar] [CrossRef] [PubMed] [Green Version]
- Jabłoński, A. Über den mechanismus der photolumineszenz von farbstoffphosphoren. Z. Phys. 1935, 94, 38. [Google Scholar] [CrossRef]
- Young, A.T. Rayleigh scattering. Appl. Opt. 1981, 20, 533–535. [Google Scholar] [CrossRef] [PubMed]
- Mie, G. Beiträge zur optik trüber medien, speziell kolloidaler metallösungen. Ann. Phys. 1908, 330, 377–445. [Google Scholar] [CrossRef]
- Andrade, E.C.N. A theory of the viscosity of liquids—Part, I. Lond. Edinb. Dublin Philos. Mag. J. Sci. 1934, 17, 497–511. [Google Scholar] [CrossRef]
- Long, D.A. Raman Spectroscopy; McGraw-Hill: New York, NY, USA, 1977; Volume 1. [Google Scholar]
- Lippert, J.L.; Peticolas, W.L. Laser Raman investigation of the effect of cholesterol on conformational changes in dipalmitoyl lecithin multilayers. Proc. Natl. Acad. Sci. USA 1971, 68, 1572–1576. [Google Scholar] [CrossRef] [Green Version]
- Yu, N.-T.; Liu, C.; O’shea, D. Laser Raman spectroscopy and the conformation of insulin and proinsulin. J. Mol. Biol. 1972, 70, 117–132. [Google Scholar] [CrossRef]
- Baron, V.O.; Chen, M.; Hammarstrom, B.; Hammond, R.J.; Glynne-Jones, P.; Gillespie, S.H.; Dholakia, K. Real-time monitoring of live mycobacteria with a microfluidic acoustic-Raman platform. Commun. Biol. 2020, 3, 1–8. [Google Scholar] [CrossRef]
- Uzunbajakava, N.; Lenferink, A.; Kraan, Y.; Willekens, B.; Vrensen, G.; Greve, J.; Otto, C. Nonresonant Raman imaging of protein distribution in single human cells. Biopolym. Orig. Res. Biomol. 2003, 72, 1–9. [Google Scholar] [CrossRef] [PubMed]
- Jahncke, C.; Paesler, M.; Hallen, H. Raman imaging with near-field scanning optical microscopy. Appl. Phys. Lett. 1995, 67, 2483–2485. [Google Scholar] [CrossRef] [Green Version]
- Monfared, Y.E.; Shaffer, T.M.; Gambhir, S.S.; Hewitt, K.C. Continuous-wave coherent Raman spectroscopy via plasmonic enhancement. Sci. Rep. 2019, 9, 12092. [Google Scholar] [CrossRef]
- Zhou, P.; Tek, W. Choosing the most suitable laser wavelength for your Raman application. BWTEK 2015, 1, 1–6. [Google Scholar]
- Cao, J.; Zhu, B.; Zheng, K.; He, S.; Meng, L.; Song, J.; Yang, H. Recent progress in NIR-II contrast agent for biological imaging. Front. Bioeng. Biotechnol. 2020, 7, 487. [Google Scholar] [CrossRef] [Green Version]
- Griffiths, P.R. Infrared and Raman instrumentation for mapping and imaging. Infrared Raman Spectrosc. Imaging 2009, 1–64. [Google Scholar] [CrossRef]
- Tuschel, D. Spectral resolution and dispersion in raman spectroscopy. Spectroscopy 2020, 35, 9. [Google Scholar]
- Li, F.M.; Nathan, A. Degradation behavior and damage mechanisms of CCD image sensor with deep-UV laser radiation. IEEE Trans. Electron. Devices 2004, 51, 2229–2236. [Google Scholar] [CrossRef]
- Ramya, A.N.; Arya, J.S.; Madhukrishnan, M.; Shamjith, S.; Vidyalekshmi, M.S.; Maiti, K.K. Raman imaging: An impending approach towards cancer diagnosis. Chem. Asian J. 2021, 16, 409–422. [Google Scholar] [CrossRef]
- Maker, P.; Terhune, R. Study of optical effects due to an induced polarization third order in the electric field strength. Phys. Rev. 1965, 137, A801. [Google Scholar] [CrossRef]
- Zheltikov, A. Coherent anti-stokes Raman scattering: From proof-of-the-principle experiments to femtosecond CARS and higher order wave-mixing generalizations. J. Raman Spectrosc. 2000, 31, 653–667. [Google Scholar] [CrossRef]
- Le, T.T.; Huff, T.B.; Cheng, J.-X. Coherent anti-stokes Raman scattering imaging of lipids in cancer metastasis. BMC Cancer 2009, 9, 42. [Google Scholar] [CrossRef] [PubMed] [Green Version]
- Potma, E.O.; Evans, C.L.; Xie, X.S. Heterodyne coherent anti-stokes Raman scattering (CARS) imaging. Opt. Lett. 2006, 31, 241–243. [Google Scholar] [CrossRef] [Green Version]
- Le, T.T.; Rehrer, C.W.; Huff, T.B.; Nichols, M.B.; Camarillo, I.G.; Cheng, J.-X. Nonlinear optical imaging to evaluate the impact of obesity on mammary gland and tumor stroma. Mol. Imaging 2007, 6. [Google Scholar] [CrossRef]
- Bocklitz, T.W.; Salah, F.S.; Vogler, N.; Heuke, S.; Chernavskaia, O.; Schmidt, C.; Waldner, M.J.; Greten, F.R.; Bräuer, R.; Schmitt, M.; et al. Pseudo-HE images derived from CARS/TPEF/SHG multimodal imaging in combination with Raman-spectroscopy as a pathological screening tool. BMC Cancer 2016, 16, 534. [Google Scholar] [CrossRef] [PubMed] [Green Version]
- Guerrini, L.; Alvarez-Puebla, R.A. Surface-enhanced Raman spectroscopy in cancer diagnosis, prognosis and monitoring. Cancers 2019, 11, 748. [Google Scholar] [CrossRef] [PubMed] [Green Version]
- Kneipp, K.; Wang, Y.; Kneipp, H.; Perelman, L.T.; Itzkan, I.; Dasari, R.R.; Feld, M.S. Single molecule detection using surface-enhanced Raman scattering (SERS). Phys. Rev. Lett. 1997, 78, 1667. [Google Scholar] [CrossRef] [Green Version]
- Fleischmann, M.; Hendra, P.J.; McQuillan, A.J. Raman spectra of pyridine adsorbed at a silver electrode. Chem. Phys. Lett. 1974, 26, 163–166. [Google Scholar] [CrossRef]
- Liz-Marzán, L.M. Tailoring surface plasmons through the morphology and assembly of metal nanoparticles. Langmuir 2006, 22, 32–41. [Google Scholar] [CrossRef]
- Eustis, S.; El-Sayed, M.A. Why gold nanoparticles are more precious than pretty gold: Noble metal surface plasmon resonance and its enhancement of the radiative and nonradiative properties of nanocrystals of different shapes. Chem. Soc. Rev. 2006, 35, 209–217. [Google Scholar] [CrossRef]
- Lee, S.; Chon, H.; Lee, J.; Ko, J.; Chung, B.H.; Lim, D.W.; Choo, J. Rapid and sensitive phenotypic marker detection on breast cancer cells using surface-enhanced Raman scattering (SERS) imaging. Biosens. Bioelectron. 2014, 51, 238–243. [Google Scholar] [CrossRef]
- Hu, Q.; Tay, L.-L.; Noestheden, M.; Pezacki, J.P. Mammalian cell surface imaging with nitrile-functionalized nanoprobes: Biophysical characterization of aggregation and polarization anisotropy in SERS imaging. J. Am. Chem. Soc. 2007, 129, 14–15. [Google Scholar] [CrossRef]
- Zheng, Z.; Wu, L.; Li, L.; Zong, S.; Wang, Z.; Cui, Y. Simultaneous and highly sensitive detection of multiple breast cancer biomarkers in real samples using a SERS microfluidic chip. Talanta 2018, 188, 507–515. [Google Scholar] [CrossRef]
- Dinish, U.; Fu, C.Y.; Soh, K.S.; Ramaswamy, B.; Kumar, A.; Olivo, M. Highly sensitive SERS detection of cancer proteins in low sample volume using hollow core photonic crystal fiber. Biosens. Bioelectron. 2012, 33, 293–298. [Google Scholar]
- Lin, H.Y.; Huang, C.H.; Hsieh, W.H.; Liu, L.H.; Lin, Y.C.; Chu, C.C.; Wang, S.T.; Kuo, I.T.; Chau, L.K.; Yang, C.Y. On-line SERS detection of single bacterium using novel SERS nanoprobes and a microfluidic dielectrophoresis device. Small 2014, 10, 4700–4710. [Google Scholar] [CrossRef] [PubMed]
- Subramanian, P.; Meziane, D.; Wojcieszak, R.; Dumeignil, F.; Boukherroub, R.; Szunerits, S. Plasmon-induced electrocatalysis with multi-component nanostructures. Materials 2019, 12, 43. [Google Scholar] [CrossRef] [Green Version]
- Li, J.F.; Huang, Y.F.; Ding, Y.; Yang, Z.L.; Li, S.B.; Zhou, X.S.; Fan, F.R.; Zhang, W.; Zhou, Z.Y.; Ren, B. Shell-isolated nanoparticle-enhanced Raman spectroscopy. Nature 2010, 464, 392–395. [Google Scholar] [CrossRef] [PubMed]
- Zavaleta, C.L.; Smith, B.R.; Walton, I.; Doering, W.; Davis, G.; Shojaei, B.; Natan, M.J.; Gambhir, S.S. Multiplexed imaging of surface enhanced Raman scattering nanotags in living mice using noninvasive Raman spectroscopy. Proc. Natl. Acad. Sci. USA 2009, 106, 13511–13516. [Google Scholar] [CrossRef] [PubMed] [Green Version]
- Wang, X.F.; Periasamy, A.; Herman, B.; Coleman, D.M. Fluorescence lifetime imaging microscopy (FLIM): Instrumentation and applications. Crit. Rev. Anal. Chem. 1992, 23, 369–395. [Google Scholar] [CrossRef]
- Becker, W. Fluorescence lifetime imaging by multi-dimensional time correlated single photon counting. Med. Photonics 2015, 27, 41–61. [Google Scholar] [CrossRef]
- Berezin, M.Y.; Achilefu, S. Fluorescence lifetime measurements and biological imaging. Chem. Rev. 2010, 110, 2641–2684. [Google Scholar] [CrossRef] [PubMed] [Green Version]
- Lakowicz, J.R.; Szmacinski, H.; Nowaczyk, K.; Johnson, M.L. Fluorescence lifetime imaging of free and protein-bound NADH. Proc. Natl. Acad. Sci. USA 1992, 89, 1271–1275. [Google Scholar] [CrossRef] [PubMed] [Green Version]
- Sarder, P.; Maji, D.; Achilefu, S. Molecular probes for fluorescence lifetime imaging. Bioconjug. Chem. 2015, 26, 963–974. [Google Scholar] [CrossRef] [PubMed] [Green Version]
- Benninger, R.K.; Koç, Y.; Hofmann, O.; Requejo-Isidro, J.; Neil, M.A.; French, P.M.; DeMello, A.J. Quantitative 3D mapping of fluidic temperatures within microchannel networks using fluorescence lifetime imaging. Anal. Chem. 2006, 78, 2272–2278. [Google Scholar] [CrossRef]
- Kuimova, M.K. Mapping viscosity in cells using molecular rotors. Phys. Chem. Chem. Phys. 2012, 14, 12671–12686. [Google Scholar] [CrossRef]
- Hille, C.; Berg, M.; Bressel, L.; Munzke, D.; Primus, P.; Löhmannsröben, H.G.; Dosche, C. Time-domain fluorescence lifetime imaging for intracellular pH sensing in living tissues. Anal. Bioanal. Chem. 2008, 391, 1871–1879. [Google Scholar] [CrossRef]
- Becker, W.; Bergmann, A.; Hink, M.; König, K.; Benndorf, K.; Biskup, C. Fluorescence lifetime imaging by time-correlated single-photon counting. Microsc. Res. Tech. 2004, 63, 58–66. [Google Scholar] [CrossRef] [PubMed]
- Smith, T.A. Time-resolved fluorescence; measurements in polymer science. In Encyclopedia of Modern Optics; Guenther, R.D., Ed.; Elsevier: Oxford, UK, 2005; pp. 184–192. [Google Scholar]
- Rossi, B.; Nereson, N. Experimental determination of the disintegration curve of mesotrons. Phys. Rev. 1942, 62, 417–422. [Google Scholar] [CrossRef] [Green Version]
- Haugen, G.R.; Wallin, B.W.; Lytle, F.E. Optimization of data-acquistion rates in time-correlated single-photon fluorimetry. Rev. Sci. Instrum. 1979, 50, 64–72. [Google Scholar] [CrossRef]
- Alléaume, R.; Treussart, F.; Courty, J.M.; Roch, J.F. Photon statistics characterization of a single-photon source. New J. Phys. 2004, 6, 85. [Google Scholar] [CrossRef] [Green Version]
- Becker, W. Advanced Time-Correlated Single Photon Counting Techniques; Springer Science & Business Media: New York, NY, USA, 2005; Volume 81. [Google Scholar]
- Suhling, K.; French, P.M.W.; Phillips, D. Time-resolved fluorescence microscopy. Photochem. Photobiol. Sci. 2005, 4, 13–22. [Google Scholar] [CrossRef]
- Gadella, T.W., Jr.; Jovin, T.M.; Clegg, R.M. Fluorescence lifetime imaging microscopy (FLIM): Spatial resolution of microstructures on the nanosecond time scale. Biophys. Chem. 1993, 48, 221–239. [Google Scholar] [CrossRef]
- Gratton, E.; Breusegem, S.; Sutin, J.D.; Ruan, Q.; Barry, N.P. Fluorescence lifetime imaging for the two-photon microscope: Time-domain and frequency-domain methods. J. Biomed. Opt. 2003, 8, 381–390. [Google Scholar] [CrossRef] [PubMed]
- Liu, X.; Lin, D.; Becker, W.; Niu, J.; Yu, B.; Liu, L.; Qu, J. Fast fluorescence lifetime imaging techniques: A review on challenge and development. J. Innov. Opt. Health Sci. 2019, 12, 1930003. [Google Scholar] [CrossRef] [Green Version]
- Datta, R.; Heaster, T.; Sharick, J.; Gillette, A.; Skala, M. Fluorescence lifetime imaging microscopy: Fundamentals and advances in instrumentation, analysis, and applications. J. Biomed. Opt. 2020, 25, 071203. [Google Scholar] [CrossRef] [PubMed]
- Chance, B.; Schoener, B.; Oshino, R.; Itshak, F.; Nakase, Y. Oxidation-reduction ratio studies of mitochondria in freeze-trapped samples. NADH and flavoprotein fluorescence signals. J. Biol. Chem. 1979, 254, 4764–4771. [Google Scholar] [CrossRef]
- Ghukasyan, V.V.; Kao, F.-J. Monitoring cellular metabolism with fluorescence lifetime of reduced nicotinamide adenine dinucleotide. J. Phys. Chem. C 2009, 113, 11532–11540. [Google Scholar] [CrossRef]
- Heikal, A.A. Intracellular coenzymes as natural biomarkers for metabolic activities and mitochondrial anomalies. Biomark. Med. 2010, 4, 241–263. [Google Scholar] [CrossRef] [PubMed] [Green Version]
- Ying, W. NAD+/NADH and NADP+/NADPH in cellular functions and cell death: Regulation and biological consequences. Antioxid. Redox Signal. 2008, 10, 179–206. [Google Scholar] [CrossRef] [Green Version]
- Salmon, J.M.; Kohen, E.; Viallet, P.; Hirschberg, J.G.; Wouters, A.W.; Kohen, C.; Thorell, B. Microspectrofluorometric approach to the study of free/bound NAD (P) H ratio as metabolic indicator in various cell types. Photochem. Photobiol. 1982, 36, 585–593. [Google Scholar] [CrossRef]
- Clegg, R.M.; Holub, O.; Gohlke, C. [22] Fluorescence lifetime-resolved imaging: Measuring lifetimes in an image. Methods Enzymol. 2003, 360, 509–542. [Google Scholar] [PubMed]
- Jares-Erijman, E.A.; Jovin, T.M. FRET imaging. Nat. Biotechnol. 2003, 21, 1387–1395. [Google Scholar] [CrossRef] [PubMed]
- Förster, T. Zwischenmolekulare energiewanderung und fluoreszenz. Ann. Phys. 1948, 437, 55–75. [Google Scholar] [CrossRef]
- Wallrabe, H.; Periasamy, A. Imaging protein molecules using FRET and FLIM microscopy. Curr. Opin. Biotechnol. 2005, 16, 19–27. [Google Scholar] [CrossRef]
- Rajoria, S.; Zhao, L.; Intes, X.; Barroso, M. FLIM-FRET for cancer applications. Curr. Mol. Imaging 2014, 3, 144–161. [Google Scholar] [CrossRef] [PubMed] [Green Version]
- Nothdurft, R.; Sarder, P.; Bloch, S.; Culver, J.; Achilefu, S. Fluorescence lifetime imaging microscopy using near-infrared contrast agents. J. Microsc. 2012, 247, 202–207. [Google Scholar] [CrossRef] [Green Version]
- Morales, A.R.; Schafer-Hales, K.J.; Marcus, A.I.; Belfield, K.D. Amine-Reactive fluorene probes: Synthesis, optical characterization, bioconjugation, and two-photon fluorescence imaging. Bioconjug. Chem. 2008, 19, 2559–2567. [Google Scholar] [CrossRef] [Green Version]
- Wu, T.J.; Tzeng, Y.K.; Chang, W.W.; Cheng, C.A.; Kuo, Y.; Chien, C.H.; Chang, H.C.; Yu, J. Tracking the engraftment and regenerative capabilities of transplanted lung stem cells using fluorescent nanodiamonds. Nat. Nanotechnol. 2013, 8, 682–689. [Google Scholar] [CrossRef]
- Berezin, M.Y.; Kao, J.; Achilefu, S. pH-dependent optical properties of synthetic fluorescent imidazoles. Chemistry 2009, 15, 3560. [Google Scholar] [CrossRef]
- Nakabayashi, T.; Wang, H.-P.; Kinjo, M.; Ohta, N. Application of fluorescence lifetime imaging of enhanced green fluorescent protein to intracellular pH measurements. Photochem. Photobiol. Sci. 2008, 7, 668–670. [Google Scholar] [CrossRef]
- Hille, C.; Lahn, M.; Löhmannsröben, H.-G.; Dosche, C. Two-photon fluorescence lifetime imaging of intracellular chloride in cockroach salivary glands. Photochem. Photobiol. Sci. 2009, 8, 319–327. [Google Scholar] [CrossRef]
- Wilms, C.D.; Eilers, J. Photo-physical properties of Ca2+-indicator dyes suitable for two-photon fluorescence-lifetime recordings. J. Microsc. 2007, 225, 209–213. [Google Scholar] [CrossRef]
- Satapathy, R.; Wu, Y.-H.; Lin, H.-C. Novel thieno-imidazole based probe for colorimetric detection of Hg2+ and fluorescence turn-on response of Zn2+. Org. Lett. 2012, 14, 2564–2567. [Google Scholar] [CrossRef]
- Hosny, N.A.; Lee, D.A.; Knight, M.M. Single photon counting fluorescence lifetime detection of pericellular oxygen concentrations. J. Biomed. Opt. 2012, 17, 016007. [Google Scholar] [CrossRef] [PubMed] [Green Version]
- Dmitriev, R.I.; Zhdanov, A.V.; Nolan, Y.M.; Papkovsky, D.B. Imaging of neurosphere oxygenation with phosphorescent probes. Biomaterials 2013, 34, 9307–9317. [Google Scholar] [CrossRef] [PubMed]
- Loison, P.; Hosny, N.A.; Gervais, P.; Champion, D.; Kuimova, M.K.; Perrier-Cornet, J.-M. Direct investigation of viscosity of an atypical inner membrane of Bacillus spores: A molecular rotor/FLIM study. Biochim. Biophys. Acta Biomembr. 2013, 1828, 2436–2443. [Google Scholar] [CrossRef] [PubMed] [Green Version]
- Kwiatek, J.M.; Owen, D.M.; Abu-Siniyeh, A.; Yan, P.; Loew, L.M.; Gaus, K. Characterization of a new series of fluorescent probes for imaging membrane order. PLoS ONE 2013, 8, e52960. [Google Scholar] [CrossRef]
- Okabe, K.; Inada, N.; Gota, C.; Harada, Y.; Funatsu, T.; Uchiyama, S. Intracellular temperature mapping with a fluorescent polymeric thermometer and fluorescence lifetime imaging microscopy. Nat. Commun. 2012, 3, 1–9. [Google Scholar] [CrossRef] [Green Version]
- Rowland, C.E.; Brown, C.W.; Medintz, I.L.; Delehanty, J.B. Intracellular FRET-based probes: A review. Methods Appl. Fluoresc. 2015, 3, 042006. [Google Scholar] [CrossRef]
- Siegel, R.L.; Miller, K.D.; Fuchs, H.E.; Jemal, A. Cancer statistics, 2021. CA A Cancer J. Clin. 2021, 71, 7–33. [Google Scholar] [CrossRef]
- Partridge, E.E.; Abu-Rustum, N.R.; Campos, S.M.; Fahey, P.J.; Farmer, M.; Garcia, R.L.; Giuliano, A.; Jones, H.W., III; Lele, S.M.; Lieberman, R.W.; et al. Cervical cancer screening. J. Natl. Compr. Cancer Netw. 2010, 8, 1358–1386. [Google Scholar] [CrossRef] [Green Version]
- Pickhardt, P.J.; Hassan, C.; Halligan, S.; Marmo, R. Colorectal cancer: CT colonography and colonoscopy for detection-systematic review and meta-analysis. Radiology 2011, 259, 393–405. [Google Scholar] [CrossRef] [PubMed] [Green Version]
- Van den Biggelaar, F.J.; Nelemans, P.J.; Flobbe, K. Performance of radiographers in mammogram interpretation: A systematic review. Breast 2008, 17, 85–90. [Google Scholar] [CrossRef] [PubMed]
- Brawer, M.K. Prostate-specific antigen. Semin. Surg. Oncol. 2000, 18, 3–9. [Google Scholar] [CrossRef]
- Chen, X.; Gole, J.; Gore, A.; He, Q.; Lu, M.; Min, J.; Yuan, Z.; Yang, X.; Jiang, Y.; Zhang, T.; et al. Non-invasive early detection of cancer four years before conventional diagnosis using a blood test. Nat. Commun. 2020, 11, 3475. [Google Scholar] [CrossRef]
- Nargis, H.F.; Nawaz, H.; Ditta, A.; Mahmood, T.; Majeed, M.I.; Rashid, N.; Muddassar, M.; Bhatti, H.N.; Saleem, M.; Jilani, K.; et al. Raman spectroscopy of blood plasma samples from breast cancer patients at different stages. Spectrochim. Acta Part A Mol. Biomol. Spectrosc. 2019, 222, 117210. [Google Scholar] [CrossRef] [PubMed] [Green Version]
- Marro, M.; Rodríguez-Rivero, A.M.; Araujo-Andrade, C.; Fernández-Figueras, M.T.; Pérez-Roca, L.; Castellà, E.; Navinés, J.; Mariscal, A.; Julián, J.F.; Turon, P.; et al. Unravelling the encapsulation of DNA and other biomolecules in HAp microcalcifications of human breast cancer tissues by raman imaging. Cancers 2021, 13, 2658. [Google Scholar] [CrossRef] [PubMed]
- Abramczyk, H.; Surmacki, J.M.; Brozek-Pluska, B.; Kopec, M. Revision of commonly accepted warburg mechanism of cancer development: Redox-sensitive mitochondrial cytochromes in breast and brain cancers by raman imaging. Cancers 2021, 13, 2599. [Google Scholar] [CrossRef]
- Sites, A. SEER Cancer Statistics Review 1975–2011; Bethesda MD Natlional Cancer Institute. 2014. Available online: https://seer.cancer.gov/archive/csr/1975_2011/results_single/sect_28_table.03.pdf (accessed on 29 September 2021).
- Chen, K.; Qin, Y.; Zheng, F.; Sun, M.; Shi, D. Diagnosis of colorectal cancer using Raman spectroscopy of laser-trapped single living epithelial cells. Opt. Lett. 2006, 31, 2015–2017. [Google Scholar] [CrossRef]
- Liu, W.; Sun, Z.; Chen, J.; Jing, C. Raman spectroscopy in colorectal cancer diagnostics: Comparison of PCA-LDA and PLS-DA models. J. Spectrosc. 2016, 2016, 1603609. [Google Scholar] [CrossRef]
- Li, X.; Yang, T.; Yu, T.; Li, S. Discrimination of serum Raman spectroscopy between normal and colorectal cancer. In Proceedings of the European Conference on Biomedical Optics, Munich, Germany, 22–26 May 2011; p. 808727. [Google Scholar]
- Lin, D.; Feng, S.; Pan, J.; Chen, Y.; Lin, J.; Chen, G.; Xie, S.; Zeng, H.; Chen, R. Colorectal cancer detection by gold nanoparticle based surface-enhanced Raman spectroscopy of blood serum and statistical analysis. Opt. Express 2011, 19, 13565–13577. [Google Scholar] [CrossRef] [PubMed]
- Jenkins, C.A.; Jenkins, R.A.; Pryse, M.M.; Welsby, K.A.; Jitsumura, M.; Thornton, C.A.; Dunstan, P.R.; Harris, D.A. A high-throughput serum Raman spectroscopy platform and methodology for colorectal cancer diagnostics. Analyst 2018, 143, 6014–6024. [Google Scholar] [CrossRef] [PubMed] [Green Version]
- Lin, J.; Huang, Z.; Lin, X.; Wu, Q.; Quan, K.; Cheng, Y.; Zheng, M.; Xu, J.; Dai, Y.; Qiu, H.; et al. Rapid and label-free urine test based on surface-enhanced Raman spectroscopy for the non-invasive detection of colorectal cancer at different stages. Biomed. Opt. Express 2020, 11, 7109–7119. [Google Scholar] [CrossRef] [PubMed]
- Hong, Y.; Li, Y.; Huang, L.; He, W.; Wang, S.; Wang, C.; Zhou, G.; Chen, Y.; Zhou, X.; Huang, Y.; et al. Label-free diagnosis for colorectal cancer through coffee ring-assisted surface-enhanced Raman spectroscopy on blood serum. J. Biophotonics 2020, 13, e201960176. [Google Scholar] [CrossRef]
- Petersen, D.; Mavarani, L.; Niedieker, D.; Freier, E.; Tannapfel, A.; Kötting, C.; Gerwert, K.; El-Mashtoly, S.F. Virtual staining of colon cancer tissue by label-free Raman micro-spectroscopy. Analyst 2017, 142, 1207–1215. [Google Scholar] [CrossRef]
- Guerenne-Del Ben, T.; Couderc, V.; Duponchel, L.; Sol, V.; Leproux, P.; Petit, J.-M. Multiplex coherent anti-stokes Raman scattering microspectroscopy detection of lipid droplets in cancer cells expressing TrkB. Sci. Rep. 2020, 10, 16749. [Google Scholar] [CrossRef]
- Geng, F.; Guo, D. Lipid droplets, potential biomarker and metabolic target in glioblastoma. Intern. Med. Rev. 2017, 3. [Google Scholar] [CrossRef] [Green Version]
- Hugosson, J.; Carlsson, S.; Aus, G.; Bergdahl, S.; Khatami, A.; Lodding, P.; Pihl, C.-G.; Stranne, J.; Holmberg, E.; Lilja, H. Mortality results from the Göteborg randomised population-based prostate-cancer screening trial. Lancet Oncol. 2010, 11, 725–732. [Google Scholar] [CrossRef] [Green Version]
- Etzioni, R.; Tsodikov, A.; Mariotto, A.; Szabo, A.; Falcon, S.; Wegelin, J.; Karnofski, K.; Gulati, R.; Penson, D.F.; Feuer, E. Quantifying the role of PSA screening in the US prostate cancer mortality decline. Cancer Causes Control 2008, 19, 175–181. [Google Scholar] [CrossRef] [Green Version]
- Medipally, D.K.; Maguire, A.; Bryant, J.; Armstrong, J.; Dunne, M.; Finn, M.; Lyng, F.M.; Meade, A.D. Development of a high throughput (HT) Raman spectroscopy method for rapid screening of liquid blood plasma from prostate cancer patients. Analyst 2017, 142, 1216–1226. [Google Scholar] [CrossRef] [Green Version]
- Li, S.; Zhang, Y.; Xu, J.; Li, L.; Zeng, Q.; Lin, L.; Guo, Z.; Liu, Z.; Xiong, H.; Liu, S. Noninvasive prostate cancer screening based on serum surface-enhanced Raman spectroscopy and support vector machine. Appl. Phys. Lett. 2014, 105, 091104. [Google Scholar] [CrossRef]
- Fu, X.; Wen, J.; Li, J.; Lin, H.; Liu, Y.; Zhuang, X.; Tian, C.; Chen, L. Highly sensitive detection of prostate cancer specific PCA3 mimic DNA using SERS-based competitive lateral flow assay. Nanoscale 2019, 11, 15530–15536. [Google Scholar] [CrossRef]
- Ma, Y.; Chi, J.; Zheng, Z.; Attygalle, A.; Kim, I.Y.; Du, H. Therapeutic prognosis of prostate cancer using surface-enhanced Raman scattering of patient urine and multivariate statistical analysis. J. Biophotonics 2021, 14, e202000275. [Google Scholar] [CrossRef] [PubMed]
- Uckermann, O.; Galli, R.; Tamosaityte, S.; Leipnitz, E.; Geiger, K.D.; Schackert, G.; Koch, E.; Steiner, G.; Kirsch, M. Label-free delineation of brain tumors by coherent anti-stokes Raman scattering microscopy in an orthotopic mouse model and human glioblastoma. PLoS ONE 2014, 9, e107115. [Google Scholar] [CrossRef] [Green Version]
- Galli, R.; Uckermann, O.; Temme, A.; Leipnitz, E.; Meinhardt, M.; Koch, E.; Schackert, G.; Steiner, G.; Kirsch, M. Assessing the efficacy of coherent anti-Stokes Raman scattering microscopy for the detection of infiltrating glioblastoma in fresh brain samples. J. Biophotonics 2017, 10, 404–414. [Google Scholar] [CrossRef] [PubMed]
- Livermore, L.J.; Isabelle, M.; Bell, I.M.; Edgar, O.; Voets, N.L.; Stacey, R.; Ansorge, O.; Vallance, C.; Plaha, P. Raman spectroscopy to differentiate between fresh tissue samples of glioma and normal brain: A comparison with 5-ALA–induced fluorescence-guided surgery. J. Neurosurg. 2020, 1, 1–11. [Google Scholar] [CrossRef]
- Romeike, B.F.M.; Meyer, T.; Reichart, R.; Kalff, R.; Petersen, I.; Dietzek, B.; Popp, J. Coherent anti-stokes Raman scattering and two photon excited fluorescence for neurosurgery. Clin. Neurol. Neurosurg. 2015, 131, 42–46. [Google Scholar] [CrossRef]
- Uckermann, O.; Galli, R.; Mark, G.; Meinhardt, M.; Koch, E.; Schackert, G.; Steiner, G.; Kirsch, M. Label-free multiphoton imaging allows brain tumor recognition based on texture analysis—A study of 382 tumor patients. Neuro Oncol. Adv. 2020, 2, vdaa035. [Google Scholar] [CrossRef]
- Luo, T.; Lu, Y.; Liu, S.; Lin, D.; Qu, J. Phasor–FLIM as a Screening tool for the differential diagnosis of actinic keratosis, Bowen’s disease, and basal cell carcinoma. Anal. Chem. 2017, 89, 8104–8111. [Google Scholar] [CrossRef]
- Erkkilä, M.T.; Bauer, B.; Hecker-Denschlag, N.; Madera Medina, M.J.; Leitgeb, R.A.; Unterhuber, A.; Gesperger, J.; Roetzer, T.; Hauger, C.; Drexler, W. Widefield fluorescence lifetime imaging of protoporphyrin IX for fluorescence-guided neurosurgery: An ex vivo feasibility study. J. Biophotonics 2019, 12, e201800378. [Google Scholar] [CrossRef]
- Alberda, W.J.; Verhoef, C.; Schipper, M.E.; Nuyttens, J.J.; Rothbarth, J.; de Wilt, J.H.; Burger, J.W. The importance of a minimal tumor-free resection margin in locally recurrent rectal cancer. Dis. Colon Rectum 2015, 58, 677–685. [Google Scholar] [CrossRef]
- Scollo, C.; Russo, M.; Trovato, M.A.; Sambataro, D.; Giuffrida, D.; Manusia, M.; Sapuppo, G.; Malandrino, P.; Vigneri, R.; Pellegriti, G. Prognostic Factors for Adrenocortical Carcinoma Outcomes. Front. Endocrinol. 2016, 7, 99. [Google Scholar] [CrossRef] [Green Version]
- Jacobs, L. Positive margins: The challenge continues for breast surgeons. Ann. Surg. Oncol. 2008, 15, 1271–1272. [Google Scholar] [CrossRef] [Green Version]
- Jeevan, R.; Cromwell, D.; Trivella, M.; Lawrence, G.; Kearins, O.; Pereira, J.; Sheppard, C.; Caddy, C.; Van Der Meulen, J. Reoperation rates after breast conserving surgery for breast cancer among women in England: Retrospective study of hospital episode statistics. BMJ 2012, 345. [Google Scholar] [CrossRef] [PubMed] [Green Version]
- Jorns, J.M.; Visscher, D.; Sabel, M.; Breslin, T.; Healy, P.; Daignaut, S.; Myers, J.L.; Wu, A.J. Intraoperative frozen section analysis of margins in breast conserving surgery significantly decreases reoperative rates: One-year experience at an ambulatory surgical center. Am. J. Clin. Pathol. 2012, 138, 657–669. [Google Scholar] [CrossRef] [Green Version]
- Wang, Y.W.; Doerksen, J.D.; Kang, S.; Walsh, D.; Yang, Q.; Hong, D.; Liu, J.T.C. multiplexed molecular imaging of fresh tissue surfaces enabled by convection-enhanced topical staining with SERS-coded nanoparticles. Small 2016, 12, 5612–5621. [Google Scholar] [CrossRef] [PubMed]
- Aldousari, S.; Kassouf, W. Update on the management of non-muscle invasive bladder cancer. Can. Urol. Assoc. J. 2010, 4, 56. [Google Scholar] [CrossRef] [PubMed] [Green Version]
- Schwaibold, H.E.; Sivalingam, S.; May, F.; Hartung, R. The value of a second transurethral resection for T1 bladder cancer. BJU Int. 2006, 97, 1199–1201. [Google Scholar] [CrossRef] [PubMed]
- Davis, R.M.; Kiss, B.; Trivedi, D.R.; Metzner, T.J.; Liao, J.C.; Gambhir, S.S. Surface-enhanced raman scattering nanoparticles for multiplexed imaging of bladder cancer tissue permeability and molecular phenotype. ACS Nano 2018, 12, 9669–9679. [Google Scholar] [CrossRef] [PubMed]
- Bovenkamp, D.; Sentosa, R.; Rank, E.; Erkkilä, M.T.; Placzek, F.; Püls, J.; Drexler, W.; Leitgeb, R.A.; Garstka, N.; Shariat, S.F. Combination of high-resolution optical coherence tomography and raman spectroscopy for improved staging and grading in bladder cancer. Appl. Sci. 2018, 8, 2371. [Google Scholar] [CrossRef] [Green Version]
- Pope, I.; Masia, F.; Ewan, K.; Jimenez-Pascual, A.; Dale, T.C.; Siebzehnrubl, F.A.; Borri, P.; Langbein, W. Identifying subpopulations in multicellular systems by quantitative chemical imaging using label-free hyperspectral CARS microscopy. Analyst 2021, 146, 2277–2291. [Google Scholar] [CrossRef] [PubMed]
- Aubertin, K.; Desroches, J.; Jermyn, M.; Trinh, V.Q.; Saad, F.; Trudel, D.; Leblond, F. Combining high wavenumber and fingerprint Raman spectroscopy for the detection of prostate cancer during radical prostatectomy. Biomed. Opt. Express 2018, 9, 4294–4305. [Google Scholar] [CrossRef] [PubMed]
- Galletly, N.P.; McGinty, J.; Dunsby, C.; Teixeira, F.; Requejo-Isidro, J.; Munro, I.; Elson, D.S.; Neil, M.A.A.; Chu, A.C.; French, P.M.W.; et al. Fluorescence lifetime imaging distinguishes basal cell carcinoma from surrounding uninvolved skin. Br. J. Dermatol. 2008, 159, 152–161. [Google Scholar] [CrossRef]
- Patalay, R.; Talbot, C.; Munro, I.; Breunig, H.G.; König, K.; Alexandrov, Y.; Warren, S.; Neil, M.; French, P.M.; Chu, A.; et al. Fluorescence Lifetime Imaging of Skin Cancer; SPIE: Bellingham, WA, USA, 2011; Volume 7883. [Google Scholar]
- Seidenari, S.; Arginelli, F.; Dunsby, C.; French, P.; König, K.; Magnoni, C.; Manfredini, M.; Talbot, C.; Ponti, G. Multiphoton laser tomography and fluorescence lifetime imaging of basal cell carcinoma: Morphologic features for non-invasive diagnostics. Exp. Dermatol. 2012, 21, 831–836. [Google Scholar] [CrossRef]
- Miller, J.P.; Habimana-Griffin, L.; Edwards, T.S.; Achilefu, S. Multimodal fluorescence molecular imaging for in vivo characterization of skin cancer using endogenous and exogenous fluorophores. J. Biomed. Opt. 2017, 22, 066007. [Google Scholar] [CrossRef] [Green Version]
- McGinty, J.; Galletly, N.P.; Dunsby, C.; Munro, I.; Elson, D.S.; Requejo-Isidro, J.; Cohen, P.; Ahmad, R.; Forsyth, A.; Thillainayagam, A.V.; et al. Wide-field fluorescence lifetime imaging of cancer. Biomed. Opt. Express 2010, 1, 627–640. [Google Scholar] [CrossRef] [PubMed] [Green Version]
- Wang, Y.; Song, C.; Wang, M.; Xie, Y.; Mi, L.; Wang, G. Rapid, label-free, and highly sensitive detection of cervical cancer with fluorescence lifetime imaging microscopy. IEEE J. Sel. Top. Quantum Electron. 2015, 22, 228–234. [Google Scholar] [CrossRef]
- Rueck, A.C.; Hauser, C.; Mosch, S.; Kalinina, S. Spectrally resolved fluorescence lifetime imaging to investigate cell metabolism in malignant and nonmalignant oral mucosa cells. J. Biomed. Opt. 2014, 19, 096005. [Google Scholar] [CrossRef]
- Skala, M.C.; Riching, K.M.; Bird, D.K.; Gendron-Fitzpatrick, A.; Eickhoff, J.; Eliceiri, K.W.; Keely, P.J.; Ramanujam, N. In vivo multiphoton fluorescence lifetime imaging of protein-bound and free nicotinamide adenine dinucleotide in normal and precancerous epithelia. J. Biomed. Opt. 2007, 12, 024014. [Google Scholar] [CrossRef] [Green Version]
- Pastore, M.N.; Studier, H.; Bonder, C.S.; Roberts, M.S. Non-invasive metabolic imaging of melanoma progression. Exp. Dermatol. 2017, 26, 607–614. [Google Scholar] [CrossRef]
- Wadiura, L.I.; Reichert, D.; Sperl, V.; Lang, A.; Kiesel, B.; Erkkilae, M.; Wöhrer, A.; Furtner, J.; Roetzer, T.; Leitgeb, R. Influence of dexamethasone on visible 5-ALA fluorescence and quantitative protoporphyrin IX accumulation measured by fluorescence lifetime imaging in glioblastomas: Is pretreatment obligatory before fluorescence-guided surgery? J. Neurosurg. 2021, 1, 1–9. [Google Scholar] [CrossRef] [PubMed]
- Ngan, H.Y.; Hsu, C.; Wong, L.C.; Ma, H.K. The value of cervical punch biopsy in the assessment of histopathological prognostic factors in carcinoma of the cervix. Asia Ocean. J. Obstet. Gynaecol. 1988, 14, 467–470. [Google Scholar] [CrossRef] [PubMed]
- Yao, X.; Gomes, M.M.; Tsao, M.S.; Allen, C.J.; Geddie, W.; Sekhon, H. Fine-needle sspiration biopsy versus core-needle biopsy in diagnosing lung cancer: A systematic review. Curr. Oncol. 2012, 19, 16–27. [Google Scholar] [CrossRef] [Green Version]
- Blakeslee, D.; Vaughan, C.W.; Simpson, G.T.; Shapshay, S.M.; Strong, M.S. Excisional biopsy in the selective management of T1glottic cancer: A three-year follow-up study. Laryngoscope 1984, 94, 488–494. [Google Scholar] [CrossRef] [PubMed]
- Efthymiou, M.; Taylor, A.; Desmond, P.; Allen, P.; Chen, R. Biopsy forceps is inadequate for the resection of diminutive polyps. Endoscopy 2011, 43, 312–316. [Google Scholar] [CrossRef] [Green Version]
- Fahey, M.T.; Irwig, L.; Macaskill, P. Meta-analysis of Pap test accuracy. Am. J. Epidemiol. 1995, 141, 680–689. [Google Scholar] [CrossRef]
- Jo, J.A.; Cheng, S.; Cuenca-Martinez, R.; Duran-Sierra, E.; Malik, B.; Ahmed, B.; Maitland, K.; Cheng, Y.-S.L.; Wright, J.; Reese, T. Endogenous fluorescence lifetime imaging (FLIM) endoscopy for early detection of oral cancer and dysplasia. In Proceedings of the 40th Annual International Conference of the IEEE Engineering in Medicine and Biology Society (EMBC), Honolulu, HI, USA, 17–21 July 2018; pp. 3009–3012. [Google Scholar]
- Duran-Sierra, E.; Cheng, S.; Cuenca-Martinez, R.; Malik, B.; Maitland, K.C.; Cheng, Y.L.; Wright, J.; Ahmed, B.; Ji, J.; Martinez, M. Clinical label-free biochemical and metabolic fluorescence lifetime endoscopic imaging of precancerous and cancerous oral lesions. Oral Oncol. 2020, 105, 104635. [Google Scholar] [CrossRef]
- Lagarto, J.L.; Shcheslavskiy, V.; Pavone, F.S.; Cicchi, R. Real-time fiber-based fluorescence lifetime imaging with synchronous external illumination: A new path for clinical translation. J. Biophotonics 2020, 13, e201960119. [Google Scholar] [CrossRef]
- Marsden, M.; Weyers, B.; Fukazawa, T.; Sun, T.; Bec, J.; Gandour-Edwards, R.F.; Gui, D.; Birkeland, A.C.; Bewley, A.F.; Abouyared, M. Intraoperative margin assessment in head and neck cancer using label-free fluorescence lifetime imaging, machine learning and visualization. In Proceedings of the Advanced Biomedical and Clinical Diagnostic and Surgical Guidance Systems XIX, Online. 6–11 March 2021; p. 116310N. [Google Scholar]
- Lee, J.; Kim, B.; Park, B.; Won, Y.; Kim, S.-Y.; Lee, S. Real-time cancer diagnosis of breast cancer using fluorescence lifetime endoscopy based on the pH. Sci. Rep. 2021, 11, 1–12. [Google Scholar]
- Shim, M.G.; Wong Kee Song, L.-M.; Marcon, N.E.; Wilson, B.C. In vivo near-infrared raman spectroscopy: Demonstration of feasibility during clinical gastrointestinal endoscopy. Photochem. Photobiol. 2000, 72, 146–150. [Google Scholar] [CrossRef]
- Molckovsky, A.; Song, L.-M.W.K.; Shim, M.G.; Marcon, N.E.; Wilson, B.C. Diagnostic potential of near-infrared Raman spectroscopy in the colon: Differentiating adenomatous from hyperplastic polyps. Gastrointest. Endosc. 2003, 57, 396–402. [Google Scholar] [CrossRef]
- Bergholt, M.S.; Zheng, W.; Lin, K.; Ho, K.Y.; Teh, M.; Yeoh, K.G.; Yan So, J.B.; Huang, Z. In vivo diagnosis of gastric cancer using Raman endoscopy and ant colony optimization techniques. Int. J. Cancer 2011, 128, 2673–2680. [Google Scholar] [CrossRef]
- Bergholt, M.S.; Zheng, W.; Lin, K.; Wang, J.; Xu, H.; Ren, J.-l.; Ho, K.Y.; Teh, M.; Yeoh, K.G.; Huang, Z. Characterizing variability of in vivo Raman spectroscopic properties of different anatomical sites of normal colorectal tissue towards cancer diagnosis at colonoscopy. Anal. Chem. 2015, 87, 960–966. [Google Scholar] [CrossRef] [PubMed]
- Petersen, D.; Naveed, P.; Ragheb, A.; Niedieker, D.; El-Mashtoly, S.; Brechmann, T.; Kötting, C.; Schmiegel, W.; Freier, E.; Pox, C. Raman fiber-optical method for colon cancer detection: Cross-validation and outlier identification approach. Spectrochim. Acta Part A Mol. Biomol. Spectrosc. 2017, 181, 270–275. [Google Scholar] [CrossRef] [PubMed]
- Desroches, J.; Jermyn, M.; Mok, K.; Lemieux-Leduc, C.; Mercier, J.; St-Arnaud, K.; Urmey, K.; Guiot, M.-C.; Marple, E.; Petrecca, K.; et al. Characterization of a Raman spectroscopy probe system for intraoperative brain tissue classification. Biomed. Opt. Express 2015, 6, 2380–2397. [Google Scholar] [CrossRef] [PubMed] [Green Version]
- Jermyn, M.; Mercier, J.; Aubertin, K.; Desroches, J.; Urmey, K.; Karamchandiani, J.; Marple, E.; Guiot, M.-C.; Leblond, F.; Petrecca, K. Highly accurate detection of cancer in situ with intraoperative, label-free, multimodal optical spectroscopy. Cancer Res. 2017, 77, 3942–3950. [Google Scholar] [CrossRef] [PubMed] [Green Version]
- Desroches, J.; Jermyn, M.; Pinto, M.; Picot, F.; Tremblay, M.-A.; Obaid, S.; Marple, E.; Urmey, K.; Trudel, D.; Soulez, G.; et al. A new method using Raman spectroscopy for in vivo targeted brain cancer tissue biopsy. Sci. Rep. 2018, 8, 1792. [Google Scholar] [CrossRef]
- Bergholt, M.S.; Zheng, W.; Ho, K.Y.; Teh, M.; Yeoh, K.G.; Yan So, J.B.; Shabbir, A.; Huang, Z. Fiberoptic confocal raman spectroscopy for real-time in vivo diagnosis of dysplasia in Barrett’s esophagus. Gastroenterology 2014, 146, 27–32. [Google Scholar] [CrossRef]
- Draga, R.O.P.; Grimbergen, M.C.M.; Vijverberg, P.L.M.; van Swol, C.F.P.; Jonges, T.G.N.; Kummer, J.A.; Ruud Bosch, J.L.H. In vivo bladder cancer diagnosis by high-volume Raman spectroscopy. Anal. Chem. 2010, 82, 5993–5999. [Google Scholar] [CrossRef]
- Singh, S.P.; Deshmukh, A.; Chaturvedi, P.; Murali Krishna, C. In vivo Raman spectroscopic identification of premalignant lesions in oral buccal mucosa. J. Biomed. Opt. 2012, 17, 105002. [Google Scholar] [CrossRef]
- Haka, A.S.; Volynskaya, Z.; Gardecki, J.A.; Nazemi, J.; Lyons, J.; Hicks, D.; Fitzmaurice, M.; Dasari, R.R.; Crowe, J.P.; Feld, M.S. In vivo margin assessment during partial mastectomy breast surgery using raman spectroscopy. Cancer Res. 2006, 66, 3317–3322. [Google Scholar] [CrossRef] [Green Version]
- Bergholt, M.S.; Lin, K.; Zheng, W.; Lau, D.P.; Huang, Z. In vivo, real-time, transnasal, image-guided Raman endoscopy: Defining spectral properties in the nasopharynx and larynx. J. Biomed. Opt. 2012, 17, 077002. [Google Scholar] [CrossRef] [Green Version]
- Lin, K.; Cheng, D.L.P.; Huang, Z. Optical diagnosis of laryngeal cancer using high wavenumber Raman spectroscopy. Biosens. Bioelectron. 2012, 35, 213–217. [Google Scholar] [CrossRef]
- Short, M.A.; Lam, S.; McWilliams, A.; Zhao, J.; Lui, H.; Zeng, H. Development and preliminary results of an endoscopic Raman probe for potential in vivo diagnosis of lung cancers. Opt. Lett. 2008, 33, 711–713. [Google Scholar] [CrossRef]
- Mahadevan-Jansen, A.; Mitchell, M.F.; Ramanujam, N.; Utzinger, U.; Richards-Kortum, R. Development of a fiber optic probe to measure NIR Raman spectra of cervical tissue in vivo. Photochem. Photobiol. 1998, 68, 427–431. [Google Scholar] [CrossRef]
- Buschman, H.P.; Marple, E.T.; Wach, M.L.; Bennett, B.; Bakker Schut, T.C.; Bruining, H.A.; Bruschke, A.V.; van der Laarse, A.; Puppels, G.J. In vivo determination of the molecular composition of artery wall by intravascular Raman spectroscopy. Anal. Chem. 2000, 72, 3771–3775. [Google Scholar] [CrossRef] [PubMed]
- Komachi, Y.; Sato, H.; Aizawa, K.; Tashiro, H. Micro-optical fiber probe for use in an intravascular Raman endoscope. Appl. Opt. 2005, 44, 4722–4732. [Google Scholar] [CrossRef]
- Hattori, Y.; Komachi, Y.; Asakura, T.; Shimosegawa, T.; Kanai, G.-I.; Tashiro, H.; Sato, H. In vivo raman study of the living rat esophagus and stomach using a micro-Raman probe under an endoscope. Appl. Spectrosc. 2007, 61, 579–584. [Google Scholar] [CrossRef] [PubMed]
- Chundayil Madathil, G.; Iyer, S.; Thankappan, K.; Gowd, G.S.; Nair, S.; Koyakutty, M. A Novel surface enhanced Raman catheter for rapid detection, classification, and grading of oral cancer. Adv. Healthc. Mater. 2019, 8, e1801557. [Google Scholar] [CrossRef]
- Jayhooni, S.M.H.; Short, M.; Assadsangabi, B.; Hohert, G.; Du, C.; Zeng, H.; Takahata, K. Side-viewing endoscopic Raman spectroscopy for angle-resolved analysis of luminal organs. Adv. Mater. Technol. 2019, 4, 1900364. [Google Scholar] [CrossRef]
- Huang, Z.; Teh, S.K.; Zheng, W.; Mo, J.; Lin, K.; Shao, X.; Ho, K.Y.; Teh, M.; Yeoh, K.G. Integrated Raman spectroscopy and trimodal wide-field imaging techniques for real-time in vivo tissue Raman measurements at endoscopy. Opt. Lett. 2009, 34, 758–760. [Google Scholar] [CrossRef] [PubMed]
- Lin, D.; Qiu, S.; Huang, W.; Pan, J.; Xu, Z.; Chen, R.; Feng, S.; Chen, G.; Li, Y.; Short, M.; et al. Autofluorescence and white light imaging-guided endoscopic Raman and diffuse reflectance spectroscopy for in vivo nasopharyngeal cancer detection. J. Biophotonics 2018, 11, e201700251. [Google Scholar] [CrossRef]
- Dochow, S.; Ma, D.; Latka, I.; Bocklitz, T.; Hartl, B.; Bec, J.; Fatakdawala, H.; Marple, E.; Urmey, K.; Wachsmann-Hogiu, S.; et al. Combined fiber probe for fluorescence lifetime and Raman spectroscopy. Anal. Bioanal. Chem. 2015, 407, 8291–8301. [Google Scholar] [CrossRef]
- Katt, M.E.; Placone, A.L.; Wong, A.D.; Xu, Z.S.; Searson, P.C. In vitro tumor models: Advantages, disadvantages, variables, and selecting the right platform. Front. Bioeng. Biotechnol. 2016, 4, 12. [Google Scholar] [CrossRef] [PubMed]
- Pauli, C.; Hopkins, B.D.; Prandi, D.; Shaw, R.; Fedrizzi, T.; Sboner, A.; Sailer, V.; Augello, M.; Puca, L.; Rosati, R. Personalized in vitro and in vivo cancer models to guide precision medicine. Cancer Discov. 2017, 7, 462–477. [Google Scholar] [CrossRef] [PubMed] [Green Version]
- Cunningham, D.; You, Z. In vitro and in vivo model systems used in prostate cancer research. J. Biol. Methods 2015, 2, e17. [Google Scholar] [CrossRef] [Green Version]
- Unger, C.; Kramer, N.; Walzl, A.; Scherzer, M.; Hengstschläger, M.; Dolznig, H. Modeling human carcinomas: Physiologically relevant 3D models to improve anti-cancer drug development. Adv. Drug Deliv. Rev. 2014, 79, 50–67. [Google Scholar] [CrossRef] [PubMed]
- Harrison, R.G. Observations on the living developing nerve fiber. Proc. Soc. Exp. Biol. Med. 1906, 4, 140–143. [Google Scholar] [CrossRef]
- Scudiero, D.A.; Shoemaker, R.H.; Paull, K.D.; Monks, A.; Tierney, S.; Nofziger, T.H.; Currens, M.J.; Seniff, D.; Boyd, M.R. Evaluation of a soluble tetrazolium/formazan assay for cell growth and drug sensitivity in culture using human and other tumor cell lines. Cancer Res. 1988, 48, 4827–4833. [Google Scholar]
- Harrison, R.G. The outgrowth of the nerve fiber as a mode of protoplasmic movement. J. Exp. Zool. 1959, 142, 5–73. [Google Scholar] [CrossRef]
- Gomez-Lechon, M.; Donato, M.; Lahoz, A.; Castell, J. Cell lines: A tool for in vitro drug metabolism studies. Curr. Drug Metab. 2008, 9, 1–11. [Google Scholar] [CrossRef] [PubMed]
- Ryan, J.A. Introduction to animal cell culture. Tech. Bull. 2008, 278. [Google Scholar] [CrossRef] [Green Version]
- Yang, W.; Soares, J.; Greninger, P.; Edelman, E.J.; Lightfoot, H.; Forbes, S.; Bindal, N.; Beare, D.; Smith, J.A.; Thompson, I.R.; et al. Genomics of drug sensitivity in cancer (GDSC): A resource for therapeutic biomarker discovery in cancer cells. Nucleic Acids Res. 2013, 41, D955–D961. [Google Scholar] [CrossRef] [Green Version]
- Shoemaker, R.H. The NCI60 human tumour cell line anticancer drug screen. Nat. Rev. Cancer 2006, 6, 813–823. [Google Scholar] [CrossRef]
- Antoni, D.; Burckel, H.; Josset, E.; Noel, G. Three-dimensional cell culture: A breakthrough in vivo. Int. J. Mol. Sci. 2015, 16, 5517–5527. [Google Scholar] [CrossRef] [PubMed]
- Lai, Y.; Asthana, A.; Kisaalita, W.S. Biomarkers for simplifying HTS 3D cell culture platforms for drug discovery: The case for cytokines. Drug Discov. Today 2011, 16, 293–297. [Google Scholar] [CrossRef]
- Edmondson, R.; Broglie, J.J.; Adcock, A.F.; Yang, L. Three-dimensional cell culture systems and their applications in drug discovery and cell-based biosensors. Assay Drug Dev. Technol. 2014, 12, 207–218. [Google Scholar] [CrossRef] [Green Version]
- Chwalek, K.; Bray, L.J.; Werner, C. Tissue-engineered 3D tumor angiogenesis models: Potential technologies for anti-cancer drug discovery. Adv. Drug Deliv. Rev. 2014, 79, 30–39. [Google Scholar] [CrossRef] [PubMed] [Green Version]
- Fong, E.L.; Harrington, D.A.; Farach-Carson, M.C.; Yu, H. Heralding a new paradigm in 3D tumor modeling. Biomaterials 2016, 108, 197–213. [Google Scholar] [CrossRef] [Green Version]
- Friedrich, J.; Seidel, C.; Ebner, R.; Kunz-Schughart, L.A. Spheroid-based drug screen: Considerations and practical approach. Nat. Protoc. 2009, 4, 309–324. [Google Scholar] [CrossRef]
- Simian, M.; Bissell, M.J. Organoids: A historical perspective of thinking in three dimensions. J. Cell Biol. 2017, 216, 31–40. [Google Scholar] [CrossRef]
- Sutherland, R.M.; McCredie, J.A.; Inch, W.R. Growth of multicell spheroids in tissue culture as a model of nodular carcinomas. J. Natl. Cancer Inst. 1971, 46, 113–120. [Google Scholar] [PubMed]
- Tchoryk, A.; Taresco, V.; Argent, R.H.; Ashford, M.; Gellert, P.R.; Stolnik, S.; Grabowska, A.; Garnett, M.C. Penetration and uptake of nanoparticles in 3D tumor spheroids. Bioconjug. Chem. 2019, 30, 1371–1384. [Google Scholar] [CrossRef]
- Leek, R.; Grimes, D.R.; Harris, A.L.; McIntyre, A. Methods: Using three-dimensional culture (Spheroids) as an in vitro model of tumour hypoxia. Adv. Exp. Med. Biol. 2016, 899, 167–196. [Google Scholar] [CrossRef] [PubMed]
- Sato, T.; Vries, R.G.; Snippert, H.J.; Van De Wetering, M.; Barker, N.; Stange, D.E.; Van Es, J.H.; Abo, A.; Kujala, P.; Peters, P.J. Single Lgr5 stem cells build crypt-villus structures in vitro without a mesenchymal niche. Nature 2009, 459, 262–265. [Google Scholar] [CrossRef] [PubMed]
- Kuperwasser, C.; Chavarria, T.; Wu, M.; Magrane, G.; Gray, J.W.; Carey, L.; Richardson, A.; Weinberg, R.A. Reconstruction of functionally normal and malignant human breast tissues in mice. Proc. Natl. Acad. Sci. USA 2004, 101, 4966–4971. [Google Scholar] [CrossRef] [Green Version]
- Gunti, S.; Hoke, A.T.K.; Vu, K.P.; London, N.R., Jr. Organoid and spheroid tumor models: Techniques and applications. Cancers 2021, 13, 874. [Google Scholar] [CrossRef]
- Gilazieva, Z.; Ponomarev, A.; Rutland, C.; Rizvanov, A.; Solovyeva, V. Promising applications of tumor spheroids and organoids for personalized medicine. Cancers 2020, 12, 2727. [Google Scholar] [CrossRef]
- Lee, G.Y.; Kenny, P.A.; Lee, E.H.; Bissell, M.J. Three-dimensional culture models of normal and malignant breast epithelial cells. Nat. Methods 2007, 4, 359–365. [Google Scholar] [CrossRef] [Green Version]
- Marusyk, A.; Tabassum, D.P.; Janiszewska, M.; Place, A.E.; Trinh, A.; Rozhok, A.I.; Pyne, S.; Guerriero, J.L.; Shu, S.; Ekram, M.; et al. Spatial Proximity to Fibroblasts Impacts Molecular Features and Therapeutic Sensitivity of Breast Cancer Cells Influencing Clinical Outcomes. Cancer Res. 2016, 76, 6495–6506. [Google Scholar] [CrossRef] [Green Version]
- Dijkstra, K.K.; Cattaneo, C.M.; Weeber, F.; Chalabi, M.; van de Haar, J.; Fanchi, L.F.; Slagter, M.; van der Velden, D.L.; Kaing, S.; Kelderman, S.; et al. Generation of tumor-reactive T cells by co-culture of peripheral blood lymphocytes and tumor organoids. Cell 2018, 174, 1586–1598.e1512. [Google Scholar] [CrossRef] [Green Version]
- Öhlund, D.; Handly-Santana, A.; Biffi, G.; Elyada, E.; Almeida, A.S.; Ponz-Sarvise, M.; Corbo, V.; Oni, T.E.; Hearn, S.A.; Lee, E.J.; et al. Distinct populations of inflammatory fibroblasts and myofibroblasts in pancreatic cancer. J. Exp. Med. 2017, 214, 579–596. [Google Scholar] [CrossRef] [PubMed]
- Neal, J.T.; Li, X.; Zhu, J.; Giangarra, V.; Grzeskowiak, C.L.; Ju, J.; Liu, I.H.; Chiou, S.H.; Salahudeen, A.A.; Smith, A.R.; et al. Organoid modeling of the tumor immune microenvironment. Cell 2018, 175, 1972–1988.e1916. [Google Scholar] [CrossRef] [PubMed] [Green Version]
- Warburg, O.; Minami, S. Versuche an überlebendem carcinom-gewebe. Klin. Wochenschr. 1923, 2, 776–777. [Google Scholar] [CrossRef]
- Leighton, J. A sponge matrix method for tissue culture; formation of organized aggregates of cells in vitro. J. Natl. Cancer Inst. 1951, 12, 545–561. [Google Scholar]
- Krumdieck, C.L.; dos Santos, J.E.; Ho, K.J. A new instrument for the rapid preparation of tissue slices. Anal. Biochem. 1980, 104, 118–123. [Google Scholar] [CrossRef]
- Powley, I.R.; Patel, M.; Miles, G.; Pringle, H.; Howells, L.; Thomas, A.; Kettleborough, C.; Bryans, J.; Hammonds, T.; MacFarlane, M. Patient-derived explants (PDEs) as a powerful preclinical platform for anti-cancer drug and biomarker discovery. Br. J. Cancer 2020, 122, 735–744. [Google Scholar] [CrossRef] [Green Version]
- Przystal, J.M.; Becker, H.; Canjuga, D.; Tsiami, F.; Anderle, N.; Keller, A.-L.; Pohl, A.; Ries, C.H.; Schmittnaegel, M.; Korinetska, N.; et al. Targeting CSF1R alone or in combination with PD1 in experimental glioma. Cancers 2021, 13, 2400. [Google Scholar] [CrossRef]
- Zhang, Z.; Chen, Y.C.; Urs, S.; Chen, L.; Simeone, D.M.; Yoon, E. Scalable multiplexed drug-combination screening platforms using 3D microtumor model for precision medicine. Small 2018, 14, 1703617. [Google Scholar] [CrossRef]
- Neef, S.K.; Janssen, N.; Winter, S.; Wallisch, S.K.; Hofmann, U.; Dahlke, M.H.; Schwab, M.; Mürdter, T.E.; Haag, M. Metabolic drug response phenotyping in colorectal cancer organoids by LC-QTOF-MS. Metabolites 2020, 10, 494. [Google Scholar] [CrossRef] [PubMed]
- Schneckenburger, H.; Koenig, K. Fluorescence decay kinetics and imaging of NAD(P)H and flavins as metabolic indicators. Opt. Eng. 1992, 31. [Google Scholar] [CrossRef]
- Cong, A.; Pimenta, R.M.L.; Lee, H.B.; Mereddy, V.; Holy, J.; Heikal, A.A. Two-photon fluorescence lifetime imaging of intrinsic NADH in three-dimensional tumor models. Cytom. Part A 2019, 95, 80–92. [Google Scholar] [CrossRef] [Green Version]
- Chen, L.B. Mitochondrial membrane potential in living cells. Annu. Rev. Cell Biol. 1988, 4, 155–181. [Google Scholar] [CrossRef] [PubMed]
- Heerdt, B.G.; Houston, M.A.; Augenlicht, L.H. Growth properties of colonic tumor cells are a function of the intrinsic mitochondrial membrane potential. Cancer Res. 2006, 66, 1591–1596. [Google Scholar] [CrossRef] [Green Version]
- Okkelman, I.A.; Papkovsky, D.B.; Dmitriev, R.I. Estimation of the mitochondrial membrane potential using fluorescence lifetime imaging microscopy. Cytom. Part A 2020, 97, 471–482. [Google Scholar] [CrossRef]
- Martín-Villar, E.; Fernández-Muñoz, B.; Parsons, M.; Yurrita, M.M.; Megías, D.; Pérez-Gómez, E.; Jones, G.E.; Quintanilla, M. Podoplanin associates with CD44 to promote directional cell migration. Mol. Biol. Cell 2010, 21, 4387–4399. [Google Scholar] [CrossRef] [Green Version]
- McGhee, E.J.; Morton, J.P.; Von Kriegsheim, A.; Schwarz, J.P.; Karim, S.A.; Carragher, N.O.; Sansom, O.; Anderson, K.I.; Timpson, P. FLIM-FRET imaging in vivo reveals 3D-environment spatially regulates RhoGTPase activity during cancer cell invasion. Small GTPases 2011, 2, 747–757. [Google Scholar] [CrossRef] [PubMed] [Green Version]
- Pajic, M.; Herrmann, D.; Vennin, C.; Conway, J.R.W.; Chin, V.T.; Johnsson, A.-K.E.; Welch, H.C.E.; Timpson, P. The dynamics of Rho GTPase signaling and implications for targeting cancer and the tumor microenvironment. Small GTPases 2015, 6, 123–133. [Google Scholar] [CrossRef] [Green Version]
- Nobis, M.; Herrmann, D.; Warren, S.C.; Kadir, S.; Leung, W.; Killen, M.; Magenau, A.; Stevenson, D.; Lucas, M.C.; Reischmann, N.; et al. A RhoA-FRET biosensor mouse for intravital imaging in normal tissue homeostasis and disease contexts. Cell Rep. 2017, 21, 274–288. [Google Scholar] [CrossRef] [Green Version]
- Miller, C.R.; Nichols, M.G. Metabolic profiling of the skin to monitor the onset and progression of squamous cell carcinoma through time-and wavelength-resolved fluorescence lifetime imaging. Biophys. J. 2015, 108, 478a. [Google Scholar] [CrossRef] [Green Version]
- Porter, A.G.; Jänicke, R.U. Emerging roles of caspase-3 in apoptosis. Cell Death Differ. 1999, 6, 99–104. [Google Scholar] [CrossRef]
- Devarajan, E.; Sahin, A.A.; Chen, J.S.; Krishnamurthy, R.R.; Aggarwal, N.; Brun, A.-M.; Sapino, A.; Zhang, F.; Sharma, D.; Yang, X.-H. Down-regulation of caspase 3 in breast cancer: A possible mechanism for chemoresistance. Oncogene 2002, 21, 8843–8851. [Google Scholar] [CrossRef] [Green Version]
- Xiao, A.; Gibbons, A.E.; Luker, K.E.; Luker, G.D. Fluorescence Lifetime Imaging of Apoptosis. Tomography 2015, 1, 115–124. [Google Scholar] [CrossRef]
- Keese, M.; Yagublu, V.; Schwenke, K.; Post, S.; Bastiaens, P. Fluorescence lifetime imaging microscopy of chemotherapy-induced apoptosis resistance in a syngenic mouse tumor model. Int. J. Cancer 2010, 126, 104–113. [Google Scholar] [CrossRef] [PubMed]
- Coban, O.; Zanetti-Dominguez, L.C.; Matthews, D.R.; Rolfe, D.J.; Weitsman, G.; Barber, P.R.; Barbeau, J.; Devauges, V.; Kampmeier, F.; Winn, M. Effect of phosphorylation on EGFR dimer stability probed by single-molecule dynamics and FRET/FLIM. Biophys. J. 2015, 108, 1013–1026. [Google Scholar] [CrossRef] [PubMed] [Green Version]
- Waterhouse, B.R.; Gijsen, M.; Barber, P.R.; Tullis, I.D.C.; Vojnovic, B.; Kong, A. Assessment of EGFR/HER2 dimerization by FRET-FLIM utilizing Alexa-conjugated secondary antibodies in relation to targeted therapies in cancers. Oncotarget 2011, 2, 728–736. [Google Scholar] [CrossRef] [PubMed] [Green Version]
- Trédan, O.; Galmarini, C.M.; Patel, K.; Tannock, I.F. Drug resistance and the solid tumor microenvironment. J. Natl. Cancer Inst. 2007, 99, 1441–1454. [Google Scholar] [CrossRef] [Green Version]
- Lyssiotis, C.A.; Kimmelman, A.C. Metabolic interactions in the tumor microenvironment. Trends Cell Biol. 2017, 27, 863–875. [Google Scholar] [CrossRef] [Green Version]
- Hashim, A.I.; Zhang, X.; Wojtkowiak, J.W.; Martinez, G.V.; Gillies, R.J. Imaging pH and metastasis. NMR Biomed. 2011, 24, 582–591. [Google Scholar] [CrossRef]
- O’Donnell, N.; Okkelman, I.A.; Timashev, P.; Gromovykh, T.I.; Papkovsky, D.B.; Dmitriev, R.I. Cellulose-based scaffolds for fluorescence lifetime imaging-assisted tissue engineering. Acta Biomater. 2018, 80, 85–96. [Google Scholar] [CrossRef]
- Chin, L.; Andersen, J.N.; Futreal, P.A. Cancer genomics: From discovery science to personalized medicine. Nat. Med. 2011, 17, 297–303. [Google Scholar] [CrossRef]
- Diamandis, M.; White, N.M.; Yousef, G.M. Personalized medicine: Marking a new epoch in cancer patient management. Mol. Cancer Res. 2010, 8, 1175–1187. [Google Scholar] [CrossRef] [Green Version]
- Fenstermacher, D.A.; Wenham, R.M.; Rollison, D.E.; Dalton, W.S. Implementing personalized medicine in a cancer center. Cancer J. 2011, 17, 528. [Google Scholar] [CrossRef] [Green Version]
- Goetz, M.P.; Sangkuhl, K.; Guchelaar, H.J.; Schwab, M.; Province, M.; Whirl-Carrillo, M.; Symmans, W.F.; McLeod, H.L.; Ratain, M.J.; Zembutsu, H.; et al. Clinical pharmacogenetics implementation consortium (CPIC) guideline for CYP2D6 and tamoxifen therapy. Clin. Pharm. 2018, 103, 770–777. [Google Scholar] [CrossRef] [PubMed] [Green Version]
- Amstutz, U.; Henricks, L.M.; Offer, S.M.; Barbarino, J.; Schellens, J.H.M.; Swen, J.J.; Klein, T.E.; McLeod, H.L.; Caudle, K.E.; Diasio, R.B.; et al. Clinical pharmacogenetics implementation consortium (CPIC) guideline for dihydropyrimidine dehydrogenase genotype and fluoropyrimidine dosing: 2017 update. Clin. Pharm. 2018, 103, 210–216. [Google Scholar] [CrossRef]
- Beall, H.; Prankerd, R.; Sloan, K. Transdermal delivery of 5-fluorouracil (5-FU) through hairless mouse skin by 1-alkyloxycarbonyl-5-FU prodrugs: Physicochemical characterization of prodrugs and correlations with transdermal delivery. Int. J. Pharm. 1994, 111, 223–233. [Google Scholar] [CrossRef]
- Zhang, G.; Moore, D.J.; Sloan, K.B.; Flach, C.R.; Mendelsohn, R. Imaging the prodrug-to-drug transformation of a 5-fluorouracil derivative in skin by confocal Raman microscopy. J. Investig. Dermatol. 2007, 127, 1205–1209. [Google Scholar] [CrossRef] [PubMed] [Green Version]
- Harada, Y.; Dai, P.; Yamaoka, Y.; Ogawa, M.; Tanaka, H.; Nosaka, K.; Akaji, K.; Takamatsu, T. Intracellular dynamics of topoisomerase I inhibitor, CPT-11, by slit-scanning confocal Raman microscopy. Histochem. Cell Biol. 2009, 132, 39–46. [Google Scholar] [CrossRef]
- El-Mashtoly, S.F.; Petersen, D.; Yosef, H.K.; Mosig, A.; Reinacher-Schick, A.; Kötting, C.; Gerwert, K. Label-free imaging of drug distribution and metabolism in colon cancer cells by Raman microscopy. Analyst 2014, 139, 1155–1161. [Google Scholar] [CrossRef] [PubMed]
- Aljakouch, K.; Lechtonen, T.; Yosef, H.K.; Hammoud, M.K.; Alsaidi, W.; Kötting, C.; Mügge, C.; Kourist, R.; El-Mashtoly, S.F.; Gerwert, K. Raman microspectroscopic evidence for the metabolism of a tyrosine kinase inhibitor, neratinib, in cancer cells. Angew. Chem. Int. Ed. Engl. 2018, 57, 7250–7254. [Google Scholar] [CrossRef]
- Liu, L.; Tang, Y.; Dai, S.; Kleitz, F.; Qiao, S.Z. Smart surface-enhanced Raman scattering traceable drug delivery systems. Nanoscale 2016, 8, 12803–12811. [Google Scholar] [CrossRef] [Green Version]
- Huang, J.; Zong, C.; Shen, H.; Cao, Y.; Ren, B.; Zhang, Z. Tracking the intracellular drug release from graphene oxide using surface-enhanced Raman spectroscopy. Nanoscale 2013, 5, 10591–10598. [Google Scholar] [CrossRef]
- Dai, X.; Yue, Z.; Eccleston, M.E.; Swartling, J.; Slater, N.K.H.; Kaminski, C.F. Fluorescence intensity and lifetime imaging of free and micellar-encapsulated doxorubicin in living cells. Nanomed. Nanotechnol. Biol. Med. 2008, 4, 49–56. [Google Scholar] [CrossRef] [PubMed] [Green Version]
- Romero, G.; Qiu, Y.; Murray, R.A.; Moya, S.E. Study of intracellular delivery of doxorubicin from poly(lactide-co-glycolide) nanoparticles by means of fluorescence lifetime imaging and confocal raman microscopy. Macromol. Biosci. 2013, 13, 234–241. [Google Scholar] [CrossRef]
- Saari, H.; Lisitsyna, E.; Rautaniemi, K.; Rojalin, T.; Niemi, L.; Nivaro, O.; Laaksonen, T.; Yliperttula, M.; Vuorimaa-Laukkanen, E. FLIM reveals alternative EV-mediated cellular up-take pathways of paclitaxel. J. Control. Release 2018, 284, 133–143. [Google Scholar] [CrossRef] [PubMed]
- Kirkby, C.J.; de Pablo, J.G.; Tinkler-Hundal, E.; Wood, H.M.; Evans, S.D.; West, N.P. Developing a Raman spectroscopy-based tool to stratify patient response to pre-operative radiotherapy in rectal cancer. Analyst 2021, 146, 581–589. [Google Scholar] [CrossRef]
- Chacko, J.V.; Eliceiri, K.W. Autofluorescence lifetime imaging of cellular metabolism: Sensitivity toward cell density, pH, intracellular, and intercellular heterogeneity. Cytom. Part A 2019, 95, 56–69. [Google Scholar] [CrossRef] [PubMed] [Green Version]
- Zanetti-Domingues, L.C.; Tynan, C.J.; Rolfe, D.J.; Clarke, D.T.; Martin-Fernandez, M. Hydrophobic fluorescent probes introduce artifacts into single molecule tracking experiments due to non-specific binding. PLoS ONE 2013, 8, e74200. [Google Scholar]
- Ning, Y.; Cheng, S.; Wang, J.-X.; Liu, Y.-W.; Feng, W.; Li, F.; Zhang, J.-L. Fluorescence lifetime imaging of upper gastrointestinal pH in vivo with a lanthanide based near-infrared τ probe. Chem. Sci. 2019, 10, 4227–4235. [Google Scholar] [CrossRef] [PubMed] [Green Version]
- Baggaley, E.; Botchway, S.W.; Haycock, J.W.; Morris, H.; Sazanovich, I.V.; Williams, J.G.; Weinstein, J.A. Long-lived metal complexes open up microsecond lifetime imaging microscopy under multiphoton excitation: From FLIM to PLIM and beyond. Chem. Sci. 2014, 5, 879–886. [Google Scholar] [CrossRef] [Green Version]
- Mitchell, A.; Dad, S.; Morgan, C. Selective detection of luminescence from semiconductor quantum dots by nanosecond time-gated imaging with a colour-masked CCD detector. J. Microsc. 2008, 230, 172–176. [Google Scholar] [CrossRef]
- Osterlund, E.J.; Liu, Q.; Andrews, D.W. The use of FLIM-FRET for the detection of mitochondria-associated protein interactions. In Mitochondrial Medicine; Springer: New York, NY, USA, 2015; pp. 395–419. [Google Scholar]
- Lukina, M.; Yashin, K.; Kiseleva, E.E.; Alekseeva, A.; Dudenkova, V.; Zagaynova, E.V.; Bederina, E.; Medyanic, I.; Becker, W.; Mishra, D.; et al. Label-free macroscopic fluorescence lifetime imaging of brain tumors. Front. Oncol. 2021, 11. [Google Scholar] [CrossRef] [PubMed]
- Delhaye, M.; Dhamelincourt, P. Raman microprobe and microscope with laser excitation. J. Raman Spectrosc. 1975, 3, 33–43. [Google Scholar] [CrossRef]
- Ramser, K.K.; Logg, K.I.; Goksör-Ericsson, M.F.; Enger, J.; Kaell, M.; Hanstorp, D. Resonance Raman spectroscopy of optically trapped functional erythrocytes. J. Biomed. Opt. 2004, 9, 593–600. [Google Scholar] [CrossRef] [PubMed] [Green Version]
- Hoshi, Y.; Tamura, M. Detection of dynamic changes in cerebral oxygenation coupled to neuronal function during mental work in man. Neurosci. Lett. 1993, 150, 5–8. [Google Scholar] [CrossRef]
- Beć, K.B.; Grabska, J.; Huck, C.W. Near-infrared spectroscopy in bio-applications. Molecules 2020, 25, 2948. [Google Scholar] [CrossRef]
- Liao, C.-S.; Wang, P.; Huang, C.Y.; Lin, P.; Eakins, G.; Bentley, R.T.; Liang, R.; Cheng, J.-X. In vivo and in situ spectroscopic imaging by a handheld stimulated Raman scattering microscope. ACS Photonics 2017, 5, 947–954. [Google Scholar] [CrossRef]
- Ji, M.; Lewis, S.; Camelo-Piragua, S.; Ramkissoon, S.H.; Snuderl, M.; Venneti, S.; Fisher-Hubbard, A.; Garrard, M.; Fu, D.; Wang, A.C. Detection of human brain tumor infiltration with quantitative stimulated Raman scattering microscopy. Sci. Transl. Med. 2015, 7, 309ra163. [Google Scholar] [CrossRef] [Green Version]
- Zhao, J.; Short, M.A.; Braun, T.A.; Lui, H.; McLean, D.I.; Zeng, H. Clinical Raman measurements under special ambient lighting illumination. J. Biomed. Opt. 2014, 19, 111609. [Google Scholar] [CrossRef] [Green Version]
- Guze, K.; Pawluk, H.C.; Short, M.; Zeng, H.; Lorch, J.; Norris, C.; Sonis, S. Pilot study: Raman spectroscopy in differentiating premalignant and malignant oral lesions from normal mucosa and benign lesions in humans. Head Neck 2015, 37, 511–517. [Google Scholar] [CrossRef]
- Wang, W.; Short, M.A.; Tai, I.T.; Zeng, H. Disposable sheath that facilitates endoscopic Raman spectroscopy. J. Biomed. Opt. 2016, 21, 025001. [Google Scholar] [CrossRef] [PubMed]
- Food and Drug Administration. Performance Standards for Light-Emitting Products. In 21CFR1040.10; 2020; pp. 846–863. Available online: https://www.govinfo.gov/app/details/CFR-2012-title21-vol8/CFR-2012-title21-vol8-part1040/context (accessed on 29 September 2021).
- Rockwell, B.; Thomas, R.; Zimmerman, S. Updates to the ANSI Z136. 1 Standard. In Proceedings of the International Laser Safety Conference, Albuquerque, NM, USA, 23–26 March 2015; pp. 75–77. [Google Scholar]
- Cong, L.; Feng, W.; Yao, Z.; Zhou, X.; Xiao, W. Deep learning model as a new trend in computer-aided diagnosis of tumor pathology for lung cancer. J. Cancer 2020, 11, 3615. [Google Scholar] [CrossRef] [PubMed]
- Riva, M.; Sciortino, T.; Secoli, R.; D’Amico, E.; Moccia, S.; Fernandes, B.; Conti Nibali, M.; Gay, L.; Rossi, M.; De Momi, E. Glioma biopsies Classification Using Raman Spectroscopy and Machine Learning Models on Fresh Tissue Samples. Cancers 2021, 13, 1073. [Google Scholar] [CrossRef] [PubMed]
- Doherty, T.; McKeever, S.; Alattar, N.; Murphy, T.; Gonzalez, C.A.; Rahman, A.; O’Neill, A.; Finn, S.; Kay, E.; Gallagher, W.M. Feature fusion of Raman chemical imaging and digital histopathology using machine learning for prostate cancer detection. Analyst 2021. [Google Scholar] [CrossRef]

Publisher’s Note: MDPI stays neutral with regard to jurisdictional claims in published maps and institutional affiliations. |
© 2021 by the authors. Licensee MDPI, Basel, Switzerland. This article is an open access article distributed under the terms and conditions of the Creative Commons Attribution (CC BY) license (https://creativecommons.org/licenses/by/4.0/).
Share and Cite
Becker, L.; Janssen, N.; Layland, S.L.; Mürdter, T.E.; Nies, A.T.; Schenke-Layland, K.; Marzi, J. Raman Imaging and Fluorescence Lifetime Imaging Microscopy for Diagnosis of Cancer State and Metabolic Monitoring. Cancers 2021, 13, 5682. https://doi.org/10.3390/cancers13225682
Becker L, Janssen N, Layland SL, Mürdter TE, Nies AT, Schenke-Layland K, Marzi J. Raman Imaging and Fluorescence Lifetime Imaging Microscopy for Diagnosis of Cancer State and Metabolic Monitoring. Cancers. 2021; 13(22):5682. https://doi.org/10.3390/cancers13225682
Chicago/Turabian StyleBecker, Lucas, Nicole Janssen, Shannon L. Layland, Thomas E. Mürdter, Anne T. Nies, Katja Schenke-Layland, and Julia Marzi. 2021. "Raman Imaging and Fluorescence Lifetime Imaging Microscopy for Diagnosis of Cancer State and Metabolic Monitoring" Cancers 13, no. 22: 5682. https://doi.org/10.3390/cancers13225682