Long-Term Nightshift Work and Breast Cancer Risk: An Updated Systematic Review and Meta-Analysis with Special Attention to Menopausal Status and to Recent Nightshift Work

 , , ,
, , ,
Abstract
:Simple Summary
Abstract
1. Introduction
2. Materials and Methods
2.1. Literature Search and Eligibility Criteria
2.2. Data Extraction
2.3. Risk of Bias Assessment of Individual Studies (Newcastle–Ottawa Scale)
2.4. Statistical Methods
2.4.1. Meta-Analysis on Long-Term NSW and BC Risk
- Global meta-analysis of long-term NSW (for ≥15 years) and BC
- Dose–response meta-analysis
- Subgroup meta-analysis by menopausal status
2.4.2. Meta-Analysis on Recent Long-Term NSW and BC
3. Results
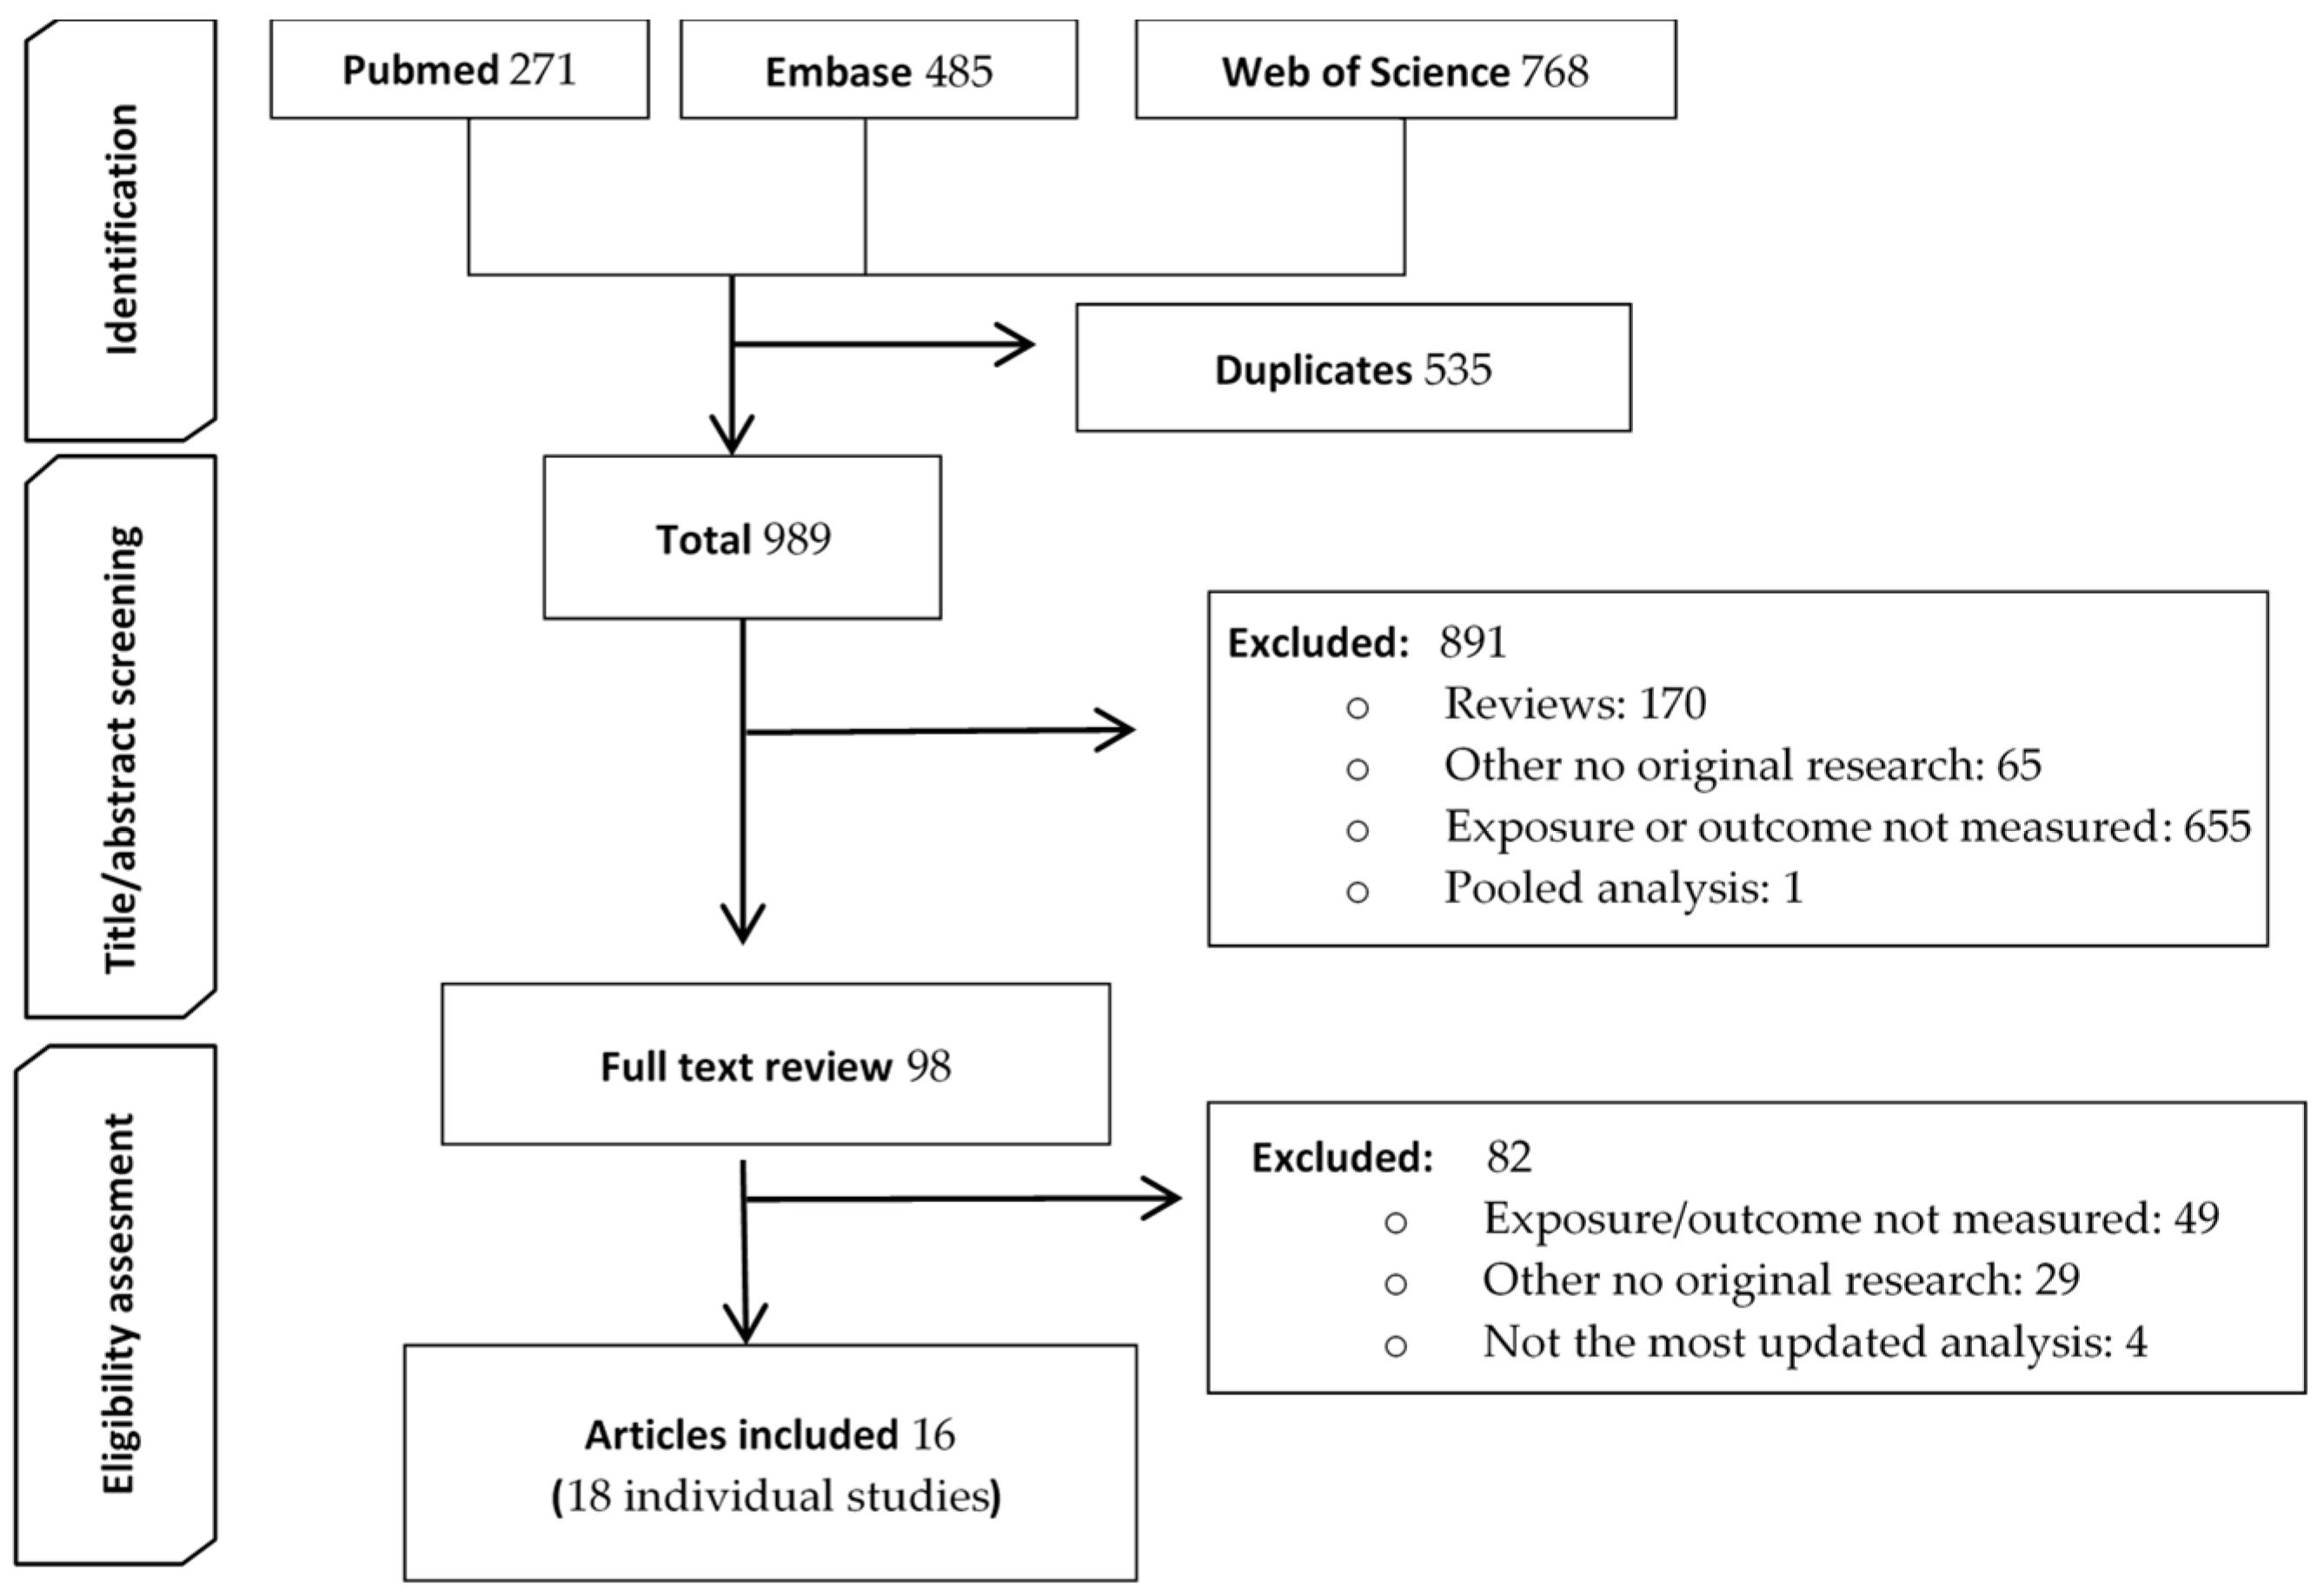
3.1. Search Results
3.2. Study Characteristics
3.3. Results of the Risk of Bias Assessment in the Selected Studies
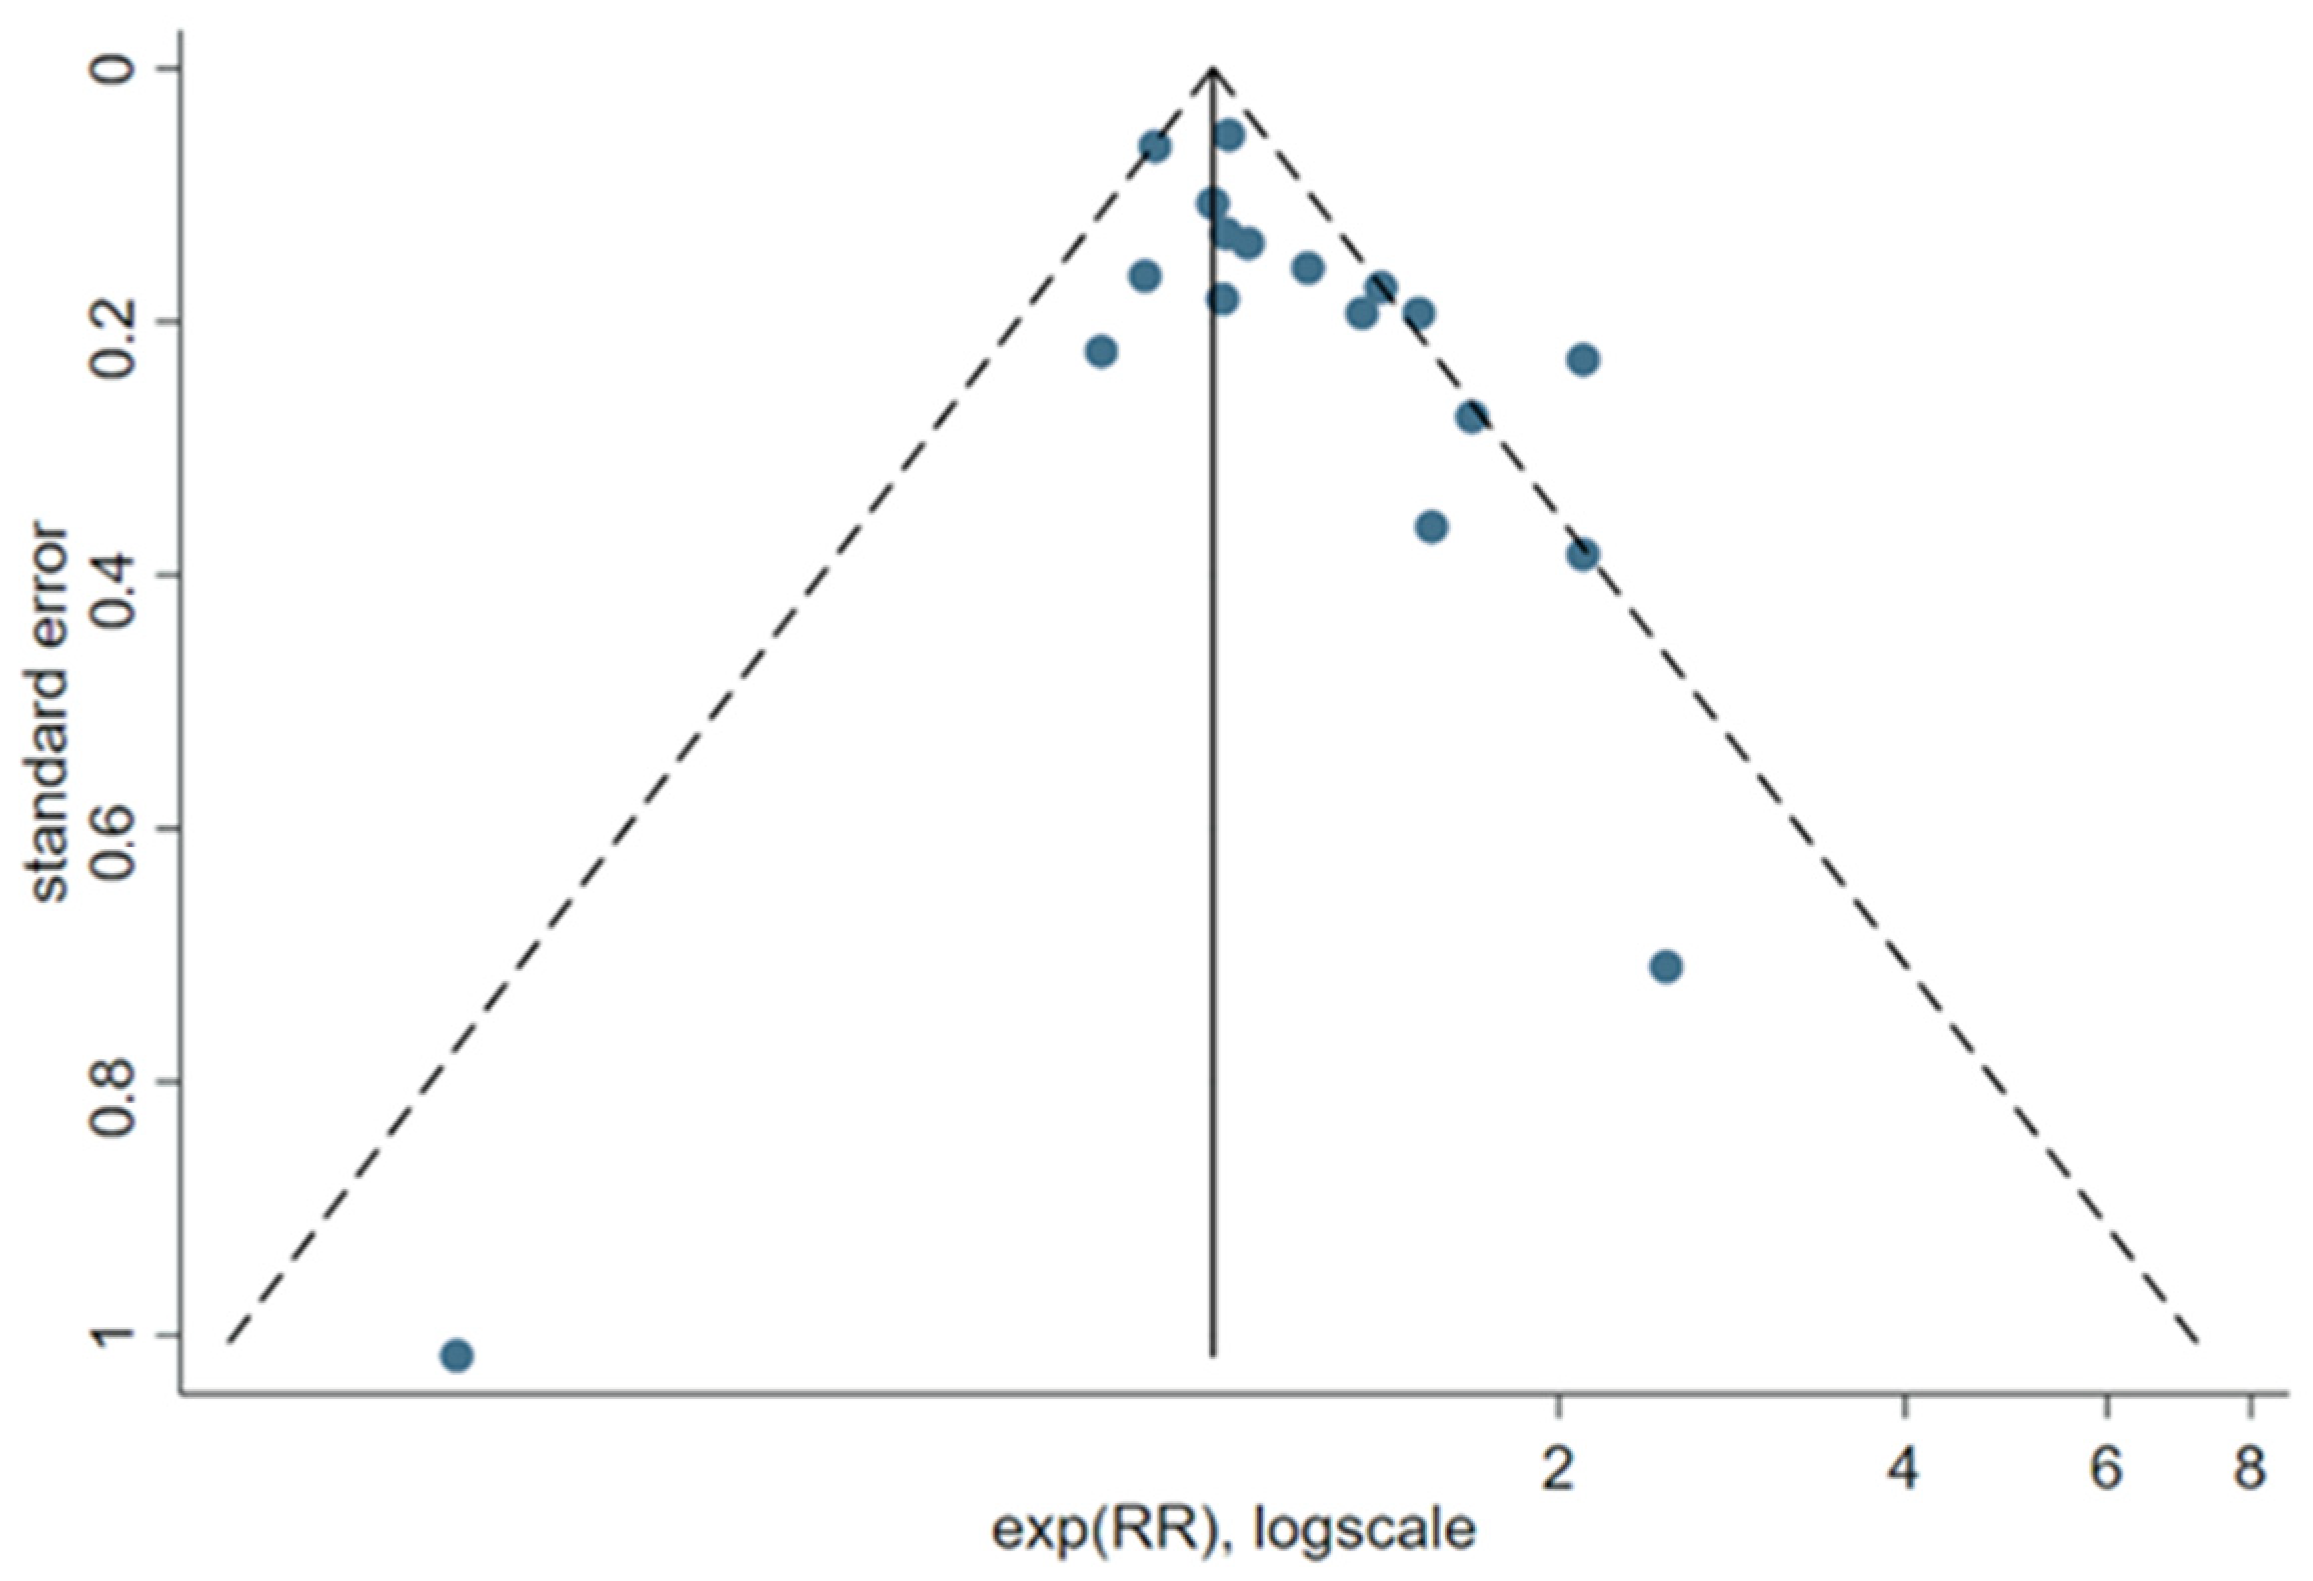
3.4. Results of the Meta-Analyses
3.4.1. Long-Term NSW and BC Risk
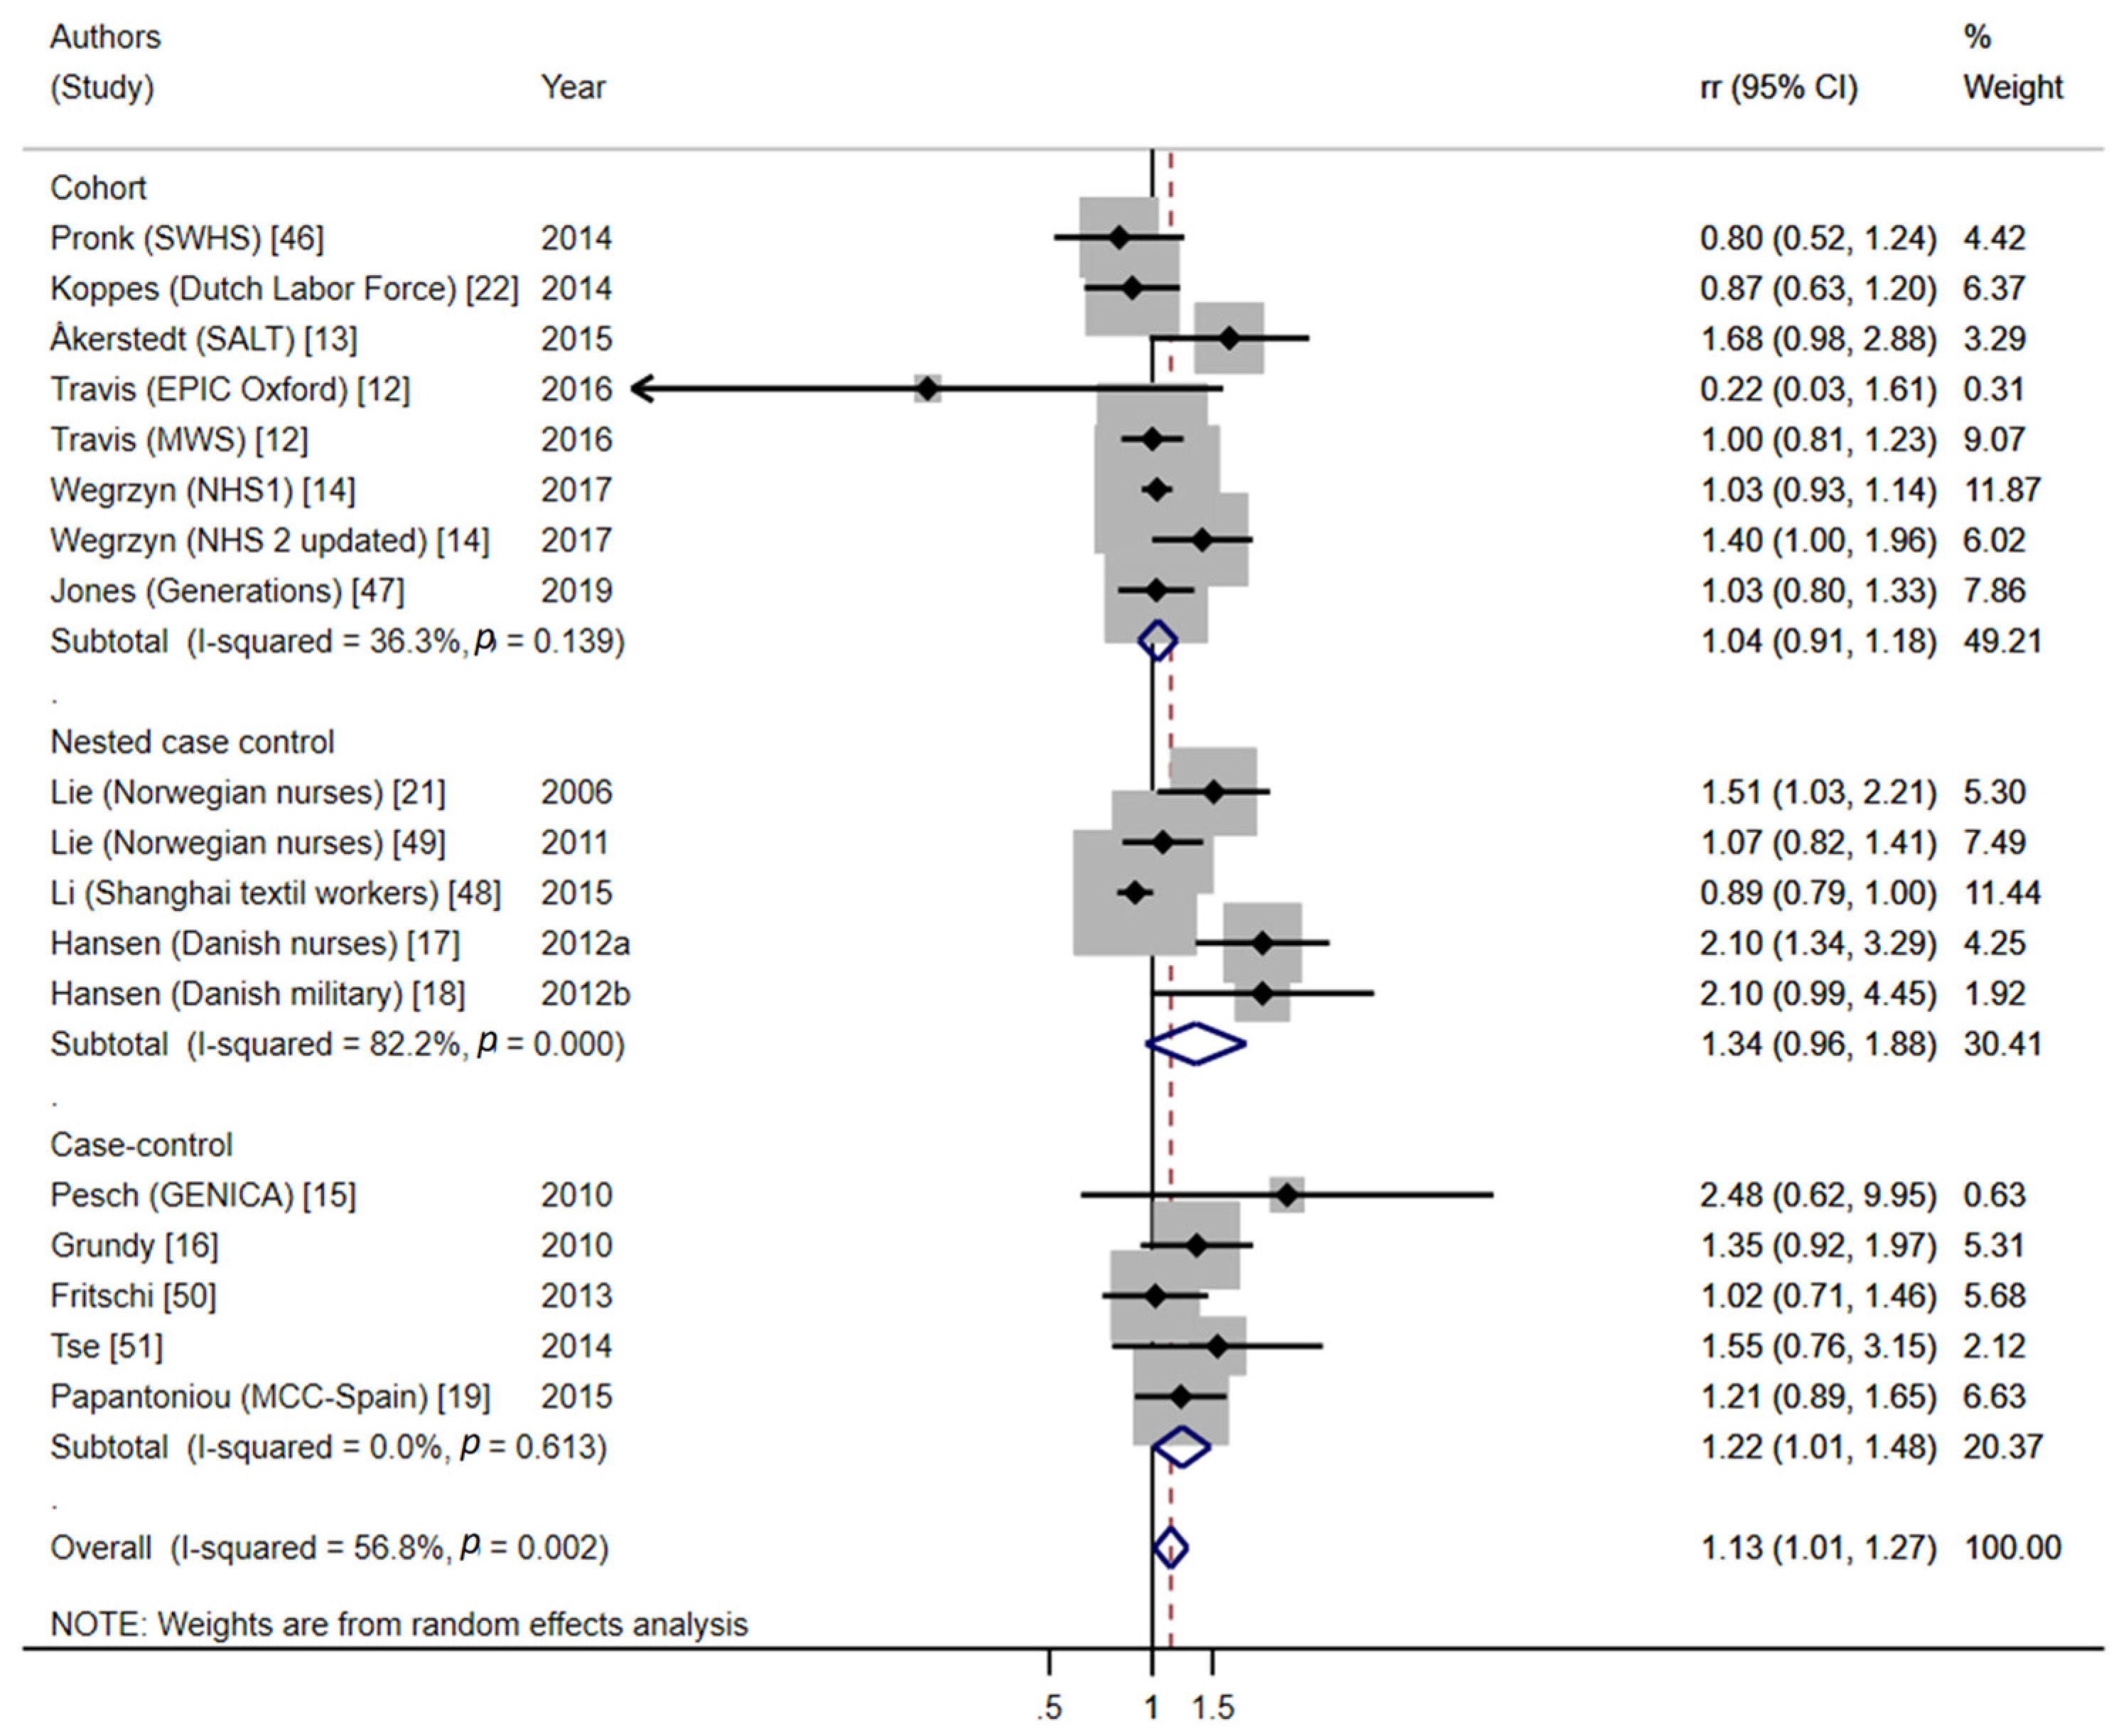
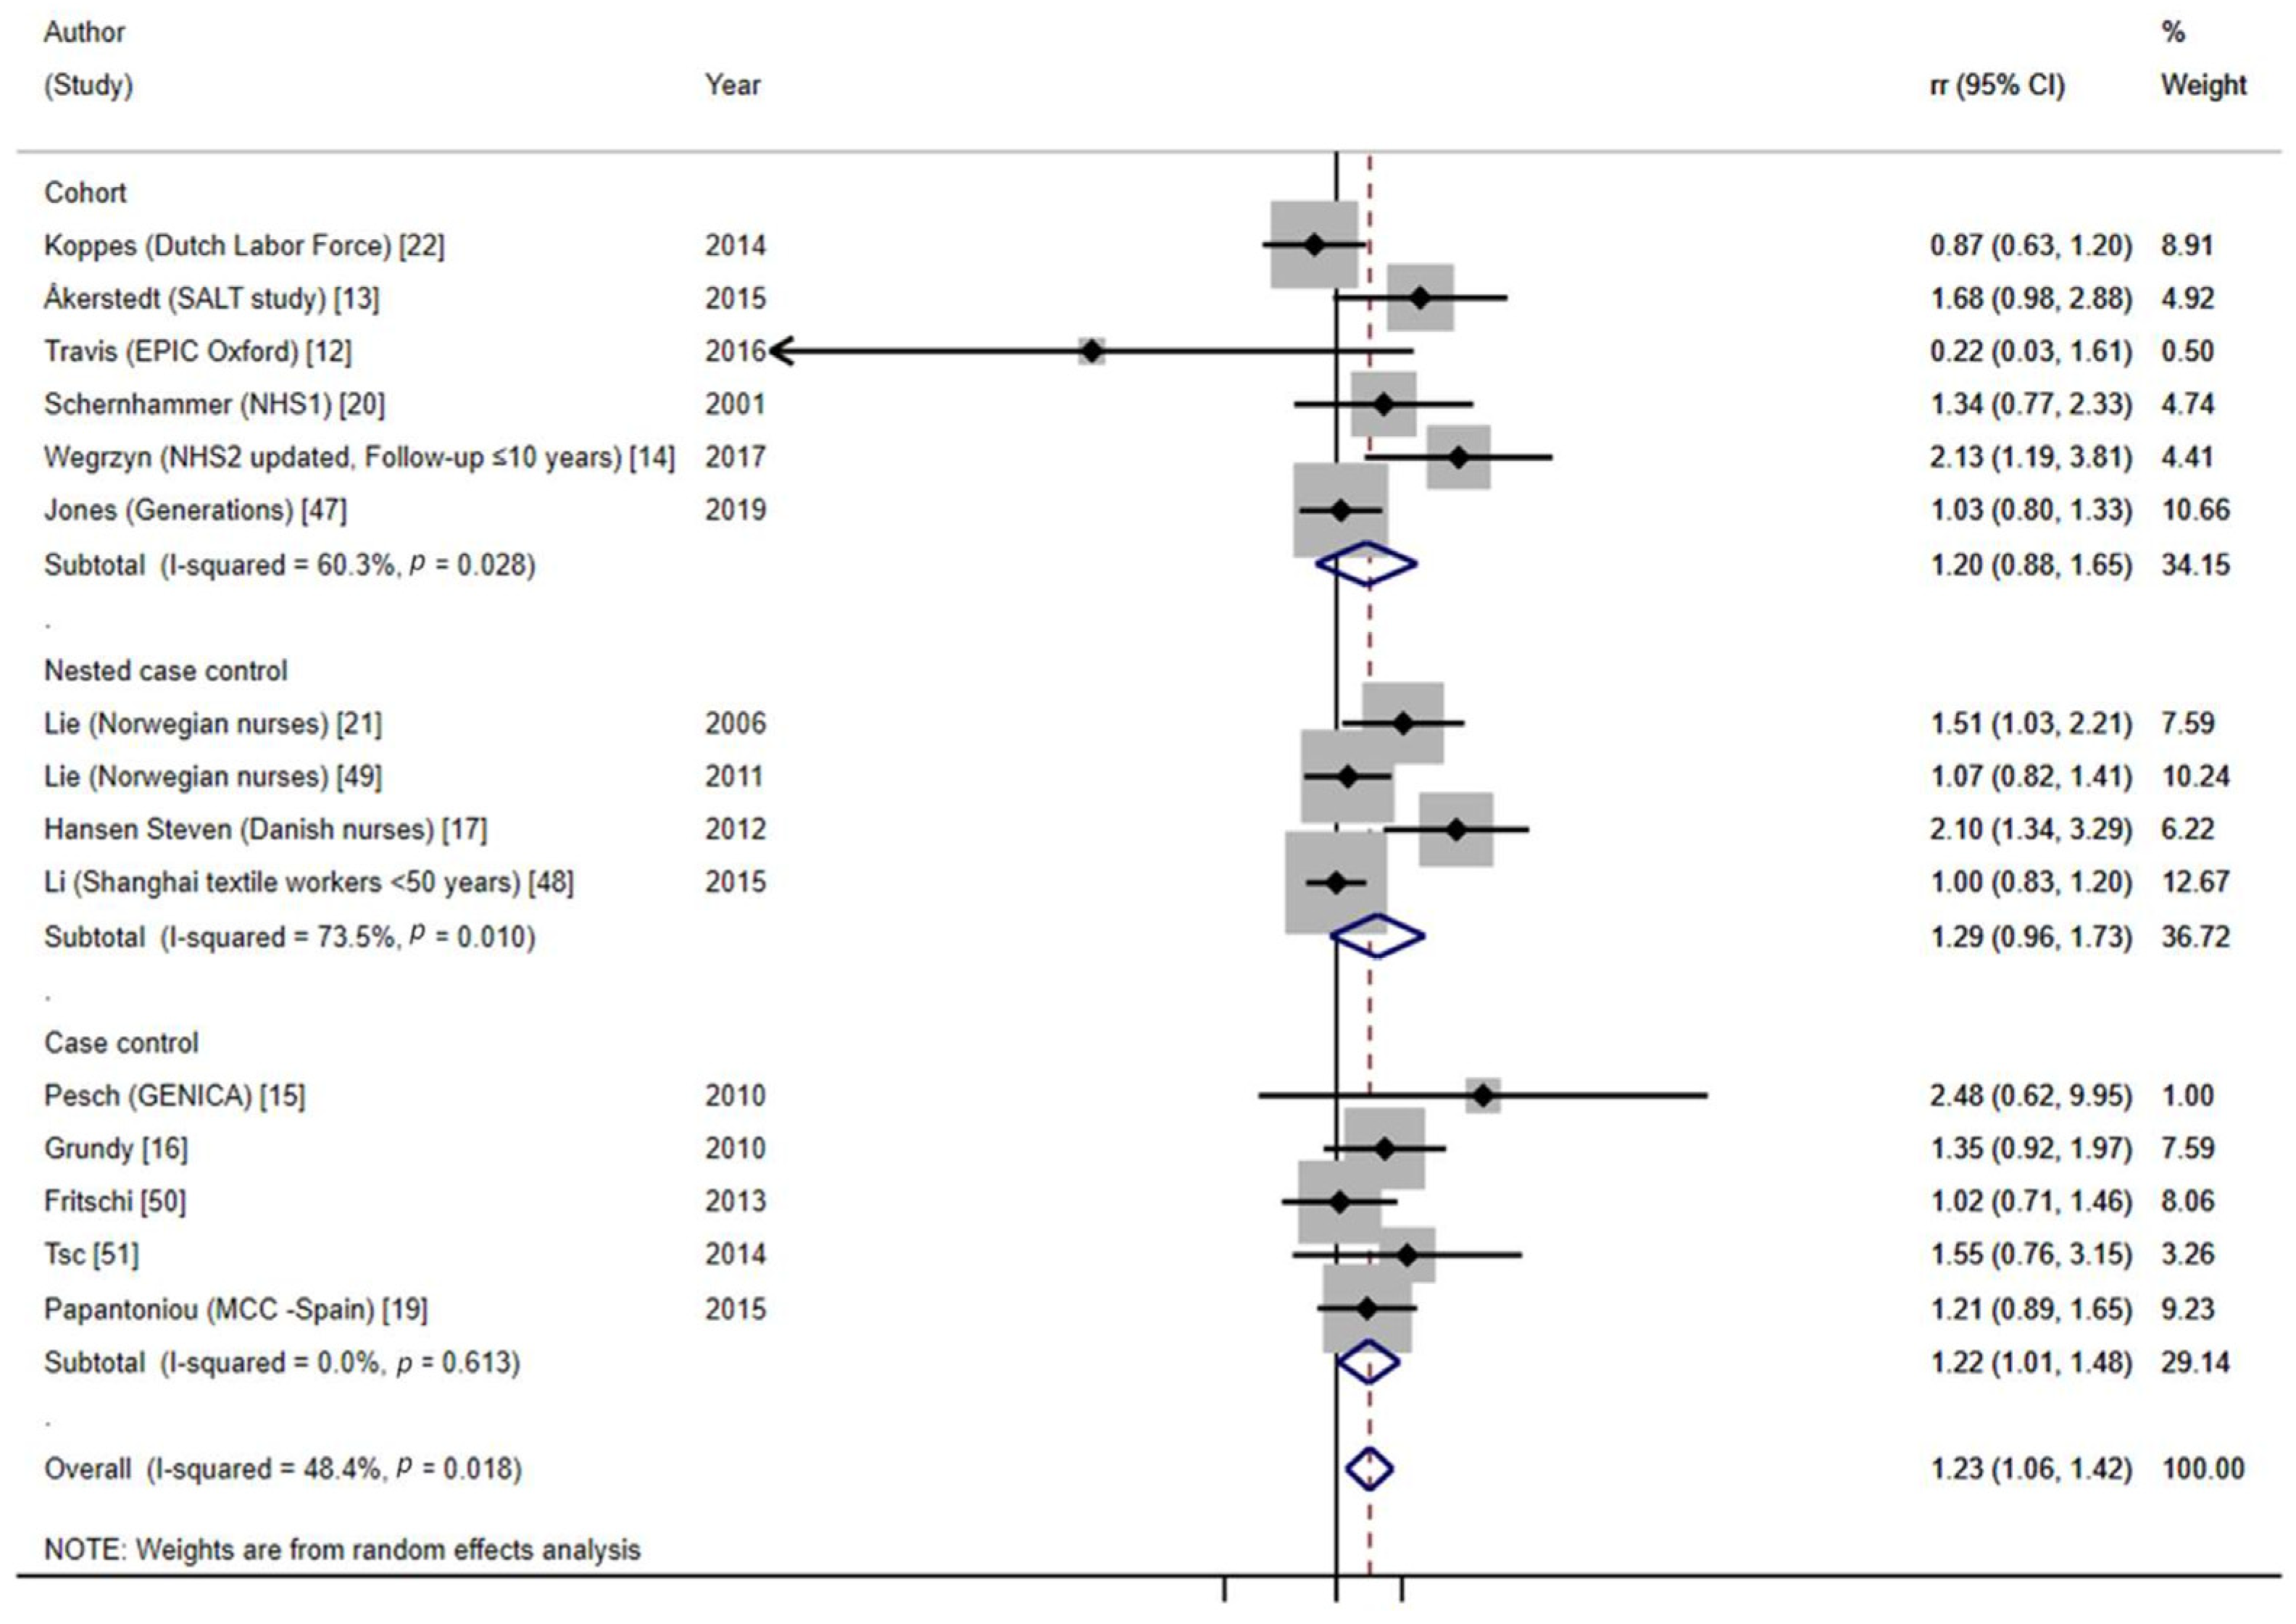
- Global meta-analysis on long-term NSW and BC risk
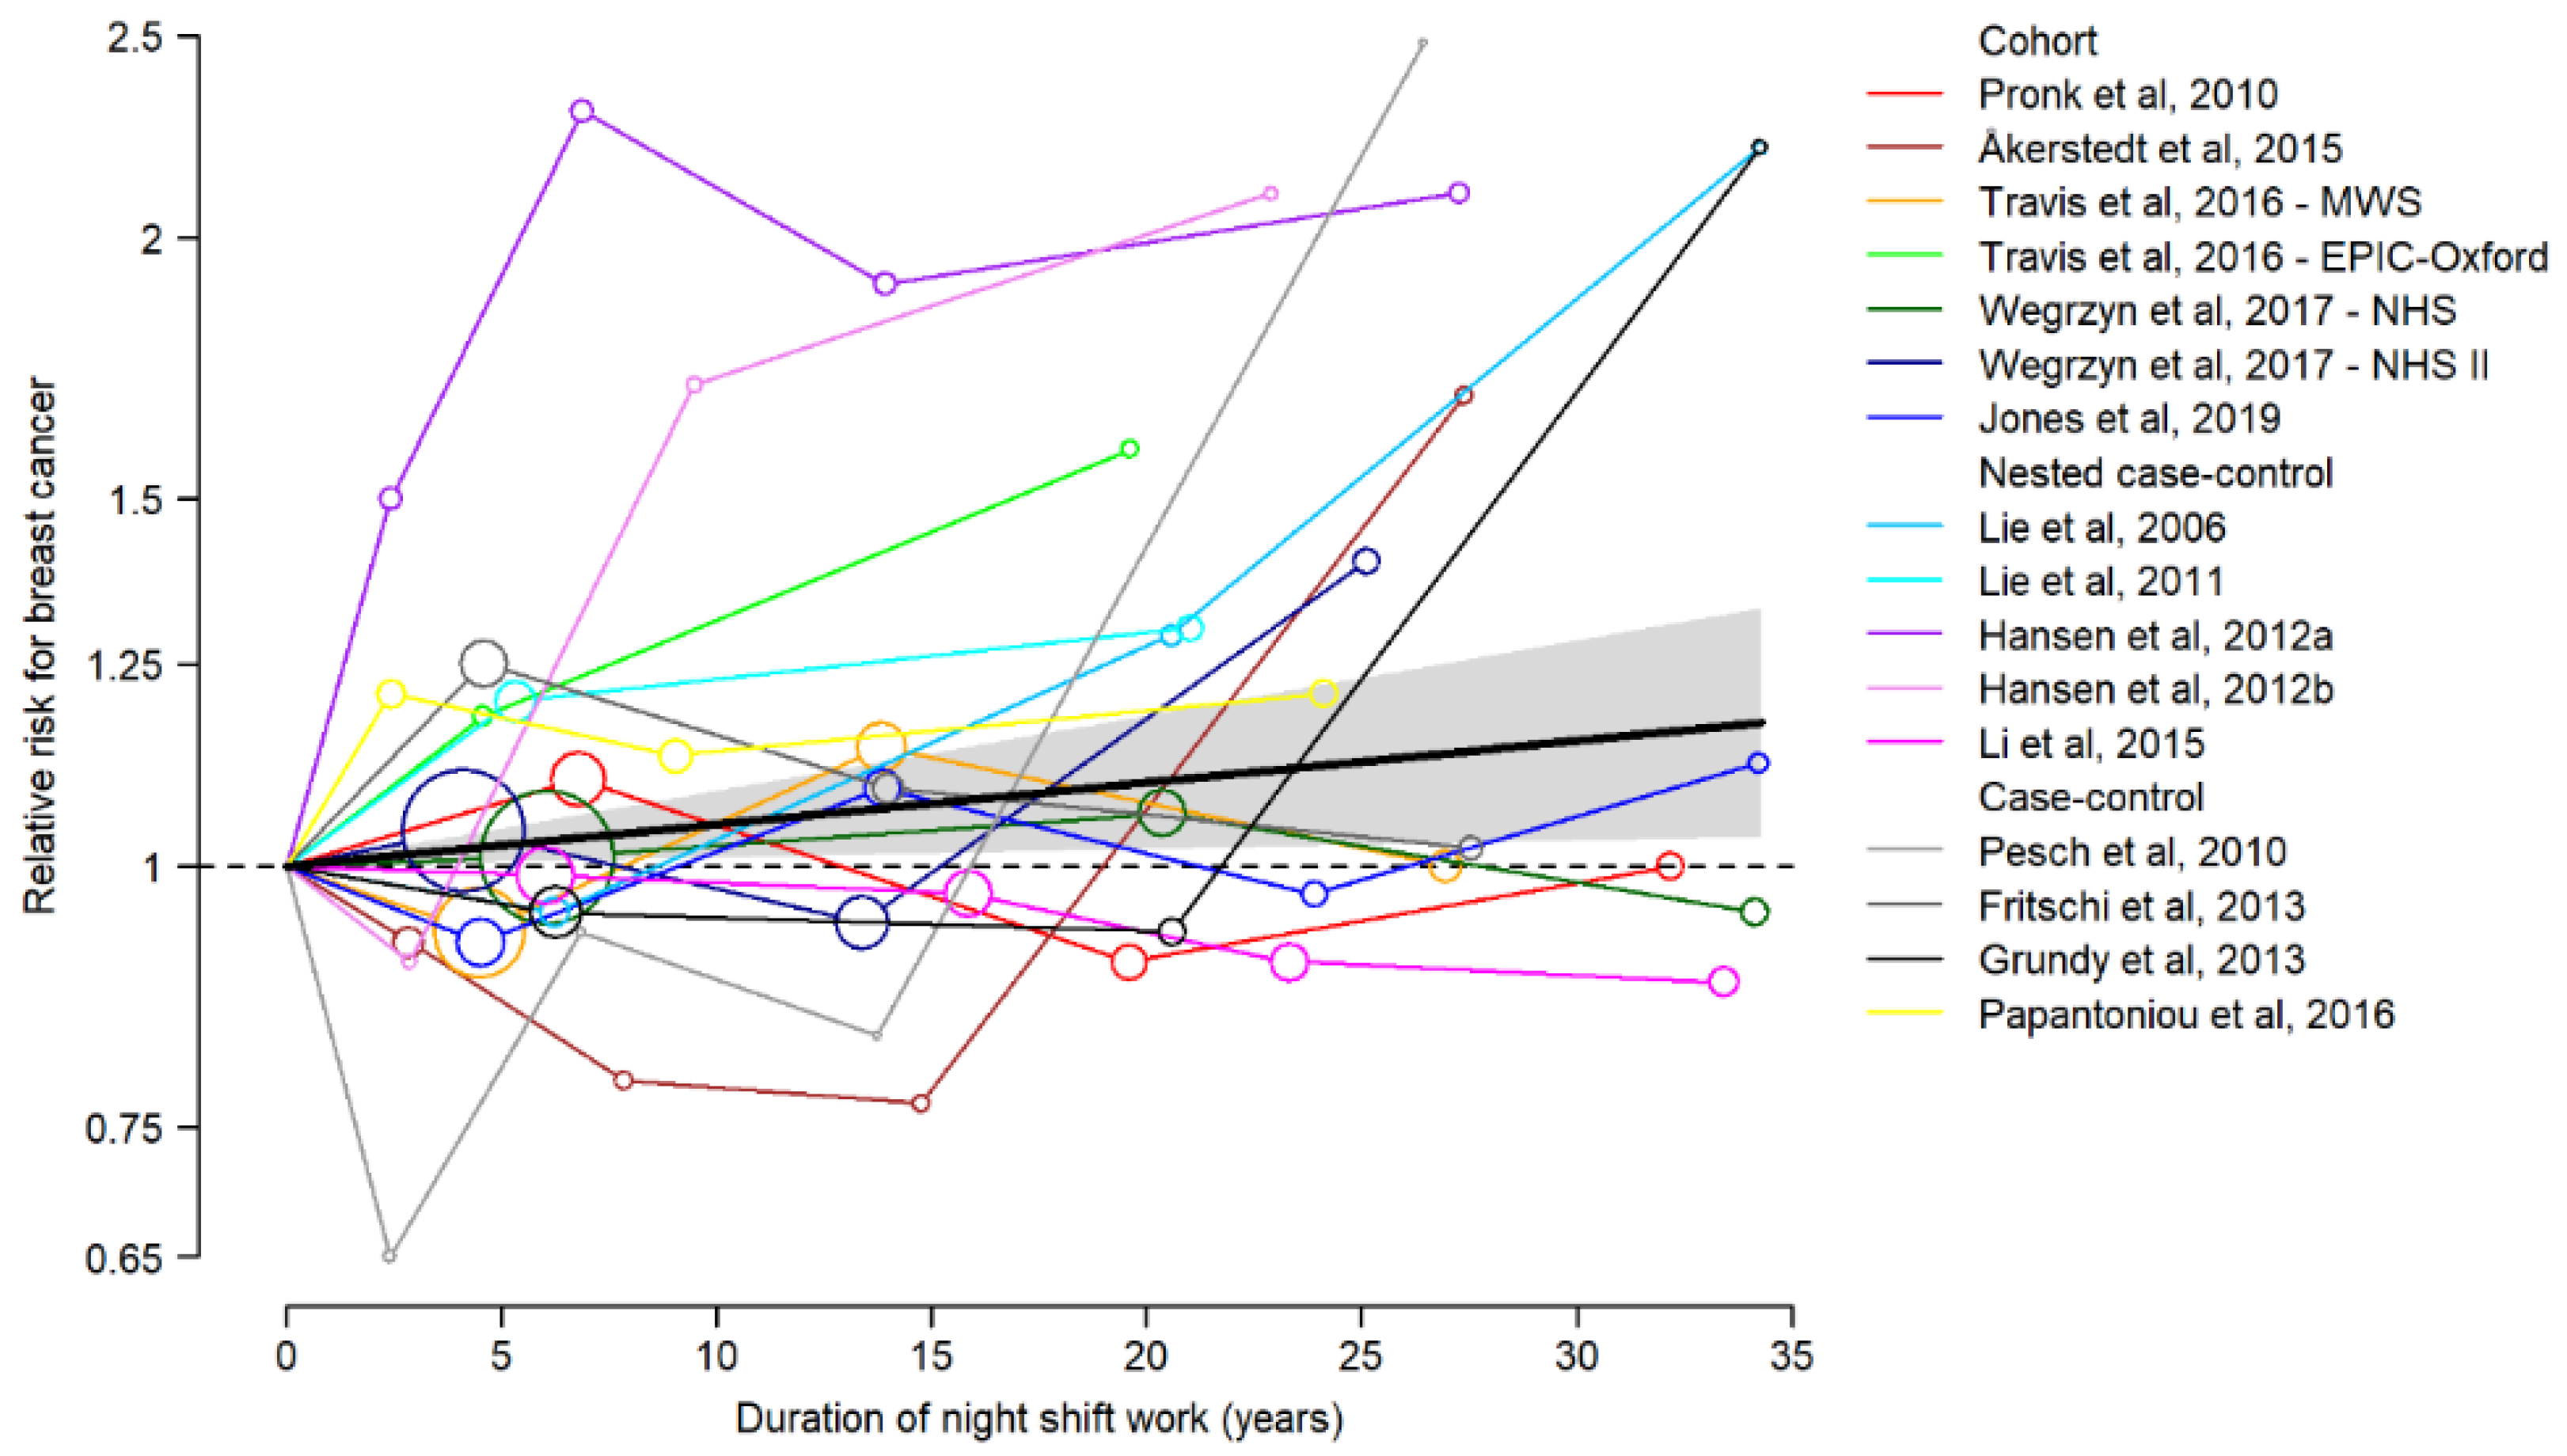
- Dose–response meta-analysis
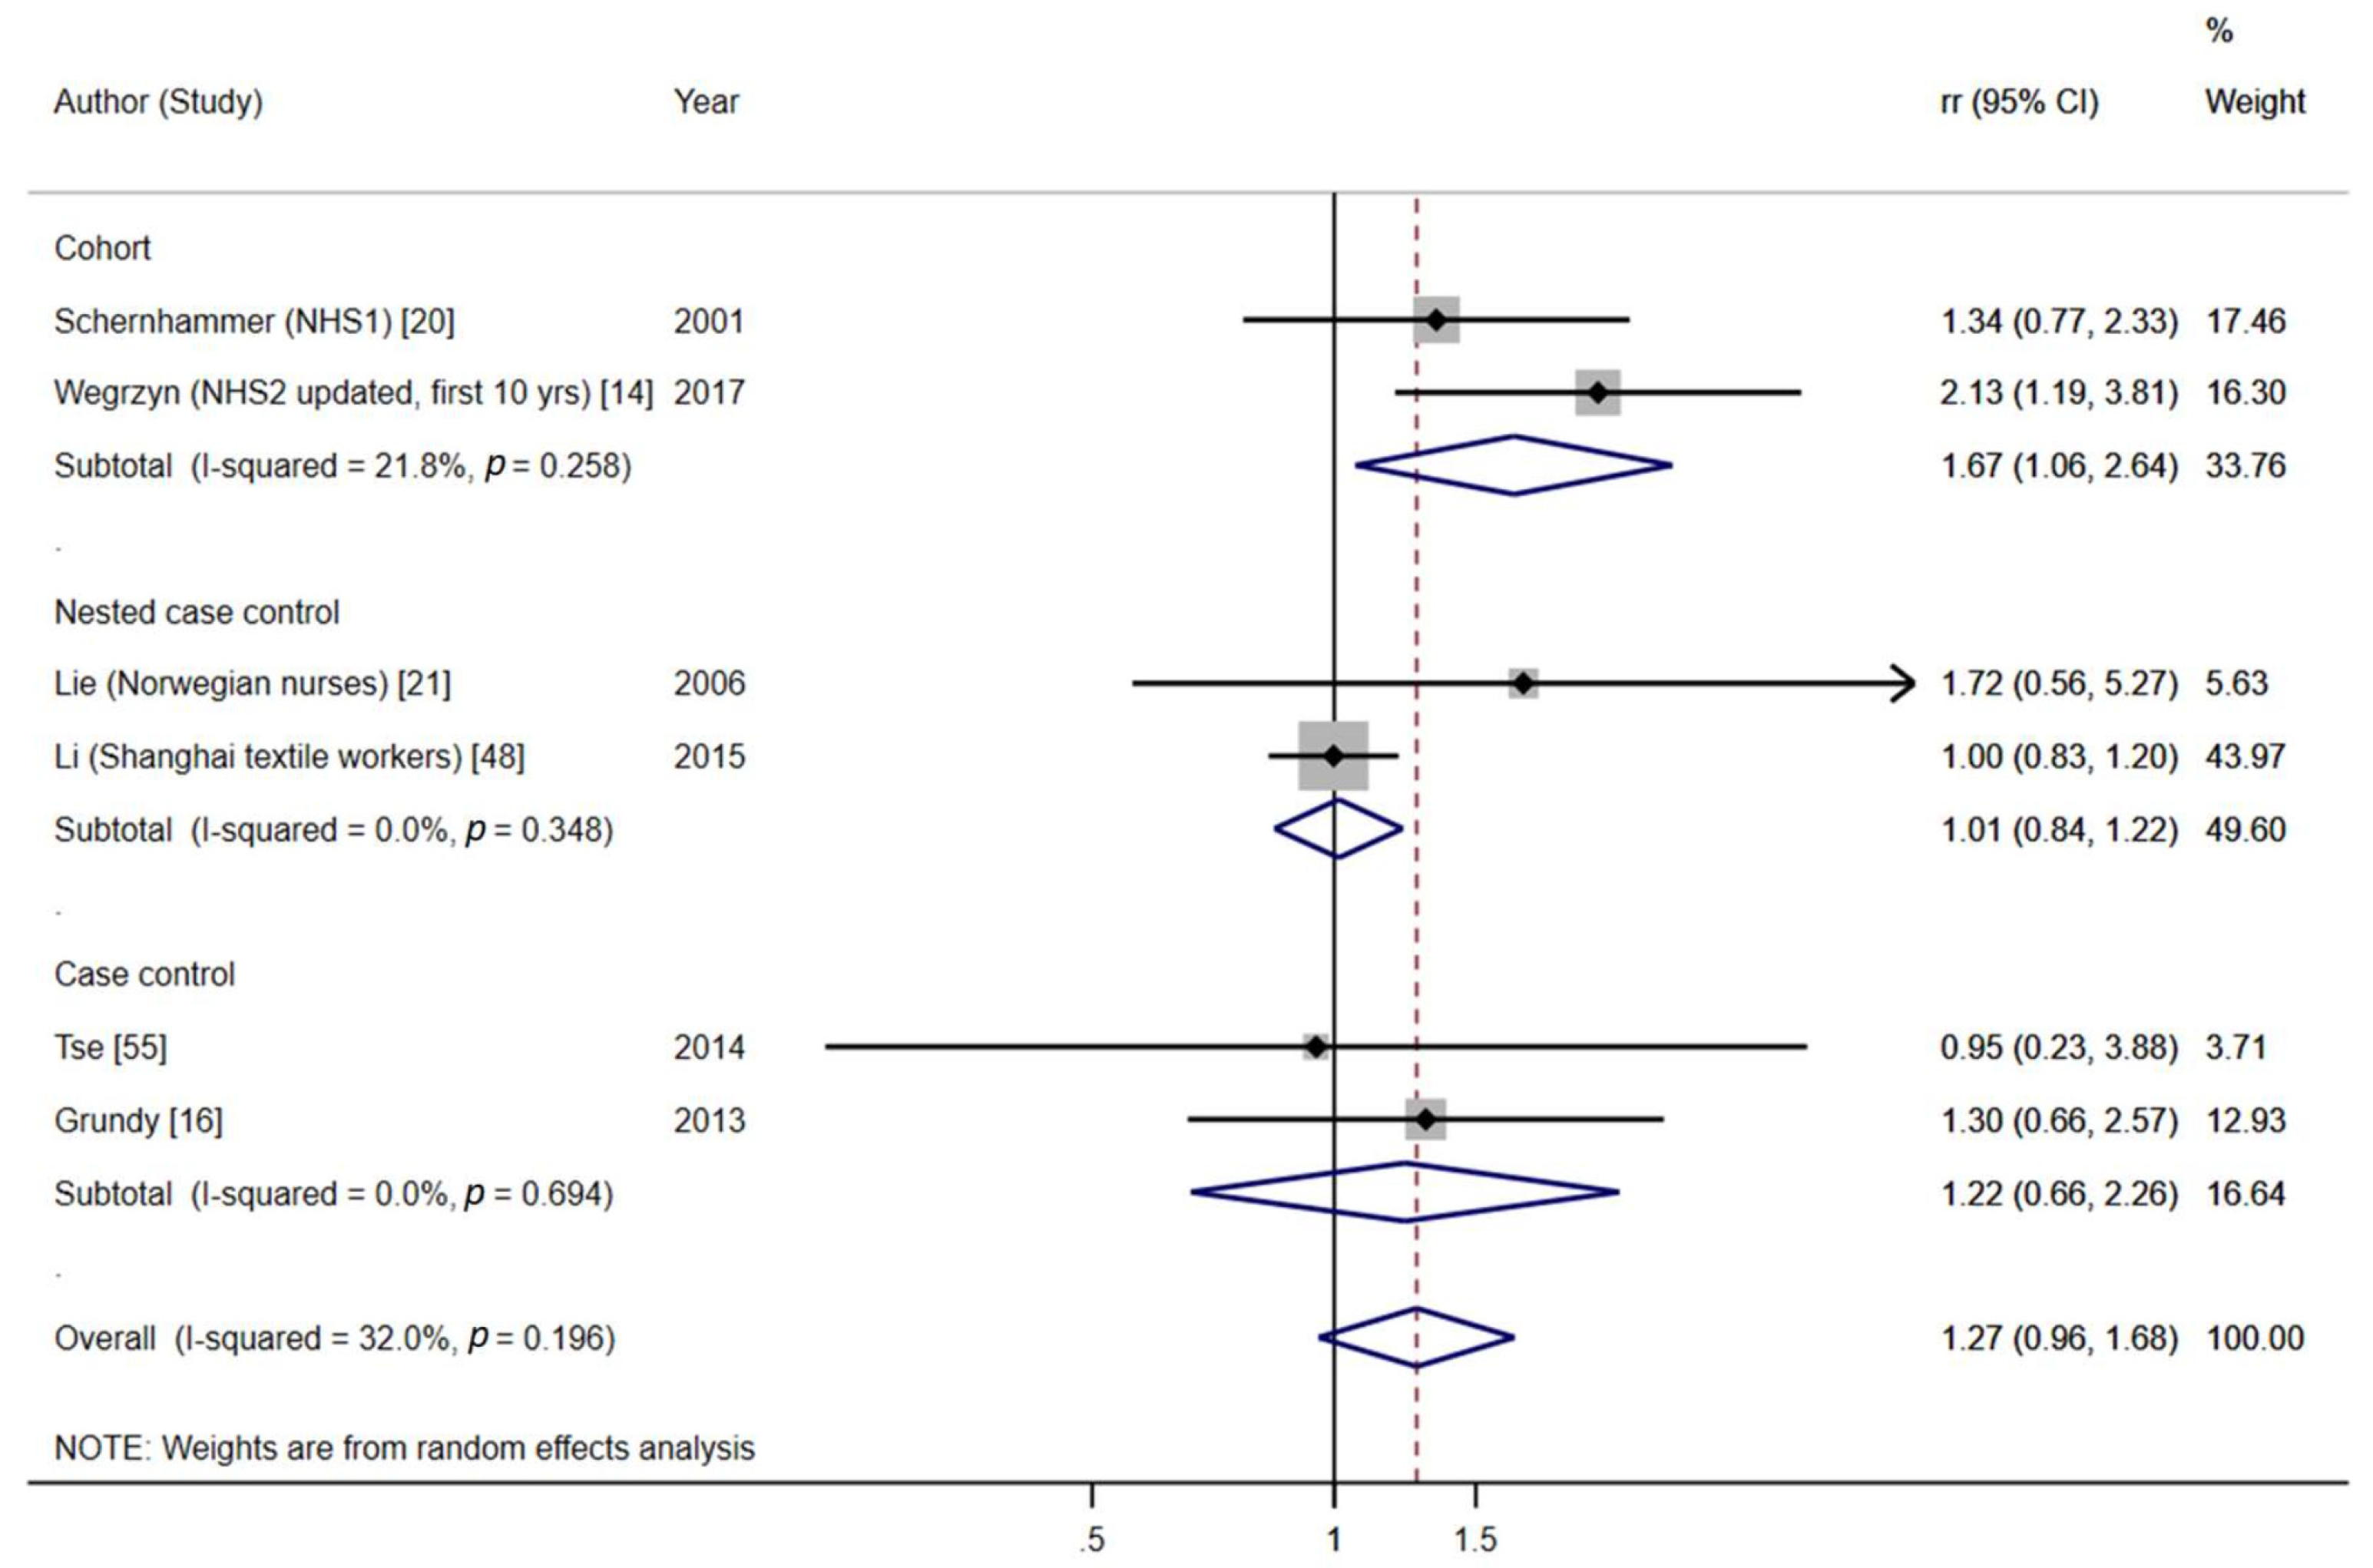
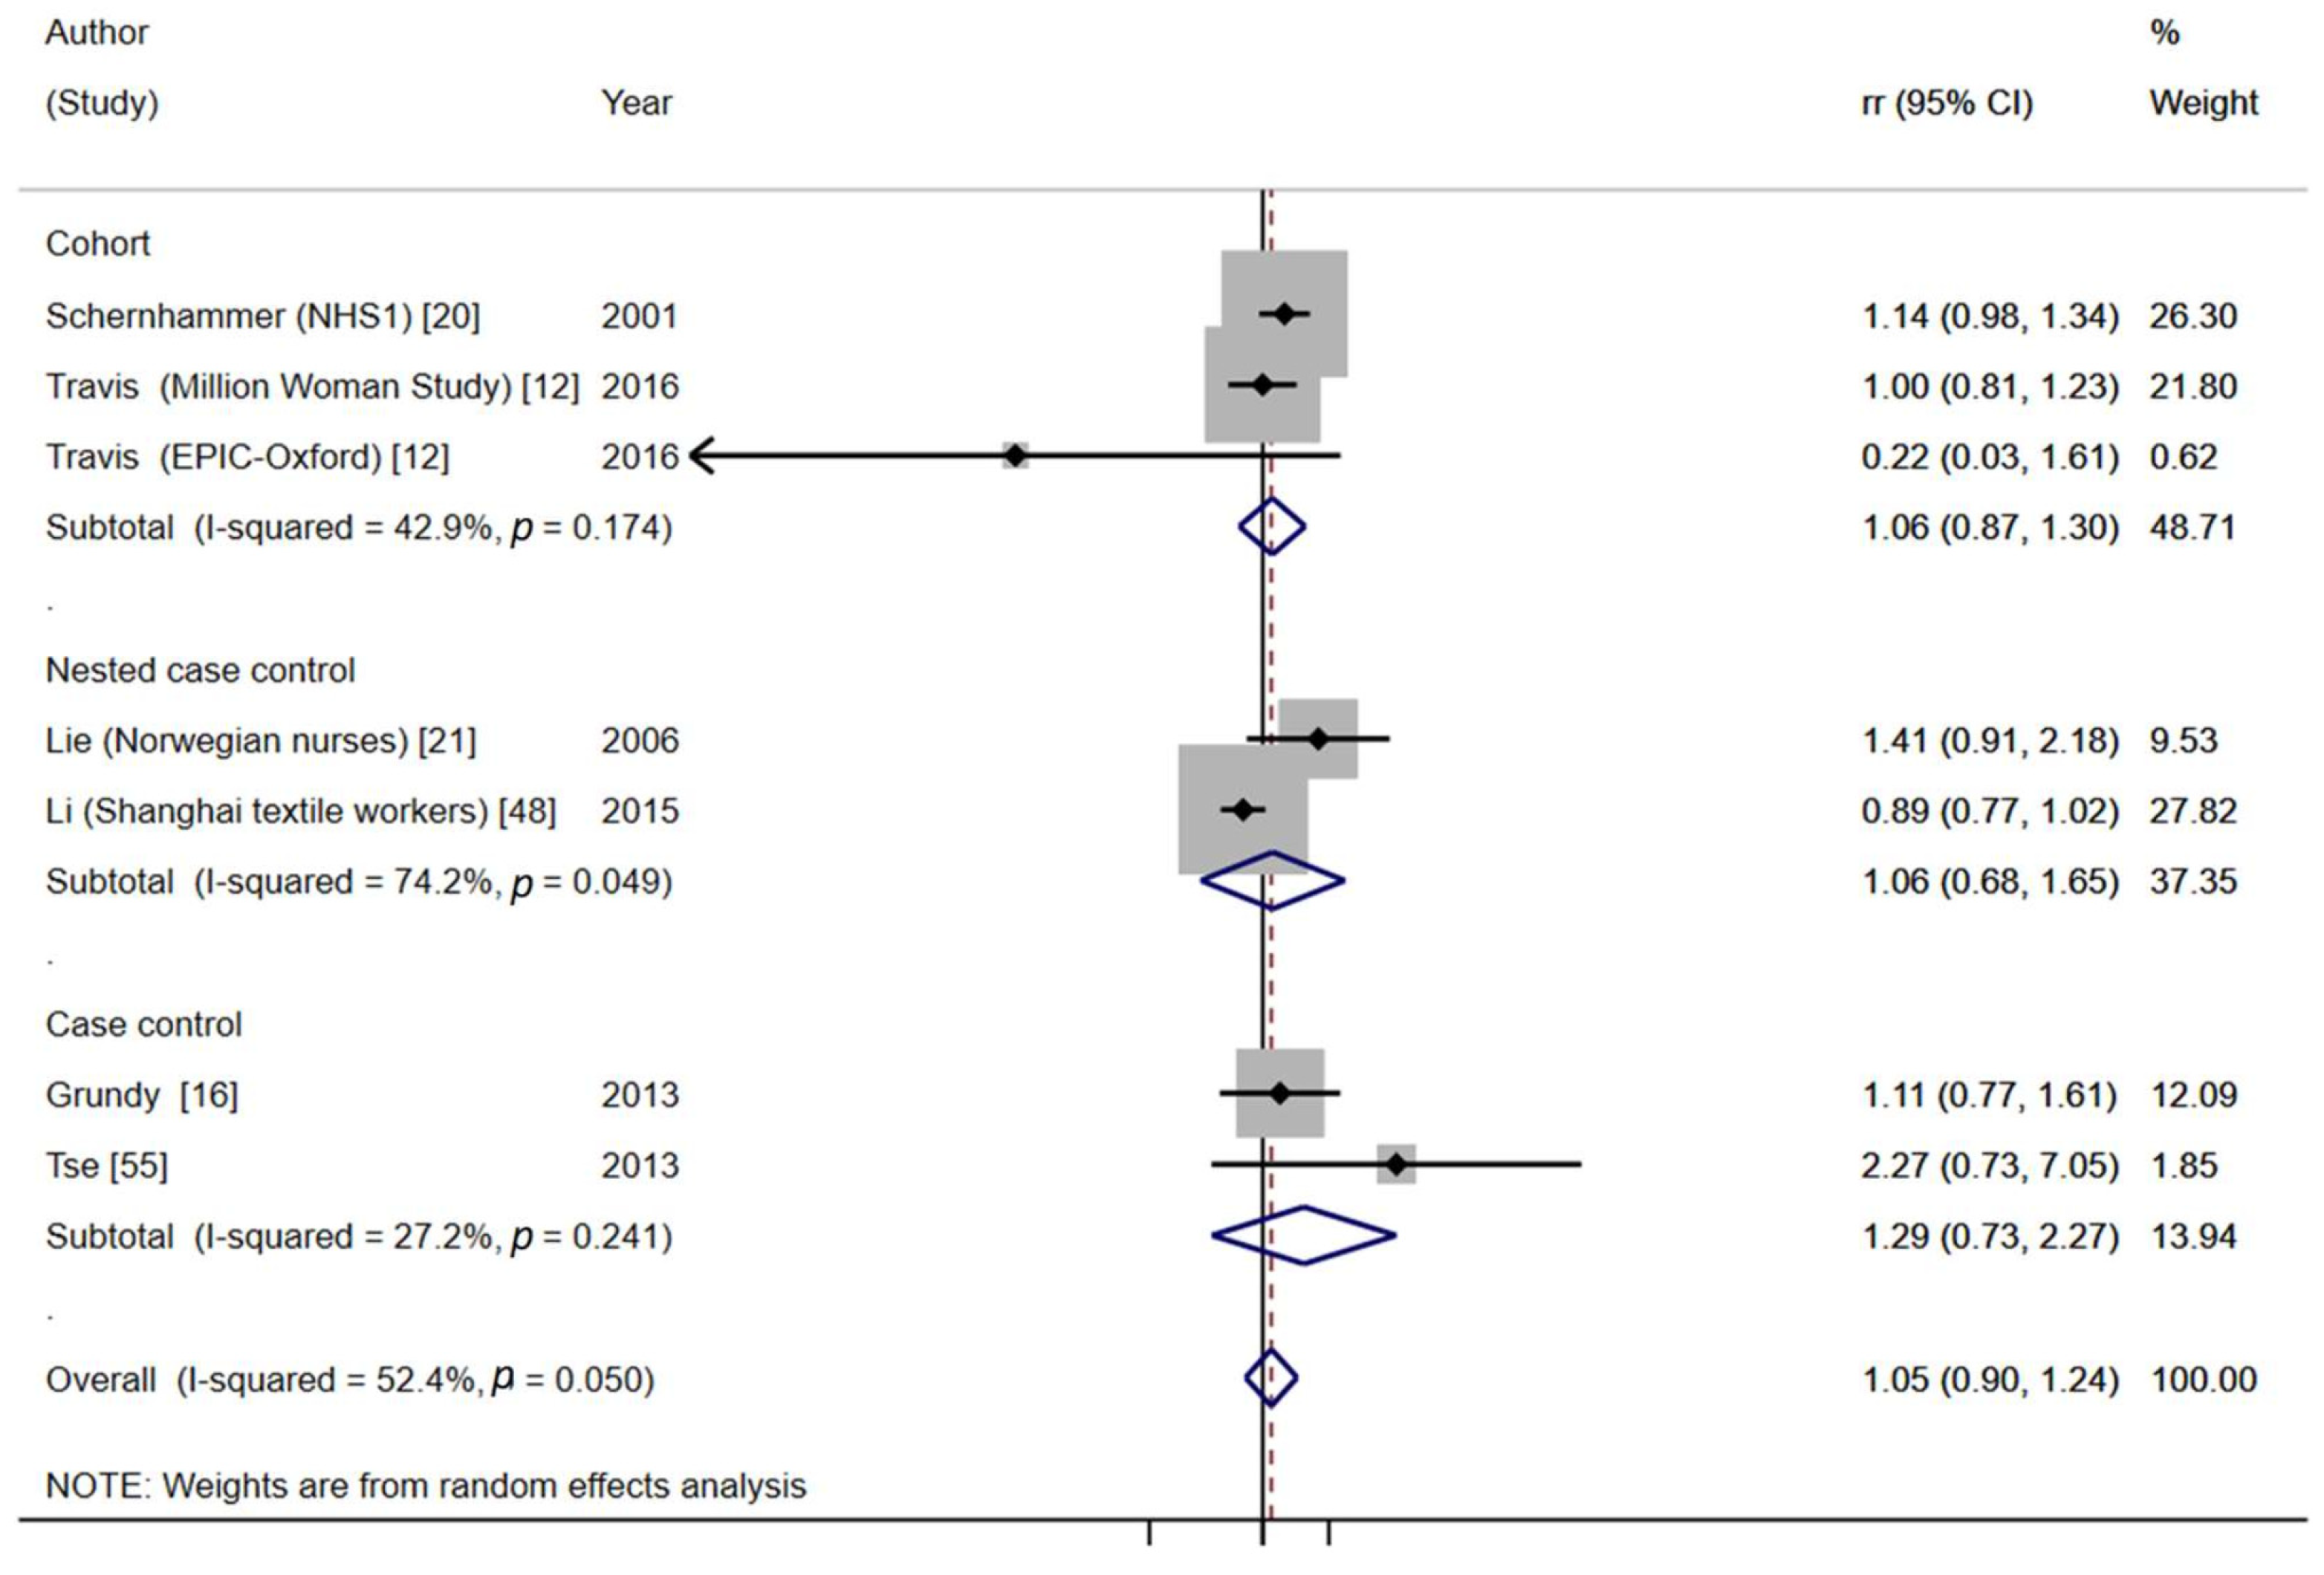
- Subgroup analysis by menopausal status
3.4.2. Recent Long-Term NSW and BC Risk
3.5. Comparison with Former Meta-Analyses
4. Discussion
4.1. The Association between Long-Term NSW and BC Risk
4.2. Comparison with Former Meta-Analyses and Relevant Studies
4.3. Interpretation of the Results and Possible Mechanisms of the Association
4.4. Strengths and Limitations
5. Conclusions
Supplementary Materials
Author Contributions
Funding
Data Availability Statement
Conflicts of Interest
References
- Directive 2003/88/EC of the European Parliament and of the Council of 4 November 2003 Concerning Certain Aspects of the Organisation of Working Time, EUR-LEX, Access to European Union Law; European Parlament and European Council. Available online: https://eur-lex.europa.eu/legal-content/en/TXT/?uri=CELEX:32003L0088 (accessed on 11 March 2020).
- Job Flexibilites and Work Schedules-2017-2018. Data from the American Time Use Survey. Available online: https://www.bls.gov/news.release/flex2.nr0.htm (accessed on 11 March 2020).
- Parent-Thirion, A.; Biletta, I.; Cabrita, J.; Llave Vargas, O.; Vermeylen, G.; Wilczynska, A.; Wilkens, M. 6th European Working Conditions Survey: Overview Report; EF; 2017 Update; Publications Office of the European Union: Luxembourg, 2017; ISBN 978-92-897-1596-6. [Google Scholar]
- Czeisler, C.A.; Gooley, J.J. Sleep and Circadian Rhythms in Humans. Cold Spring Harb. Symp. Quant. Biol. 2007, 72, 579–597. [Google Scholar] [CrossRef] [Green Version]
- Czeisler, C.A.; Duffy, J.F.; Shanahan, T.L.; Brown, E.N.; Mitchell, J.F.; Rimmer, D.W.; Ronda, J.M.; Silva, E.J.; Allan, J.S.; Emens, J.S.; et al. Stability, Precision, and Near-24-Hour Period of the Human Circadian Pacemaker. Science 1999, 284, 2177. [Google Scholar] [CrossRef] [PubMed]
- Panda, S. Circadian Physiology of Metabolism. Science 2016, 354, 1008–1015. [Google Scholar] [CrossRef] [Green Version]
- Duffy, J.F.; Czeisler, C.A. Effect of Light on Human Circadian Physiology. Sleep Med. Clin. 2009, 4, 165–177. [Google Scholar] [CrossRef] [PubMed] [Green Version]
- International Agency for Research on Cancer (IARC). Night Shift Work. In Monographs on the Identification of Carcinogenic Hazards to Humans; IARC: Lyon, France, 2015; Volume 124, ISBN 9789283201625. [Google Scholar]
- Ginsburg, O.; Bray, F.; Coleman, M.P.; Vanderpuye, V.; Eniu, A.; Kotha, S.R.; Sarker, M.; Huong, T.T.; Allemani, C.; Dvaladze, A.; et al. The Global Burden of Women’s Cancers: A Grand Challenge in Global Health. Lancet 2017, 389, 847–860. [Google Scholar] [CrossRef]
- Jia, Y.; Lu, Y.; Wu, K.; Lin, Q.; Shen, W.; Zhu, M.; Huang, S.; Chen, J. Does Night Work Increase the Risk of Breast Cancer? A Systematic Review and Meta-Analysis of Epidemiological Studies. Cancer Epidemiol. 2013, 37, 197–206. [Google Scholar] [CrossRef] [PubMed]
- Lin, X.; Chen, W.; Wei, F.; Ying, M.; Wei, W.; Xie, X. Night-Shift Work Increases Morbidity of Breast Cancer and All-Cause Mortality: A Meta-Analysis of 16 Prospective Cohort Studies. Sleep Med. 2015, 16, 1381–1387. [Google Scholar] [CrossRef]
- Travis, R.C.; Balkwill, A.; Fensom, G.K.; Appleby, P.N.; Reeves, G.K.; Wang, X.-S.; Roddam, A.W.; Gathani, T.; Peto, R.; Green, J.; et al. Gathani Toral, Peto Richard, Green Jane, Key Timothy J., Beral Valerie. Night Shift Work and Breast Cancer Incidence: Three Prospective Studies and Meta-analysis of Published Studies. J. Natl. Cancer Inst. 2016, 108, djw169. [Google Scholar] [CrossRef]
- Åkerstedt, T.; Knutsson, A.; Narusyte, J.; Svedberg, P.; Kecklund, G.; Alexanderson, K. Night Work and Breast Cancer in Women: A Swedish Cohort Study. BMJ Open 2015, 5, e008127. [Google Scholar] [CrossRef]
- Wegrzyn, L.R.; Tamimi, R.M.; Rosner, B.A.; Brown, S.B.; Stevens, R.G.; Eliassen, A.H.; Laden, F.; Willett, W.C.; Hankinson, S.E.; Schernhammer, E.S. Rotating night shift work and risk of breast cancer in the nurses’ health studies. Am. J. Epidemiol. 2017, 186, 532–540. [Google Scholar] [CrossRef] [Green Version]
- Pesch, B.; Harth, V.; Rabstein, S.; Baisch, C.; Schiffermann, M.; Pallapies, D.; Bonberg, N.; Heinze, E.; Spickenheuer, A.; Justenhoven, C.; et al. Night Work and Breast Cancer—Results from the German GENICA Study. Scand. J. Work. Environ. Health 2010, 36, 134–141. [Google Scholar] [CrossRef] [Green Version]
- Grundy, A.; Richardson, H.; Burstyn, I.; Lohrisch, C.; SenGupta, S.K.; Lai, A.S.; Lee, D.; Spinelli, J.J.; Aronson, K.J. Increased Risk of Breast Cancer Associated with Long-Term Shift Work in Canada. Occup. Environ. Med. 2013, 70, 831–838. [Google Scholar] [CrossRef] [PubMed] [Green Version]
- Hansen, J.; Stevens, R.G. Case–Control Study of Shift-Work and Breast Cancer Risk in Danish Nurses: Impact of Shift Systems. Eur. J. Cancer 2012, 48, 1722–1729. [Google Scholar] [CrossRef] [PubMed]
- Hansen, J.; Lassen, C.F. Nested Case–Control Study of Night Shift Work and Breast Cancer Risk among Women in the Danish Military. Occup. Environ. Med. 2012, 69, 551–556. [Google Scholar] [CrossRef]
- Papantoniou, K.; Castaño-Vinyals, G.; Espinosa, A.; Aragonés, N.; Pérez-Gómez, B.; Ardanaz, E.; Altzibar, J.M.; Sanchez, V.M.; Gómez-Acebo, I.; Llorca, J.; et al. Breast Cancer Risk and Night Shift Work in a Case-Control Study in a Spanish Population. Eur. J. Epidemiol. 2016, 31, 867–878. [Google Scholar] [CrossRef] [Green Version]
- Schernhammer, E.S.; Laden, F.; Speizer, F.E.; Willett, W.C.; Hunter, D.J.; Kawachi, I.; Colditz, G.A. Rotating Night Shifts and Risk of Breast Cancer in Women Participating in the Nurses’ Health Study. J. Natl. Cancer Inst. 2001, 93, 1563–1568. [Google Scholar] [CrossRef] [Green Version]
- Lie, J.-A.S.; Roessink, J.; Kjærheim, K. Breast Cancer and Night Work among Norwegian Nurses. Cancer Causes Control 2006, 17, 39–44. [Google Scholar] [CrossRef]
- Koppes, L.L.J.; Geuskens, G.A.; Pronk, A.; Vermeulen, R.C.H.; de Vroome, E.M.M. Night Work and Breast Cancer Risk in a General Population Prospective Cohort Study in The Netherlands. Eur. J. Epidemiol. 2014, 29, 577–584. [Google Scholar] [CrossRef] [PubMed] [Green Version]
- Word Cancer Resarch Fund International (WCRFI). American Institute for Cancer Research Breast Cancer. Available online: https://www.wcrf.org/dietandcancer/breast-cancer/ (accessed on 2 November 2021).
- Schoemaker, M.J.; Nichols, H.B.; Wright, L.B.; Brook, M.N.; Jones, M.E.; O’Brien, K.M.; Adami, H.-O.; Baglietto, L.; Bernstein, L.; Bertrand, K.A.; et al. Association of Body Mass Index and Age With Subsequent Breast Cancer Risk in Premenopausal Women. JAMA Oncol. 2018, 4, e181771. [Google Scholar] [CrossRef]
- Liao, S.; Hartmaier, R.J.; McGuire, K.P.; Puhalla, S.L.; Luthra, S.; Chandran, U.R.; Ma, T.; Bhargava, R.; Modugno, F.; Davidson, N.E.; et al. The Molecular Landscape of Premenopausal Breast Cancer. Breast Cancer Res. 2015, 17, 1–13. [Google Scholar] [CrossRef] [Green Version]
- Stevens, R.G. RE: Night Shift Work and Breast Cancer Incidence: Three Prospective Studies and Meta-Analysis of Published Studies. J. Natl. Cancer Inst. 2017, 109. [Google Scholar] [CrossRef] [Green Version]
- Schernhammer, E.S. RE: Night Shift Work and Breast Cancer Incidence: Three Prospective Studies and Meta-Analysis of Published Studies. JNCI J. Natl. Cancer Inst. 2017, 109. [Google Scholar] [CrossRef]
- Knutsson, A.; Alfredsson, L.; Karlsson, B.; Åkerstedt, T.; Fransson, E.I.; Westerholm, P.; Westerlund, H. Breast Cancer among Shift Workers: Results of the WOLF Longitudinal Cohort Study. Scand. J. Work. Environ. Health 2013, 39, 170–177. [Google Scholar] [CrossRef] [Green Version]
- Kogevinas, M.; Espinosa, A.; Papantoniou, K.; Aragonés, N.; Pérez-Gómez, B.; Burgos, J.; Gómez-Acebo, I.; Llorca, J.; Peiró, R.; Jimenez-Moleón, J.J.; et al. Prostate Cancer Risk Decreases Following Cessation of Night Shift Work. Int. J. Cancer 2019, 145, 2597–2599. [Google Scholar] [CrossRef] [PubMed]
- Cordina-Duverger, E.; Menegaux, F.; Popa, A.; Rabstein, S.; Harth, V.; Pesch, B.; Brüning, T.; Fritschi, L.; Glass, D.C.; Heyworth, J.S.; et al. Night Shift Work and Breast Cancer: A Pooled Analysis of Population-Based Case-Control Studies with Complete Work History. Eur. J. Epidemiol. 2018, 33, 369–379. [Google Scholar] [CrossRef]
- Page, M.J.; Moher, D.; Bossuyt, P.M.; Boutron, I.; Hoffmann, T.C.; Mulrow, C.D.; Shamseer, L.; Tetzlaff, J.M.; Akl, E.A.; Brennan, S.E.; et al. PRISMA 2020 Explanation and Elaboration: Updated Guidance and Exemplars for Reporting Systematic Reviews. BMJ 2021, 372, n160. [Google Scholar] [CrossRef] [PubMed]
- NIHR: National Institute for Health Research. PROSPERO International Prospective Register of Systematic Reviews. Available online: https://www.crd.york.ac.uk/prospero/ (accessed on 30 August 2020).
- Wells, G.A.; Shea, B.; O’Connell, D.; Paterson, J.; Welch, V.; Losos, M. Tugwell The Newcastle-Ottawa Scale (NOS) for Assessing the Quality of Nonrandomised Studies in Meta-Analyses. Available online: http://www.ohri.ca/programs/clinical_epidemiology/oxford.asp (accessed on 28 November 2020).
- Higgins, J.P.T.; Thompson, S.G. Quantifying Heterogeneity in a Meta-Analysis. Stat. Med. 2002, 21, 1539–1558. [Google Scholar] [CrossRef] [PubMed]
- Review Manager(RevMan) [Computer Program]. The Cochrane Collaboration; Version 5.4; RevMan: New York, NY, USA, 2020. [Google Scholar]
- Shi, J.Q.; Copas, J.B. Meta-Analysis for Trend Estimation. Stat. Med. 2004, 23, 3–19. [Google Scholar] [CrossRef] [PubMed] [Green Version]
- Greenland, S.; Longnecker, M.P. Methods for Trend Estimation from Summarized Dose-Response Data, with Applications to Meta-Analysis. Am. J. Epidemiol. 1992, 135, 1301–1309. [Google Scholar] [CrossRef]
- DerSimonian, R.; Laird, N. Meta-Analysis in Clinical Trials Revisited. Contemp. Clin. Trials 2015, 45, 139–145. [Google Scholar] [CrossRef] [Green Version]
- Organisation for Economic Co-Operation and Development Pensions at a Glance-2013: Country Profiles. Available online: https://www.oecd.org/els/public-pensions/PAG2013-profile-country.pdf (accessed on 21 November 2020).
- Schernhammer, E.S.; Kroenke, C.H.; Laden, F.; Hankinson, S.E. Night Work and Risk of Breast Cancer. Epidemiology 2006, 17, 108–111. [Google Scholar] [CrossRef]
- Schernhammer, E. 0359 Nighshift Work and Breast Cancer Risk—Good News, Bad News? Occup. Environ. Med. 2014, 71, A121. [Google Scholar] [CrossRef] [Green Version]
- Tynes, T.; Hannevik, M.; Andersen, A.; Vistnes, A.I.; Haldorsen, T. Incidence of Breast Cancer in Norwegian Female Radio and Telegraph Operators. Cancer Causes Control 1996, 7, 197–204. [Google Scholar] [CrossRef]
- Davis, S.; Mirick, D.K.; Stevens, R.G. Night Shift Work, Light at Night, and Risk of Breast Cancer. J. Natl. Cancer Inst. 2001, 93, 1557–1562. [Google Scholar] [CrossRef] [Green Version]
- O’Leary, E.S. Shift Work, Light at Night, and Breast Cancer on Long Island, New York. Am. J. Epidemiol. 2006, 164, 358–366. [Google Scholar] [CrossRef] [Green Version]
- Menegaux, F.; Truong, T.; Anger, A.; Cordina-Duverger, E.; Lamkarkach, F.; Arveux, P.; Kerbrat, P.; Févotte, J.; Guénel, P. Night Work and Breast Cancer: A Population-Based Case-Control Study in France (the CECILE Study). Int. J. Cancer 2013, 132, 924–931. [Google Scholar] [CrossRef] [PubMed]
- Pronk, A.; Ji, B.T.; Shu, X.O.; Xue, S.; Yang, G.; Li, H.L.; Rothman, N.; Gao, Y.T.; Zheng, W.; Chow, W.H. Night-Shift Work and Breast Cancer Risk in a Cohort of Chinese Women. Am. J. Epidemiol. 2010, 171, 953–959. [Google Scholar] [CrossRef] [Green Version]
- Jones, M.E.; Schoemaker, M.J.; McFadden, E.C.; Wright, L.B.; Johns, L.E.; Swerdlow, A.J. Night Shift Work and Risk of Breast Cancer in Women: The Generations Study Cohort. Br. J. Cancer 2019, 121, 172–179. [Google Scholar] [CrossRef] [PubMed]
- Li, W.; Ray, R.M.; Thomas, D.B.; Davis, S.; Yost, M.; Breslow, N.; Gao, D.L.; Fitzgibbons, E.D.; Camp, J.E.; Wong, E.; et al. Shift Work and Breast Cancer among Women Textile Workers in Shanghai, China. Cancer Causes Control 2015, 26, 143–150. [Google Scholar] [CrossRef] [PubMed] [Green Version]
- Lie, J.-A.S.; Kjuus, H.; Zienolddiny, S.; Haugen, A.; Stevens, R.G.; Kjaerheim, K. Night Work and Breast Cancer Risk Among Norwegian Nurses: Assessment by Different Exposure Metrics. Am. J. Epidemiol. 2011, 173, 1272–1279. [Google Scholar] [CrossRef] [PubMed] [Green Version]
- Fritschi, L.; Erren, T.C.; Glass, D.C.; Girschik, J.; Thomson, A.K.; Saunders, C.; Boyle, T.; El-Zaemey, S.; Rogers, P.; Peters, S.; et al. The Association between Different Night Shiftwork Factors and Breast Cancer: A Case–Control Study. Br. J. Cancer 2013, 109, 2472–2480. [Google Scholar] [CrossRef] [PubMed] [Green Version]
- Tsc, L.A.; Wang, F.; Chan, W.C.; Wu, Ç.; Li, M.; Kwok, C.H.; Leung, S.L.; Yu, W.C.; Yu, I.T. 0076 Long-Term Nightshift Work and Breast Cancer Risk in Hong Kong Women: Results Update. Occup. Environ. Med. 2014, 71, A7–A8. [Google Scholar] [CrossRef] [Green Version]
- Wang, F.; Yeung, K.L.; Chan, W.C.; Kwok, C.C.H.; Leung, S.L.; Wu, C.; Chan, E.Y.Y.; Yu, I.T.S.; Yang, X.R.; Tse, L.A. A Meta-Analysis on Dose-Response Relationship between Night Shift Work and the Risk of Breast Cancer. Ann. Oncol. 2013, 24, 2724–2732. [Google Scholar] [CrossRef] [PubMed]
- Ijaz, S.I.; Verbeek, J.H.; Seidler, A.; Lindbohm, M.-L.; Ojajärvi, A.; Orsini, N.; Costa, G.; Neuvonen, K. Night-Shift Work and Breast Cancer—A Systematic Review and Meta-Analysis. Scand. J. Work. Environ. Health 2013, 39, 431–447. [Google Scholar] [CrossRef] [PubMed]
- He, C.; Anand, S.T.; Ebell, M.H.; Vena, J.E.; Robb, S.W. Circadian Disrupting Exposures and Breast Cancer Risk: A Meta-Analysis. Int. Arch. Occup. Environ. Health 2015, 88, 533–547. [Google Scholar] [CrossRef]
- Tse, L.A. Project details. Research Grants Council of Hong Kong. Enquire Project Details by General Public. Available online: https://cerg1.ugc.edu.hk/cergprod/scrrm00542.jsp?proj_id=474811&old_proj_id=null&proj_title=&isname=&ioname=&institution=&subject=&pages=1&year=&theSubmit=474811 (accessed on 28 July 2020).
- Social Security Benefits Planner: Retirement. Retirement Age Calculator. Available online: https://www.ssa.gov/planners/retire/ageincrease.html (accessed on 28 November 2020).
- The State Council. The People’s Republic of China China Plans to Rise Age of Retirement. Available online: http://english.www.gov.cn/state_council/ministries/2016/03/01/content_281475299145295.htm (accessed on 10 November 2020).
- Atav, T.; Jongen, E.; Rabaté, S. Centraal Planbureau. In The Effects of the Increase in the Retirement Age in the Netherlands; Netherlands Bureau for Economic Policy Analysis (CPB): The Hague, The Netherlands, 2019; Available online: https://www.cpb.nl/sites/default/files/omnidownload/CPB-Discussion-Paper-408-The-effects-of-the-increase-in-the-retirement-age-in-the-Netherlands.pdf (accessed on 28 November 2020).
- The Government of Sweden. Ministry of Health and Social Affairs. Government Offices of Sweden Sustainable Pensions: Improved Basic Protection for Pensioners and a Gradual Increase in Retirement Age; Ministry of Health and Social Affairs: Stockholm, Sweden, 2019. Available online: https://www.government.se/articles/2019/06/1.---sustainable-pensions-improved-basic-protection-for-pensioners-and-a-gradual-increase-in-retirement-age/ (accessed on 28 November 2020).
- Check Your State Pension Age—GOV.UK. Available online: https://www.gov.uk/state-pension-age (accessed on 28 November 2020).
- Old Age Pensions. 2008. Available online: https://www.regjeringen.no/en/topics/pensions-and-welfare/innsikt/pensjoner/old-age-pensions/id449656/ (accessed on 28 November 2020).
- OECD; Ageing and Employment Policy Team Denmark. Key Policies to Promote Longer Working Lives. Country Note 2007 to 2017. Secretary General of the OECD. 2018. Available online: https://www.oecd.org/els/emp/Denmark%20Key%20policies_Final.pdf (accessed on 28 November 2020).
- Daniels, D.; Buckmaster, L.; Yeend, P. Parliament of Australia; Social Policy Section Social Security and Other Legislation Amendment (Pension Reform and Other 2009 Budget Measures) Bill; Issuing Body; Item ID: 154004-1001; Parliamentary Library: Canberra, Australia, 2009.
- GovHK Retirement Planning and Tips. Available online: https://www.gov.hk/en/residents/employment/mpf/employees/planandtips.htm (accessed on 28 November 2020).
- Papantoniou, K.; Pozo, O.J.; Espinosa, A.; Marcos, J.; Castano-Vinyals, G.; Basagana, X.; Pages, E.J.; Mirabent, J.; Martin, J.; Such Faro, P.; et al. Increased and Mistimed Sex Hormone Production in Night Shift Workers. Cancer Epidemiol. Biomark. Prev. 2015, 24, 854–863. [Google Scholar] [CrossRef] [Green Version]
- Beral, V. Million Women Study Collaborators Breast Cancer and Hormone-Replacement Therapy in the Million Women Study. Lancet 2003, 362, 419–427. [Google Scholar] [CrossRef]
- Collaborative Group on Hormonal Factors in Breast Cancer. Type and Timing of Menopausal Hormone Therapy and Breast Cancer Risk: Individual Participant Meta-Analysis of the Worldwide Epidemiological Evidence. Lancet 2019, 394, 1159–1168. [Google Scholar] [CrossRef]
- Khan, S.A.; Stickles, S. Cell Proliferation and Apoptosis in the Normal Breast Epithelium of Pre, Peri, and Postmenopausal Women. In Hormonal Carcinogenesis III; Springer: New York, NY, USA, 2001; pp. 418–423. [Google Scholar]
- Milholland, B.; Auton, A.; Suh, Y.; Vijg, J. Millholland Age-Related Somatic Mutations in the Cancer Genome. Oncotarget 2015, 6, 24627–24635. [Google Scholar] [CrossRef] [Green Version]
- Trichopoulos, D.; Lagiou, P.; Adami, H.-O. Towards an Integrated Model for Breast Cancer Etiology: The Crucial Role of the Number of Mammary Tissue-Specific Stem Cells. Breast Cancer Res. 2005, 7, 13–17. [Google Scholar] [CrossRef] [Green Version]
- Terry, M.B.; Michels, K.B.; Brody, J.G.; Byrne, C.; Chen, S.; Jerry, D.J.; Malecki, K.M.C.; Martin, M.B.; Miller, R.L.; Neuhausen, S.L.; et al. Trentham-Dietz A12; Breast Cancer and the Environment Research Program (BCERP). Environmental Exposures during Windows of Susceptibility for Breast Cancer: A Framework for Prevention Research. Breast Cancer Res. 2019, 21, 96. [Google Scholar] [CrossRef] [PubMed] [Green Version]
- Page, M.J.; Higgins, J.P.T.; Clayton, G.; Sterne, J.A.C.; Hróbjartsson, A.; Savović, J. Empirical Evidence of Study Design Biases in Randomized Trials: Systematic Review of Meta-Epidemiological Studies. PLoS ONE 2016, 11, e0159267. [Google Scholar] [CrossRef] [PubMed]
- Härmä, M.; Koskinen, A.; Ropponen, A.; Puttonen, S.; Karhula, K.; Vahtera, J.; Kivimäki, M. Validity of Self-Reported Exposure to Shift Work. Occup. Environ. Med. 2017, 74, 228–230. [Google Scholar] [CrossRef] [PubMed]


| (a) Cohort Studies | |||||||||||||||||||||||
|---|---|---|---|---|---|---|---|---|---|---|---|---|---|---|---|---|---|---|---|---|---|---|---|
| Individual Studies: Main Characteristics | Published Meta-Analyses or Pooled Analyses on Long-Term NSW | ||||||||||||||||||||||
| Wang (2013) [52] | Jia (2013) [10] | Ijaz (2013) [53] | He (2015) [54] | Lin (2015) [11] | Travis (2016) [12] | Cordina Duverger (2018) [30] | Present Meta-Analysis | Present Dose–Response Meta-Analysis | |||||||||||||||
| Author, Study, Year of Publication | Country | Base Population | Ascert. of Breast Cancer | ≥15 yrs NSW | No NSW | Total Cases5 | Follow-Up (yrs) | Lost to Follow-Up | Q | D-R per 5 yrs | ≥15 yrs | D-R per 5 yrs | D-R per 10 yrs | 10–20 yrs | >20 yrs | >20 yrs | >30 yrs | 10–20 yrs | >20 yrs | ≥15 yrs | D-R per 10 yrs | ||
| N 1 | Ca 2 | N 3 | Ca 4 | ||||||||||||||||||||
| Schernhammer NHS I (2001) [20] | USA | Occup (nurses) | SR/HOSP | max 10 | <10% | 7 | X | X | X | X | X | X | X | X | -- | -- | -- | -- | |||||
| Wegrzyn NHS I (2017) [14] | USA | Occup (nurses) | SR/HOSP | 5804 | 427 | 31,746 | 2382 | 2809 | max 24 | <10% | 8 | -- | -- | -- | -- | -- | -- | -- | -- | -- | -- | X | X |
| Schernhammer NHS I and II (2014) [41] | USA | Occup (nurses) | SR/HOSP | max 22 | <10% | 8 | -- | -- | -- | -- | X | -- | -- | -- | -- | -- | -- | ||||||
| Schernhammer NHSII (2006) [40] | USA | Occup (nurses) | SR/HOSP | max 12 | <10% | 7 | X | X | X | X | X | X | X | -- | -- | -- | -- | -- | |||||
| Wegrzyn NHS II (2017) [14] | USA | Occup (nurses) | SR/HOSP | 162 | 35 | 43,529 | 950 | 985 | max 24 | <10% | 8 | -- | -- | -- | -- | -- | -- | -- | -- | -- | -- | X | X |
| Pronk (2010) SWHS based on JEM [46] 6 | CHN | General pop | REG | av 9.0 | 3% | 6 | X | X | -- | X | X | -- | -- | -- | -- | -- | -- | -- | |||||
| Ponk (2010) SWHS based on SR [46] | CHN | Working pop | REG | 5720 | 19 | 51,238 | 276 | 295 | av 4.4 | 3% | 7 | -- | -- | X | -- | -- | -- | X | X | -- | -- | X | X |
| Knutsson WOLF (2013) [28] | SE | General pop | REG | av 12.4 | n/a | 6 | -- | -- | -- | -- | X | -- | -- | -- | -- | -- | -- | -- | |||||
| Koppes Dutch Labor Force (2014) [22] | NL | Working pop | REG | n/a | n/a | 255,900 | 2312 | n/a | av 6.9 | n/a | 4 | -- | -- | -- | -- | X | X | X | -- | -- | -- | X | -- |
| Åkerstedt Salt Study (2015) [13] | SE | Twins | REG | 305 | 18 | 9674 | 354 | 372 | av 8.7 | n/a | 6 | -- | -- | -- | -- | -- | -- | X | -- | -- | -- | X | X |
| Travis (2016) EPIC—Oxford [12] | UK | General pop | REG | 461 | 1 | 19,289 | 153 | 154 | av 3.1 | n/a | 7 | -- | -- | -- | -- | -- | -- | X | -- | -- | -- | X | X |
| Travis Million Women Study (2016) [12] | UK | General pop | REG | 9647 | 89 | 450,232 | 4136 | 4225 | av 2.6 | n/a | 7 | -- | -- | -- | -- | -- | -- | X | X | -- | -- | X | X |
| Jones Generations Study (2019) [47] | UK | General pop | REG | n/a | 60 | 84,888 | 1845 | 1905 | median 9.5 | 4% | 7 | -- | -- | -- | -- | -- | -- | -- | -- | -- | -- | X | X |
| (b)Nested Case-Control and Case-Control Studies | |||||||||||||||||||||||
| Individual Studies: Main Characteristics | Published Meta-Analyses or Pooled Analyses on Long-Term NSW | ||||||||||||||||||||||
| Wang (2013) [52] | Jia (2013) [10] | Ijaz (2013) [53] | He (2015) [54] | Lin (2015) [11] | Travis (2016) [12] | Cordina Duverger (2018) [30] | Present Meta-Anal. | Present Dose–Response Meta-Anal. | |||||||||||||||
| Country | Base Population | Control Selection | Case Ascert | Ratio | LT-NSW Exposed (n) | Participation (%) | Q | D-R per 5 yrs | ≥15 yrs | D-R per 5 yrs | D-R per 10 yrs | 10–20 yrs | >20 yrs | >20 yrs | >30 yrs | 10–20 yrs | >20 yrs | ≥15 yrs | D-R per 10 yrs | ||||
| Controls | Cases | Controls | Cases | ||||||||||||||||||||
| NESTED CASE–CONTROL STUDIES | |||||||||||||||||||||||
| Tynes (1996) [42] | NOR | Occup (radio/tele) | n/a | REG | 4–7:1 | n/a | n/a | 5 | -- | -- | X | -- | -- | -- | -- | -- | -- | -- | -- | -- | |||
| Lie (2006) [21] | NOR | Occup (nurses) | IDS | REG | 4:1 | 417 | 125 | n/a | n/a | 5 | X | -- | X | -- | -- | -- | -- | -- | -- | -- | X | X | |
| Lie (2011) [49] | NOR | Occup (nurses) | IDS | REG | 1.5:1 | 231 | 179 | 65 | 74 | 7 | X | X | X | X | -- | -- | -- | -- | -- | -- | X | X | |
| Hansen (2012a) [17] | DK | Occup (nurses) | IDS | REG | 4:1 | 124 | 39 | 91 | 92 | 7 | X | -- | X | X | -- | -- | -- | -- | -- | -- | X | X | |
| Hansen (2012b) [18] | DK | Occup (military) | IDS | REG | 4:1 | 29 | 12 | 61 | 67 | 8 | X | X | X | X | -- | -- | -- | -- | -- | -- | X | X | |
| Li (2015) [48] | CHN | Occup (textile) | RND | REG | 2.8:1 | n/a | 576 | n/a | n/a | 5 | -- | -- | -- | -- | -- | -- | X | X | -- | -- | X | X | |
| CASE–CONTROL STUDIES | |||||||||||||||||||||||
| Davis (2001) [43] | USA | General pop | RND | REG | 1:1 | 75 | 78 | 5 | X | -- | X | X | -- | -- | -- | -- | -- | -- | -- | -- | |||
| O’ Leary (2006) LIBCSP/EBCLIS [44] | USA | Diverse sources | RND | HOSP | 1:1 | 83 | 87 | 5 | X | -- | X | X | -- | -- | -- | -- | -- | -- | -- | -- | |||
| Pesch GENICA (2010) [15] | DE | General pop | RND | HOSP | 1:1 | 5 | 12 | 67 | 88 | 6 | X | X | X | X | -- | -- | -- | -- | X | X | X | X | |
| Menegaux (2013) [45] | FR | General pop | RND | HOSP | 1:1 | 76 | 79 | 6 | -- | -- | X | X | -- | -- | -- | -- | X | X | -- | -- | |||
| Fritschi (2013) [50] | AUS | General pop | RND | REG | 1.5:1 | 53 | 84 | 41 | 58 | 7 | -- | -- | -- | X | -- | -- | -- | -- | X | X | X | X | |
| Grundy (2013) [16] | CA | BC screening | RND | Mixed 7 | 1:1 | 53 | 65 | V: 54, K: 49 | V: 57 K:59 | 8 | -- | -- | -- | X | -- | -- | -- | -- | X | X | X | X | |
| Tsc (2014 [51,55] | CHN | Hospitalized | CONSEC | HOSP | 1:1 | n/a | n/a | 93 (55) | 91 (55) | 6 | -- | -- | -- | -- | -- | -- | -- | -- | -- | -- | X | -- | |
| Papantoniou (2015) [19] | SP | General pop | RND | HOSP | 1:1 | 97 | 91 | 52 | 72 | 7 | -- | -- | -- | -- | -- | -- | -- | -- | X | X | X | X | |
| (a) Cohort Studies | ||||||||||||||||
|---|---|---|---|---|---|---|---|---|---|---|---|---|---|---|---|---|
| Author, Year of Publication, Study | Exposure Definition | Min. Freq. of NSW/Month | Nonexposure Definition | Exposure Ascertainment | NSW Duration (yrs) | Age at Start of Follow-Up | Follow-Up Period | Mean Age at Start of Follow-Up + Full Follow-Up Period (yrs) | Retirement Age (yrs) | Estimated yrs since Retirement at the End of Follow-Up | Inclusion in our (sub)-Meta-Analyses | |||||
| Direction and Moment | Source | Mean | Range | All BC | Premen BC | Postmen BC | “Recent Long-Term NSW” | |||||||||
| Schernhammer (2001), NHS I [20] | Yrs of rotating night shifts with at least 3 nights/month | 3/m | Never rotating NSW 1 | Retro. at start of follow-up | SR | ≥15 | 57.1 | 42–67 | 1988–1998 | 67.1 | 65 [56] | 2.1 | -- | X | X | X 2 |
| Wegrzyn (2017), NHS I [14] | See Schernhammer (2001) | 3/m | Never rotating NSW 1 | Retro. at start of follow-up | SR | ≥15 | 57.1 | 42–67 | 1988–2012 | 81.1 | 65 [56] | 16.1 | X | -- | -- | -- |
| Wegrzyn (2017), NHS II update [14] | See Schernhammer (2001) | 3/m | Never rotating NSW 1 | Retro. at start of follow-up and 5 updates | SR | ≥20 | 39 | 25–42 | 1989–2013 | 63.0 | 66 [56] | Still working, but no NSW | X | X | -- | X 3 |
| Pronk (2010) SWHS [46] | Starting work after 10 p.m. | 3/m | Never night shifts | Retro. and two yrsafter start of follow-up | SR | >17 | 52.5 | 40–70 | 2000–2007 | 61.5 | 50–55 [57] | 6.5–11.5 | X | -- | -- | -- |
| Koppes (2014), Dutch Labor Force [22] | Occ/regular current work at night, between 0 and 6 a.m. combined with yrs of job tenure | None | No current NSW≥20 yrs same job | Before start of follow-up | JEM | ≥20 | 38 * | 15–64 | 1996–2009 | 51.9 | 65 [58] | Still working | X | -- | -- | X |
| Åkerstedt (2015), Salt twin study [13] | Yrs working at nights at least now and then | None | Not worked nights | Retro. at start of follow-up | SR | 21–45 | 51.6 | 41–60 | 1998–2010 | 63.6 | 65 [59] | Still working | X | -- | -- | X |
| Travis (2016), EPIC-Oxford [12] | Worked regularly at night, on NSW or on call at night | 1/m | Never night shifts | Retro. at start of follow-up | SR | ≥20 | 57.8 | n/a | 2010–2013 | 60.9 | 62 [60] | Still working | X | -- | X | X |
| Travis (2016), MWS [12] | Ever regularly worked at night or on night shifts at any time between 00 and 06 h | 3/m | Never night shifts | Retro. at start of follow-up | SR | ≥20 | 68.6 | n/a | 2011–2013 | 71.2 | 60 [60] | 11.2 | X | -- | X | -- |
| Jones (2019), Generations Study [47] | Any job that regularly involved work in the late evening or night (between 10 p.m. and 7 a.m.) | None | Not being an NSWer within the last ten yrs | At start of follow-up and 1 update 6 yrs after recruitment | SR | ≥20 | 45 ** | 35–55 | 2003–2018 | 60.5 | 60–68 [60] | Still working | X | -- | -- | X |
| (b) Nested Case-Control and Case-Control Studies | ||||||||||||||||
| NESTED CASE CONTROL STUDIES | ||||||||||||||||
| Author, Year of Publication | Exposure Definition | Min. Freq of NSW/month | Non-Exposure Definition | Source of Expo. Ascert | NSW Duration (yrs) | Age at Start of Follow-Up | Mean Age at dx of BC (yrs) [Range] | Mean Age at Start of Follow-Up + Full Follow-Up Period (yrs) | Retirement Age (yrs) | Estimated yrs since Retirement at BC dx | Inclusion in our (sub) Meta-Analyses | |||||
| Mean | Range | All BC | Premen BC | Postmen BC | “Recent Long-Term NSW” | |||||||||||
| Lie (2006) [21] | Work at infirmaries (based on Nurse Registry and census, only considering time after grad) | None | Managerial, teaching, physiotherapy, outpatient department worksite, other than infirmaries | JEM | 15–29 | 39.7 * | 27–85 | 54 * (27–85) | 61.7 | 67 [61] | Still working | X | X | X | X | |
| Lie (2011) [49] | Rotating and permanent night work | 3/m | Never night work | SR | ≥15 | n/a | 20–70 | 54.5 (35–74) | n/a | 67 [61] | Still working | X | -- | -- | X | |
| Hansen (2012a) [17] | Working ≥1 yr during hours between 7 p.m. and 9 a.m. not including overtime | None | Never (<1 year) “after midnight shifts” | SR | ≥20 | 54 * | 31–69 | n/a | 56 | 65 [62] | Still working *** | X | -- | -- | X | |
| Hansen (2012b) [18] | Working ≥1 yr during hours between 5 p.m. and 9 a.m., not including overtime | None | No yrs (<1 yr) of NSW | SR | ≥15 | n/a | 22–75 | n/a | n/a | n/a | X | -- | -- | -- | ||
| Li (2015) [48] | Jobs involving rotating NSW (22.00–06.00 h) according to factory processes | None | No rotating NSW 4 | JEM | 20–27 | 48.9 * | 30–66 | 53.4 | 59.9 | 50 [57] | 3.4 | X | X | X | X 5 | |
| CASE CONTROL STUDIES | ||||||||||||||||
| Author Year of publication, study | Exposure Definition | Min. freq. of NSW/Month | Nonexposure Definition | Source of expo. Ascert | NSW Duration(yrs) | Mean Age at dx of BC (yrs) [Range] | Year of BC- dx | Retirement Age (yrs) | Estimated yrs since Retirement at BC Diagnosis | Inclusion in our (sub) Meta-Analyses | ||||||
| All BC | Premen BC | Postmen BC | “Recent Long-Term NSW” | |||||||||||||
| Pesch (2010) [15] | Ever having worked in NSW for ≥1 year and working the full time period between 0.00 and 5.00 | None | Employed but never in shift work (day shifts only) | SR | ≥20 | 54 (42–62) | 2000–2004 | 65 [63] | Still working | X | -- | -- | X | |||
| Fritschi (2013) [50] | Worked any number of hours between 0.00 and 5 a.m. (graveyard shift) | None | Never graveyard shift | SR | ≥20 | 57 * (18–80) | 2009–2011 | 64.5 [63] | Still working | X | -- | -- | X | |||
| Grundy (2013) [16] | Jobs that started/ended between 11 p.m. and 7 a.m. | None | No yrs in jobs with start or end between 11 p.m. and 7 a.m. | SR | ≥15 | 57 (<80) | 2005–2010 | 65 [39] | Still working | X | X | X | X | |||
| Tsc (2014) [51,55] | Nightshift at least once per month for ≥1 year | 1/m | Permanent day work 6 | SR | ≥15 | 55 (40–69) | 2011–2013 | 65 [64] | Still working | X | X | X | X | |||
| Papantoniou (2015) MCC-Spain [19] | Partly/entirely working between 0 and 6 a.m. | 3/m | Never night work | SR | ≥15 | 56 (23–85) | 2008–2013 | 65 [39] | Still working | X | -- | -- | X | |||
| Meta-Analysis | Wang (2013) [52] | Jia (2013) [10] | Ijaz (2013) [53] | He (2015) [54] | Lin (2015) [11] | Travis (2016) [12] | Cordina-Duverger (2018) [30] | Present Study |
|---|---|---|---|---|---|---|---|---|
| Inclusion Criteria (Study Types) | Cohort, nested case–control, and case–control | Cohort, nested case–control and case–control | Cohort, nested case–control, and case–control | Cohort, nested case–control and case–control | Cohort | Cohort and nested case–control | Case–control | Cohort, nested case–control, and case–control |
| Duration of exposure | ||||||||
| 10–20 years | 1.07 (1.01–1.14) | 0.98 (0.78–1.22) | ||||||
| ≥15 years | 1.15 (1.03–1.29) | 1.13 (1.01–1.27) | ||||||
| ≥20 years | 1.09 (1.01–1.17) | 1.01 (0.93–1.10) | 1.10 (0.87–1.39) | |||||
| ≥30 years | 1.00 (0.87–1.14) | |||||||
| Dose–response meta-analysis | ||||||||
| per 5 years | 1.03 (1.01–1.05) | 1.05 (1.01–1.10) | ||||||
| per 10 years | 1.06 (0.98–1.15) | 1.05 (0.94–1.09) | ||||||
| Sub-meta-analyses | ||||||||
| Premenopausal women | ||||||||
| 10–20 years | 1.05 (0.74–1.47) | |||||||
| ≥15 years | 1.27 (0.96–1.68) | |||||||
| ≥20 years | 1.34 (0.85–2.13) | |||||||
| Postmenopausal women | ||||||||
| 10–20 years | 0.92 (0.68–1.23) | |||||||
| ≥15 years | 1.05 (0.90–1.24) | |||||||
| ≥20 years | 1.04 (0.80–1.36) | |||||||
Publisher’s Note: MDPI stays neutral with regard to jurisdictional claims in published maps and institutional affiliations. |
© 2021 by the authors. Licensee MDPI, Basel, Switzerland. This article is an open access article distributed under the terms and conditions of the Creative Commons Attribution (CC BY) license (https://creativecommons.org/licenses/by/4.0/).
Share and Cite
Schwarz, C.; Pedraza-Flechas, A.M.; Pastor-Barriuso, R.; Lope, V.; de Larrea, N.F.; Jiménez-Moleón, J.J.; Pollán, M.; Pérez-Gómez, B. Long-Term Nightshift Work and Breast Cancer Risk: An Updated Systematic Review and Meta-Analysis with Special Attention to Menopausal Status and to Recent Nightshift Work. Cancers 2021, 13, 5952. https://doi.org/10.3390/cancers13235952
Schwarz C, Pedraza-Flechas AM, Pastor-Barriuso R, Lope V, de Larrea NF, Jiménez-Moleón JJ, Pollán M, Pérez-Gómez B. Long-Term Nightshift Work and Breast Cancer Risk: An Updated Systematic Review and Meta-Analysis with Special Attention to Menopausal Status and to Recent Nightshift Work. Cancers. 2021; 13(23):5952. https://doi.org/10.3390/cancers13235952
Chicago/Turabian StyleSchwarz, Christine, Ana María Pedraza-Flechas, Roberto Pastor-Barriuso, Virginia Lope, Nerea Fernández de Larrea, José Juan Jiménez-Moleón, Marina Pollán, and Beatriz Pérez-Gómez. 2021. "Long-Term Nightshift Work and Breast Cancer Risk: An Updated Systematic Review and Meta-Analysis with Special Attention to Menopausal Status and to Recent Nightshift Work" Cancers 13, no. 23: 5952. https://doi.org/10.3390/cancers13235952