
Type 2 Diabetes-Related Variants Influence the Risk of Developing Prostate Cancer: A Population-Based Case-Control Study and Meta-Analysis

 , , , , , , , , , and
  add
Show full author list
add
Show full author list
Abstract
:Simple Summary
Abstract
1. Introduction
2. Materials and Methods
2.1. Study Population
2.2. SNP Selection and Genotyping
2.3. Statistical Analysis
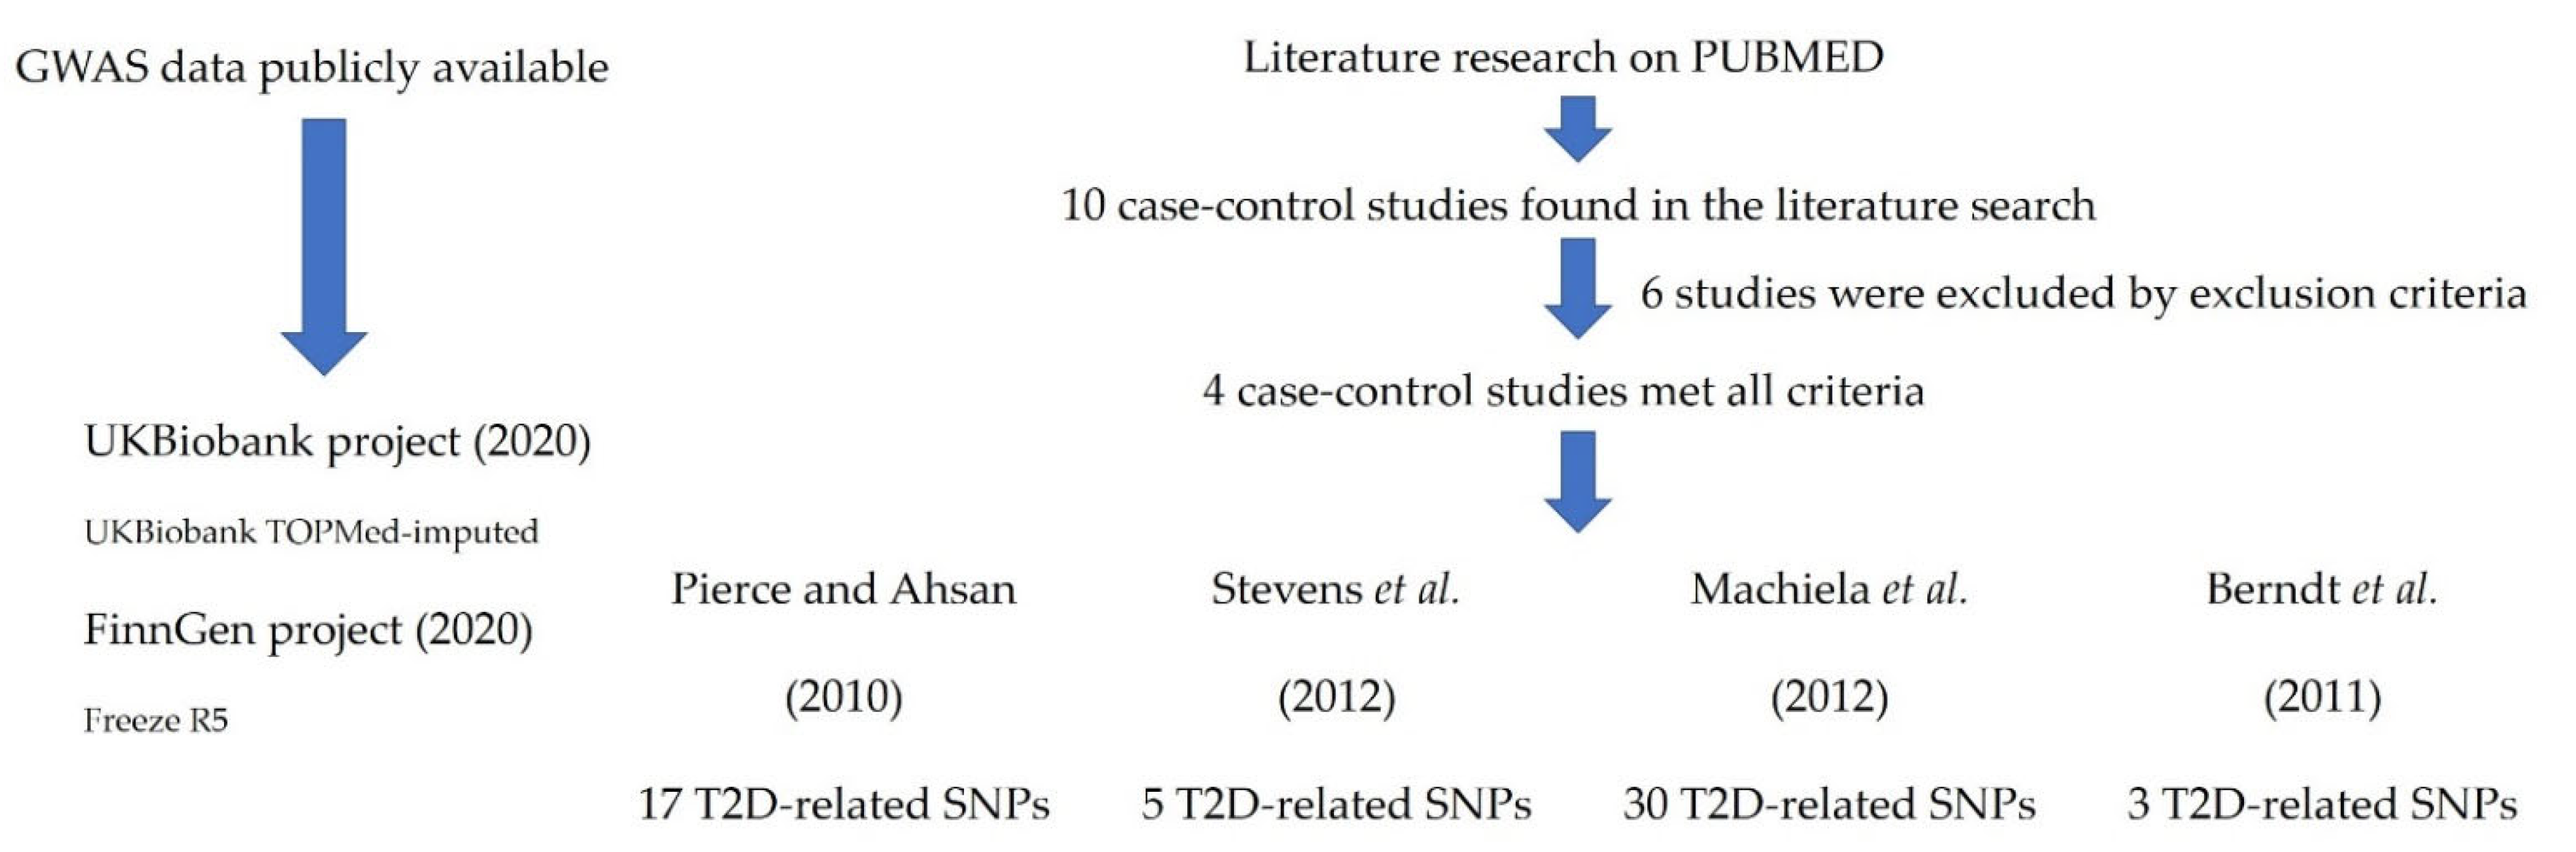
2.4. Meta-Analysis
2.5. cQTL Analysis of the T2D-Related Variants
2.6. Correlation between T2D-Related Polymorphisms and Cell Counts of 91 Blood-Derived Immune Cell Populations and 103 Serum/Plasmatic Immunological Proteins
2.7. Correlation between Steroid Hormone Levels and T2D-Related SNPs
2.8. In Silico Functional Analysis
3. Results
3.1. Overall Associations of Selected SNPs with PCa Risk
3.2. Meta-Analysis
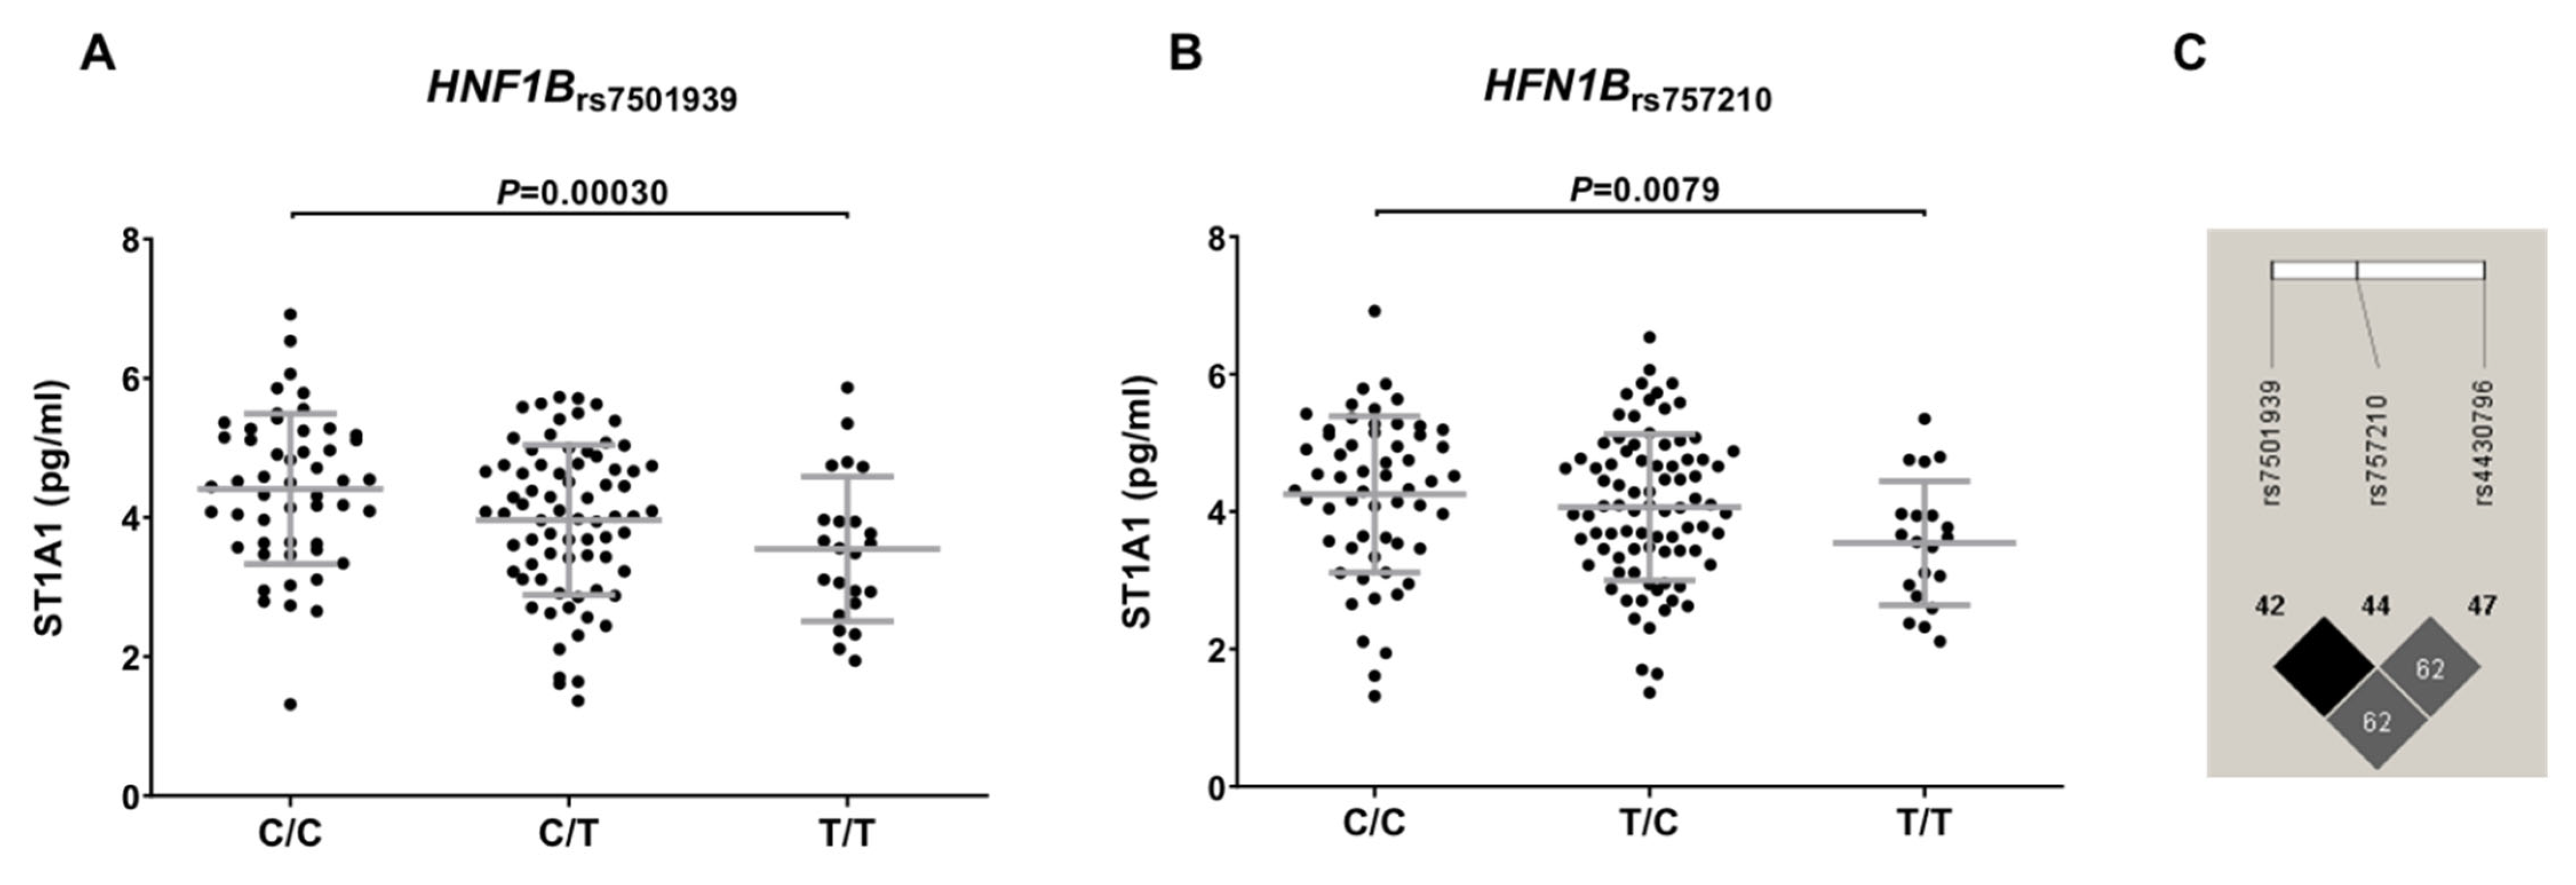
3.3. Functional Characterization of T2D-Related Variants in the HFGP Cohort
4. Discussion
5. Conclusions
Supplementary Materials
Author Contributions
Funding
Institutional Review Board Statement
Informed Consent Statement
Data Availability Statement
Acknowledgments
Conflicts of Interest
References
- Siegel, R.L.; Fedewa, S.A.; Miller, K.D.; Goding-Sauer, A.; Pinheiro, P.S.; Martinez-Tyson, D.; Jemal, A. Cancer statistics for Hispanics/Latinos, 2015. CA Cancer J. Clin. 2015, 65, 457–480. [Google Scholar] [CrossRef] [Green Version]
- Sung, H.; Ferlay, J.; Siegel, R.L.; Laversanne, M.; Soerjomataram, I.; Jemal, A.; Bray, F. Global Cancer Statistics 2020: GLOBOCAN Estimates of Incidence and Mortality Worldwide for 36 Cancers in 185 Countries. CA Cancer. J. Clin. 2021, 71, 209–249. [Google Scholar] [CrossRef]
- Weiner, A.B.; Matulewicz, R.S.; Eggener, S.E.; Schaeffer, E.M. Increasing incidence of metastatic prostate cancer in the United States (2004–2013). Prostate Cancer Prostatic Dis. 2016, 19, 395–397. [Google Scholar] [CrossRef] [Green Version]
- Wong, M.C.; Goggins, W.B.; Wang, H.H.; Fung, F.D.; Leung, C.; Wong, S.Y.; Ng, C.F.; Sung, J.J. Global Incidence and Mortality for Prostate Cancer: Analysis of Temporal Patterns and Trends in 36 Countries. Eur. Urol. 2016, 70, 862–874. [Google Scholar] [CrossRef] [Green Version]
- Hodson, R. Prostate cancer: 4 big questions. Nature 2015, 528, S137. [Google Scholar] [CrossRef] [PubMed] [Green Version]
- Eeles, R.; Goh, C.; Castro, E.; Bancroft, E.; Guy, M.; Al Olama, A.A.; Easton, D.; Kote-Jarai, Z. The genetic epidemiology of prostate cancer and its clinical implications. Nat. Rev. Urol. 2014, 11, 18–31. [Google Scholar] [CrossRef] [PubMed]
- Khan, A.E.; Gallo, V.; Linseisen, J.; Kaaks, R.; Rohrmann, S.; Raaschou-Nielsen, O.; Tjonneland, A.; Johnsen, H.E.; Overvad, K.; Bergmann, M.M.; et al. Diabetes and the risk of non-Hodgkin’s lymphoma and multiple myeloma in the European Prospective Investigation into Cancer and Nutrition. Haematologica 2008, 93, 842–850. [Google Scholar] [CrossRef] [PubMed] [Green Version]
- Richardson, P.G.; Sonneveld, P.; Schuster, M.W.; Stadtmauer, E.A.; Facon, T.; Harousseau, J.L.; Ben-Yehuda, D.; Lonial, S.; Goldschmidt, H.; Reece, D.; et al. Reversibility of symptomatic peripheral neuropathy with bortezomib in the phase III APEX trial in relapsed multiple myeloma: Impact of a dose-modification guideline. Br. J. Haematol. 2009, 144, 895–903. [Google Scholar] [CrossRef]
- Castillo, J.J.; Mull, N.; Reagan, J.L.; Nemr, S.; Mitri, J. Increased incidence of non-Hodgkin lymphoma, leukemia, and myeloma in patients with diabetes mellitus type 2: A meta-analysis of observational studies. Blood 2012, 119, 4845–4850. [Google Scholar] [CrossRef] [Green Version]
- Haring, A.; Murtola, T.J.; Talala, K.; Taari, K.; Tammela, T.L.; Auvinen, A. Antidiabetic drug use and prostate cancer risk in the Finnish Randomized Study of Screening for Prostate Cancer. Scand. J. Urol. 2017, 51, 5–12. [Google Scholar] [CrossRef]
- Murtola, T.J.; Tammela, T.L.; Lahtela, J.; Auvinen, A. Antidiabetic medication and prostate cancer risk: A population-based case-control study. Am. J. Epidemiol. 2008, 168, 925–931. [Google Scholar] [CrossRef]
- Haggstrom, C.; Van Hemelrijck, M.; Zethelius, B.; Robinson, D.; Grundmark, B.; Holmberg, L.; Gudbjornsdottir, S.; Garmo, H.; Stattin, P. Prospective study of Type 2 diabetes mellitus, anti-diabetic drugs and risk of prostate cancer. Int. J. Cancer 2017, 140, 611–617. [Google Scholar] [CrossRef] [Green Version]
- Frayling, T.M.; Colhoun, H.; Florez, J.C. A genetic link between type 2 diabetes and prostate cancer. Diabetologia 2008, 51, 1757–1760. [Google Scholar] [CrossRef] [Green Version]
- Gudmundsson, J.; Sulem, P.; Steinthorsdottir, V.; Bergthorsson, J.T.; Thorleifsson, G.; Manolescu, A.; Rafnar, T.; Gudbjartsson, D.; Agnarsson, B.A.; Baker, A.; et al. Two variants on chromosome 17 confer prostate cancer risk, and the one in TCF2 protects against type 2 diabetes. Nat. Genet. 2007, 39, 977–983. [Google Scholar] [CrossRef]
- Winckler, W.; Weedon, M.N.; Graham, R.R.; McCarroll, S.A.; Purcell, S.; Almgren, P.; Tuomi, T.; Gaudet, D.; Bostrom, K.B.; Walker, M.; et al. Evaluation of common variants in the six known maturity-onset diabetes of the young (MODY) genes for association with type 2 diabetes. Diabetes 2007, 56, 685–693. [Google Scholar] [CrossRef] [Green Version]
- Horikawa, Y.; Iwasaki, N.; Hara, M.; Furuta, H.; Hinokio, Y.; Cockburn, B.N.; Lindner, T.; Yamagata, K.; Ogata, M.; Tomonaga, O.; et al. Mutation in hepatocyte nuclear factor-1 beta gene (TCF2) associated with MODY. Nat. Genet. 1997, 17, 384–385. [Google Scholar] [CrossRef]
- Rios, R.; Lupianez, C.B.; Campa, D.; Martino, A.; Martinez-Lopez, J.; Martinez-Bueno, M.; Varkonyi, J.; Garcia-Sanz, R.; Jamroziak, K.; Dumontet, C.; et al. Type 2 diabetes-related variants influence the risk of developing multiple myeloma: Results from the IMMEnSE consortium. Endocr.-Relat. Cancer 2015, 22, 545–559. [Google Scholar] [CrossRef] [Green Version]
- Sainz, J.; Rudolph, A.; Hoffmeister, M.; Frank, B.; Brenner, H.; Chang-Claude, J.; Hemminki, K.; Forsti, A. Effect of type 2 diabetes predisposing genetic variants on colorectal cancer risk. J. Clin. Endocrinol. Metab. 2012, 97, E845–E851. [Google Scholar] [CrossRef] [Green Version]
- Zhao, Z.; Wen, W.; Michailidou, K.; Bolla, M.K.; Wang, Q.; Zhang, B.; Long, J.; Shu, X.O.; Schmidt, M.K.; Milne, R.L.; et al. Association of genetic susceptibility variants for type 2 diabetes with breast cancer risk in women of European ancestry. Cancer Causes Control 2016, 27, 679–693. [Google Scholar] [CrossRef] [Green Version]
- Pierce, B.L.; Ahsan, H. Genetic susceptibility to type 2 diabetes is associated with reduced prostate cancer risk. Hum. Hered. 2010, 69, 193–201. [Google Scholar] [CrossRef] [Green Version]
- Stevens, V.L.; Ahn, J.; Sun, J.; Jacobs, E.J.; Moore, S.C.; Patel, A.V.; Berndt, S.I.; Albanes, D.; Hayes, R.B. HNF1B and JAZF1 genes, diabetes, and prostate cancer risk. Prostate 2010, 70, 601–607. [Google Scholar] [CrossRef] [Green Version]
- Machiela, M.J.; Lindstrom, S.; Allen, N.E.; Haiman, C.A.; Albanes, D.; Barricarte, A.; Berndt, S.I.; Bueno-de-Mesquita, H.B.; Chanock, S.; Gaziano, J.M.; et al. Association of type 2 diabetes susceptibility variants with advanced prostate cancer risk in the Breast and Prostate Cancer Cohort Consortium. Am. J. Epidemiol. 2012, 176, 1121–1129. [Google Scholar] [CrossRef]
- Waters, K.M.; Wilkens, L.R.; Monroe, K.R.; Stram, D.O.; Kolonel, L.N.; Henderson, B.E.; Le Marchand, L.; Haiman, C.A. No association of type 2 diabetes risk variants and prostate cancer risk: The multiethnic cohort and PAGE. Cancer Epidemiol. Biomark. Prev. 2011, 20, 1979–1981. [Google Scholar] [CrossRef] [Green Version]
- Mottet, N.; Bellmunt, J.; Bolla, M.; Briers, E.; Cumberbatch, M.G.; De Santis, M.; Fossati, N.; Gross, T.; Henry, A.M.; Joniau, S.; et al. EAU-ESTRO-SIOG Guidelines on Prostate Cancer. Part 1: Screening, Diagnosis, and Local Treatment with Curative Intent. Eur. Urol. 2017, 71, 618–629. [Google Scholar] [CrossRef]
- Lyssenko, V.; Nagorny, C.L.; Erdos, M.R.; Wierup, N.; Jonsson, A.; Spegel, P.; Bugliani, M.; Saxena, R.; Fex, M.; Pulizzi, N.; et al. Common variant in MTNR1B associated with increased risk of type 2 diabetes and impaired early insulin secretion. Nat. Genet. 2009, 41, 82–88. [Google Scholar] [CrossRef]
- Zeggini, E.; Scott, L.J.; Saxena, R.; Voight, B.F.; Marchini, J.L.; Hu, T.; de Bakker, P.I.; Abecasis, G.R.; Almgren, P.; Andersen, G.; et al. Meta-analysis of genome-wide association data and large-scale replication identifies additional susceptibility loci for type 2 diabetes. Nat. Genet. 2008, 40, 638–645. [Google Scholar] [CrossRef]
- Mohlke, K.L.; Boehnke, M.; Abecasis, G.R. Metabolic and cardiovascular traits: An abundance of recently identified common genetic variants. Hum. Mol. Genet. 2008, 17, R102–R108. [Google Scholar] [CrossRef]
- Shu, X.O.; Long, J.; Cai, Q.; Qi, L.; Xiang, Y.B.; Cho, Y.S.; Tai, E.S.; Li, X.; Lin, X.; Chow, W.H.; et al. Identification of new genetic risk variants for type 2 diabetes. PLoS Genet. 2010, 6, e1001127. [Google Scholar] [CrossRef] [PubMed]
- Dupuis, J.; Langenberg, C.; Prokopenko, I.; Saxena, R.; Soranzo, N.; Jackson, A.U.; Wheeler, E.; Glazer, N.L.; Bouatia-Naji, N.; Gloyn, A.L.; et al. New genetic loci implicated in fasting glucose homeostasis and their impact on type 2 diabetes risk. Nat. Genet. 2010, 42, 105–116. [Google Scholar] [CrossRef] [PubMed]
- Saxena, R.; Hivert, M.F.; Langenberg, C.; Tanaka, T.; Pankow, J.S.; Vollenweider, P.; Lyssenko, V.; Bouatia-Naji, N.; Dupuis, J.; Jackson, A.U.; et al. Genetic variation in GIPR influences the glucose and insulin responses to an oral glucose challenge. Nat. Genet. 2010, 42, 142–148. [Google Scholar] [CrossRef] [PubMed]
- Voight, B.F.; Scott, L.J.; Steinthorsdottir, V.; Morris, A.P.; Dina, C.; Welch, R.P.; Zeggini, E.; Huth, C.; Aulchenko, Y.S.; Thorleifsson, G.; et al. Twelve type 2 diabetes susceptibility loci identified through large-scale association analysis. Nat. Genet. 2010, 42, 579–589. [Google Scholar] [CrossRef]
- Nielsen, T.; Sparso, T.; Grarup, N.; Jorgensen, T.; Pisinger, C.; Witte, D.R.; Diabetes Genetics, R.; Meta-analysis, C.; Hansen, T.; Pedersen, O. Type 2 diabetes risk allele near CENTD2 is associated with decreased glucose-stimulated insulin release. Diabetologia 2011, 54, 1052–1056. [Google Scholar] [CrossRef] [Green Version]
- Saxena, R.; Voight, B.F.; Lyssenko, V.; Burtt, N.P.; de Bakker, P.I.; Chen, H.; Roix, J.J.; Kathiresan, S.; Hirschhorn, J.N.; Daly, M.J.; et al. Genome-wide association analysis identifies loci for type 2 diabetes and triglyceride levels. Science 2007, 316, 1331–1336. [Google Scholar] [CrossRef]
- Florez, J.C.; Manning, A.K.; Dupuis, J.; McAteer, J.; Irenze, K.; Gianniny, L.; Mirel, D.B.; Fox, C.S.; Cupples, L.A.; Meigs, J.B. A 100K genome-wide association scan for diabetes and related traits in the Framingham Heart Study: Replication and integration with other genome-wide datasets. Diabetes 2007, 56, 3063–3074. [Google Scholar] [CrossRef] [Green Version]
- Scott, L.J.; Mohlke, K.L.; Bonnycastle, L.L.; Willer, C.J.; Li, Y.; Duren, W.L.; Erdos, M.R.; Stringham, H.M.; Chines, P.S.; Jackson, A.U.; et al. A genome-wide association study of type 2 diabetes in Finns detects multiple susceptibility variants. Science 2007, 316, 1341–1345. [Google Scholar] [CrossRef] [Green Version]
- Yamauchi, T.; Hara, K.; Maeda, S.; Yasuda, K.; Takahashi, A.; Horikoshi, M.; Nakamura, M.; Fujita, H.; Grarup, N.; Cauchi, S.; et al. A genome-wide association study in the Japanese population identifies susceptibility loci for type 2 diabetes at UBE2E2 and C2CD4A-C2CD4B. Nat. Genet. 2010, 42, 864–868. [Google Scholar] [CrossRef]
- Takeuchi, F.; Serizawa, M.; Yamamoto, K.; Fujisawa, T.; Nakashima, E.; Ohnaka, K.; Ikegami, H.; Sugiyama, T.; Katsuya, T.; Miyagishi, M.; et al. Confirmation of multiple risk Loci and genetic impacts by a genome-wide association study of type 2 diabetes in the Japanese population. Diabetes 2009, 58, 1690–1699. [Google Scholar] [CrossRef] [Green Version]
- Bouatia-Naji, N.; Bonnefond, A.; Cavalcanti-Proenca, C.; Sparso, T.; Holmkvist, J.; Marchand, M.; Delplanque, J.; Lobbens, S.; Rocheleau, G.; Durand, E.; et al. A variant near MTNR1B is associated with increased fasting plasma glucose levels and type 2 diabetes risk. Nat. Genet. 2009, 41, 89–94. [Google Scholar] [CrossRef]
- Sladek, R.; Rocheleau, G.; Rung, J.; Dina, C.; Shen, L.; Serre, D.; Boutin, P.; Vincent, D.; Belisle, A.; Hadjadj, S.; et al. A genome-wide association study identifies novel risk loci for type 2 diabetes. Nature 2007, 445, 881–885. [Google Scholar] [CrossRef]
- Chambers, J.C.; Elliott, P.; Zabaneh, D.; Zhang, W.; Li, Y.; Froguel, P.; Balding, D.; Scott, J.; Kooner, J.S. Common genetic variation near MC4R is associated with waist circumference and insulin resistance. Nat. Genet. 2008, 40, 716–718. [Google Scholar] [CrossRef]
- Wellcome Trust Case Control Consortium. Genome-wide association study of 14,000 cases of seven common diseases and 3000 shared controls. Nature 2007, 447, 661–678. [Google Scholar] [CrossRef] [Green Version]
- Zeggini, E.; Weedon, M.N.; Lindgren, C.M.; Frayling, T.M.; Elliott, K.S.; Lango, H.; Timpson, N.J.; Perry, J.R.; Rayner, N.W.; Freathy, R.M.; et al. Replication of genome-wide association signals in UK samples reveals risk loci for type 2 diabetes. Science 2007, 316, 1336–1341. [Google Scholar] [CrossRef] [Green Version]
- Bouatia-Naji, N.; Rocheleau, G.; Van Lommel, L.; Lemaire, K.; Schuit, F.; Cavalcanti-Proenca, C.; Marchand, M.; Hartikainen, A.L.; Sovio, U.; De Graeve, F.; et al. A polymorphism within the G6PC2 gene is associated with fasting plasma glucose levels. Science 2008, 320, 1085–1088. [Google Scholar] [CrossRef] [Green Version]
- Chen, W.M.; Erdos, M.R.; Jackson, A.U.; Saxena, R.; Sanna, S.; Silver, K.D.; Timpson, N.J.; Hansen, T.; Orru, M.; Grazia Piras, M.; et al. Variations in the G6PC2/ABCB11 genomic region are associated with fasting glucose levels. J. Clin. Investig. 2008, 118, 2620–2628. [Google Scholar] [CrossRef] [Green Version]
- Prokopenko, I.; Langenberg, C.; Florez, J.C.; Saxena, R.; Soranzo, N.; Thorleifsson, G.; Loos, R.J.; Manning, A.K.; Jackson, A.U.; Aulchenko, Y.; et al. Variants in MTNR1B influence fasting glucose levels. Nat. Genet. 2009, 41, 77–81. [Google Scholar] [CrossRef]
- Vujkovic, M.; Keaton, J.M.; Lynch, J.A.; Miller, D.R.; Zhou, J.; Tcheandjieu, C.; Huffman, J.E.; Assimes, T.L.; Lorenz, K.; Zhu, X.; et al. Discovery of 318 new risk loci for type 2 diabetes and related vascular outcomes among 1.4 million participants in a multi-ancestry meta-analysis. Nat. Genet. 2020, 52, 680–691. [Google Scholar] [CrossRef]
- Kichaev, G.; Bhatia, G.; Loh, P.R.; Gazal, S.; Burch, K.; Freund, M.K.; Schoech, A.; Pasaniuc, B.; Price, A.L. Leveraging Polygenic Functional Enrichment to Improve GWAS Power. Am. J. Hum. Genet. 2019, 104, 65–75. [Google Scholar] [CrossRef] [PubMed] [Green Version]
- Mahajan, A.; Taliun, D.; Thurner, M.; Robertson, N.R.; Torres, J.M.; Rayner, N.W.; Payne, A.J.; Steinthorsdottir, V.; Scott, R.A.; Grarup, N.; et al. Fine-mapping type 2 diabetes loci to single-variant resolution using high-density imputation and islet-specific epigenome maps. Nat. Genet. 2018, 50, 1505–1513. [Google Scholar] [CrossRef] [Green Version]
- Mahajan, A.; Wessel, J.; Willems, S.M.; Zhao, W.; Robertson, N.R.; Chu, A.Y.; Gan, W.; Kitajima, H.; Taliun, D.; Rayner, N.W.; et al. Refining the accuracy of validated target identification through coding variant fine-mapping in type 2 diabetes. Nat. Genet. 2018, 50, 559–571. [Google Scholar] [CrossRef] [Green Version]
- Sandhu, M.S.; Weedon, M.N.; Fawcett, K.A.; Wasson, J.; Debenham, S.L.; Daly, A.; Lango, H.; Frayling, T.M.; Neumann, R.J.; Sherva, R.; et al. Common variants in WFS1 confer risk of type 2 diabetes. Nat. Genet. 2007, 39, 951–953. [Google Scholar] [CrossRef] [Green Version]
- Pechlivanis, S.; Wagner, K.; Chang-Claude, J.; Hoffmeister, M.; Brenner, H.; Forsti, A. Polymorphisms in the insulin like growth factor 1 and IGF binding protein 3 genes and risk of colorectal cancer. Cancer Detect. Prev. 2007, 31, 408–416. [Google Scholar] [CrossRef] [PubMed]
- Rung, J.; Cauchi, S.; Albrechtsen, A.; Shen, L.; Rocheleau, G.; Cavalcanti-Proenca, C.; Bacot, F.; Balkau, B.; Belisle, A.; Borch-Johnsen, K.; et al. Genetic variant near IRS1 is associated with type 2 diabetes, insulin resistance and hyperinsulinemia. Nat. Genet. 2009, 41, 1110–1115. [Google Scholar] [CrossRef] [PubMed]
- Tang, Y.; Han, X.; Sun, X.; Lv, C.; Zhang, X.; Guo, W.; Ren, Q.; Luo, Y.; Zhang, X.; Zhou, X.; et al. Association study of a common variant near IRS1 with type 2 diabetes mellitus in Chinese Han population. Endocrine 2013, 43, 84–91. [Google Scholar] [CrossRef] [PubMed]
- Willer, C.J.; Bonnycastle, L.L.; Conneely, K.N.; Duren, W.L.; Jackson, A.U.; Scott, L.J.; Narisu, N.; Chines, P.S.; Skol, A.; Stringham, H.M.; et al. Screening of 134 single nucleotide polymorphisms (SNPs) previously associated with type 2 diabetes replicates association with 12 SNPs in nine genes. Diabetes 2007, 56, 256–264. [Google Scholar] [CrossRef] [Green Version]
- Gloyn, A.L.; Weedon, M.N.; Owen, K.R.; Turner, M.J.; Knight, B.A.; Hitman, G.; Walker, M.; Levy, J.C.; Sampson, M.; Halford, S.; et al. Large-scale association studies of variants in genes encoding the pancreatic beta-cell KATP channel subunits Kir6.2 (KCNJ11) and SUR1 (ABCC8) confirm that the KCNJ11 E23K variant is associated with type 2 diabetes. Diabetes 2003, 52, 568–572. [Google Scholar] [CrossRef] [Green Version]
- Unoki, H.; Takahashi, A.; Kawaguchi, T.; Hara, K.; Horikoshi, M.; Andersen, G.; Ng, D.P.; Holmkvist, J.; Borch-Johnsen, K.; Jorgensen, T.; et al. SNPs in KCNQ1 are associated with susceptibility to type 2 diabetes in East Asian and European populations. Nat. Genet. 2008, 40, 1098–1102. [Google Scholar] [CrossRef]
- Tsai, F.J.; Yang, C.F.; Chen, C.C.; Chuang, L.M.; Lu, C.H.; Chang, C.T.; Wang, T.Y.; Chen, R.H.; Shiu, C.F.; Liu, Y.M.; et al. A genome-wide association study identifies susceptibility variants for type 2 diabetes in Han Chinese. PLoS Genet. 2010, 6, e1000847. [Google Scholar] [CrossRef] [Green Version]
- Yasuda, K.; Miyake, K.; Horikawa, Y.; Hara, K.; Osawa, H.; Furuta, H.; Hirota, Y.; Mori, H.; Jonsson, A.; Sato, Y.; et al. Variants in KCNQ1 are associated with susceptibility to type 2 diabetes mellitus. Nat. Genet. 2008, 40, 1092–1097. [Google Scholar] [CrossRef]
- Hamid, Y.H.; Urhammer, S.A.; Glumer, C.; Borch-Johnsen, K.; Jorgensen, T.; Hansen, T.; Pedersen, O. The common T60N polymorphism of the lymphotoxin-alpha gene is associated with type 2 diabetes and other phenotypes of the metabolic syndrome. Diabetologia 2005, 48, 445–451. [Google Scholar] [CrossRef] [Green Version]
- Altshuler, D.; Hirschhorn, J.N.; Klannemark, M.; Lindgren, C.M.; Vohl, M.C.; Nemesh, J.; Lane, C.R.; Schaffner, S.F.; Bolk, S.; Brewer, C.; et al. The common PPARgamma Pro12Ala polymorphism is associated with decreased risk of type 2 diabetes. Nat. Genet. 2000, 26, 76–80. [Google Scholar] [CrossRef]
- Qi, L.; Cornelis, M.C.; Kraft, P.; Stanya, K.J.; Linda Kao, W.H.; Pankow, J.S.; Dupuis, J.; Florez, J.C.; Fox, C.S.; Pare, G.; et al. Genetic variants at 2q24 are associated with susceptibility to type 2 diabetes. Hum. Mol. Genet. 2010, 19, 2706–2715. [Google Scholar] [CrossRef] [Green Version]
- Morris, A.P.; Voight, B.F.; Teslovich, T.M.; Ferreira, T.; Segre, A.V.; Steinthorsdottir, V.; Strawbridge, R.J.; Khan, H.; Grallert, H.; Mahajan, A.; et al. Large-scale association analysis provides insights into the genetic architecture and pathophysiology of type 2 diabetes. Nat. Genet. 2012, 44, 981–990. [Google Scholar] [CrossRef]
- Steinthorsdottir, V.; Thorleifsson, G.; Reynisdottir, I.; Benediktsson, R.; Jonsdottir, T.; Walters, G.B.; Styrkarsdottir, U.; Gretarsdottir, S.; Emilsson, V.; Ghosh, S.; et al. A variant in CDKAL1 influences insulin response and risk of type 2 diabetes. Nat. Genet. 2007, 39, 770–775. [Google Scholar] [CrossRef] [Green Version]
- Grant, S.F.; Thorleifsson, G.; Reynisdottir, I.; Benediktsson, R.; Manolescu, A.; Sainz, J.; Helgason, A.; Stefansson, H.; Emilsson, V.; Helgadottir, A.; et al. Variant of transcription factor 7-like 2 (TCF7L2) gene confers risk of type 2 diabetes. Nat. Genet. 2006, 38, 320–323. [Google Scholar] [CrossRef]
- Scott, L.J.; Bonnycastle, L.L.; Willer, C.J.; Sprau, A.G.; Jackson, A.U.; Narisu, N.; Duren, W.L.; Chines, P.S.; Stringham, H.M.; Erdos, M.R.; et al. Association of transcription factor 7-like 2 (TCF7L2) variants with type 2 diabetes in a Finnish sample. Diabetes 2006, 55, 2649–2653. [Google Scholar] [CrossRef] [Green Version]
- Peng, S.; Zhu, Y.; Lu, B.; Xu, F.; Li, X.; Lai, M. TCF7L2 gene polymorphisms and type 2 diabetes risk: A comprehensive and updated meta-analysis involving 121,174 subjects. Mutagenesis 2013, 28, 25–37. [Google Scholar] [CrossRef] [Green Version]
- Zhao, W.; Rasheed, A.; Tikkanen, E.; Lee, J.J.; Butterworth, A.S.; Howson, J.M.M.; Assimes, T.L.; Chowdhury, R.; Orho-Melander, M.; Damrauer, S.; et al. Identification of new susceptibility loci for type 2 diabetes and shared etiological pathways with coronary heart disease. Nat. Genet. 2017, 49, 1450–1457. [Google Scholar] [CrossRef]
- Chen, J.; Spracklen, C.N.; Marenne, G.; Varshney, A.; Corbin, L.J.; Luan, J.; Willems, S.M.; Wu, Y.; Zhang, X.; Horikoshi, M.; et al. The trans-ancestral genomic architecture of glycemic traits. Nat. Genet. 2021, 53, 840–860. [Google Scholar] [CrossRef]
- Grarup, N.; Andersen, G.; Krarup, N.T.; Albrechtsen, A.; Schmitz, O.; Jorgensen, T.; Borch-Johnsen, K.; Hansen, T.; Pedersen, O. Association testing of novel type 2 diabetes risk alleles in the JAZF1, CDC123/CAMK1D, TSPAN8, THADA, ADAMTS9, and NOTCH2 loci with insulin release, insulin sensitivity, and obesity in a population-based sample of 4516 glucose-tolerant middle-aged Danes. Diabetes 2008, 57, 2534–2540. [Google Scholar] [CrossRef] [Green Version]
- Gagliano Taliun, S.A.; VandeHaar, P.; Boughton, A.P.; Welch, R.P.; Taliun, D.; Schmidt, E.M.; Zhou, W.; Nielsen, J.B.; Willer, C.J.; Lee, S.; et al. Exploring and visualizing large-scale genetic associations by using PheWeb. Nat. Genet. 2020, 52, 550–552. [Google Scholar] [CrossRef]
- Berndt, S.I.; Sampson, J.; Yeager, M.; Jacobs, K.B.; Wang, Z.; Hutchinson, A.; Chung, C.; Orr, N.; Wacholder, S.; Chatterjee, N.; et al. Large-scale fine mapping of the HNF1B locus and prostate cancer risk. Hum. Mol. Genet. 2011, 20, 3322–3329. [Google Scholar] [CrossRef] [Green Version]
- Li, Y.; Oosting, M.; Smeekens, S.P.; Jaeger, M.; Aguirre-Gamboa, R.; Le, K.T.T.; Deelen, P.; Ricano-Ponce, I.; Schoffelen, T.; Jansen, A.F.M.; et al. A Functional Genomics Approach to Understand Variation in Cytokine Production in Humans. Cell 2016, 167, 1099–1110.e1014. [Google Scholar] [CrossRef] [Green Version]
- Schirmer, M.; Smeekens, S.P.; Vlamakis, H.; Jaeger, M.; Oosting, M.; Franzosa, E.A.; Horst, R.T.; Jansen, T.; Jacobs, L.; Bonder, M.J.; et al. Linking the Human Gut Microbiome to Inflammatory Cytokine Production Capacity. Cell 2016, 167, 1897.e113. [Google Scholar] [CrossRef] [Green Version]
- Ter Horst, R.; Jaeger, M.; Smeekens, S.P.; Oosting, M.; Swertz, M.A.; Li, Y.; Kumar, V.; Diavatopoulos, D.A.; Jansen, A.F.M.; Lemmers, H.; et al. Host and Environmental Factors Influencing Individual Human Cytokine Responses. Cell 2016, 167, 1111–1124. [Google Scholar] [CrossRef] [Green Version]
- Orru, V.; Steri, M.; Sole, G.; Sidore, C.; Virdis, F.; Dei, M.; Lai, S.; Zoledziewska, M.; Busonero, F.; Mulas, A.; et al. Genetic variants regulating immune cell levels in health and disease. Cell 2013, 155, 242–256. [Google Scholar] [CrossRef] [Green Version]
- Aguirre-Gamboa, R.; Joosten, I.; Urbano, P.C.M.; van der Molen, R.G.; van Rijssen, E.; van Cranenbroek, B.; Oosting, M.; Smeekens, S.; Jaeger, M.; Zorro, M.; et al. Differential Effects of Environmental and Genetic Factors on T and B Cell Immune Traits. Cell Rep 2016, 17, 2474–2487. [Google Scholar] [CrossRef] [Green Version]
- Westra, H.J.; Peters, M.J.; Esko, T.; Yaghootkar, H.; Schurmann, C.; Kettunen, J.; Christiansen, M.W.; Fairfax, B.P.; Schramm, K.; Powell, J.E.; et al. Systematic identification of trans eQTLs as putative drivers of known disease associations. Nat. Genet. 2013, 45, 1238–1243. [Google Scholar] [CrossRef] [Green Version]
- Lewis, S.J.; Murad, A.; Chen, L.; Davey Smith, G.; Donovan, J.; Palmer, T.; Hamdy, F.; Neal, D.; Lane, J.A.; Davis, M.; et al. Associations between an obesity related genetic variant (FTO rs9939609) and prostate cancer risk. PLoS ONE 2010, 5, e13485. [Google Scholar] [CrossRef] [Green Version]
- Yu, D.D.; Guo, S.W.; Jing, Y.Y.; Dong, Y.L.; Wei, L.X. A review on hepatocyte nuclear factor-1beta and tumor. Cell Biosci. 2015, 5, 58. [Google Scholar] [CrossRef] [Green Version]
- Rios-Tamayo, R.; Lupianez, C.B.; Campa, D.; Hielscher, T.; Weinhold, N.; Martinez-Lopez, J.; Jerez, A.; Landi, S.; Jamroziak, K.; Dumontet, C.; et al. A common variant within the HNF1B gene is associated with overall survival of multiple myeloma patients: Results from the IMMEnSE consortium and meta-analysis. Oncotarget 2016, 7, 59029–59048. [Google Scholar] [CrossRef] [PubMed] [Green Version]
- Silva, T.D.; Vidigal, V.M.; Felipe, A.V.; JM, D.E.L.; Neto, R.A.; Saad, S.S.; Forones, N.M. DNA methylation as an epigenetic biomarker in colorectal cancer. Oncol. Lett. 2013, 6, 1687–1692. [Google Scholar] [CrossRef] [PubMed] [Green Version]
- Kim, L.; Liao, J.; Zhang, M.; Talamonti, M.; Bentrem, D.; Rao, S.; Yang, G.Y. Clear cell carcinoma of the pancreas: Histopathologic features and a unique biomarker: Hepatocyte nuclear factor-1beta. Mod. Pathol. 2008, 21, 1075–1083. [Google Scholar] [CrossRef] [PubMed] [Green Version]
- Eeles, R.A.; Kote-Jarai, Z.; Giles, G.G.; Olama, A.A.; Guy, M.; Jugurnauth, S.K.; Mulholland, S.; Leongamornlert, D.A.; Edwards, S.M.; Morrison, J.; et al. Multiple newly identified loci associated with prostate cancer susceptibility. Nat. Genet. 2008, 40, 316–321. [Google Scholar] [CrossRef] [PubMed]
- Thomas, G.; Jacobs, K.B.; Yeager, M.; Kraft, P.; Wacholder, S.; Orr, N.; Yu, K.; Chatterjee, N.; Welch, R.; Hutchinson, A.; et al. Multiple loci identified in a genome-wide association study of prostate cancer. Nat. Genet. 2008, 40, 310–315. [Google Scholar] [CrossRef]
- Chou, H.C.; Lang, N.P.; Kadlubar, F.F. Metabolic activation of N-hydroxy arylamines and N-hydroxy heterocyclic amines by human sulfotransferase(s). Cancer Res. 1995, 55, 525–529. [Google Scholar]
- Nowell, S.; Ratnasinghe, D.L.; Ambrosone, C.B.; Williams, S.; Teague-Ross, T.; Trimble, L.; Runnels, G.; Carrol, A.; Green, B.; Stone, A.; et al. Association of SULT1A1 phenotype and genotype with prostate cancer risk in African-Americans and Caucasians. Cancer Epidemiol. Biomark. Prev. 2004, 13, 270–276. [Google Scholar] [CrossRef] [Green Version]
- Al-Buheissi, S.Z.; Patel, H.R.; Meinl, W.; Hewer, A.; Bryan, R.L.; Glatt, H.; Miller, R.A.; Phillips, D.H. N-Acetyltransferase and sulfotransferase activity in human prostate: Potential for carcinogen activation. Pharmacogenet. Genom. 2006, 16, 391–399. [Google Scholar] [CrossRef]
- Zhu, K.; Li, Y.; Xu, Y. The FTO m(6)A demethylase inhibits the invasion and migration of prostate cancer cells by regulating total m(6)A levels. Life Sci. 2021, 271, 119180. [Google Scholar] [CrossRef]
- Salgado-Montilla, J.L.; Rodriguez-Caban, J.L.; Sanchez-Garcia, J.; Sanchez-Ortiz, R.; Irizarry-Ramirez, M. Impact of FTO SNPs rs9930506 and rs9939609 in Prostate Cancer Severity in a Cohort of Puerto Rican Men. Arch. Cancer Res. 2017, 5, 148. [Google Scholar] [CrossRef] [Green Version]
- Hoffmann, T.J.; Van Den Eeden, S.K.; Sakoda, L.C.; Jorgenson, E.; Habel, L.A.; Graff, R.E.; Passarelli, M.N.; Cario, C.L.; Emami, N.C.; Chao, C.R.; et al. A large multiethnic genome-wide association study of prostate cancer identifies novel risk variants and substantial ethnic differences. Cancer Discov. 2015, 5, 878–891. [Google Scholar] [CrossRef] [Green Version]
- Hoffmann, T.J.; Passarelli, M.N.; Graff, R.E.; Emami, N.C.; Sakoda, L.C.; Jorgenson, E.; Habel, L.A.; Shan, J.; Ranatunga, D.K.; Quesenberry, C.P.; et al. Genome-wide association study of prostate-specific antigen levels identifies novel loci independent of prostate cancer. Nat. Commun. 2017, 8, 14248. [Google Scholar] [CrossRef]
- Conti, D.V.; Darst, B.F.; Moss, L.C.; Saunders, E.J.; Sheng, X.; Chou, A.; Schumacher, F.R.; Olama, A.A.A.; Benlloch, S.; Dadaev, T.; et al. Trans-ancestry genome-wide association meta-analysis of prostate cancer identifies new susceptibility loci and informs genetic risk prediction. Nat. Genet. 2021, 53, 65–75. [Google Scholar] [CrossRef]
- Schumacher, F.R.; Al Olama, A.A.; Berndt, S.I.; Benlloch, S.; Ahmed, M.; Saunders, E.J.; Dadaev, T.; Leongamornlert, D.; Anokian, E.; Cieza-Borrella, C.; et al. Association analyses of more than 140,000 men identify 63 new prostate cancer susceptibility loci. Nat. Genet. 2018, 50, 928–936. [Google Scholar] [CrossRef] [Green Version]
- Sung, Y.; Park, S.; Park, S.J.; Jeong, J.; Choi, M.; Lee, J.; Kwon, W.; Jang, S.; Lee, M.H.; Kim, D.J.; et al. Jazf1 promotes prostate cancer progression by activating JNK/Slug. Oncotarget 2018, 9, 755–765. [Google Scholar] [CrossRef] [Green Version]
- Lee, H.J.D. Early growth retardation and insulin resistance in JAZF1 KO Mice. Diabetes 2011, 60, A103. [Google Scholar]
- Bin Hafeez, B.; Adhami, V.M.; Asim, M.; Siddiqui, I.A.; Bhat, K.M.; Zhong, W.; Saleem, M.; Din, M.; Setaluri, V.; Mukhtar, H. Targeted knockdown of Notch1 inhibits invasion of human prostate cancer cells concomitant with inhibition of matrix metalloproteinase-9 and urokinase plasminogen activator. Clin. Cancer Res. 2009, 15, 452–459. [Google Scholar] [CrossRef] [Green Version]
- Wang, Z.; Li, Y.; Banerjee, S.; Kong, D.; Ahmad, A.; Nogueira, V.; Hay, N.; Sarkar, F.H. Down-regulation of Notch-1 and Jagged-1 inhibits prostate cancer cell growth, migration and invasion, and induces apoptosis via inactivation of Akt, mTOR, and NF-kappaB signaling pathways. J. Cell Biochem. 2010, 109, 726–736. [Google Scholar] [CrossRef]
- Kashat, M.; Azzouz, L.; Sarkar, S.H.; Kong, D.; Li, Y.; Sarkar, F.H. Inactivation of AR and Notch-1 signaling by miR-34a attenuates prostate cancer aggressiveness. Am. J. Transl. Res. 2012, 4, 432–442. [Google Scholar]
- Zhu, H.; Zhou, X.; Redfield, S.; Lewin, J.; Miele, L. Elevated Jagged-1 and Notch-1 expression in high grade and metastatic prostate cancers. Am. J. Transl. Res. 2013, 5, 368–378. [Google Scholar]
- Ye, Q.F.; Zhang, Y.C.; Peng, X.Q.; Long, Z.; Ming, Y.Z.; He, L.Y. Silencing Notch-1 induces apoptosis and increases the chemosensitivity of prostate cancer cells to docetaxel through Bcl-2 and Bax. Oncol. Lett. 2012, 3, 879–884. [Google Scholar] [CrossRef] [Green Version]
- Than, B.L.; Goos, J.A.; Sarver, A.L.; O’Sullivan, M.G.; Rod, A.; Starr, T.K.; Fijneman, R.J.; Meijer, G.A.; Zhao, L.; Zhang, Y.; et al. The role of KCNQ1 in mouse and human gastrointestinal cancers. Oncogene 2014, 33, 3861–3868. [Google Scholar] [CrossRef] [PubMed] [Green Version]
- Jacobs, D.I.; Mao, Y.; Fu, A.; Kelly, W.K.; Zhu, Y. Dysregulated methylation at imprinted genes in prostate tumor tissue detected by methylation microarray. BMC Urol. 2013, 13, 37. [Google Scholar] [CrossRef] [PubMed] [Green Version]
- Shou, J.; Ross, S.; Koeppen, H.; de Sauvage, F.J.; Gao, W.Q. Dynamics of notch expression during murine prostate development and tumorigenesis. Cancer Res. 2001, 61, 7291–7297. [Google Scholar] [PubMed]
- Whelan, J.T.; Kellogg, A.; Shewchuk, B.M.; Hewan-Lowe, K.; Bertrand, F.E. Notch-1 signaling is lost in prostate adenocarcinoma and promotes PTEN gene expression. J. Cell. Biochem. 2009, 107, 992–1001. [Google Scholar] [CrossRef]
- Dankert, J.T.; Wiesehofer, M.; Wach, S.; Czyrnik, E.D.; Wennemuth, G. Loss of RBMS1 as a regulatory target of miR-106b influences cell growth, gap closing and colony forming in prostate carcinoma. Sci. Rep. 2020, 10, 18022. [Google Scholar] [CrossRef]
- Gu, H.; Gu, S.; Zhang, X.; Zhang, S.; Zhang, D.; Lin, J.; Hasengbayi, S.; Han, W. miR-106b-5p promotes aggressive progression of hepatocellular carcinoma via targeting RUNX3. Cancer Med. 2019, 8, 6756–6767. [Google Scholar] [CrossRef]
- Zong, S.; Liu, X.; Zhou, N.; Yue, Y. E2F7, EREG, miR-451a and miR-106b-5p are associated with the cervical cancer development. Arch. Gynecol. Obstet. 2019, 299, 1089–1098. [Google Scholar] [CrossRef]
- Miao, L.J.; Yan, S.; Zhuang, Q.F.; Mao, Q.Y.; Xue, D.; He, X.Z.; Chen, J.P. miR-106b promotes proliferation and invasion by targeting Capicua through MAPK signaling in renal carcinoma cancer. OncoTargets Ther. 2019, 12, 3595–3607. [Google Scholar] [CrossRef] [Green Version]
- Yuan, C.; Zhang, Y.; Tu, W.; Guo, Y. Integrated miRNA profiling and bioinformatics analyses reveal upregulated miRNAs in gastric cancer. Oncol. Lett. 2019, 18, 1979–1988. [Google Scholar] [CrossRef]


| Demographic Characteristics | Study Population (n = 990) | |
|---|---|---|
| Age (years) | 62.35 ± 11.51 | |
| Clinical assessment | ||
| PSA | PSA (4–10) | 137 (46.13) |
| PSA (10–20) | 68 (22.90) | |
| PSA (>20) | 92 (30.97) | |
| Gleason | Gleason (≤7) | 220 (73.58) |
| Gleason (8–10) | 79 (26.42) | |
| TNM Staging system | T1–T2 | 209 (76.28) |
| T3–T4 | 65 (23.72) | |
| Risk | High | 63 (26.58) |
| Intermediate | 79 (33.33) | |
| Low | 95 (40.09) | |
| Gene Name | dbSNP rs# | Nucleotide Substitution | GWAS-Identified Risk Allele for T2D | Location/Aa Substitution | References |
|---|---|---|---|---|---|
| ADAM30 | rs2641348 ɱ | T/C | C | L359P | [25,26] |
| ADAMTS9 | rs4607103 | T/C | C | Near gene | [26,27,28] |
| ADCY5 | rs11708067 | T/C | T | Intronic | [29,30] |
| ADRA2A | rs10885122 | G/T | G | Near ADRA2A | [29] |
| ARAPI, CENTD2 | rs1552224 | C/A | A | Near gene | [31,32] |
| CDC123 | rs12779790 | A/G | G | Near gene | [26,27,28] |
| CDKAL1 | rs7754840 | C/G | C | Intronic | [33,34,35] |
| CDKN2A-2B | rs10811661 | T/C | T | Near gene | [26,27,28,33,35,36,37] |
| COL5A1 | rs4240702 | C/T | n/s | Intronic | [38] |
| CRY2 | rs11605924 | A/C | A | Intronic | [29] |
| DCD | rs1153188 | A/T | A | Near gene | [26] |
| EXT2 | rs1113132 | C/G | C | Intronic | [34,39] |
| FADS1 | rs174550 | C/T | T | Intronic | [29] |
| FAM148B | rs11071657 | A/G | A | Near gene | [29,40] |
| FLJ39370 | rs17044137 | A/T | A | Near gene | [33] |
| FTO | rs9939609 | A/C | A | Intronic | [27,41,42] |
| G6PC2 | rs560887 | G/A | G | Intronic | [29,38,43,44,45] |
| GCK | rs1799884 | G/A | A | Near gene | [29,38,43,44,45] |
| GCKR | rs1260326 | A/G | A | Leu446Pro | [46,47,48,49] |
| HHEX | rs1111875 | G/A | C | Near gene | [27,33,34,35,39,41,42] |
| HMGA2 | rs1531343 | C/G | C | Near gene | [31,32] |
| HNF1A, TCF1 | rs7957197 | A/T | T | Intronic | [31,32] |
| HNF1B, TCF2 | rs7501939 ʯ | C/T | T | Intronic | [14,50] |
| HNF1B, TCF2 | rs757210 | C/T | T | Intronic | [14,31] |
| HNF1B, TCF2 | rs4430796 | G/A | G | Intronic | [14] |
| IGF1 | rs35767 | C/T | C | Near gene | [29,51] |
| IGF2BP2 | rs4402960 | G/T | T | Intronic | [27,33,34,35,42,52] |
| IL13 | rs20541 | C/T | T | R144Q | [33] |
| IRS1 | rs2943641 | C/T | C | Near gene | [31,52,53] |
| JAZF1 | rs864745 | T/C | T | Intronic | [26,28] |
| JAZF1 | rs10486567 | A/G | A | Intronic | [26,28] |
| KCNJ11 | rs5215 | T/C | C | V337I | [27,33,35,41,42,54,55] |
| KCNJ11 | rs5219 ʚ | C/T | T | K23E | |
| KCNQ1 | rs2237897 ʠ | C/T | C | Intronic | [36,56,57,58] |
| KCNQ1 | rs2074196 | G/T | G | Intronic | |
| KCNQ1 | rs2237892 | C/T | C | Intronic | |
| KCNQ1 | rs2237895 | A/C | C | Intronic | |
| KCNQ1OT1 | rs231362 | C/T | G | Intronic | [31,32,57] |
| LTA | rs1041981 | A/C | A | T60N | [59] |
| MADD | rs7944584 | A/T | A | Intronic | [29] |
| MCR4 | rs12970134 | A/G | A | Near gene | [40] |
| MTNR1B | rs1387153 | C/T | T | Near gene | [31,38,45] |
| NOTCH2 | rs10923931 | G/T | T | Intronic | [26,27] |
| PKN2 | rs6698181 | C/T | T | Intergenic | [33] |
| PPARG | rs1801282 | C/G | C | P12A | [26,27,33,35,41,42,54,60] |
| PRC1 | rs8042680 | A/C | A | Intronic | [31,32] |
| PROX1 | rs340874 | A/G | G | Promoter | [29] |
| RBMS1 | rs7593730 | T/C | T | Intronic | [61,62] |
| SLC2A2 | rs11920090 | A/T | T | Intronic | [29] |
| SLC30A8 | rs13266634 | C/T | C | R325W | [27,28,29,33,34,35,39,41,42,63] |
| TCF7L2 | rs7903146 ʞ | C/T | T | Intronic | [27,29,30,33,34,35,39,41,42,63,64,65] |
| TCF7L2 | rs12255372 | G/T | T | Intronic | [66] |
| THADA | rs7578597 | T/C | C | Thr1187Ala | [26,67] |
| TP53INP1 | rs896854 | T/C | A | Intronic | [31,47,67,68] |
| TSPAN8, LGR5 | rs7961581 | C/T | C | Near gene | [69] |
| VEGFA | rs9472138 | C/T | T | Near gene | [26] |
| WFS1 | rs10010131 | A/G | G | Intronic | [50] |
| Variant_dbSNP | Gene | Nucleotide Substitution | Risk Allele | OR (95% CI) † | p |
|---|---|---|---|---|---|
| rs2641348 | ADAM30 | T/C | C | 0.93 (0.66–1.29) | 0.66 |
| rs4607103 | ADAMTS9 | T/C | C | 1.06 (0.83–1.37) | 0.63 |
| rs11708067 | ADCY5 | A/G | G | 1.08 (0.80–1.48) | 0.60 |
| rs10885122 | ADRA2A | G/T | T | 1.12 (0.81–1.55) | 0.49 |
| rs1552224 | ARAPI, CENTD2 | C/A | A | 1.04 (0.76–1.41) | 0.82 |
| rs12779790 | CDC123, CAMK1D | A/G | G | 1.05 (0.80–1.38) | 0.73 |
| rs7754840 | CDKAL1 | C/G | C | 0.69 (0.51–0.95) ¥ | 0.022 |
| rs10811661 | CDKN2A-2B | T/C | T | 0.84 (0.64–1.10) | 0.22 |
| rs4240702 | COL5A1 | C/T | T | 0.82 (0.66–1.02) | 0.082 |
| rs11605924 | CRY2 | A/C | A | 1.03 (0.83–1.28) | 0.79 |
| rs1153188 | DCD | A/T | T | 0.93 (0.73–1.18) | 0.55 |
| rs1113132 | EXT2 | C/G | C | 1.02 (0.80–1.30) | 0.13 |
| rs174550 | FADS1 | C/T | C | 0.96 (0.76–1.22) | 0.75 |
| rs11071657 | FAM148B | A/G | G | 1.16 (0.94–1.44) | 0.16 |
| rs17044137 | FLJ39370 | A/T | A | 0.68 (0.49–0.94) ¥ | 0.021 |
| rs9939609 | FTO | A/C | A | 0.80 (0.63–0.99) | 0.046 |
| rs560887 | G6PC2 | G/A | G | 1.15 (0.90–1.46) | 0.28 |
| rs1799884 | GCK | G/A | A | 1.07 (0.80–1.44) | 0.65 |
| rs1260326 | GCKR | C/T | T | 0.93 (0.73–1.20) | 0.60 |
| rs1111875 | HHEX | C/T | C | 0.90 (0.72–1.13) | 0.36 |
| rs1531343 | HMGA2 | C/G | C | 0.74 (0.53–1.02) | 0.068 |
| rs7957197 | HNF1A (TCF1) | A/T | T | 0.82 (0.63–1.07) | 0.16 |
| rs7501939 | HNF1B (TCF2) | C/T | T | 0.70 (0.50–0.96) ¥ | 0.030 |
| rs757210 | HNF1B (TCF2) | C/T | T | 0.67 (0.48–0.95) ¥ | 0.024 |
| rs4430796 | HNF1B (TCF2) | G/A | G | 0.73 (0.50–1.06) ¥ | 0.10 |
| rs35767 | IGF1 | C/T | C | 0.87 (0.66–1.14) | 0.30 |
| rs4402960 | IGF2BP2 | G/T | T | 1.66 (1.03–2.68) § | 0.037 |
| rs20541 | IL13 | C/T | T | 0.82 (0.60–1.11) | 0.20 |
| rs2943641 | IRS1 | C/T | C | 0.97 (0.77–1.21) | 0.80 |
| rs864745 | JAZF1 | T/C | T | 1.05 (0.84–1.30) | 0.67 |
| rs10486567 | JAZF1 | A/G | A | 0.69 (0.52–0.91) | 0.011 |
| rs5215 | KCNJ11 | T/C | C | 0.87 (0.70–1.08) | 0.21 |
| rs5219 | KCNJ11 | C/T | T | 0.89 (0.71–1.11) | 0.29 |
| rs2237897 | KCNQ1 | C/T | C | 0.66 (0.44–0.98) | 0.041 |
| rs2074196 | KCNQ1 | G/T | T | 0.99 (0.53–1.84) | 0.97 |
| rs2237892 | KCNQ1 | C/T | C | 0.41 (0.26–0.66) | 0.0002 |
| rs2237895 | KCNQ1 | A/C | C | 0.92 (0.73–1.17) | 0.50 |
| rs231362 | KCNQ1OT1 | C/T | C | 0.94 (0.75–1.18) | 0.61 |
| rs1041981 | LTA | A/C | A | 0.87 (0.68–1.12) | 0.29 |
| rs7944584 | MADD | A/T | T | 1.16 (0.93–1.46) | 0.18 |
| rs12970134 | MCR4 | A/G | A | 0.85 (0.66–1.11) | 0.25 |
| rs1387153 | MTNR1B | C/T | T | 0.81 (0.63–1.04) | 0.10 |
| rs10923931 | NOTCH2 | G/T | T | 0.92 (0.66–1.28) | 0.63 |
| rs6698181 | PKN2 | C/T | T | 0.90 (0.72–1.13) | 0.39 |
| rs1801282 | PPARG | C/G | C | 0.99 (0.70–1.42) | 0.98 |
| rs8042680 | PRC1 | A/C | A | 1.10 (0.87–1.37) | 0.40 |
| rs340874 | PROX1 | A/G | G | 0.89 (0.72–1.10) | 0.29 |
| rs7593730 | RBMS1 | C/T | T | 0.77 (0.59–1.02) | 0.070 |
| rs11920090 | SLC2A2 | A/T | T | 0.81 (0.59–1.12) | 0.20 |
| rs13266634 | SLC30A8 | C/T | C | 0.83 (0.65–1.05) | 0.11 |
| rs7903146 | TCF7L2 | C/T | T | 1.01 (0.80–1.29) | 0.91 |
| rs12255372 | TCF7L2 | G/T | T | 1.85 (1.20–2.86) § | 0.005 |
| rs7578597 | THADA | T/C | C | 0.93 (0.58–1.49) | 0.76 |
| rs896854 | TP53INP1 | G/A | A | 0.73 (0.52–1.03) ¥ | 0.070 |
| rs7961581 | TSPAN8, LGR5 | C/T | C | 1.72 (1.07–2.76) § | 0.024 |
| rs9472138 | VEGFA | C/T | T | 1.04 (0.81–1.32) | 0.78 |
| rs10010131 | WFS1 | A/G | G | 0.90 (0.72–1.13) | 0.39 |
| Study Population (304 PCa Cases and 686 Controls) | UKBiobank (2020) (5993 PCa Cases and 168,999 Controls) | FinnGen (2020) (6311 PCa Cases and 74,685 Controls) | Machiela et al. (2012) (2782 PCa Cases and 4458 Controls) | Pierce and Ahsan (2010) (1230 PCa Cases and 1160 Controls) | Stevens et al. (2010) (2935 PCa Cases and 2932 Controls) | Berndt et al. (2011) (10,272 PCa Cases and 9123 Controls) | Meta-Analysis (29,827 PCa Cases and 262,042 Controls) | |||||
|---|---|---|---|---|---|---|---|---|---|---|---|---|
| SNP | Gene_SNP | Risk Allele | OR (95% CI) a | OR (95% CI) a | OR (95% CI) a | OR (95% CI) a | OR (95% CI) a | OR (95% CI) a | OR (95% CI) a | OR (95% CI) a | p Value | PHet |
| rs2641348 | ADAM30 | C | 0.93 (0.66–1.29) | 0.95 (0.89–1.01) | 0.96 (0.90–1.02) | - | 0.87 (0.71–1.05) | - | - | 0.95 (0.91–0.99) | 0.020 | 0.826 |
| rs4607103 | ADAMTS9 | C | 1.07 (0.83–1.37) | 1.02 (0.97–1.07) | 0.97 (0.93–1.02) | 0.99 (0.91–1.08) | 0.98 (0.85–1.12) η | - | - | 0.99 (0.96–1.02) | 0.660 | 0.641 |
| rs11708067 | ADCY5 | G | 1.09 (0.80–1.48) | 1.00 (0.96–1.05) | 0.99 (0.94–1.05) | 0.91 (0.84–0.99) | - | - | - | 0.98 (0.94–1.02) | 0.307 | 0.217 |
| rs10885122 | ADRA2A | T | 1.12 (0.81–1.54) | 0.99 (0.94–1.05) | 1.00 (0.94–1.06) | - | - | - | - | 1.00 (0.96–1.04) | 0.863 | 0.750 |
| rs1552224 | ARAPI | A | 1.04 (0.76–1.41) | 1.00 (0.95–1.06) | 1.00 (0.95–1.05) | 1.00 (0.91–1.10) | - | - | - | 1.00 (0.96–1.03) | 0.948 | 0.951 |
| rs12779790 | CDC123 | G | 1.05 (0.80–1.37) | 1.04 (0.99–1.09) | 0.98 (0.93–1.03) | 1.06 (0.97–1.16) | 1.03 (0.89–1.19) ξ | - | - | 1.02 (0.99–1.05) | 0.251 | 0.441 |
| rs7754840 | CDKAL1 | C | 0.80 (0.63–1.02) | 1.00 (0.96–1.05) | 1.03 (0.98–1.07) | 1.04 (0.97–1.13) | 1.00 (0.88–1.14) # | - | - | 1.01 (0.98–1.05) | 0.316 | 0.283 |
| rs10811661 | CDKN2A-2B | T | 0.84 (0.64–1.10) | 1.02 (0.97–1.07) | 0.95 (0.90–1.01) | 0.91 (0.83–1.00) | - | - | - | 0.98 (0.94–1.01) | 0.168 | 0.063 |
| rs4240702 | COL5A1 | T | 0.83 (0.67–1.03) | 1.00 (0.97–1.04) | 1.01 (0.97–1.05) | - | - | - | - | 1.00 (0.97–1.03) | 0.907 | 0.211 |
| rs11605924 | CRY2 | A | 1.03 (0.82–1.28) | 1.01 (0.97–1.04) | 1.00 (0.95–1.04) | - | - | - | - | 1.01 (0.98–1.03) | 0.637 | 0.924 |
| rs1153188 | DCD | T | 0.93 (0.73–1.18) | 0.97 (0.93–1.02) | 0.98 (0.93–1.03) | - | - | - | - | 0.97 (0.94–1.01) | 0.122 | 0.892 |
| rs1113132 | EXT2 | C | 0.93 (0.73–1.19) | 0.99 (0.95–1.02) | 1.01 (0.97–1.06) | - | - | - | - | 1.00 (0.97–1.02) | 0.890 | 0.646 |
| rs174550 | FADS1 | C | 0.96 (0.76–1.21) | 0.98 (0.94–1.02) | 0.98 (0.94–1.03) | - | - | - | - | 0.98 (0.95–1.01) | 0.182 | 0.985 |
| rs11071657 | FAM148B | G | 1.16 (0.94–1.44) | 1.02 (0.98–1.06) | 1.01 (0.96–1.05) | - | - | - | - | 1.02 (0.99–1.05) | 0.227 | 0.456 |
| rs17044137 | FLJ39370 | A | 0.79 (0.61–1.03) | 1.02 (0.98–1.07) | 0.94 (0.90–0.99) | - | - | - | - | 0.98 (0.95–1.01) | 0.199 | 0.013 |
| rs9939609 | FTO | A | 0.80 (0.63–0.99) | 0.96 (0.92–1.00) | 0.96 (0.92–1.00) | 0.93 (0.86–1.00) | 0.87 (0.77–0.98) δ | 0.93 (0.85–1.02) ς | - | 0.95 (0.92–0.97) | 3.70 × 10⁻⁵ | 0.388 |
| rs560887 | G6PC2 | G | 1.15 (0.90–1.46) | 1.02 (0.98–1.07) | 0.96 (0.92–1.01) | - | - | - | - | 1.00 (0.94–1.06) | 0.705 | 0.088 |
| rs1799884 | GCK | A | 1.07 (0.80–1.44) | 1.03 (0.98–1.08) | 0.99 (0.93–1.06) | 1.06 (0.96–1.16) ∂ | - | - | - | 1.02 (0.99–1.06) | 0.220 | 0.643 |
| rs1260326 | GCKR | C | 1.07 (0.83–1.37) | 0.99 (0.96–1.03) | 0.98 (0.94–1.02) | 0.98 (0.91–1.05) ∏ | - | - | - | 0.99 (0.97–1.00) | 0.170 | 0.889 |
| rs1111875 | HHEX | C | 0.90 (0.72–1.13) | 1.01 (0.97–1.05) | 1.01 (0.97–1.05) | 1.01 (0.94–1.09) | 0.98 (0.87–1.10) | - | - | 1.01 (0.98–1.03) | 0.586 | 0.876 |
| rs1531343 | HMGA2 | C | 0.74 (0.53–1.20) | 0.98 (0.92–1.04) | 1.01 (0.97–1.05) | 0.98 (0.88–1.10) | - | - | - | 0.99 (0.94–1.03) | 0.534 | 0.512 |
| rs7957197 | HNF1A | T | 0.82 (0.63–1.07) | 1.01 (0.97–1.06) | 0.99 (0.94–1.04) | 0.96 (0.88–1.05) | - | - | - | 0.99 (0.96–1.02) | 0.673 | 0.370 |
| rs7501939 | HNF1B | T | 0.84 (0.67–1.05) | 0.83 (0.80–0.86) | 0.83 (0.79–0.87) | - | - | 0.87 (0.80–0.94) | 0.84 (0.80–0.87) | 0.84 (0.82–0.86) | 9.39 × 10−54 | 0.873 |
| rs757210 | HNF1B | T | 0.84 (0.67–1.04) | 0.84 (0.81–0.88) | 0.82 (0.79–0.86) | 0.85 (0.79–0.92) | - | 0.85 (0.79–0.92) | 0.84 (0.80–0.88) | 0.84 (0.82–0.86) | 5.04 × 10−54 | 0.902 |
| rs4430796 | HNF1B | G | 0.89 (0.71–1.12) | 0.81 (0.79–0.85) | 0.82 (0.78–0.85) | - | 0.87 (0.77–0.97) | 0.85 (0.79–0.92) | 0.81 (0.77–0.84) | 0.82 (0.80–0.84) | 1.19 × 10−71 | 0.688 |
| rs35767 | IGF1 | C | 0.87 (0.66–1.13) | 0.99 (0.94–1.04) | 1.01 (0.96–1.06) | - | - | - | - | 1.00 (0.96–1.03) | 0.901 | 0.516 |
| rs4402960 | IGF2BP2 | T | 1.05 (0.83–1.32) | 0.99 (0.95–1.03) | 1.00 (0.95–1.04) | 1.03 (0.95–1.11) | 0.91 (0.81–1.04) | - | - | 0.99 (0.97–1.02) | 0.733 | 0.552 |
| rs20541 | IL13 | T | 0.82 (0.60–1.11) | 0.97 (0.93–1.02) | 1.04 (0.99–1.08) | - | - | - | - | 1.00 (0.93–1.06) | 0.788 | 0.042 |
| rs2943641 | IRS1 | C | 0.97 (0.77–1.21) | 1.01 (0.97–1.05) | 1.02 (0.98–1.06) | 0.95 (0.88–1.02) | - | - | - | 1.01 (0.98–1.03) | 0.641 | 0.403 |
| rs864745 | JAZF1 | T | 1.05 (0.84–1.30) | 1.02 (0.98–1.06) | 0.99 (0.95–1.03) | 1.08 (1.01–1.16) | 0.98 (0.87–1.10) ℵ | - | - | 1.02 (0.99–1.05) | 0.269 | 0.283 |
| rs10486567 | JAZF1 | A | 0.69 (0.52–0.91) | 0.87 (0.83–0.91) | 0.86 (0.82–0.91) | - | - | 0.86 (0.73–0.94) | - | 0.86 (0.83–0.89) | 1.66 × 10⁻¹⁸ | 0.459 |
| rs5215 | KCNJ11 | C | 0.87 (0.70–1.08) | 1.02 (0.98–1.06) | 0.99 (0.95–1.03) | 1.01 (0.94–1.09) | 0.89 (0.78–1.00) | - | - | 0.99 (0.96–1.03) | 0.921 | 0.182 |
| rs5219 | KCNJ11 | T | 0.89 (0.71–1.11) | 1.02 (0.98–1.06) | 0.99 (0.95–1.04) | - | - | - | - | 1.00 (0.97–1.04) | 0.746 | 0.349 |
| rs2237897 | KCNQ1 | C | 0.66 (0.44–0.98) | 0.94 (0.86–1.04) | 0.98 (0.91–1.06) | - | - | - | - | 0.94 (0.86–1.04) | 0.136 | 0.148 |
| rs2074196 | KCNQ1 | T | 0.99 (0.53–1.84) | 1.03 (0.94–1.14) | 0.97 (0.88–1.07) | - | - | - | - | 1.00 (0.93–1.07) | 0.996 | 0.693 |
| rs2237892 | KCNQ1 | C | 0.41 (0.26–0.66) | 0.98 (0.91–1.06) | 1.02 (0.93–1.12) | 0.85 (0.74–0.98) | 0.88 (0.69–1.12) | - | - | 0.89 (0.78–1.02) | 0.105 | 0.001 |
| rs2237895 | KCNQ1 | C | 0.92 (0.73–1.16) | 0.99 (0.95–1.03) | 0.96 (0.92–1.00) | - | - | - | - | 0.97 (0.95–1.00) | 0.078 | 0.517 |
| rs231362 | KCNQ1OT1 | C | 0.94 (0.75–1.18) | 0.99 (0.96–1.03) | 1.03 (0.99–1.08) | 0.92 (0.86–0.98) | - | - | - | 0.99 (0.94–1.03) | 0.515 | 0.042 |
| rs1041981 | LTA | A | 0.88 (0.69–1.13) | 0.95 (0.91–0.99) | 0.99 (0.94–1.04) | - | - | - | - | 0.96 (0.93–1.00) | 0.028 | 0.359 |
| rs7944584 | MADD | T | 1.16 (0.93–1.46) | 1.03 (0.99–1.07) | 1.04 (0.99–1.10) | - | - | - | - | 1.04 (1.00–1.07) | 0.026 | 0.585 |
| rs12970134 | MCR4 | A | 0.85 (0.65–1.11) | 0.99 (0.95–1.04) | 0.99 (0.94–1.04) | - | - | - | - | 0.99 (0.95–1.02) | 0.466 | 0.541 |
| rs1387153 | MTNR1B | T | 0.81 (0.63–1.04) | 1.02 (0.97–1.06) | 0.98 (0.94–1.03) | 1.10 (1.01–1.19) ς | - | - | - | 1.01 (0.96–1.08) | 0.517 | 0.029 |
| rs10923931 | NOTCH2 | T | 0.92 (0.66–1.28) | 0.95 (0.90–1.01) | 0.95 (0.89–1.01) | 0.86 (0.76–0.96) | 0.87 (0.71–1.05) * | - | - | 0.94 (0.90–0.97) | 8.49 × 10⁻⁴ | 0.552 |
| rs6698181 | PKN2 | T | 0.90 (0.72–1.13) | 0.99 (0.96–1.03) | 1.01 (0.96–1.06) | - | - | - | - | 0.99 (0.97–1.02) | 0.732 | 0.551 |
| rs1801282 | PPARG | C | 1.00 (0.70–1.42) | 1.01 (0.95–1.06) | 1.00 (0.94–1.05) | 0.96 (0.87–1.07) | 0.88 (0.74–1.04) | - | - | 0.99 (0.96–1.03) | 0.733 | 0.596 |
| rs8042680 | PRC1 | A | 1.10 (0.87–1.37) | 0.99 (0.95–1.03) | 0.96 (0.91–0.99) | 1.04 (0.97–1.12) | - | - | - | 0.99 (0.95–1.03) | 0.300 | 0.204 |
| rs340874 | PROX1 | G | 0.89 (0.72–1.10) | 1.01 (0.97–1.05) | 1.00 (0.96–1.05) | 1.01 (0.94–1.08) | - | - | - | 1.00 (0.98–1.03) | 0.758 | 0.708 |
| rs7593730 | RBMS1 | T | 0.77 (0.59–1.02) | 1.07 (1.03–1.12) | 1.03 (0.98–1.09) | - | - | - | - | 1.03 (0.96–1.11) | 0.004 | 0.045 |
| rs11920090 | SLC2A2 | T | 0.82 (0.59–1.12) | 0.94 (0.89–0.99) | 0.99 (0.93-1.06) | - | - | - | - | 0.96 (0.92–1.00) | 0.036 | 0.307 |
| rs13266634 | SLC30A8 | C | 0.83 (0.65–1.05) | 0.99 (0.95–1.03) | 1.00 (0.96–1.05) | 1.00 (0.93–1.08) | 0.97 (0.86–1.11) | - | - | 0.99 (0.96–1.02) | 0.551 | 0.659 |
| rs7903146 | TCF7L2 | T | 1.01 (0.80–1.29) | 1.04 (1.00–1.08) | 0.99 (0.94–1.04) | 0.90 (0.83–0.97) | 0.97 (0.85–1.10) | - | - | 0.98 (0.93–1.03) | 0.872 | 0.047 |
| rs12255372 | TCF7L2 | T | 1.17 (0.94–1.46) | 1.02 (0.98–1.06) | 0.97 (0.92–1.02) | - | - | - | - | 1.00 (0.96–1.06) | 0.778 | 0.123 |
| rs7578597 | THADA | T | 1.08 (0.67–1.72) | 1.05 (0.98–1.11) | 1.04 (0.95–1.14) | 1.03 (0.91–1.16) | 1.10 (0.92–1.32) Ϯ | - | - | 1.05 (1.00–1.10) | 0.044 | 0.982 |
| rs896854 | TP53INP1 | T | 0.88 (0.71–1.10) | 0.99 (0.95–1.02) | 0.99 (0.94–1.03) | 1.02 (0.95–1.09) | - | - | - | 0.99 (0.97–1.02) | 0.570 | 0.615 |
| rs7961581 | TSPAN8 | C | 1.19 (0.94–1.51) | 0.98 (0.94–1.02) | 1.00 (0.95–1.05) | 1.05 (0.97–1.13) | 1.04 (0.92–1.19) τ | - | - | 1.00 (0.97–1.04) | 0.924 | 0.295 |
| rs9472138 | VEGFA | T | 1.04 (0.82–1.33) | 1.01 (0.97–1.05) | 0.98 (0.94–1.03) | - | - | - | - | 1.00 (0.97–1.03) | 0.877 | 0.586 |
| rs10010131 | WFS1 | G | 0.90 (0.72–1.13) | 0.99 (0.95–1.02) | 1.01 (0.97–1.05) | 1.00 (0.93–1.07) | - | - | - | 1.00 (0.97–1.02) | 0.859 | 0.716 |
Publisher’s Note: MDPI stays neutral with regard to jurisdictional claims in published maps and institutional affiliations. |
© 2022 by the authors. Licensee MDPI, Basel, Switzerland. This article is an open access article distributed under the terms and conditions of the Creative Commons Attribution (CC BY) license (https://creativecommons.org/licenses/by/4.0/).
Share and Cite
Sánchez-Maldonado, J.M.; Collado, R.; Cabrera-Serrano, A.J.; Ter Horst, R.; Gálvez-Montosa, F.; Robles-Fernández, I.; Arenas-Rodríguez, V.; Cano-Gutiérrez, B.; Bakker, O.; Bravo-Fernández, M.I.; et al. Type 2 Diabetes-Related Variants Influence the Risk of Developing Prostate Cancer: A Population-Based Case-Control Study and Meta-Analysis. Cancers 2022, 14, 2376. https://doi.org/10.3390/cancers14102376
Sánchez-Maldonado JM, Collado R, Cabrera-Serrano AJ, Ter Horst R, Gálvez-Montosa F, Robles-Fernández I, Arenas-Rodríguez V, Cano-Gutiérrez B, Bakker O, Bravo-Fernández MI, et al. Type 2 Diabetes-Related Variants Influence the Risk of Developing Prostate Cancer: A Population-Based Case-Control Study and Meta-Analysis. Cancers. 2022; 14(10):2376. https://doi.org/10.3390/cancers14102376
Chicago/Turabian StyleSánchez-Maldonado, José Manuel, Ricardo Collado, Antonio José Cabrera-Serrano, Rob Ter Horst, Fernando Gálvez-Montosa, Inmaculada Robles-Fernández, Verónica Arenas-Rodríguez, Blanca Cano-Gutiérrez, Olivier Bakker, María Inmaculada Bravo-Fernández, and et al. 2022. "Type 2 Diabetes-Related Variants Influence the Risk of Developing Prostate Cancer: A Population-Based Case-Control Study and Meta-Analysis" Cancers 14, no. 10: 2376. https://doi.org/10.3390/cancers14102376