Refining the Role of Pyruvate Dehydrogenase Kinases in Glioblastoma Development

 , , , and
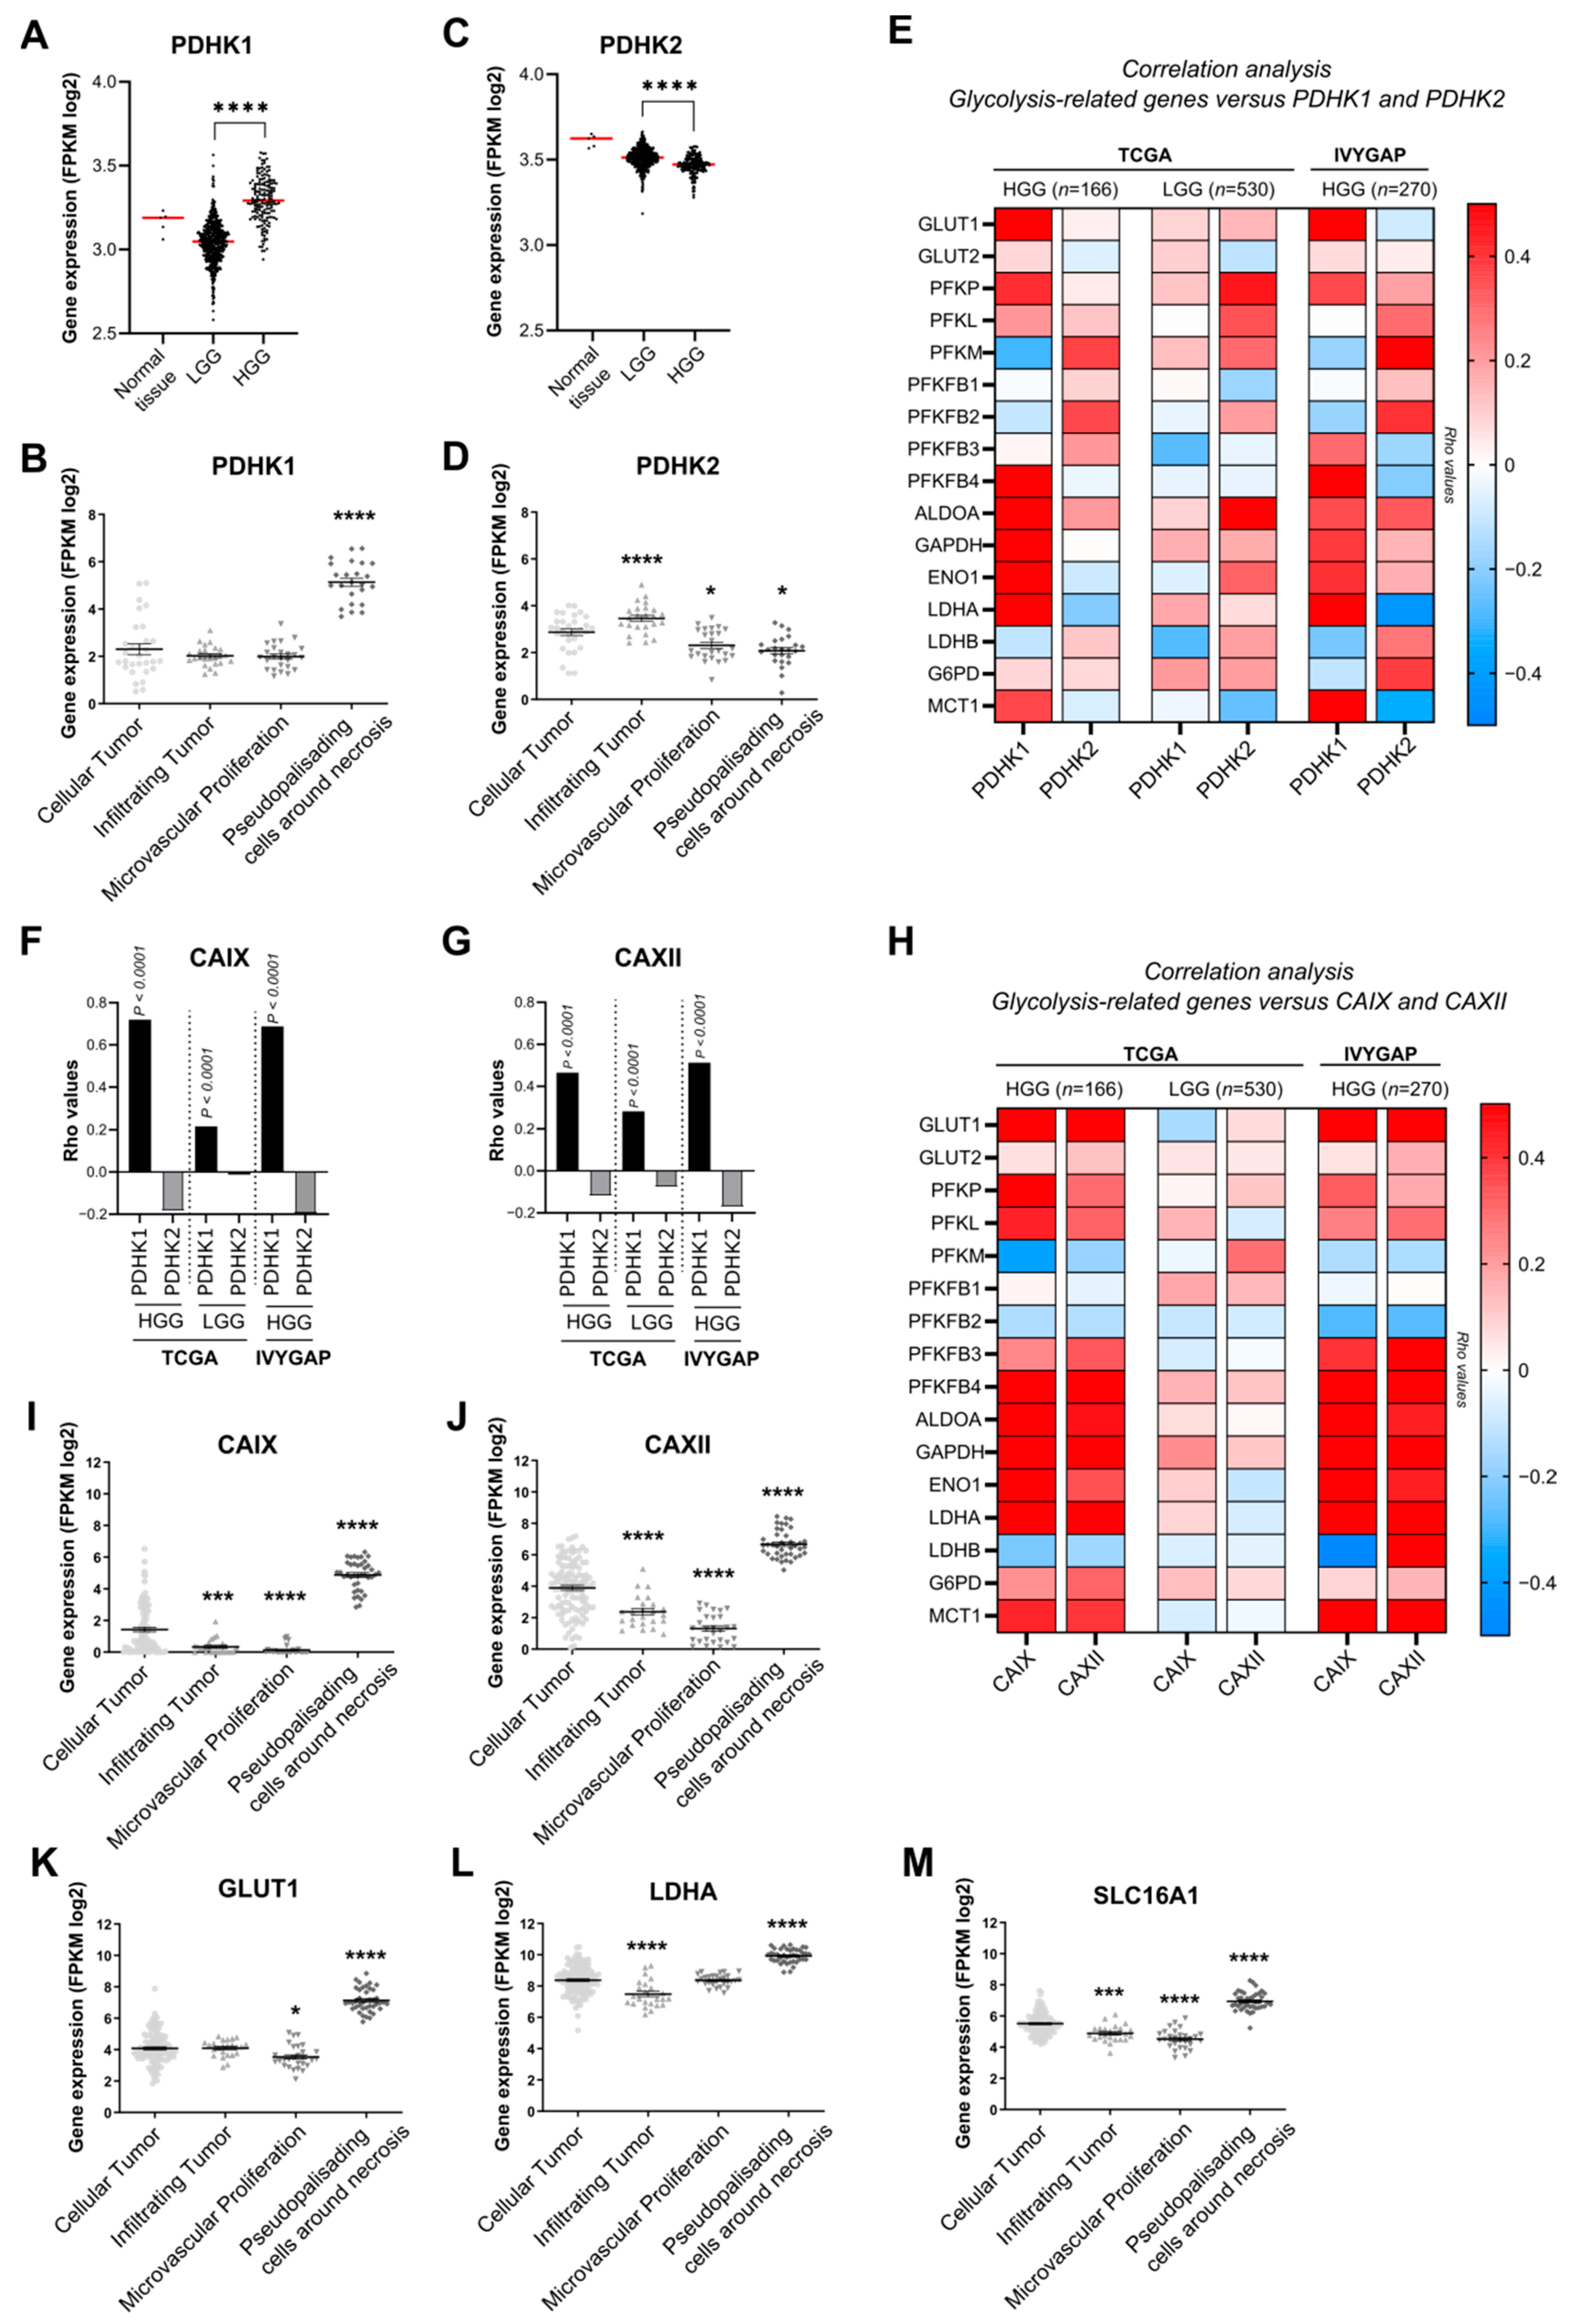
Abstract
:Simple Summary
Abstract
1. Introduction
2. Materials and Methods
2.1. Ethical Issues
2.2. Expression and Correlation Analysis
2.3. Cell Culture
2.4. Western Blotting
2.5. Immunofluorescence Experiments
2.6. Seahorse Oxygen Consumption and Extracellular Acidification Measurements
2.7. Oroboros Oxygen Consumption Assay
2.8. ROS Detection Method
2.9. Lactate Measurements
2.10. Spheroid Experimental Assays
2.11. Intracranial Implantation
2.12. Immunohistological Procedures
2.13. Statistics and Figures
3. Results
3.1. PDHK1 Is Increased in Glioblastoma Patient Samples and Correlates with Glucose Metabolism and pH Regulation Genes
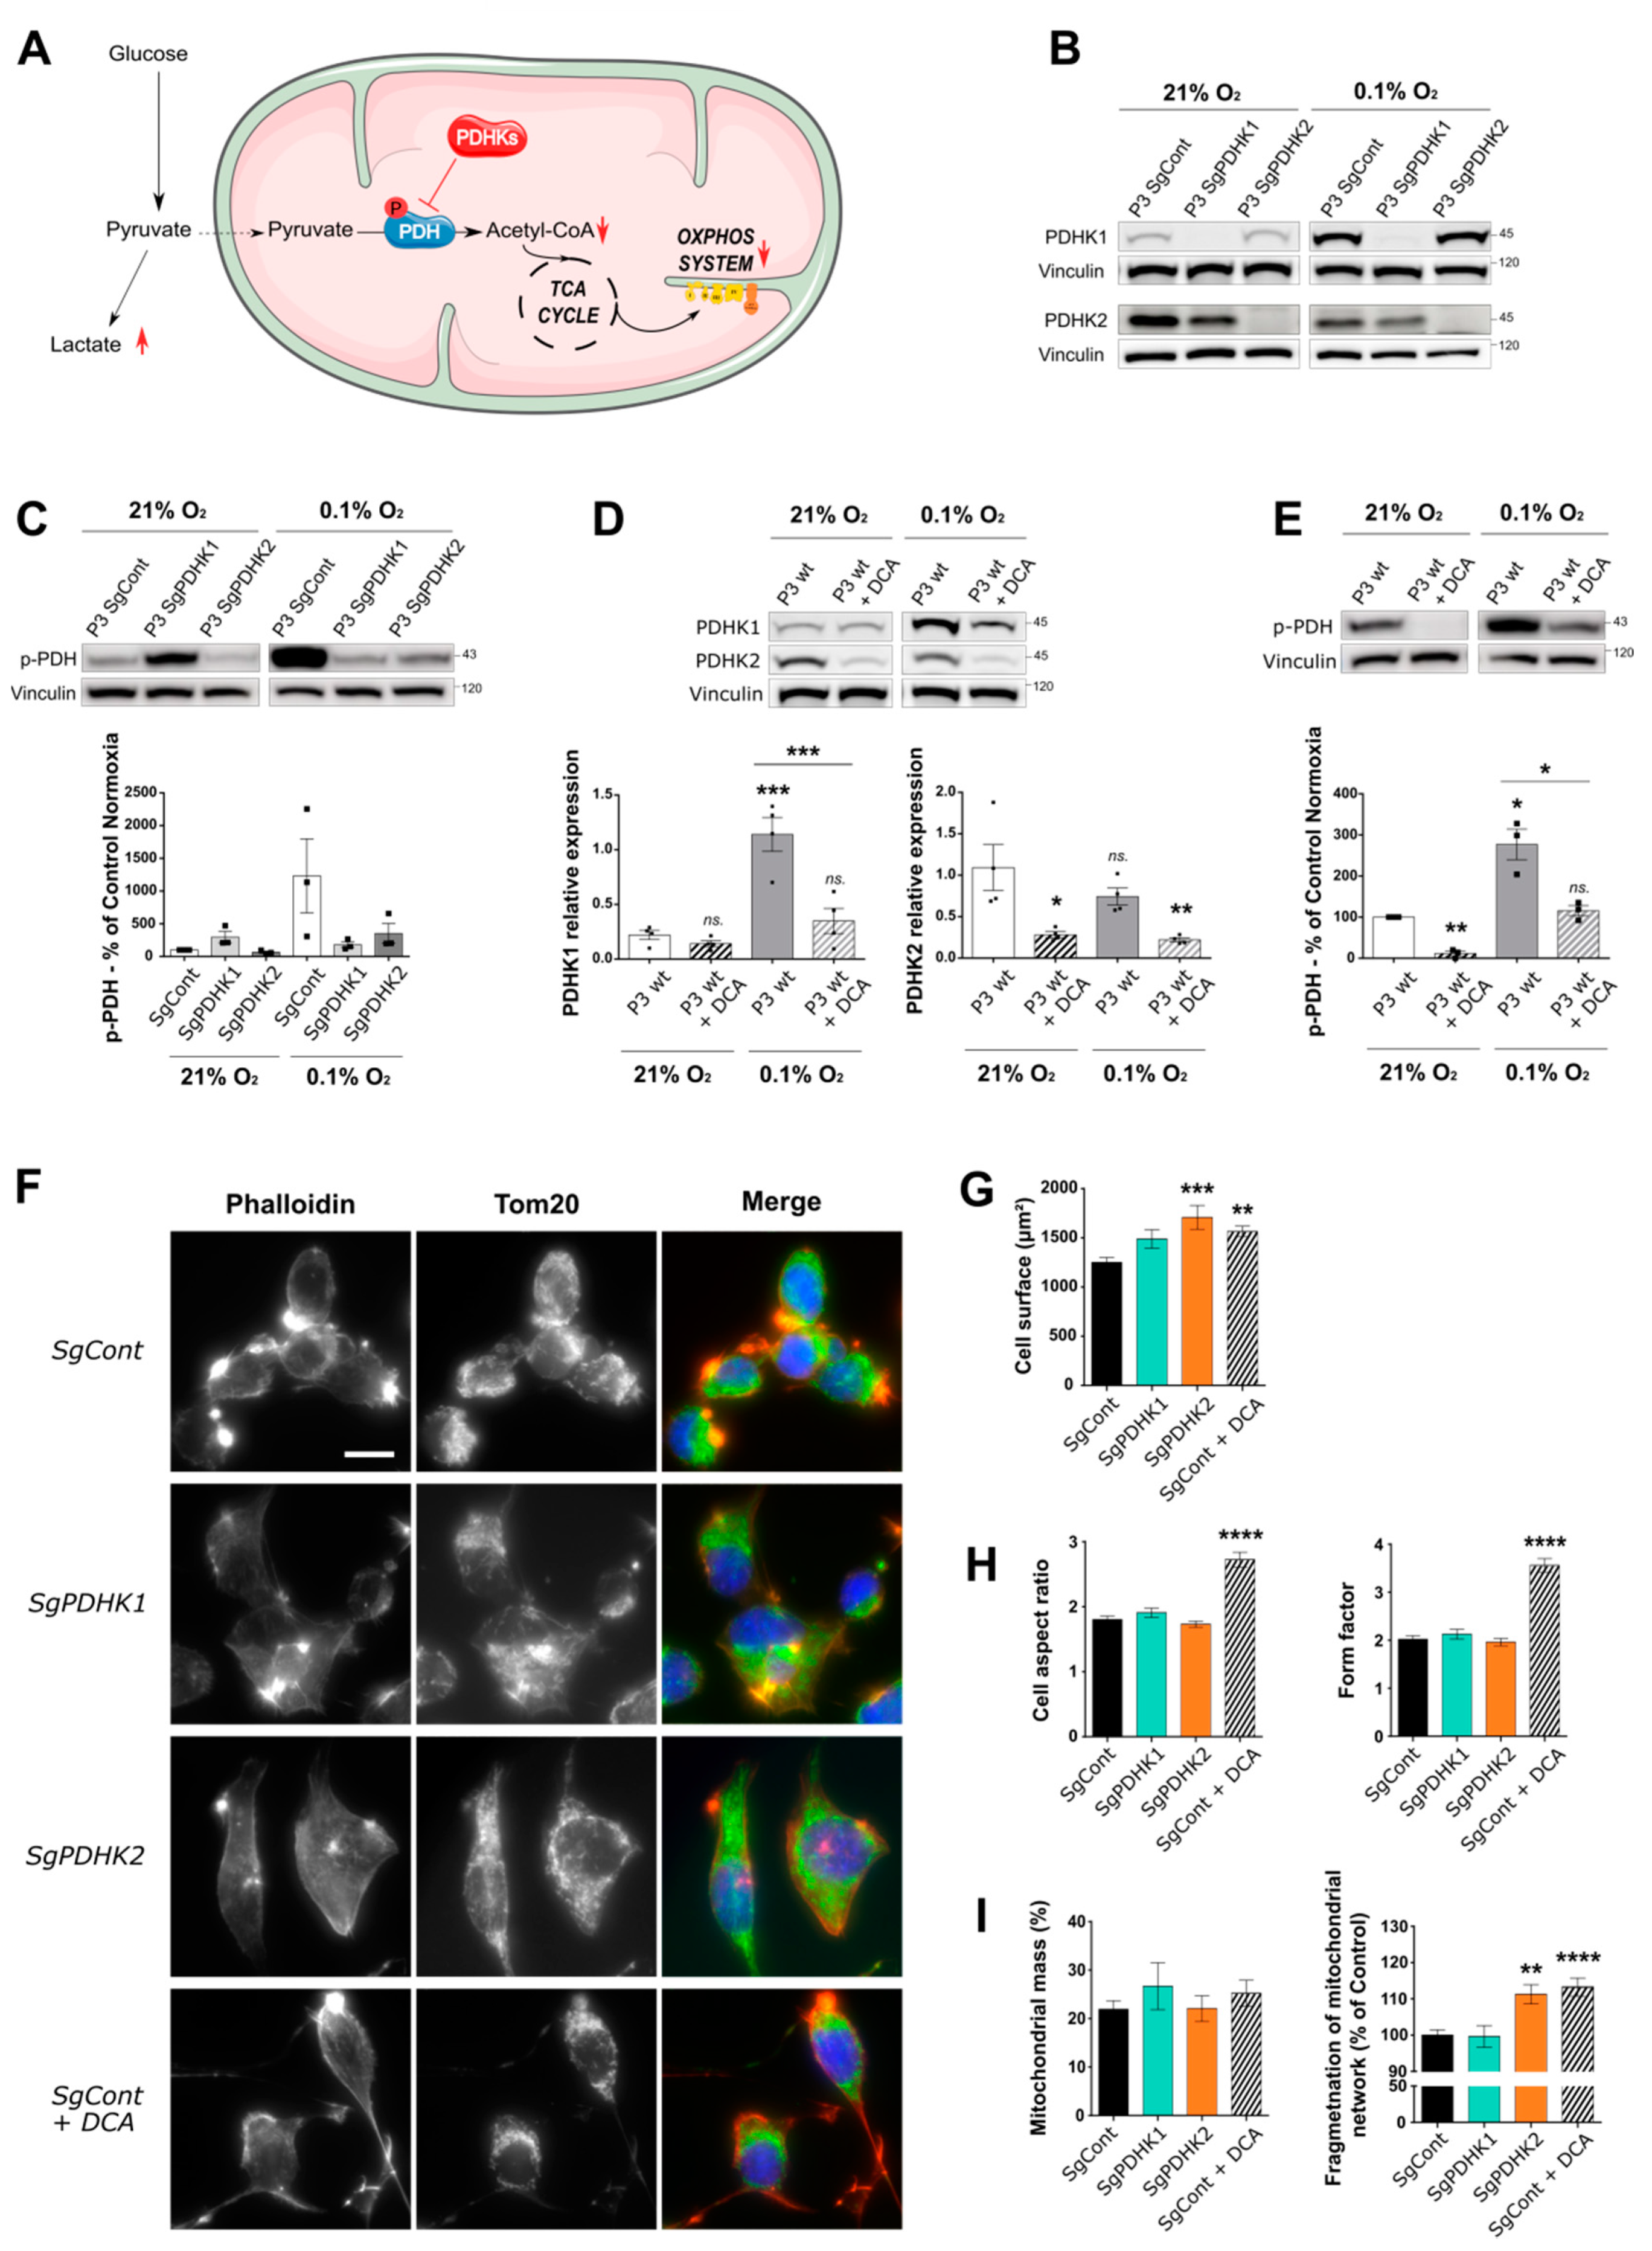
3.2. Inhibition of PDHK Activity by DCA Modulates PDHK Expression and Cell Morphology
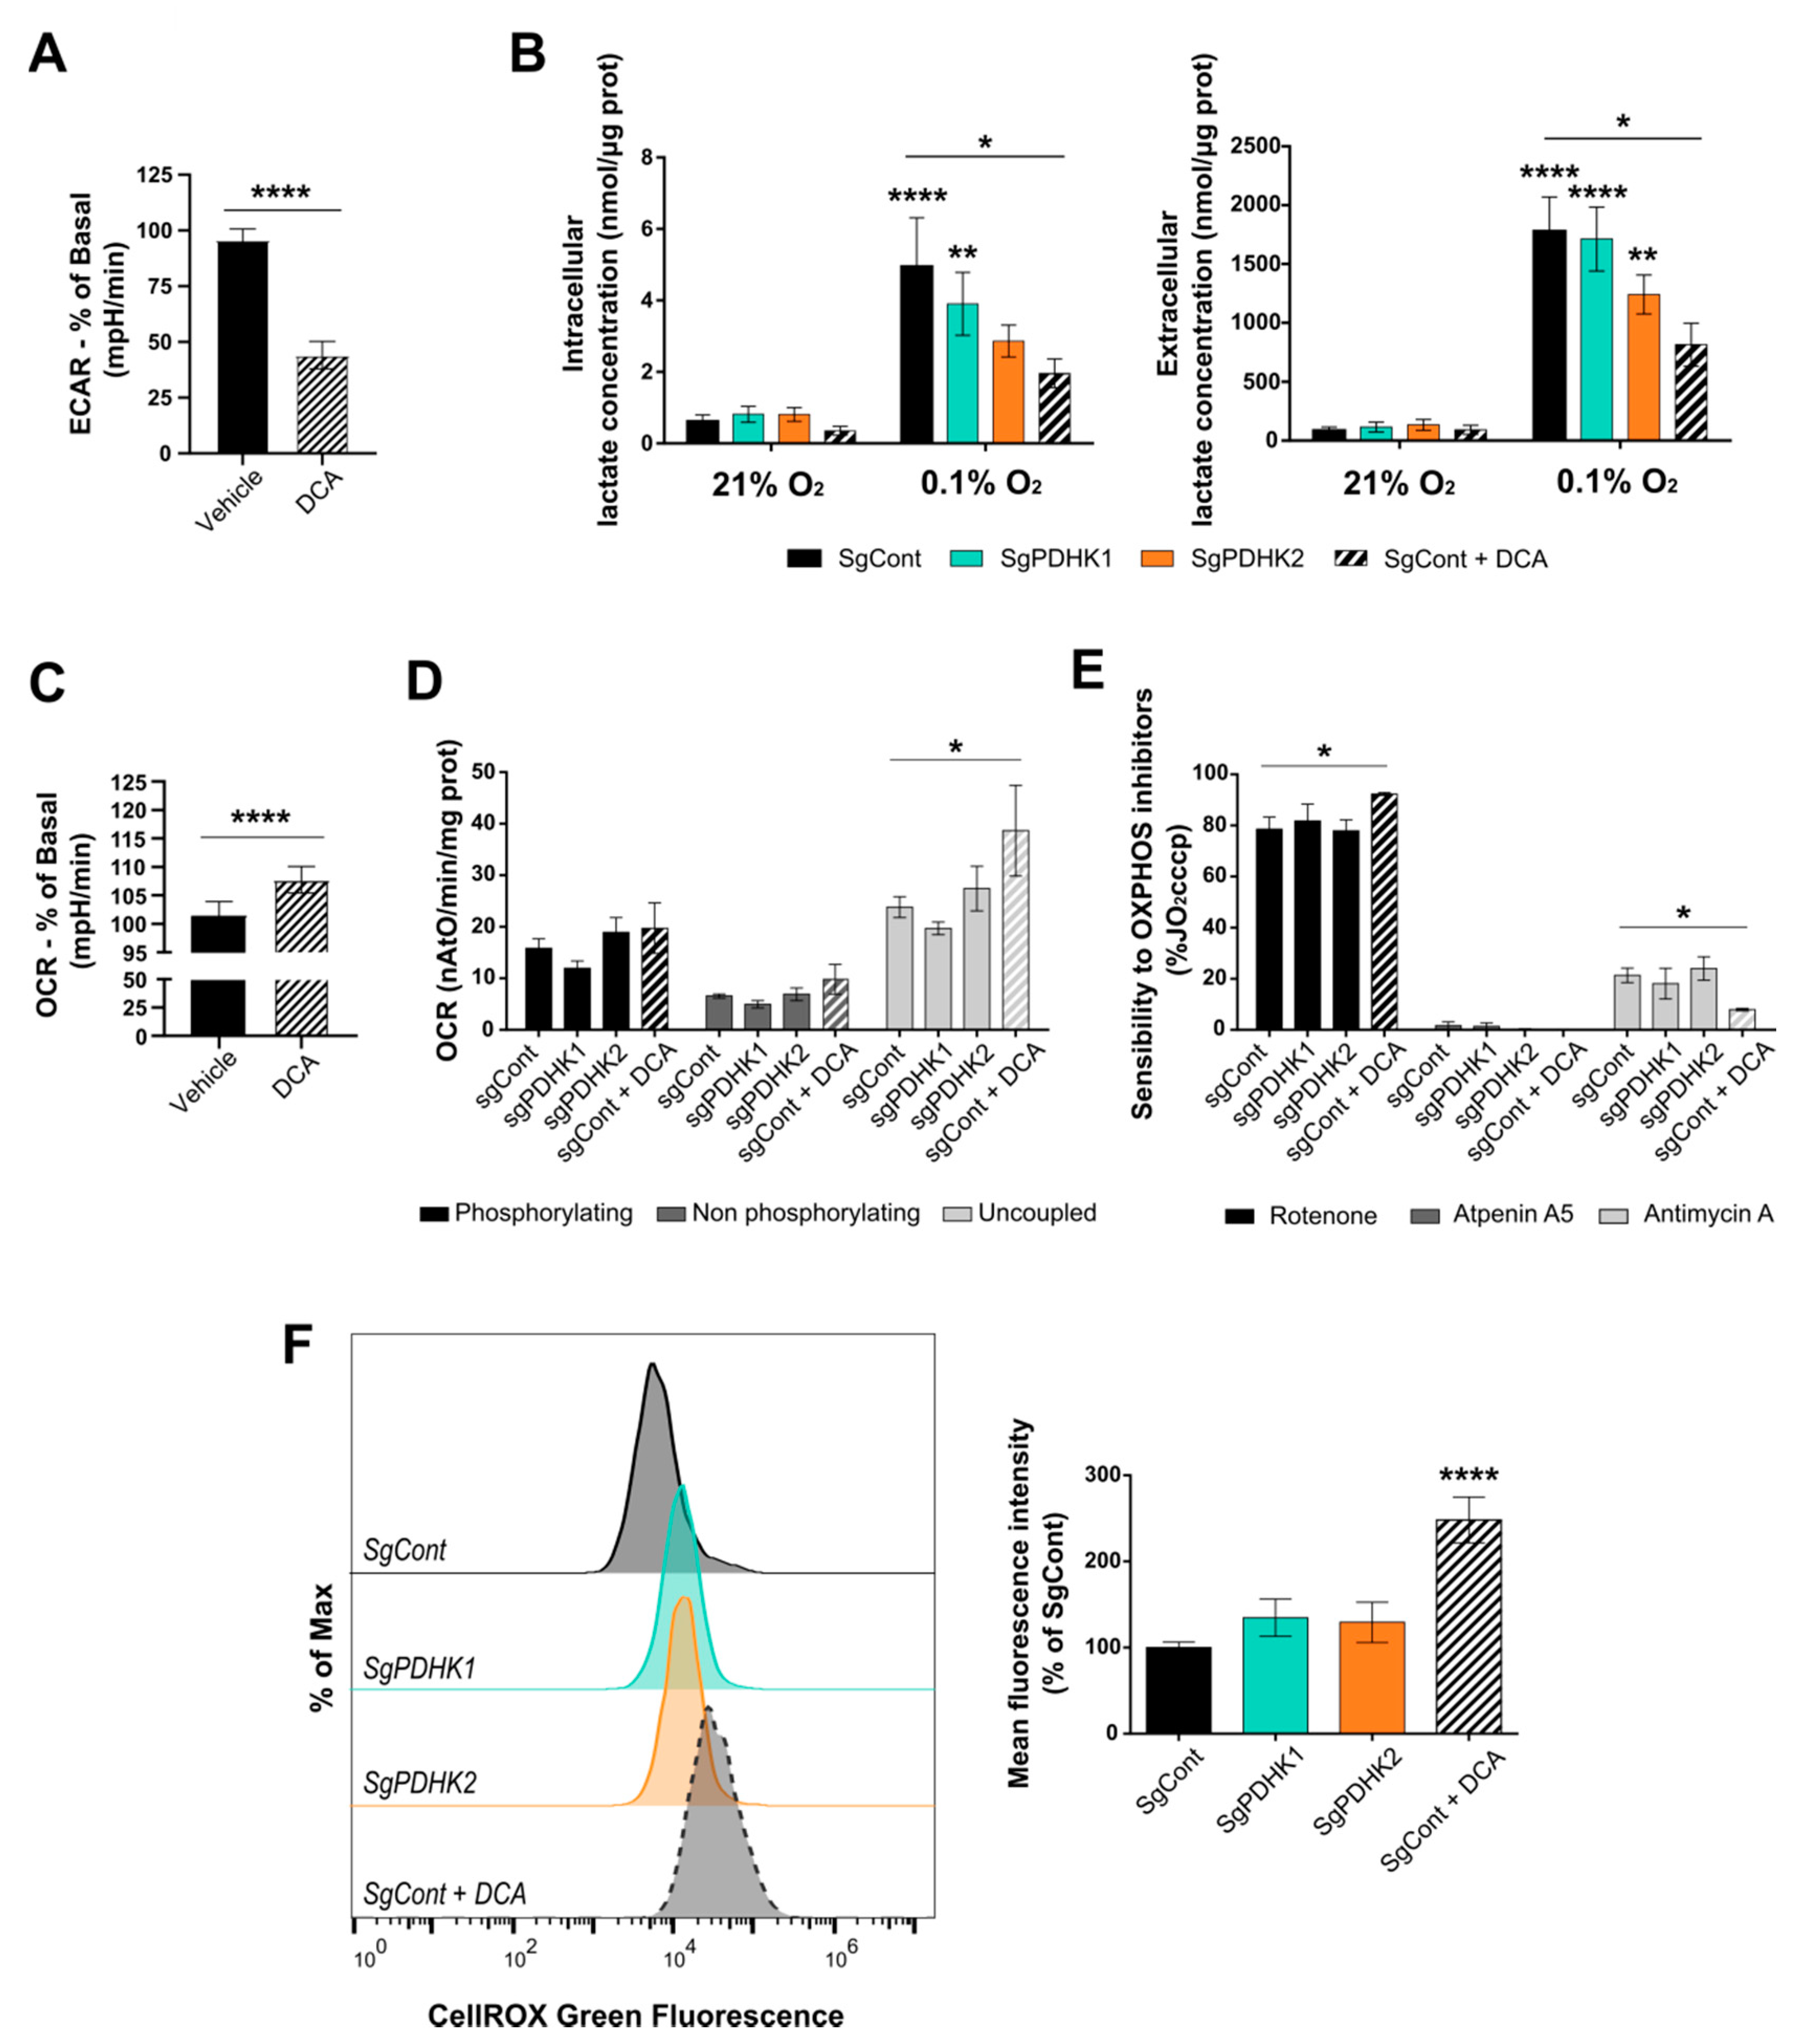
3.3. Inhibition of PDHK Activity Impacts GB Cell Energy Metabolism
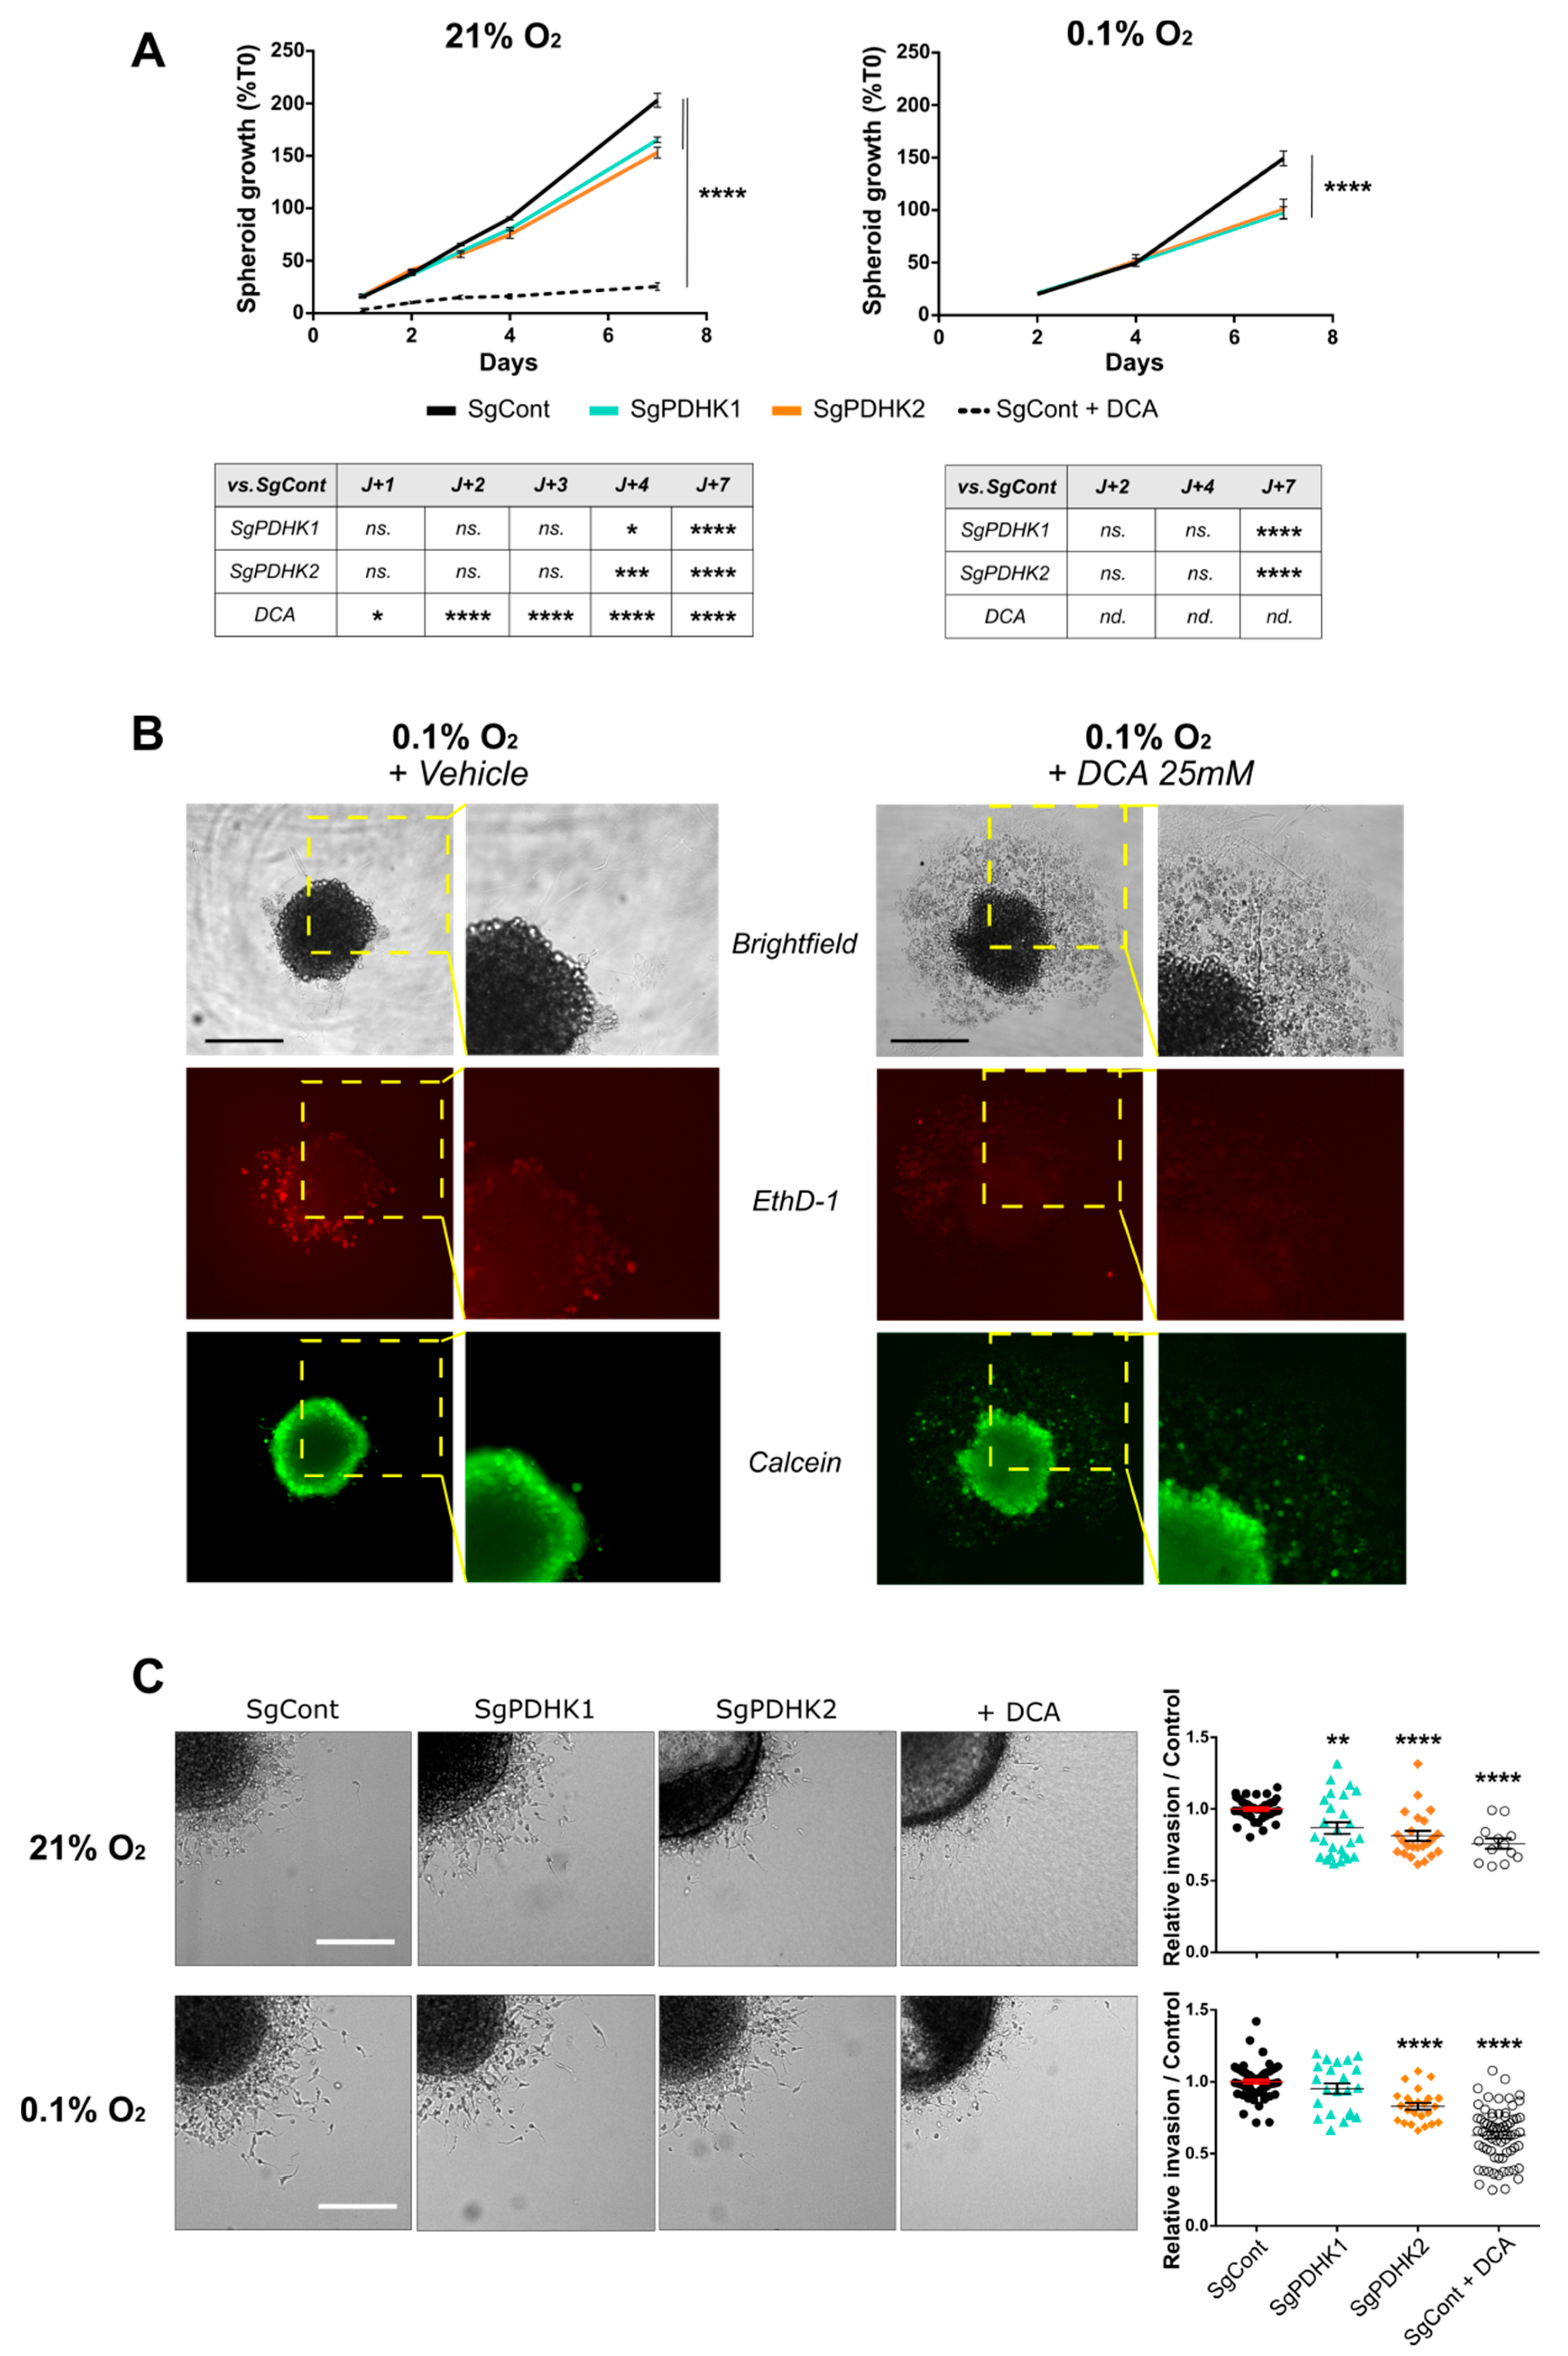
3.4. Disruption of PDHK1 or PDHK2 Activity Impairs GB Proliferation and Invasion
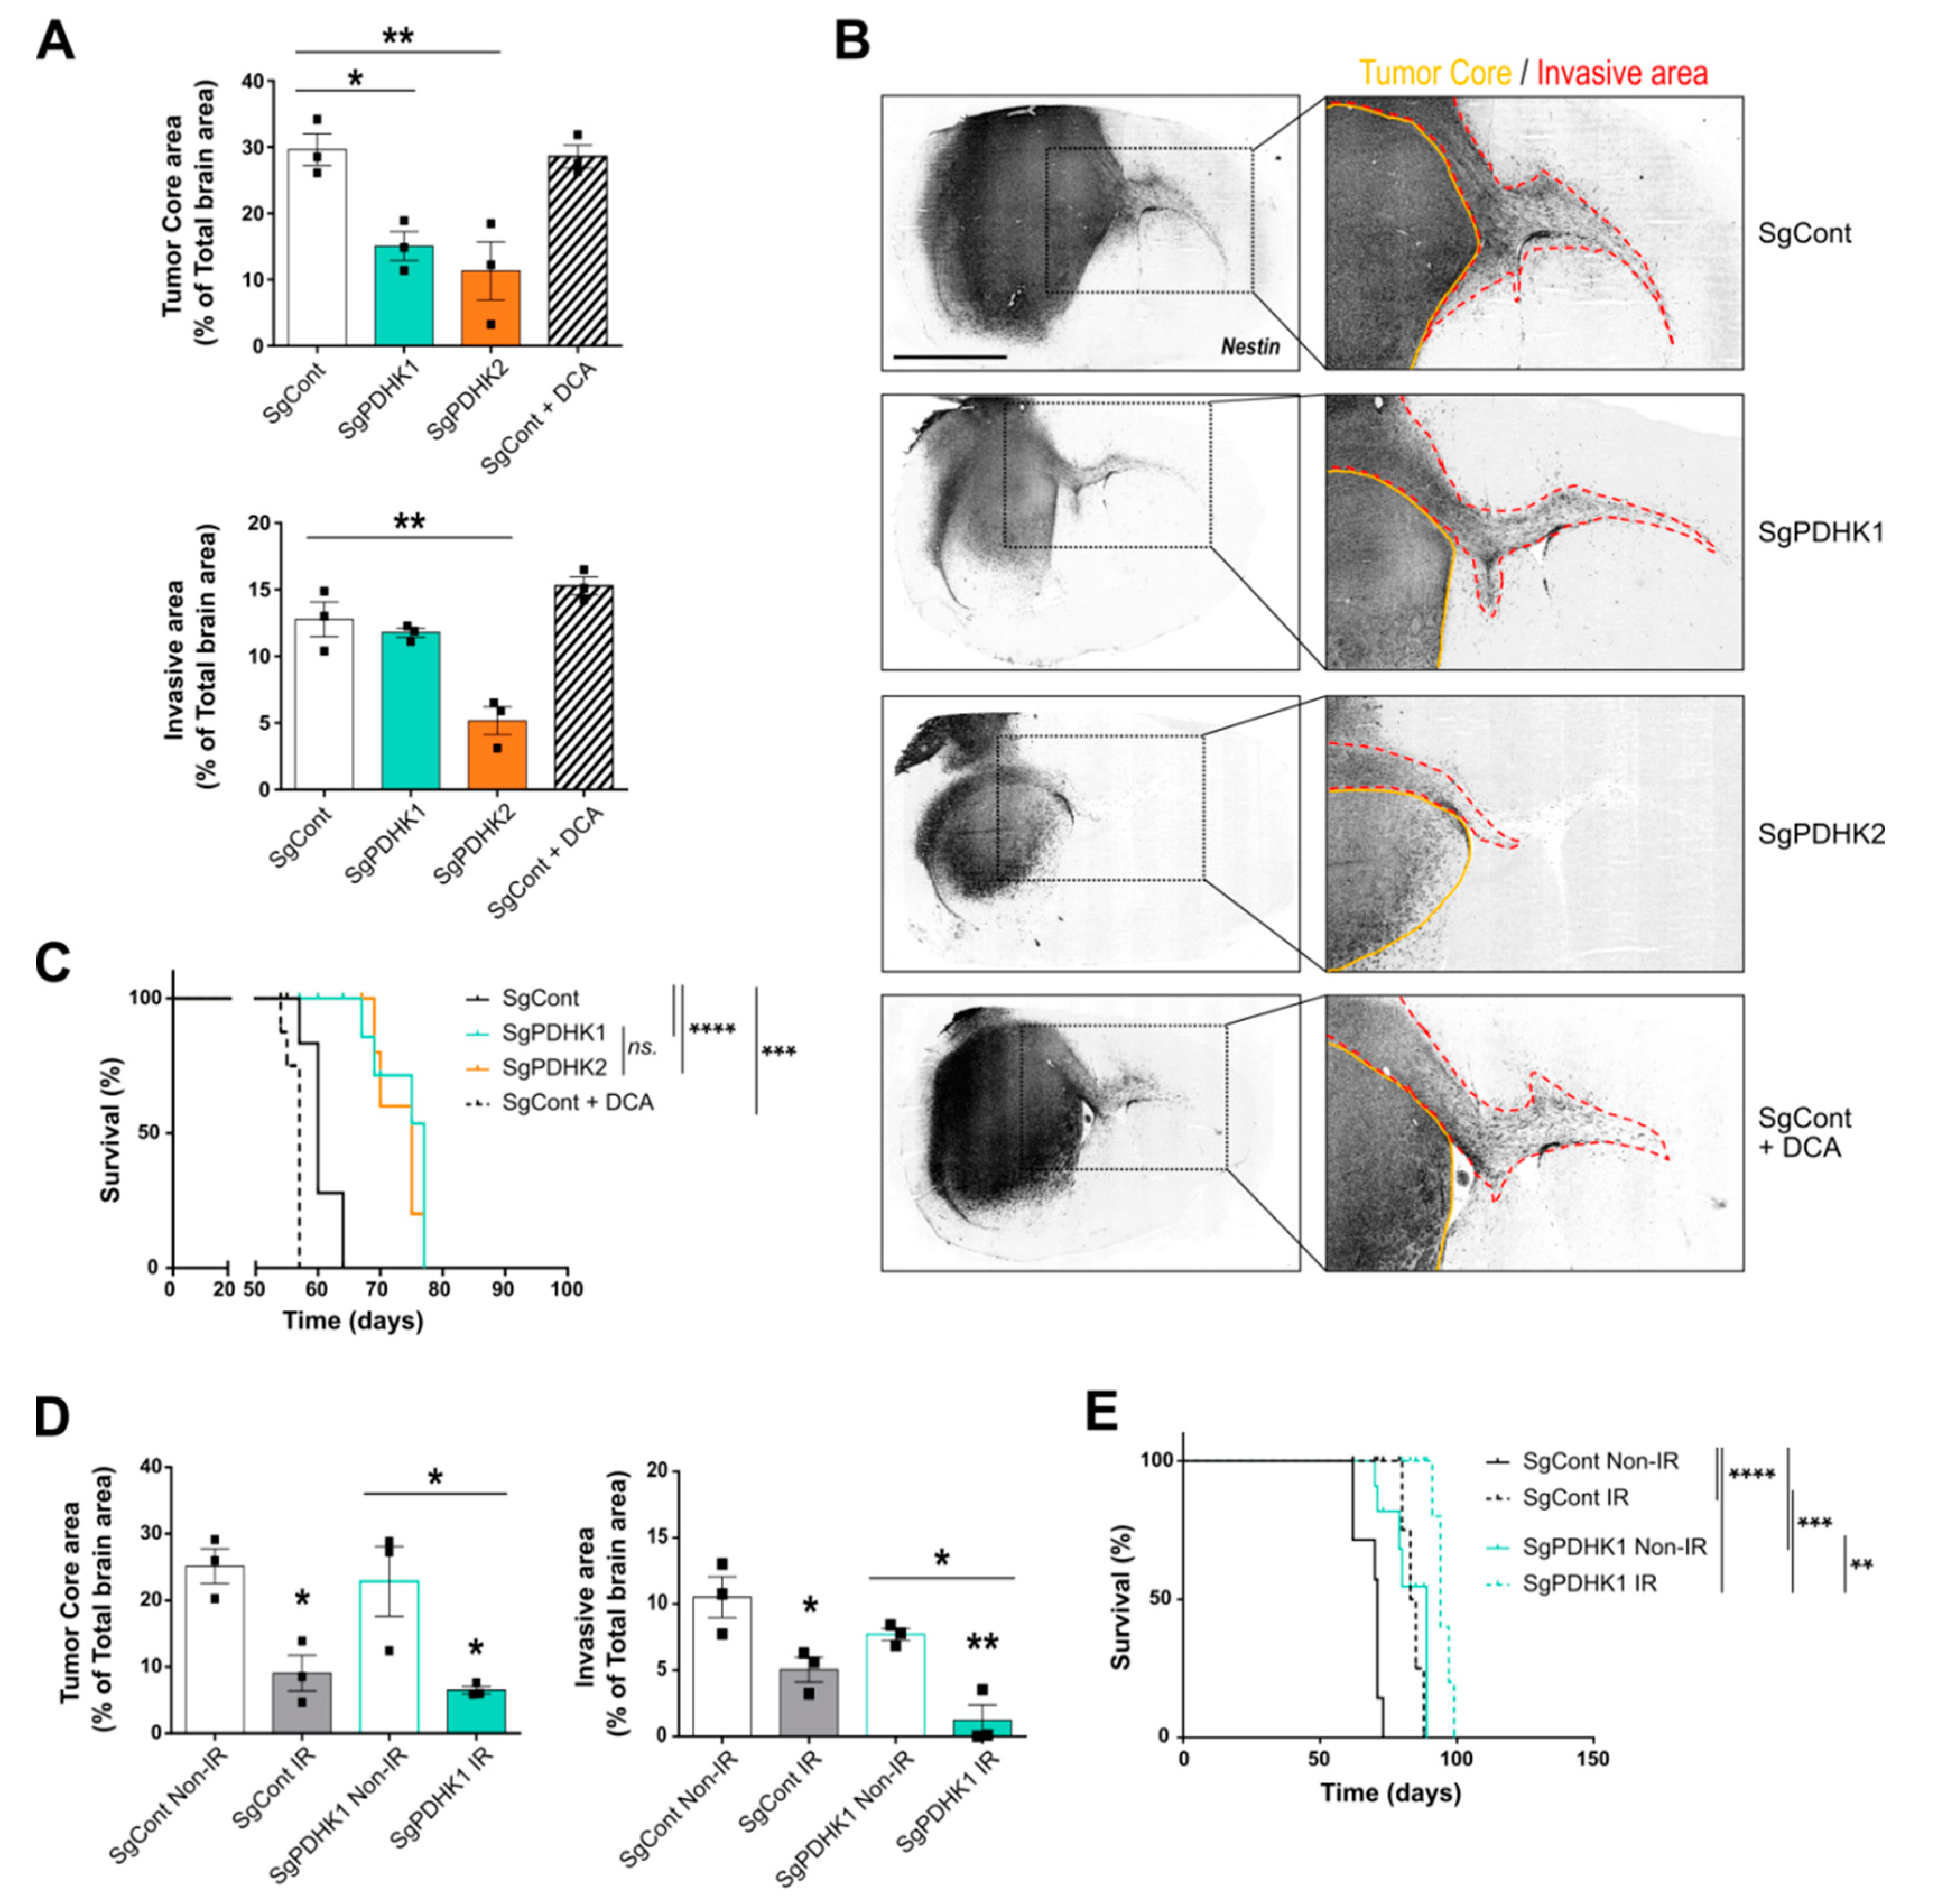
3.5. Simple Knockout of PDHK1 or PDHK2 Impairs In Vivo GB Tumor Growth and Invasion and Improves Mice Survival
4. Discussion
5. Conclusions
Supplementary Materials
Author Contributions
Funding
Institutional Review Board Statement
Data Availability Statement
Acknowledgments
Conflicts of Interest
References
- Hanahan, D. Hallmarks of Cancer: New Dimensions. Cancer Discov. 2022, 12, 31–46. [Google Scholar] [CrossRef] [PubMed]
- Warburg, O. On the Origin of Cancer Cells. Science 1956, 123, 309–314. [Google Scholar] [CrossRef] [PubMed]
- Benej, M.; Pastorekova, S.; Pastorek, J. Carbonic Anhydrase IX: Regulation and Role in Cancer. Subcell. Biochem. 2014, 75, 199–219. [Google Scholar] [CrossRef] [PubMed]
- Corbet, C.; Feron, O. Tumour Acidosis: From the Passenger to the Driver’s Seat. Nat. Rev. Cancer 2017, 17, 577–593. [Google Scholar] [CrossRef] [PubMed]
- Lunt, S.Y.; Vander Heiden, M.G. Aerobic Glycolysis: Meeting the Metabolic Requirements of Cell Proliferation. Annu. Rev. Cell Dev. Biol. 2011, 27, 441–464. [Google Scholar] [CrossRef] [Green Version]
- Sutendra, G.; Michelakis, E.D. Pyruvate Dehydrogenase Kinase as a Novel Therapeutic Target in Oncology. Front. Oncol. 2013, 3, 38. [Google Scholar] [CrossRef] [Green Version]
- Dyrstad, S.E.; Lotsberg, M.L.; Tan, T.Z.; Pettersen, I.K.N.; Hjellbrekke, S.; Tusubira, D.; Engelsen, A.S.T.; Daubon, T.; Mourier, A.; Thiery, J.P.; et al. Blocking Aerobic Glycolysis by Targeting Pyruvate Dehydrogenase Kinase in Combination with EGFR TKI and Ionizing Radiation Increases Therapeutic Effect in Non-Small Cell Lung Cancer Cells. Cancers 2021, 13, 941. [Google Scholar] [CrossRef] [PubMed]
- Li, X.; Jiang, Y.; Meisenhelder, J.; Yang, W.; Hawke, D.H.; Zheng, Y.; Xia, Y.; Aldape, K.; He, J.; Hunter, T.; et al. Mitochondria-Translocated PGK1 Functions as a Protein Kinase to Coordinate Glycolysis and the TCA Cycle in Tumorigenesis. Mol. Cell 2016, 61, 705–719. [Google Scholar] [CrossRef] [Green Version]
- Korsakova, L.; Krasko, J.A.; Stankevicius, E. Metabolic-Targeted Combination Therapy with Dichloroacetate and Metformin Suppresses Glioblastoma Cell Line Growth In Vitro and In Vivo. In Vivo 2021, 35, 341–348. [Google Scholar] [CrossRef]
- Tataranni, T.; Piccoli, C. Dichloroacetate (DCA) and Cancer: An Overview towards Clinical Applications. Oxid Med. Cell Longev. 2019, 2019, 8201079. [Google Scholar] [CrossRef] [PubMed]
- Ruggieri, V.; Agriesti, F.; Scrima, R.; Laurenzana, I.; Perrone, D.; Tataranni, T.; Mazzoccoli, C.; Lo Muzio, L.; Capitanio, N.; Piccoli, C. Dichloroacetate, a Selective Mitochondria-Targeting Drug for Oral Squamous Cell Carcinoma: A Metabolic Perspective of Treatment. Oncotarget 2015, 6, 1217–1230. [Google Scholar] [CrossRef] [PubMed] [Green Version]
- Tataranni, T.; Agriesti, F.; Pacelli, C.; Ruggieri, V.; Laurenzana, I.; Mazzoccoli, C.; Sala, G.D.; Panebianco, C.; Pazienza, V.; Capitanio, N.; et al. Dichloroacetate Affects Mitochondrial Function and Stemness-Associated Properties in Pancreatic Cancer Cell Lines. Cells 2019, 8, E478. [Google Scholar] [CrossRef] [PubMed] [Green Version]
- James, M.O.; Jahn, S.C.; Zhong, G.; Smeltz, M.G.; Hu, Z.; Stacpoole, P.W. Therapeutic Applications of Dichloroacetate and the Role of Glutathione Transferase Zeta-1. Pharmacol. Ther. 2017, 170, 166–180. [Google Scholar] [CrossRef] [PubMed] [Green Version]
- Puchalski, R.B.; Shah, N.; Miller, J.; Dalley, R.; Nomura, S.R.; Yoon, J.-G.; Smith, K.A.; Lankerovich, M.; Bertagnolli, D.; Bickley, K.; et al. An Anatomic Transcriptional Atlas of Human Glioblastoma. Science 2018, 360, 660–663. [Google Scholar] [CrossRef] [PubMed] [Green Version]
- Rahman, M.A.; Brekke, J.; Arnesen, V.; Hannisdal, M.H.; Navarro, A.G.; Waha, A.; Herfindal, L.; Rygh, C.B.; Bratland, E.; Brandal, P.; et al. Sequential Bortezomib and Temozolomide Treatment Promotes Immunological Responses in Glioblastoma Patients with Positive Clinical Outcomes: A Phase 1B Study. Immun. Inflamm. Dis. 2020, 8, 342–359. [Google Scholar] [CrossRef]
- Daubon, T.; Léon, C.; Clarke, K.; Andrique, L.; Salabert, L.; Darbo, E.; Pineau, R.; Guérit, S.; Maitre, M.; Dedieu, S.; et al. Deciphering the Complex Role of Thrombospondin-1 in Glioblastoma Development. Nat. Commun. 2019, 10, 1146. [Google Scholar] [CrossRef] [Green Version]
- Guyon, J.; Fernandez-Moncada, I.; Larrieu, C.; Bouchez, C.; Chouleur, T.; Espedal, H.; Røsland, G.; Daher, B.; Barre, A.; Dartigues, B.; et al. Specific Expression of Lactate Dehydrogenases in Glioblastoma Controls Intercellular Lactate Transfer to Promote Tumor Growth and Invasion. 2021; In Review. [Google Scholar]
- Schindelin, J.; Arganda-Carreras, I.; Frise, E.; Kaynig, V.; Longair, M.; Pietzsch, T.; Preibisch, S.; Rueden, C.; Saalfeld, S.; Schmid, B.; et al. Fiji: An Open-Source Platform for Biological-Image Analysis. Nat. Methods 2012, 9, 676–682. [Google Scholar] [CrossRef] [Green Version]
- Koopman, W.J.H.; Visch, H.-J.; Smeitink, J.A.M.; Willems, P.H.G.M. Simultaneous Quantitative Measurement and Automated Analysis of Mitochondrial Morphology, Mass, Potential, and Motility in Living Human Skin Fibroblasts. Cytometry 2006, 69A, 1–12. [Google Scholar] [CrossRef]
- Molinié, T.; Cougouilles, E.; David, C.; Cahoreau, E.; Portais, J.-C.; Mourier, A. MDH2 Produced OAA Is a Metabolic Switch Rewiring the Fuelling of Respiratory Chain and TCA Cycle. Biochim. Biophys. Acta Bioenerg. 2022, 1863, 148532. [Google Scholar] [CrossRef] [PubMed]
- Lobo-Jarne, T.; Nývltová, E.; Pérez-Pérez, R.; Timón-Gómez, A.; Molinié, T.; Choi, A.; Mourier, A.; Fontanesi, F.; Ugalde, C.; Barrientos, A. Human COX7A2L Regulates Complex III Biogenesis and Promotes Supercomplex Organization Remodeling without Affecting Mitochondrial Bioenergetics. Cell Rep. 2018, 25, 1786–1799.e4. [Google Scholar] [CrossRef] [Green Version]
- Bouchez, C.L.; Daubon, T.; Mourier, A. NADH-Independent Enzymatic Assay to Quantify Extracellular and Intracellular L-Lactate Levels. STAR Protoc. 2022, 3, 101403. [Google Scholar] [CrossRef] [PubMed]
- Guyon, J.; Andrique, L.; Pujol, N.; Røsland, G.V.; Recher, G.; Bikfalvi, A.; Daubon, T. A 3D Spheroid Model for Glioblastoma. J. Vis. Exp. 2020, 158, e60998. [Google Scholar] [CrossRef] [PubMed]
- Joseph, J.V.; Magaut, C.R.; Storevik, S.; Geraldo, L.H.; Mathivet, T.; Latif, M.A.; Rudewicz, J.; Guyon, J.; Gambaretti, M.; Haukas, F.; et al. TGF-β Promotes Microtube Formation in Glioblastoma through Thrombospondin 1. Neuro Oncol. 2022, 24, 541–553. [Google Scholar] [CrossRef] [PubMed]
- Saunier, E.; Benelli, C.; Bortoli, S. The Pyruvate Dehydrogenase Complex in Cancer: An Old Metabolic Gatekeeper Regulated by New Pathways and Pharmacological Agents: Pyruvate Dehydrogenase Complex in Cancer. Int. J. Cancer 2016, 138, 809–817. [Google Scholar] [CrossRef] [PubMed]
- Anwar, S.; Shamsi, A.; Mohammad, T.; Islam, A.; Hassan, M.I. Targeting Pyruvate Dehydrogenase Kinase Signaling in the Development of Effective Cancer Therapy. Biochim. Biophys. Acta Rev. Cancer 2021, 1876, 188568. [Google Scholar] [CrossRef] [PubMed]
- Hitosugi, T.; Fan, J.; Chung, T.-W.; Lythgoe, K.; Wang, X.; Xie, J.; Ge, Q.; Gu, T.-L.; Polakiewicz, R.D.; Roesel, J.L.; et al. Tyrosine Phosphorylation of Mitochondrial Pyruvate Dehydrogenase Kinase 1 Is Important for Cancer Metabolism. Mol. Cell 2011, 44, 864–877. [Google Scholar] [CrossRef] [PubMed] [Green Version]
- Niewisch, M.R.; Kuçi, Z.; Wolburg, H.; Sautter, M.; Krampen, L.; Deubzer, B.; Handgretinger, R.; Bruchelt, G. Influence of Dichloroacetate (DCA) on Lactate Production and Oxygen Consumption in Neuroblastoma Cells: Is DCA a Suitable Drug for Neuroblastoma Therapy? Cell Physiol. Biochem. 2012, 29, 373–380. [Google Scholar] [CrossRef]
- Stacpoole, P.W.; Nagaraja, N.V.; Hutson, A.D. Efficacy of Dichloroacetate as a Lactate-Lowering Drug. J. Clin. Pharmacol. 2003, 43, 683–691. [Google Scholar] [CrossRef] [PubMed]
- Murphy, M.P. How Mitochondria Produce Reactive Oxygen Species. Biochem. J. 2009, 417, 1–13. [Google Scholar] [CrossRef] [PubMed] [Green Version]
- Dubouchaud, H.; Walter, L.; Rigoulet, M.; Batandier, C. Mitochondrial NADH Redox Potential Impacts the Reactive Oxygen Species Production of Reverse Electron Transfer through Complex I. J. Bioenerg. Biomembr. 2018, 50, 367–377. [Google Scholar] [CrossRef] [PubMed]
- Rossignol, R.; Gilkerson, R.; Aggeler, R.; Yamagata, K.; Remington, S.J.; Capaldi, R.A. Energy Substrate Modulates Mitochondrial Structure and Oxidative Capacity in Cancer Cells. Cancer Res. 2004, 64, 985–993. [Google Scholar] [CrossRef] [PubMed] [Green Version]
- Han, J.E.; Lim, P.W.; Na, C.M.; Choi, Y.S.; Lee, J.Y.; Kim, Y.; Park, H.W.; Moon, H.E.; Heo, M.S.; Park, H.R.; et al. Inhibition of HIF1α and PDK Induces Cell Death of Glioblastoma Multiforme. Exp. Neurobiol. 2017, 26, 295–306. [Google Scholar] [CrossRef] [PubMed] [Green Version]
- Dunbar, E.M.; Coats, B.S.; Shroads, A.L.; Langaee, T.; Lew, A.; Forder, J.R.; Shuster, J.J.; Wagner, D.A.; Stacpoole, P.W. Phase 1 Trial of Dichloroacetate (DCA) in Adults with Recurrent Malignant Brain Tumors. Investig. New Drugs 2014, 32, 452–464. [Google Scholar] [CrossRef] [Green Version]
- Donohue, J.M.; Galal-Gorchev, H.; Brattin, W.; Liccione, J.J.; Altshuler, K.B. Toxicological Review of Dichloroacetic Acid; U.S. Environmental Protection Agency: Washington DC, USA, 2003. [Google Scholar]
- Stacpoole, P.W.; Martyniuk, C.J.; James, M.O.; Calcutt, N.A. Dichloroacetate-Induced Peripheral Neuropathy. Int. Rev. Neurobiol. 2019, 145, 211–238. [Google Scholar] [CrossRef]
- Feuerecker, B.; Seidl, C.; Pirsig, S.; Bruchelt, G.; Senekowitsch-Schmidtke, R. DCA Promotes Progression of Neuroblastoma Tumors in Nude Mice. Am. J. Cancer Res. 2015, 5, 812–820. [Google Scholar]
- Godoy, P.R.D.V.; Pour Khavari, A.; Rizzo, M.; Sakamoto-Hojo, E.T.; Haghdoost, S. Targeting NRF2, Regulator of Antioxidant System, to Sensitize Glioblastoma Neurosphere Cells to Radiation-Induced Oxidative Stress. Oxidative Med. Cell. Longev. 2020, 2020, 2534643. [Google Scholar] [CrossRef]
- Vlashi, E.; Lagadec, C.; Vergnes, L.; Matsutani, T.; Masui, K.; Poulou, M.; Popescu, R.; Della Donna, L.; Evers, P.; Dekmezian, C.; et al. Metabolic State of Glioma Stem Cells and Nontumorigenic Cells. Proc. Natl. Acad. Sci. USA 2011, 108, 16062–16067. [Google Scholar] [CrossRef] [Green Version]
- Shen, H.; Hau, E.; Joshi, S.; Dilda, P.J.; McDonald, K.L. Sensitization of Glioblastoma Cells to Irradiation by Modulating the Glucose Metabolism. Mol. Cancer Ther. 2015, 14, 1794–1804. [Google Scholar] [CrossRef] [Green Version]
- Kumar, K.; Wigfield, S.; Gee, H.E.; Devlin, C.M.; Singleton, D.; Li, J.-L.; Buffa, F.; Huffman, M.; Sinn, A.L.; Silver, J.; et al. Dichloroacetate Reverses the Hypoxic Adaptation to Bevacizumab and Enhances Its Antitumor Effects in Mouse Xenografts. J. Mol. Med. 2013, 91, 749–758. [Google Scholar] [CrossRef] [Green Version]
- Knudsen, A.M.; Halle, B.; Cédile, O.; Burton, M.; Baun, C.; Thisgaard, H.; Anand, A.; Hubert, C.; Thomassen, M.; Michaelsen, S.R.; et al. Surgical Resection of Glioblastomas Induces Pleiotrophin-Mediated Self-Renewal of Glioblastoma Stem Cells in Recurrent Tumors. Neuro-Oncol. 2022, 24, 1074–1087. [Google Scholar] [CrossRef] [PubMed]
- Bao, S.; Wu, Q.; McLendon, R.E.; Hao, Y.; Shi, Q.; Hjelmeland, A.B.; Dewhirst, M.W.; Bigner, D.D.; Rich, J.N. Glioma Stem Cells Promote Radioresistance by Preferential Activation of the DNA Damage Response. Nature 2006, 444, 756–760. [Google Scholar] [CrossRef]
- Stacpoole, P.W. Therapeutic Targeting of the Pyruvate Dehydrogenase Complex/Pyruvate Dehydrogenase Kinase (PDC/PDK) Axis in Cancer. J. Natl. Cancer Inst. 2017, 109, djx071. [Google Scholar] [CrossRef] [PubMed] [Green Version]
- Meng, G.; Li, B.; Chen, A.; Zheng, M.; Xu, T.; Zhang, H.; Dong, J.; Wu, J.; Yu, D.; Wei, J. Targeting Aerobic Glycolysis by Dichloroacetate Improves Newcastle Disease Virus-Mediated Viro-Immunotherapy in Hepatocellular Carcinoma. Br. J. Cancer 2020, 122, 111–120. [Google Scholar] [CrossRef] [PubMed]
- Ohashi, T.; Akazawa, T.; Aoki, M.; Kuze, B.; Mizuta, K.; Ito, Y.; Inoue, N. Dichloroacetate Improves Immune Dysfunction Caused by Tumor-Secreted Lactic Acid and Increases Antitumor Immunoreactivity. Int. J. Cancer 2013, 133, 1107–1118. [Google Scholar] [CrossRef]
- Reardon, D.A.; Brandes, A.A.; Omuro, A.; Mulholland, P.; Lim, M.; Wick, A.; Baehring, J.; Ahluwalia, M.S.; Roth, P.; Bähr, O.; et al. Effect of Nivolumab vs Bevacizumab in Patients With Recurrent Glioblastoma: The CheckMate 143 Phase 3 Randomized Clinical Trial. JAMA Oncol. 2020, 6, 1003–1010. [Google Scholar] [CrossRef] [PubMed]
- Huang, B.; Li, X.; Li, Y.; Zhang, J.; Zong, Z.; Zhang, H. Current Immunotherapies for Glioblastoma Multiforme. Front. Immunol. 2020, 11, 603911. [Google Scholar] [CrossRef]
- Duraj, T.; García-Romero, N.; Carrión-Navarro, J.; Madurga, R.; de Mendivil, A.O.; Prat-Acin, R.; Garcia-Cañamaque, L.; Ayuso-Sacido, A. Beyond the Warburg Effect: Oxidative and Glycolytic Phenotypes Coexist within the Metabolic Heterogeneity of Glioblastoma. Cells 2021, 10, 202. [Google Scholar] [CrossRef]


Publisher’s Note: MDPI stays neutral with regard to jurisdictional claims in published maps and institutional affiliations. |
© 2022 by the authors. Licensee MDPI, Basel, Switzerland. This article is an open access article distributed under the terms and conditions of the Creative Commons Attribution (CC BY) license (https://creativecommons.org/licenses/by/4.0/).
Share and Cite
Larrieu, C.M.; Storevik, S.; Guyon, J.; Pagano Zottola, A.C.; Bouchez, C.L.; Derieppe, M.-A.; Tan, T.Z.; Miletic, H.; Lorens, J.; Tronstad, K.J.; et al. Refining the Role of Pyruvate Dehydrogenase Kinases in Glioblastoma Development. Cancers 2022, 14, 3769. https://doi.org/10.3390/cancers14153769
Larrieu CM, Storevik S, Guyon J, Pagano Zottola AC, Bouchez CL, Derieppe M-A, Tan TZ, Miletic H, Lorens J, Tronstad KJ, et al. Refining the Role of Pyruvate Dehydrogenase Kinases in Glioblastoma Development. Cancers. 2022; 14(15):3769. https://doi.org/10.3390/cancers14153769
Chicago/Turabian StyleLarrieu, Claire M., Simon Storevik, Joris Guyon, Antonio C. Pagano Zottola, Cyrielle L. Bouchez, Marie-Alix Derieppe, Tuan Zea Tan, Hrvoje Miletic, James Lorens, Karl Johan Tronstad, and et al. 2022. "Refining the Role of Pyruvate Dehydrogenase Kinases in Glioblastoma Development" Cancers 14, no. 15: 3769. https://doi.org/10.3390/cancers14153769