VAlPOs as Efficient Catalysts for Glycerol Conversion to Methanol
by
Gheorghița Mitran
1,*,†, 
Florentina Neațu
2,†,
Ștefan Neațu
2, 
Mihaela M. Trandafir
2 and
Mihaela Florea
1,2,* 1
Department of Organic Chemistry, University of Bucharest, Biochemistry & Catalysis, Faculty of Chemistry, 4-12, Blv. Regina Elisabeta, 030018 Bucharest, Romania
2
National Institute of Material Physics, 405A Atomiştilor, P.O. Box MG 7, 077125 Măgurele, Romania
*
Authors to whom correspondence should be addressed.
†
Authors with equal contribution.
Catalysts 2020, 10(7), 728; https://doi.org/10.3390/catal10070728
Submission received: 24 April 2020
/
Revised: 23 June 2020
/
Accepted: 28 June 2020
/
Published: 1 July 2020
(This article belongs to the Special Issue New Glycerol Upgrading Processes)
Abstract
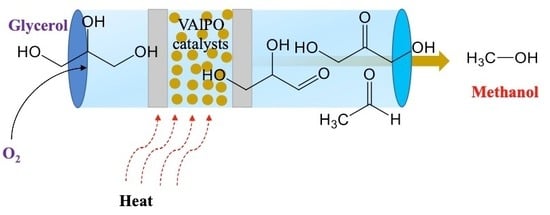
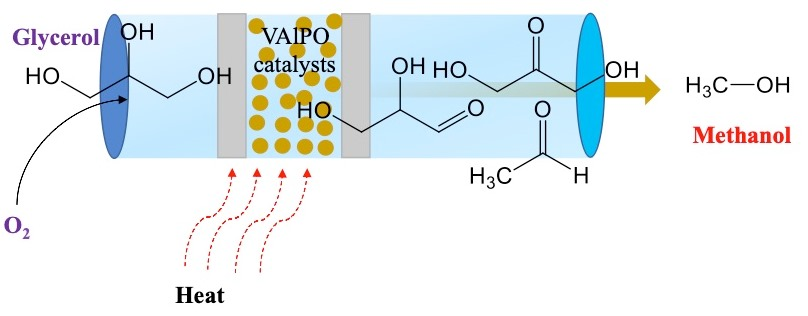
:The catalytic activity of a series of vanadium aluminophosphates catalysts prepared by sol-gel method followed by combustion of the obtained gel was evaluated in glycerol conversion towards methanol. The materials were characterized by several techniques such as X-ray diffraction (XRD), UV-vis, Fourier-transform infrared (FTIR), Raman and X-ray photoelectron (XPS) spectroscopies. The amount of vanadium incorporated in aluminophosphates framework played an important role in the catalytic activity, while in the products distribution the key role is played by the vanadium oxidation state on the surface. The sample that contains a large amount of V4+ has the highest selectivity towards methanol. On the sample with the lowest vanadium loading the oxidation path to dihydroxyacetone is predominant. The catalyst with higher content of tetrahedral isolated vanadium species, such V5APO, is less active in breaking the C–C bonds in the glycerol molecule than the one containing polymeric species.
1. Introduction
The conversion of glycerol in added value products has been the subject of extensive research due to its excess in the world market, whereas approximately 100 kg of glycerol is produced for each ton of biodiesel [1]. Glycerol is very cheap and could be harnessed by dehydration, esterification, oxidation, hydrogenolysis, reforming and polymerization, and, therefore, glycerol is expected to become a renewable building block chemical to be efficiently converted into various more added value products. The selective oxidation of glycerol to high-value chemicals with molecular oxygen has been extensively studied [2,3,4,5].
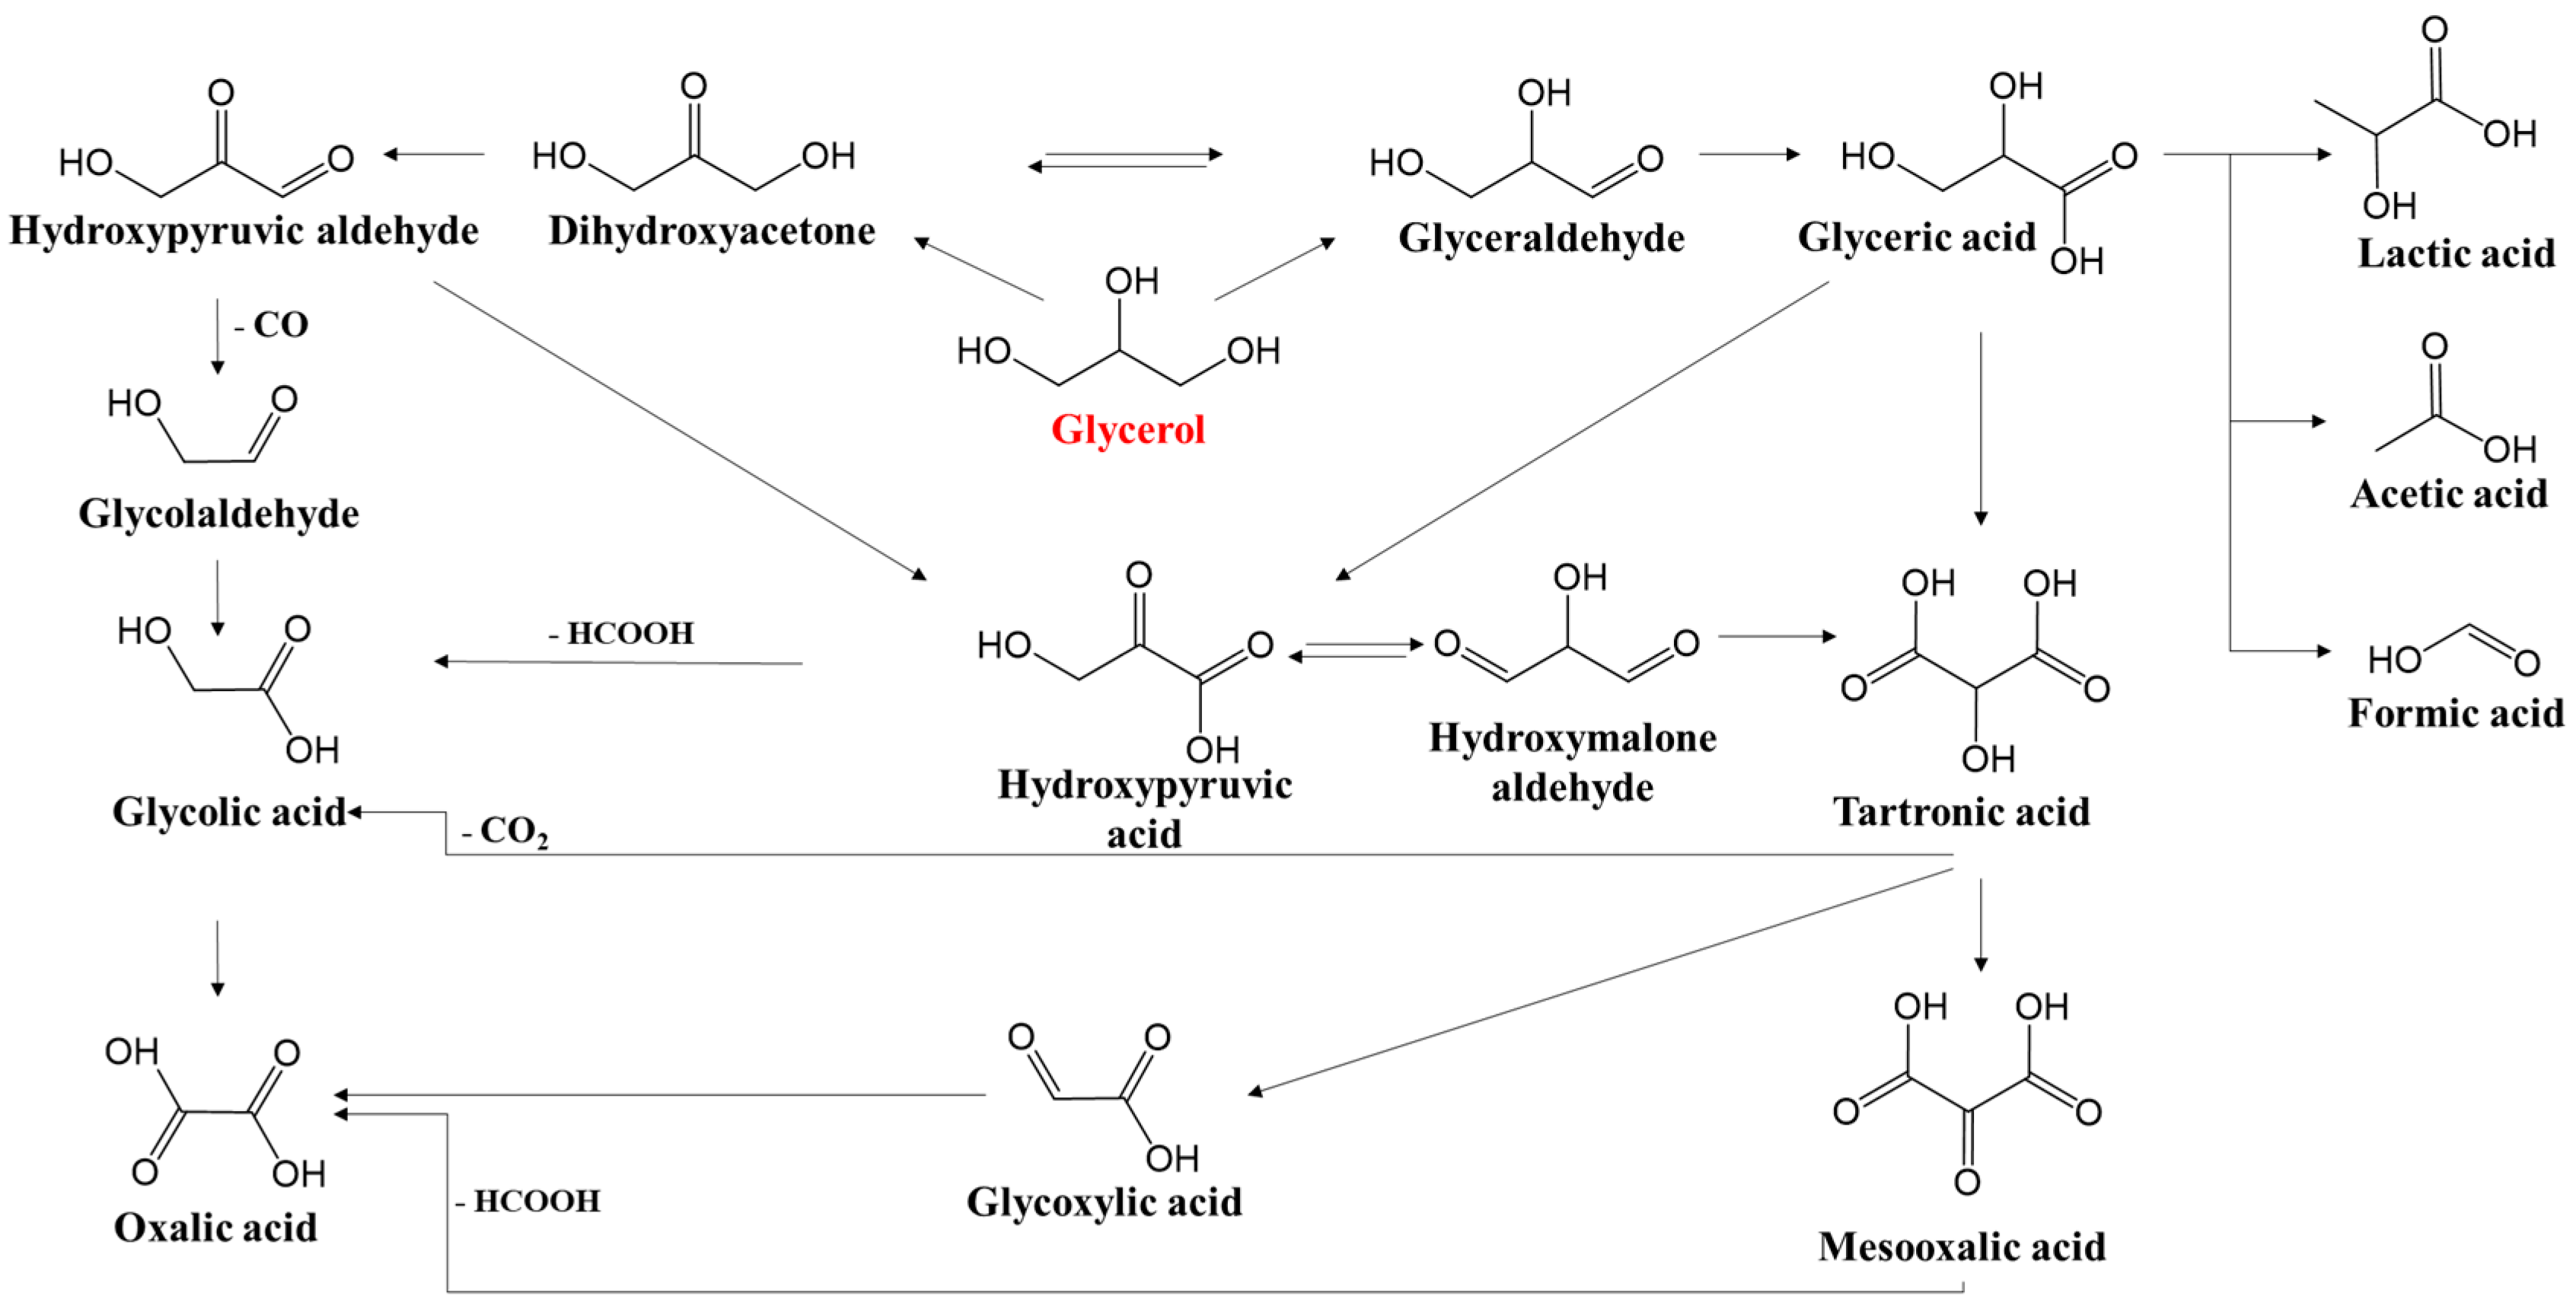
The catalytic glycerol oxidation occurs by a complex mechanism and conducts to many products such as formic acid [6], acrolein [7], acrylic acid [8,9], glycolic acid [10], glyoxylic acid, glyceric acid [11], glyceraldehyde and dihydroxyacetone [12,13] (see Scheme 1) [6]. These products have many uses in the chemical industry, e.g., dihydroxyacetone can be used in cosmetics industry; glyceric acid for detergents [14]; formic acid is used as a hydrogen carrier [15]; and acrylic acid is used mainly in the production of acrylic esters and resins used in coatings and adhesives [16].
Therefore, the glycerol oxidation has been extensively studied over numerous catalysts yielding various byproducts [3,17,18]. Wang et al. [19] obtained, mainly, acrolein and acetaldehyde over vanadium phosphate oxides, Ning et al. [20] reported the selective oxidation of glycerol to 1,3-dihydroxyacetone over Pt catalysts promoted with bismuth and antimony, Hamid et al. [21] observed a superior selectivity to glyceric acid using nanosized Pd-based catalysts supported on activated carbon (Ac), hydrotalcite (HTc) and activated carbon–hydrotalcite composite (Ac–HTc). Glyceric acid was also obtained over CuNiAl hydrotalcites (HTs) [22], while acrylic acid was mainly a product obtained by gas-phase oxidation of glycerol over W–V–Nb–O complex metal oxides having a structure like that of orthorhombic Mo3VOx [23]. The successful employment of different ceria nanocatalysts for glycerol oxidation reaction has been also demonstrated [4]. The authors concluded that the presence of reduced Ce3+ species and, also, the interactions of the reactants with different crystallographic surfaces play a major role in the catalytic activity of these materials [4].
However, there are several identified limitations such as: the catalysts suffer deactivations, make use of alkaline conditions and sometimes lead to poor selectivities [2,24,25]. Therefore, the development of highly active and selective heterogeneous catalysts for base-free glycerol oxidation remains a big challenge for the scientific community.
A much more interesting, but more challenging, alternative is to convert glycerol to methanol, due to the fact that methanol is a major raw material for the production of various added value chemicals, therefore its production from glycerol attracted the researcher’s interest. Commercially, glycerol can be converted to methanol by a two-step process: catalytic transformation of crude glycerol to syngas (H2/CO), followed by the methanol synthesis process. However, there are studies demonstrating that the direct glycerol transformation to methanol is possible. For instance, glycerol can be directly converted to methanol in hydrogen with high selectivity over a Pd/Fe2O3 co-precipitated catalyst [26]. Furthermore, Hutchings et al. [27] showed that crude glycerol can be reacted with water over very simple basic or redox oxide catalysts, such as MgO or CeO2, to produce methanol in high yields in a one-step low-pressure process.
Heterogeneous catalysts based on vanadium oxides are well known as active catalysts for the oxidation process due to their multiple oxidation states. Selective oxidation reactions over these catalysts are influenced by many factors such as (i) lattice oxygen, (ii) the strength of vanadium-oxygen bonds, (iii) environment of oxygen atoms, (iv) redox properties of vanadium and (v) multi-functionality of the active sites [28].
Meanwhile, microporous materials, aluminophosphate frameworks (AlPO), have acquired attention lately due to their structural and compositional diversity being analogous with zeolites and following their catalytic applicability trend, a multitude of metals have been placed in neutral AlPO framework. VAlPO-5 and VAlPO-11 were the most studied aluminophosphates molecular sieves with vanadium, and they were found to be active in numerous selective oxidation reactions, among which alkanes, alkenes aromatic compounds oxidation with oxygen or hydrogen peroxide [29]. On the catalyst surface the presence of monomeric or polymeric vanadium species were evidenced depending on the vanadium loading.
Recently, by modification of aluminophosphates with small amounts of a transition metal, such as V (~3 wt.%) [30], as well as Fe and Co (1, 10 and 20 wt.%) [31,32], more active and selective catalysts for glycerol conversion to acrolein were developed.
In this paper, we examined the one-step glycerol conversion to methanol and other useful chemicals, without the addition of hydrogen gas, over V substituted AlPO4 catalysts in order to emphasize the role of vanadium content on the catalytic activity and selectivity.
2. Results and Discussion
2.1. Characterization of Catalysts
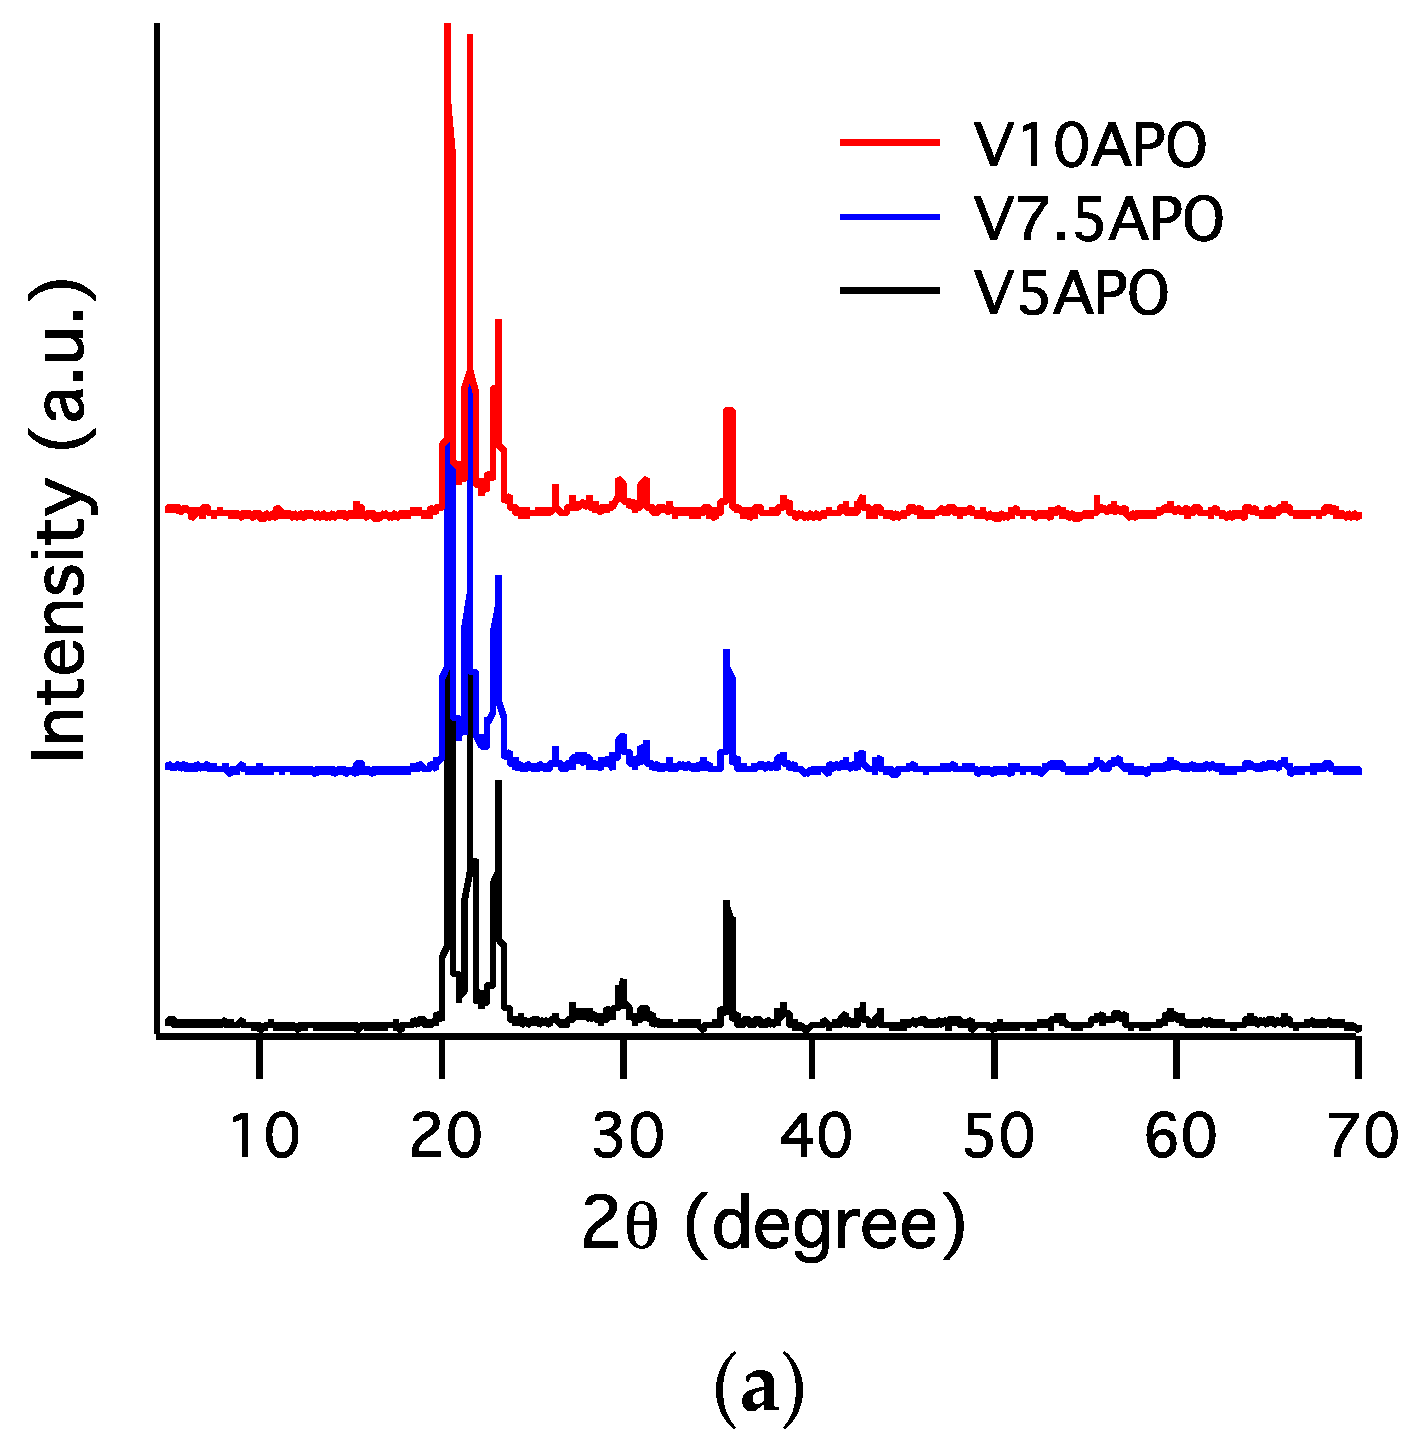
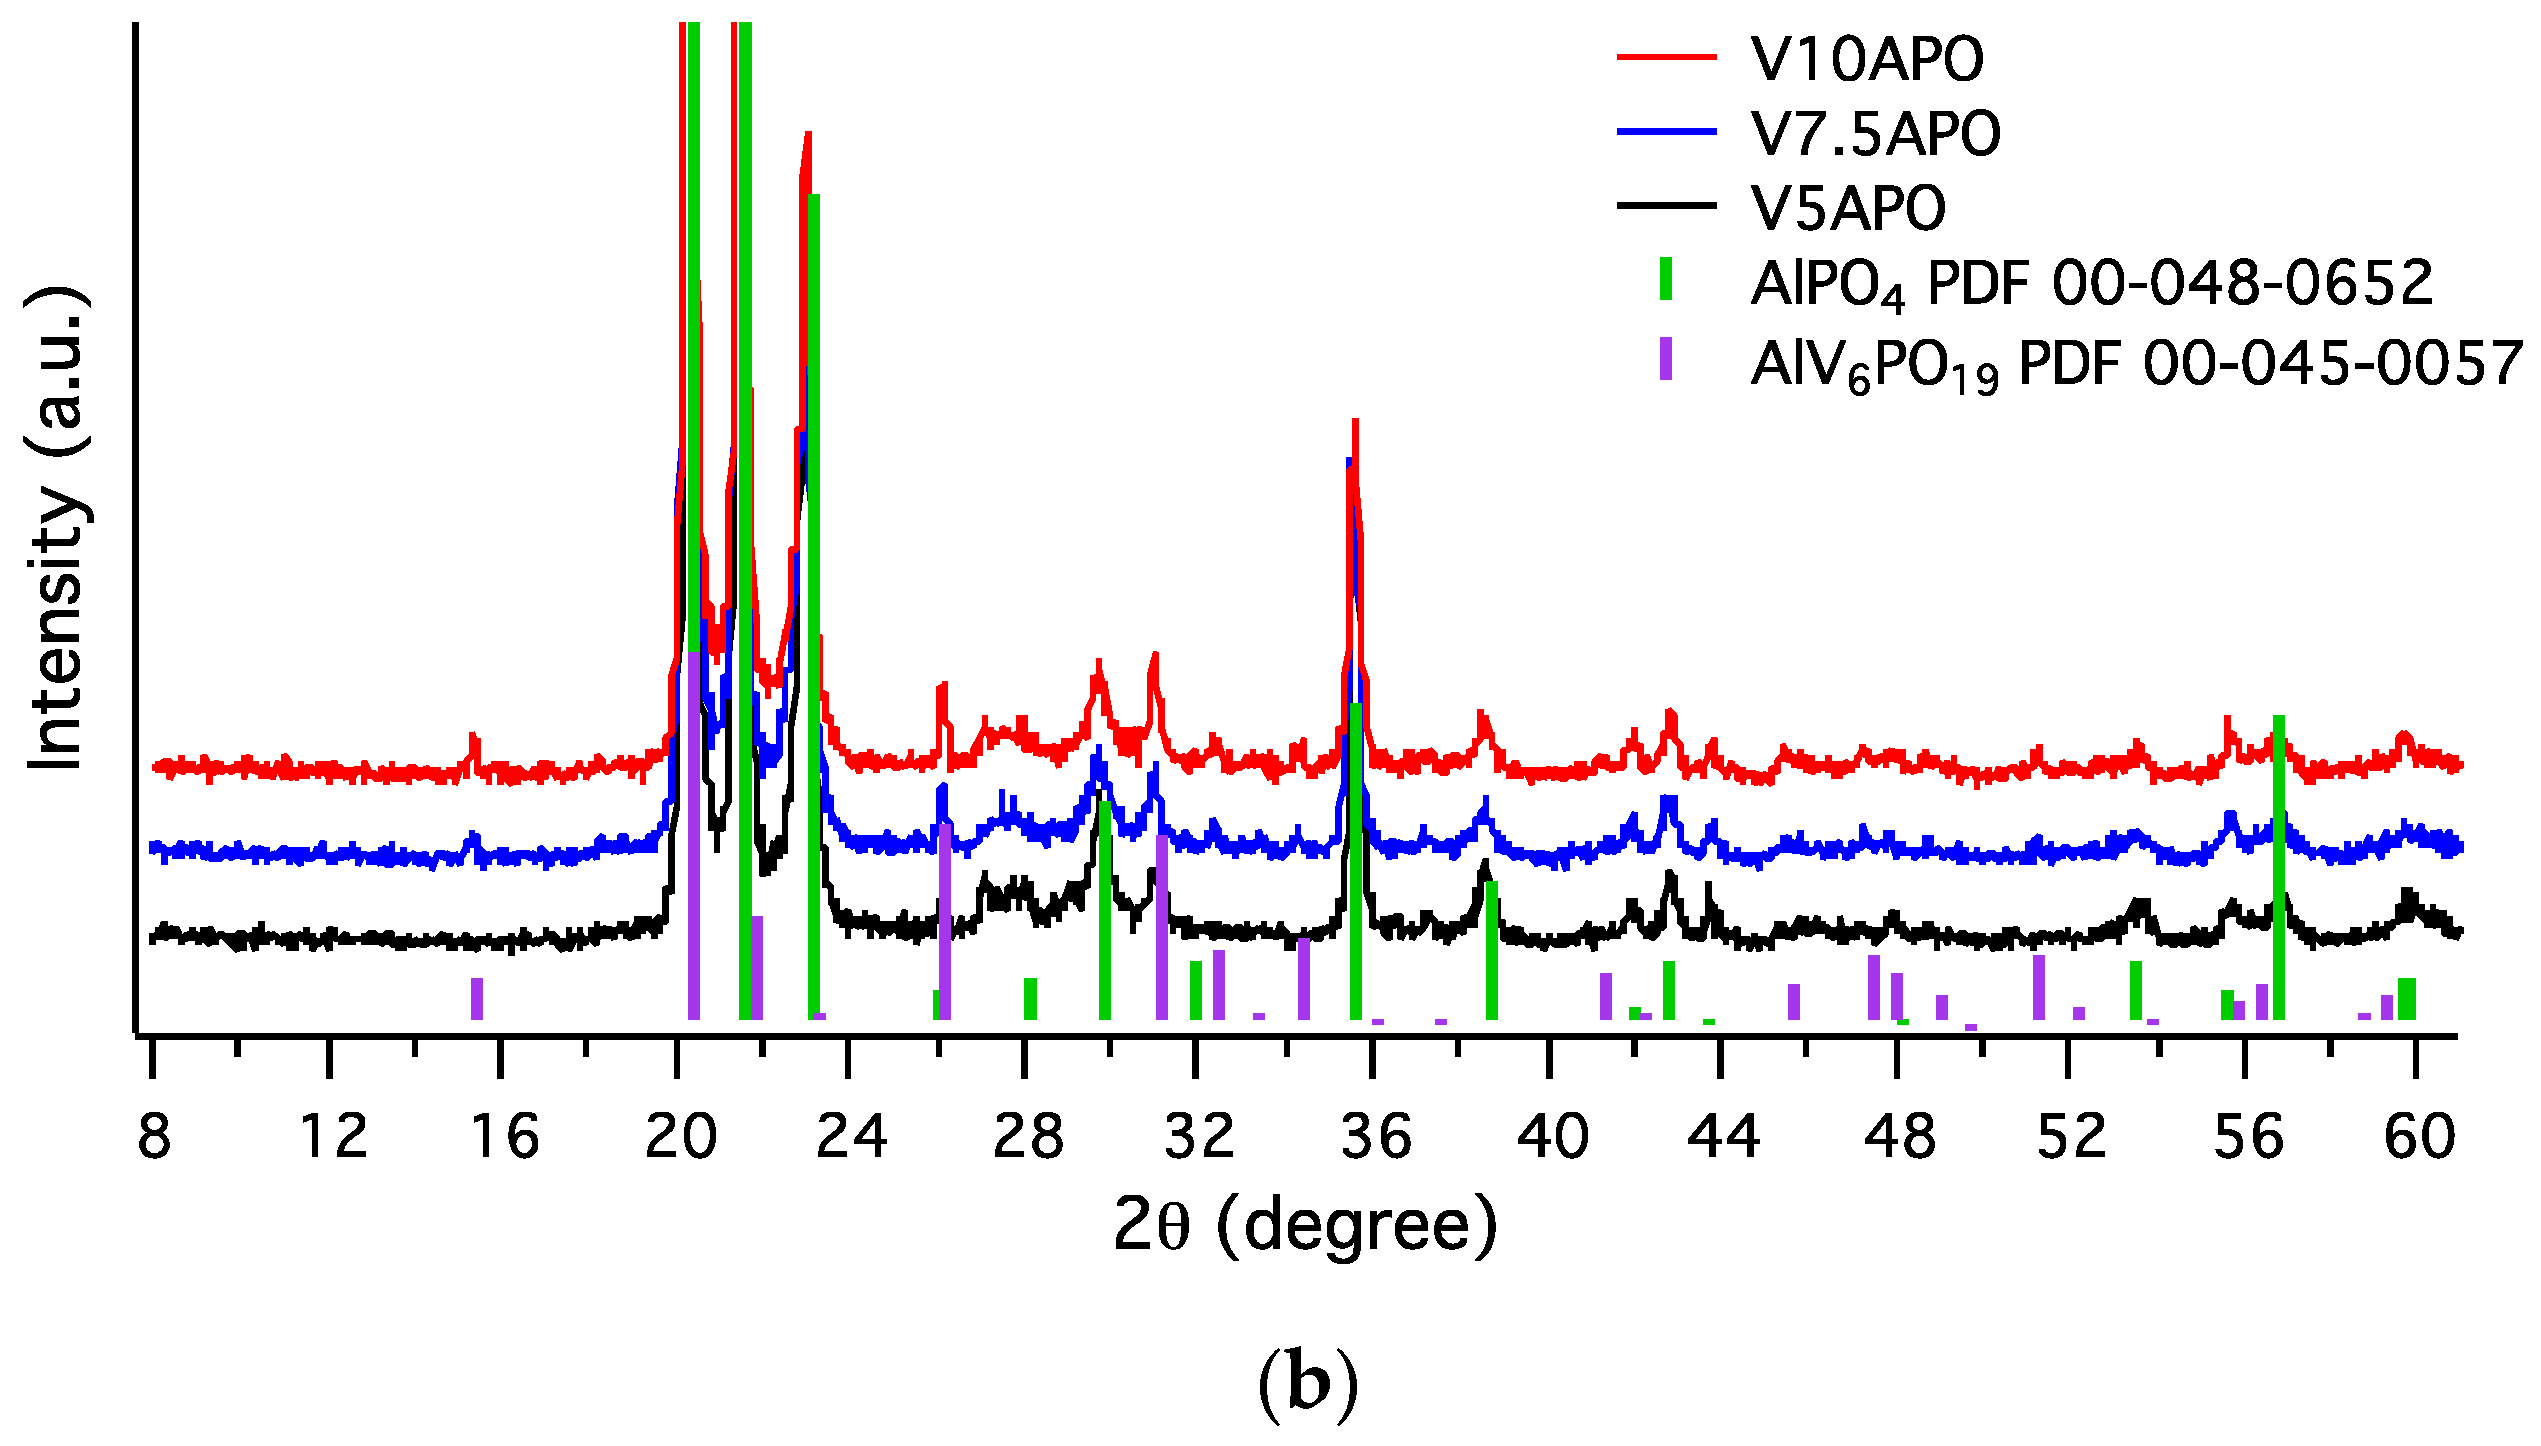
X-ray diffraction patterns of all samples are illustrated in Figure 1. A highly crystalline structure for all studied samples was observed, but with a low surface area, as evidenced by nitrogen adsorption isotherms (Table 1). The four main diffraction lines at 2θ of 20.32°, 21.48°, 23.00° and 35.54° correspond to (020), (211), (212) and (107) planes of orthorhombic AlPO4 phases (Joint Committee on Powder Diffraction Standards (JCPDS) Card No. 00-048-0652), respectively. As it can be observed in Table 1 for all samples, the three lattice parameters (a, b and c) have increased values reported to AlPO4, which means that during vanadium insertion, a lattice expansion occurred. This can take place when pentavalent vanadium ion (0.68 Å) replaced the pentavalent phosphorus ion with a smaller dimension (0.305 Å). This also indicates that vanadium was successfully incorporated into the framework. Moreover, additional lines located at 2θ of 15.4°, 26.2° and 31.1° correspond to a polymeric orthorhombic AlV6PO19 phase (Powder Diffraction File (PDF) card 00-045-0057) as highlighted in the XRD patterns. However, the vanadium insertion does not influence the AlPO4 crystallinity. It was also observed that increasing the V loading in AlPO, slightly increases the crystallite size, from 35 nm to 37 nm, for V5APO to V10APO, respectively (Table 1), probably due to the increase of polymeric vanadium phase, as evidenced further by Raman data for higher vanadium loadings.
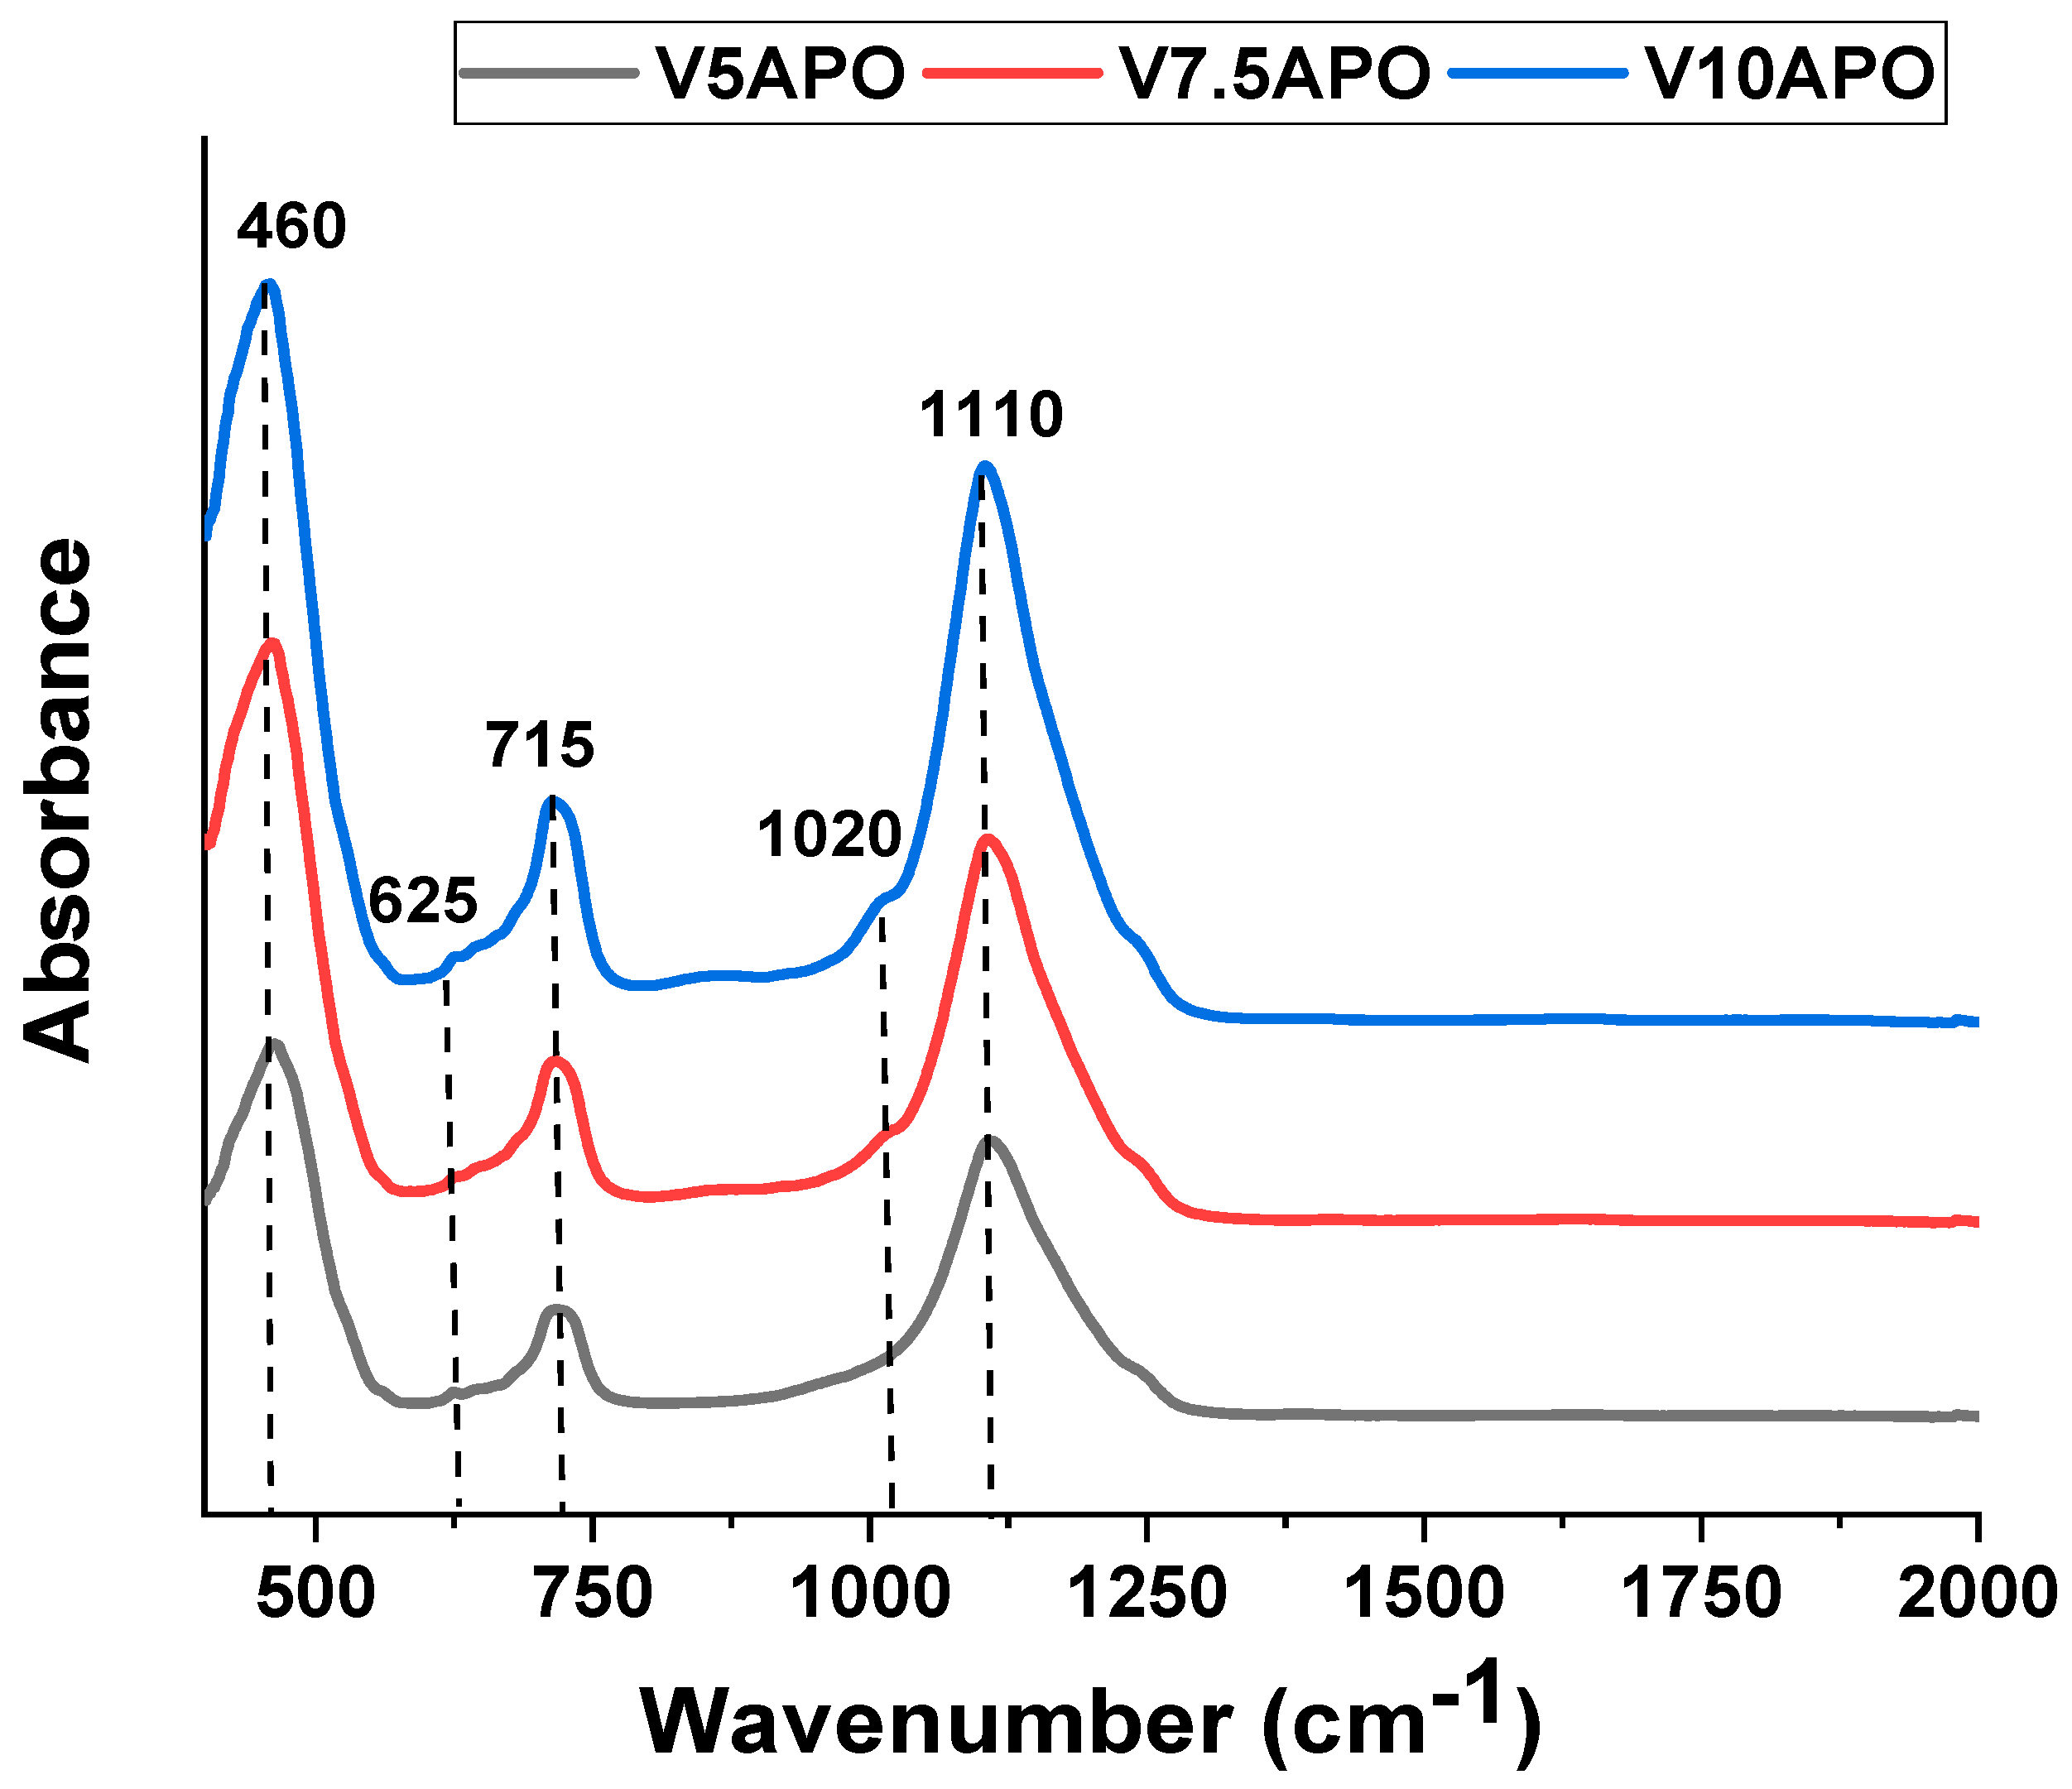
Figure 2 shows the FTIR spectra of VAPO catalysts. The band located at 1110 cm−1 is characteristic of aluminophosphates and is due to asymmetric stretching vibration of the P–O–Al bonds [33], the band located at 715 cm−1 is due to P–O–P bridges, while the band that appear at 460 cm−1 is attributed of PO4 units corresponding to primarily crystalline phase of orthophosphate composition. The low absorption band at 625 cm−1 is assigned to deformation vibrations of O–V–O, while that located at 1020 cm−1 is assigned to the vibrations of the isolated V=O vanadyl groups in VO5 trigonal bipyramids [34].
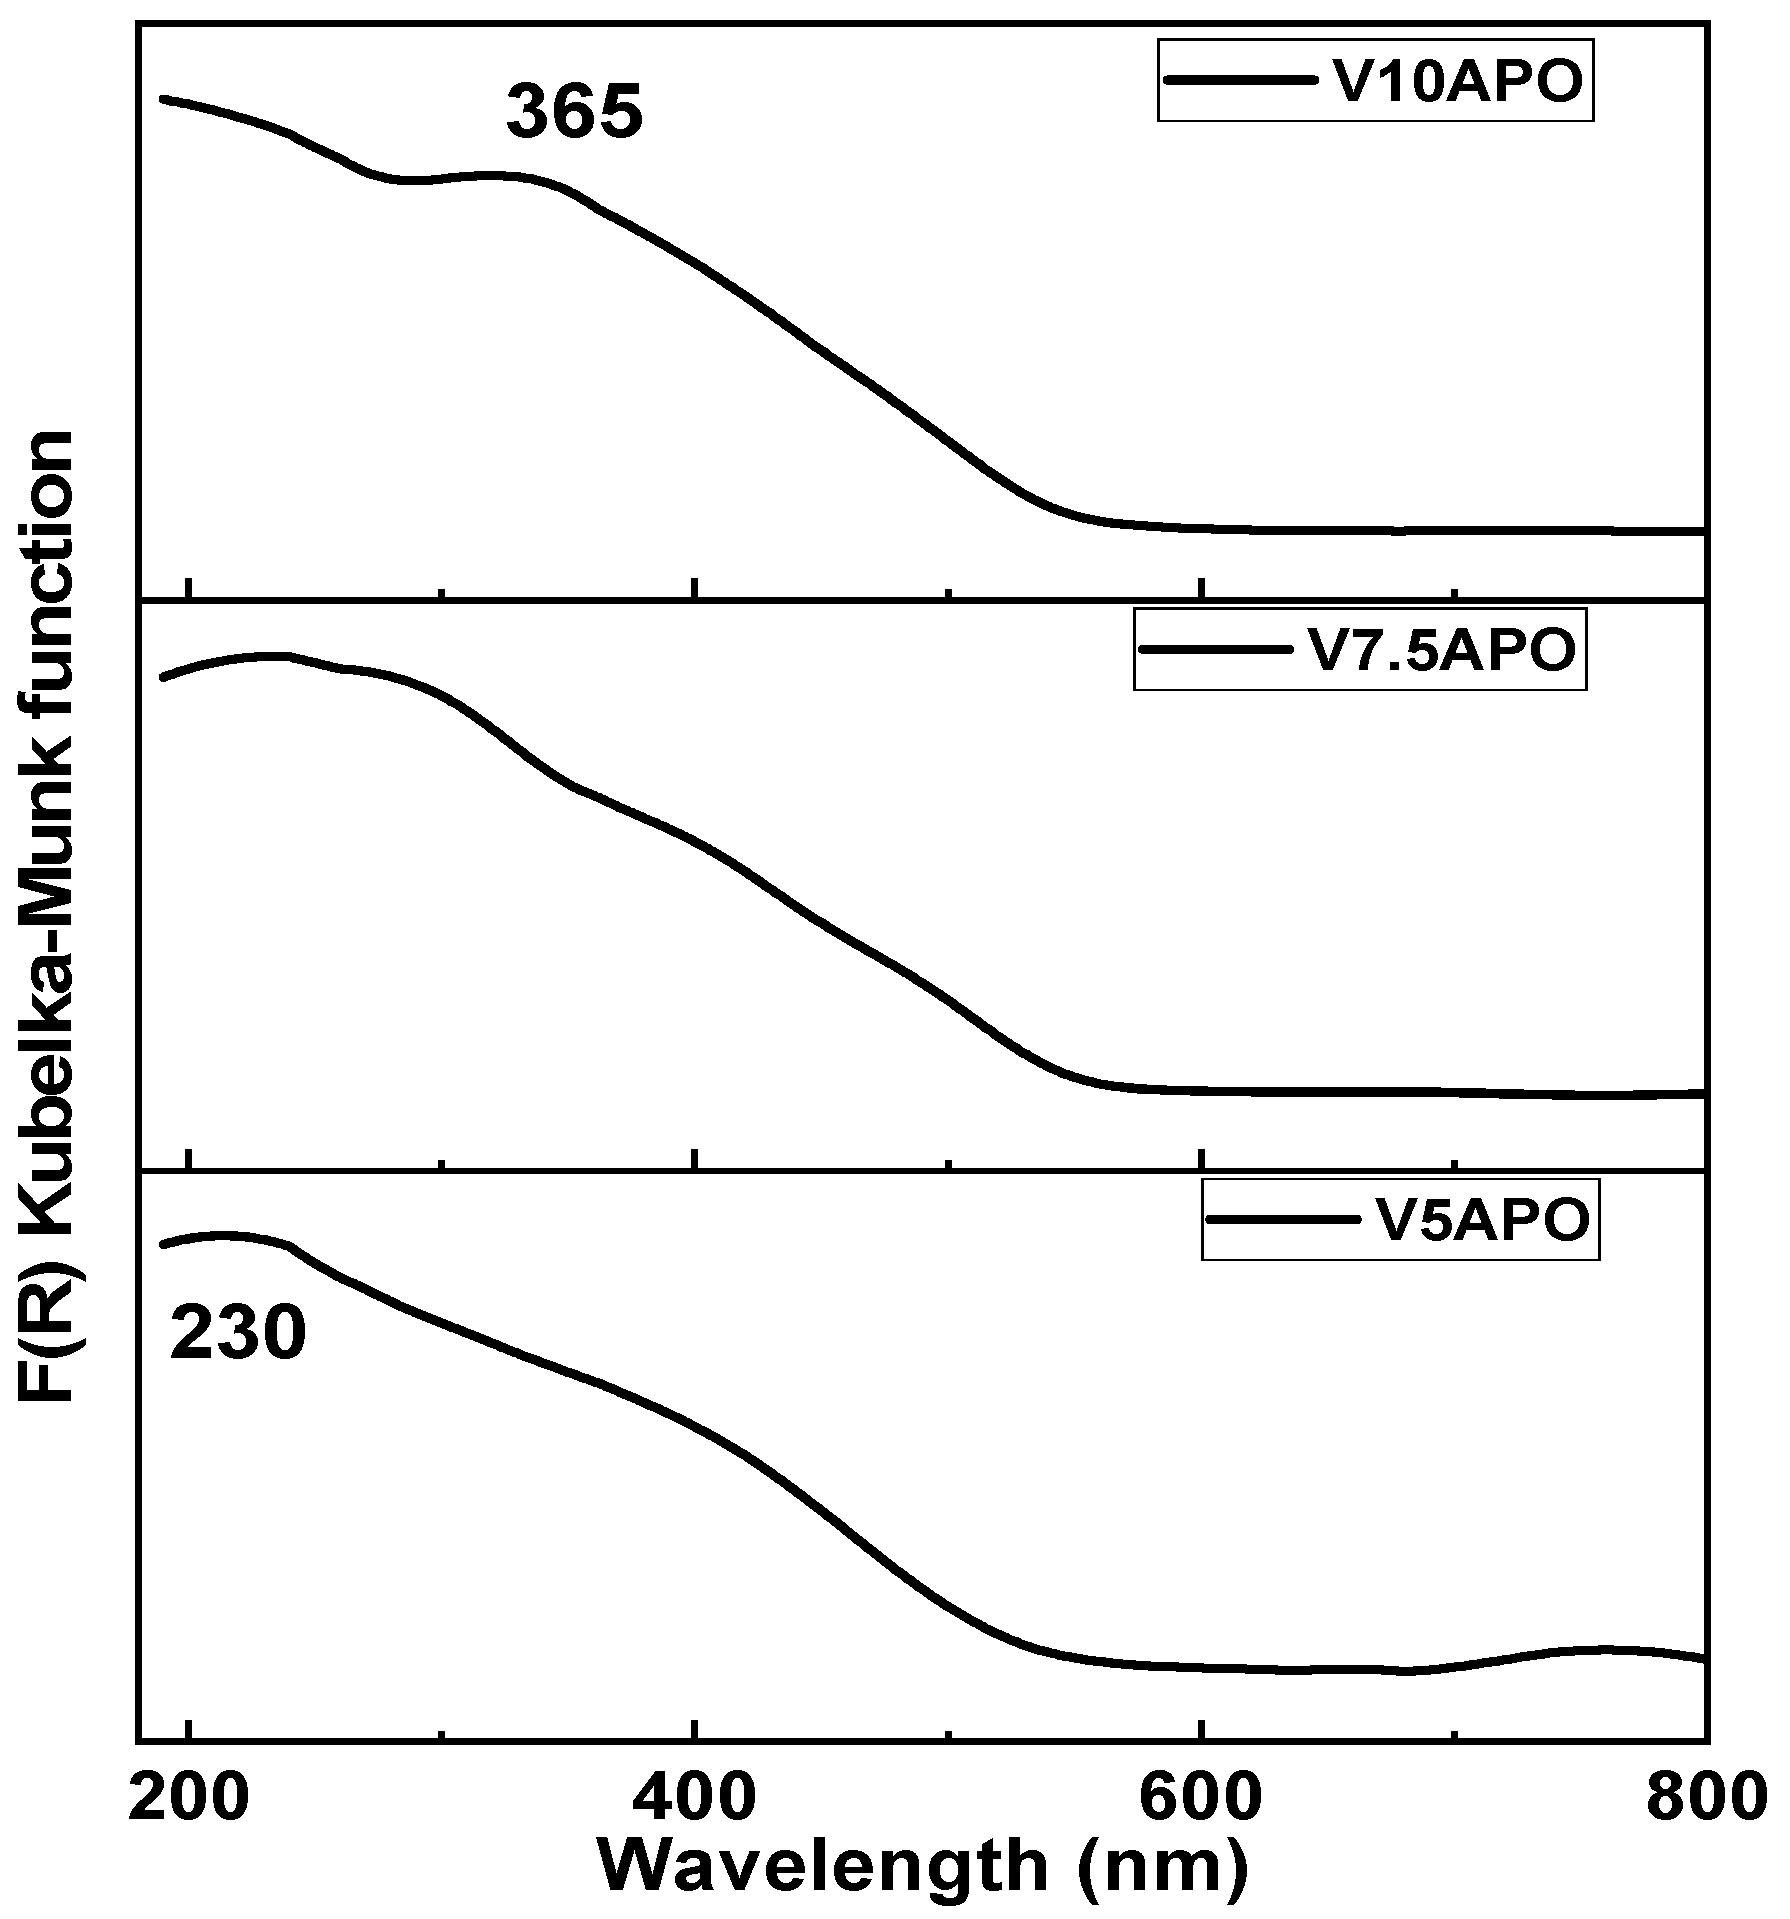
The type of vanadium species in the VAPO catalysts were further studied by UV-vis spectroscopy (see Figure 3). In general, the absorbance spectra of V5APO and V7.5APO samples present a band at 230 nm that can be assigned to tetrahedral isolated V species, attributed to oxygen–tetrahedral V5+ charge transfer from vanadyls (V5+=O) [29,35], and also to V4+ charge transfer band of VO2+ species [36]. The V7.5APO and V10APO samples present a new band located at 365 nm that is attributed to tetrahedral vanadium species in a polymeric state [37]. The shift of absorption band to higher wavelengths, with increasing of vanadium loading, highlights the formation of vanadium species with higher coordination, five or six [38]. Likewise, the bands presented in this interval are typical d–d transitions of V4+ species. It seems that for higher loadings, the V5+=O ions were transformed to V4+=O species, and, in agreement with other studies, they could also change their coordination (to octahedral geometry) in the presence of water molecules [29]. This is also supported by the decrease of the band from 230 nm when the vanadium loading is increasing.
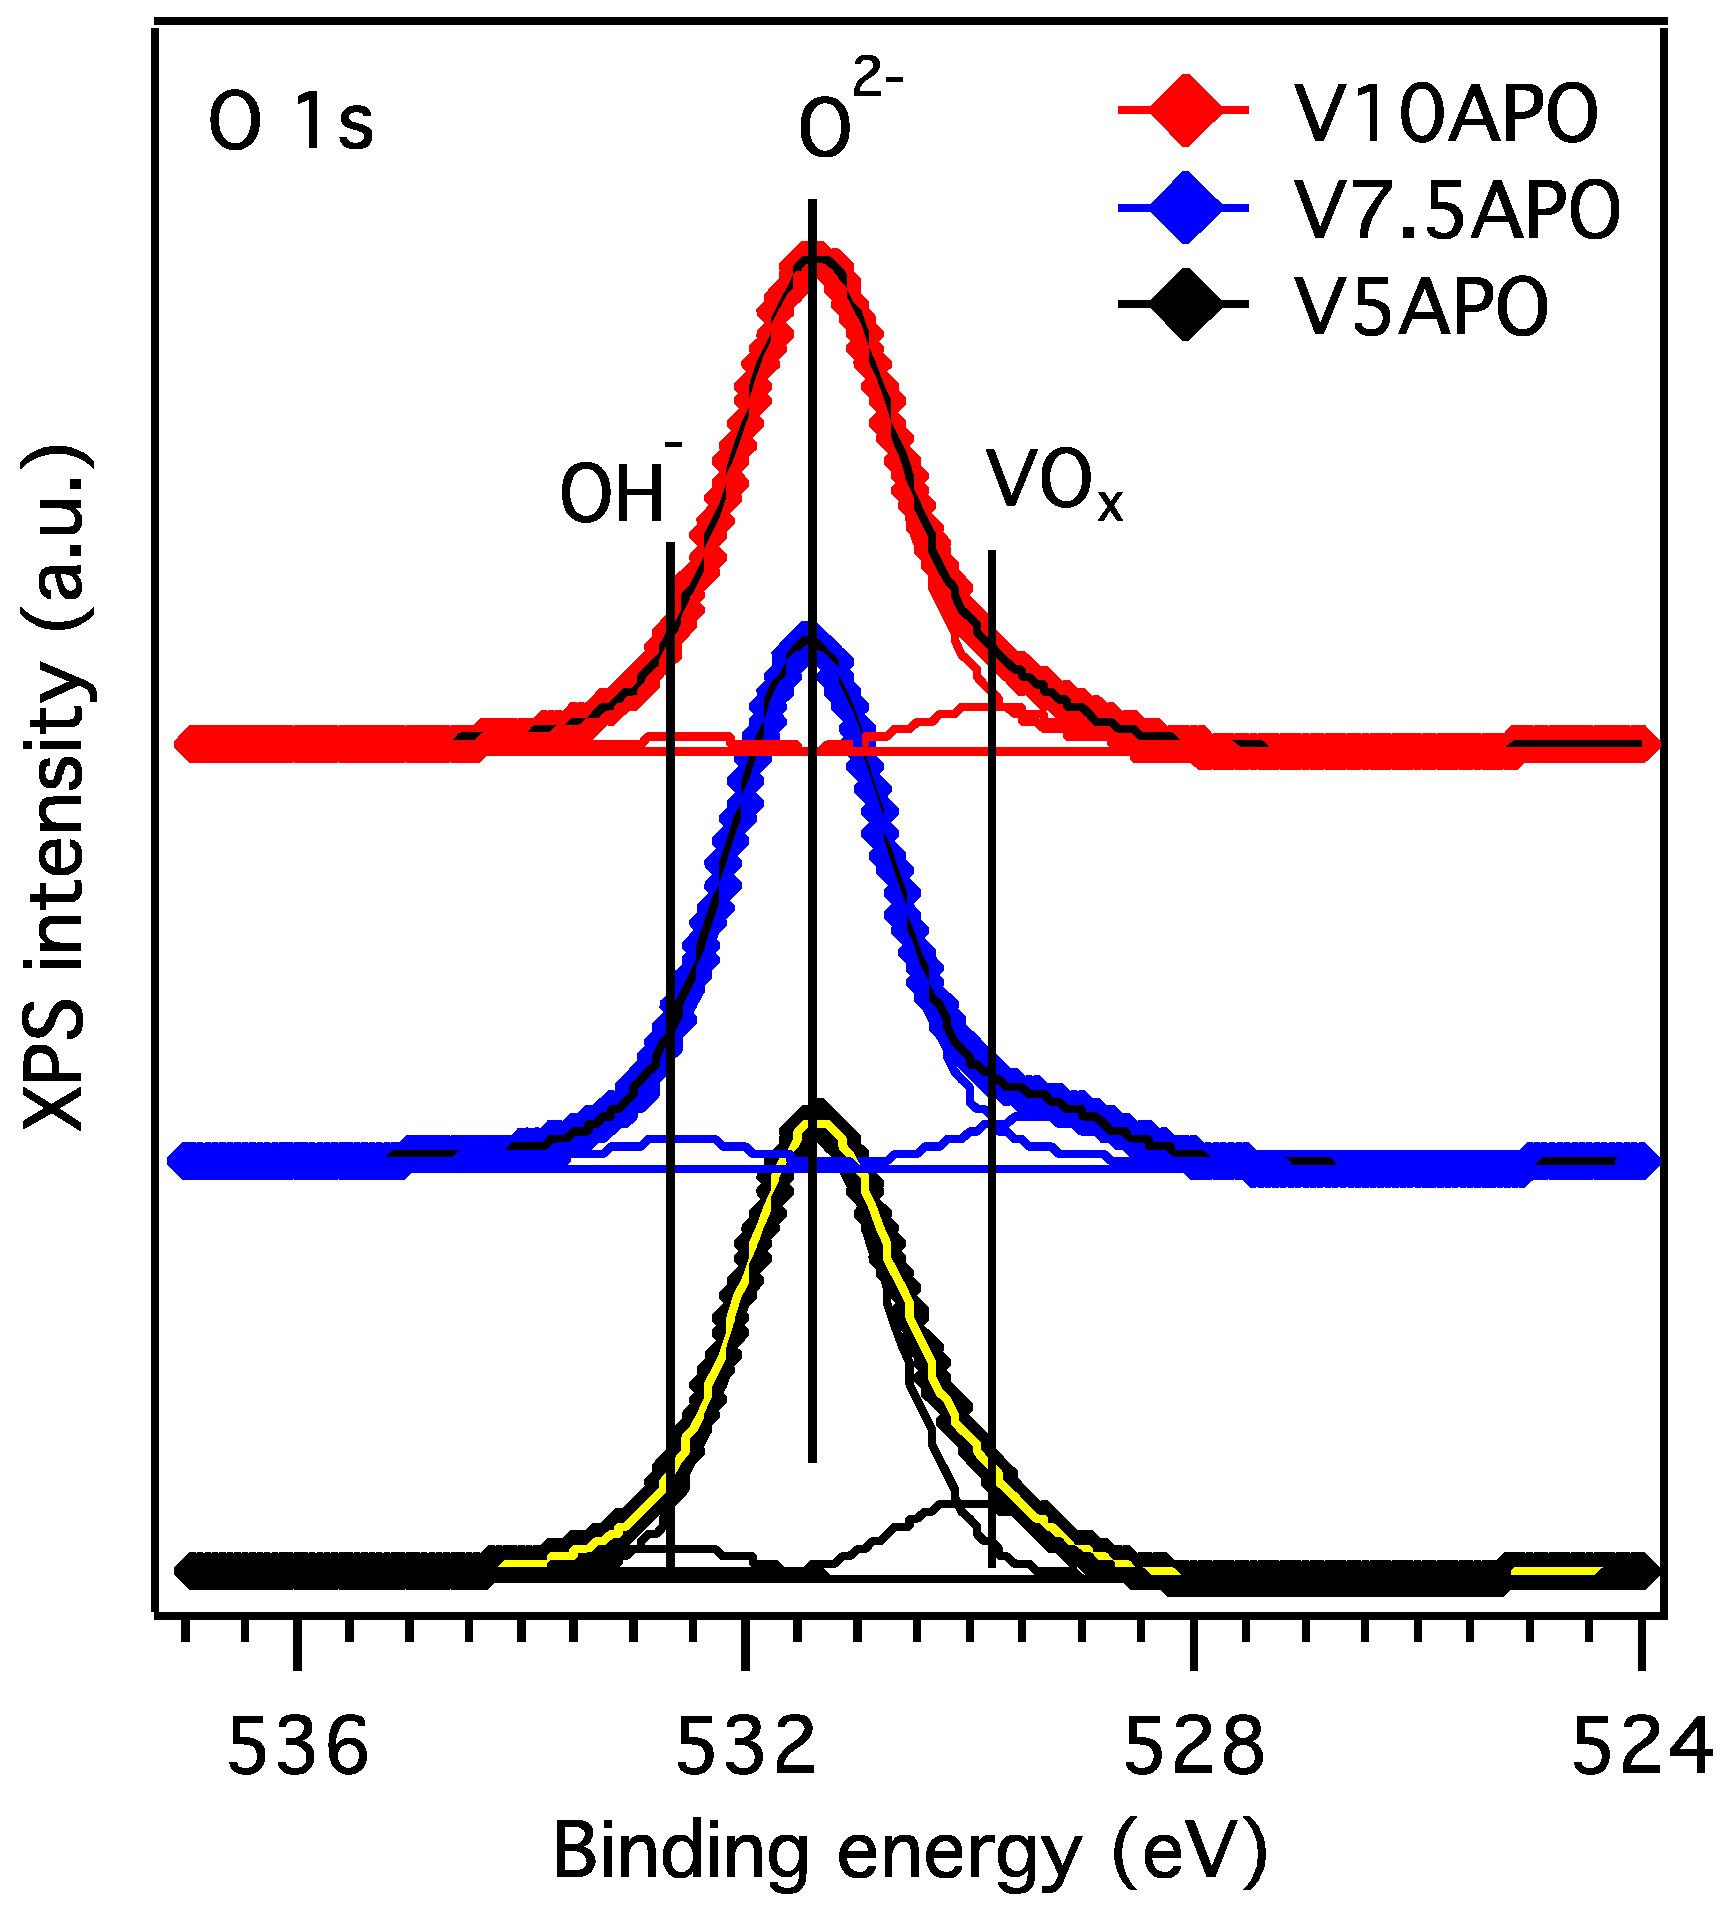
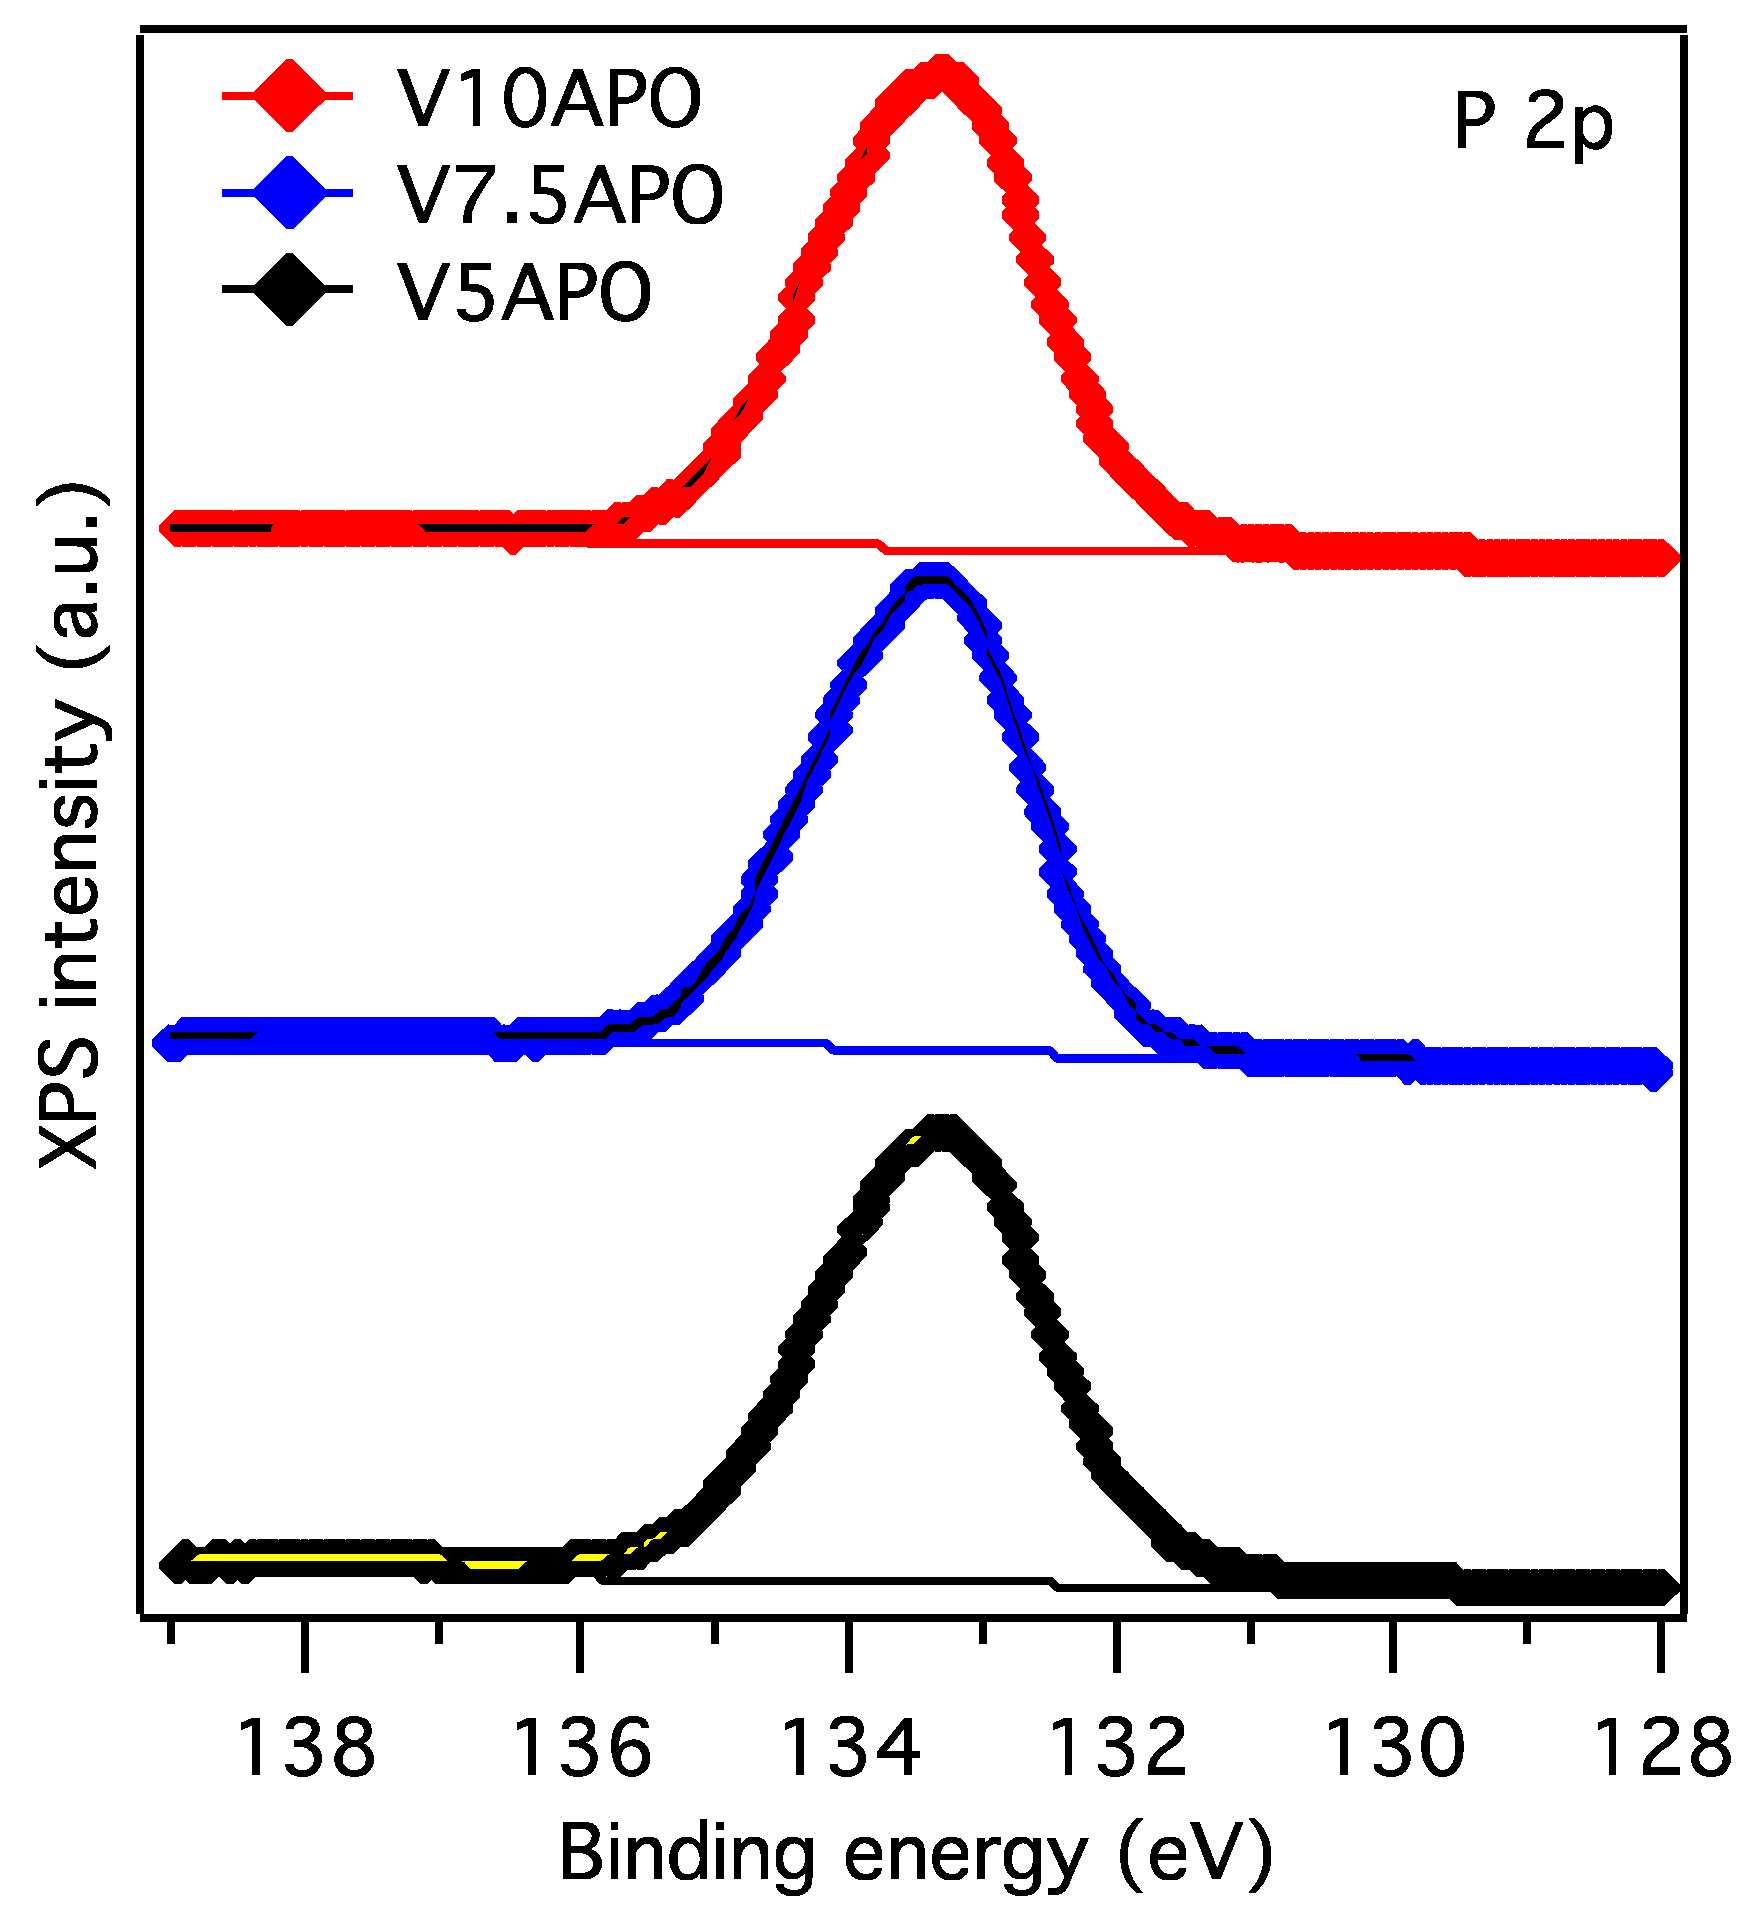
High resolution XP spectra of O 1s, V 2p, Al 2p and P 2p for VAPO samples are presented in Figure 4, while the surface composition and the binding energies values are shown in Table 2. The O 1s core level taken at 531.3 eV for phosphate (PO4)2− and 530.0 eV for VOx was used as an internal binding energy reference according to Silversmit’s recommendations [39].
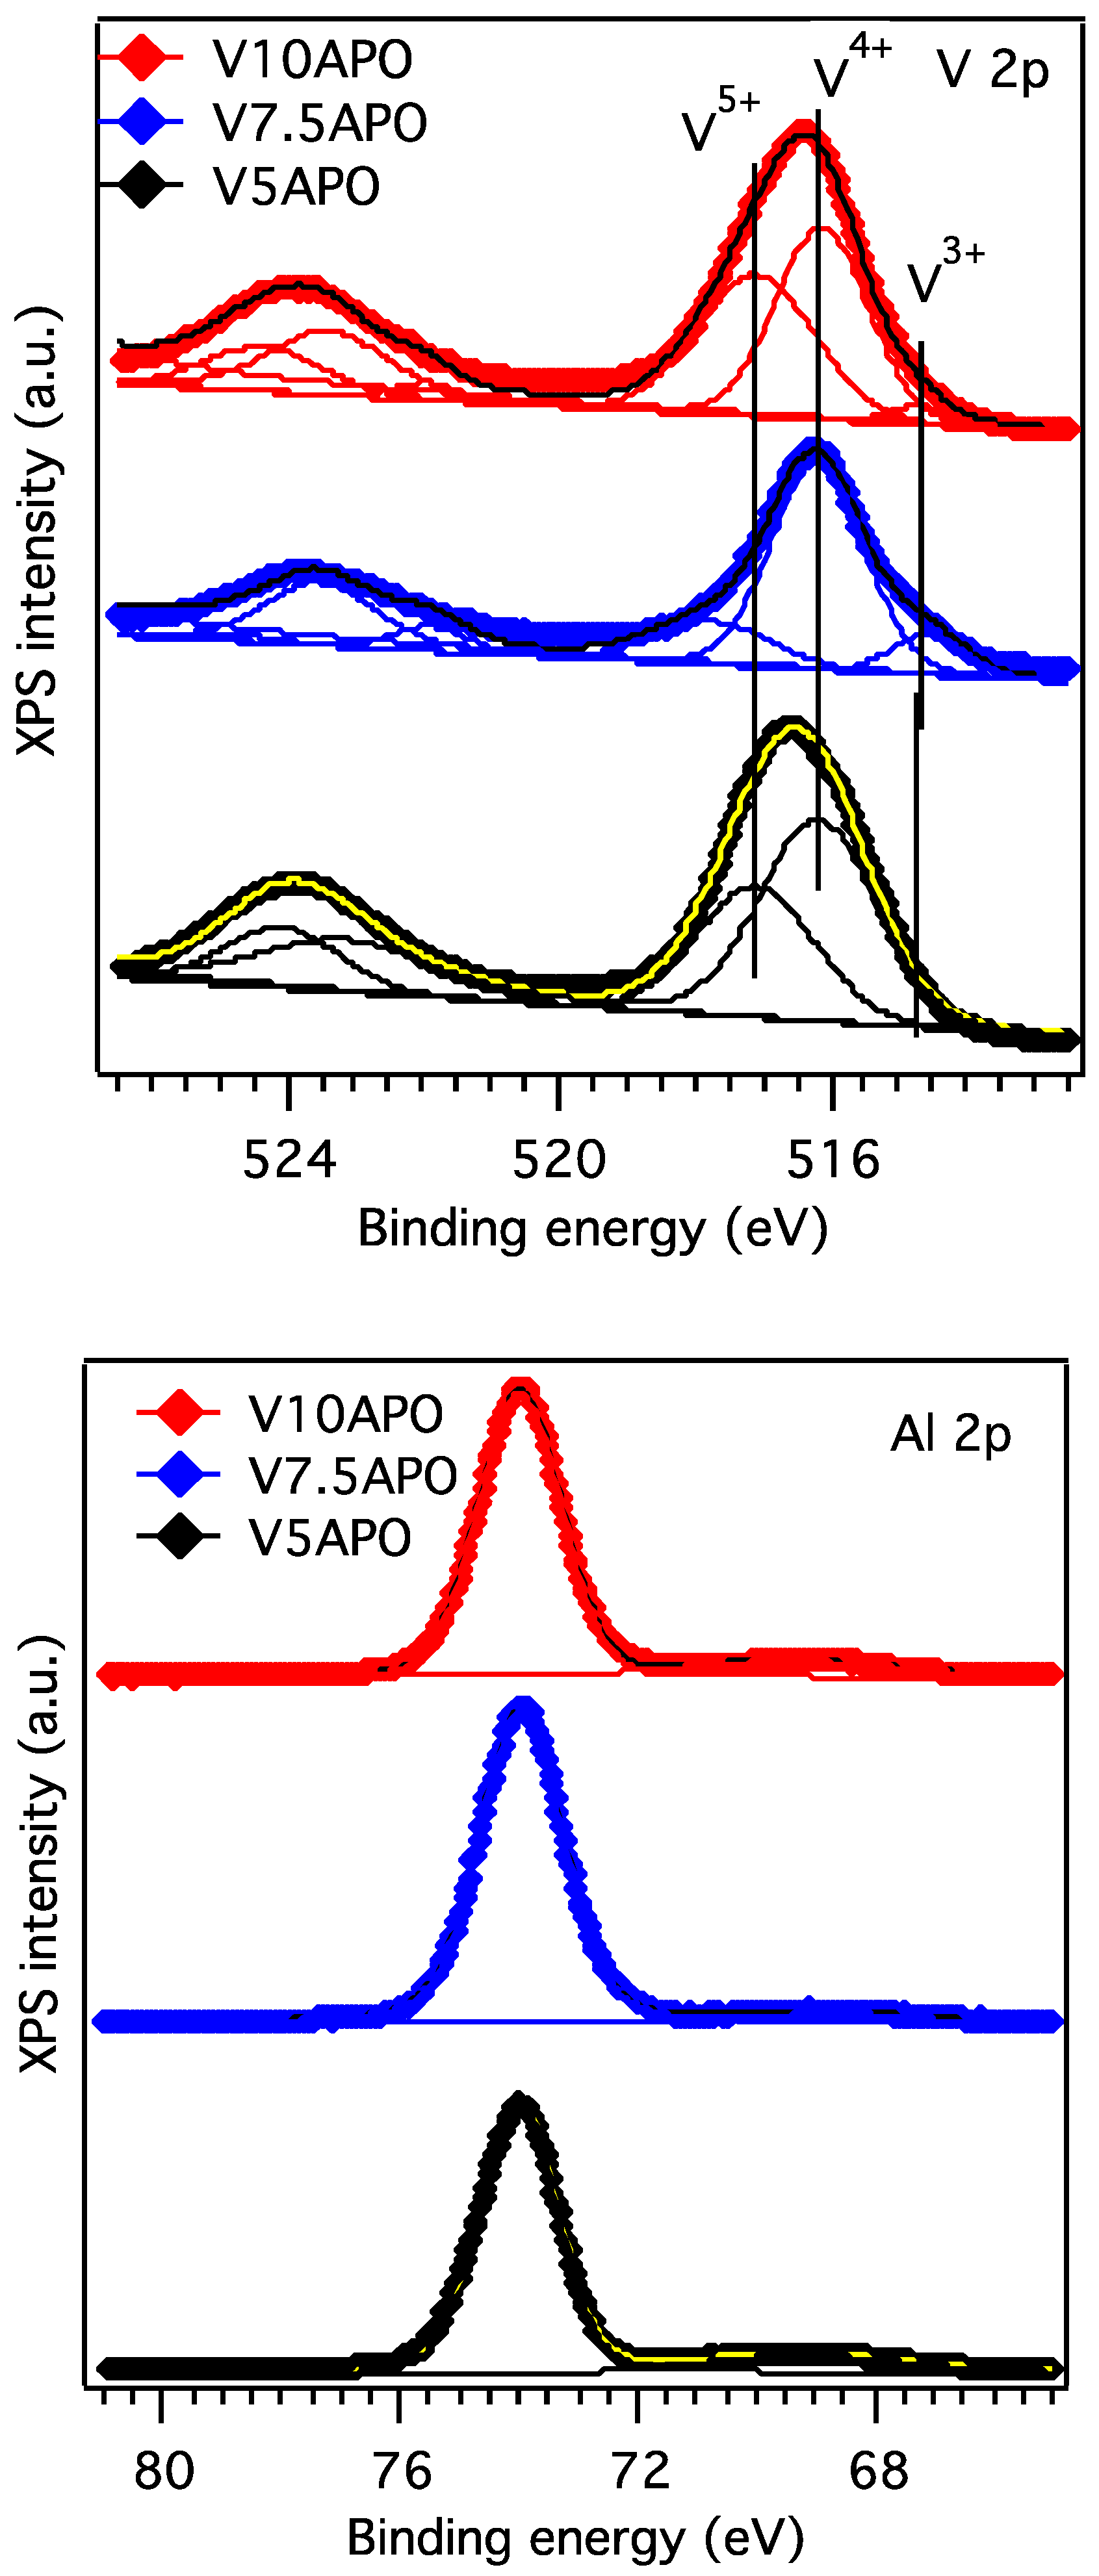
The XPS core-level of V 2p region (515–525 eV) is fitted with three components with the maximum intensity at 514.6 eV, 516.1 eV and 517.1 eV corresponding to V3+, V4+ and V5+, respectively [39,40]. For the sample containing the lowest amount of vanadium (V5APO), only two components were identified, corresponding to V5+ and V4+. UV–vis data also indicates the presence of both +4 and +5 oxidation states of vanadium. By increasing the amount of vanadium (samples V7.5APO and V10APO) a third component arises, which correspond to V3+ oxidation state. Moreover, the sample V7.5APO presents the highest amount of V4+ species (~81%) at the surface and the lowest amount of V5+ (~10%) compared to the total amount of V present (see Table 2). This will have an important impact over the catalytic selectivity of the materials, as it is detailed in the section below.
The O 1s core level revealed the presence of multiple components. The main component found at 531.3 eV corresponds to phosphate oxygen [41,42], while the component at 530.0 eV corresponds to the oxygen bonded to vanadium [39]. The small component found at 532.6 eV is associated to OH− species found on the surface [43].
The XPS region for Al 2p was fitted with only one component, corresponding to Al3+, situated at a lower binding energy, 73.8 eV, than expected ~75.1 eV, specific for AlPO4. This behavior, was also observed for other Al co-doped oxides, and confirms the fact that P was replaced by V and bonds Al [44]. The P 2p core level is associated to P5+ from phosphates [42], irrespective to the vanadium loading.
The atomic ratios Vtot/Al and Vtot/P found at the surface confirm the composition for the samples with higher V loadings (V7.5APO and V10APO), while for the sample V5APO, higher amounts of V species were found at the surface, which means that V migrated to the surface, demonstrating heterogeneity of the material (see Table 2).
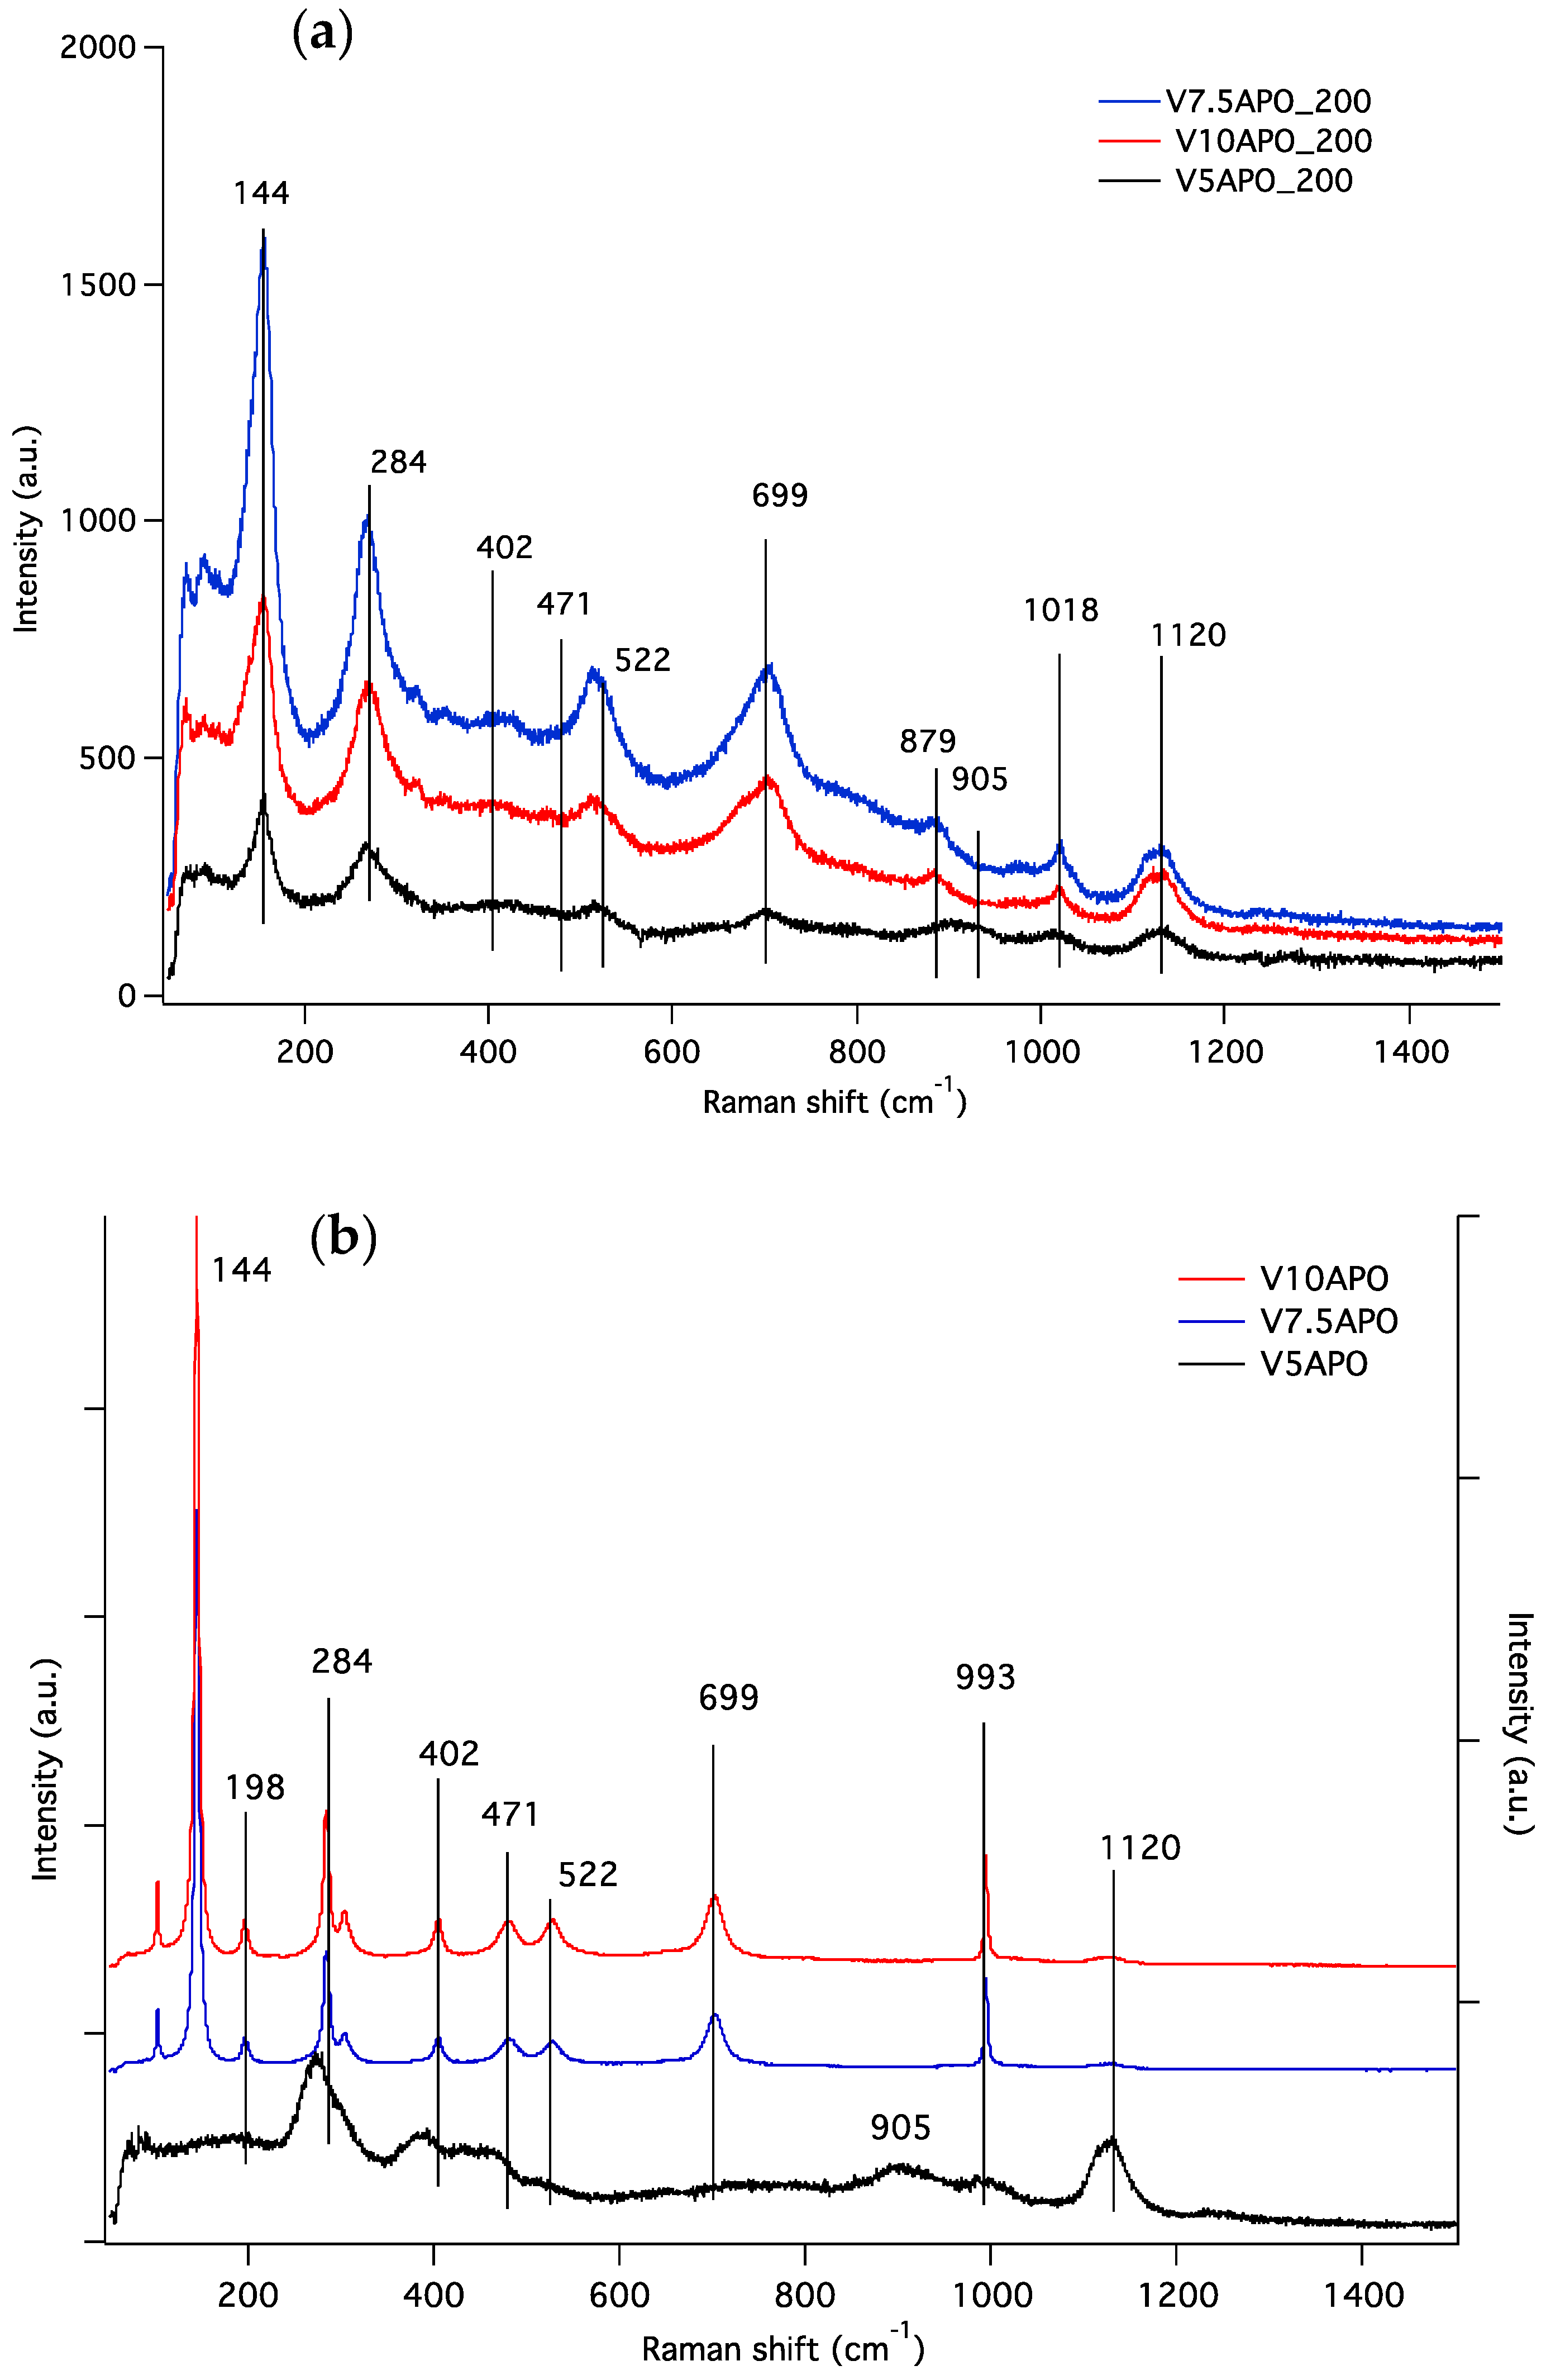
Raman spectroscopy has been employed to gain insights on the vanadium surface species, since Raman stretching frequency of vanadium–oxygen bonds provides information on local environment of the vanadium ion such as bond strength, nuclearity and chemical environment. For instance, Raman analysis can distinguish among three possible active oxygen sites: terminal V=O, binding surface V–O–V polymeric species and binding V–O– to support species [45]. Figure 5 depicts the Raman spectra of VAPO samples thermally treated at 200 and 600 °C with different V loadings.
The broad band at around 1120 cm−1 clearly evidenced for V5APO, and weaker for V7.5VAPO and V10APO samples, is typical of the AlPO4 framework, due to the asymmetric stretching modes of framework tetrahedral PO4 and AlO4 units [29,46]. Raman bands, in the 50–1020 cm−1 region, are related to the presence of surface vanadium oxide species from AlPO framework, and were also observed in the orthorhombic structure of V2O5 [47,48,49].
Within the Figure 5a, the presence of the Raman band(s) at: (i) 144 cm−1 is related to a –V–O–V–O–V– skeleton bent vibration and denotes a layer like structure as observed in V2O5 orthorhombic structure [48,49], (ii) 284 and 402 cm−1 can be assigned to V=O bend vibrations modes, (iii) 471 and 699 cm−1 correspond to the internal V–O–V bending and stretching modes, respectively, while, (iv) 310 and 522 cm−1 are associated to V–O bending and stretching modes along the c-axis, respectively. All of the Raman bands were slightly shifted from that of the V2O5 orthorhombic structure, probably due to the new configuration of V within the AlPO4 structure. For all three samples thermally treated at 200 °C, but more intensively in the case of V7.5APO and V10APO the characteristic Raman modes for V4+=O and V5+=O found in amorphous phase at 879 and 1018 cm−1, respectively were observed.
After calcination at 600 °C, the spectrum of sample containing 5% vanadium was different from samples with 7.5% and 10% vanadium, which were very similar and contain well defined Raman bands. For the samples V7.5APO and V10APO a decrease of the band located at 1120 cm−1 associated with the AlPO4 framework can be observed along with the sharpening of Raman bands associated to a layered structure: 144 cm−1 (bending) and 993 cm−1 (stretching), when vanadium oxide is present in the material. Similarly, it can be observed that in the case of V5APO the layer structure is damaged, since its Raman characteristic bands faded after calcination at 600 °C, together with the V=O bending and stretching modes from the internal structure. For all samples, after calcination at 600 °C, the disappearance of modes associated with the amorphous phase (879 and 1018 cm−1) can be observed and the appearance of other vibration modes, which are described further.
This agrees with UV-vis data. The vibration at 197 cm−1, according to recent calculations, corresponds to the motion of vanadium atoms along the c axis of the VO2 crystal (stretching motion of V–V dimers) [47].
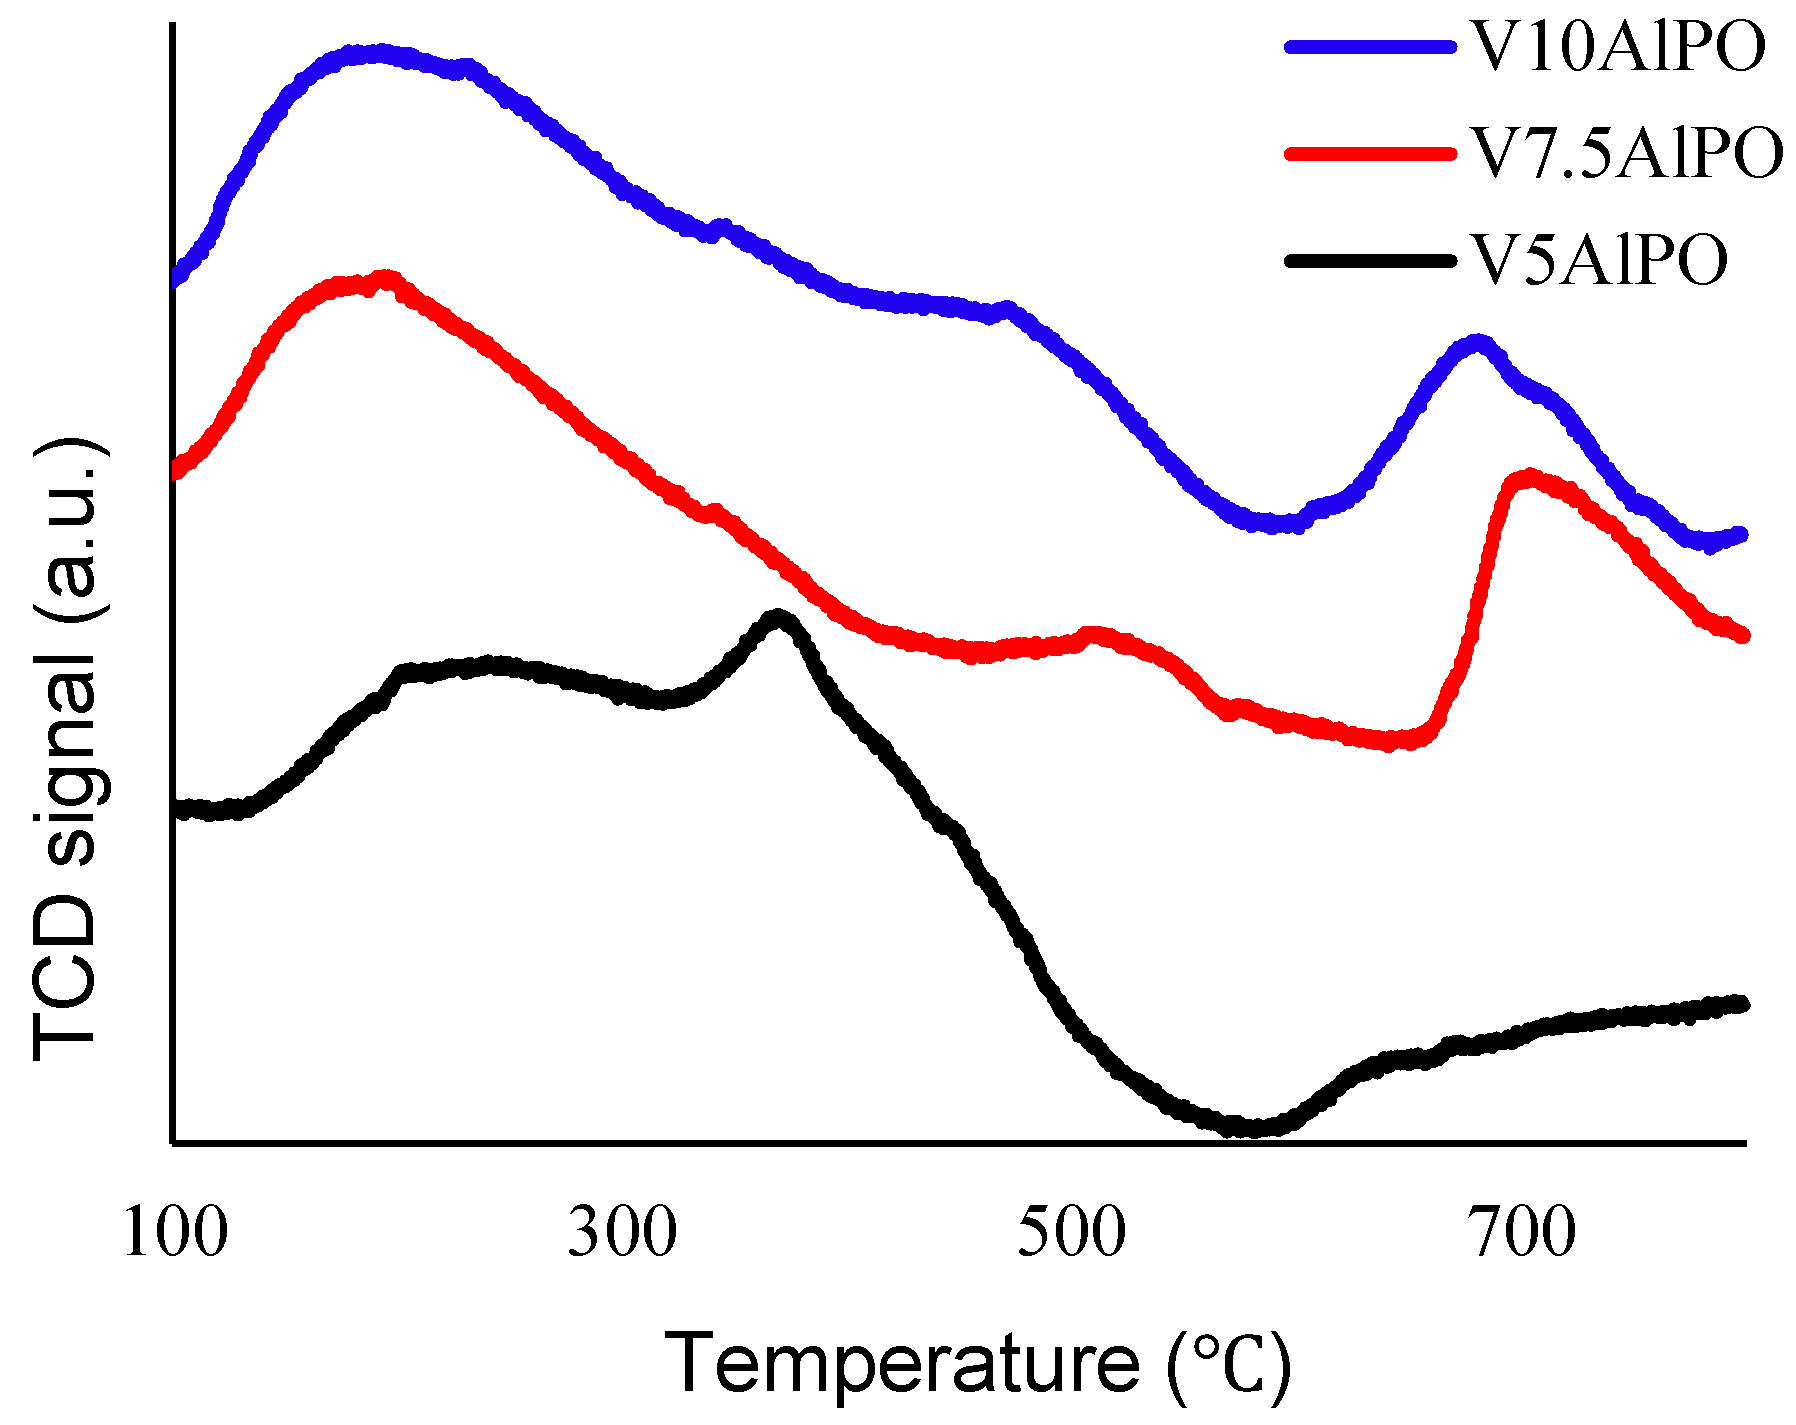
To determine the density and strength of the acid sites of the VAPO samples, NH3-TPD analysis was performed. The quantitative data is presented in Table 3, while the NH3 desorption profiles are depicted in Figure 6.
Temperature Programmed Desorption (TPD) profiles showed three distinct regions: One between 200–250 °C that correspond to weak acid sites from surface hydroxyl groups, one with peaks between 350–450 °C and correspond possibly to Brønsted acid sites of moderate acidity, while the one from 500–700 °C corresponds to strong acid sites. The sample containing the highest content of V possess also the highest number of acid sites (see Table 3). This behavior is in agreement with other reports, [50], that found also an increase of the acidity strength with vanadium loading.
2.2. Catalytic Activity
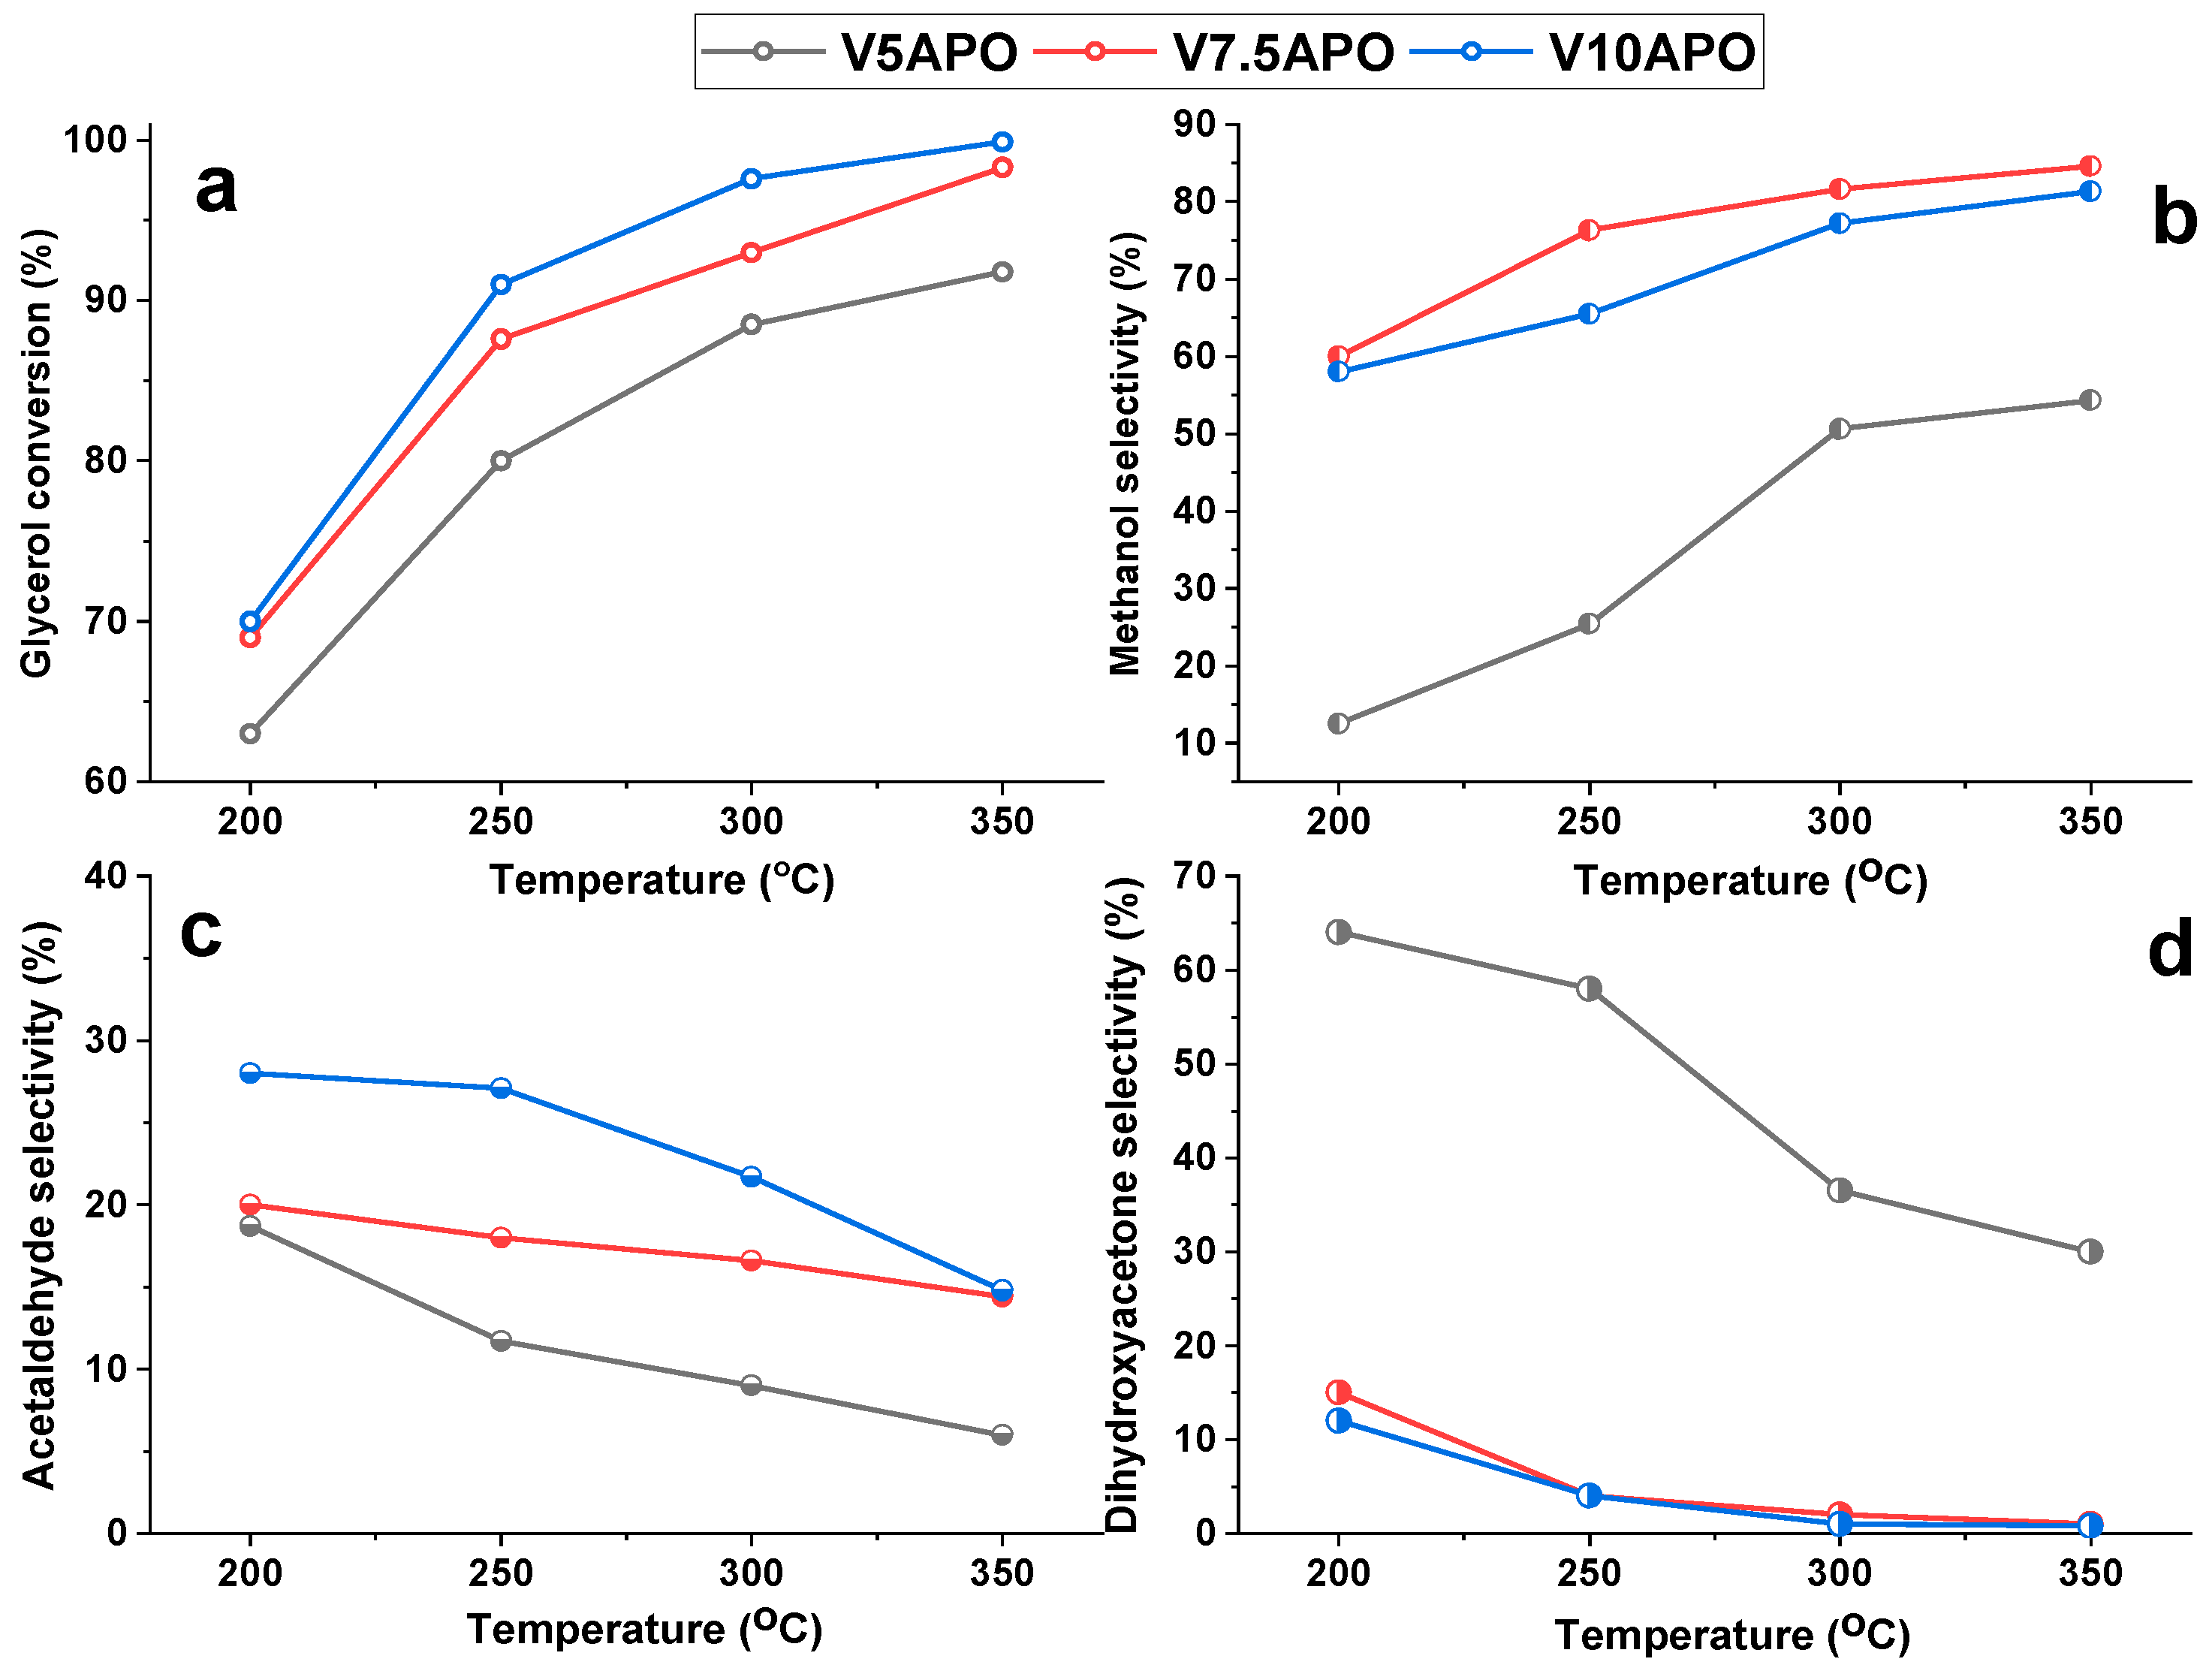
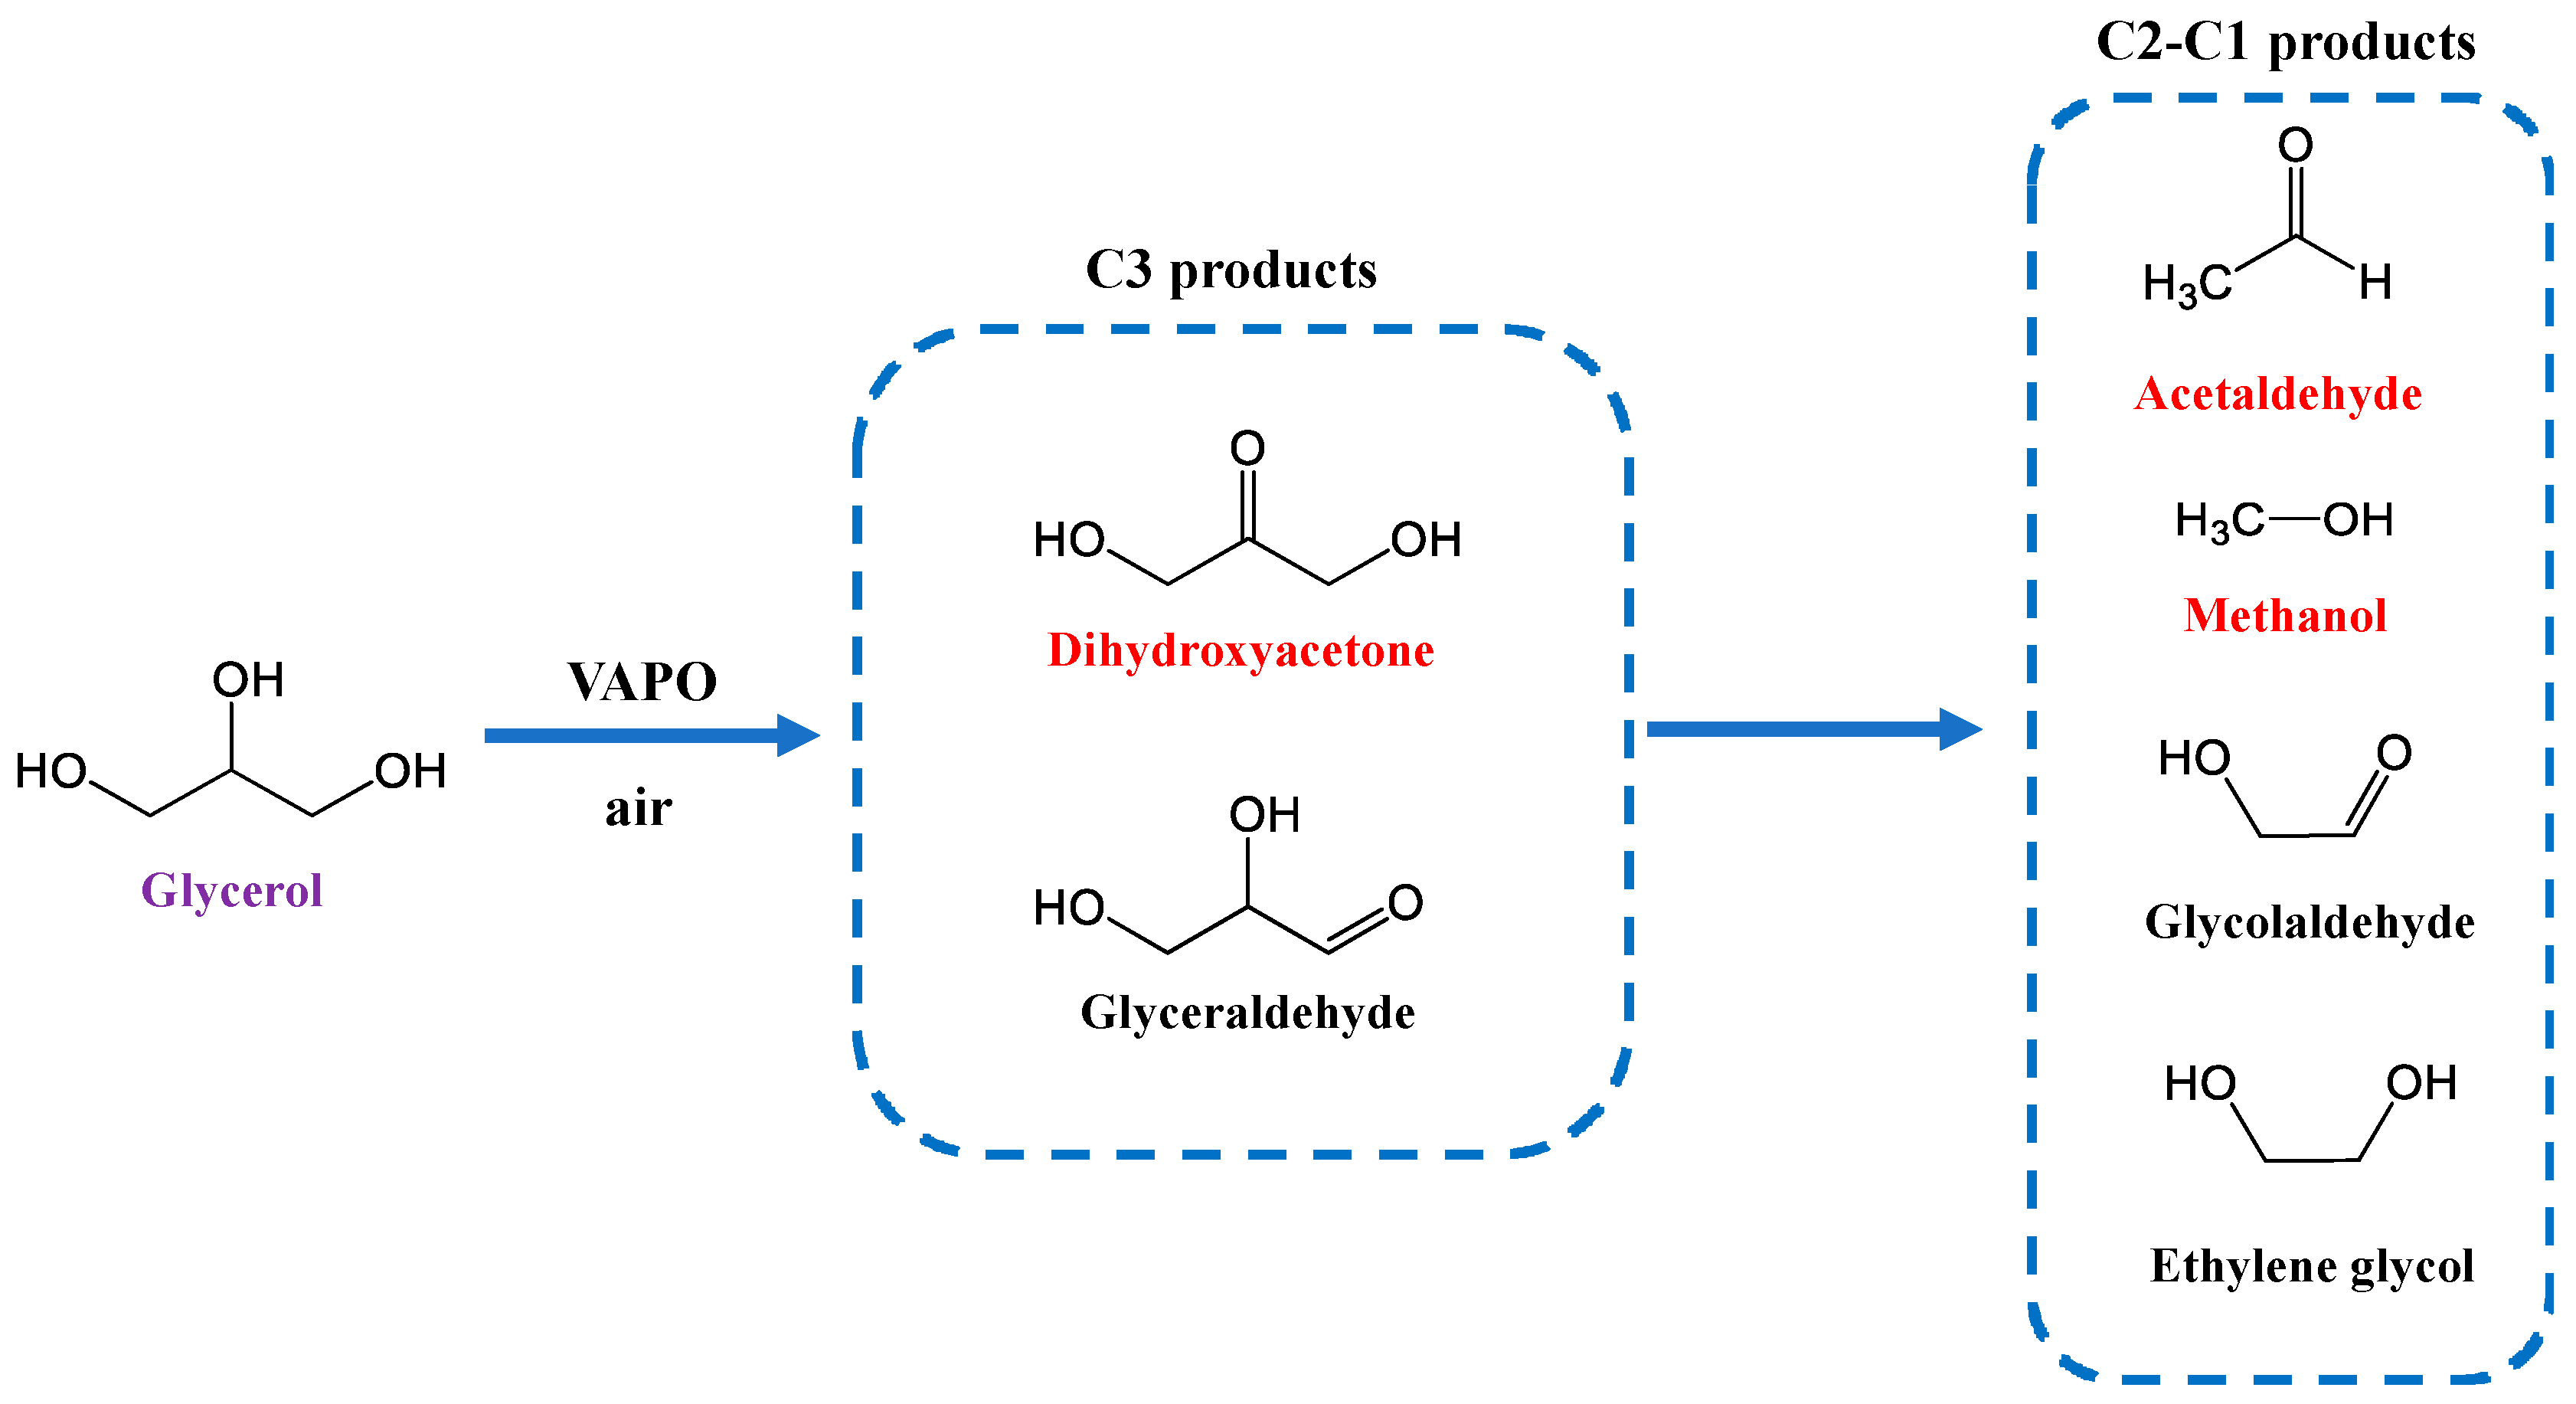
The catalytic performance of VAPO catalysts in the glycerol transformation was examined, and the glycerol conversion and the products distribution as function of reaction temperature, in the temperature range 200–350 °C, are presented in Figure 7. The major products were methanol, acetaldehyde and dihydroxyacetone. Glyceraldehyde, glycol aldehyde and ethylene glycol have been found as minor products; however, their selectivity does not exceed 5%. These liquid products covered 98% of the total mass of product mixture. The reaction products obtained on VAPO catalysts indicate two possible ways for glycerol transformation on VAPO catalysts: through oxidation and through dehydration followed by hydrogenolysis.
Scheme 2 depicts the reaction products and a simplified reaction pathway for glycerol transformation on VAPO catalysts.
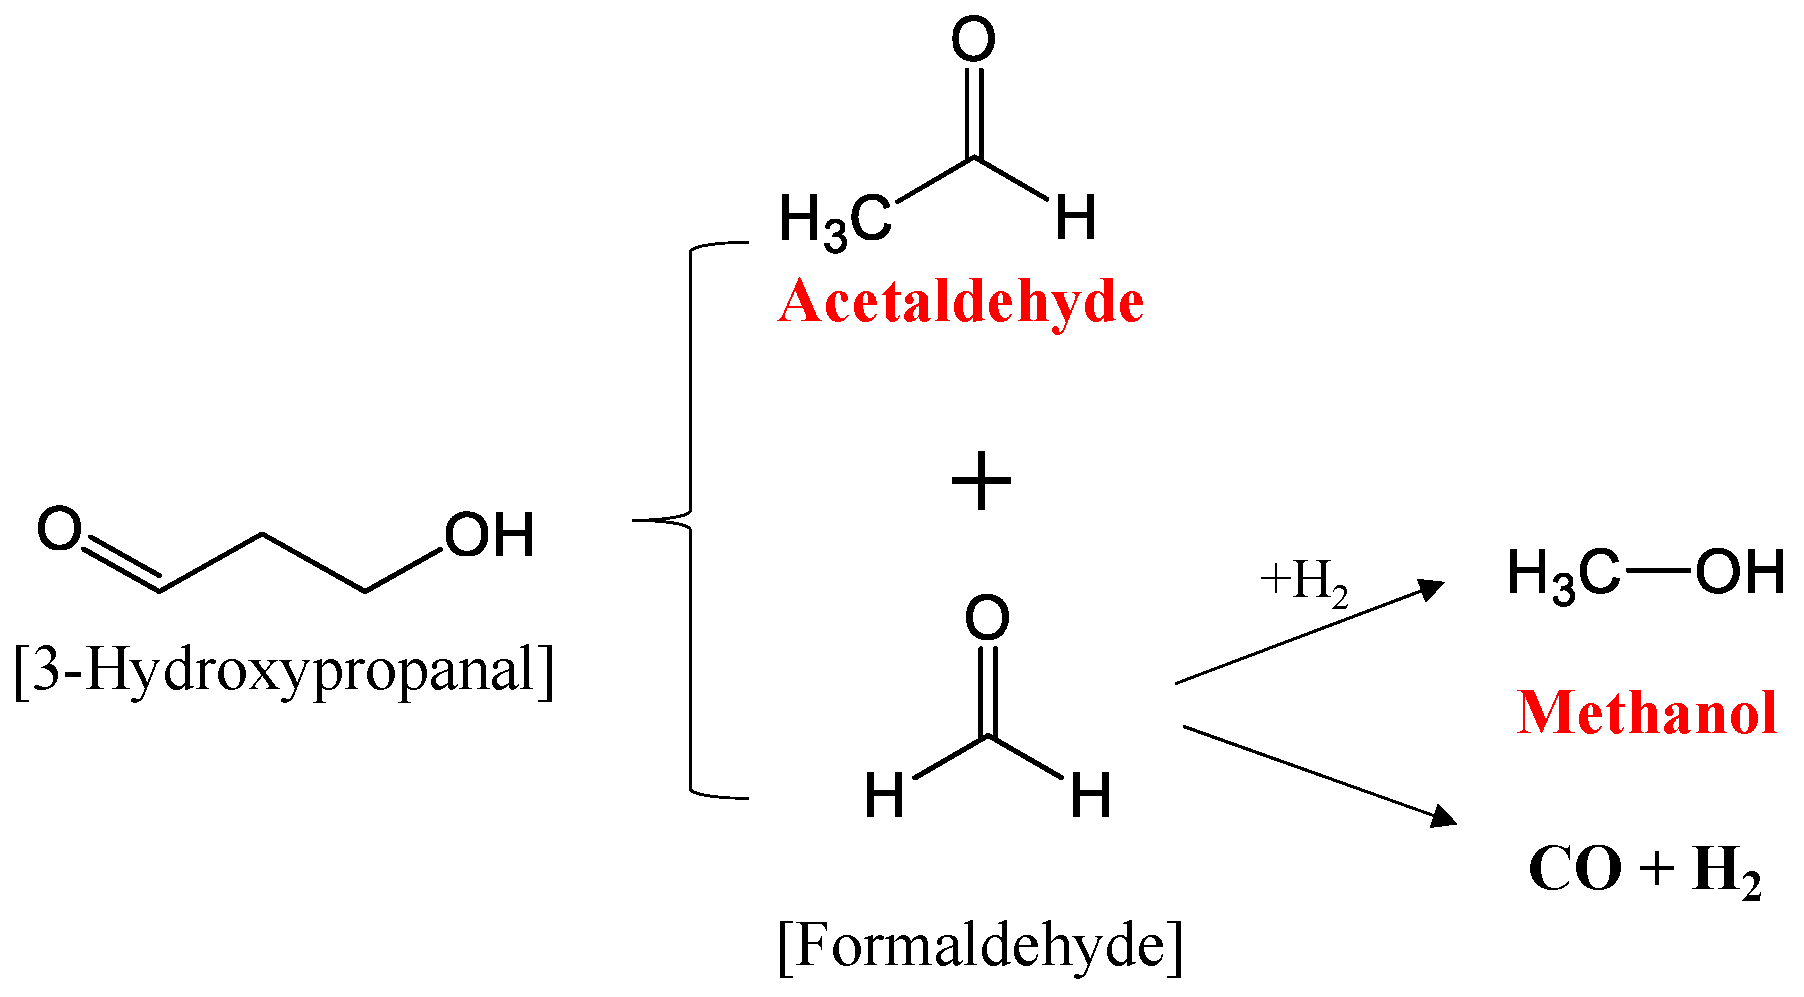
Dihydroxyacetone is produced by oxidation of the secondary OH group from glycerol [51], while the oxidation of the primary OH group led to the formation of very small amounts of glyceraldehyde [52]. In agreement with literature data [53], acetaldehyde can be produced from 3-hydroxypropanal formed by dehydration of glycerol, although 3-hydroxypropanal was not confirmed in our reaction conditions due, most probably, to a very fast reaction rate. Along with acetaldehyde, formaldehyde is usually produced [54] (see Scheme 3), but this was not identified in our case. This is possible by a retro aldol condensation as demonstrated by Suprun et al. on SAPO catalysts starting [55].
Another possible route for the formation of acetaldehyde is from hydroxyacetone, as evidenced also on SAPO catalysts [55], even this compound was not evidenced among the reaction products. To prove this, a reaction using hydroxyacetone as reactant was performed on V7.5APO catalyst. The reaction products were acetic acid, propionic acid, 3-methylfuran, methylglyoxal and pyruvic acid (see Figure 8). Moreover, the hydroxyacetone transformation was not complete when using our best catalytic system and reaction conditions indicating that indeed hydroxyacetone is not formed on VAPO catalysts.
The presence of methanol among the reaction products is unexpected, since its formation requires carbon–carbon bond scission and a source of hydrogen. According to literature data [27], the water present in the stream can act as a source of H2 to perform the hydrogenolysis. However, we cannot exclude the formation of formaldehyde (see Scheme 3) which also acts as an excellent hydrogen donor in liquid phase [56]. Moreover, it was proposed that by a follow up hydrogenation of formaldehyde would result in formation of methanol [54].
Glycerol conversion increased with the increase in temperature of reaction, as expected, from 200 to 350 °C, and the amount of V incorporated in AlPO played an important role in the activity of the catalyst, thus, V10APO showed the best glycerol conversion followed by V7.5APO and V5APO, respectively.
The methanol selectivity increased with reaction temperature and the best values were observed for V7.5APO sample. A key role is played by the V oxidation state on the product distribution and V7.5APO is the sample containing the highest amount of V4+ among all samples, according to XPS, and seems to be the most reactive in methanol formation. A similar behavior was observed for VOPO4 species deposited on graphene oxide, which presented a higher amount of reducible V4+ species, with enhanced reactivity toward hydroxylation of benzene to phenol [57]. An important difference was observed for V5APO compared with both, V7.5APO and V10APO in terms of methanol selectivity (10% vs. 60%). The presence of V3+ in both, V7.5APO and V10APO, probably plays an important role along with V4+ in the formation of methanol, which is missing from V5APO as stated by XPS.
The selectivity to acetaldehyde has the opposite trend to methanol formation and at higher temperatures the selectivity to acetaldehyde is compromised by an increased production of methanol. The catalyst with 10% V shows the highest selectivity to acetaldehyde, which decreased with increasing of the temperature. On the sample with the lowest V loading, V5APO, the principal reaction product is dihydroxyacetone, indicating that for this catalyst the oxidation path is more important. A selectivity of 64% of dihydroxyacetone was observed for V5APO sample at a relatively low temperature (200 °C), that drops to 30% at a temperature of 350 °C, while for the other catalysts the selectivity is four times lower.
The catalyst with higher content of tetrahedral isolated vanadium species, such V5AlPO, is less active in breaking the C–C bonds in the glycerol molecule than the one containing polymeric species. On this catalyst, in particular, the oxidation of the most reactive alcohol group, namely, secondary hydroxyl group of glycerol occurs, leading to formation of dihydroxyacetone, especially at low temperature. This is in accordance with the results obtained by Sebastian et al. [37] in the catalytic conversion of glucose in inferior polyols, indicating that the polymeric vanadium species are more active than monomeric species.
The glycerol conversion is almost complete for V7.5APO and V10APO and the increase of conversion is in line with the increase of the V4+ species and with the increase in acidity strength. The results are similar with those obtained by Lopez [30] over binary Al-V phosphate where the conversion was practically 100%, but the difference consists in products selectivity, their main product being acrolein. Nevertheless, the surface properties of the catalyst predominantly dictate the reaction selectivity, for example, Brønsted acidic surface sites typically favor dehydration routes to form hydroxyacetone and acrolein [58,59].
The influence of glycerol concentration on the glycerol conversion and the products distribution are shown in Figure 9a–c. A slightly decrease in the conversion, with the increase of the glycerol concentration in water from 10% to 20%, was noted for all catalysts. In the same time, the selectivity to methanol decreases with increasing glycerol concentration, with the highest values observed again over the V7.5APO catalyst. Conversely, the acetaldehyde production increase with glycerol concentration. In this moment we do not have experimental details to give a plausible explanation. However, this result is in line with data from the literature that also revealed that higher glycerol concentrations in the feed resulted in a significant increase in the quantity of side products [27].
The production of dihydroxyacetone, at 350 °C, was evidenced only on the V5APO catalyst, while for the other two catalysts its selectivity was below 1%, while the selectivity to acetaldehyde increased with glycerol concentration and reached a maximum value over V10APO catalyst at a glycerol concentration of 20%. This catalyst provides the highest amount of V5+ species on the surface and the highest degree of polymerization according with Raman data.
The effect of water on the glycerol conversion and methanol selectivity over V7.5APO is depicted in Figure 9d. Two concentrations of glycerol (10% and 20%, respectively) with two different flow rates (1.8 mL h−1 and 3.6 mL h−1), with a constant ratio of O2 to glycerol of 1.33 are employed. The glycerol conversion remained almost unchanged while the selectivity towards methanol was slightly higher when the water concentration was increased. This underlines the role of water for methanol production and opens new directions for glycerol transformation towards methanol.
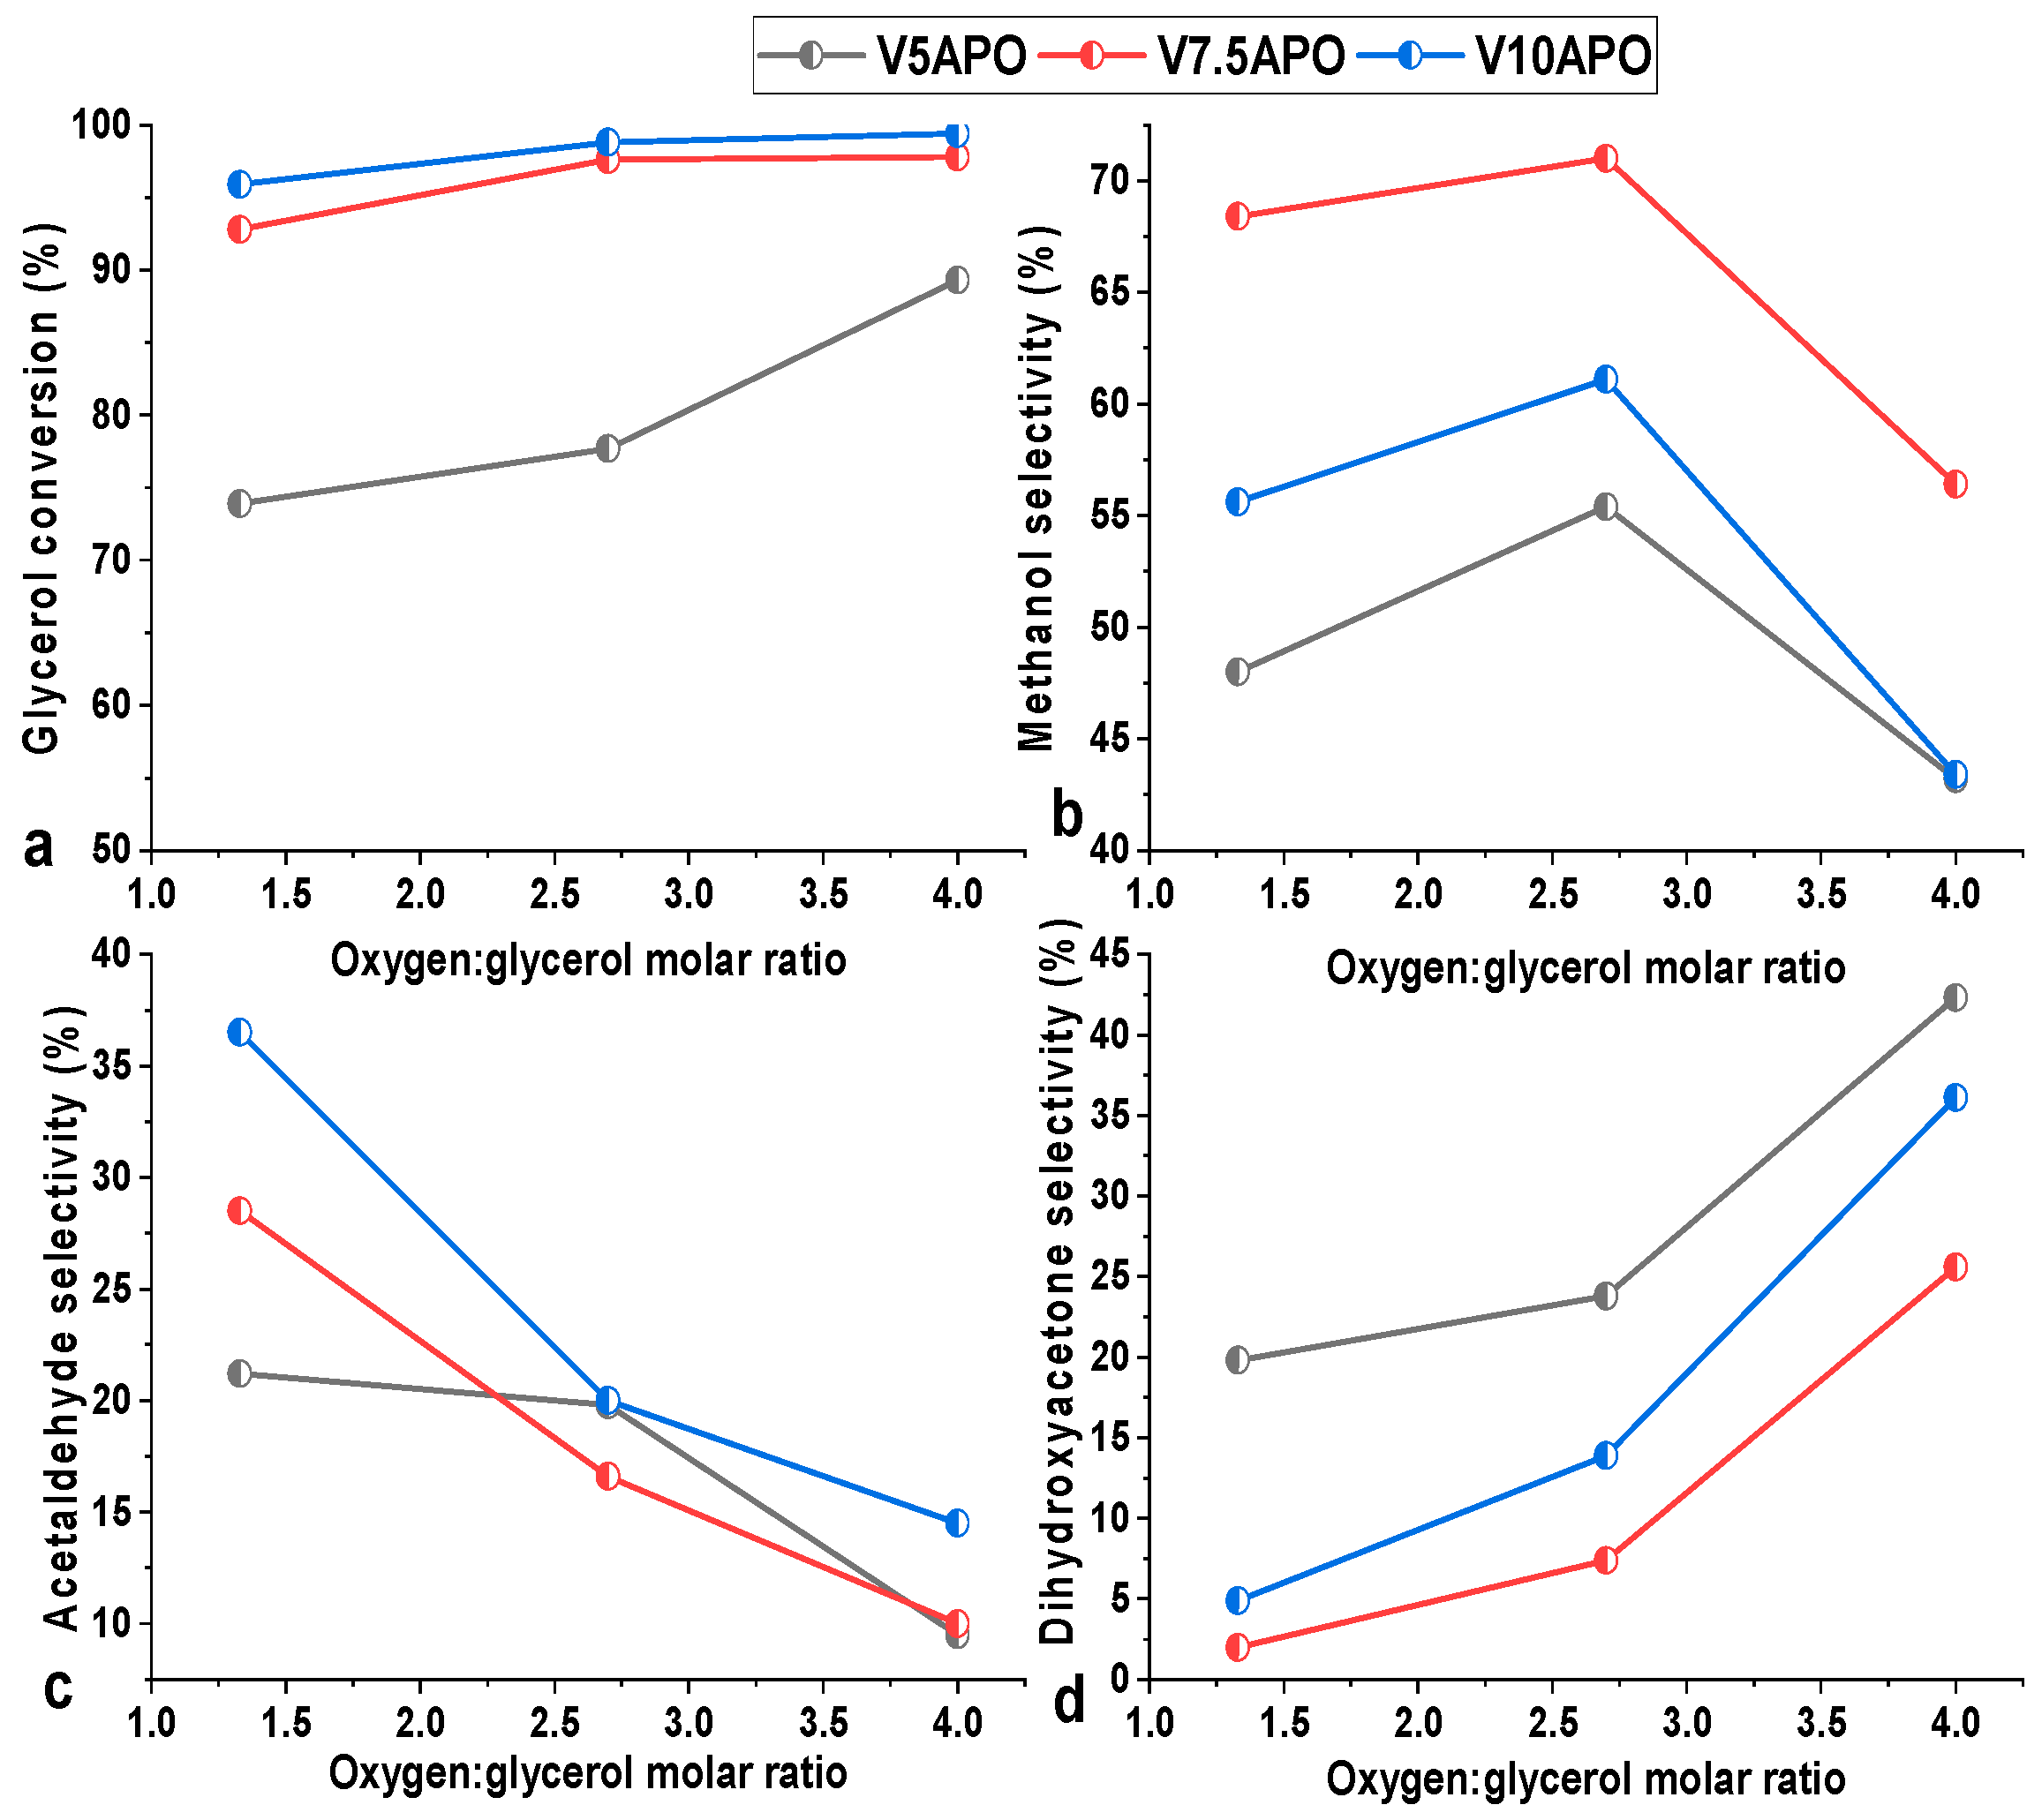
To check the contribution of selective oxidation, different O2 to glycerol ratio were studied. The influence of oxygen to glycerol ratio, at 20% glycerol concentration and 350 °C, over conversion and selectivity is depicted in Figure 10. The glycerol conversion was increasing with O2 to glycerol ratio for all studied samples, V7.5APO and V10APO presenting the highest and similar conversions. This agrees with other studies [60,61], which revealed the importance of O2 to increase the conversion. The total conversion was reached when O2 to glycerol ratio was four. Conversely, increasing the O2 to glycerol ratio determined a decrease in the selectivity to dehydration products. Therefore, the selectivity to acetaldehyde was diminishing with the increase of O2 to glycerol ratio, while the selectivity to methanol followed a volcano curve, irrespective to the V loading, with a maximum selectivity of 70% for V7.5APO and O2 to glycerol ratio of 2.7. Further increase of O2 to glycerol ratio is detrimental to methanol production, while the formation of dihydroxyacetone increased. This indicates that for O2 to glycerol ratio higher than 2.7 the contribution of selective oxidation was in a larger extent as compared with dehydration/hydrogenolysis reaction.
Summarizing, Table 4 gathers the catalytic data obtained on VAPO catalysts and other catalytic data from literature. It can be observed that our results are comparable in terms of conversion and present higher selectivity to methanol, even the one reported in the study performed in the presence of H2 [62]. For a better evaluation of the productivity of V7.5APO catalyst in methanol production, space-time yield (STY) was calculated and it was found to be 10-fold higher compared with the literature data (see Table 4). Moreover, turn-over frequency (TOF) of V7.5APO catalytic system is triple compared with the values from the literature, for the cases when TOF was calculated using the total number of moles of glycerol transformed per mole of catalyst per hour or either considering the total amount of catalytic acid sites as determined from NH3-TPD analysis. It is clear that extended studies on VAPO are necessary to better understand the methanol formation from glycerol solution in the presence of oxygen.
3. Materials and Methods
3.1. Synthesis
Aluminophosphates modified with vanadium were prepared by sol–gel method followed by the combustion of the obtained gel, using Al(NO3)3·9H2O as aluminum source, citric acid, H3PO4 and NH4VO3 as vanadium source, with the following gel composition: 1Al2O3:1-xP2O5:xV2O5: 0.5 citric acid (x = 0.05; 0.075; 0.1). Aqueous solutions of aluminum nitrate and ammonium vanadate were mixed; and then a solution of citric acid was added with stirring as a complexation agent. Finally, phosphoric acid was added dropwise with stirring. The solution was then heated under stirring at ≈80 °C for slow evaporation of water. The resulting gel was heated at 200 °C under air for 24 h in order to realize the gel combustion. Finally, all the prepared materials were calcined in flowing air in two steps: Firstly, at 400 °C for 2 h and then at 600 °C for 2 h. The catalytic materials were denoted as a function of the vanadium content, as following: V5APO, V7.5APO and V10APO.
3.2. Materials Characterization
The X-ray diffraction measurements were performed using a Bruker-AXS D8 Advance diffractometer (Bruker Corporation, Billerica, MA, USA) equipped with a LynxEye 1D detector and Cu-Kα (0.1541 nm) radiation source and a scintillation counter detector. The diffraction patterns were recorded over a 2θ range of 5–70° with a 0.01° step size and using a counting time of 1 s per point. For the identification of the XRD phases present in the samples, the PDF from the International Centre for Diffraction Data (PDF-ICDD) was used. Scherer–Debye formula was employed for the crystallite size evaluation.
N2 adsorption-desorption at liquid N2 temperature (77 K) isotherms were recorded on a Micromeritics ASAP 2020 analyzer (Micromeritics Instrument Corporation, Norcross, GA, USA). Specific surface area was calculated using Brunauer–Emmett–Teller (BET) formalism [65]. In order to efficiently remove the surface adsorbed residues, a degassing step at 150 °C for 4 h was employed.
The UV–vis–NIR spectra were obtained using a UV3600 UV–vis spectrophotometer (Shimadzu Corporation, Kyoto, Japan) with Shimadzu ISR-3100 integrating sphere attachment having an angle of incident light 0–8°, wavelength range of 200–2600 nm and two light sources: D2 (deuterium) lamp for the ultraviolet range and WI (halogen) lamp for the visible and near-infrared range.
FTIR spectra were collected with a Perkin Elmer Spectrum Two spectrometer (PerkinElmer, Waltham, MA, USA), in the range of 400–4000 cm−1, 20 scans with a resolution of 4 cm−1.
XPS measurements were performed on Kratos Ultra DLD Setup (Kratos Analytical Ltd., Manchester, UK) using Al Kα radiation (1486.74 eV) produced by a monochromatized X-ray source operating on a total power of 300 W (15 kV × 15 mA), on a routine base pressure of 1 × 10⁻⁷ Pa. The parameters were optimized in order to obtain the C 1s peak of the adventitious carbon contamination of the sample at 284.60 ± 0.05 eV.
Raman spectra were collected in the range between 50 and 2500 cm−1 on a LabRAM HR Evolution spectrometer (Horiba Jobin Yvon, Kyoto, Japan) equipped with an air-cooled CCD and a He-Ne laser (633 nm). The Raman spectra were recorded at room temperature in the extended scan mode with an acquisition time of five times 50 s and a delay time of 10 s.
NH3-TPD analysis, to determine the nature and strength of the acidity, was performed on a Porotec (Porotec, Frankfurt, Germany) apparatus equipped with a TCD detector and a programmable temperature furnace. Typical procedure is the following: the sample (~0.1 g) was treated for 1 h in helium (20 mL min−1) at 200 °C in order to clean the catalyst surface. Next, a gaseous mixture containing 10% NH3 in He (20 mL min−1) has been passed for 10 min at 100 °C and purged with He (20 mL min−1) for 2 h. The temperature was upraised to 800 °C with 10 °C min−1 under He (20 mL min−1), and the desorbed ammonia has been analyzed with a TCD detector.
3.3. Catalytic Reactions
The glycerol oxidation was carried out in a vertical fixed bed reactor with an internal diameter of 9 mm, and a temperature range of 250–350 °C. A solution of 10%, 15% and 20% glycerol in water was fed into reactor with a pump at a feed flow rate of 3.6 mL h−1 and the catalyst mass was 0.2 g. Air flow rate was 1200 mL h−1. Reaction products in both liquid and gas phase were collected after half hour of reaction and were analyzed by a GC equipped with FID detector and confirmed by NMR (see Section 3.4.). The carbon oxides analysis was not performed. Before changing any reaction parameter, the catalyst was reactivated in air for one hour.
Glycerol conversion and product selectivities were calculated by equations:
Several blank tests were also performed in order to demonstrate the absence of any homogeneous reactions in our reaction conditions.
3.4. Product Analysis
Glycerol. 1H-NMR (500 MHz, DMSO-d6): δ = 3.344–3.386 (dd, 2H, CH2, J = 12.25 Hz), 3.444–3.477 (dd, 2H, CH2, J = 12.25 Hz), 3.569–3.613 (m, 1H), 4.2 (m, 3H, OH) ppm. 13C-NMR (125 MHz, DMSO-d6): δ = 62.468; 72.045 ppm.
Dihydroxyacetone. 1H-NMR (500 MHz, DMSO-d6): δ = 4.15–4.16 (d, 2H, CH, J = 5 Hz), 5.022 (t, 2H, OH, J = 5 Hz) ppm. 13C-NMR (125 MHz, DMSO-d6): δ = 66.71; 214.03 ppm.
Acetaldehyde. 1H-NMR (500 MHz, DMSO-d6): δ = 2.125–2.131 (d, 3H, CH3, J = 3 Hz), 9.646–9.663 (q, 1H, CHO, J = 3 Hz) ppm. 13C-NMR (125 MHz, DMSO-d6): δ = 31.06; 199.70 ppm.
Methanol. 1H-NMR (500 MHz, DMSO-d6): δ = 3.16 (s, 3H, CH3,), 4.01 (s, 1H, OH,) ppm. 13C-NMR (125 MHz, DMSO-d6): δ = 48.85 ppm.
Glyceraldehyde. 1H-NMR (500 MHz, DMSO-d6): δ = 3.545–3.642 (m, 2H, CH2, J = 12.25 Hz), 3.719–3.773 (dd, 1H, CH, J = 14.5 Hz) 4.402 (s, 2H, OH), 9.621–9.624 (d, 1H, CHO, J = 1.5 Hz) ppm. 13C -NMR (125 MHz, DMSO-d6): δ = 63.85; 76.05; 91.52 ppm.
Glycolaldehyde. 1H-NMR (500 MHz, DMSO-d6): δ = 4.09–4.12 (d, 2H, CH2, J = 5 Hz), 5.294 (t, 1H, OH, J = 5 Hz), 9.619 (s, 1H, CHO) ppm. 13C-NMR (125 MHz, DMSO-d6): δ = 66.33; 91.56 ppm.
Ethylene glycol. 1H-NMR (500 MHz, DMSO-d6): δ = 3.340 (s, 4H, CH2), 4.96 (s, 2H, OH,) ppm. 13C-NMR (125 MHz, DMSO-d6): δ = 62.76 ppm.
4. Conclusions
The incorporation of vanadium (V4+/V5+) in the framework of aluminum phosphate materials has been achieved through sol-gel combustion method. This study showed that VAlPOs with different V loading are capable of converting glycerol towards methanol in one-step synthesis without H2. This was possible, most probably, due to water present in the system. The vanadium loading, the oxidation state and the degree of polymerization are important for the product distribution and the sample with an optimum of 7.5% loading of vanadium possesses the highest selectivity to methanol. Higher O2 to glycerol ratio promotes the formation of dihydroxyacetone, indicating that the reaction selectivity can be oriented as a function of the reaction conditions.
Author Contributions
Conceptualization, G.M. and M.F.; catalytic tests, G.M.; characterization, G.M., M.F., F.N. Ș.N. and M.M.T.; writing—original draft preparation, G.M., M.F. and F.N.; writing—review and editing, G.M., F.N., Ș.N., M.M.T and M.F. All authors have read and agreed to the published version of the manuscript.
Funding
This work was also supported by a grant of the Romanian National Authority for Scientific Research and Innovation, CCCDI–UEFISCDI, project number 111/2019, ERANET-M.-CATALEAST-1 and PNIII-P1.1-TE-2016–2116, within PNCDI III. Support from the Romanian Ministry of Research and Innovation through the Core Program 2019–2022 (contract 21N/2019) is also gratefully acknowledged.
Conflicts of Interest
The authors declare no conflict of interest.
References
- Gross, M.S.; Sánchez, B.S.; Querini, C.A. Glycerol oxidation in liquid phase: Highly stable Pt catalysts supported on ion exchange resins. Appl. Catal. A Gen. 2015, 501, 1–9. [Google Scholar] [CrossRef]
- Villa, A.; Dimitratos, N.; Chan-Thaw, C.E.; Hammond, C.; Prati, L.; Hutchings, G.J. Glycerol Oxidation Using Gold-Containing Catalysts. Acc. Chem. Res. 2015, 48, 1403–1412. [Google Scholar] [CrossRef] [PubMed]
- Katryniok, B.; Kimura, H.; Skrzynska, E.; Girardon, J.S.; Fongarland, P.; Capron, M.; Ducoulombier, R.; Mimura, N.; Paul, S.; Dumeignil, F. Selective catalytic oxidation of glycerol: Perspectives for high value chemicals. Green Chem. 2011, 13, 1960–1979. [Google Scholar] [CrossRef]
- Tinoco, M.; Fernandez-Garcia, S.; Villa, A.; Gonzalez, J.M.; Blanco, G.; Hungria, A.B.; Jiang, L.; Prati, L.; Calvino, J.J.; Chen, X.W. Selective oxidation of glycerol on morphology controlled ceria nanomaterials. Catal. Sci. Technol. 2019, 9, 2328–2334. [Google Scholar] [CrossRef]
- Aroua, M.K.; Cognet, P. Editorial: From Glycerol to Value-Added Products. Front. Chem. 2020, 8, 69. [Google Scholar] [CrossRef]
- Farnetti, E.; Crotti, C. Selective oxidation of glycerol to formic acid catalyzed by iron salts. Catal. Commun. 2016, 84, 1–4. [Google Scholar] [CrossRef]
- Estevez, R.; Lopez-Pedrajas, S.; Blanco-Bonilla, F.; Luna, D.; Bautista, F.M. Production of acrolein from glycerol in liquid phase on heterogeneous catalysts. Chem. Eng. J. 2015, 282, 179–186. [Google Scholar] [CrossRef]
- Witsuthammakul, A.; Sooknoi, T. Direct conversion of glycerol to acrylic acid via integrated dehydration-oxidation bed system. Appl. Catal. A-Gen. 2012, 413, 109–116. [Google Scholar] [CrossRef]
- Kim, M.; Lee, H. Highly Selective Production of Acrylic Acid from Glycerol via Two Steps Using Au/CeO2 Catalysts. Acs Sustain. Chem. Eng. 2017, 5, 11371–11376. [Google Scholar] [CrossRef]
- Lee, C.S.; Aroua, M.K.; Daud, W.A.W.; Cognet, P.; Peres, Y.; Ajeel, M.A. Selective Electrochemical Conversion of Glycerol to Glycolic Acid and Lactic Acid on a Mixed Carbon-Black Activated Carbon Electrode in a Single Compartment Electrochemical Cell. Front. Chem. 2019, 7, 110. [Google Scholar]
- Zhang, X.Q.; Zhou, D.; Wang, X.J.; Zhou, J.; Li, J.F.; Zhang, M.K.; Shen, Y.H.; Chu, H.B.; Qu, Y.Q. Overcoming the Deactivation of Pt/CNT by Introducing CeO2 for Selective Base-Free Glycerol-to-Glyceric Acid Oxidation. Acs Catal. 2020, 10, 3832–3837. [Google Scholar] [CrossRef]
- Liu, C.; Hirohara, M.; Maekawa, T.; Chang, R.; Hayashi, T.; Chiang, C.Y. Selective electro-oxidation of glycerol to dihydroxyacetone by a non-precious electrocatalyst - CuO. Appl. Catal. B-Environ. 2020, 265, 12. [Google Scholar] [CrossRef]
- Diguilio, E.; Galarza, E.D.; Domine, M.E.; Pierella, L.B.; Renzini, M.S. Tuning product selectivity in the catalytic oxidation of glycerol by employing metal-ZSM-11 materials. New J. Chem. 2020, 44, 4363–4375. [Google Scholar] [CrossRef]
- Sullivan, J.A.; Burnham, S. The use of alkaline earth oxides as pH modifiers for selective glycerol oxidation over supported Au catalysts. Renew. Energy 2015, 78, 89–92. [Google Scholar] [CrossRef] [Green Version]
- Kawanami, H.; Himeda, Y.; Laurenczy, G. Formic Acid as a Hydrogen Carrier for Fuel Cells Toward a Sustainable Energy System. Adv. Inorg. Chem. Inorg. React. Mech. 2017, 70, 395–427. [Google Scholar]
- Elliott, J.E.; Macdonald, M.; Nie, J.; Bowman, C.N. Structure and swelling of poly(acrylic acid) hydrogels: Effect of pH, ionic strength, and dilution on the crosslinked polymer structure. Polymer 2004, 45, 1503–1510. [Google Scholar] [CrossRef]
- Pagliaro, M.; Ciriminna, R.; Kimura, H.; Rossi, M.; della Pina, C. From glycerol to value-added products. Angew. Chem. Int. Ed. 2007, 46, 4434–4440. [Google Scholar] [CrossRef]
- Gholami, Z.; Abdullah, A.Z.; Lee, K.T. Dealing with the surplus of glycerol production from biodiesel industry through catalytic upgrading to polyglycerols and other value-added products. Renew. Sustain. Energy Rev. 2014, 39, 327–341. [Google Scholar] [CrossRef]
- Wang, F.; Dubois, J.-L.; Ueda, W. Catalytic dehydration of glycerol over vanadium phosphate oxides in the presence of molecular oxygen. J. Catal. 2009, 268, 260–267. [Google Scholar] [CrossRef]
- Ning, X.; Li, Y.; Yu, H.; Peng, F.; Wang, H.; Yang, Y. Promoting role of bismuth and antimony on Pt catalysts for the selective oxidation of glycerol to dihydroxyacetone. J. Catal. 2016, 335, 95–104. [Google Scholar] [CrossRef]
- Hamid, S.B.A.; Basiron, N.; Yehye, W.A.; Sudarsanam, P.; Bhargava, S.K. Nanoscale Pd-based catalysts for selective oxidation of glycerol with molecular oxygen: Structure–activity correlations. Polyhedron 2016, 120, 124–133. [Google Scholar] [CrossRef]
- Wu, G.; Wang, X.; Huang, Y.a.; Liu, X.; Zhang, F.; Ding, K.; Yang, X. Selective oxidation of glycerol with O2 catalyzed by low-cost CuNiAl hydrotalcites. J. Mol. Catal. A Chem. 2013, 379, 185–191. [Google Scholar] [CrossRef]
- Omata, K.; Matsumoto, K.; Murayama, T.; Ueda, W. Direct oxidative transformation of glycerol to acrylic acid over Nb-based complex metal oxide catalysts. Catal. Today 2016, 259, 205–212. [Google Scholar] [CrossRef]
- Yang, L.H.; Li, X.W.; Chen, P.; Hou, Z.Y. Selective oxidation of glycerol in a base-free aqueous solution: A short review. Chin. J. Catal. 2019, 40, 1020–1034. [Google Scholar] [CrossRef]
- Purushothaman, R.K.P.; van Haveren, J.; van Es, D.S.; Melian-Cabrera, I.; Meeldijk, J.D.; Heeres, H.J. An efficient one pot conversion of glycerol to lactic acid using bimetallic gold-platinum catalysts on a nanocrystalline CeO2 support. Appl. Catal. B-Environ. 2014, 147, 92–100. [Google Scholar] [CrossRef] [Green Version]
- Wu, C.-T.; Yu, K.M.K.; Liao, F.; Young, N.; Nellist, P.; Dent, A.; Kroner, A.; Tsang, S.C.E. A non-syn-gas catalytic route to methanol production. Nat. Commun. 2012, 3, 1050. [Google Scholar] [CrossRef] [PubMed]
- Haider, M.H.; Dummer, N.F.; Knight, D.W.; Jenkins, R.L.; Howard, M.; Moulijn, J.; Taylor, S.H.; Hutchings, G.J. Efficient green methanol synthesis from glycerol. Nat. Chem. 2015, 7, 1028–1032. [Google Scholar] [CrossRef] [Green Version]
- Paula, A.S.; Possato, L.G.; Ratero, D.R.; Contro, J.; Keinan-Adamsky, K.; Soares, R.R.; Goobes, G.; Martins, L.; Nery, J.G. One-step oxidehydration of glycerol to acrylic acid using ETS-10-like vanadosilicates. Microporous Mesoporous Mater. 2016, 232, 151–160. [Google Scholar] [CrossRef] [Green Version]
- Vishnuvarthan, M.; Paterson, A.J.; Raja, R.; Piovano, A.; Bonino, F.; Gianotti, E.; Berlier, G. Spectroscopic investigation into the nature of the active sites for epoxidation reactions using vanadium-based aluminophosphate catalysts. Microporous Mesoporous Mater. 2011, 138, 167–175. [Google Scholar] [CrossRef]
- Lopez-Pedrajas, S.; Estevez, R.; Navarro, R.; Luna, D.; Bautista, F.M. Catalytic behaviour of mesoporous metal phosphates in the gas-phase glycerol transformation. J. Mol. Catal. A Chem. 2016, 421, 92–101. [Google Scholar] [CrossRef]
- Lopez-Pedrajas, S.; Estevez, R.; Schnee, J.; Gaigneaux, E.M.; Luna, D.; Bautista, F.M. Study of the gas-phase glycerol oxidehydration on systems based on transition metals (Co, Fe, V) and aluminium phosphate. Mol. Catal. 2018, 455, 68–77. [Google Scholar] [CrossRef]
- Lopez-Pedrajas, S.; Estevez, R.; Blanco-Bonilla, F.; Luna, D.; Bautista, F.M. Insight into the gas-phase glycerol dehydration on transition metal modified aluminium phosphates and zeolites. J. Chem. Technol. Biotechnol. 2017, 92, 2661–2672. [Google Scholar] [CrossRef]
- Xu, J.; Chen, L.; Zeng, D.; Yang, J.; Zhang, M.; Ye, C.; Deng, F. Crystallization of AlPO4-5 Aluminophosphate Molecular Sieve Prepared in Fluoride Medium: A Multinuclear Solid-State NMR Study. J. Phys. Chem. B 2007, 111, 7105–7113. [Google Scholar] [CrossRef] [PubMed]
- Rair, D.; Rochdi, A.; Majjane, A.; Jermoumi, T.; Chahine, A.; Touhami, M.E. Synthesis and study by FTIR, 31P NMR and electrochemical impedance spectroscopy of vanadium zinc phosphate glasses prepared by sol–gel route. J. Non-Cryst. Solids 2016, 432, 459–465. [Google Scholar] [CrossRef]
- Dzwigaj, S.; el Malki, E.M.; Peltre, M.-J.; Massiani, P.; Davidson, A.; Che, M. Effect of calcination/rehydration treatments on the environment of V in β zeolite. Top. Catal. 2000, 11, 379. [Google Scholar] [CrossRef]
- Subrahmanyam, C.; Louis, B.; Viswanathan, B.; Renken, A.; Varadarajan, T.K. Synthesis, characterisation and catalytic properties of vanadium substituted mesoporous aluminophosphates. Appl. Catal. A Gen. 2005, 282, 67–71. [Google Scholar] [CrossRef] [Green Version]
- Sebastian, J.; Zheng, M.; Li, X.; Pang, J.; Wang, C.; Zhang, T. Catalytic conversion of glucose to small polyols over a binary catalyst of vanadium modified beta zeolite and Ru/C. J. Energy Chem. 2019, 34, 88–95. [Google Scholar] [CrossRef] [Green Version]
- Blanco-Bonilla, F.; Lopez-Pedrajas, S.; Luna, D.; Marinas, J.M.; Bautista, F.M. Vanadium oxides supported on amorphous aluminum phosphate: Structural and chemical characterization and catalytic performance in the 2-propanol reaction. J. Mol. Catal. A Chem. 2016, 416, 105–116. [Google Scholar] [CrossRef]
- Silversmit, G.; Depla, D.; Poelman, H.; Marin, G.B.; de Gryse, R. Determination of the V2p XPS binding energies for different vanadium oxidation states (V5+ to V0+). J. Electron Spectrosc. Relat. Phenom. 2004, 135, 167–175. [Google Scholar] [CrossRef]
- Florea, M.; Silvy, R.P.; Grange, P. Vanadium aluminium oxynitride catalysts for propane ammoxidation reaction: Effect of the V/Al ratio on the structure and catalytic behaviour. Appl. Catal. A Gen. 2005, 286, 1–10. [Google Scholar] [CrossRef]
- Xie, Q.; Li, Y.; Lv, Z.; Zhou, H.; Yang, X.; Chen, J.; Guo, H. Effective Adsorption and Removal of Phosphate from Aqueous Solutions and Eutrophic Water by Fe-based MOFs of MIL-101. Sci. Rep. 2017, 7, 3316. [Google Scholar] [CrossRef] [PubMed]
- Wang, B.; Liu, J.; Sun, Q.; Li, R.; Sham, T.-K.; Sun, X. Atomic layer deposition of lithium phosphates as solid-state electrolytes for all-solid-state microbatteries. Nanotechnology 2014, 25, 504007. [Google Scholar] [CrossRef]
- Neaţu, Ş.; Neaţu, F.; Diculescu, V.C.; Trandafir, M.M.; Petrea, N.; Somacescu, S.; Krumeich, F.; Wennmacher, J.T.C.; Knorpp, A.J.; van Bokhoven, J.A.; et al. Undoped SnO2 as a Support for Ni Species to Boost Oxygen Generation through Alkaline Water Electrolysis. ACS Appl. Mater. Interfaces 2020, 12, 18407–18420. [Google Scholar] [CrossRef] [PubMed]
- Appapillai, A.T.; Mansour, A.N.; Cho, J.; Shao-Horn, Y. Microstructure of LiCoO2 with and without “AlPO4” Nanoparticle Coating: Combined STEM and XPS Studies. Chem. Mater. 2007, 19, 5748–5757. [Google Scholar] [CrossRef]
- Florea, M.; Marin, R.S.; Pălăşanu, F.M.; Neaţu, F.; Pârvulescu, V.I. Mesostructured vanadia–alumina catalysts for the synthesis of vitamin K3. Catal. Today 2015, 254, 29–35. [Google Scholar] [CrossRef]
- Yu, J.; Li, M.; Liu, Z.; Feng, Z.; Xin, Q.; Li, C. Comparative Study of the Vanadium Species in VAPO-5 and VAPSO-5 Molecular Sieves. J. Phys. Chem. B 2002, 106, 8937–8943. [Google Scholar] [CrossRef]
- Shvets, P.; Dikaya, O.; Maksimova, K.; Goikhman, A. A review of Raman spectroscopy of vanadium oxides. J. Raman Spectrosc. 2019, 50, 1226–1244. [Google Scholar] [CrossRef]
- Kumar, R.T.R.; Karunagaran, B.; Venkatachalam, S.; Mangalaraj, D.; Narayandass, S.K.; Kesavamoorthy, R. Influence of deposition temperature on the growth of vacuum evaporated V2O5 thin films. Mater. Lett. 2003, 57, 3820–3825. [Google Scholar] [CrossRef]
- Su, Q.; Pan, X.; Xie, E.; Wang, Y.; Qiu, J.; Liu, X. Influence of temperature on the microstructure of V2O5 film prepared by DC magnetron sputtering. Rare Met. 2006, 25, 82–87. [Google Scholar] [CrossRef]
- Zhao, X.T.; Yan, Y.Y.; Mao, L.; Fu, M.C.; Zhao, H.R.; Sun, L.S.; Xiao, Y.H.; Dong, G.J. A relationship between the V4+/V5+ ratio and the surface dispersion, surface acidity, and redox performance of V2O5-WO3/TiO2 SCR catalysts. Rsc Adv. 2018, 8, 31081–31093. [Google Scholar] [CrossRef] [Green Version]
- Hirasawa, S.; Watanabe, H.; Kizuka, T.; Nakagawa, Y.; Tomishige, K. Performance, structure and mechanism of Pd-Ag alloy catalyst for selective oxidation of glycerol to dihydroxyacetone. J. Catal. 2013, 300, 205–216. [Google Scholar] [CrossRef]
- Mimura, N.; Hiyoshi, N.; Date, M.; Fujitani, T.; Dumeignil, F. Microscope Analysis of Au-Pd/TiO2 Glycerol Oxidation Catalysts Prepared by Deposition-Precipitation Method. Catal. Lett. 2014, 144, 2167–2175. [Google Scholar] [CrossRef]
- Tsukuda, E.; Sato, S.; Takahashi, R.; Sodesawa, T. Production of acrolein from glycerol over silica-supported heteropoly acids. Catal. Commun. 2007, 8, 1349–1353. [Google Scholar] [CrossRef]
- Chai, S.H.; Wang, H.P.; Liang, Y.; Xu, B.Q. Sustainable production of acrolein: Investigation of solid acid-base catalysts for gas-phase dehydration of glycerol. Green Chem. 2007, 9, 1130–1136. [Google Scholar] [CrossRef]
- Suprun, W.; Lutecki, M.; Haber, T.; Papp, H. Acidic catalysts for the dehydration of glycerol: Activity and deactivation. J. Mol. Catal. A-Chem. 2009, 309, 71–78. [Google Scholar] [CrossRef]
- Heim, L.E.; Konnerth, H.; Prechtl, M.H.G. Future perspectives for formaldehyde: Pathways for reductive synthesis and energy storage. Green Chem. 2017, 19, 2347–2355. [Google Scholar] [CrossRef] [Green Version]
- Borah, P.; Datta, A.; Nguyen, K.T.; Zhao, Y.L. VOPO4 center dot 2H(2)O encapsulated in graphene oxide as a heterogeneous catalyst for selective hydroxylation of benzene to phenol. Green Chem. 2016, 18, 397–401. [Google Scholar] [CrossRef]
- Haider, M.H.; Dummer, N.F.; Zhang, D.; Miedziak, P.; Davies, T.E.; Taylor, S.H.; Willock, D.J.; Knight, D.W.; Chadwick, D.; Hutchings, G.J. Rubidium- and caesium-doped silicotungstic acid catalysts supported on alumina for the catalytic dehydration of glycerol to acrolein. J. Catal. 2012, 286, 206–213. [Google Scholar] [CrossRef]
- Haider, M.H.; D’Agostino, C.; Dummer, N.F.; Mantle, M.D.; Gladden, L.F.; Knight, D.W.; Willock, D.J.; Morgan, D.J.; Taylor, S.H.; Hutchings, G.J. The Effect of Grafting Zirconia and Ceria onto Alumina as a Support for Silicotungstic Acid for the Catalytic Dehydration of Glycerol to Acrolein. Chem. A Eur. J. 2014, 20, 1743–1752. [Google Scholar] [CrossRef]
- Chieregato, A.; Soriano, M.D.; Basile, F.; Liosi, G.; Zamora, S.; Concepción, P.; Cavani, F.; Nieto, J.M.L. One-pot glycerol oxidehydration to acrylic acid on multifunctional catalysts: Focus on the influence of the reaction parameters in respect to the catalytic performance. Appl. Catal. B Environ. 2014, 150–151, 37–46. [Google Scholar] [CrossRef]
- Wang, F.; Xu, J.; Dubois, J.-L.; Ueda, W. Catalytic Oxidative Dehydration of Glycerol over a Catalyst with Iron Oxide Domains Embedded in an Iron Orthovanadate Phase. ChemSusChem 2010, 3, 1383–1389. [Google Scholar] [CrossRef] [PubMed]
- van Ryneveld, E.; Mahomed, A.S.; van Heerden, P.S.; Green, M.J.; Friedrich, H.B. A catalytic route to lower alcohols from glycerol using Ni-supported catalysts. Green Chem. 2011, 13, 1819–1827. [Google Scholar] [CrossRef]
- Carr, A.G.; Shi, X.; Domene, C.; Leung, A.K.; Green, W.H. Methanol formation from the treatment of glycerol in supercritical water and with ethylsulfide. J. Supercrit. Fluids 2016, 117, 80–88. [Google Scholar] [CrossRef]
- Possato, L.G.; Acevedo, M.D.; Padró, C.L.; Briois, V.; Passos, A.R.; Pulcinelli, S.H.; Santilli, C.V.; Martins, L. Activation of Mo and V oxides supported on ZSM-5 zeolite catalysts followed by in situ XAS and XRD and their uses in oxydehydration of glycerol. Mol. Catal. 2020, 481, 110158. [Google Scholar] [CrossRef] [Green Version]
- Brunauer, S.; Emmett, P.H.; Teller, E. Adsorption of Gases in Multimolecular Layers. J. Am. Chem. Soc. 1938, 60, 309–319. [Google Scholar] [CrossRef]
Scheme 1.
Parallel and series reaction network in glycerol transformation.

Figure 1.
XRD patterns of (a) VxAPO and (b) zoom in of the region at lower intensity of the three samples to emphasize the presence of AlV6PO19.
Figure 1.
XRD patterns of (a) VxAPO and (b) zoom in of the region at lower intensity of the three samples to emphasize the presence of AlV6PO19.


Figure 2.
FTIR spectra of vanadium–aluminum phosphates.

Figure 3.
UV-visible diffuse reflectance spectra of vanadium–aluminum phosphates in the 200–800 nm range.
Figure 3.
UV-visible diffuse reflectance spectra of vanadium–aluminum phosphates in the 200–800 nm range.

Figure 4.
High resolution XP spectra of O 1s, V 2p, Al 2p and P 2p regions for VAPO catalysts.


Figure 5.
Raman spectra of VAPO samples treated at (a) 200 and (b) 600 °C.

Figure 6.
NH3-TPD profiles for VAlPO catalysts.

Figure 7.
The influence of the reaction temperature on glycerol conversion (a), methanol (b), acetaldehyde (c) and dihydroxyacetone (d) selectivity; (0.2 g catalyst, air flow 1200 mL h−1, feed flow rate 3.6 mL h−1, 10% glycerol in water and O2: Glycerol ratio = 1.33).
Figure 7.
The influence of the reaction temperature on glycerol conversion (a), methanol (b), acetaldehyde (c) and dihydroxyacetone (d) selectivity; (0.2 g catalyst, air flow 1200 mL h−1, feed flow rate 3.6 mL h−1, 10% glycerol in water and O2: Glycerol ratio = 1.33).

Scheme 2.
Simplified reaction pathways for glycerol transformation on VAPO catalysts. Major reaction products are noted in red color.
Scheme 2.
Simplified reaction pathways for glycerol transformation on VAPO catalysts. Major reaction products are noted in red color.

Scheme 3.
3-Hydroxypropanal transformation to acetaldehyde and formaldehyde.

Figure 8.
Hydroxyacetone conversion over V7.5APO catalyst; 0.2 g catalyst, air flow 1200 mL h-1 and hydroxyacetone concentration 2.4 mg L−1.
Figure 8.
Hydroxyacetone conversion over V7.5APO catalyst; 0.2 g catalyst, air flow 1200 mL h-1 and hydroxyacetone concentration 2.4 mg L−1.

Figure 9.
Glycerol conversion, and the selectivity of methanol, acetaldehyde and dihydroxyacetone as function of glycerol concentration in water (temperature 350 °C, 0.2 g catalyst, air flow 1200 mL h−1 and feed flow rate 3.6 mL h−1); (a) V5APO, (b) V7.5APO, (c) V10APO and (d) V7.5APO water influence (O2 to glycerol = 1.33).

Figure 10.
The influence of oxygen to glycerol molar ratio on the glycerol conversion (a) and methanol (b), acetaldehyde (c) and dihydroxyacetone (d) selectivity; (0.2 g catalyst, 350 °C, 20% glycerol in water, total flow 1200 mL h−1, feed flow rate 3.6 mL h−1 and O2:N2:glycerol 1.33:5.24:1; 2.7:3.39:1; 4:2:1).


Table 1.
Brunauer–Emmett–Teller (BET) specific surface area and crystallite size together with lattice parameters (calculated from XRD data) for VAPO catalysts.
Table 1.
Brunauer–Emmett–Teller (BET) specific surface area and crystallite size together with lattice parameters (calculated from XRD data) for VAPO catalysts.
| Catalyst | BET (m2 g−1) | Crystallite Size (nm) | Lattice Parameter | ||
|---|---|---|---|---|---|
| a | b | c | |||
| V5APO | 0.04 | 35.1 | 9.6930 | 8.7359 | 18.8351 |
| V7.5APO | 2.12 | 36.6 | 9.6930 | 8.7359 | 18.8351 |
| V10APO | 0.45 | 37.5 | 9.6930 | 8.7359 | 18.8351 |
| AlPO4 * | - | - | 9.6380 | 8.6640 | 18.2800 |
* from Powder Diffraction File (PDF) card 00-045-0057.
Table 2.
Binding energies and surface composition as revealed by XPS analysis.
| Samples | V 2p | Al 2p | P 2p | ||||||
|---|---|---|---|---|---|---|---|---|---|
| BE (eV) | Atomic Ratio (%) (Vx+/Vtot) | BE (eV) | Atomic Ratio (%) (Vtot/Al) | BE (eV) | Atomic Ratio (%) (Vtot/P) | ||||
| XPS | Calc. | XPS | Calc. | ||||||
| V10AlPO | V3+ | 514.6 | 4.1 | 73.8 | 0.29 | 0.11 | 133.1 | 0.23 | 0.1 |
| V4+ | 516.1 | 60.1 | |||||||
| V5+ | 517.1 | 35.8 | |||||||
| V7.5AlPO | V3+ | 514.6 | 9.2 | 73.8 | 0.13 | 0.17 | 133.2 | 0.15 | 0.15 |
| V4+ | 516.1 | 81.3 | |||||||
| V5+ | 517.7 | 9.5 | |||||||
| V5AlPO | V3+ | - | - | 73.8 | 0.28 | 0.25 | 133.1 | 0.22 | 0.2 |
| V4+ | 516.1 | 71.0 | |||||||
| V5+ | 517.1 | 29.0 | |||||||
Table 3.
Temperature programmed desorption of NH3 for VAPO catalysts.
| NH3 Desorbed (μmol g−1) | ||||
|---|---|---|---|---|
| Catalyst | 200–250 | 350–450 | 500–700 | |
| Tdes range (°C) | ||||
| V5APO | 34.30 | 44.38 | ||
| V7.5APO | 38.18 | 3.53 | 21.8 | |
| V10APO | 62.44 | 19.19 | 18.36 | |
Table 4.
Selected results from the literature data reported for glycerol transformation to methanol.
Table 4.
Selected results from the literature data reported for glycerol transformation to methanol.
| Catalyst (Mass(g)) | O2 Flow (mL h−1) | Carrier gas Flow (mL h−1) | Glycerol in Water (%) | Feed Flow Rate (mL h−1) | P (bar) | T (°C) | Time (h) | C. (%) | S (%) MeOH | TOF (h−1) | STY (g MeOH kg−1 catalyst h−1) | Ref. |
|---|---|---|---|---|---|---|---|---|---|---|---|---|
| V7.5APO(0.2) | 240 | 1200 | 10 | 3.6 | - | 350 | 0.5 | 98.3 | 84.6 | 2.9 379 h | 531 | This study |
| CeO2 (0.5) | - | 6000 a | 10 | 1.0 | - | 340 | 3 | 97.0 | 60.0 | 0.5 | 51 | [27] |
| NiSiO2 (8.5) | - | 5300 b | 60 | 15.0 | 60 | 320 | ns | 99.9 | 68.5 c | 0.9 114 h | 25 | [62] |
| d | - | - | 10 | - | 300 e | 450 | 0.5 | 94.0 f | 45.0 g | - | - | [63] |
| V-ZSM-5 (0.2) | 360 | 1440 a | 10 | 3.0 | - | 320 | 1 | 100 | - | 0.1 42.0 h | 0 | [64] |
a N2; b H2; c selectivity for total alcohols (propanol, ethanol and methanol); d catalytic reaction in supercritical water in the presence of 10% by mole of ethylsulfide (ES), glycerol:ES molar ratio is 1:1; e the high pressure (300 bar) is a consequence of the reaction conditions, where the reactor (24 mL volume) was pressurized with 20 bar of He and heated at 450 °C; f molar conversion; and g selectivity calculated considering the yield of the products, as reported in the article. h calculated considering the total amount of acid sited determined by NH3-TPD; MeOH—methanol; ns—not specified; TOF (turn-over frequency) represents the total number of moles of glycerol transformed per mole of catalyst per hour; and STY (space-time yield) defined as grams of MeOH produced per kilogram of catalyst per hour.
© 2020 by the authors. Licensee MDPI, Basel, Switzerland. This article is an open access article distributed under the terms and conditions of the Creative Commons Attribution (CC BY) license (http://creativecommons.org/licenses/by/4.0/).
Share and Cite
MDPI and ACS Style
Mitran, G.; Neațu, F.; Neațu, Ș.; Trandafir, M.M.; Florea, M. VAlPOs as Efficient Catalysts for Glycerol Conversion to Methanol. Catalysts 2020, 10, 728. https://doi.org/10.3390/catal10070728
AMA Style
Mitran G, Neațu F, Neațu Ș, Trandafir MM, Florea M. VAlPOs as Efficient Catalysts for Glycerol Conversion to Methanol. Catalysts. 2020; 10(7):728. https://doi.org/10.3390/catal10070728
Chicago/Turabian StyleMitran, Gheorghița, Florentina Neațu, Ștefan Neațu, Mihaela M. Trandafir, and Mihaela Florea. 2020. "VAlPOs as Efficient Catalysts for Glycerol Conversion to Methanol" Catalysts 10, no. 7: 728. https://doi.org/10.3390/catal10070728
Note that from the first issue of 2016, this journal uses article numbers instead of page numbers. See further details here.