Article

Advancements on Basic Working Principles of Photo-Driven Oxidative Degradation of Organic Substrates over Pristine and Noble Metal-Modified TiO2. Model Case of Phenol Photo Oxidation

1
“Ilie Murgulescu” Institute of Physical Chemistry of the Romanian Academy, Spl. Independentei 202, 060021 Bucharest, Romania
2
National Institute for Lasers, Plasma and Radiation Physics, Atomistilor Str., No. 409, 077125 Bucharest-Magurele, Romania
3
Valentin Teodorescu, National Institute of Materials Physics, 405A Atomistilor Street, 077125 Bucharest-Magurele, Romania
*
Authors to whom correspondence should be addressed.
Catalysts 2021, 11(4), 487; https://doi.org/10.3390/catal11040487
Submission received: 16 March 2021 / Revised: 7 April 2021 / Accepted: 7 April 2021 / Published: 10 April 2021

Abstract

:
The specific roles played by both support and noble metals in light absorption, charge separation, and the formation of ·OH and O2 (ROS) are analyzed for light-triggered oxidation of phenol (Ph) over pristine and over noble metal (Ag, Au, Pt) -loaded TiO2. Experiments show that the supported noble metals act as a light visible absorber, assist the separation of photo-charges and reduction of O2 to O2. The O2 oxidizes mildly Ph to oxygenated products (hydroquinone, benzoquinone, and 1,2-dihydroxibenzene). In a parallel process, ·OH radicals, yielded by TiO2, mineralize Ph to CO2 by fast reaction sequences. Radical quenching and photo electrochemical measurements (surface photovoltage) confirm independently that the production of ·OH and O2 scale with oxidative conversion of Ph. The selectivity to CO2 and mild oxidation products is the result of the interplay between catalyst activity for ·OH and for O2 production.

1. Introduction

The sun light driven photo oxidation processes of organic matter are of great importance for several practical reasons: (i) imply low material and operational costs, (ii) are potentially able to clean water and air by mineralization of organic pollutants to CO2 [1,2,3,4], and (iii) are attractive alternative routes for selective synthesis of high-added value oxygenated products [5,6,7].
The thermodynamic of organics oxidation is downhill process (ΔG < 0), the light being used to speed up chemical reaction via generation of charge carriers. The general accepted steps in photocatalytic processes are: (i) light absorption by photocatalysts followed by generation of e and h+ charges; (ii) charge transfer to reactant substrate intermediated by reactive oxygen species, ROS; (iii) development of redox processes with participation of e, h+, and ROS on surface and vicinity of photocatalysts. Metals are involved actively in all essential reaction steps, determining the final overall photocatalytic efficiency [8,9].
The prevalent reaction mechanism in liquid phase depends on a series of factors including nature of photocatalyst, reaction media, and reacting organic substrate. The reaction mechanism, described well by the Langmuir–Hinshelwood adsorption equation [10], implies the interaction of photogenerated charges with the adsorbed species, at a time scale of 10−10 to 10−5 s [11]. The photo generated charges (e and h+) react first with hydroxyl groups of adsorbed H2O and O2 to yield reactive ·OH (H2O + h+ → ·OH + H+) and ·O2 (O2 + e → O2) ROS [9]. The oxidative conversion of organic compounds is intermediated by formation and diffusion of ROS to reaction scene [12], which can be remote from the illuminated surface [13].
Metals dispersed on surface of active materials (i) help separation of photo generated charges, (ii) work as cocatalyst by mediating the charge transfer to reacting substrates, (iii) favor the formation of O2, (iv) control the selectivity of oxidation process, (v) bend the energy bands of photocatalysts at solid-liquid interfaces, (vi) modify the light absorbing property of materials, (vii) contribute to enhancement of photocharge production in visible wavelength domain by surface plasmon resonance (SPR) phenomenon [9]. The Schottky regions built at metal-oxide interfaces contribute to electron and hole separation, leading to increased efficiency of photo-driven redox processes. The charge separation efficiency is validated experimentally by the comparing the PL (Photoluminiscence) emission intensity of metal-loaded photocatalysts with pristine oxide [14,15]. The bending of valence band (VB) and conduction band (CB) depends on nature of metal and pH of solution. Metals shift the light absorption edge, in many cases with beneficial effects on efficiency. Noble metals exhibit visible light absorption peaks due SPR phenomenon, which is a collective electron oscillation in metal nanoparticles induced by visible light absorption. The SPR was reported to have in some cases favorable effects on photo-driven redox processes performed in visible light [16,17,18].
In spite of a large number of published researches, essential issues in photocatalysis remain to be elucidated. For example, the specific contribution of metal and support to formation of O2 and ·OH is, in many cases, controversial, although it is of crucial importance. The predominance of one reaction pathway over the other affects the selectivity of photocatalytic oxidation reaction. The reaction of an organic matter with ·OH is unselective, yielding CO2, whereas oxidation pathway with ·O2 on surface of solid or on its premises proceed apparently with high selectivity to oxygenated products.
The general aim of this research is to gain a deeper insight on particularities showed by metal-modified oxide photocatalysts compared to pristine semiconductor oxides in what concerns ROS generation, charge separation, reaction mechanism of organic compounds oxidative conversion. The role of active participants in the oxidative degradation pathways are analyzed in detail. The light-driven (sun or visible light) oxidation of phenol over pristine and metal (Ag, Au, Pt)-modified TiO2 was chosen as model reaction. To uncover the complex reaction network associated to photo-driven oxidation of organic compounds, we analyzed comparatively: (i) the relative efficiency of supported noble metals in separation of photo charges and implicitly the impact on photocatalytic activity, (ii) the specific contribution of metal and of oxide support to ROS (·OH and O2) formation, (iii) the relationship between O2 formation and reaction selectivity to oxygenated products, (iv) the correlation between the activity of catalyst for mineralization of organic substrate to CO2 and the amount of ·OH generated under light irradiation, and (v) the relationship between nature of supported metals and surface photovoltage (SPV) generated under light irradiation in connection with material capacity to generate O2, with obvious implications in reaction mechanism.

2. Results and Discussion

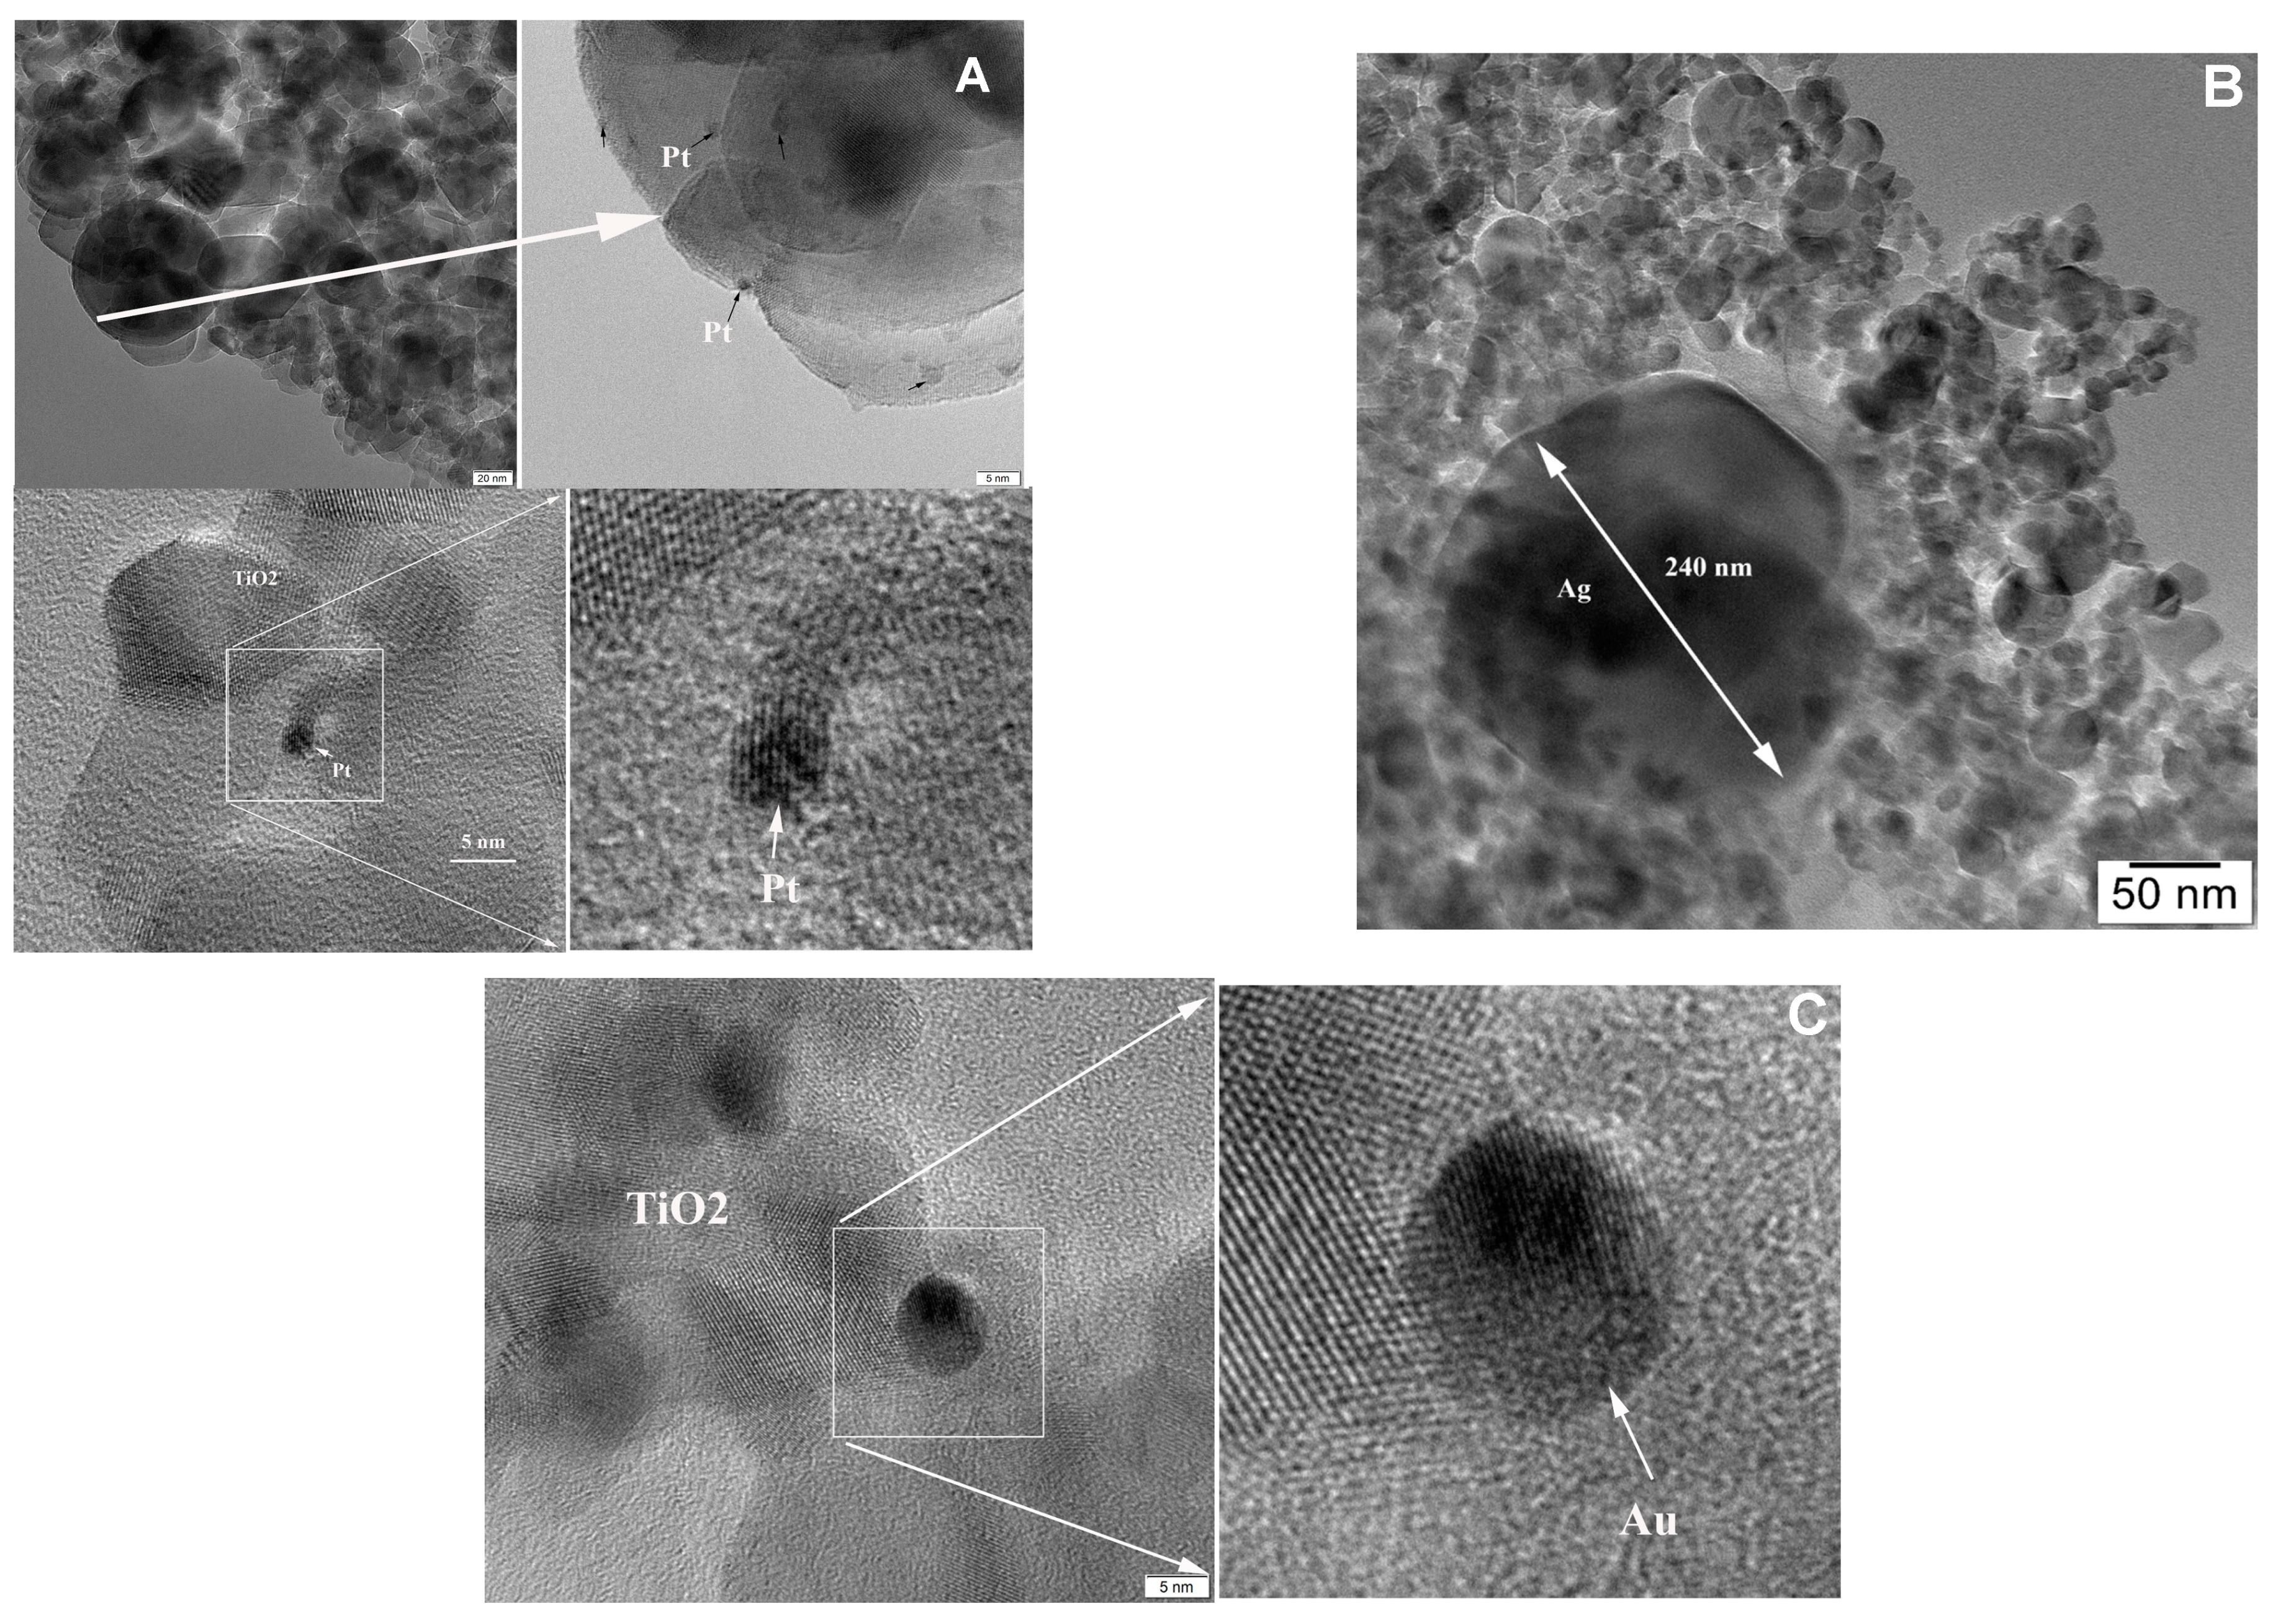
2.1. Characterization Data

The TEM (Transmission Electron Microscopy) analysis of noble metals dispersed on TiO2 prepared by laser pyrolysis shows well dispersed Pt on TiO2 support (Figure 1A). The Ag and Au particles are significantly larger than of Pt (see TEM images in Figure 1B,C). Individual spherical Au nanoparticle of around 5 nm can be observed in Figure 1C.
The most relevant characterization data obtained by various experimental methods are presented comparatively in Table 1. More details are given in Supplementary Information.
The XPS analysis revealed that the supported noble metals on TiO2 were in metallic state (see the XPS data presented in Supplementary Information). Titanium in TiO2 was in the form of Ti4+ whereas the metal-loaded TiO2 contained variable amounts of Ti3+ (see Table 1 and Supplementary Information).
The average size of Pt particles supported on TiO2 estimated from CO chemisorption measurements is ≈1 nm, corresponding to metal dispersion of around 40%. This result is in fair agreement with TEM result evidencing supported Pt nanoparticles of 1–2 nm (see Figure 1A).
The light absorption features of all investigated materials exhibit the characteristic band edge energies of TiO2 at ≈ 400 nm (see Figure 2). The plots of Kubeka–Munk function (F(R)) in Figure 2 describe light absorbance of solid samples. The SPR maxima of Ag and Au nanoparticles are clearly visible at 460 and 544 nm, respectively. Assuming the indirect allowed transitions, the optical band gaps of all investigated materials, obtained by extrapolation of linear part of ([F(R)] hν)1/2 versus hν plots, are around 3.1 eV (see the inset of Figure 2). The close values of optical band gaps, makes difficult to predict the order of photocatalytic activity, based only on light absorption data.

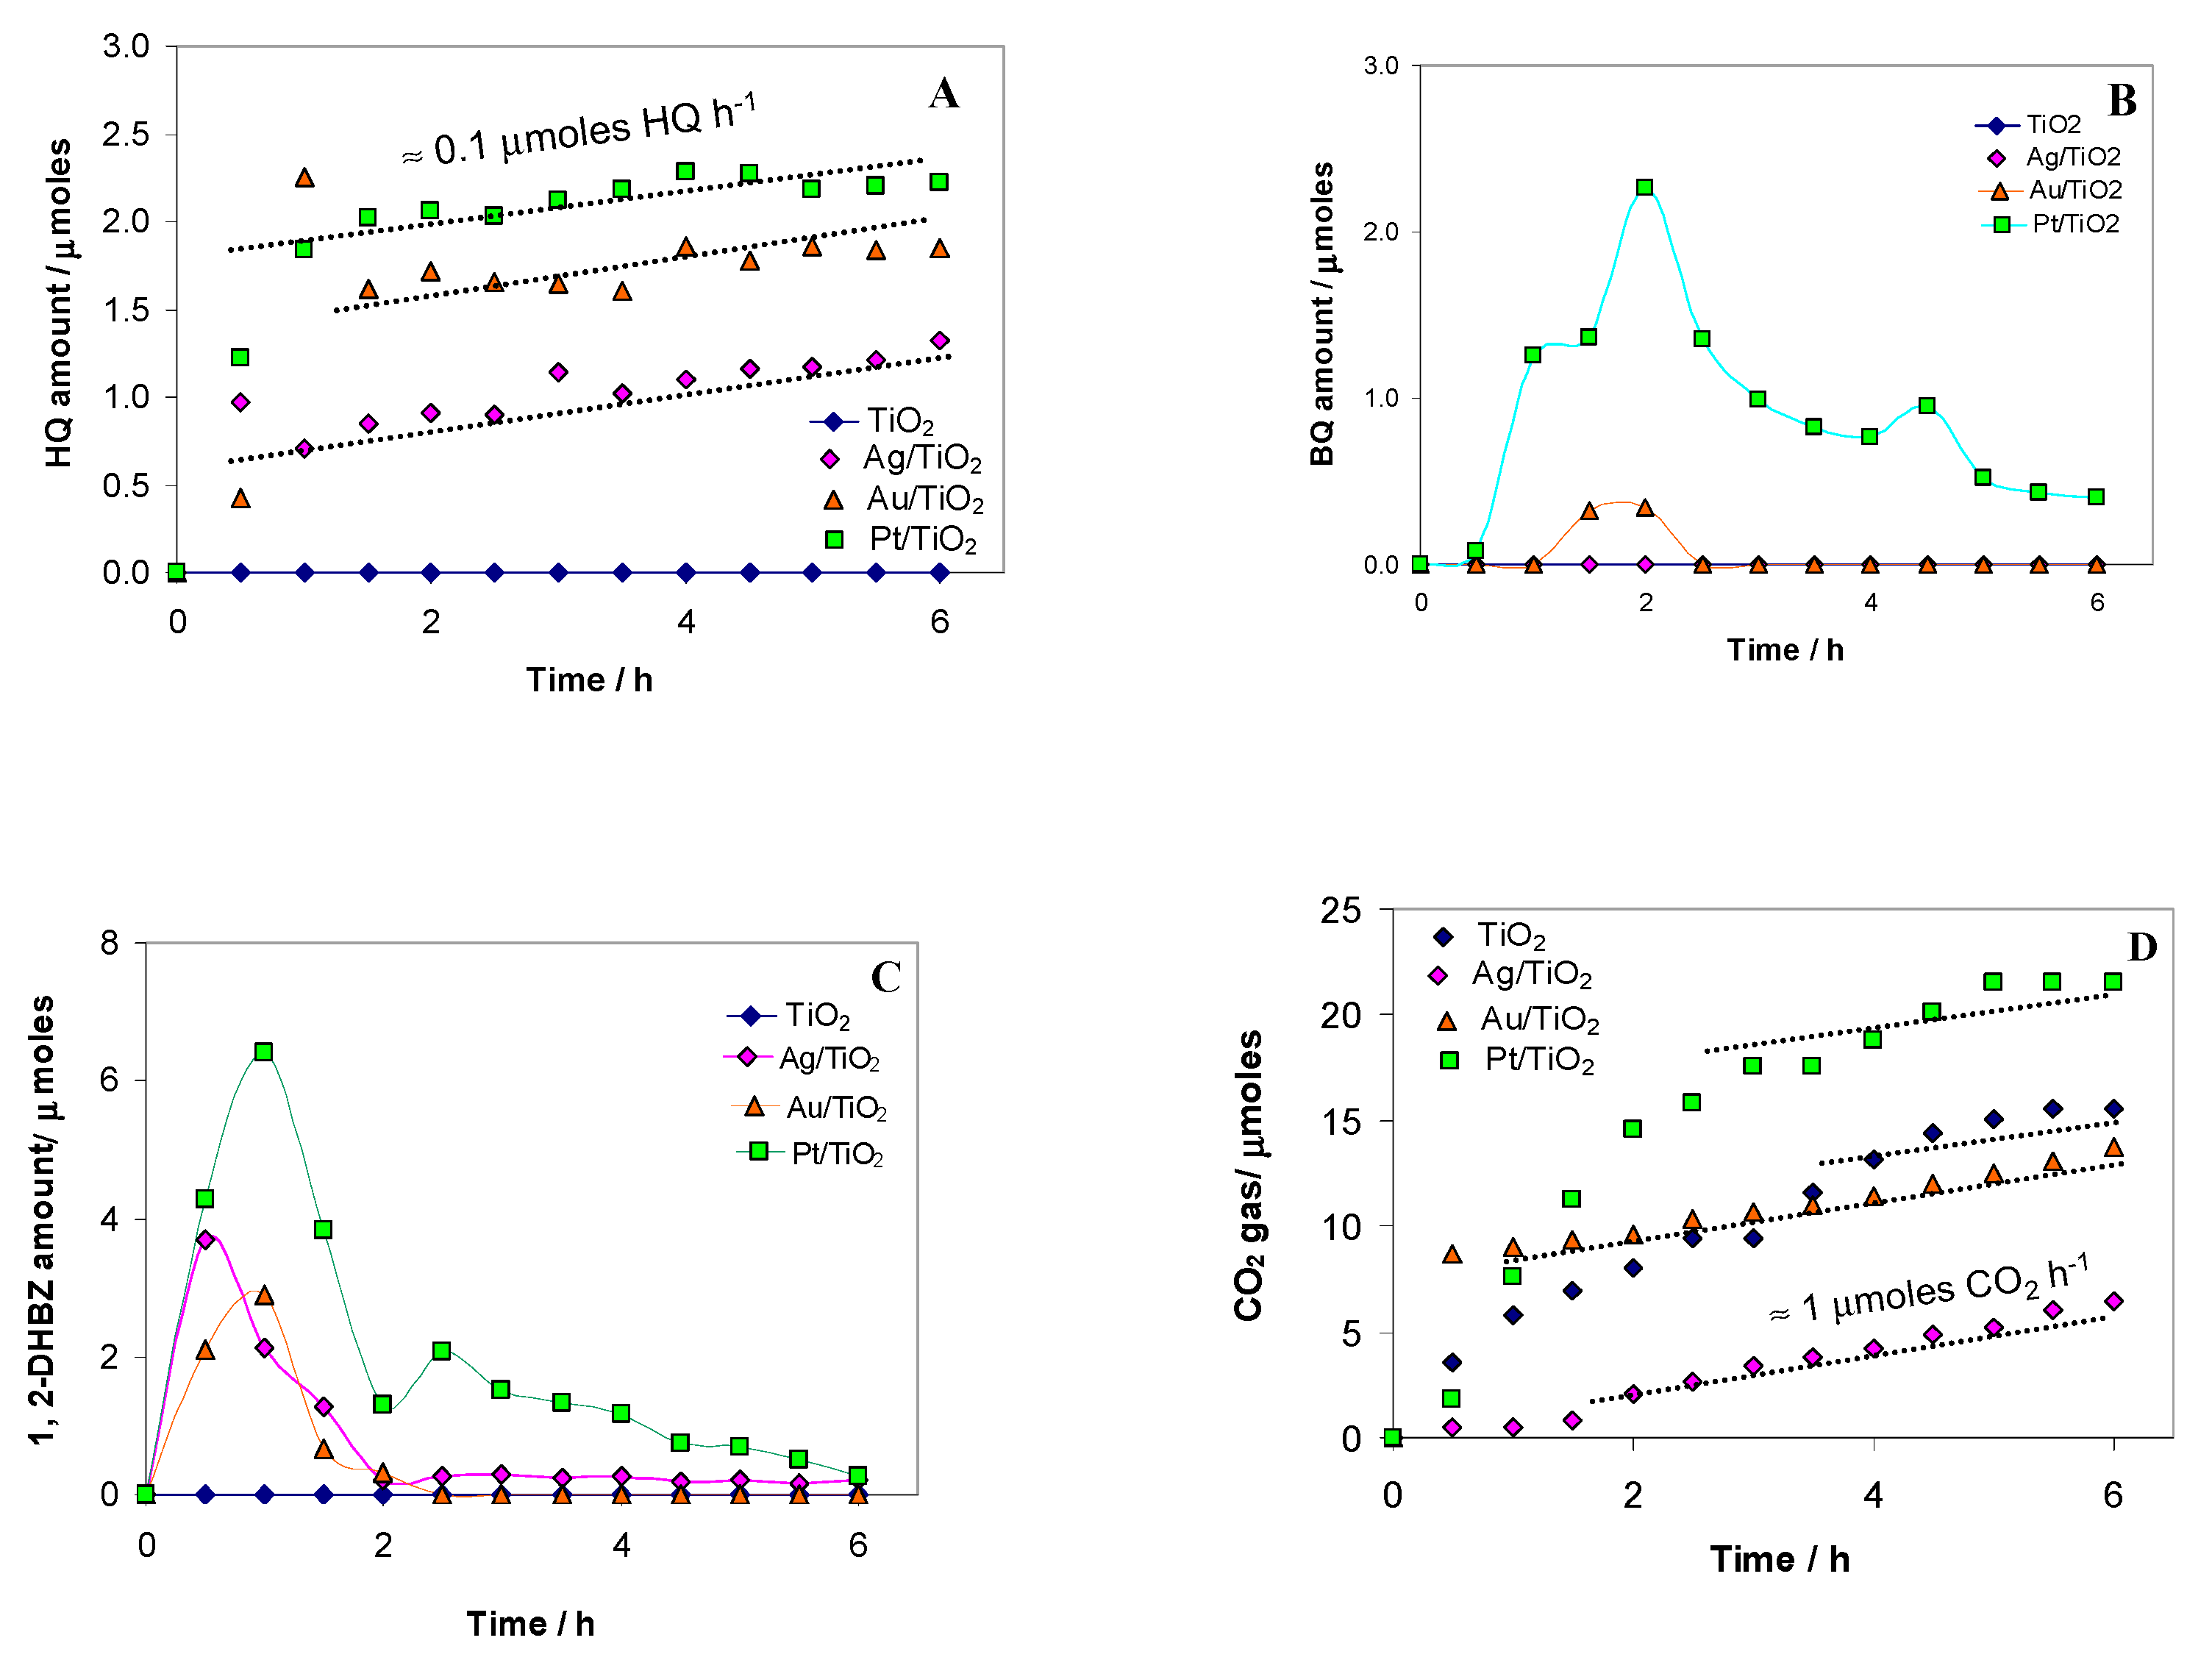
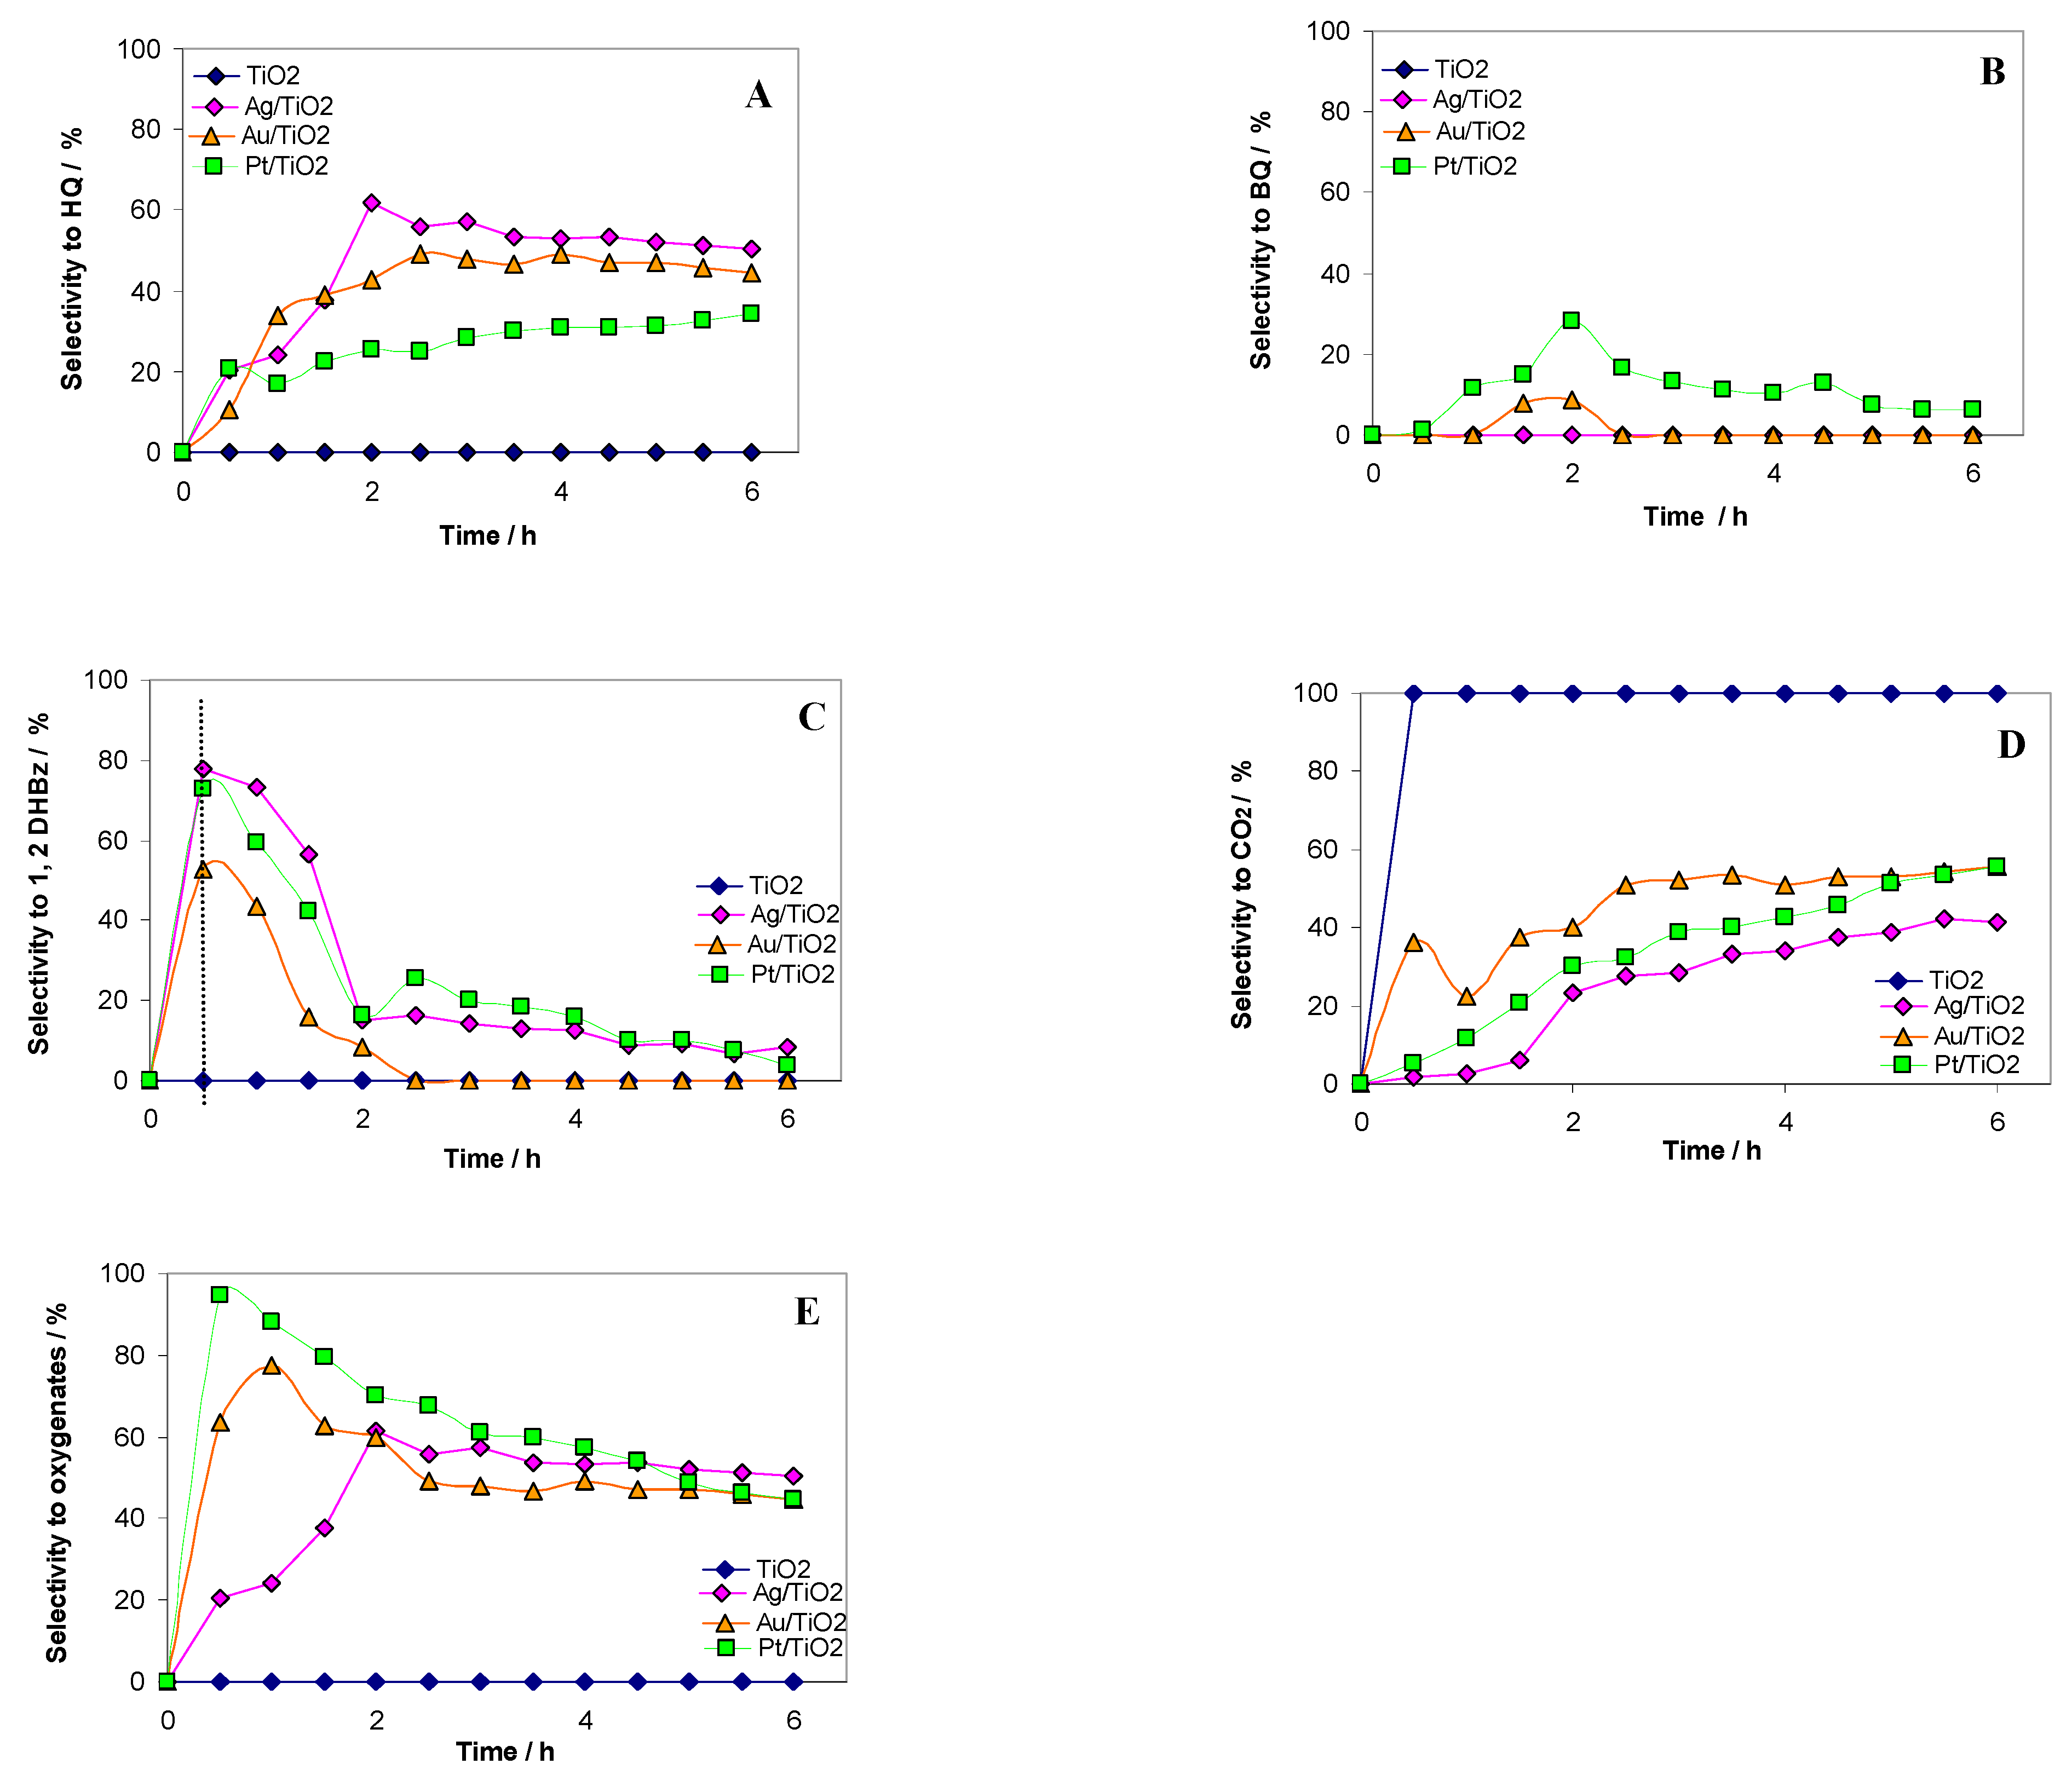
2.2. Photocatalytic Test Results

The experimental data concerning reactant and product distribution, carbon balance, and conversion of phenol (Ph) over bare and metal-modified TiO2 in aqueous media after 6 h of reaction time are presented in Table 2.
The carbon balance ((C(outlet)/C(inlet))x100) in our experiments was better than 92%. The Ph conversion ranged between 8.7% (for bare TiO2) and 15.8% (for Pt/TiO2). From the Ph conversion point of view, metal deposition enhances the activity of TiO2 (Pt/TiO2 > Ag/TiO2 > Au/TiO2 > TiO2). The formation of Ph mild oxidation products at end of reaction time, hydroquinone (HQ), benzoquinone (BQ) and 1,2-dihydroxibenzene (1,2 DHBz), could be observed only on metal-loaded TiO2 (Me = Ag, Au, Pt). In contrast, over bare TiO2, Ph was mineralized directly to CO2. The brief analysis of our results suggests that metal deposition on TiO2 favor the formation of oxygenated products, whereas over pristine TiO2, Ph is mineralized directly to CO2, without intermediate formation. As we shall show in this article, the choice of metal is crucial in controlling the selectivity of oxidation reaction.
The time course of products formation during photocatalytic oxidative degradation of phenol over bare and metal-modified TiO2 exposed to simulated solar light is presented in Figure 3. It can be observed that the formation of oxygenated products takes place only on metal-loaded TiO2. The amount of HQ increases rapidly in the first hour of the reaction, then the formation rate is stabilized at ≈ 0.1 μmoles h−1. The activity order for HQ formation over metal-loaded TiO2 is Ag/TiO2 < Au/TiO2 < Pt/TiO2. Transient formation of BQ was observed only over Pt/TiO2 and Au/TiO2. The amount of BQ peaked at ≈ 2.3 and 0.4 μmoles for the former and second photocatalysts, respectively, after 2 h of reaction. For a longer reaction time, the amount of BQ decreases progressively, vanishing completely for Au/TiO2 and remaining at low concentration (≈ 0.5 μmoles) in the case of Pt/TiO2.
The evolution of reaction selectivity to oxygenated compounds and CO2 is presented in Figure 4A–E. Selectivity to 1,2 DHBz reaches a maximum at 30 min for all metal-loaded catalysts (78% for Ag/TiO2, 73% for Pt/TiO2, 53% for Au/TiO2) (Figure 4C). Highest selectivity to oxygenated products (1,2 DHBz + HQ + BQ) of ≈95% was measured for Pt/TiO2 after 0.5 h of reaction time, followed by Au/TiO2 (77% at 1 h), Ag/TiO2 (61% at 2 h), and TiO2 (0%) (see Figure 4E).

2.3. Noble Metals Role in Charge Separation and ROS Generation

The next step of our investigation was to elucidate in more details the role played by metals in photocatalytic oxidation processes, specifically in (i) charge separation and in (ii) ROS generation.
Electron-hole recombination is one of the main energy loss routes through radiative and nonradiative processes [19]. Photoluminescence (PL) experiments were designed to observe whether, in our case, metal deposition is effective to decrease charge recombination by PL emission.
It is documented that, PL emission intensity depends on photogenerated charge concentration [20]. The PL spectra in Figure 5 show that the energy loss by radiative recombination decreases because of metal deposition on TiO2, due to a better separation of photocharges at the metal–oxide interfaces [14,15]. In light of experimental results, the most efficient charge separation takes place on Au/TiO2, followed, in order, by Ag/TiO2 and Pt/TiO2. Improvement in charge separation is expected to enhance photocatalytic activity because a greater number of electrons and holes become available for redox processes associated with photocatalytic reactions. Our results confirm that a higher conversion of Ph is observed over metal-loaded TiO2 compared to bare TiO2 (see Table 2). However, based only on PL emission intensity results, it is difficult to predict the precise order of activity because, beside the important role played by metals in charge separation, metals work as co-catalysts, mediating charge transfer to reacting substrates.

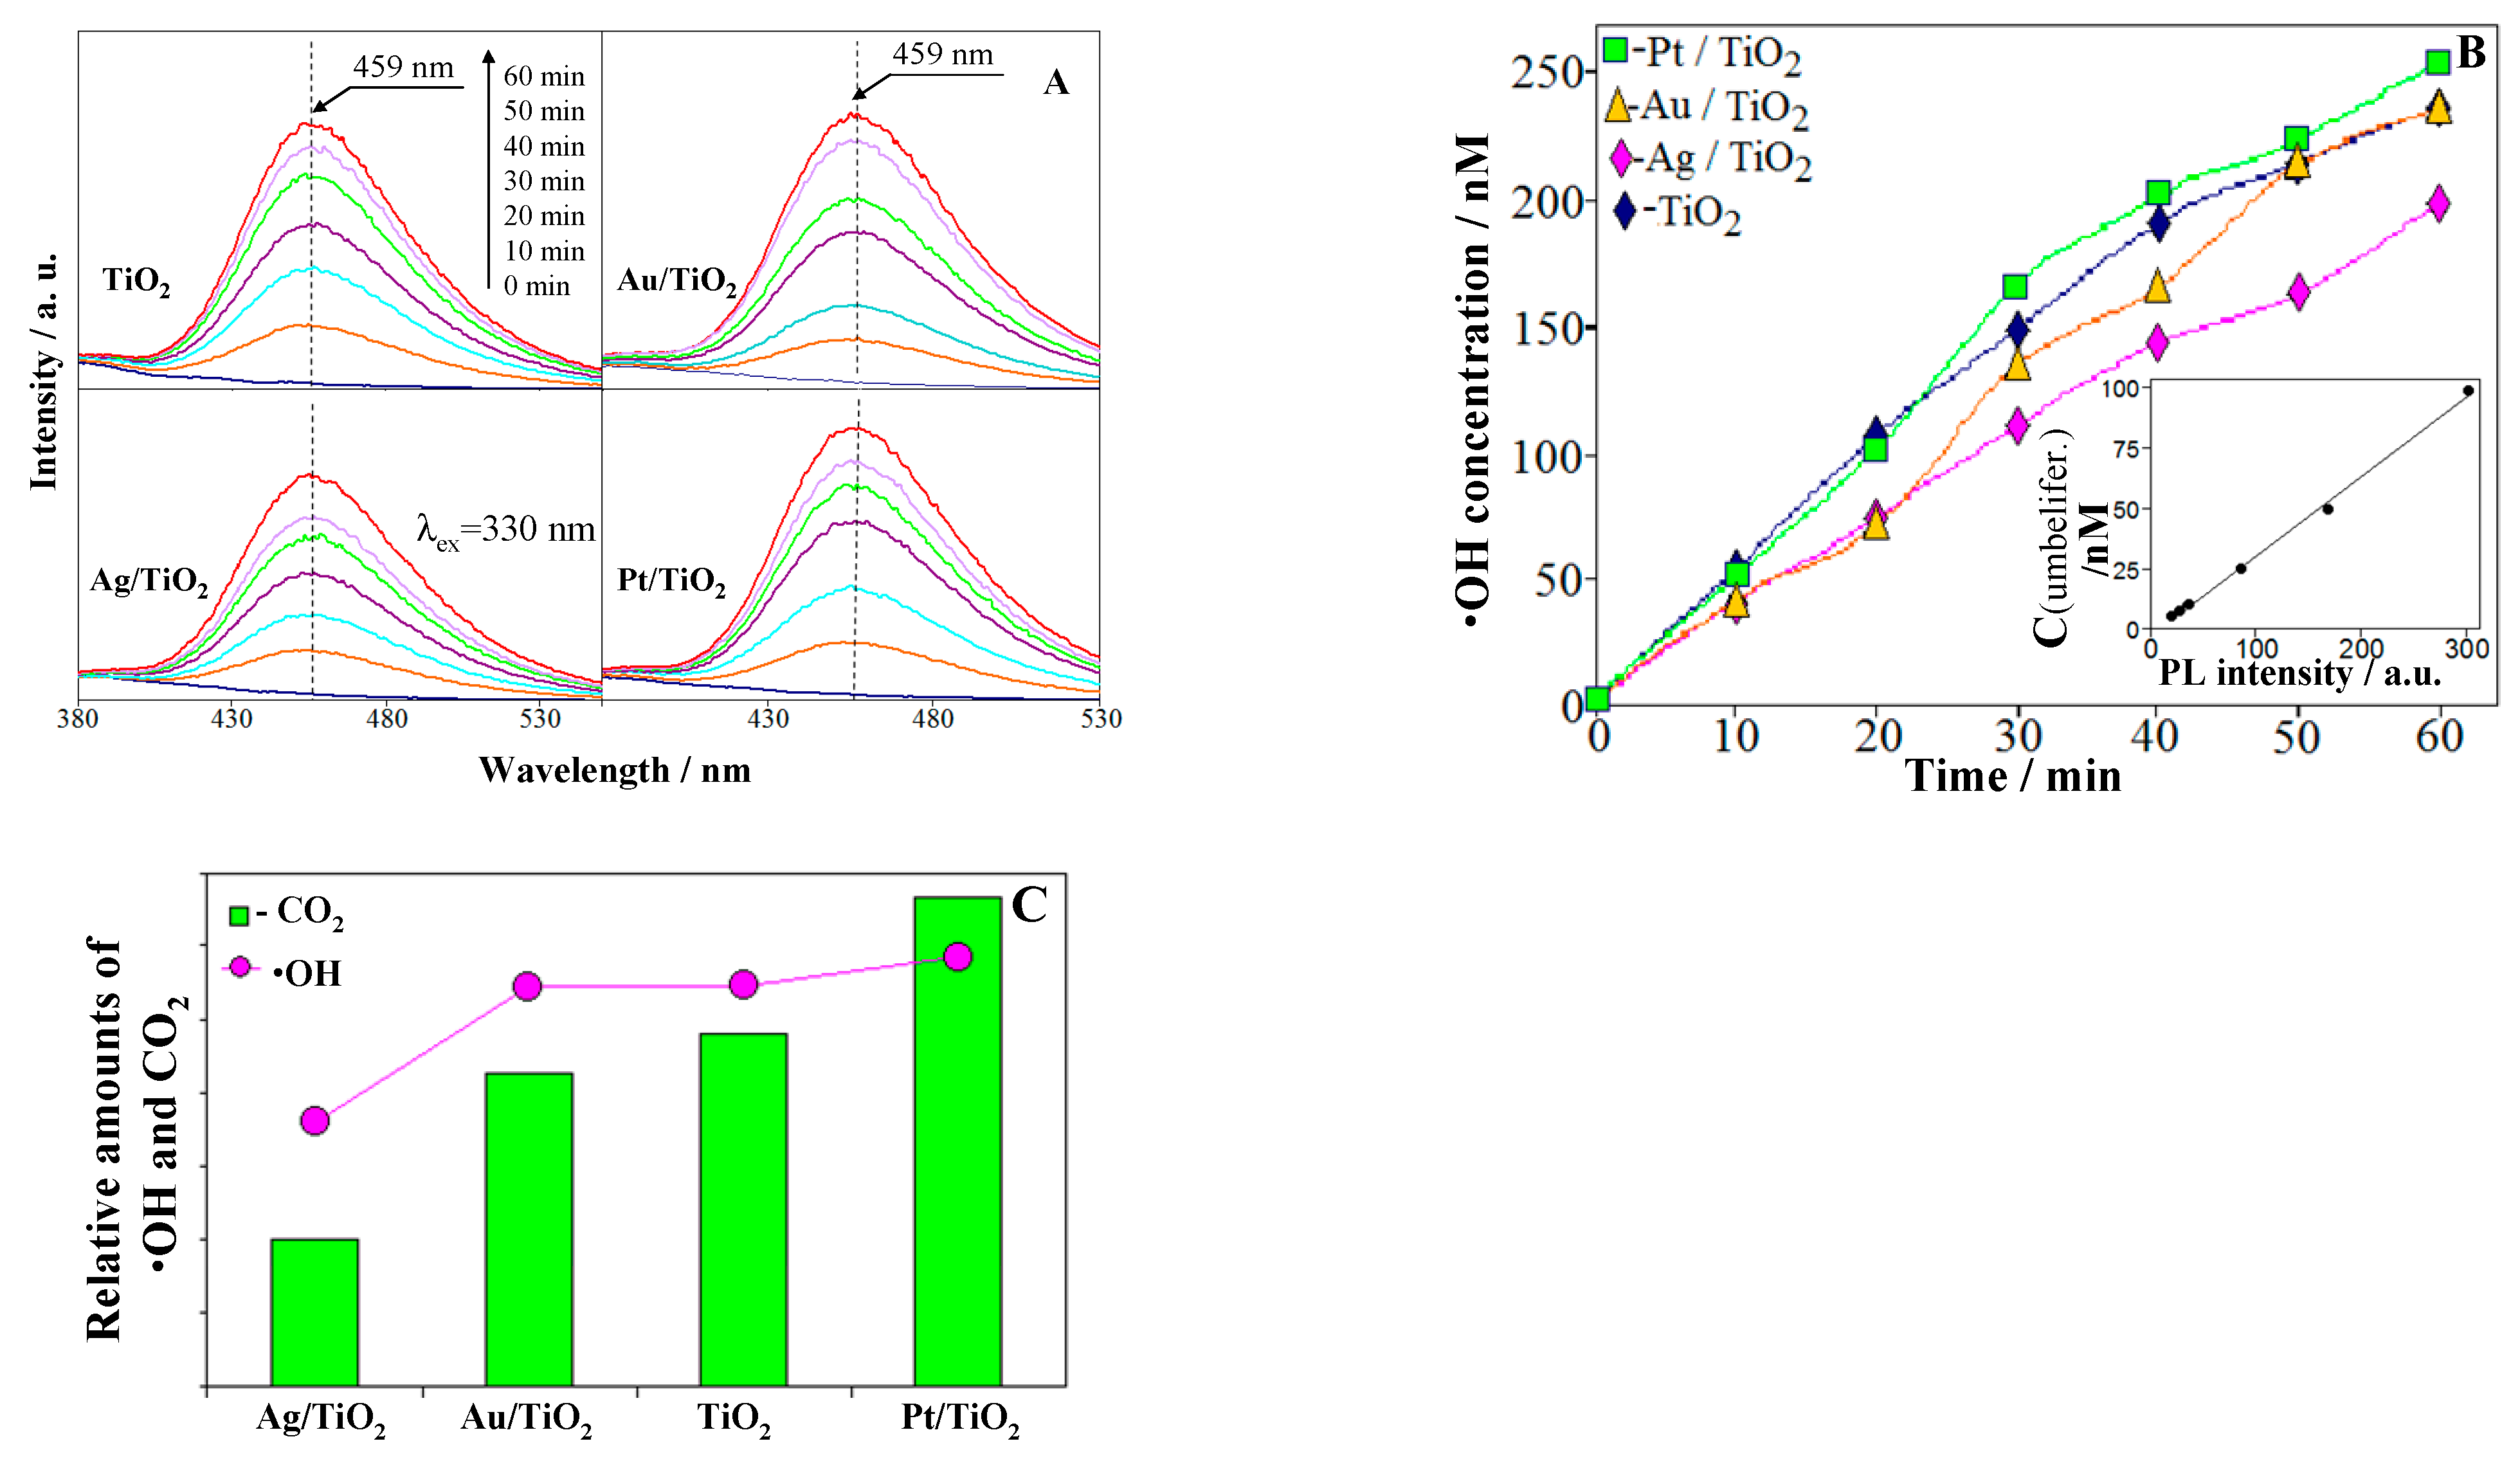
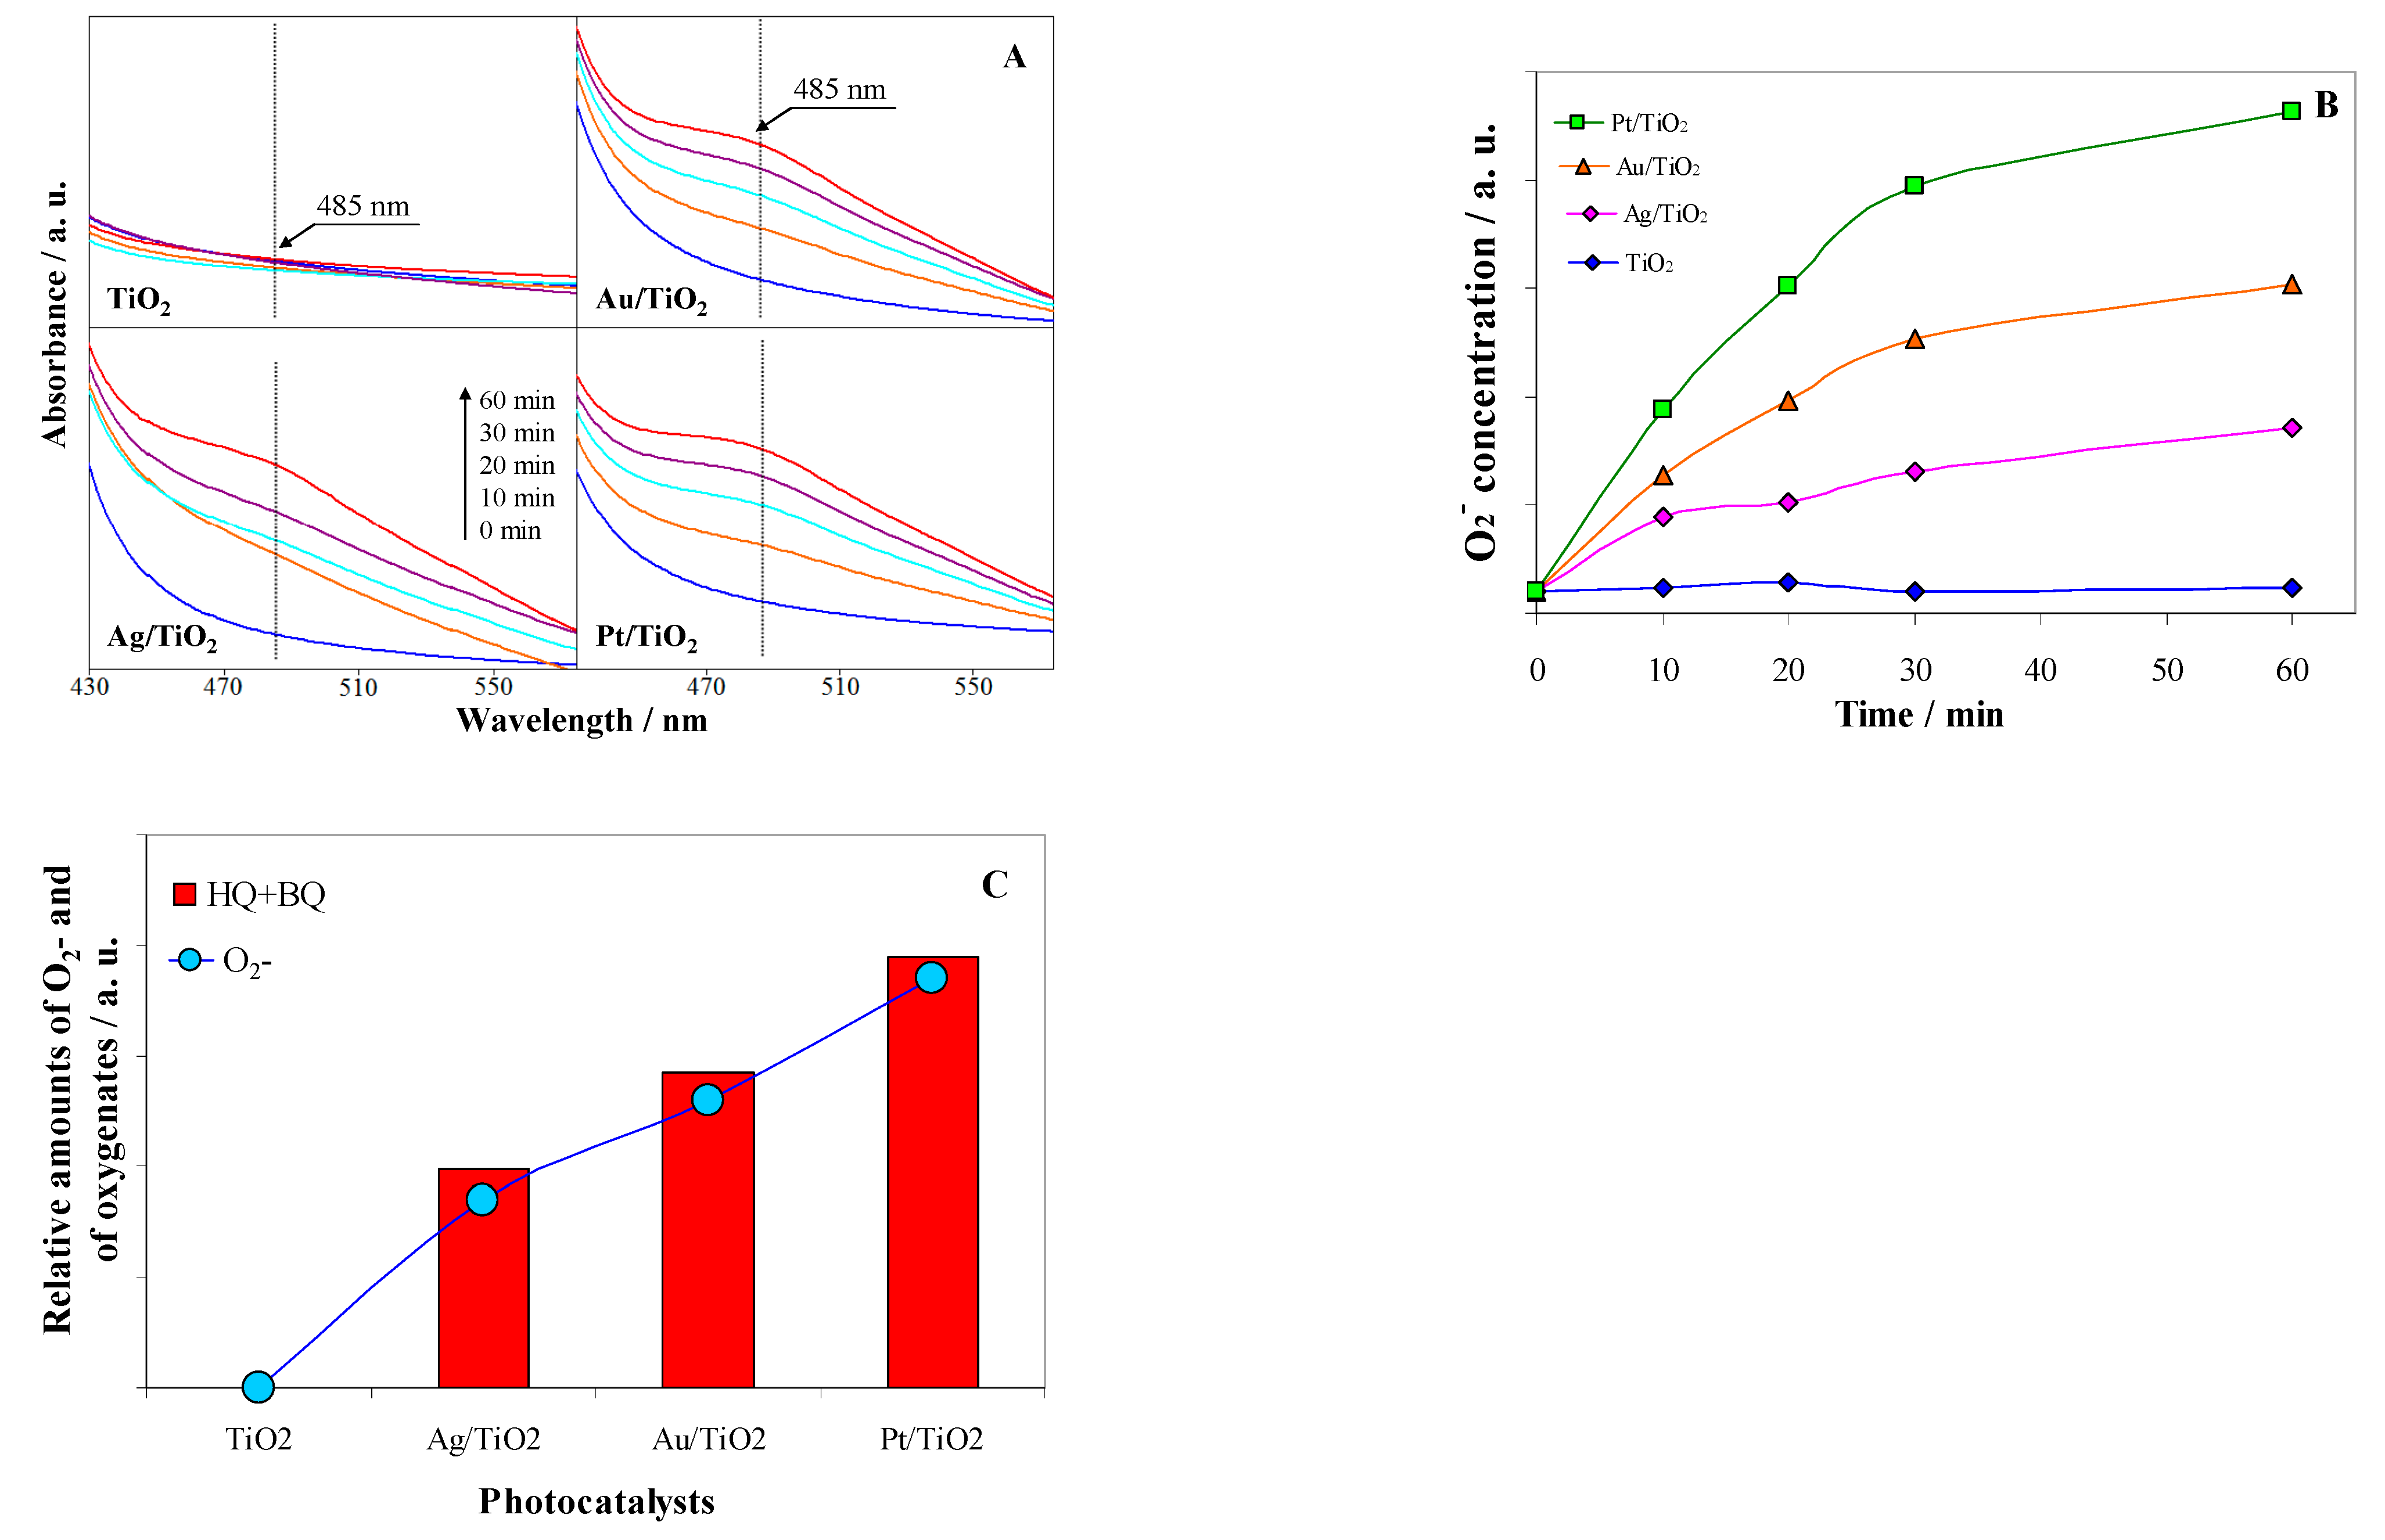
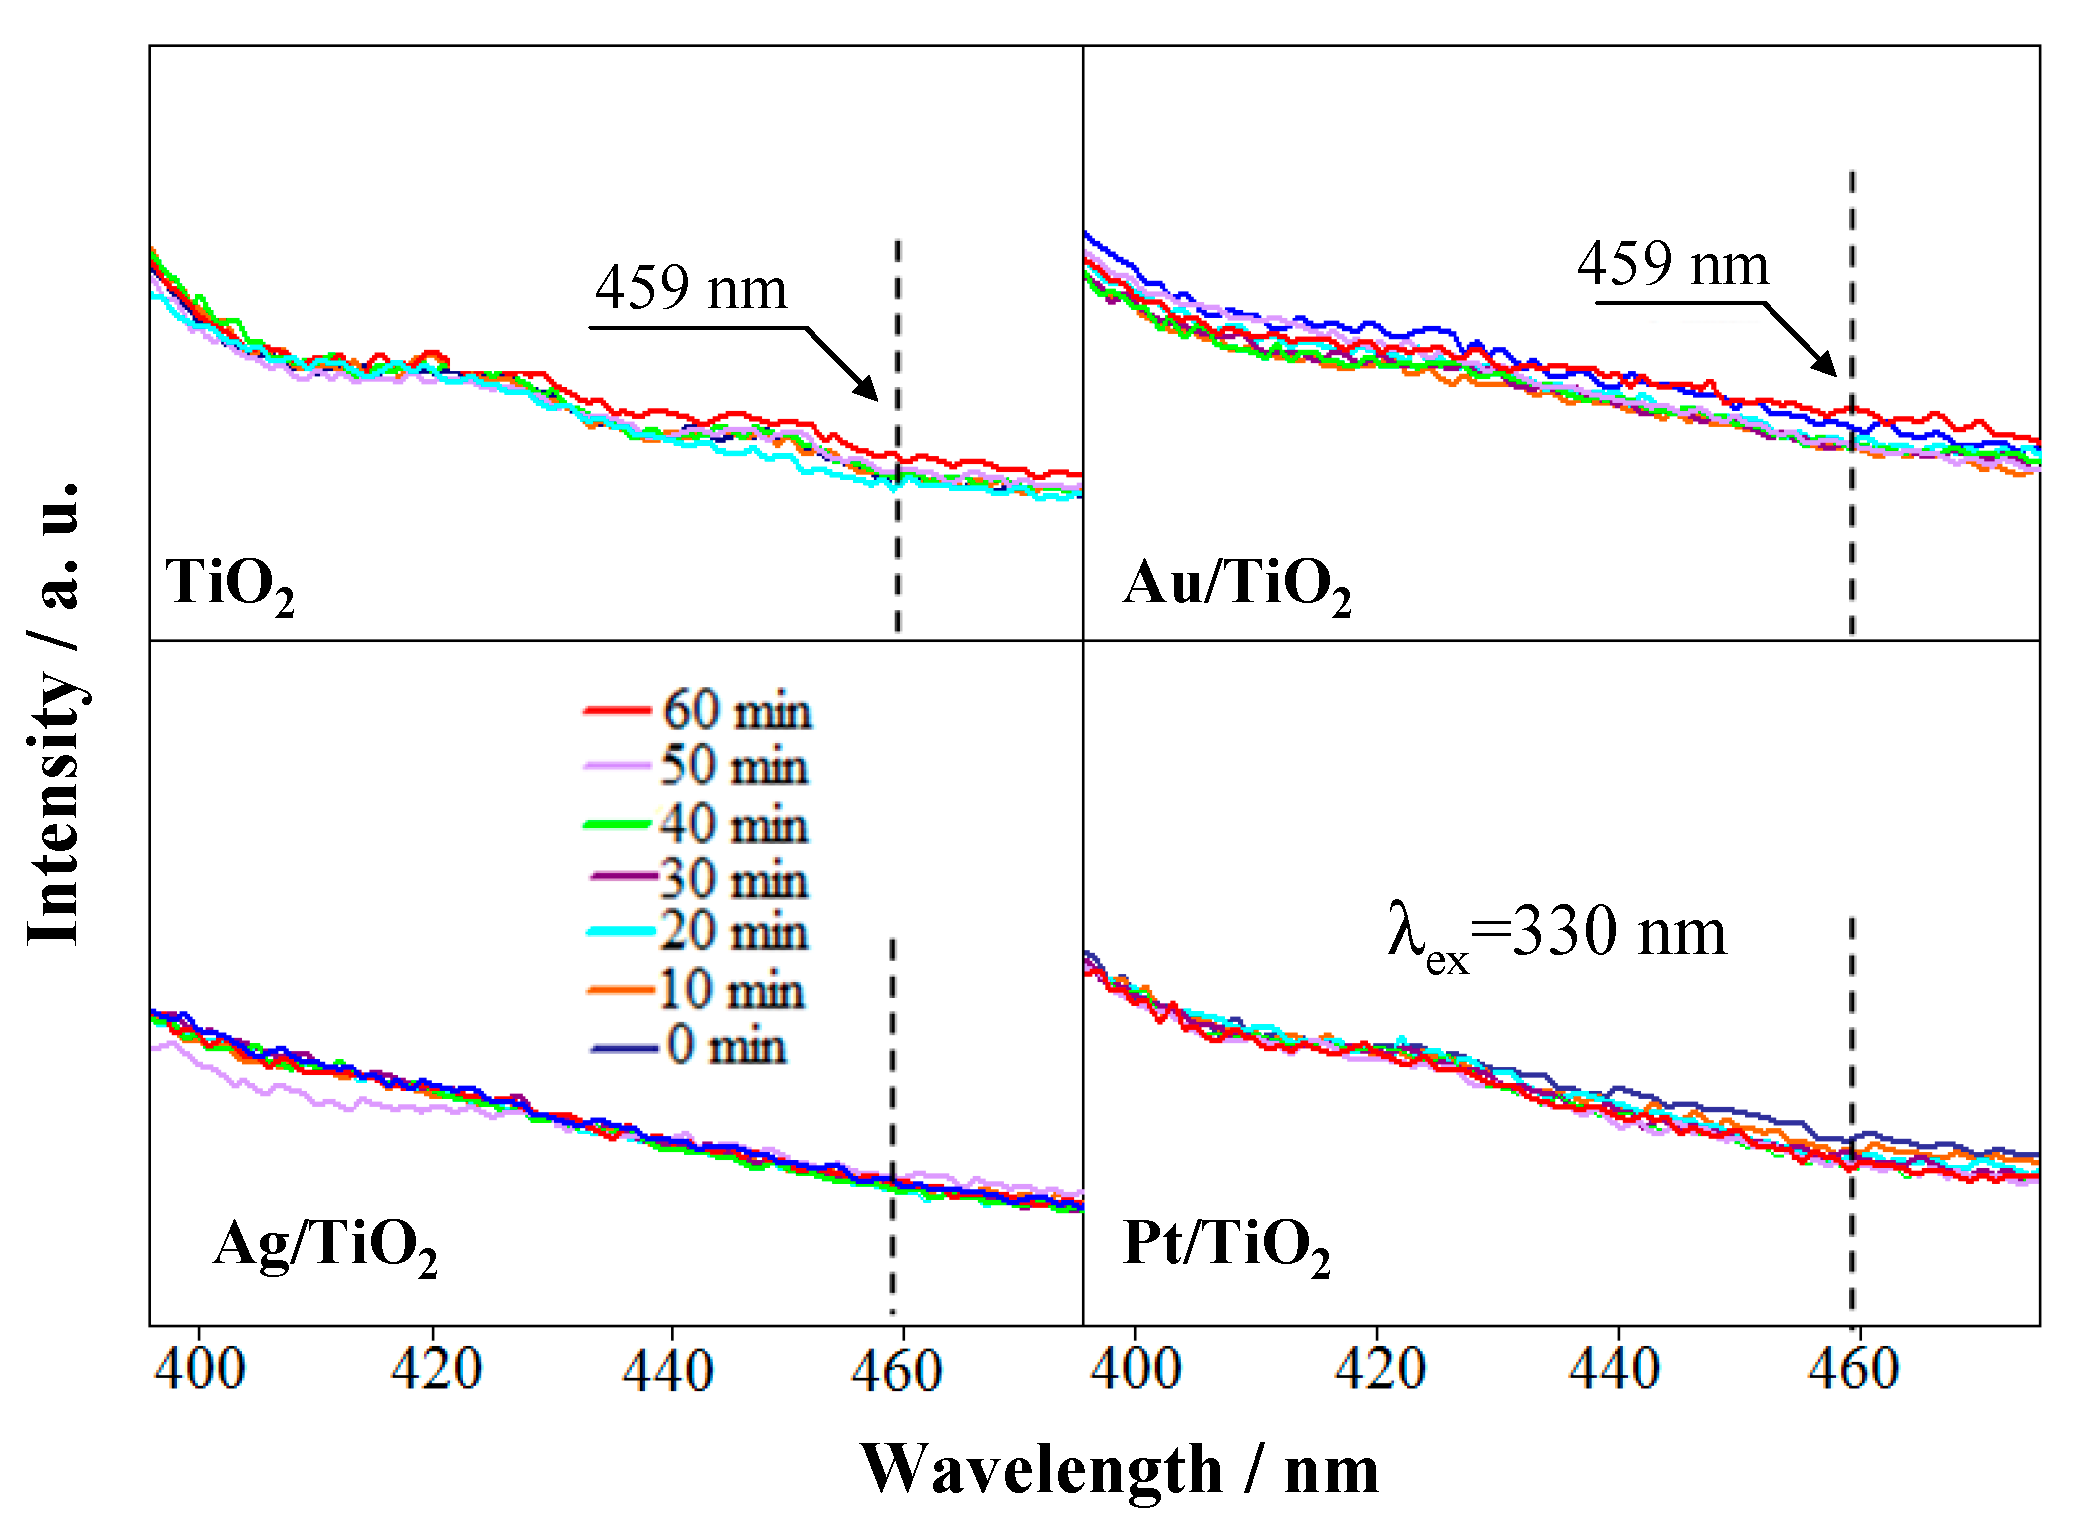
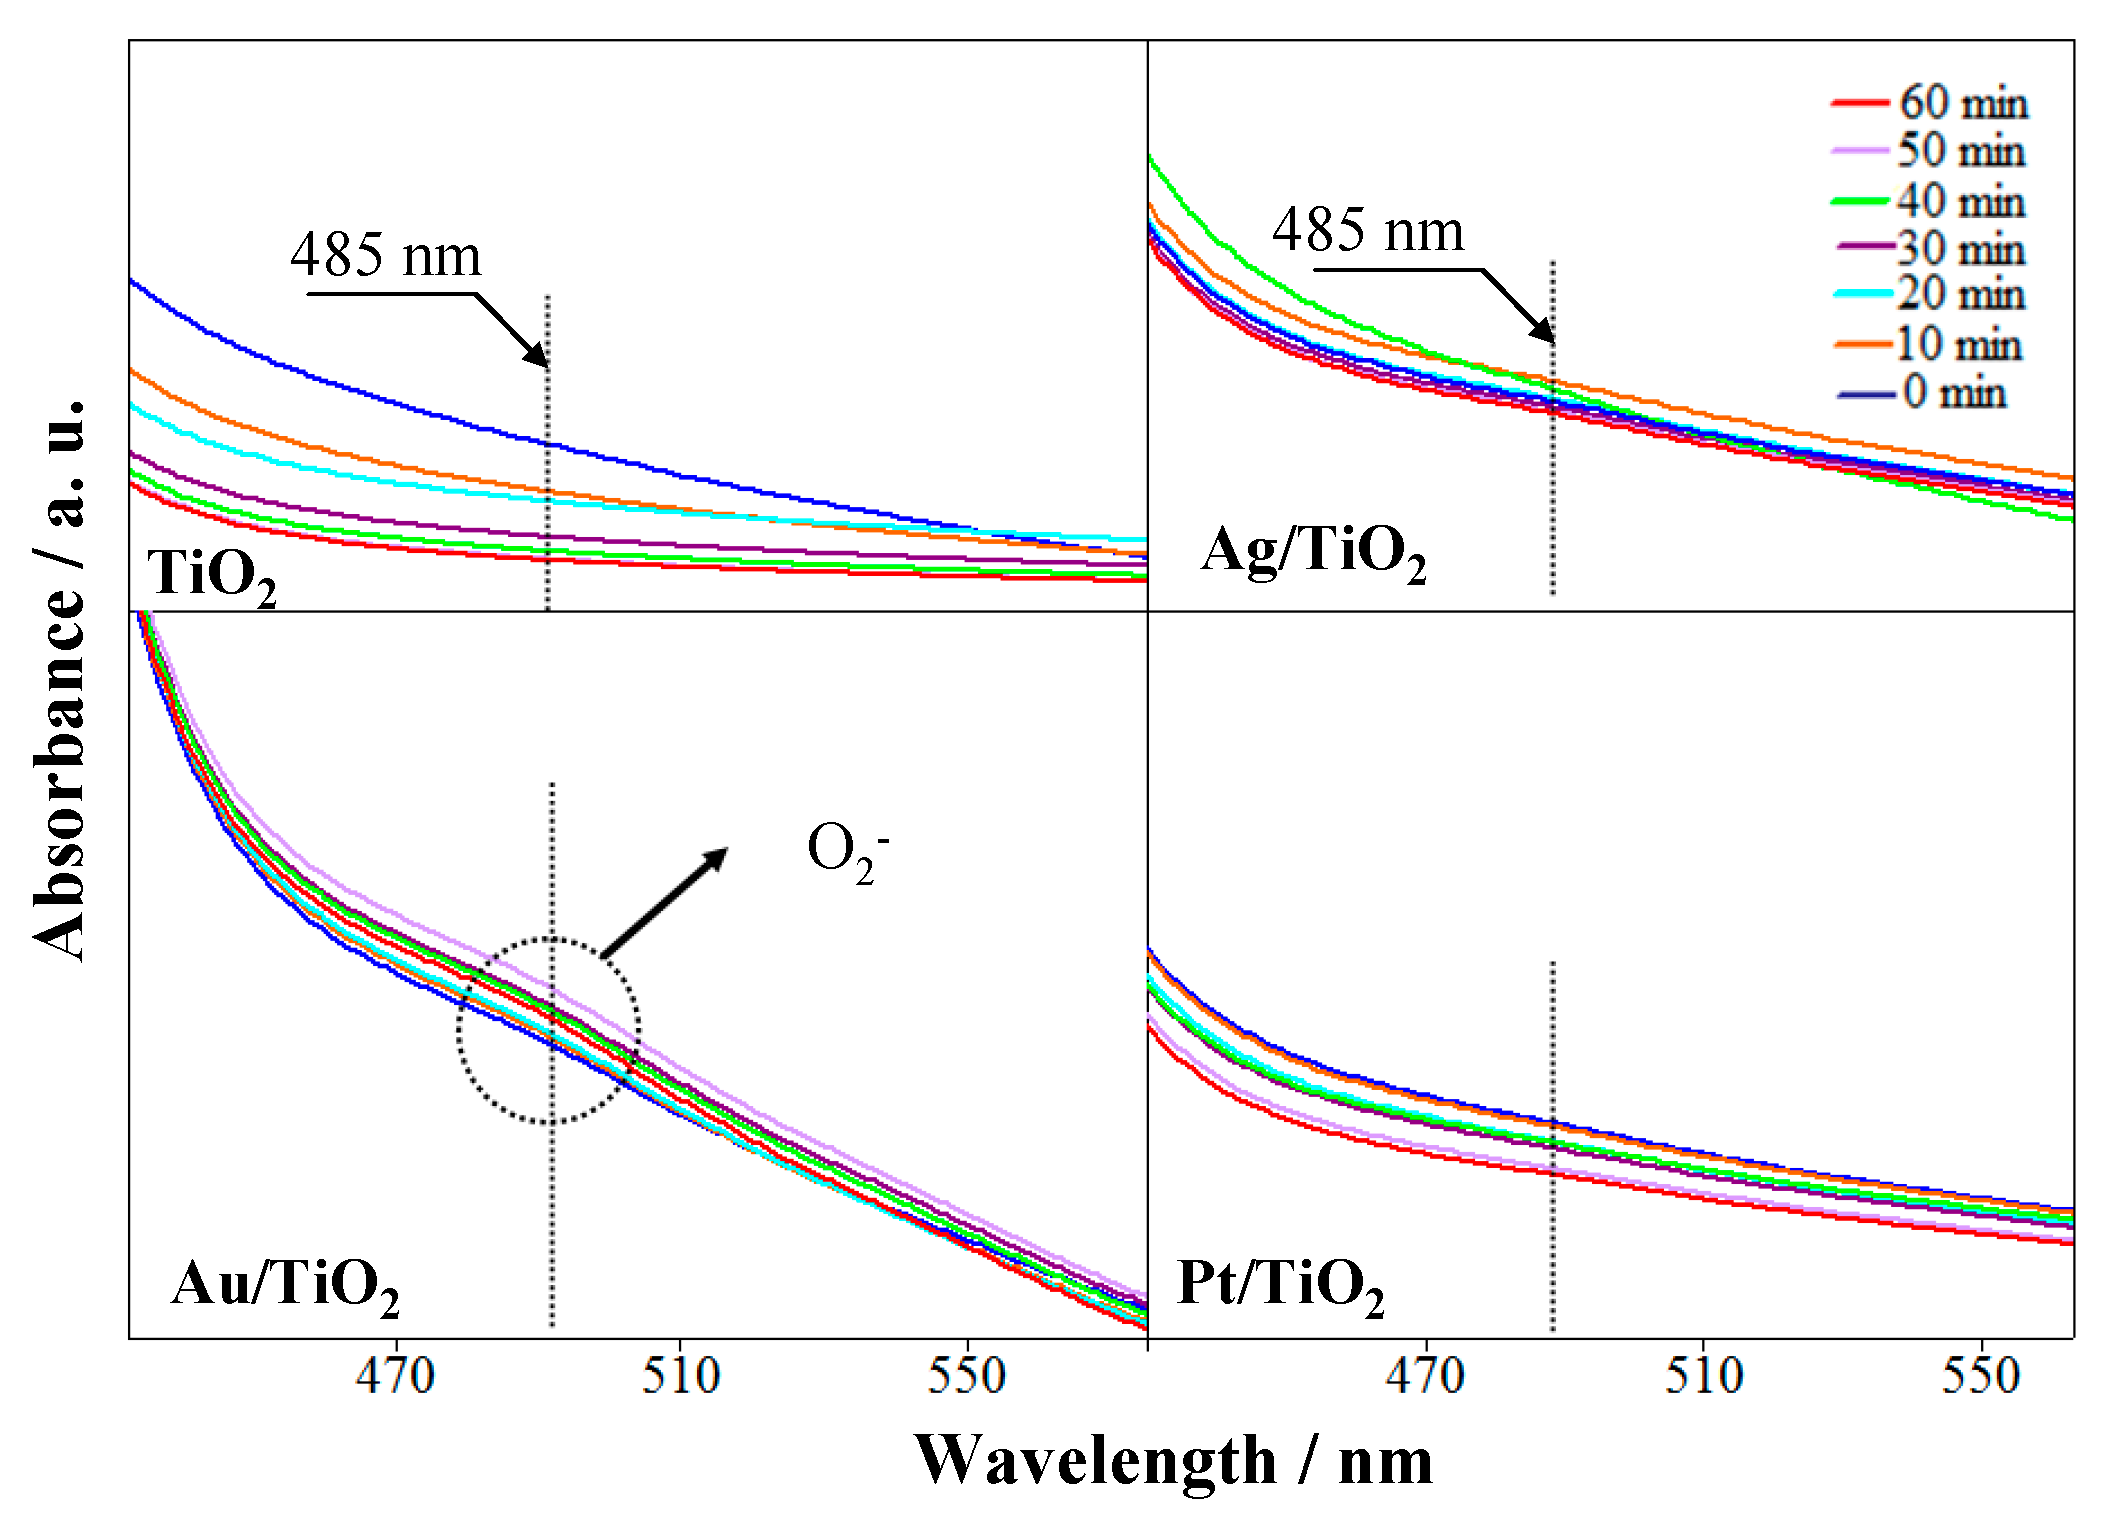
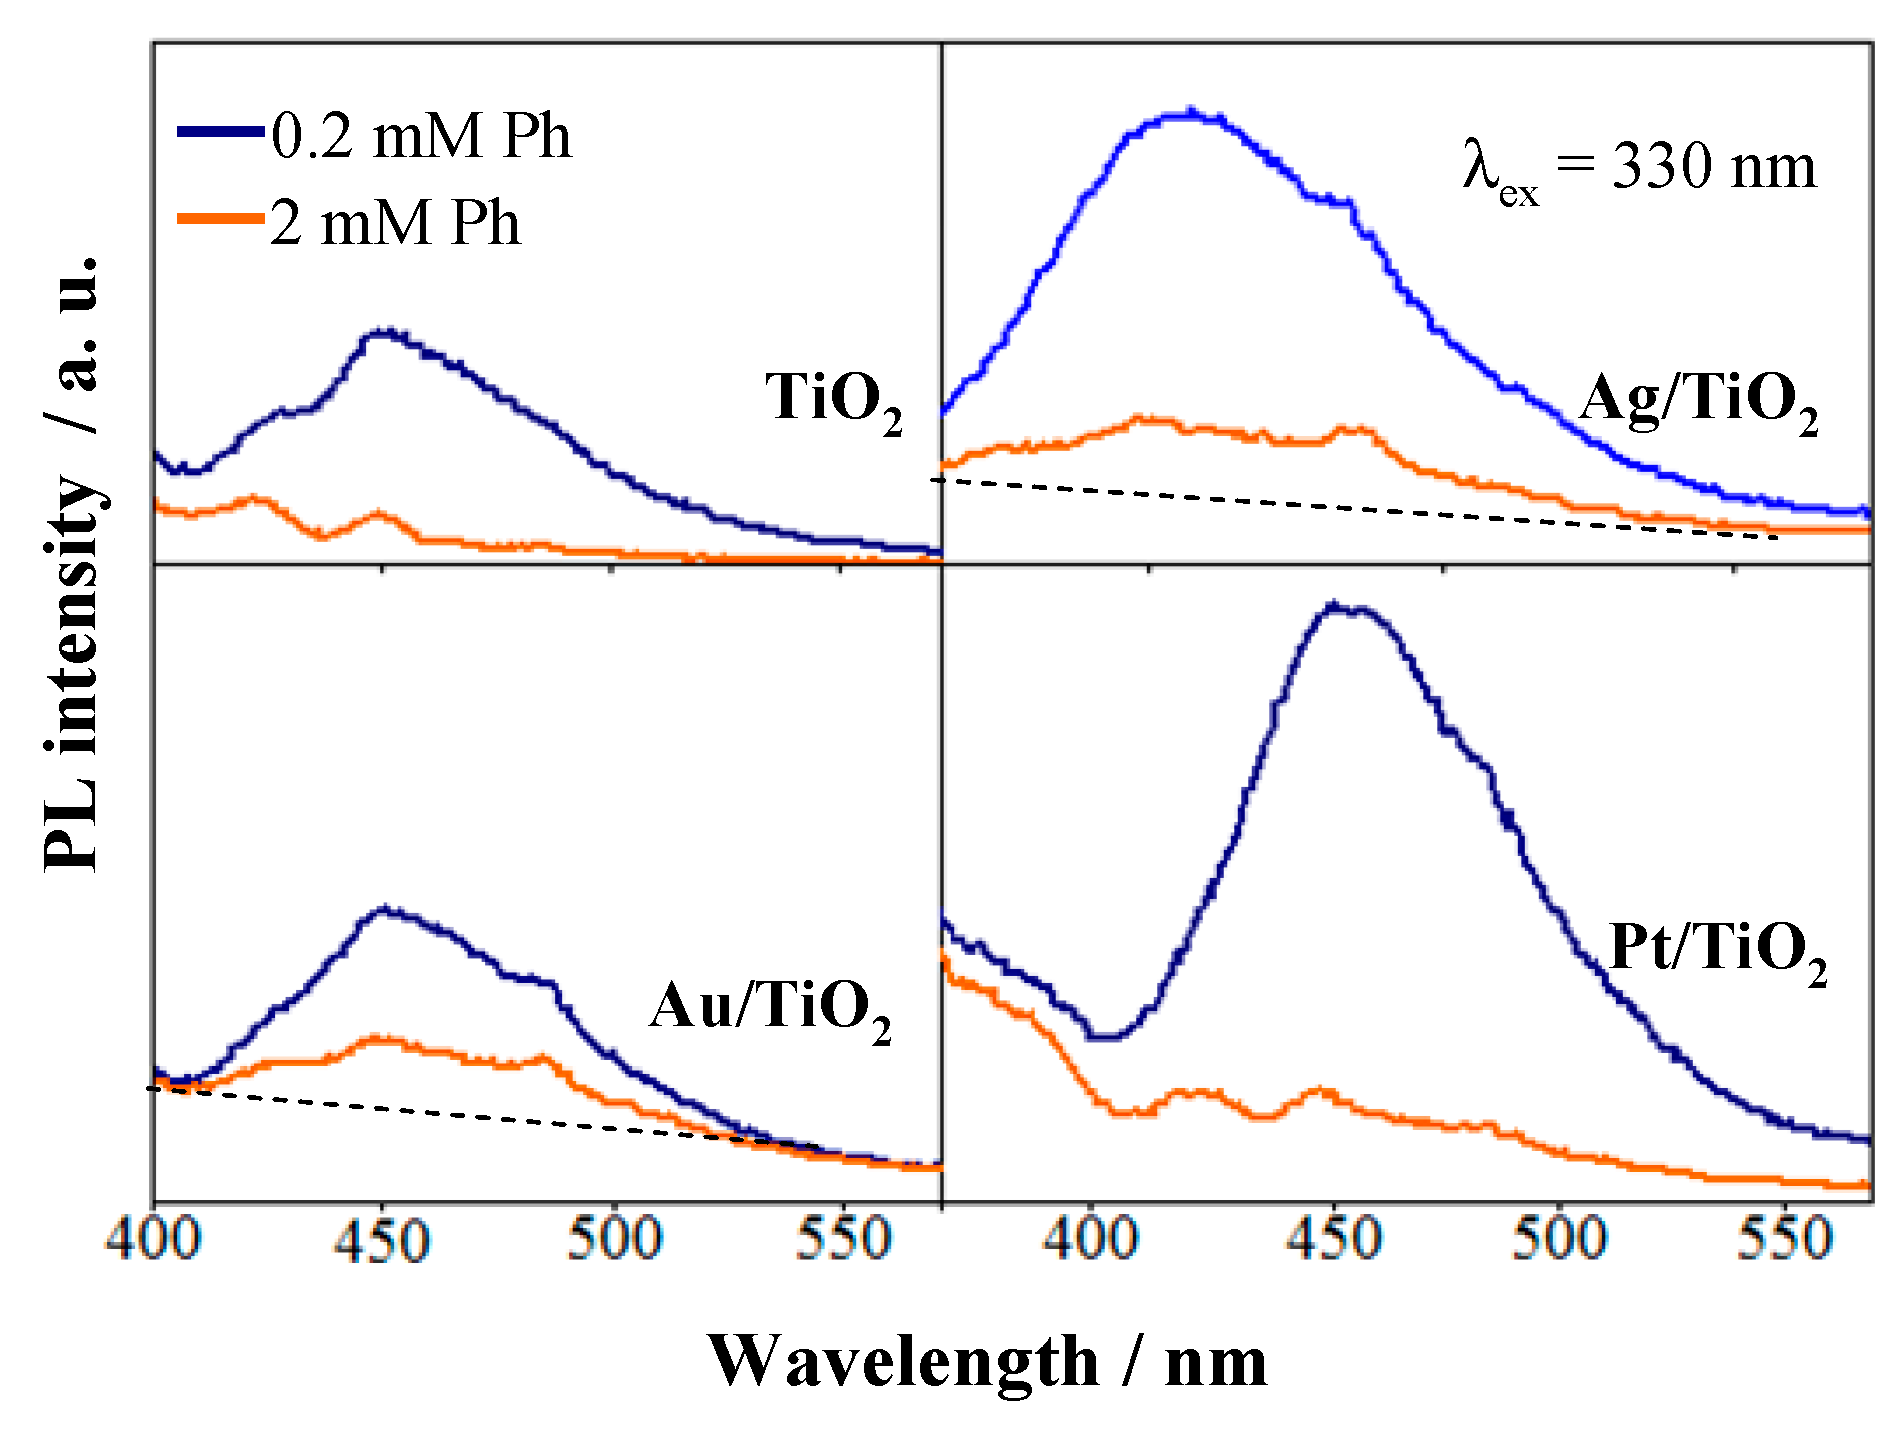
2.4. ROS Formation on Bare and Metal-Loaded TiO2

We have considered three main reaction pathways for the oxidative conversion of Ph: (i) straight charge injection to adsorbed organic substrate on catalyst surface, (ii) reaction of organic substrate with ·OH or with O2. In case of oxidative degradation reaction mechanism, the photogenerated charges are shuttled to Ph by intermediation of ROS (·OH and O2). It is well documented that ·OH is a powerful, non-selective, oxidant, whereas O2 is a weak oxidant [21].
To get further information on the relationship between ROS formation and the photocatalytic behavior of our materials, we have assessed the formation of ·OH and O2 under light irradiation by using selective radical quenchers.
The formation of free ·OH radicals was probed by monitoring the development of fluorescent umbelliferone resulted in the reaction between non-fluorescent coumarin and ·OH radicals. The amount of ·OH raises gradually in time, for all photocatalyst exposed to solar light (see Figure 6A,B). From data presented in Figure 6B, the estimated amounts of ·OH formed in 6 h of irradiation time in 110 mL of solution of reactor are: Pt
TiO2 (168 μmoles g−1cat) > TiO2 (156 μmoles g−1cat) ≈ Au/TiO2 (155 μmoles g−1cat) > Ag/TiO2 (131 μmoles g−1cat). From comparison with photocatalytic data, it comes out that the ·OH quantity is proportional with that of CO2. The experimentally measured CO2, after of 6 h of reaction time, over 0.05 g of photocatalysts, was: Pt/TiO2 (430 μmoles g−1cat) > TiO2 (310 μmoles g−1cat) ≈ Au/TiO2 (276 μmoles g−1cat) > Ag/TiO2 (128 μmoles g−1cat) (see comparatively Figure 6B and Figure 4D). Taking into account that the probability of ·OH trapping by coumarin or by Ph vary as a function of experimental conditions [22], it can be observed, based on the good matching between radical quenching and photocatalytic results, that CO2 formation relates to ·OH production. The plots in Figure 6C show a clear correlation between relative amounts of ·OH and CO2 formed over the investigated materials. Therefore, we assume that ·OH radicals are responsible for the mineralization of Ph to CO2 (non-selective oxidation route). The formation of CO2 cannot be prevented over TiO2-based materials dispersed in aqueous media because the formation of ·OH radicals is unavoidable.
The formation of O2 over metal loaded TiO2 was evidenced indirectly by detection of formazan, which is the product of reaction between XTT and O2 The specific absorbance peak of formazan is at 485 nm (Figure 7A). The reduction efficiency of O2 to O2, estimated from the amount of formazan, decreases in the order Pt/TiO2 > Au/TiO2 > Ag/TiO2 (Figure 7B). The formation of O2 could not be evidenced via formation of formazan on the bare TiO2 sample, prepared by laser pyrolysis. There are, however, reports claiming that O2 is formed on TiO2. For example, Goto et al. [23] detected the formation of O2 on rutile particles, suggesting that electron transfer takes place from an organic moiety (2-propanol) to O2.
The quantity of oxygenated products resulted by photocatalytic oxidation of Ph scale with the relative amounts of O2 (see Figure 7C). From here, it comes that, O2 is the ROS responsible for Ph mild oxidation. The main outcomes from O2 quenching experiments are: (i) supported metals catalyze O2 formation and (ii) O2 is the main player in Ph mild oxidative route. The eventual role played by O2 for degradation of oxygenated compounds to CO2 should not be completely disregarded, although O2 is a significantly weaker oxidant compared to ·OH. The BQ is indicated as an effective O2 quencher [1]. We have observed indeed the rapid degradation of BQ, formed only over Pt/TiO2 and Au/TiO2 (see Figure 3B).
The formation of ROS was checked also in visible light domain (λ > 420 nm).
The results of Figure 8 show that, the formation of ·OH radical does not proceed under visible light for any of the investigated materials (Figure 8), which is in line with the absence of CO2 formation during photocatalytic tests conducted in visible light. Our selective radical quenching results demonstrate that CO2 formation is due to ·OH appearance.
The survey conducted in visible light (λ > 420 nm) reveal that O2 formation does not take place over the scrutinized materials with exception of Au/TiO2 (Figure 9). The formation of O2 takes place by reaction between hot electrons of Au plasmon and adsorbed O2 in vicinity of Au nanoparticles [14]. Participation of TiO2 in O2 formation, via Au plasmon electron injection in TiO2 conduction followed by O2 reduction on TiO2, was also suggested [24]. However, the very short lifetime of plasmons of 2–10 fs associated with the low energy of electrons [25,26] decrease the probability of O2 reduction. We have observed experimentally only tinny amounts of O2 formed under visible light exposure of Au/TiO2, which are not enough to react with Ph at rates high enough to make possible the identification of mild oxidation reaction products by HPLC. The catalytic test results, carried out over all photocatalysts at λ > 420 nm, evidenced the formation of small amounts of H2 only over Au/TiO2 (≈ 2.5 μmoles in 5 h of reaction). The experiments performed in visible light show that ROS are not produced, because visible light (λ > 400) nm is not absorbed by TiO2.
In the UV region, both ·OH radicals and O2 are produced, the former on TiO2 and the second on metals. The ·OH oxidizes non-selectively the organic substrate(s) to CO2 and H2O. The reactions implying ·OH participation are important for environmental applications, where the scope is to mineralize rapidly the organic pollutant to non-harmful CO2. In our case, the mild oxidant O2, is produced only on supported noble metal particles, only under exposure to UV light. In addition to radical trapping experiments, the results of our photocatalytic tests evidence that, CO2 is the only reaction product of phenol oxidation over bare TiO2. The metals mediate the transfer of the photogenerated electrons from TiO2 to adsorbed O2. The activity order for O2 formation is Pt/TiO2 > Au/TiO2 > Ag/TiO2 (TiO2 shows no activity). The interplay between material activity for ·OH and O2 production determines the catalyst selectivity to oxygenated products and CO2. Pt/TiO2 is the most active to produce both ·OH and O2, thus it will give finally the best phenol conversion. This result proves that Pt/TiO2 generates the highest amount of photogenerated charges ready to participate in redox processes. The Ag/TiO2 is the less active generator of ·OH and O2 and consequently shows the smallest phenol conversion among metal-loaded photocatalysts. The supported metals have certain influence on activity of TiO2 support to produce ·OH: Pt/TiO2 > TiO2 ≈ Au/TiO2 > Ag/TiO2. Pt on TiO2 enhances the formation rate of ·OH compared to bare TiO2, whereas Ag depresses it. Supported Au seems to have no influence on activity of TiO2 for ·OH formation.
In visible region (λ > 420 nm), both catalyst types (bare and metal-loaded TiO2) show negligible photocatalytic activity because neither ·OH nor O2 are produced. The tiny amounts of O2 generated on Au/TiO2 are originate from Surface Plasmon Resonance (SPR) shown by Au nanoparticles. Hot electrons on surface of Au particles reduce small amount of O2. The absence of ROS production in visible light is most likely due to the fact that the light absorption edge is at 400 nm (see the UV-VIS spectra in Figure 2), consistent with a band gap of ≈ 3.1 eV. The visible light absorbed by Ag/TiO2 and Au/TiO2 is capable of triggering the formation of tiny amounts of O2 by electron donation to adsorbed O2, only in case of Au/TiO2 (see Figure 9).
To get additional experimental evidence on the nonselective Ph degradation route by ·OH radicals, we have designed a new series of experiments, aiming to hinder the formation of umbelliferone from coumarin. The concentration of Ph was chosen to be high enough (2 mM) to consume the majority of ·OH radicals formed in 30 min of exposure to light, thus lowering the probability of coumarin to quench ·OH radicals. In this way, the photoluminescence of umbelliferone was expected to diminish in presence of Ph.
The results of Figure 10 confirm that the ·OH radicals produced by TiO2 are able to react with Ph. When the concentration of Ph is small (0.2 mM), the ·OH radicals react preferentially with coumarine, yielding the photoluminescent umbelliferone. When Ph concentration is raised to 2mM, the formation of umbelliferone is depressed by the competing reaction between ·OH and Ph (see orange trace in Figure 10). In case of Au/TiO2 and Ag/TiO2 catalysts, the small residual PL maxima indicate that tinny amount of ·OH radicals are still able to react with coumarine even in presence of Ph in high concentration. Other studies [27] reported that the addition of alcohols have only a limited influence on umelliferone formation because the alcohols are preferentially adsorbed and oxidized by holes on the surface of the photocatalyst, without significant interference of ·OH radicals.

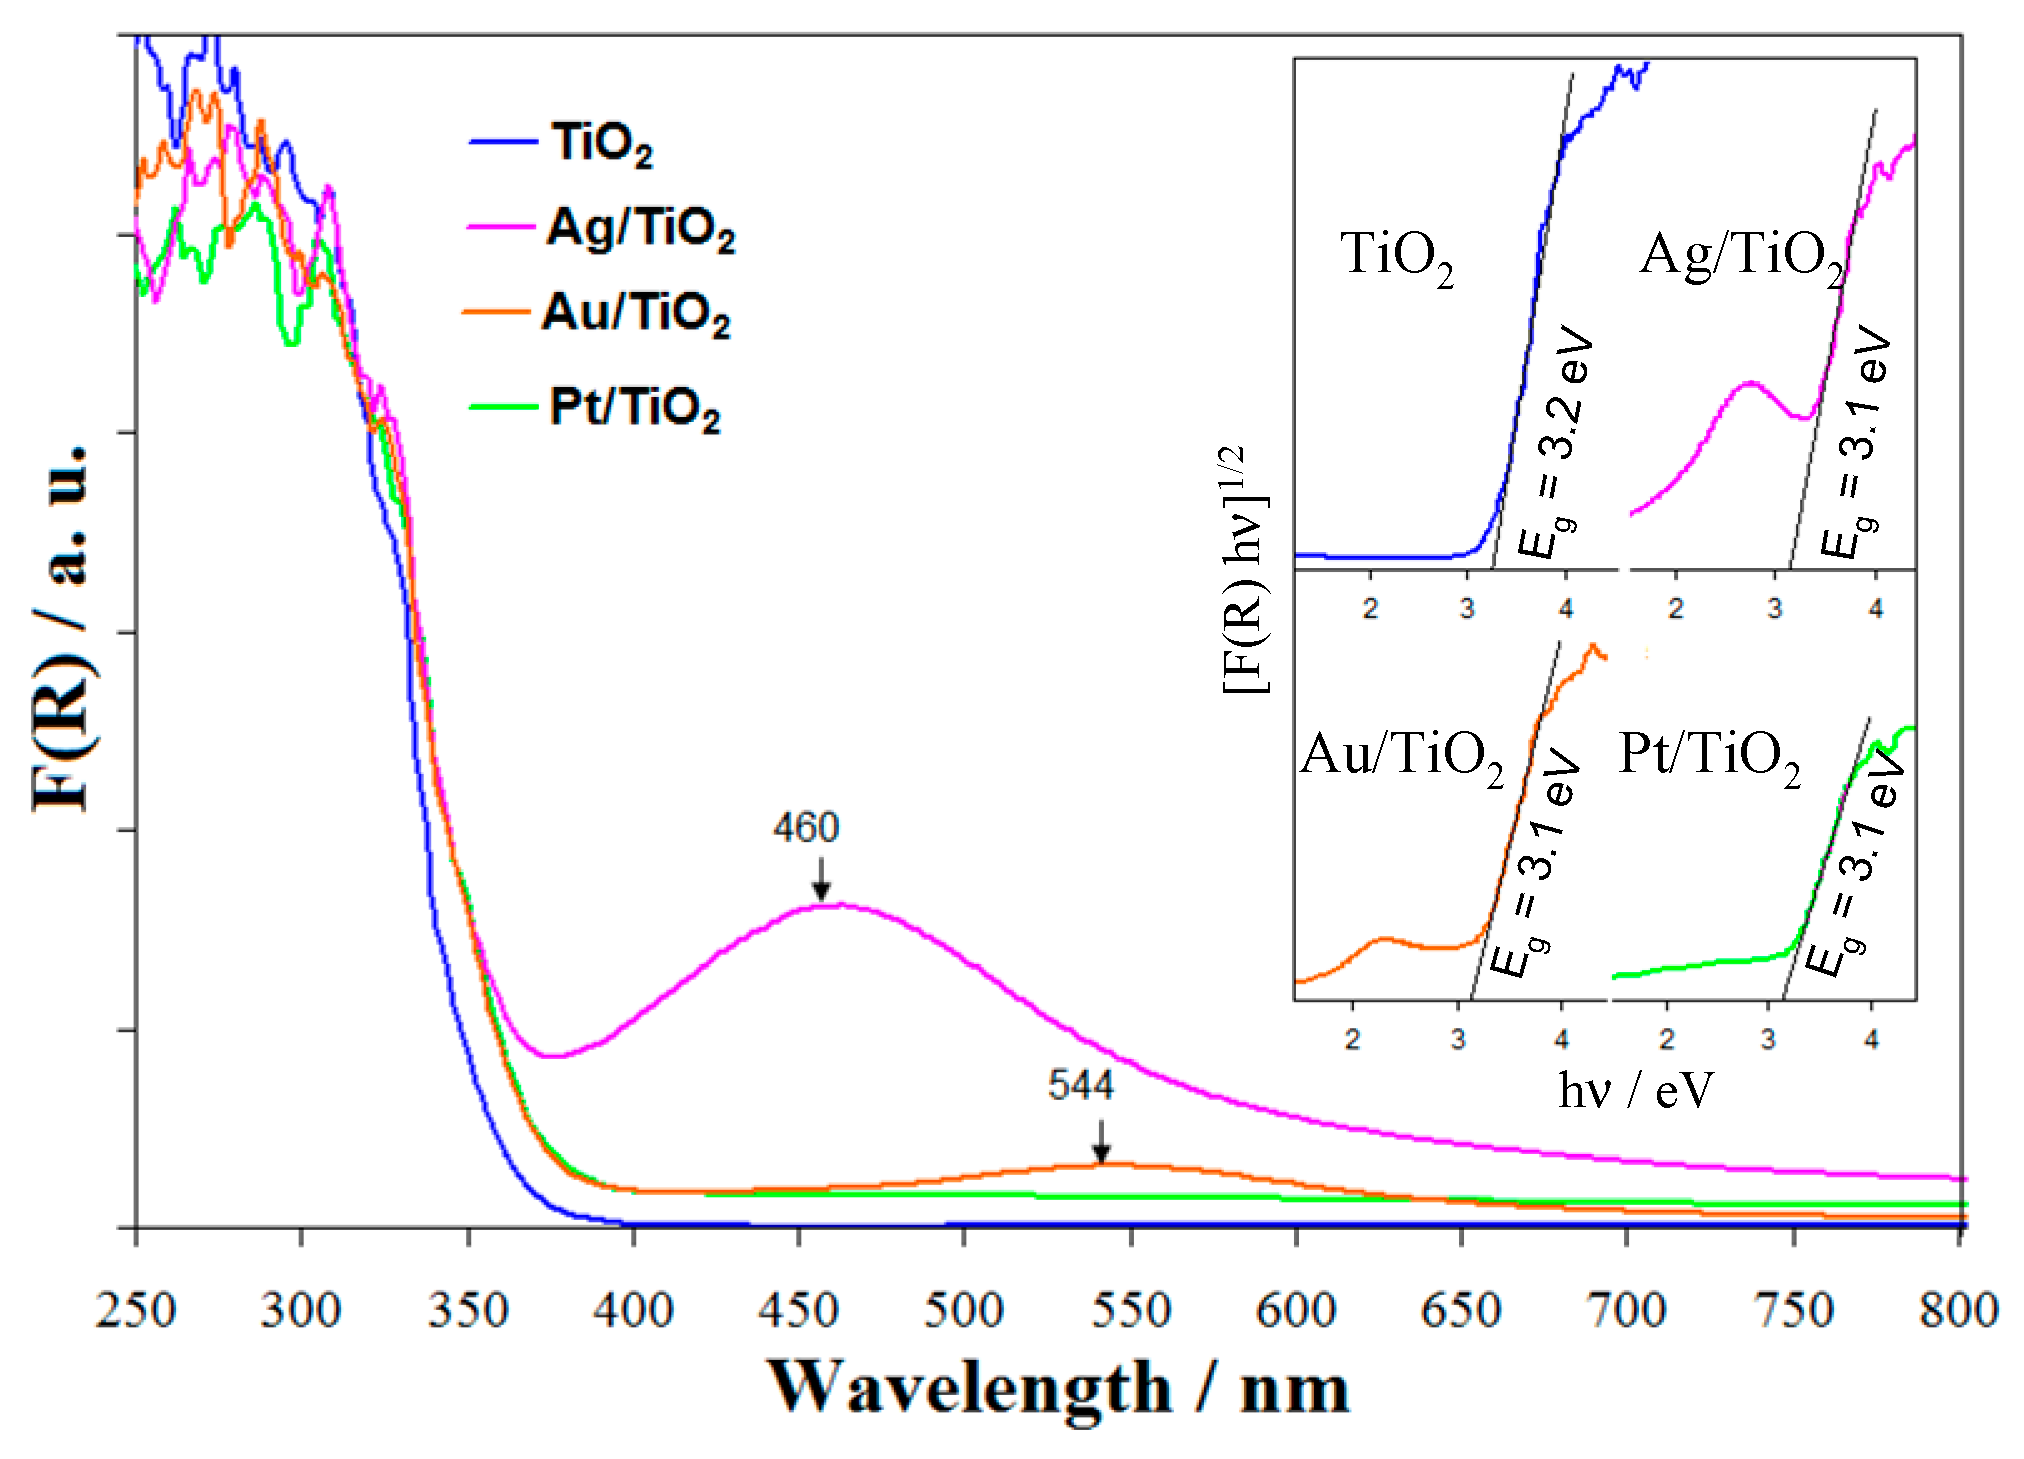
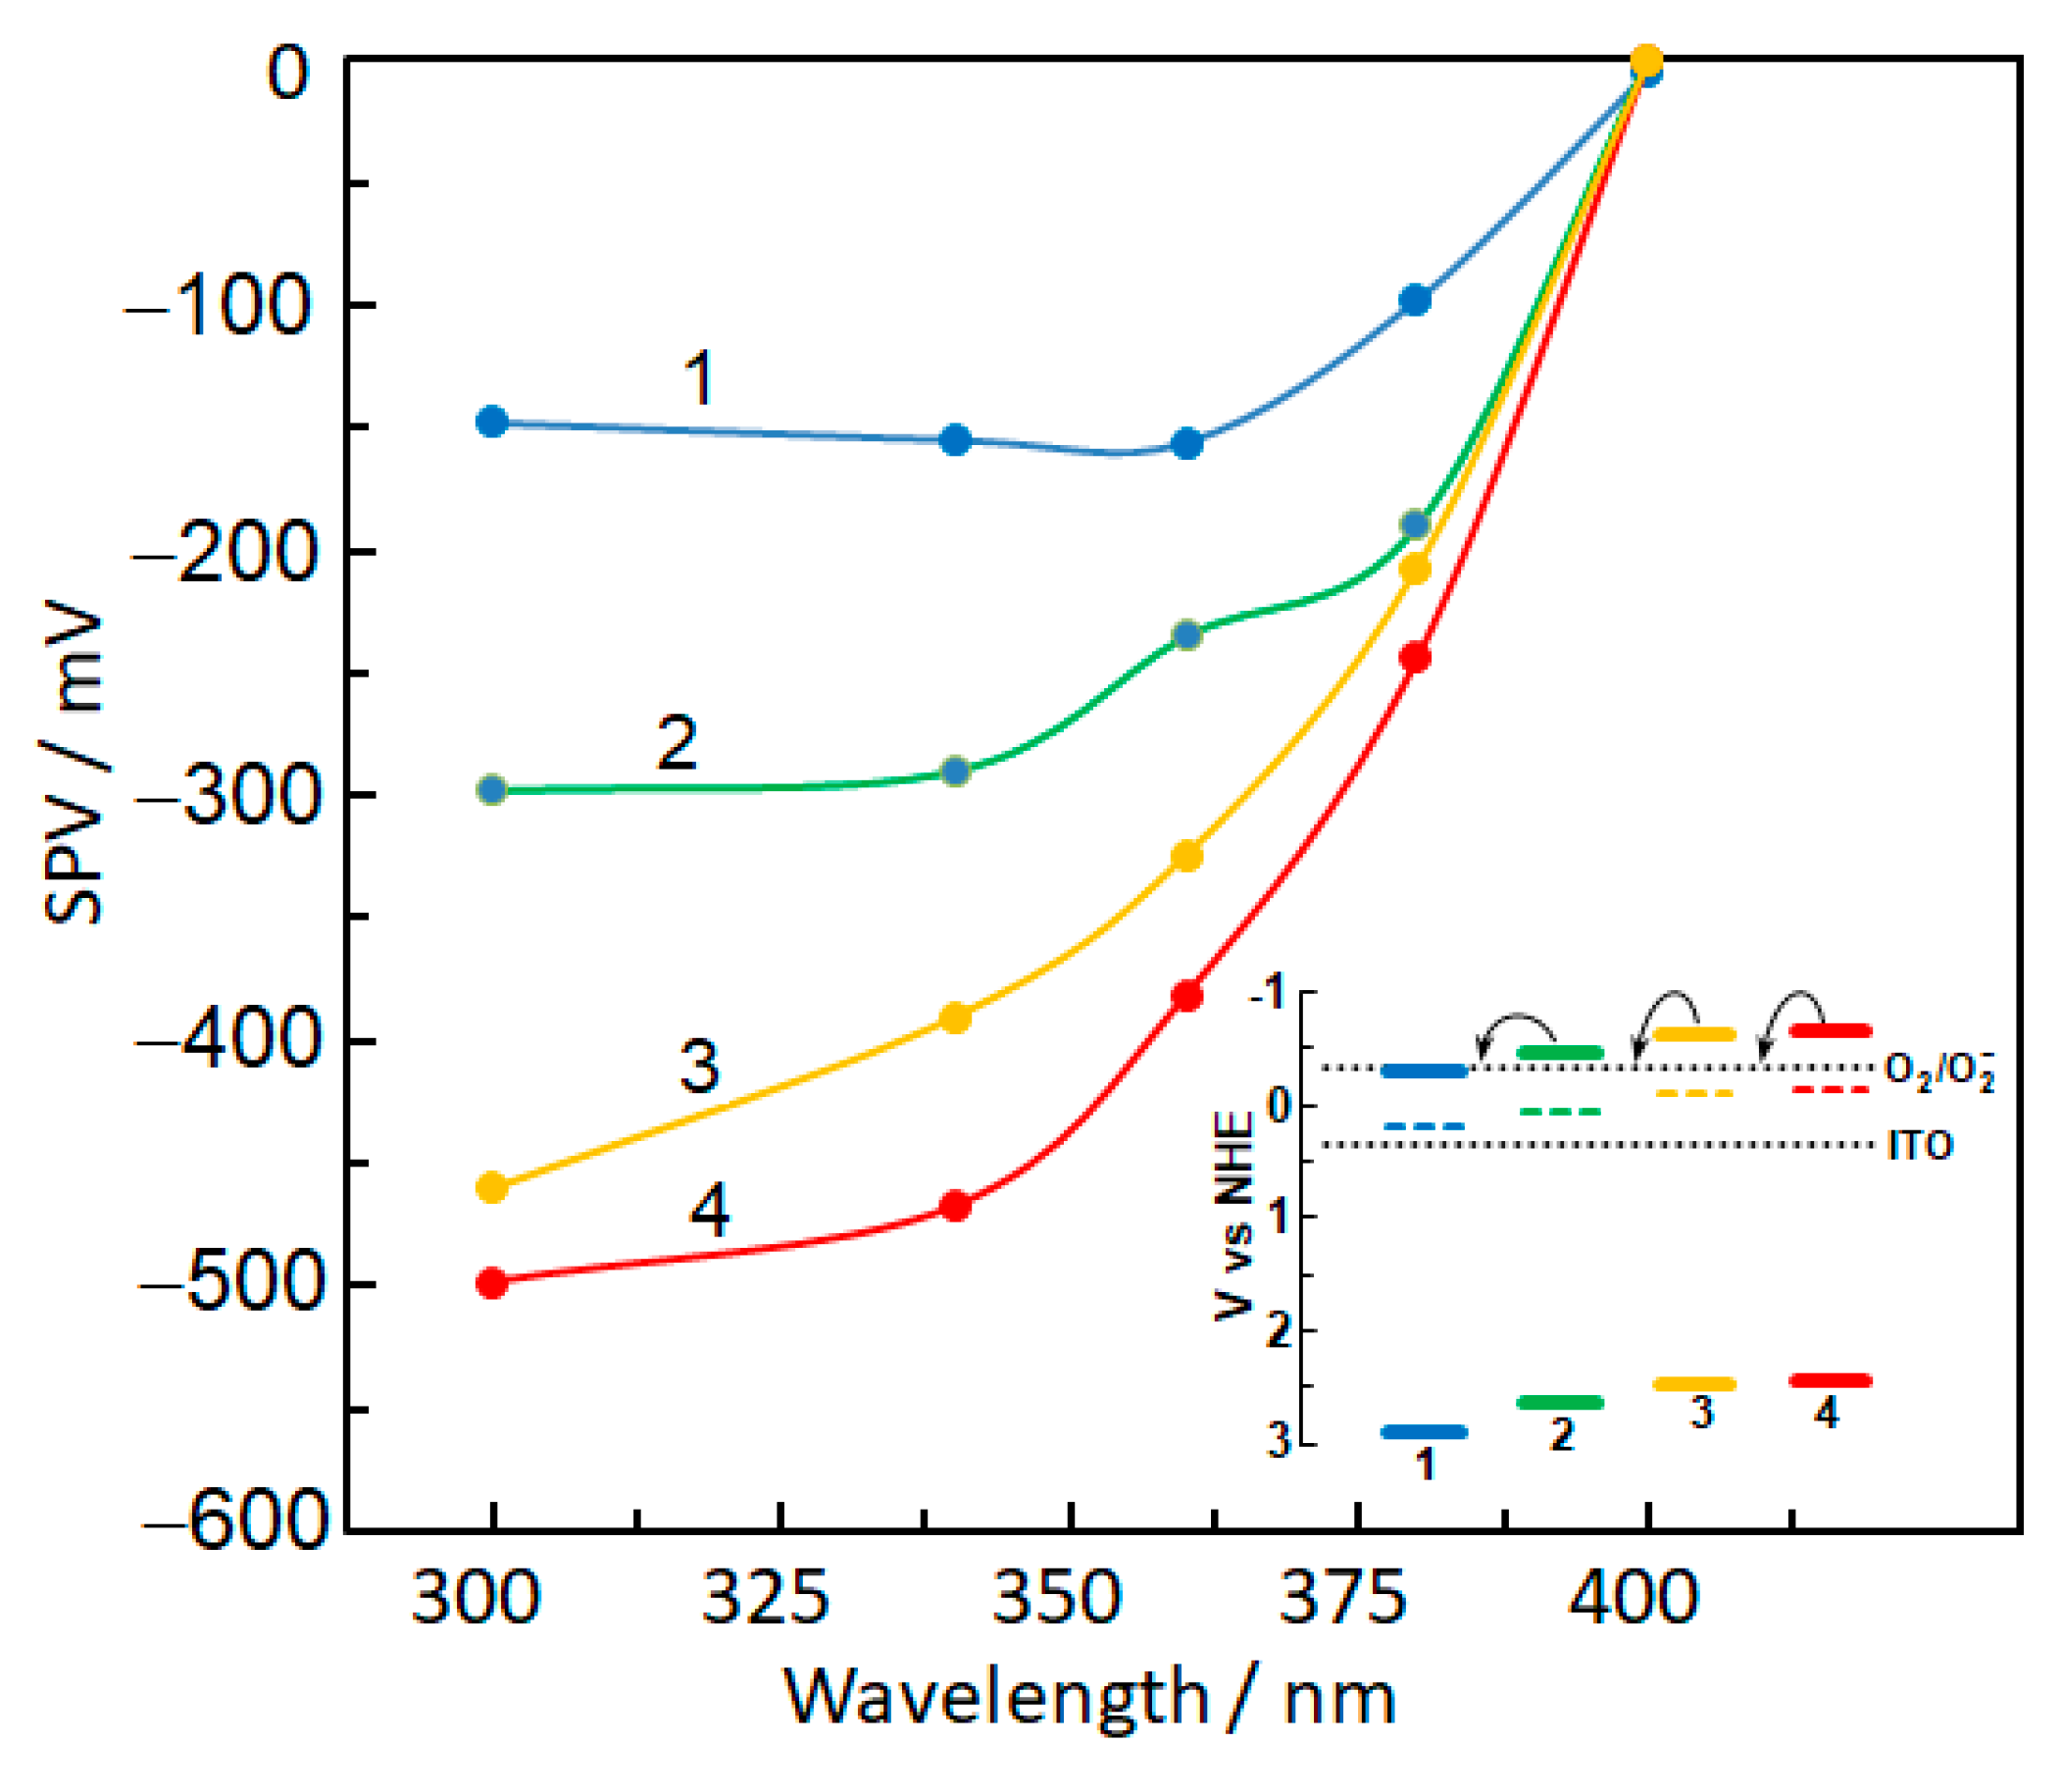
2.5. Photoelectric Properties of Bare and Metal-Modified TiO2

It is documented that the energies of valence and conduction bands of metal-modified semiconductors are shifted upward with a value depending on the height of the Shottky barrier, forcing the electrons and holes to move in different directions [14,28]. The quick charge carrier recombination, the time scale varying from μs to ns [29], is hindered, allowing the time for a charge transfer to occur at the interface. The space separation of photogenerated charge carriers inherently leads to the appearance of a certain surface photovoltage (SPV), the measurement of which can provide valuable information concerning the transfer dynamic of such carriers [30,31,32]. Thus, it was previously demonstrated that, for an n-type semiconductor, photoinduced electrons migrate towards the illuminated side of the material, giving rise to a negative SPV signal. Conversely, a positive SPV signal corresponds to a p-type semiconductor, in which case holes are directed from the surface to the bulk [33,34]. However, in both cases the surface photovoltage is wavelength dependent, being affected by the particular features of the semiconducting material, in terms of light absorption and transport of excess carriers [35,36].
The surface photovoltage was measured for each sample at several wavelengths and, as expected, SPV spectra (Figure 11) revealed in all the cases an n-type semiconducting character. Obviously, SPV signals measured under the actual experimental conditions correspond, in fact, to the potential difference between the Fermi level of ITO (indium tin oxide, + 0.35 V vs. NHE [34]) and that of the irradiated sample. Since the conduction band of non-stoichiometric TiO2 is located above its Fermi level with an average value of ca. 0.5 V [37], and by taking into account a value of around −0.33 V for the O2/O2 level [1], it appears that the formation of O2 species at the surface of the irradiated samples requires an SPV value higher than ca. −0.18 V. As the results from Figure 11 indicate, this condition is not fulfilled in the case of pristine TiO2, whereas at noble metal-modified samples O2 formation is possible, at least in principle, for irradiation wavelengths lower than 380 nm. Nevertheless, the probability for this process increases with SPV signal, in the order Pt/TiO2 > Au/TiO2 > Ag/TiO2, as schematically illustrated in the inset in Figure 11. These findings are in excellent agreement with the activity for O2 formation deduced from radical quenching experiments (see Figure 7).
To emphasize the effect of noble metal modification of the titanium oxide on the O2 generation process, chronoamperometric experiments were performed in dark, at an applied voltage of −1V. Figure 12 shows the time-variation of the oxygen reduction current, estimated as the difference between the current recorded in O2 atmosphere and that observed under Ar conditions. For easier comparison, the currents were expressed in terms of mass activity (oxygen reduction current normalized to the amount of the investigated powder sample). Pristine TiO2 exhibited negligible response (see curve 1 from Figure 12), which clearly demonstrates that the presence of noble metal particles is a prerequisite for O2 reduction. It was interesting to observe that, up to ca. 50 s, the current recorded at Au/TiO2 is higher than that at Pt/TiO2, although during further polarization the decrease in the current tends to become much slower for the latter (compare curves 3 and 4 from Figure 12). To better put into perspective the role of the noble metal nature, inset (a) in Figure 12 illustrates the decay of the oxygen reduction current on a log–log scale. Linear dependences were found in all cases, which could indicate a Langmuir adsorption kinetic control of O2 on the overall reduction process [38]. However, Pt/TiO2 exhibited the slowest current decrease, whereas for Au/TiO2 a change in slope was observed, the decline of the current becoming much steeper after only ca. 10 s, probably as result of a more sluggish adsorption of oxygen reactant species. Consequently, after about 200 s of continuous polarization, oxygen reduction current at Pt/TiO2 is more than twice as high as that observed with Au/TiO2. These results are important because they can provide an explanation for the fact that, compared to the case of Au/TiO2, the total amount of O2 produced at Pt/TiO2 is much higher (see inset in Figure 12) than would have been expected for rather small difference in terms of SPV signals between the two materials. Integration of the current responses from Figure 13 over the entire polarization time, yielded oxygen reduction charges of ca. 0.78, ca. 1.10, and ca. 1.46 mC g−1 for Ag/TiO2, Au/TiO2, and Pt/TiO2, respectively. As illustrated by the inset (b) in Figure 12, based upon these values, corresponding amounts of O2 species of 7.8, 11.4, and 15.2 nmol g−1 were estimated as being formed at the investigated active samples. The maximum amount of oxygenated compounds (HQ + BQ + 1,2 DHBz) formed over Ag/TiO2 (4.7 μmoles), Au/TiO2 (5.1 μmoles), and Pt/TiO2 (9.5 μmoles) after 1 h of reaction time (0.5 h in case of Ag/TiO2), follows closely the tendency observed in polarization measurements of O2 reduction (Figure 12). The precise correlation between quantitative polarization and photocatalytic data concerning oxygenated compounds is difficult because the formation and depletion of O2 by reaction with organic substrate(s) is a dynamic process compared to O2 adsorption on polarized surface. To build up a reliable kinetic, it is necessary to find out the rate of O2 formation in reaction conditions. However, a close relationship between formation of O2 species and mild oxidation of Ph is demonstrated by two independent experimental techniques (selective radical trapping and chronoamperometric experiments).
The corroboration of entire experimental evidences collected in this research lead to the reaction scheme presented below.
We assumed, based on experimental facts, that Ph is oxidized non-selectively by ·OH radicals directly to CO2, apparently without producing in our experimental conditions detectable long-lived intermediates. Supported noble metals are responsible for O2 reduction to O2, by mediating the transfer of photoelectron from TiO2 to adsorbed O2. The subsequent O2 reaction with Ph leads to formation of oxygenated products (HQ, BQ, 1,2 DHBz). The literature focuses mostly on reactivity O2 in organic protic and aprotic solvents and less on the reactivity in aqueous solutions [21]. However, it is recognized that, O2 disproportionates spontaneously in water, forming O2 and hydroperoxide anion (HO2). One possibility is that the reaction follows the superoxide dismutase (SOD) pathway (Equation (1)), proposed to explain the biological function of superoxide ion [39]:
2 O2 + 2H+ → O2 + H2O2
R-H + H2O2 → R-OH + H2O
Equation (2) suggests that the insertion of oxygen in ortho and para position takes place by the reaction of organic substrate with H2O2 in vicinity or on supported noble metal(s). Alternatively, the oxidation mechanism may occur through activation of Ph by transfer of photogenerated hole followed by nucleophil attack of O2 to generate organic peroxyl radicals which react further with H+ and e to form finally the hydroxylated organic compound (see Equation (3)) [40].
R-H + h+ → (R-H)+ + O2 → (R-H)-O-O· + 2 H+ + 2 e → R-OH + H2O
Actually, there is a limited knowledge on the reaction mechanism concerning the interaction in aqueous media between the adsorbed O2 and organic substrate in the presence of a catalytic metal. The published literature gives no information on the eventual role played an active metal in the above proposed reaction mechanisms.

3. Experimental

3.1. Preparation of Catalytic Materials

The photocatalysts employed in this study are TiO2, Pt/TiO2, Ag/TiO2, and Au/TiO2. High surface area TiO2, formed of nanometric sized particles, were prepared by laser pyrolysis using TiCl4 as precursor material. The detailed experiental setup and procedures are described elswhere [41]. Metal deposition was perfomed by impregnating TiO2 with H2PtCl6, AgNO3, and HAuCl4 precursors followed by reduction with NaBH4 [42]. For additional information on preparation of photocatalytic materials, see the Supplementary Information. Finally, the catalysts were dried and calcined 100 and 300 °C, respectively. The elemental composition, identification of crystalline phases and measurements of average crystallite size of photocatalytic materials was made by Energy Dispersive X-ray analysis (EDAX) and XRD, respectively. In the case of Pt/TiO2, the dispersion and average Pt particle size was estimated by CO chemisorption measurements, carried out with a ChemBet−3000 Quantachrome Instrument (Odelzhausen, Germany) equipped with a thermal conductivity detector (TCD) apparatus [43].
The values of optical band gap are estimated from the Tauc plots of diffuse reflectance UV-VIS data converted into absorbance by Kubelka–Munk function [44].
The X-ray Photoelectron Spectroscopy (XPS) measurements were performed in an ESCALAB Xi+ (Thermo SCIENTIFIC Surface Analysis, Baltimore, MD, USA) setup equipped with a multichannel hemispherical electron Analyzer (dual X-ray source) working with Al Kα radiation (hν = 1486.2 eV), using C 1s (284.8 eV) as the energy reference. The chemical compositions of surface and oxidation states were estimated from the XPS spectra by calculating the integral of each peak after subtraction of the “S-shaped” Shirley-type background using the appropriate experimental sensitivity factors.
The Photoluminescence (PL) emission spectra were recorded with Cary Eclipse Fluorescence Spectrophotometer (Agilent Technologies, Santa Clara, CA, USA) apparatus [45].
Experimental setup for photocatalytic tests. Photocatalytic experiments were conducted in a batch-type photo reactor depicted in Figure 14. The AM 1.5 (1000 W m−2) light beam of 4.5 × 4.5 cm2 was provided by a solar light simulator (Peccell-L01, Yokohama, Japan) equipped with a 150 W xenon short-arc lamp. The double-walled photoreactor was provided with optical degree quartz window. For each test, 110 mL of 50 mg∙L−1 phenol aqueous solution containing the suspended catalyst powder (0.05 g) were placed into the photoreactor, thermostated at 18 °C with a chiller. Prior tests, the suspension was kept in dark for 30 min, under stirring, to attain equilibration of experimental system. Typically, one experiment consisted of light irradiation of liquid-suspended photocatalysts for 360 min.
During tests, the Ar carrier gas was purged continuously into the phenol aqueous solution at a flow rate of 10 mL∙min−1, passed through a refrigerant cooled to −5 °C with a chiller to remove liquid vapors, and then sent to GC for on-line composition analysis at 30 min time interval with a gas chromatograph (Buck Scientific, Norwalk, CT, USA) equipped with TCD detectors. The H2 and O2 were separated and quantified on Molecular Sieve 5Å, whereas CO2 and the eventually formed C2H6 and C2H4 on the Hayesep column. Meanwhile, aliquots of 2 mL were extracted every 30 min from the liquid phase, filtered through 0.22 μm Q-Max membrane filter, and then injected for analysis into a liquid chromatograph (Alliance e2659, Waters, Milford, MA, USA). The organic components of liquid phase (phenol (Ph), hydroquinone (HQ), benzoquinone (BQ), and 1,2-dihydroxibenzene (1,2 DHBz)) were separated on HPLC column (C18–3.5 μm Symmetry, Waters), identified, and then quantified using the UV-VIS detector set at 273 nm. The mobile phase of HPLC (isocratic elution program) was a mixture of Milli-Q ultrapure water (18 MΩ) and methanol (80/20 v/v). The flow rate of the mobile phase was 1 mL∙min−1 and the sample injection volume was 2 μL.

3.2. Detection of ·OH Radicals
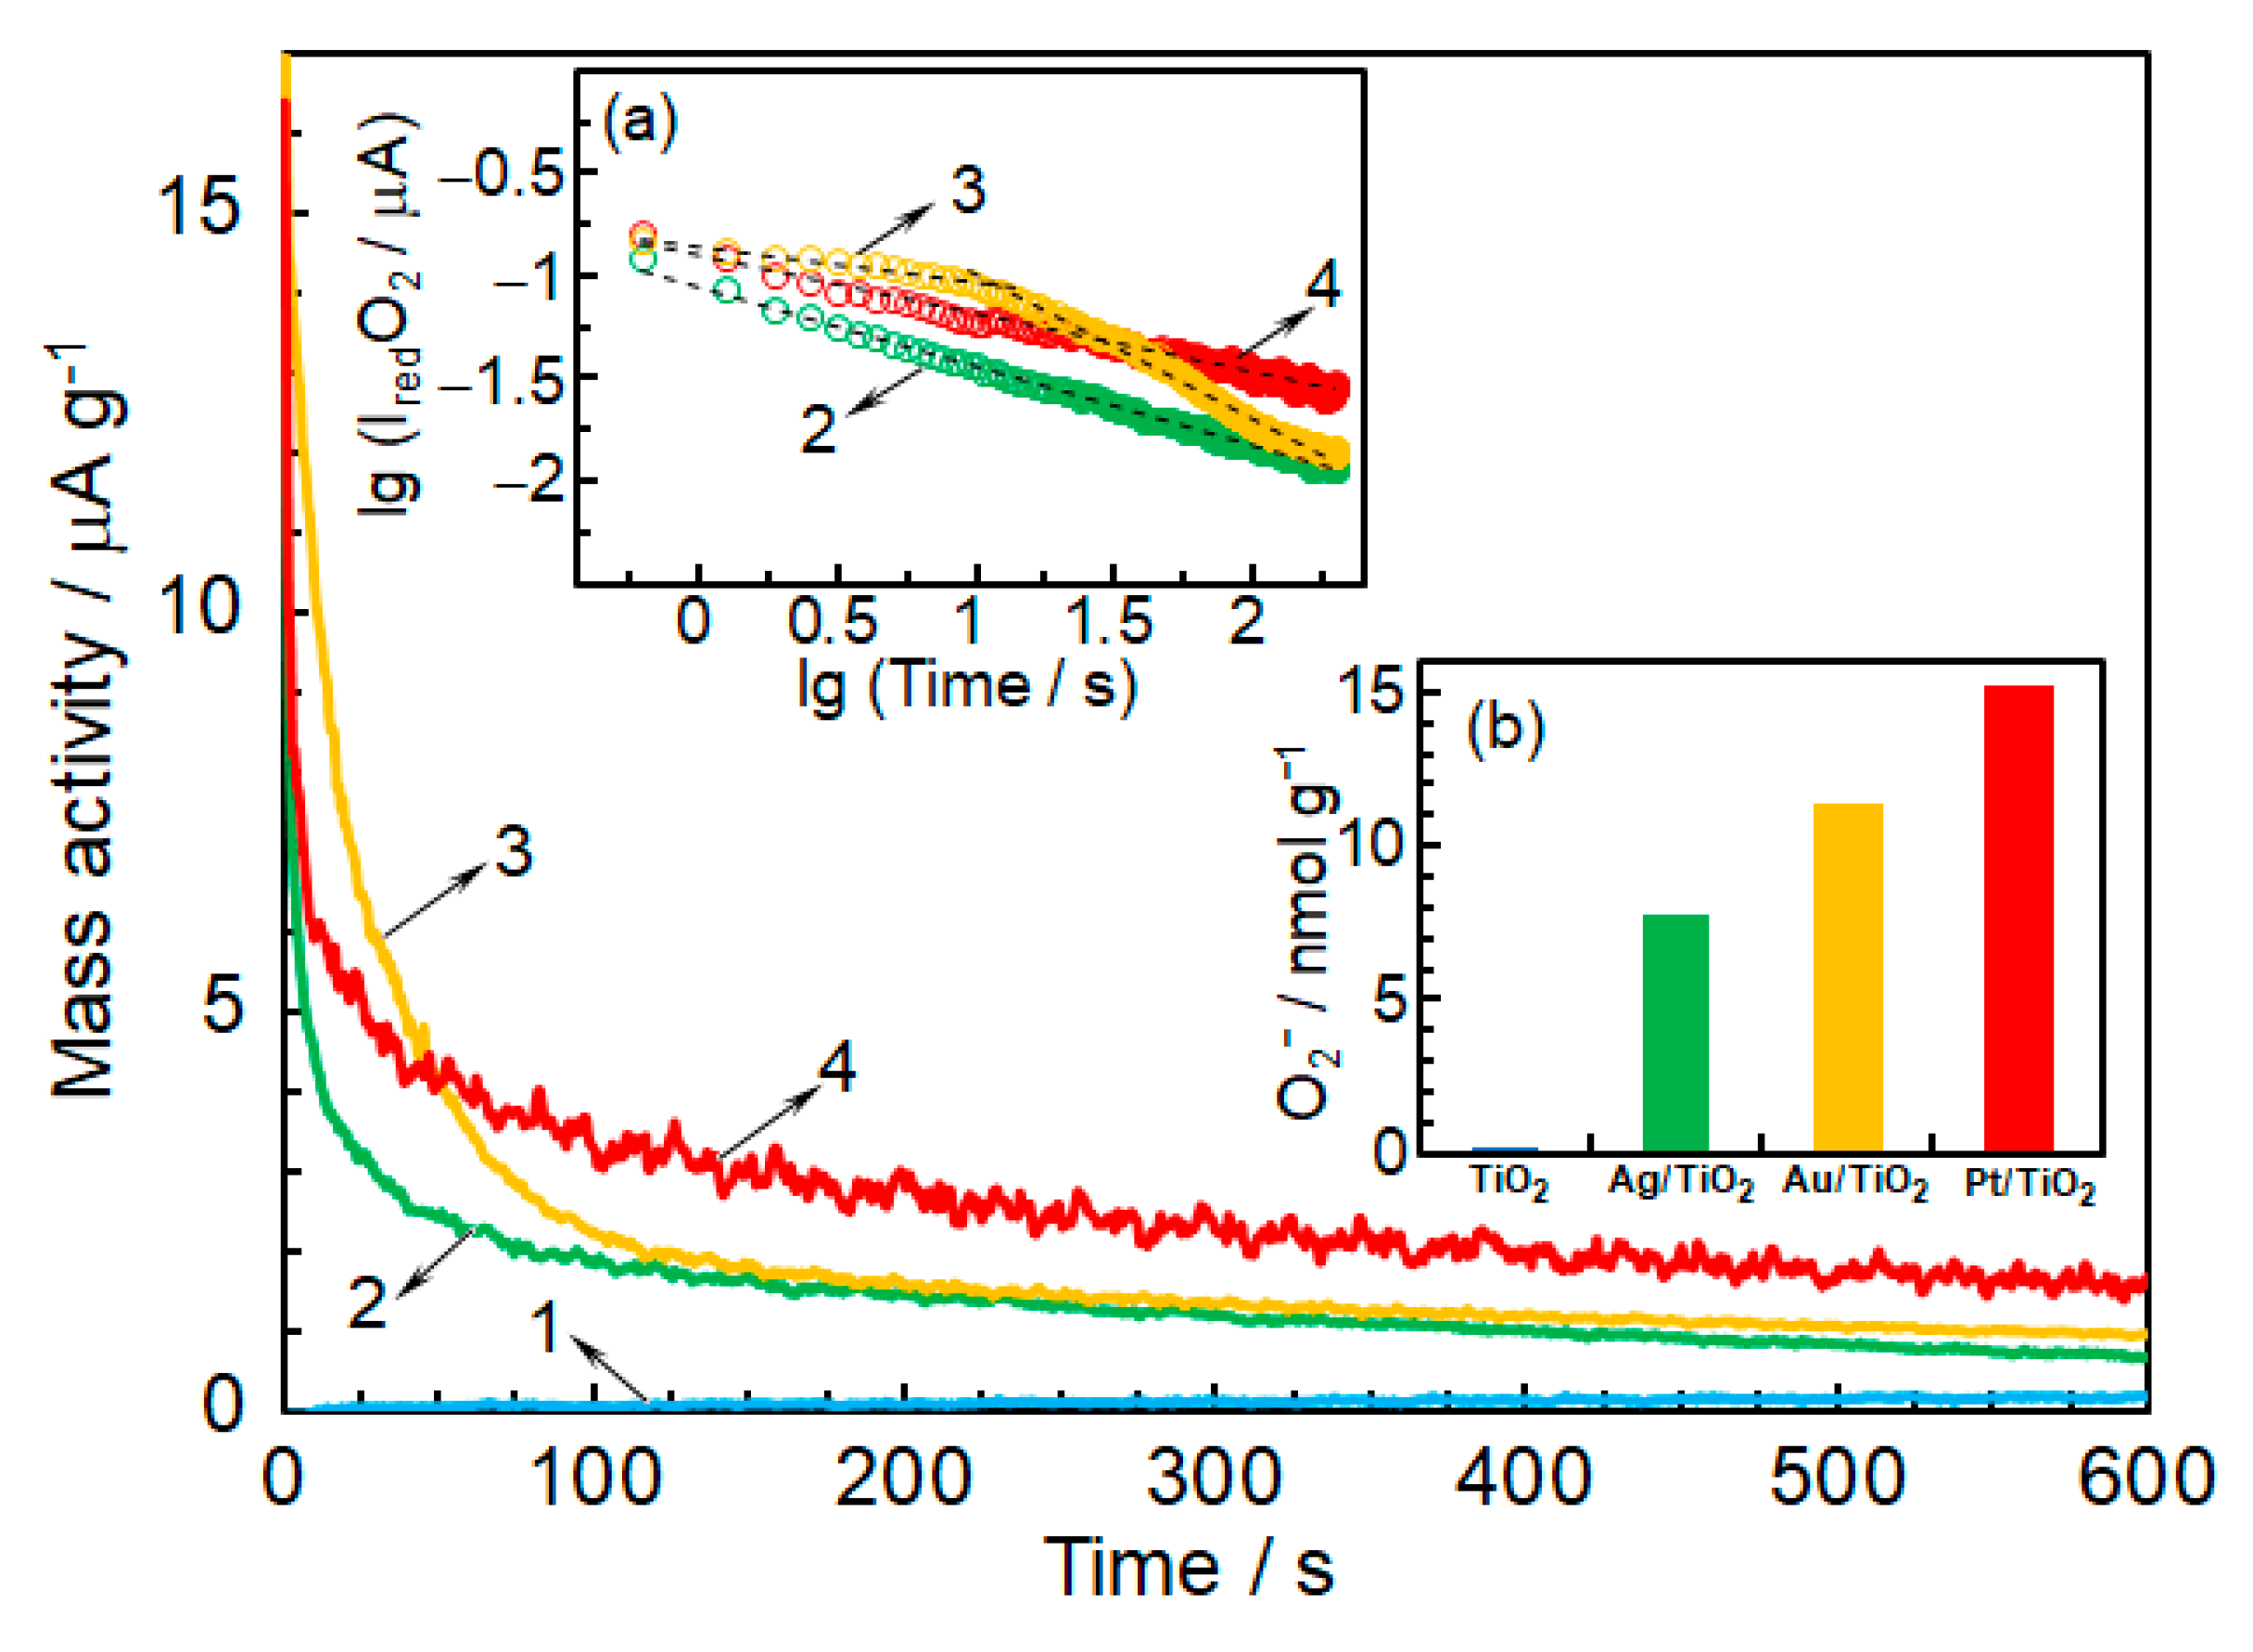
Coumarin was used as selective trap for the ·OH radicals formed under photocatalysts exposure to light [12,27]. The 0.001 g of powder catalysts were first suspended in 40 mL of 11 mM coumarin (Merck) aqueous solution and then exposed either to simulated solar light AM 1.5 or to visible light. A cut off filter (L42, Asahi Spectra, California, USA) was in the case of visible light (λ > 420 nm). Aliquots of 1.5 mL solution were sampled at 10 min time interval for fluorescence measurements (Cary Eclipse Fluorescence Spectrophotometer, Agilent Technologies, Santa Clara, CA, USA) to monitor umbelliferone, formed by reaction between coumarin and ·OH radicals. Umbelliferone gives a specific fluorescence peak at ≈ 450 nm for λexc = 330 nm.

3.3. Detection of O2

In a typical experiment, 0.004g of catalyst was suspended into 4 mL of 3 mM solution of XTT sodium salt (2, 3-bis(2-methoxi-4-nitro-5sulfophenyl)-2H-tetrazolium-5-carboxanilide) (Alfa Aesar). Then, the samples were exposed to simulated solar or visible light for 10, 20, and 30 min to induce the formation of O2. XTT reduction by O2 produces XTT-formazan, which can be evidenced by a broad absorption peak at ≈ 470 nm [12,44]. The measurements were carried out with UV-VIS spectrophotometer (Analytik Jena Specord, 200 Plus, Jena, Germany).
For the surface photovoltage (SPV) measurements, a sandwich-like photovoltaic cell was built, according to a method previously described in the literature [30]. Briefly, a small amount (ca. 12 mg) of pristine or metal-modified titanium oxide was firmly pressed in between two ITO electrodes, to obtain a confined film composed of the investigated powder sample. The upper face of the cell was irradiated (under chopped conditions) with a monochromatic light (the light beam of 300 W Xe lamp of Asahi Spectra MAX-350 (Tokyo, Japan) light source was passed through high transmission bandpass filters with FWHM = 11 nm) and the SPV signal was measured by means of a computer-driven Keithley 2425 source-meter (Cleveland, Ohio, USA). The energy of the monochromated light beam was measured with Newport optical power meter (Model 1830-R, Irvine, CA, USA) equipped a calibrated photodiode detector (Newport, 918D series). For the chronoamperometric experiments, the same cell was used and the measurements were carried out in an air-tight reactor by means of a PAR 273A (Princeton Applied Research Walpole, MA, USA) potentiostat, both under pure O2 and Ar atmospheres.

4. Conclusions

This study gives a comprehensive view on the light-initiated photocatalytic oxidation pathways of a model organic substrate with an aromatic ring (Ph) over bare and noble metal-loaded TiO2. The analysis of complex phenomena associated with photocatalytic reaction focuses on particular roles played by oxide support and by noble metals on light absorption, charge separation, formation of ROS (·OH and O2), as well as on reaction mechanism of oxidative conversion of Ph.
We have found out that TiO2 support generates only ·OH as ROS when it is exposed to light with λ < 400 nm. These radicals are responsible for deep oxidation of Ph directly to CO2, apparently without the formation of detectable long-lived intermediates. The formation of ·OH, and consequently the photocatalyst activity, cease in visible light domain.
Deposited noble metals (Ag, Au, Pt) (i) adsorb the visible light (SPR phenomenon), (ii) assist effectively the charge separation, and the (iii) O2 reduction to O2. The deposited metal raises the Fermi level of TiO2 allowing the reduction of adsorbed O2 to O2. The O2 produced on metals oxidizes mildly Ph to oxygenated products (HQ, BQ, 1,2 DHBz). In a parallel process, ·OH radicals produced by TiO2 support mineralize Ph directly to CO2 by fast reaction sequences. At this stage, it is not clear the precise function of metals in the reaction between organic substrate (Ph) and O2. With the exception of Au, the hot electrons produced by SPR at λ > 400 nm are not active to produce measurable amounts of O2.
This study demonstrates, by two complementary experimental methods (radical quenching and photo electrochemical measurements), that production of ·OH and O2 over the investigated catalysts correlates well with the activity showed for oxidative conversion of Ph. According to our data, the oxidation of Ph by photo charges is intermediated by ROS.
In light of our results, the bare TiO2 suits the best the photocatalytic depollution purposes, where the aim is to mineralize the harmful organic substrate to CO2. When noble metals are deposited on TiO2, intermediate oxygenated compounds are formed by mild oxidation of organic substrate(s) by O2, via photo induced electron transfer from metals to O2. Thus, from a depollution point of view, the modification of TiO2 with noble metals is not beneficial. In addition, the metal-modified photocatalyst in powder form dispersed in water can be harmful to the environment. Same assessment can be made for photo water splitting, where the consumption of photo-generated electron by adsorbed O2 hinders H+ reduction. On the other hand, should be the practical aim of valuable oxygenated compounds synthesis by mild selective oxidation of organic compounds, the use of catalytic metals is mandatory.

Supplementary Materials

The following are available online at https://www.mdpi.com/article/10.3390/catal11040487/s1, Figure S1: High resolution XPS spectra of TiO2 in O1s and Ti2p binding energy regions, Figure S2: High resolution XPS spectra of Ag/TiO2 in O 1s, Ti 2p and Ag 3d binding energy regions, Figure S3: High resolution XPS spectra of Au/TiO2 in O 1s, Ti 2p and Au 4f binding energy regions, Figure S4: S4 High resolution XPS spectra of Pt/TiO2 in O 1s, Ti 2p and Pt 4f binding energy regions, Figure S5: Comparative XRD difraction patterns of simple and metal-modified TiO2. •-anatase, +-rutile, Table S1: Elemental composition obtained from EDAX analysis of simple and metal -modified TiO2, Table S2: XPS survey of elemental composition of simple and noble metal-modified TiO2, Table S3: Chemical state of titanium in the investigated materials, Table S4: Crystalline phase composition and average crystallite size of simple and metal-modified TiO2.

Author Contributions

Conceptualization, I.B., Investigation, A.S., C.A., F.P., M.R., A.V., T.S., M.S., C.F., C.N.M., V.S.T., N.S., M.Z. and I.B., Methodology, A.S., C.A., F.P., M.R., A.V., T.S., M.S., C.F., C.N.M., V.S.T., N.S., M.Z. and I.B., Resources, A.S., C.A., F.P., M.R., A.V., T.S., M.S., C.F., C.N.M., V.S.T., N.S., M.Z. and I.B., Supervision, N.S. and I.B., Visualization, I.B., Writing—original draft, N.S. and I.B., Writing—review & editing, N.S. and I.B. All authors have read and agreed to the published version of the manuscript.

Funding

This research received no external funding.

Acknowledgments

This work was supported by Grants 46 PCCDI/2018 MALASENT.

Conflicts of Interest

The authors declare no conflict of interest.

References

  1. Li, X.; Xie, J.; Jiang, C.; Yu, J.; Zhang, P. Review on design and evaluation of environmental photocatalysts. Front. Environ. Sci. Eng. 2018, 12, 14. [Google Scholar] [CrossRef]
  2. Paz, Y. Application of TiO2 photocatalysis for air treatment: Patents’ overview. Appl. Catal. B 2010, 99, 448–460. [Google Scholar] [CrossRef]
  3. Shaham-Waldmann, N.; Paz, Y. Away from TiO2: A critical minireview on the developing of new photocatalysts for degradation of contaminants in water. Mat. Sci. Semicond. Process. 2016, 42, 72–80. [Google Scholar] [CrossRef]
  4. Di Paola, A.; García-López, E.; Marcì, G.; Palmisano, L. A survey of photocatalytic materials for environmental remediation. J. Hazard. Mater. 2012, 211, 3–29. [Google Scholar] [CrossRef]
  5. Chen, L.; Tang, J.; Song, L.N.; Chen, P.; He, J.; Au, C.T.; Yin, S.F. Heterogeneous photocatalysis for selective oxidation of alcohols and hydrocarbons. Appl. Catal. B 2019, 242, 379–388. [Google Scholar] [CrossRef]
  6. Meng, S.; Ye, X.; Zhang, J.; Fu, X.; Chen, S.; Chen, S. Effective use of photogenerated electrons and holes in a system: Photocatalytic selective oxidation of aromatic alcohols to aldehydes and hydrogen production. J. Catal. 2018, 367, 159–170. [Google Scholar] [CrossRef]
  7. Kou, J.; Lu, C.; Wang, J.; Chen, Y.; Xu, Z.; Varma, R.S. Selectivity Enhancement in Heterogeneous Photocatalytic Transformations. Chem. Rev. 2017, 117, 1445–1514. [Google Scholar] [CrossRef] [PubMed] [Green Version]
  8. Hou, W.; Cronin, S.B. A Review of Surface Plasmon Resonance-Enhanced Photocatalysis. Adv. Funct. Mater. 2013, 23, 1612–1619. [Google Scholar] [CrossRef]
  9. Carp, O.; Huisman, C.L.; Reller, A. Photoinduced reactivity of titanium dioxide. Progress Solid State Chem. 2004, 32, 33–177. [Google Scholar] [CrossRef]
  10. Fujishima, A.; Rao, T.N.; Tryk, D.A. Titanium Dioxide Photocatalysis. J. Photochem. Photobiol. C Photochem. Rev. 2000, 1, 1–21. [Google Scholar] [CrossRef]
  11. Linsebigler, A.L.; Lu, G.; Yates, J.T., Jr. Photocatalysis on TiO2 Surfaces: Principles, Mechanisms and Selected Results. Chem. Rev. 1995, 95, 735–758. [Google Scholar] [CrossRef]
  12. Anastasescu, C.; Negrila, C.; Angelescu, D.G.; Atkinson, I.; Anastasescu, M.; Spataru, N.; Zaharescu, M.; Balint, I. Particularities of photocatalysis and formation of reactive oxygen species on insulators and semiconductors: Cases of SiO2, TiO2 and their composite SiO2-TiO2. Catal. Sci. Technol. 2018, 8, 5657–5668. [Google Scholar] [CrossRef]
  13. Fujishima, A.; Zhang, X.; Tryk, D.A. Heterogeneous photocatalysis: From water photolysis to applications in environmental cleanup. Int. J. Hydrog. Energy 2007, 32, 2664–2672. [Google Scholar] [CrossRef]
  14. Bumajdad, A.; Madkour, M. Understanding the superior photocatalytic activity of noble metals modified titania under UV and visible light irradiation. Phys. Chem. Chem. Phys. 2014, 16, 7146–7158. [Google Scholar] [CrossRef] [PubMed]
  15. Yang, D.; Lee, S.W. Photocatalytic activity of Ag, Au-Deposited TiO2 nanoparticles prepared by sonochemical reduction method. Surface Rev. Lett. 2010, 17, 21–26. [Google Scholar] [CrossRef]
  16. Tian, Y.; Tatsuma, T. Mechanisms and Applications of Plasmon-Induced Charge Separation at TiO2 Films Loaded with Gold Nanoparticles. J. Am. Chem. Soc. 2005, 127, 7632–7637. [Google Scholar] [CrossRef]
  17. Tanaka, A.; Sakaguchi, S.; Hashimoto, K.; Kominami, H. Preparation of Au/TiO2 with Metal Cocatalysts Exhibiting Strong Surface Plasmon Resonance Effective for Photoinduced Hydrogen Formation under Irradiation of Visible Light. ACS Catal. 2013, 3, 79–85. [Google Scholar] [CrossRef]
  18. Zhai, W.; Xue, S.; Zhu, A.; Luo, Y.; Tian, Y. Plasmon-Driven Selective Oxidation of Aromatic Alcohols to Aldehydes in Water with Recyclable Pt/TiO2 Nanocomposites. Chem. Cat. Chem. 2011, 3, 127–130. [Google Scholar] [CrossRef]
  19. Osterloh, F.E. Nanoscale Effects in Water Splitting Photocatalysis. Top. Curr. Chem. 2016, 371, 105–142. [Google Scholar] [CrossRef] [Green Version]
  20. Yoffe, A.D. Semiconductor quantum dots and related systems: Electronic, optical, luminescence and related properties of low dimensional systems. Adv. Phys. 2001, 50, 1–208. [Google Scholar] [CrossRef]
  21. Hayyan, M.; Hashim, M.A.; AlNashef, I.M. Superoxide Ion: Generation and Chemical Implications. Chem. Rev. 2016, 116, 3029–3085. [Google Scholar] [CrossRef] [Green Version]
  22. Suh, M.; Bagus, P.S.; Pak, S.; Rosynek, M.P.; Lunsford, J.H. Reactions of Hydroxyl Radicals on Titania, Silica, Alumina and Gold Surfaces. J. Phys. Chem. B 2000, 104, 2736–2742. [Google Scholar] [CrossRef]
  23. Goto, H.; Hanada, Y.; Ohno, T.; Matsumura, M. Quantitative Analysis of Superoxide Ion and Hydrogen Peroxide Produced from Molecular Oxygen on Photoirradiated TiO2 Particles. J. Catal. 2004, 225, 223–229. [Google Scholar] [CrossRef]
  24. Zhu, S.; Liang, S.; Gu, Q.; Xie, L.; Wang, J.; Ding, Z.; Liu, P. Effect of Au supported TiO2 with dominant exposed facets on the visible-light photocatalytic activity. Appl. Catal. B 2012, 119, 146–155. [Google Scholar] [CrossRef]
  25. Watanabe, K.; Menzel, D.; Nilius, N.; Freund, H.J. Photochemistry on Metal Nanoparticles. Chem. Rev. 2006, 106, 4301–4320. [Google Scholar] [CrossRef]
  26. Ueno, K.; Misawa, H. Surface plasmon-enhanced photochemical reactions. J. Photochem. Photobiol. C Photochem. Rev. 2013, 15, 31–52. [Google Scholar] [CrossRef]
  27. Nosaka, Y.; Nosaka, A.Y. Generation and Detection of Reactive Oxygen Species in Photocatalysis. Chem. Rev. 2017, 117, 11302–11336. [Google Scholar] [CrossRef]
  28. Tung, R.T. Recent Advances in Schottky Barrier Concepts. Mat. Sci. Eng. R 2001, 35, 1–138. [Google Scholar] [CrossRef]
  29. Henderson, M.A. A surface science perspective on TiO2 photocatalysis. Surface Sci. Rep. 2011, 66, 185–297. [Google Scholar] [CrossRef]
  30. Fan, H.; Jiang, T.; Li, H.; Wang, D.; Wang, L.; Zhai, J.; He, D.; Wang, P.; Xie, T. Effect of BiVO4 Crystalline Phases on the Photoinduced Carriers Behavior and Photocatalytic Activity. J. Phys. Chem. C 2012, 116, 2425–2430. [Google Scholar] [CrossRef]
  31. Zhang, Y.; Xie, T.; Jiang, T.; Wei, X.; Pang, S.; Wang, X.; Wang, D. Surface photovoltage characterization of a ZnO nanowire array/CdS quantum dot heterogeneous film and its application for photovoltaic devices. Nanotechnology 2009, 20, 155707. [Google Scholar] [CrossRef] [PubMed]
  32. Wu, P.; Wang, J.; Zhao, J.; Guo, L.; Osterloh, F.E. Structure defects in g-C3N4 limit visible light driven hydrogen evolution and photovoltage. J. Mat. Chem. A 2014, 2, 20338–20344. [Google Scholar] [CrossRef]
  33. Duzhko, V.V.; Timoshenko, V.; Koch, F.; Dittrich, T. Photovoltage in nanocrystalline porous TiO2. Phys. Rev. B 2001, 64, 075204. [Google Scholar] [CrossRef]
  34. Osterloh, F.E.; Holmes, M.A.; Zhao, J.; Chang, L.; Kawula, S.; Roehling, J.D.; Moule, A.J. P3HT:PCBM Bulk-Heterojunctions: Observing Interfacial and Charge Transfer States with Surface Photovoltage Spectroscopy. J. Phys. Chem. C 2014, 118, 14723–14731. [Google Scholar] [CrossRef] [Green Version]
  35. Kronik, L.; Shapira, Y. Surface photovoltage spectroscopy of semiconductor structures: At the crossroads of physics, chemistry and electrical engineering. Surf. Interface Anal. 2001, 31, 954–965. [Google Scholar] [CrossRef]
  36. Frame, F.A.; Townsend, T.K.; Chamousis, R.L.; Sabio, E.M.; Dittrich, T.; Browning, N.D.; Osterloh, F.E. Photocatalytic Water Oxidation with Nonsensitizied IrO2 Nanocrystals under Visible and UV Light. J. Am. Chem. Soc. 2011, 133, 7264–7267. [Google Scholar] [CrossRef]
  37. Shi, F.; Baker, L.R.; Hervier, A.; Somorjai, G.A.; Komvopoulos, K. Tuning the electronic structure of titanium oxide support to enhance the electrochemical activity of platinum nanoparticles. Nano Lett. 2013, 13, 4469–4474. [Google Scholar] [CrossRef]
  38. Mirceski, V.; Guziejewski, D.; Bozem, M.; Bogeski, I. Characterizing electrode reactions by multisampling the current in square-wave voltammetry. Electrochim. Acta 2016, 213, 520–528. [Google Scholar] [CrossRef] [Green Version]
  39. Sawyer, D.T.; Valentine, J.S. How super is superoxide? Acc. Chem. Res. 1981, 14, 393–400. [Google Scholar] [CrossRef]
  40. TBui, D.; Kimura, A.; Ikeda, S.; Matsumura, M. Determination of Oxygen Sources for Oxidation of Benzene on TiO2 Photocatalysts in Aqueous Solutions Containing Molecular Oxygen. J. Am. Chem. Soc. 2010, 132, 8453–8458. [Google Scholar] [CrossRef]
  41. Ilie, A.G.; Scarisoreanu, M.; Dutu, E.; Dumitrache, F.; Banici, A.M.; Fleaca, C.T.; Vasile, E.; Mihailescu, I. Study of phase development and thermal stability in as synthesized TiO2 nanoparticles by laser pyrolysis: Ethylene uptake and oxygen enrichment. Appl. Surf. Sci. 2018, 427, 798–806. [Google Scholar] [CrossRef]
  42. Gupta, N.; Bansal, P.; Pal, B. Metal ion-TiO2 nanocomposites for the selective photooxidation of benzene to phenol and cycloalkanol to cycloalkanone. J. Experim. Nanosci. 2015, 10, 148–160. [Google Scholar] [CrossRef] [Green Version]
  43. State, R.; Scurtu, M.; Miyazaki, A.; Papa, F.; Atkinson, I.; Munteanu, C.; Balint, I. Influence of metal-support interaction on nitrate hydrogenation over Rh and Rh-Cu nanoparticles dispersed on Al2O3 and TiO2 supports. Arab. J. Chem. 2017, 10, 975–984. [Google Scholar] [CrossRef]
  44. Preda, S.; Anastasescu, C.; Balint, I.; Umek, P.; Sluban, M.; Negrila, C.C.; Angelescu, D.G.; Bratan, V.; Rusu, A.; Zaharescu, M. Charge separation and ROS generation on tubular sodium titanates exposed to simulated solar light. Appl. Surf. Sci. 2019, 470, 1053–1063. [Google Scholar] [CrossRef]
  45. Anastasescu, C.; Zaharescu, M.; Angelescu, D.; Munteanu, C.; Bratan, V.; Spataru, T.; Negrila, C.; Spataru, N.; Balint, I. Defect-related light absorption, photoluminescence and photocatalytic activity of SiO2 with tubular morphology. Solar Energ. Mater. Solar Cells 2017, 159, 325–335. [Google Scholar] [CrossRef]
Figure 1. Suggestive TEM images of metal-loaded TiO2 samples: Pt/TiO2 (A), Ag/TiO2 (B) and Au/TiO2 (C).
Catalysts 11 00487 g001
Figure 2. Comparative F(R) spectra and indirect optical band gap derived from Tauc representation (inset) for investigated photocatalysts.
Catalysts 11 00487 g002
Figure 3. Solar light-driven phenol oxidative conversion to oxygenated compounds (HQ (A), BQ (B), and 1,2 DHBz (C)), CO2 (D) and to H2 (E) over bare and metal modified TiO2 synthesized by laser pyrolysis. Experimental conditions: 0.05 g suspended in 110 mL of 50 mg∙L−1 phenol aqueous solution, reaction temperature 18 °C, simulated solar light AM 1.5.
Catalysts 11 00487 g003aCatalysts 11 00487 g003b
Figure 4. Time course of selectivity for phenol photocatalytic oxidative conversion to HQ (A), BQ (B), 1,2 DHBz (C), CO2 (D) as well as overal selectivity to oxygenates (E) over bare and metal-modified TiO2 exposed to simulated solar light.
Catalysts 11 00487 g004
Figure 5. Comparative PL emission spectra of bare and metal-loaded TiO2. Experimental conditions: 0.5 mg catalysts suspended by ultrasonication in 3 mL of water.
Catalysts 11 00487 g005
Figure 6. Time course of umbelliferone PL (A) and evolution in time of ·OH concentration (B) over the investigated photocatalysts exposed to solar light, as well as the relative amounts of CO2 and ·OH formed over the photocatalysts exposed to simulated solar light for 6 h (C). The formation of ·OH radical was evidenced by observing PL peak of umbelliferone at ≈ 450 nm for λexc = 330 nm (coumarin traps selectively ·OH to form umbelliferone). Inset of figure B represents the calibration curve obtained by plotting the PL response against umbelliferone concentration. Experimental conditions: 1 mg catalyst was dispersed by ultrasonication in 40 mL of 11 mM coumarin solution and then exposed to simulated solar light AM 1.5.
Catalysts 11 00487 g006
Figure 7. Time course of formazan absorbance (A), formed in the reaction between O2 and XTT probe molecule, and evolution of O2 relative concentration over the catalysts exposed to solar light (B). Relative amounts of oxygenates (HQ + BQ) measured at end of reaction in comparison with that of O2 (C). Experimental conditions: 4 mg of catalysts, dispersed into 3 mL of XTT sodium salt solution, were exposed to simulated solar light to induce the formation formazan, which was put in evidence by the UV-VIS absorption peak at ≈ 470 nm.
Catalysts 11 00487 g007
Figure 8. Coumarin formation survey, indicative of ·OH radical formation, upon exposure to visible light (λ > 420 nm) of catalysts dispersed in aqueous media.
Catalysts 11 00487 g008
Figure 9. Survey of O2 production, by monitoring formazan specific absorbance, over the catalysts exposed to visible light (λ > 420 nm).
Catalysts 11 00487 g009
Figure 10. The survey of ·OH formation in low (trace 0.2 mM Ph) and high Ph concentration (trace 2 mM Ph) over photocatalyst exposed to simulated solar light for 30 min. Experimental conditions: 0.6 mg photocatalyst was dispersed by ultrasonication in 40 mL solution of coumarin (11 mM)-Ph (0.2 mM) (blue trace 0.2 mM). In second case, the concentration of Ph in 11 mM coumarine solution was increased to 2 mM (orange trace 2 mM).
Catalysts 11 00487 g010
Figure 11. Surface photovoltage (SPV) spectra of pristine TiO2 (1), Ag/TiO2 (2), Au/TiO2 (3), and Pt/TiO2 (4). Inset: corresponding energy diagram at 300 nm; the dashed lines indicating the Fermi levels of samples.
Catalysts 11 00487 g011
Figure 12. Time-variation of the mass activity for oxygen reduction at pristine TiO2 (1), Ag/TiO2 (2), Au/TiO2 (3), and Pt/TiO2 (4), at an applied voltage of −1 V. Insets: (a), log–log plots for the oxygen reduction current decay at noble metal-modified TiO2; (b), estimated O2 amounts formed during 10 min of continuous polarization.
Catalysts 11 00487 g012
Figure 13. Distinct mechanisms of Phenol (Ph) photocatalytic oxidative conversion over bare and noble metal-modified TiO2.
Catalysts 11 00487 g013
Figure 14. Experimental setup used for photocatalytic tests composed of quartz reactor provided with quartz window, AM 1.5 light source, liquid and gas sampling systems, gas and liquid chromatographs, and chillers to control the temperatures of glass condenser (−5 °C) and of reactor (18 °C).
Catalysts 11 00487 g014
Table 1. Comparative characterization data of investigated materials collected from EDAX (Energy Dispersive X-ray Analysis), XPS (X-ray Photoelectron Spectroscopy), and TEM measurements.
SamplesCryst. Size
/nm a
Metal Content
/at.% (wt%)
Metal Particle Size
/nm
Ti3+/
at. % f
Oxid. State g
EDAX bXPS cTEM dChem. e
TiO218.8----0-
Ag/TiO219.30.04 (2.7)0.04 (2.7)>50-22.9Ag0
Au/TiO219.80.01 (2.5)0.02 (5.0)6-10.9Au0
Pt/TiO220.60.01 (2.4)0.002 (4.8)218.8Pt0
a—TiO2 crystallite size determined by Scherrer method from XRD diffractograms; b—metal loading evaluated by EDAX; c—metal content estimated from XPS data; d—metal particle size determined from TEM micrographs; e—metal particle size determined by CO chemisorption measurements; f—atom percentage of Ti3+ in TiO2 matrix derived from XPS measurements; g—metal oxidation state analysis performed XPS measurements.
Table 2. Phenol conversion to gaseous and liquid products and carbon balance measured after 6 h of reaction time.
PhotocatalystsC Inlet aC
Outlet a
Ph/μmolesPh/μmolesCO2/μmolesHQ/μmolesBQ/μmoles1, 2 DHBz/μmolesCarbon Balance/
%
Phenol Conversion/% b
TiO2362.9331.515.600095.68.7
Ag/TiO2369.8324.56.57.901.392.012.2
Au/TiO2356.2324.613.811.10098.18.9
Pt/TiO2367.9309.721.613.30.41.594.215.8
a—μmoles of carbon contained by inlet phenol, non-reacted outlet phenol (Ph) and formed reaction products (hydroquinone (HQ), benzoquinone (BQ), 1,2-dihydroxibenzene (1, 2 DHBz)), and CO2; b—Phenol conversion after 6 h of reaction time (reaction conditions: 110 mL of 50 mg∙L−1 phenol aqueous solution.0.05 g photocatalyst, T = 18 °C, light source AM 1.5).
Publisher’s Note: MDPI stays neutral with regard to jurisdictional claims in published maps and institutional affiliations.

