Article

Slot-Die Process of a Sol–Gel Photocatalytic Porous Coating for Large-Area Fabrication of Functional Architectural Glass

by
Adrián Angulo-Ibáñez
1,*,
Estibaliz Aranzabe
1,
Garikoitz Beobide
2,3,*,
Oscar Castillo
2,3,
Amaia M. Goitandia
1,
Sonia Pérez-Yáñez
2,3 and
Antia Villamayor
4
1
Surface Chemistry & Nanotechnologies Unit, Tekniker, Basque Research and Technology Alliance (BRTA), C/Iñaki Goenaga 5, 20600 Eibar, Spain
2
Departament of Inorganic Chemistry, Faculty of Science and Technology, University of the Basque Country, 48940 Leioa, Spain
3
BCMaterials, Basque Center for Materials, Applications and Nanostructures, UPV/EHU Science Park, 48940 Leioa, Spain
4
Physics of Surfaces and Materials Unit, Tekniker, Basque Research and Technology Alliance (BRTA), C/Iñaki Goenaga 5, 20600 Eibar, Spain
*
Authors to whom correspondence should be addressed.
Catalysts 2021, 11(6), 711; https://doi.org/10.3390/catal11060711
Submission received: 16 April 2021 / Revised: 28 May 2021 / Accepted: 3 June 2021 / Published: 6 June 2021
(This article belongs to the Special Issue UV/Vis/NIR Photocatalysis and Optical Properties)

Abstract

:
The slot-die process is an appealing technology for the fabrication of coatings on large-area substrates. However, its application on the production of photocatalytic coatings based on sol–gel formulations remains virtually unexplored. Thus, assessing the suitable formulation of the sol and operational parameters that allow one to yield high-efficacy photocatalyst coatings is a current challenge. This work aims to analyze the transferability of titania sol formulation optimized for dip-coating processes to slot-die technology. In this sense, firstly, the sol formulation is optimized by analyzing the influence of several types of surfactants on the microstructural features and photoactivity of TiO2 coatings’ growth on glass substrates. All formulations rendered a meaningful porosity and nanoscopic anatase crystallites (11–15 nm) with optical band gap values close to the expectation (3.25–3.31 eV). Accordingly, the performance of the photocatalytic dye degradation was closely related to the porosity and crystallite size led by each titania sol, and no meaningful differences were found between the results provided by the coatings developed by dip-coating and the slot-die method, which demonstrates the capability of the latter for its application on a large-scale fabrication of photocatalytic coatings.

1. Introduction

Modern buildings have large windows and glass facades with increasing functional requirements. The self-cleaning property is one of the most important functionalities required for glass windows in buildings, as the adherence of dirt reduces the transparency and prejudices the aesthetic appearance [1].
Photocatalytic coatings provide a promising route to produce self-cleaning surfaces using the energy of light to obliterate dirt, pollutants, and harmful substances (whether they be of a gaseous, aqueous or biological nature). Furthermore, these coatings promote an almost complete wetting of liquids, making the surface easy to clean [2].
The photocatalytic process requires the presence of a photocatalyst (semiconductor) and a light source with sufficient energy to promote electrons from the valence band to the conduction band, thus leaving an electron hole in the valence band. These electrons and holes behave as reducing and oxidizing agents, respectively, and can initiate as a consequence a reduction-oxidation [3]. The reactions involved in the process are adsorption, decomposition and final transformation into substances that can be easily removed.
Among the different semiconductor materials, titanium dioxide (TiO2) is considered one of the most efficient photocatalysts due to its efficiency, chemical stability and low cost [4]. However, titanium dioxide has several drawbacks affecting the efficiency, some of them related to the material itself (large band gap, fast recombination of photogenerated electron-hole pairs) and others related to its synthesis process (depending on the selected method, different morphologies and porosities can be obtained, affecting the adsorption ratio of an organic pollutant and also affecting the optical properties) [5].
It is necessary for a catalyst to have an adequate specific surface area that provides a large number of active sites where pollutants can be degraded but at the same time avoid pollutants’ adsorption, promoting the whole mineralization. The synthesis and the application method affect directly not only the specific surface area but also the porosity and morphology of the obtained coating. The sol–gel method is presented as one of the most prolific synthesis methods, as it allows for a fine control of the porosity and microstructural properties, but also because of its chemical versatility, and the multiple advisable processing methods. In addition, it is particularly suitable for large-scale applications such as glass facades [6].
Among the methods to apply sol–gel solutions, spin coating, spray coating or dip-coating can be highlighted. The selection of the method is one of the most critical parameters that affects the film microstructure and porosity, due to the solvent removal rate associated to each method [7]. Furthermore, related to large-scale application, the selected method must be able to accomplish a homogeneous and rapid production of thin films on large areas, while retaining a high degree of reproducibility.
In this sense, among the aforementioned coating methods, spray coating can be regarded as the most suitable to coat large surfaces; however, it presents some drawbacks, such as the need to use a carrier gas, control overlapping areas and take care of health and safety issues associated with the presence of inhalable aerosols. To address these points, slot-die coating is presented as the most adequate application method for flat, large surfaces, also enabling the fabrication of multilayer films with high efficiency and high-cost saving [8,9].
Slot-die coating is a type of technology based on pumping a fluid through a head with a narrow slot. Capillary forces between the substrate and the head form a liquid window that is transferred to the substrate at a given speed. The stability of this window is critical to obtaining a homogeneous coating, which will depend on the process parameters: fluid properties, substrate speed, fluid flow rate, and substrate–head gap. The main advantages include application at high speeds and considerable application tolerance in the gap between the head and the substrate. The coating process produces a uniform strip with well-defined edges and the desired film thicknesses is achieved by controlling the solution flow and the gap. This process allows for the deposition of liquids with viscosities ranging from 10−3 to 103 Pa [10]. Furthermore, in this process, there is not any loss of coating solution, as it is transferred directly onto the substrate. Considering all the above-mentioned points, this method would be suitable for the production of large and uniform thin films, both continuous and patterned, on large planar surfaces [11,12].
In this work, we provide a new route to fabricate photocatalytic films with an adequate porosity and surface area on a large scale. The overall process is performed by the combination of sol–gel chemistry with the slot-die application method. The photocatalytic efficiency of coatings having different porosities for the elimination of dyes is discussed.

2. Results

Coatings were deposited on glass substrates by dip coating and slot-die. A silicon oxide layer was pre-deposited on each substrate to prevent the migration of Na+ cations. Three types of photocatalytic layers were prepared using different surfactants. Specifically, the selected surfactants were ammonium lauryl sulfate, cetyltrimethylammonium bromide and polyoxyethylene sorbitan monooleate, which gave rise to porous photocatalytic coatings labeled PPC-ALS, PPC-CTAB and PPC-TWEEN. Besides, a fourth type of photocatalytic coating (PPC-0) was prepared without using any surfactant in the sol formulation. Further details on the preparation of the coatings are presented in the methods section.

2.1. Characterization of the Photocatalyst

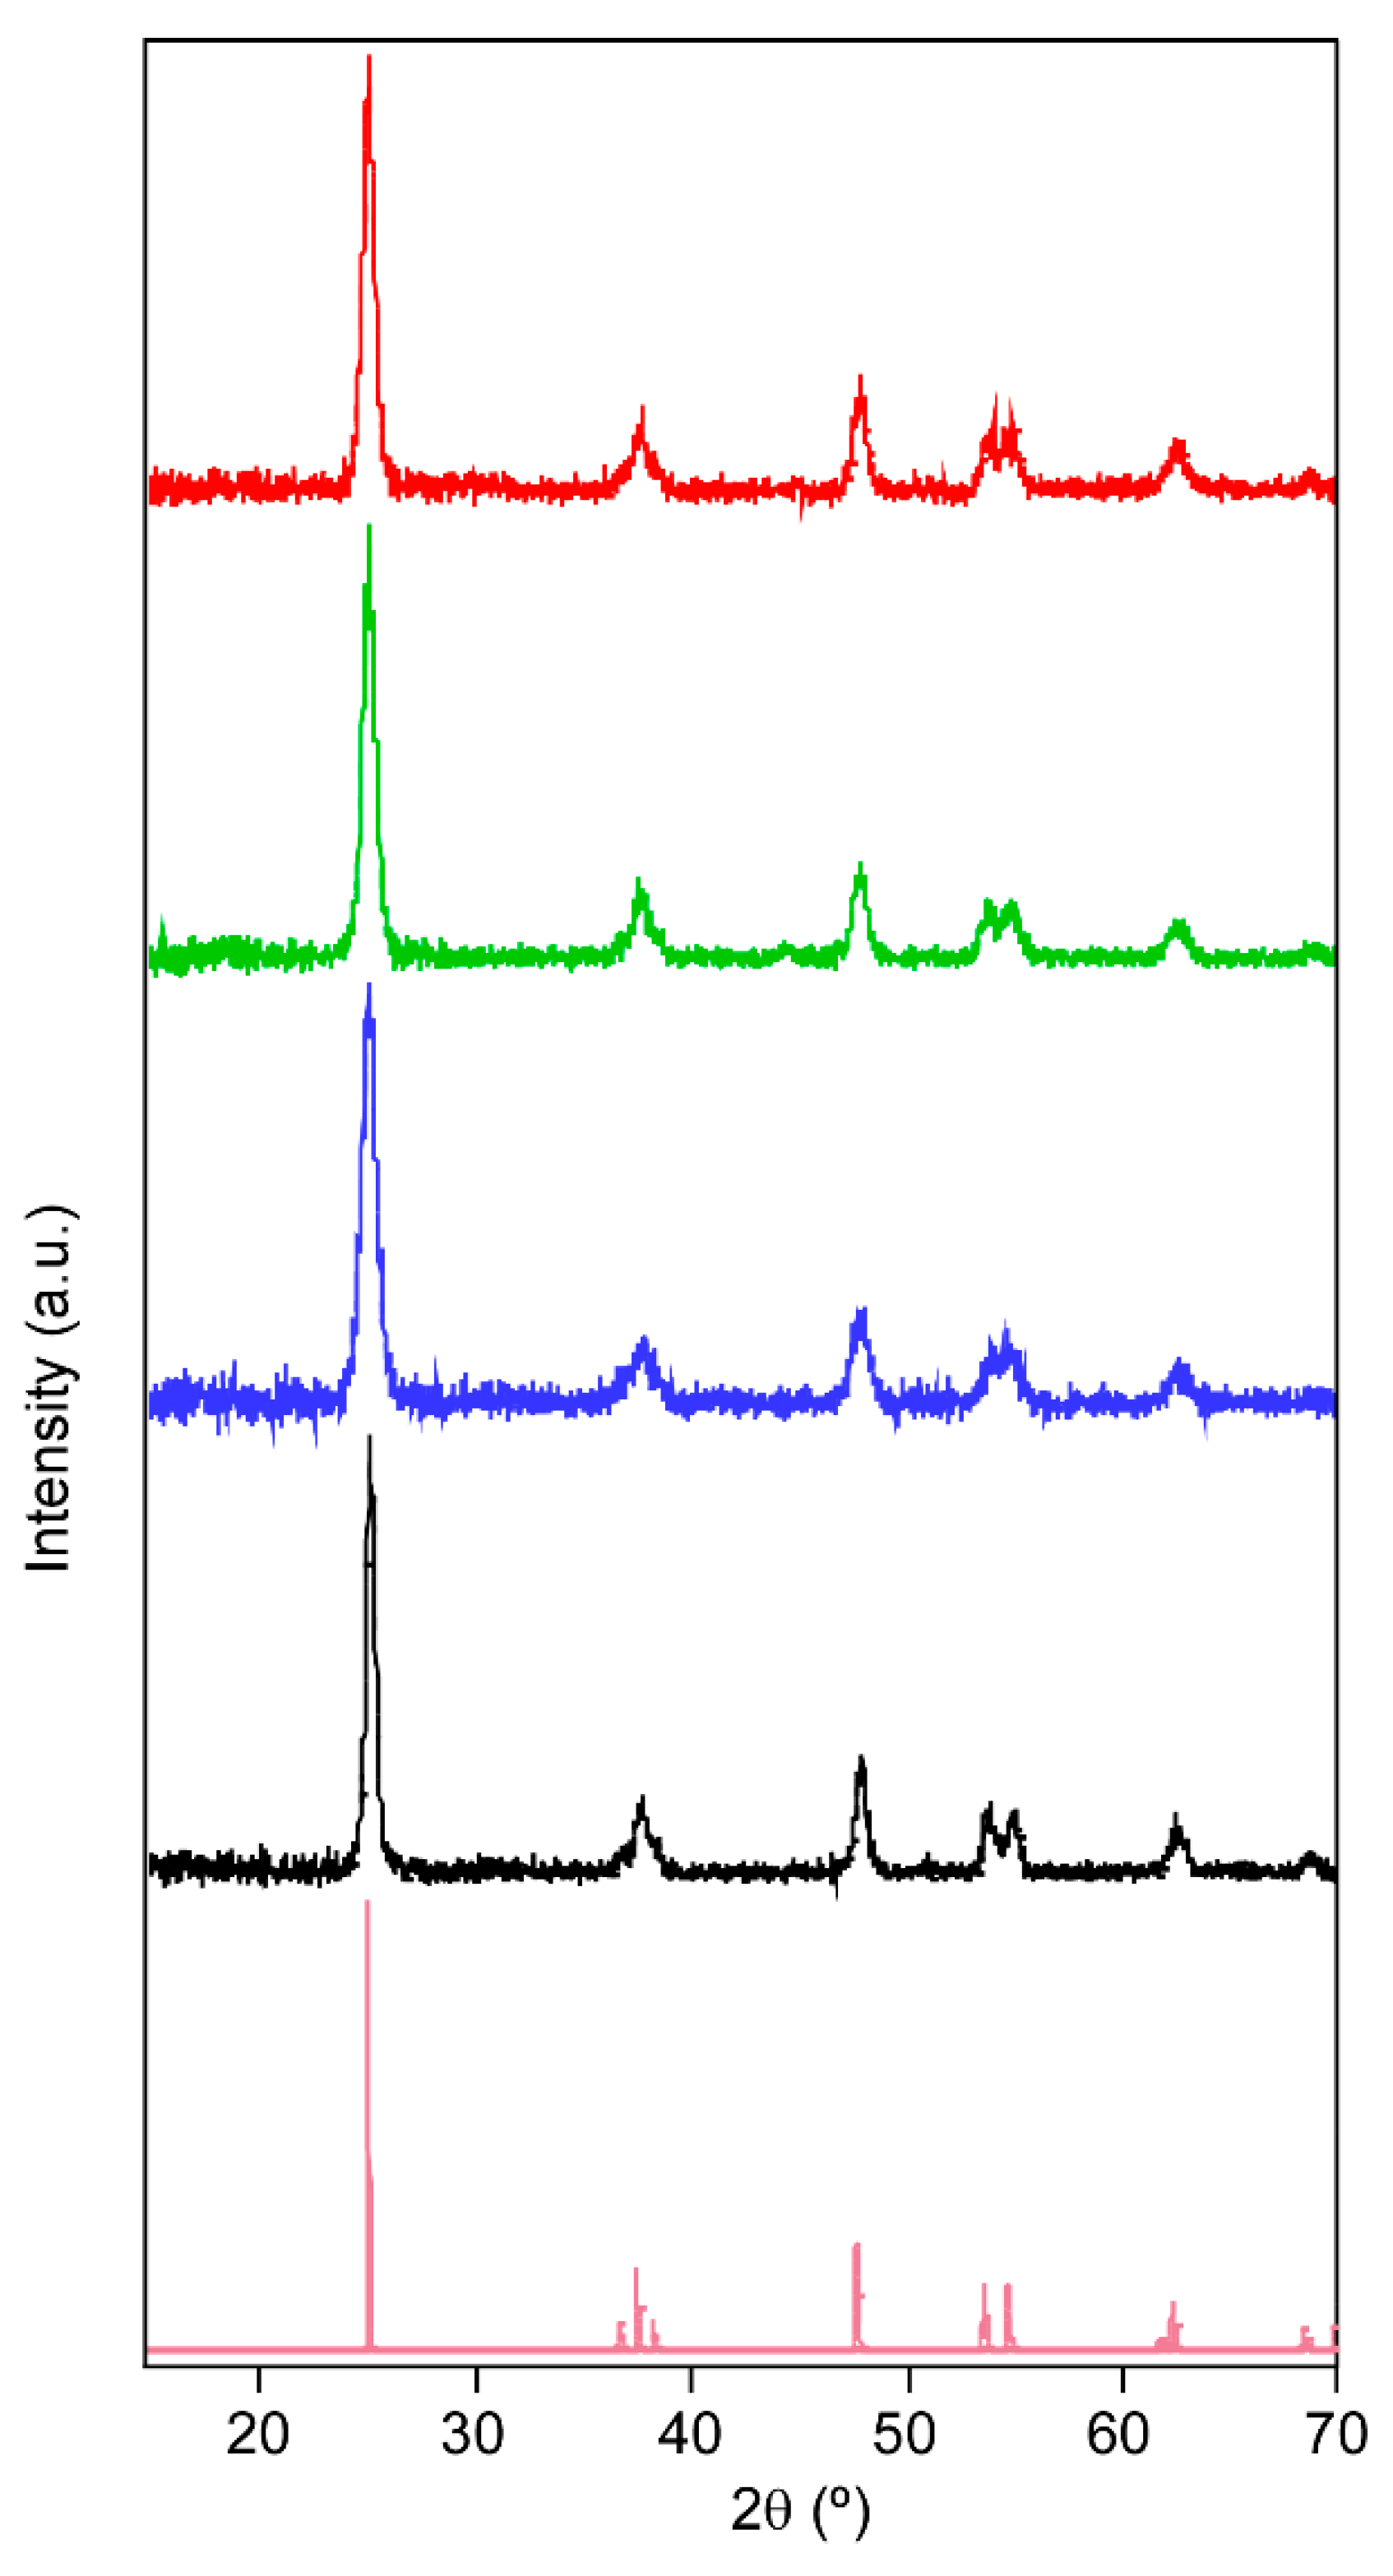
The PXRD analysis of xerogels showed anatase as the main crystalline phase and no traces of rutile were observed on the diffractograms (Figure 1). Therefore, the heat treatment conditions were suitable, and the presence of surfactant did not affect the obtained crystalline phase.
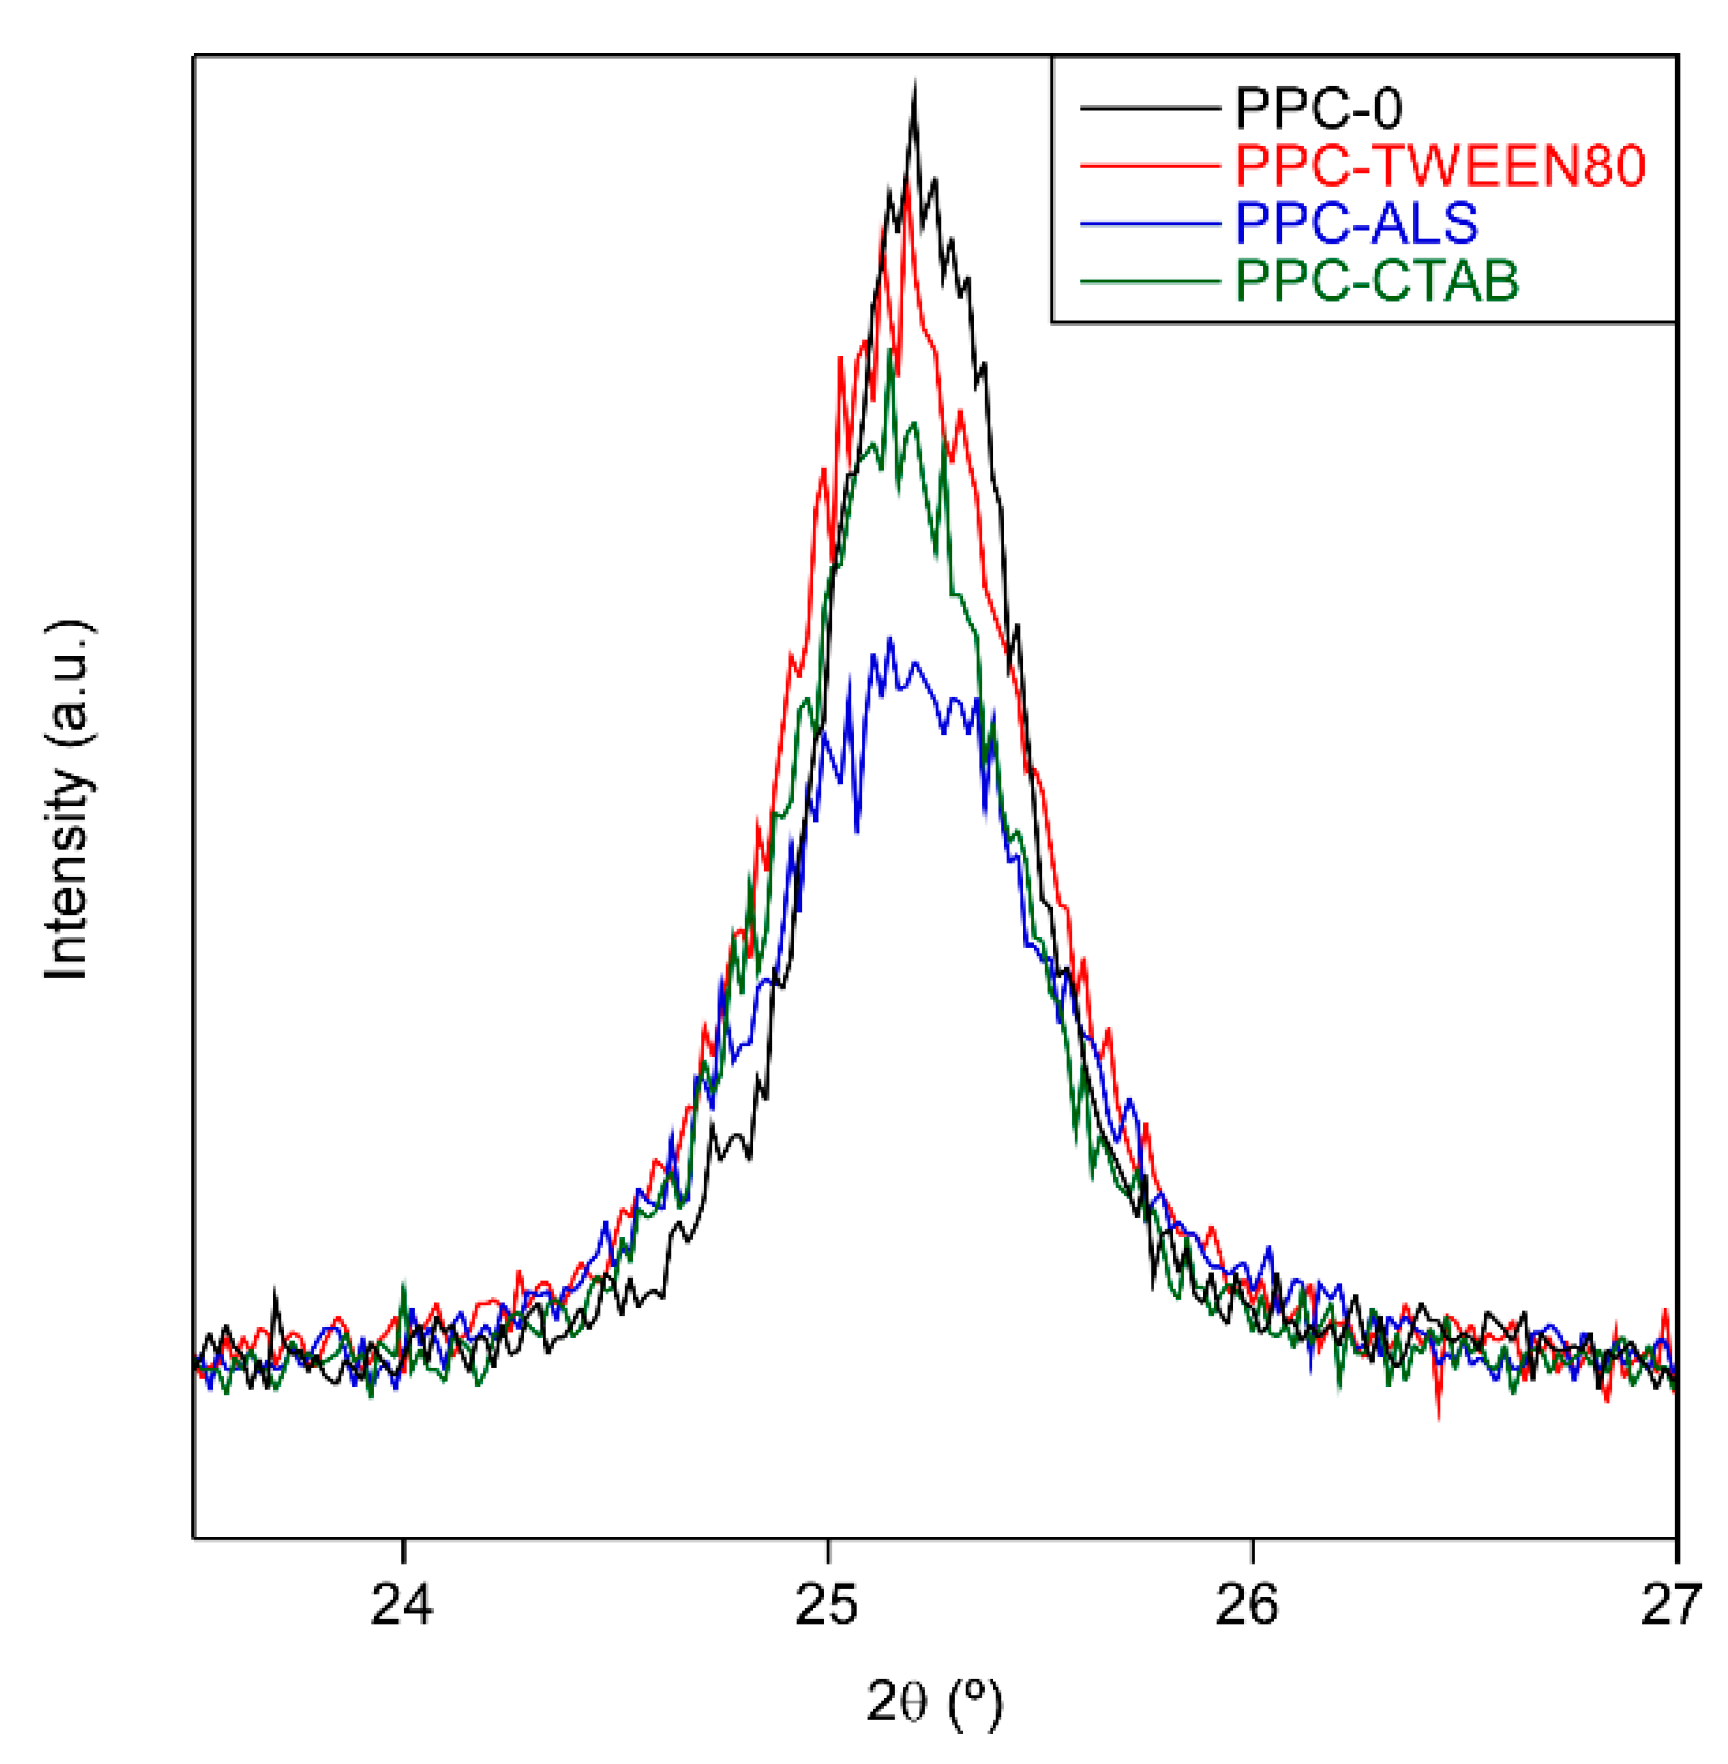
A broadening of the peaks is observed (Figure 2) depending on whether or not a surfactant is used and the type used, which can be related to the crystal size formed. This size has a direct influence on the kinetics of the reaction because by reducing the crystal size the photoactive area will be increased. The crystallite size (Dhkl) was calculated from the Scherrer equation:
D h k l = K λ β h k l c o s θ ,
where K is the particle shape factor (0.94), λ is the X-ray wavelength, βhkl is the half-width of reflection, and θ is the Bragg angle corresponding to the reflection [13,14]. Table 1 shows the full width at half maximum (FWHM) for the reflection (101) and estimated crystallite size (Dhkl). All coatings present nanoscopic crystallites. Without the presence of tensioactive, the size of crystallites is ca. 17 nm. However, the addition of a surfactant into the sol formulation promotes a meaningful size reduction, achieving the smallest crystallite with the formulation containing ALS surfactant.
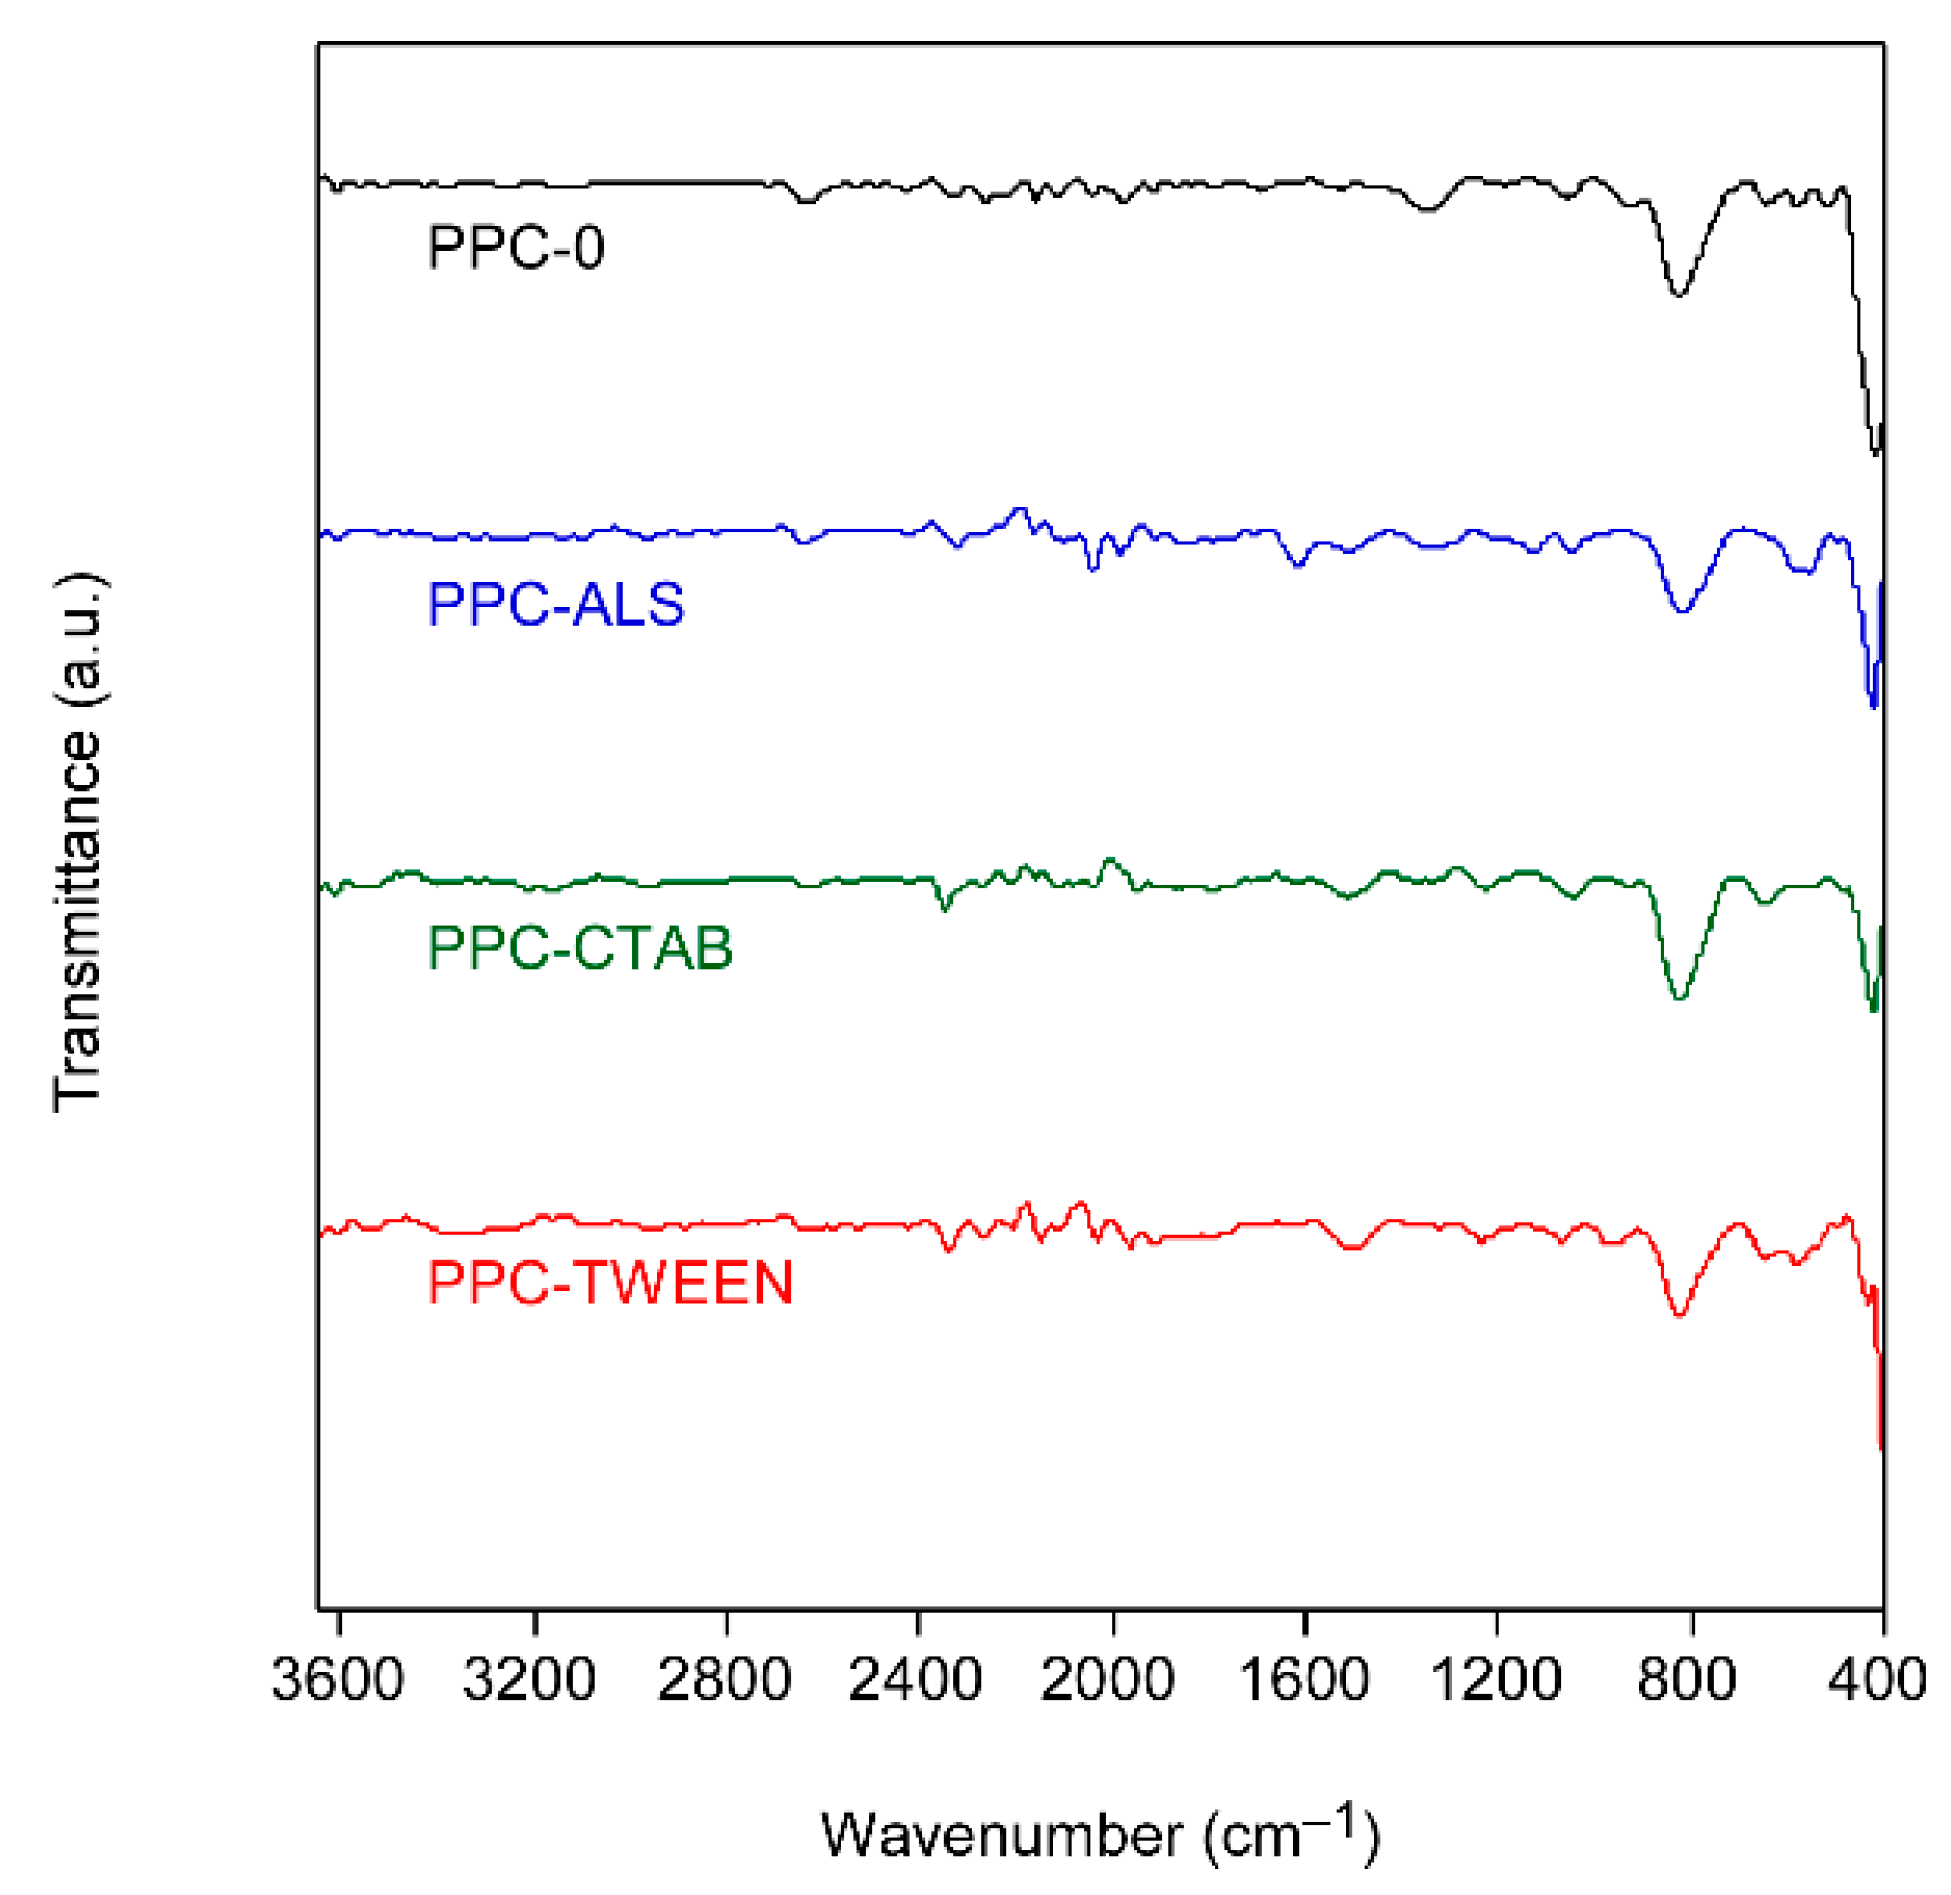
Figure 3 shows the infrared spectra of all xerogels. It can be verified that no traces of the surfactants remain in the powder after the thermal process, because the characteristic bands of these organic compounds are not detected.
The bands at 800 and 400 cm−1 correspond to Ti-O and Ti-O-Ti bonds [15], respectively, confirming the pure nature of TiO2 samples.
It is well known that the presence of surfactants in liquids decreases their viscosity, an obvious effect on the thickness of these coatings. As can be seen in Table 2, the use of different surfactants provides films thinner than PPC-0. In addition, compared with PPC-0, the presence of the template creates more irregular surfaces, with increasing roughness, due to the emergence of a porous surface. In any case, all rugosity values are relatively low (i.e., nanometric scale), which is desirable to minimize the scattering and to retain a high light transmittance.
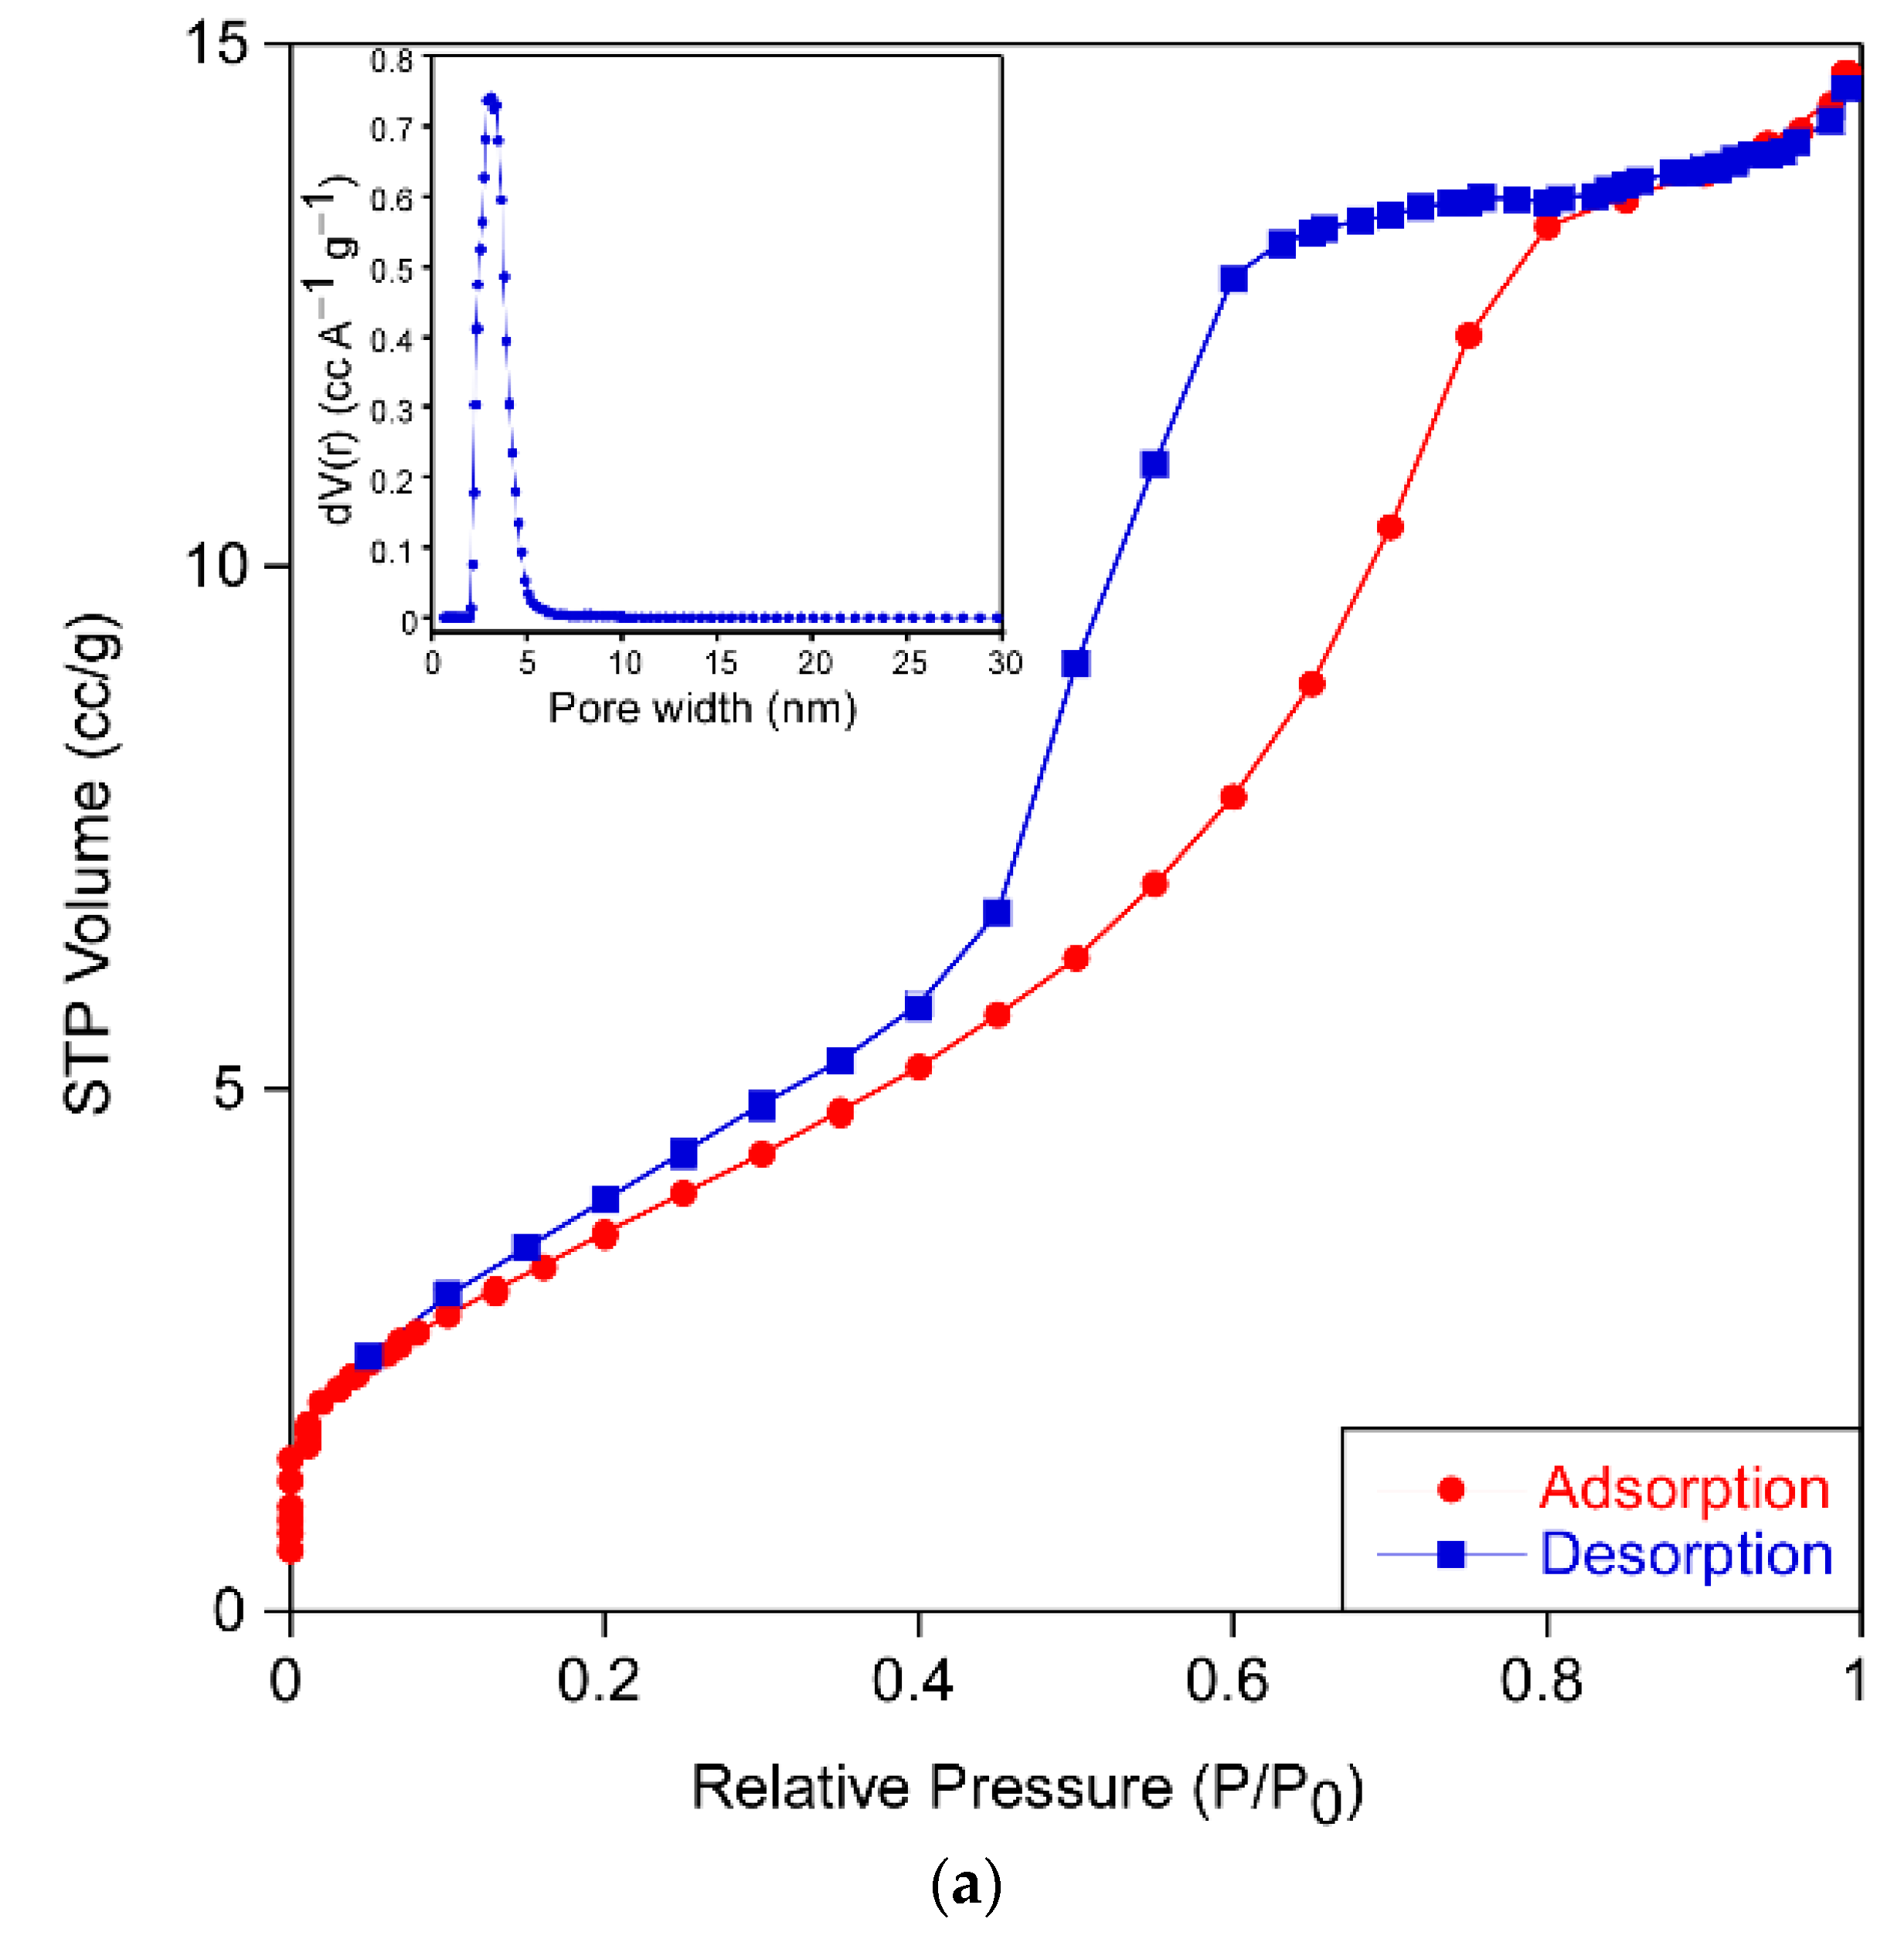
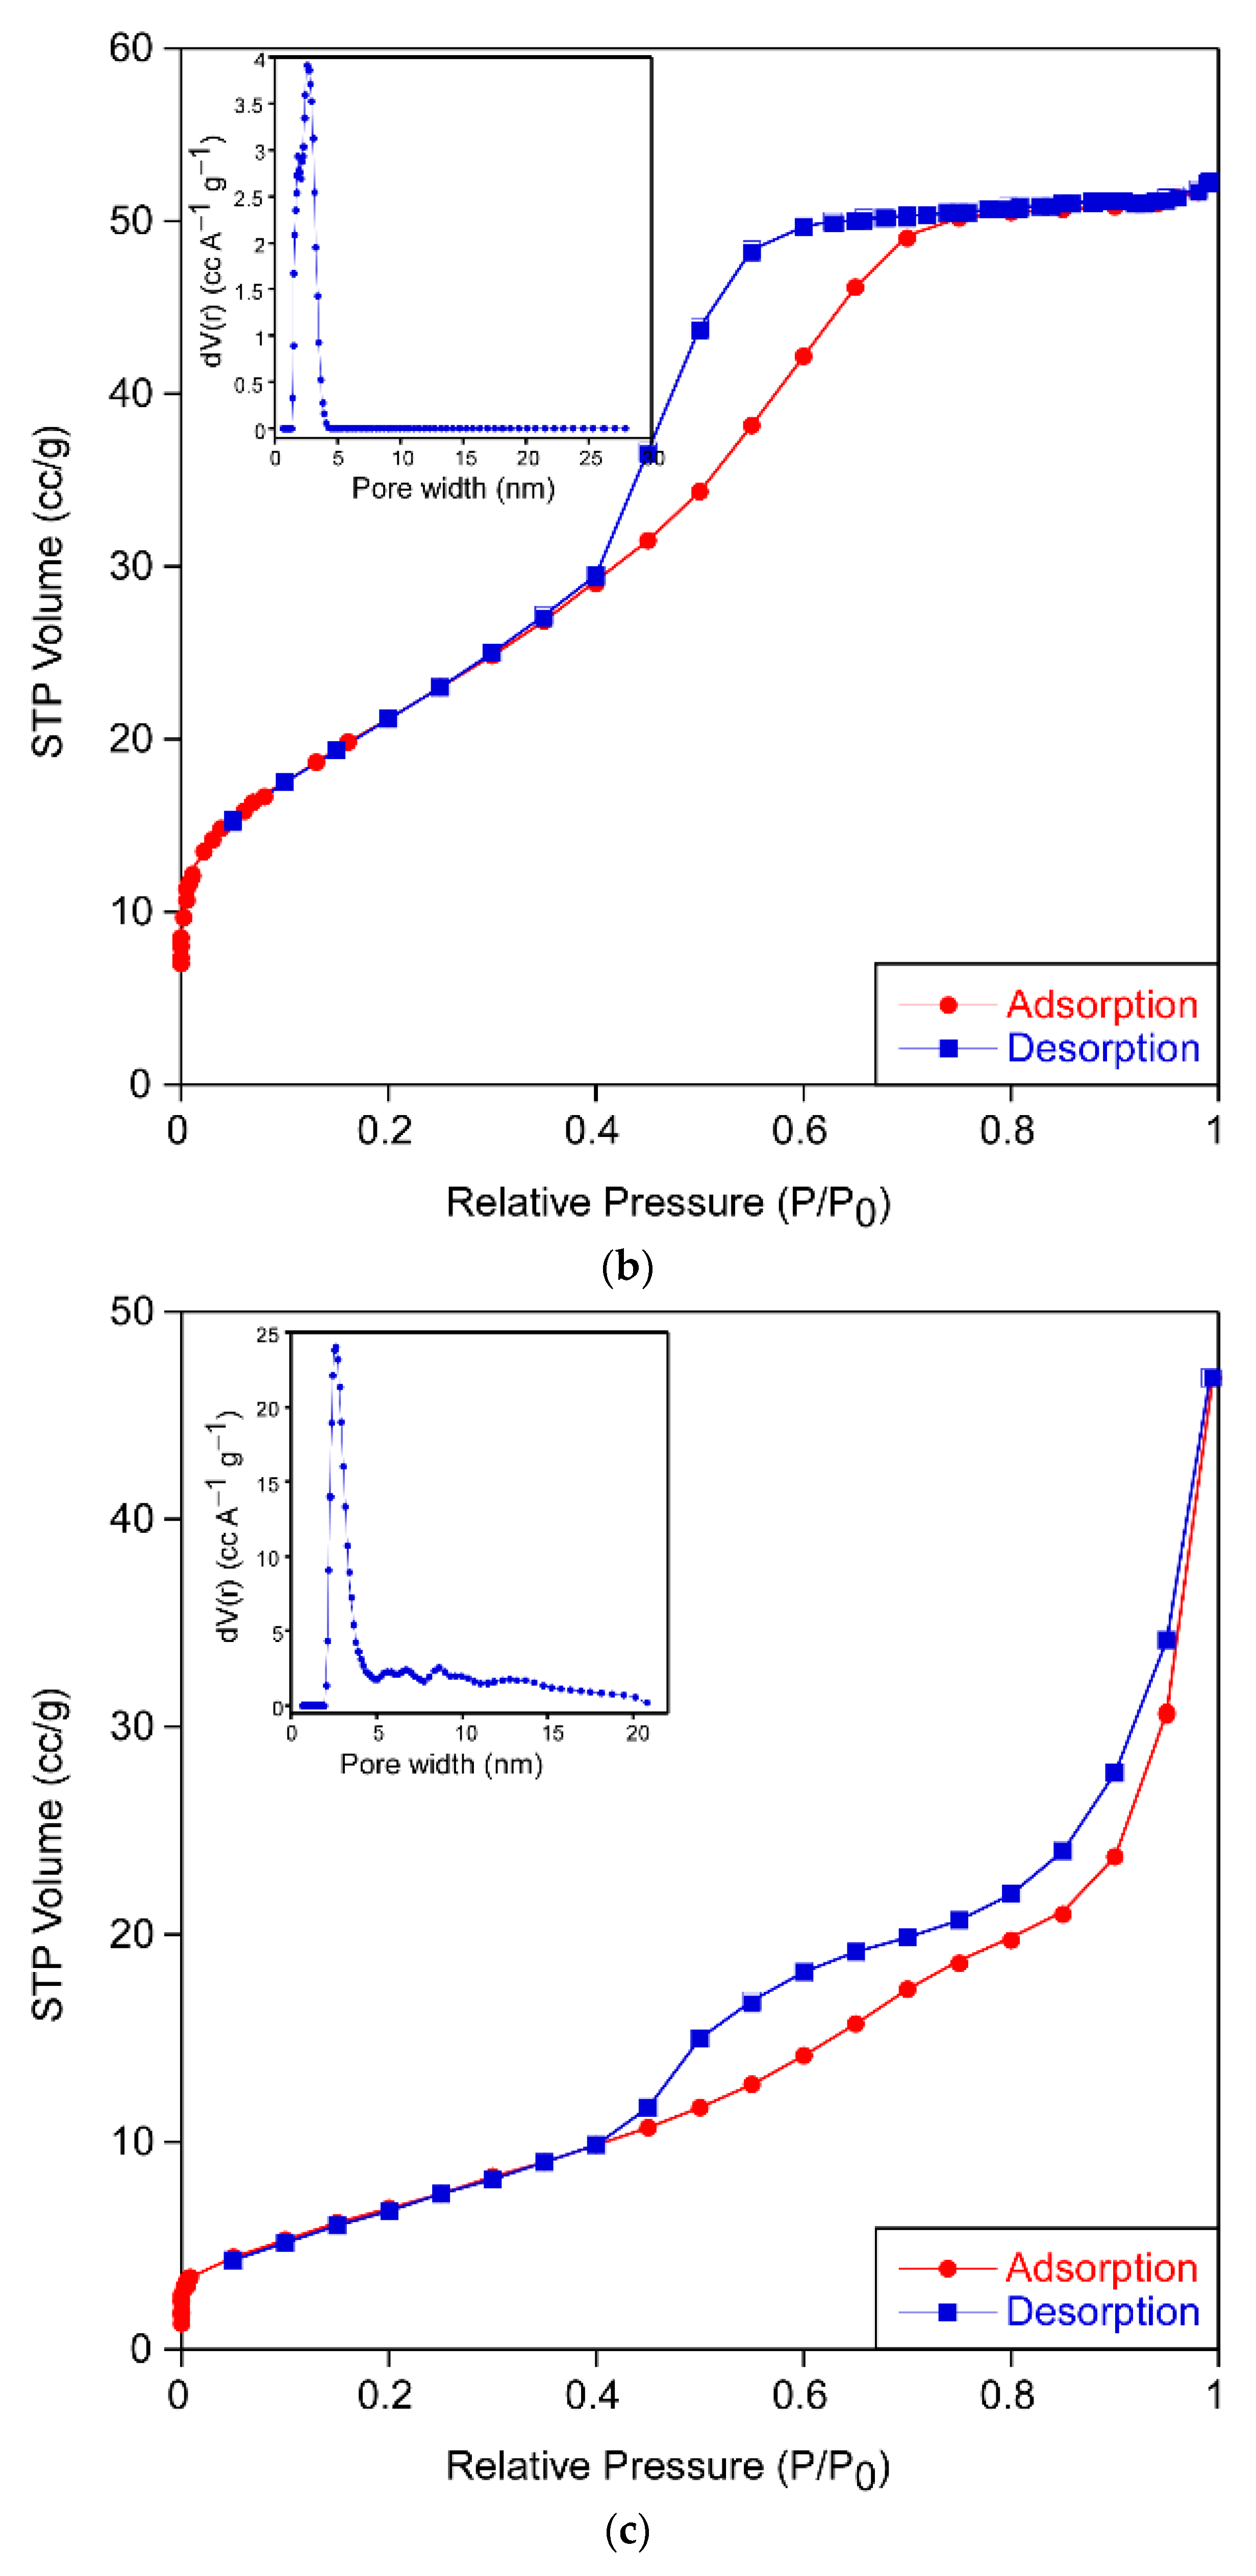
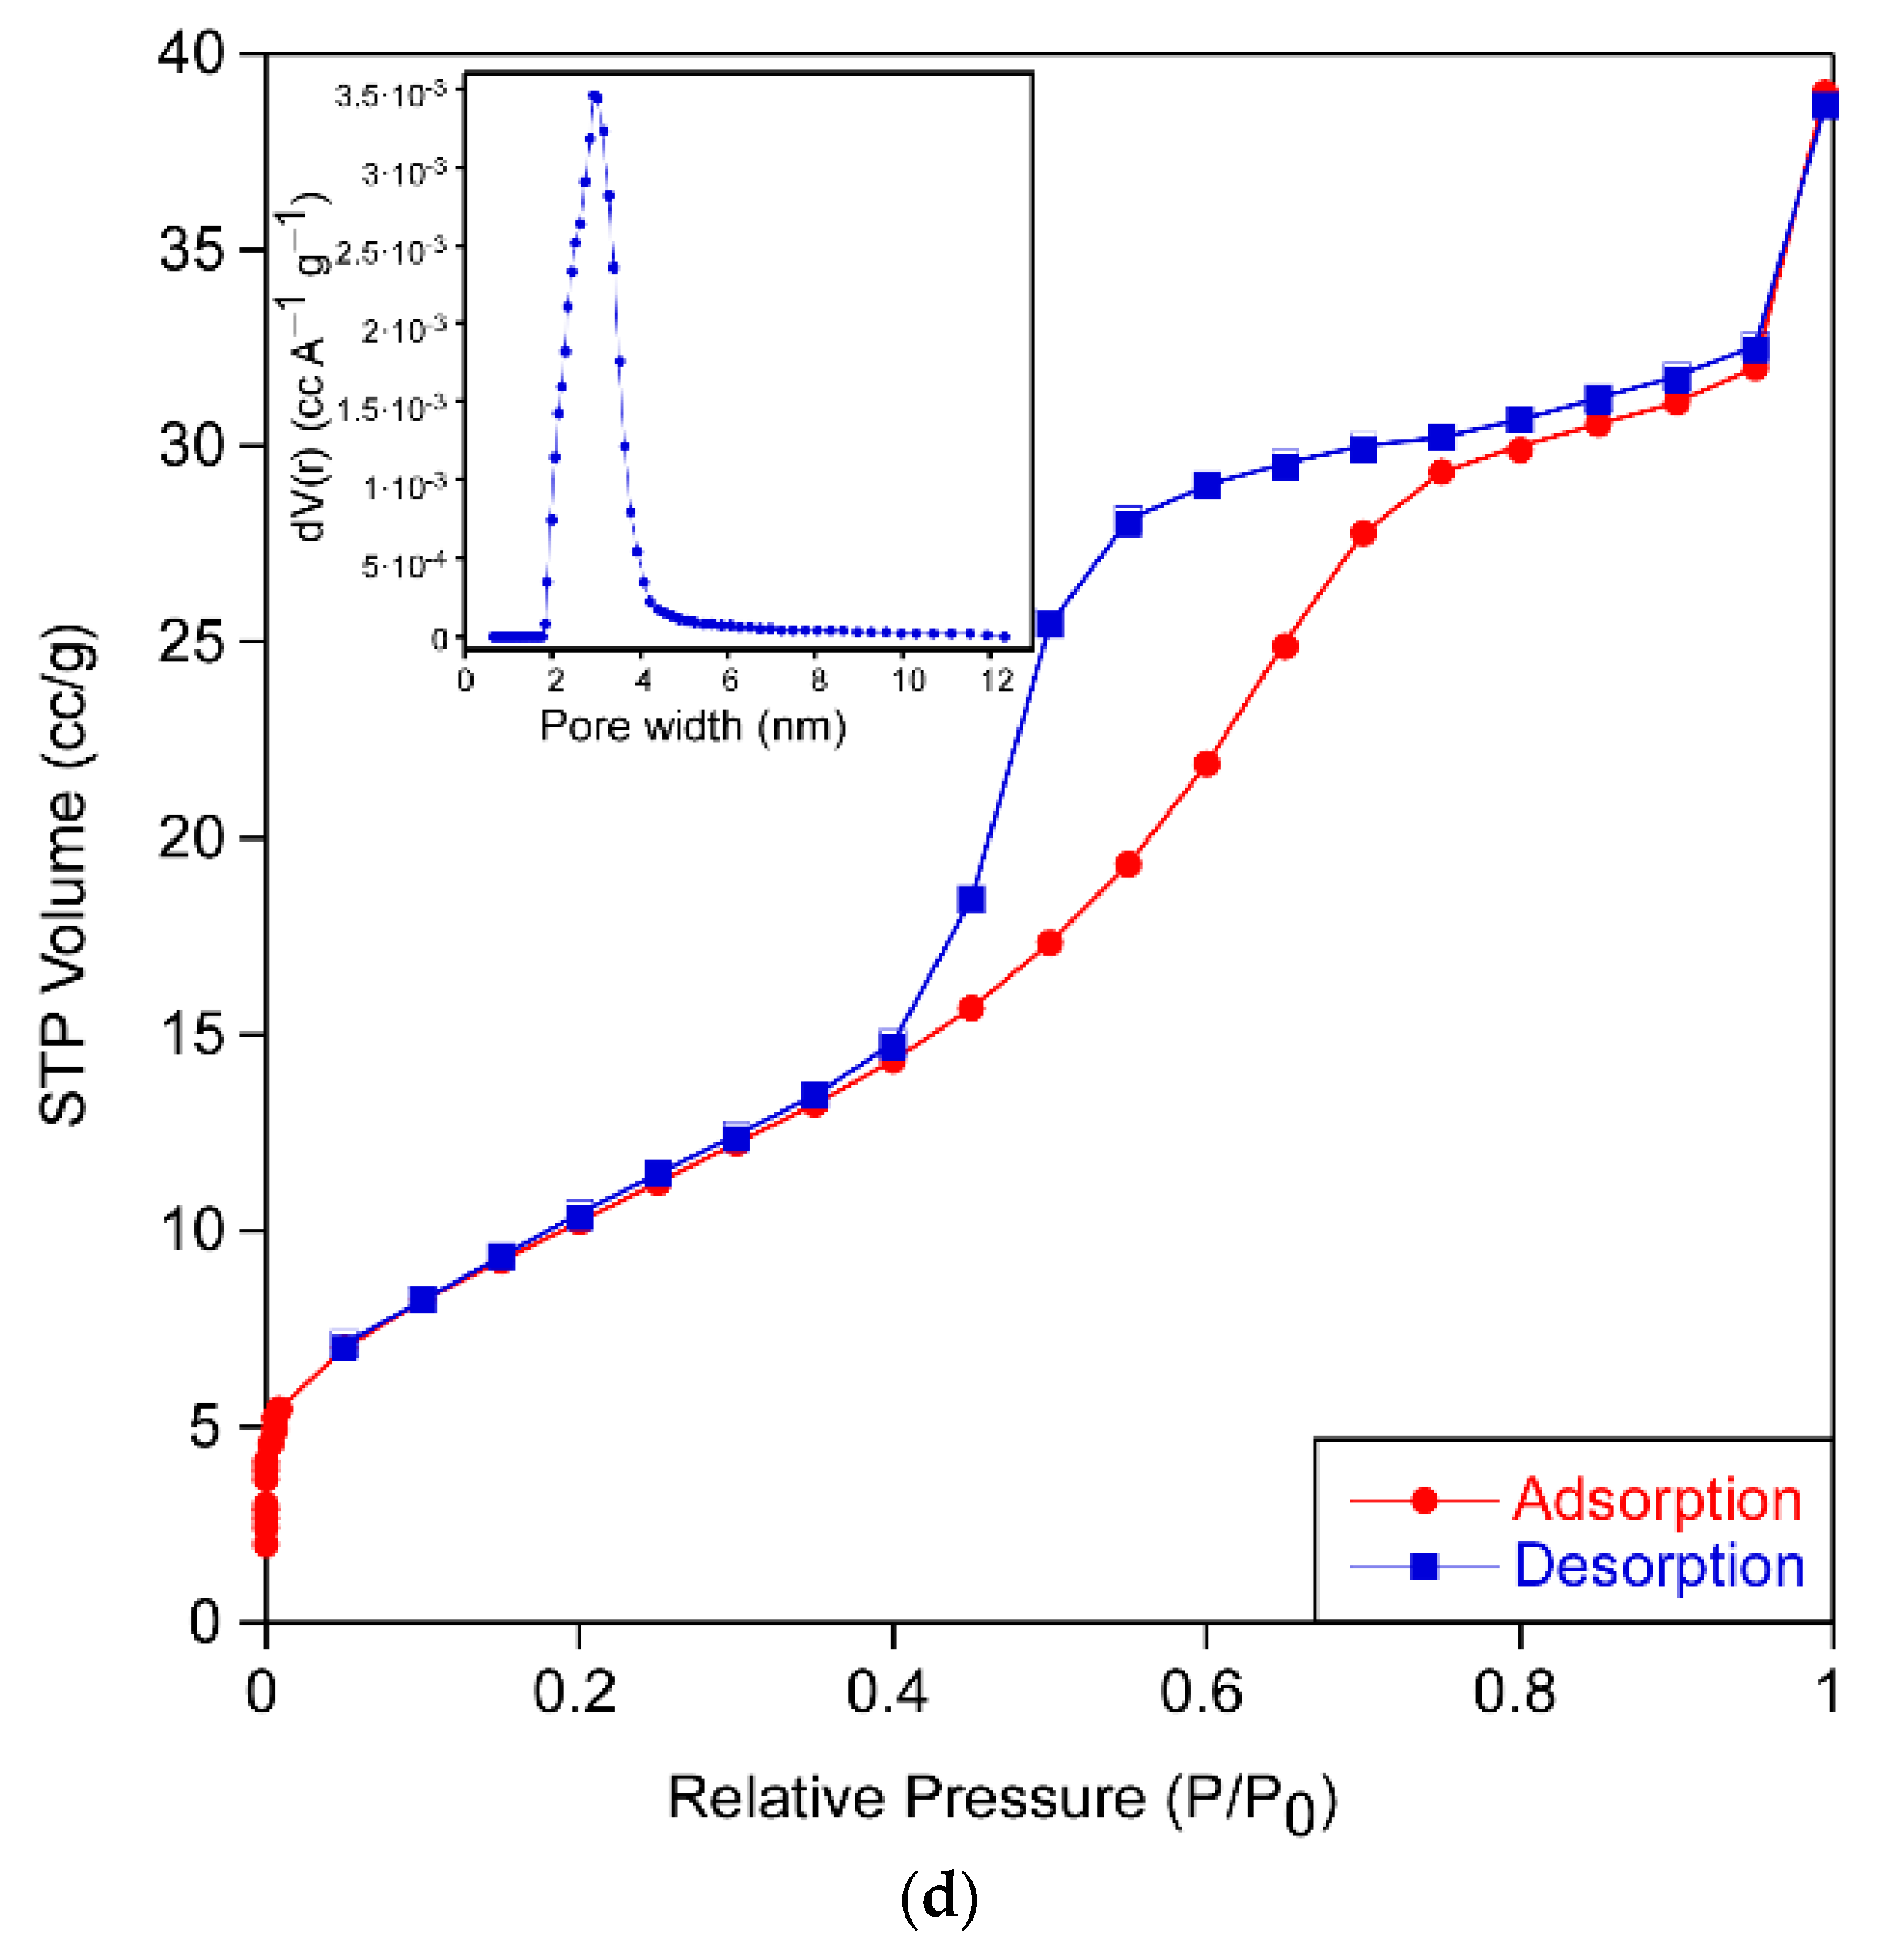
The results of the analysis from N2 adsorption isotherms (Figure 4) for each sample are gathered in Table 3. All of them exhibited type IV adsorption–desorption isotherms with an elongated S-type hysteresis loop that indicates the mesoporous nature of the xerogels. The form of the hysteresis cycle allows one to identify the shape of the pores of the sample according to the IUPAC classification [16]. The samples PPC-0, PPC-ALS and PPC-TWEEN show a type H2 hysteresis cycle, which describes materials that are often disordered where the distribution of pore size and shape is not well defined and indicative of a narrow distribution of pore bodies with a wide neck size distribution. However, the sample PPC-CTAB shows type H3 hysteresis often associated with slit-shaped pores. Samples exhibit pore sizes between 3 and 12 nm except for the PPC-CTAB sample. This pore size should ensure easy diffusion of the compounds through the porous network during the photocatalytic reaction. No meaningful differences were appreciated in the pore size distribution of the sample PPC-CTAB, because most of its pores were also in the 3–12 nm range, despite the fact that a minor contribution of pores up to 41 nm can be found.
The obtained surface area and porosity was highly influenced by the kind of surfactant used in the sol formulation, increasing in all cases in which surfactant was added. Certainly, the increase in specific surface area is related to the crystalline size (Table 1). Based on these data, the PPC-ALS formulation appears to have the most promising properties for photocatalysis.
Table 4 compares the transmittance and band gap of the photocatalytic films. The substrates have a SiO2 precoating to protect the titania form sodium migration, but it also increases the overall transmittance, allowing more photons to reach the TiO2 layer. In fact, without this SiO2 precoating, the transmittance decreases by 2–3%. Due to the refractive index of titania, the reflectance in the photocatalytic layers increases, causing the transmittance of these layers to be lower in the visible region.
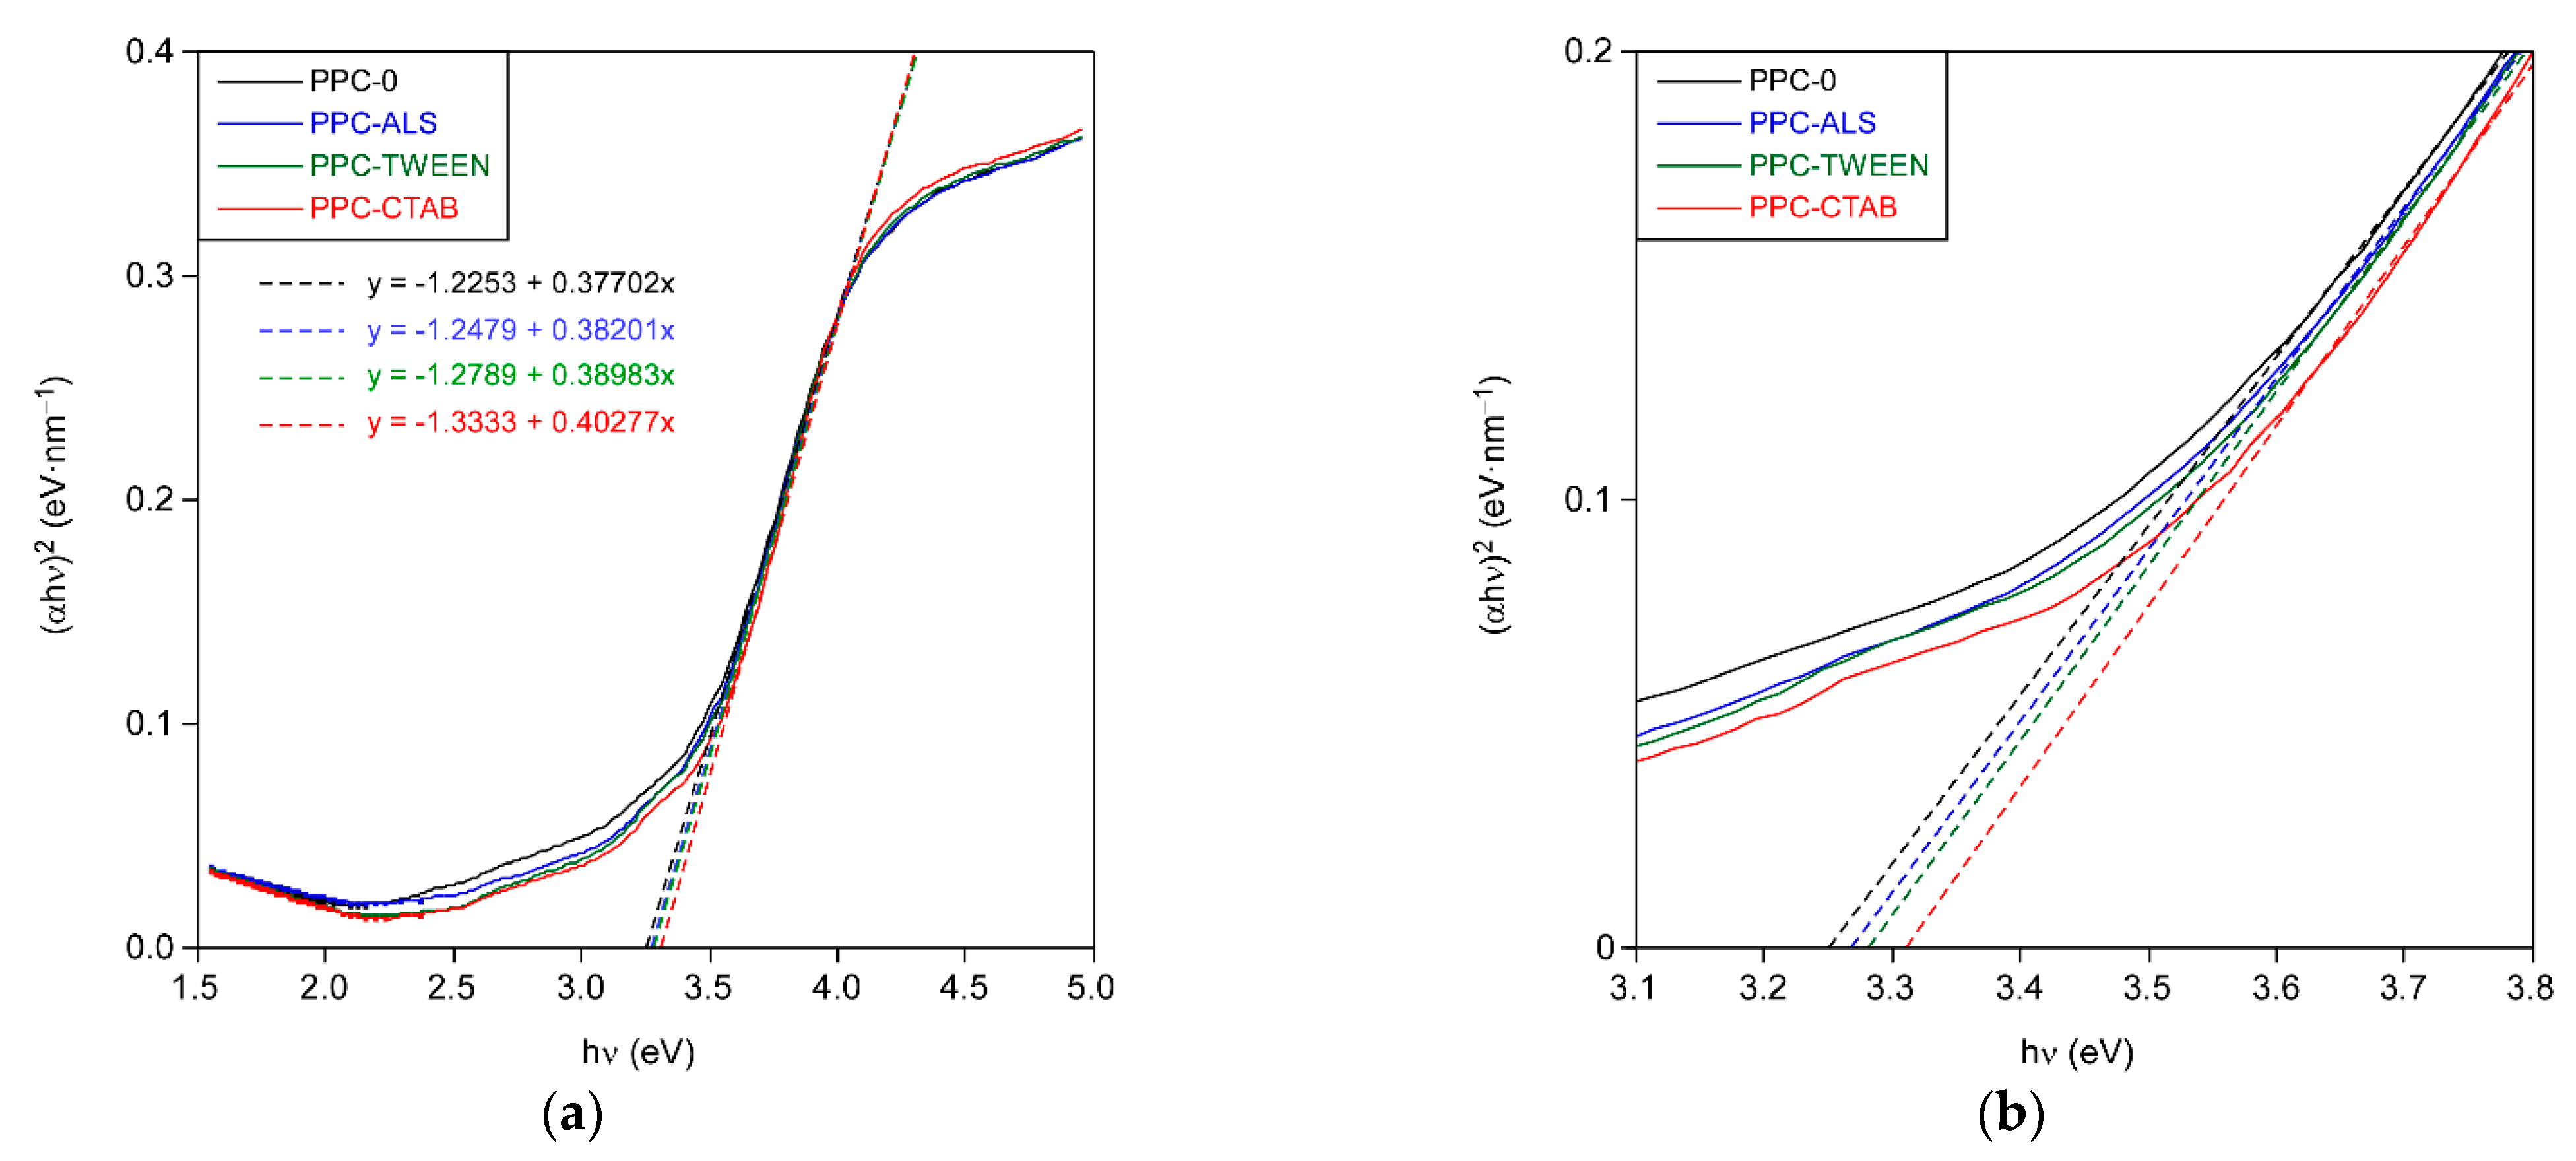
Tauc’s formula was used to estimate the band gap of the photocatalytic layers [17,18]:
( α h ν ) 1 / n = A ( h ν E g ) ,
where α is the absorption coefficient, hν is photon energy and Eg is the band gap. Depending on whether the band gap electron transition is direct or indirect, the factor n has a value of 0.5 or 2. In this case, the value of n was set to 2 since anatase exhibits an indirect band gap [19]. The factor A is a constant. The absorbance spectrum of the TiO2 layers is plotted as a function of photon energy in Figure 5 according to Equation (2). The intersection of the linear fit with the abscissa axis gives an estimate of the bandgap energy.
These values are comparable to that expected for anatase bulk phase (3.2 eV) [20,21]. The differences in the band gap between the formulations are small, always increasing with the presence of surfactant. The PPC-CTAB formulation is the one whose band gap is most affected. This increase in the band gap energy is related to the decrease in layer thickness. Lower layer thicknesses are obtained with the presence of surfactant, which, as mentioned previously, is related to the decrease in crystallite size. This is due to the quantum size effects of the semiconductors, whereby the band gap energy decreases as the crystallite size increases [22,23,24].
Figure 6 shows scanning electron microscopy (SEM) images for two representative photocatalytic coatings. These images reveal a porous microstructure consisting of nanoscopic TiO2 particles (ca. 5–10 nm) that enclose pores with sizes below ca. 20 nm (Figure 6). The estimated particle size exceeds crystallite size, which indicates that each particle is formed by the sinterization of several crystallites. It is worth mentioning that the resolution limitation of the SEM images did not allow one to perceive any clear differences among the different types of coatings.
The adhesion of the coatings was assessed by a cross-cut test. As can be seen in the images (Figure 7), all samples exhibited good adhesion to the substrate, as none of them showed any delamination.

2.2. Study of Photocatalytic Activity

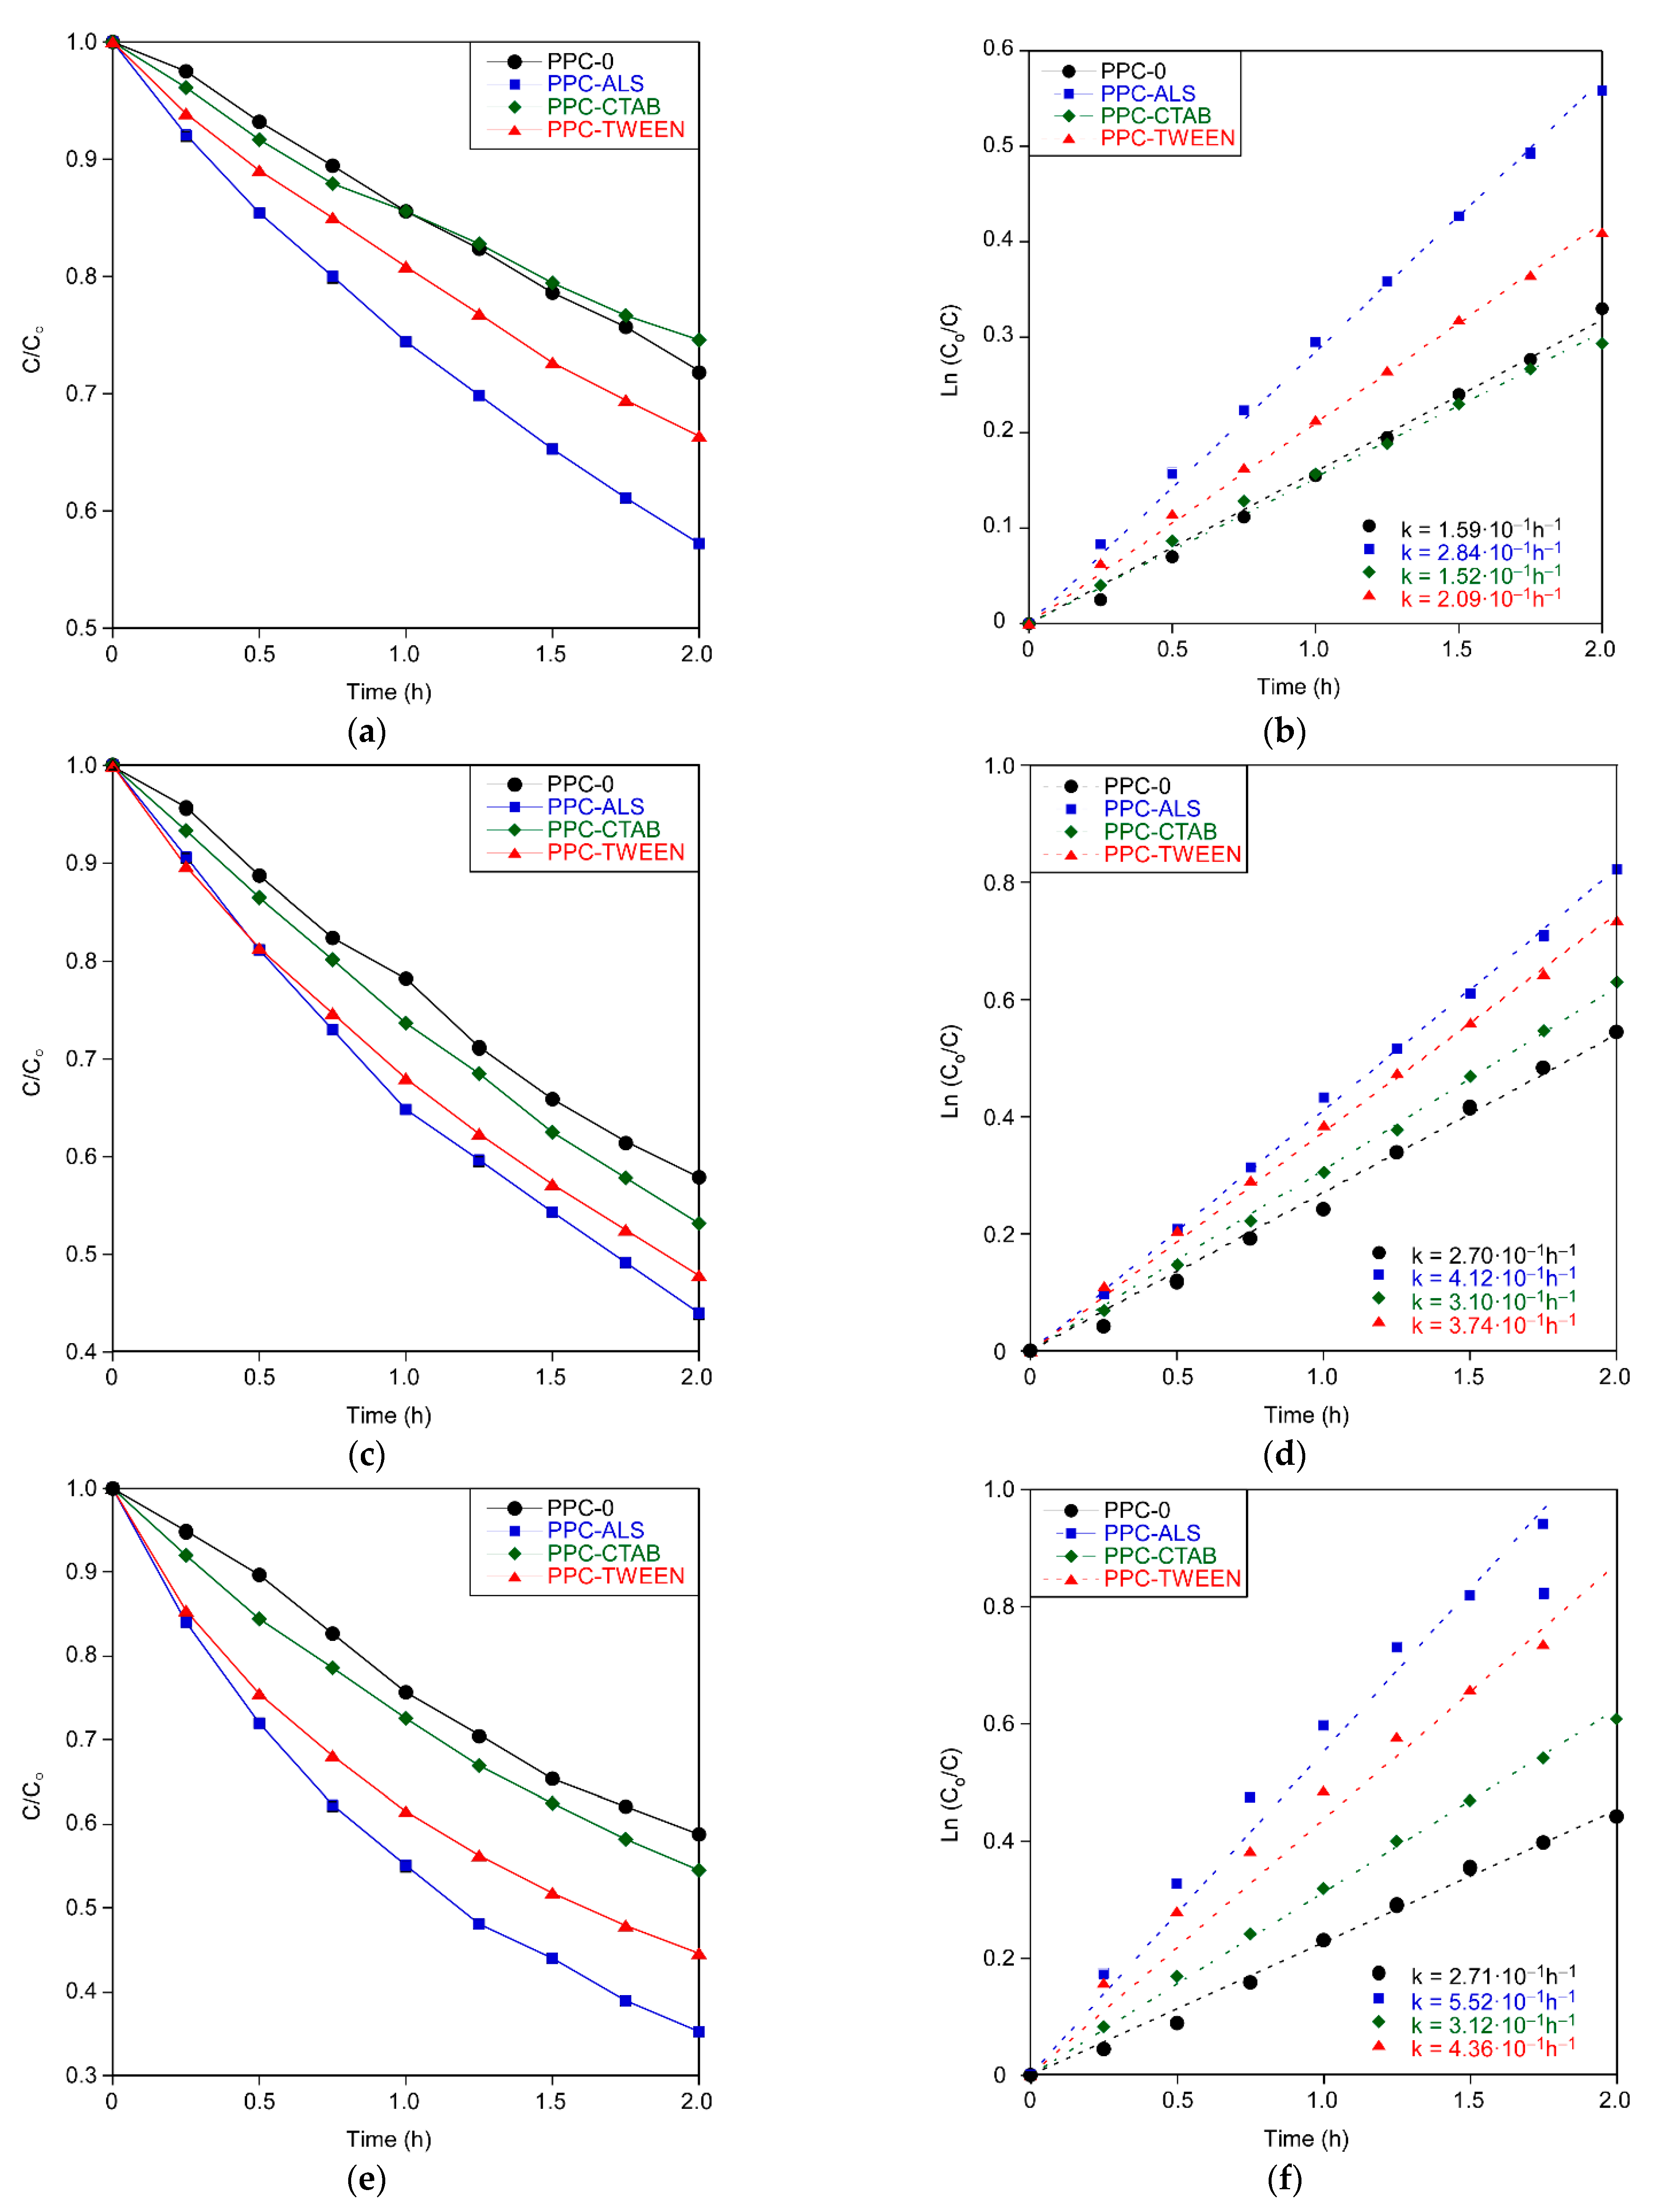
Different dyes were used to evaluate the photocatalytic activity of the coatings. 
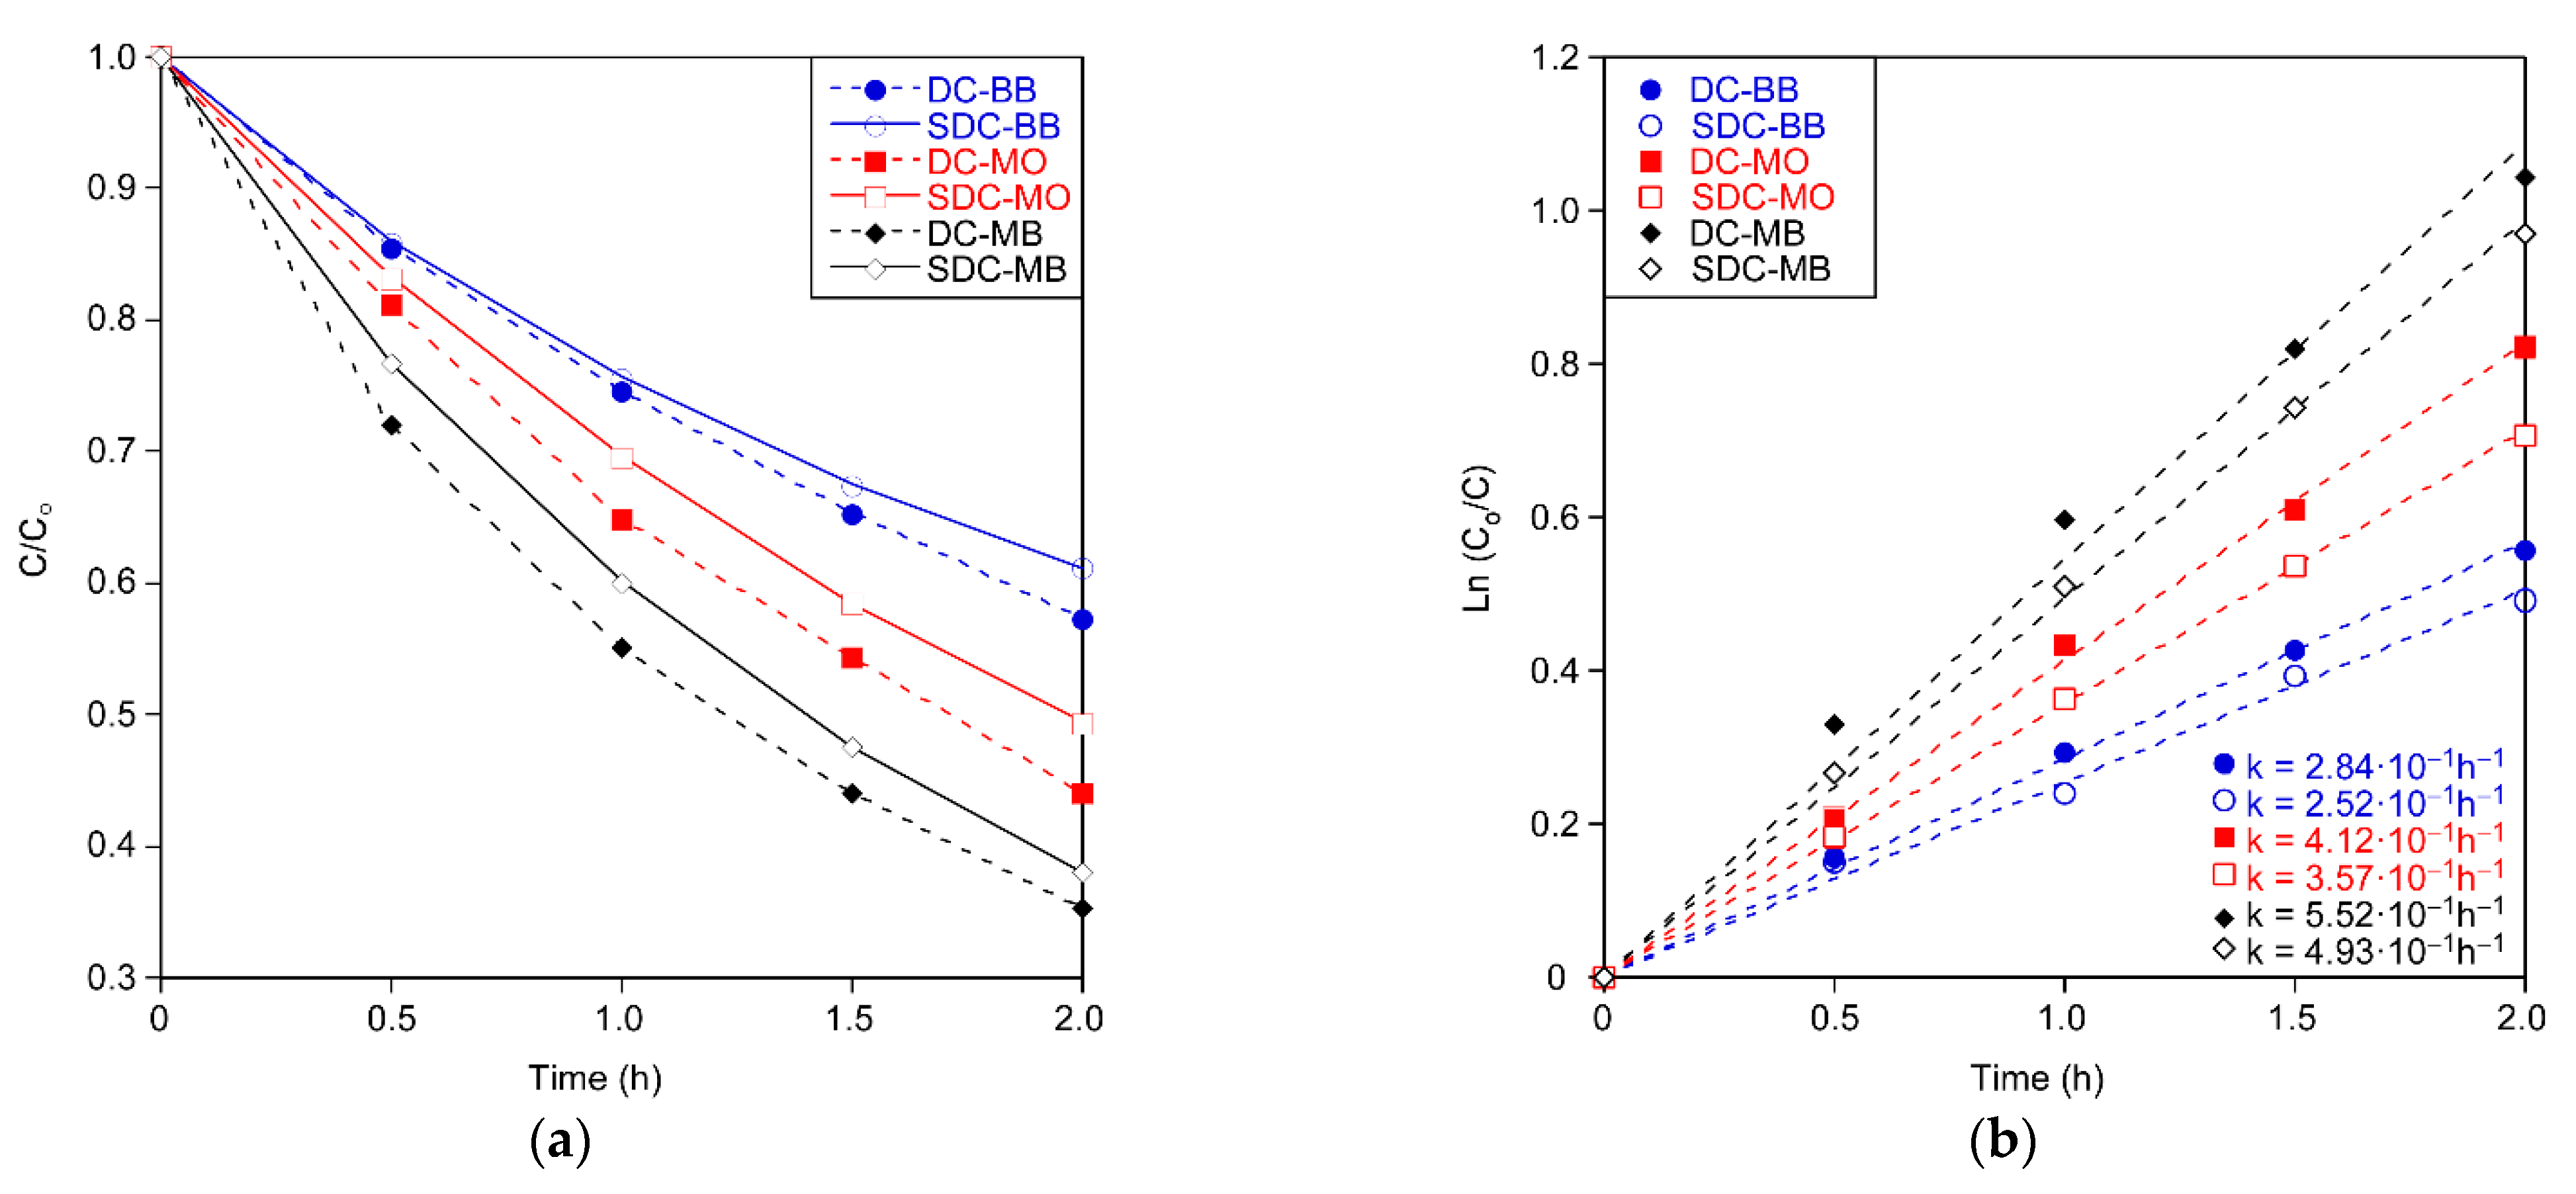
Figure 8a,c,e show the relative concentration of each dye (C/Co, where C and Co represent the dye concentration at a given time and the initial concentration, respectively) with respect to time. Previously, the substrates were kept immersed in the problem solution without applying UV radiation for 2 h. It was observed that, in all the photocatalytic layers, the removal of the dye was less than 1% after 2 h, so it was concluded that, regardless of the formulation studied, the adsorption phenomenon on the material hardly occurs.
The photocatalytic degradation kinetic of all dyes fits the first-order reaction [25]. This fit is shown in Figure 8b,d,f, representing the natural logarithm of the relative concentration (Ln(Co/C) with respect to time. Table 5 shows the percentages of dye removed and the reaction constants calculated through the fit for each coating and dye.
Considering the microstructural characteristics of the coatings (Table 1) in the photoactivity, PPC-CTAB shows a performance comparable to PPC-0, despite the fact that PPC-CTAB has a somewhat larger surface area and porosity with respect to PPC-0.
However, those coatings exhibiting higher surface area values (PPC-TWEEN and PPC-ALS) also promote a meaningful improvement in photodegradation performance.
Regarding the type of dye, the size of the molecule to be degraded seems to be the major influencing factor on the rate at which the compound is removed, although other factors such as functional groups or steric hindrance might have a minor influence. In all cases, with different surfactants and different pore distributions the order of degradation is the same, from highest to smallest activity: PPC-ALS, PPC-TWEEN, PPC-CTAB and PPC-0. It is evident that a higher porosity is beneficial for the photocatalytic activity, but if a lower or similar band gap energy is maintained, the crystallite size is minimized.
Keeping in mind the obtained results, the formulation of ALS has been selected for its application by the slot-die method.

2.3. Slot-Die Analysis of Variance

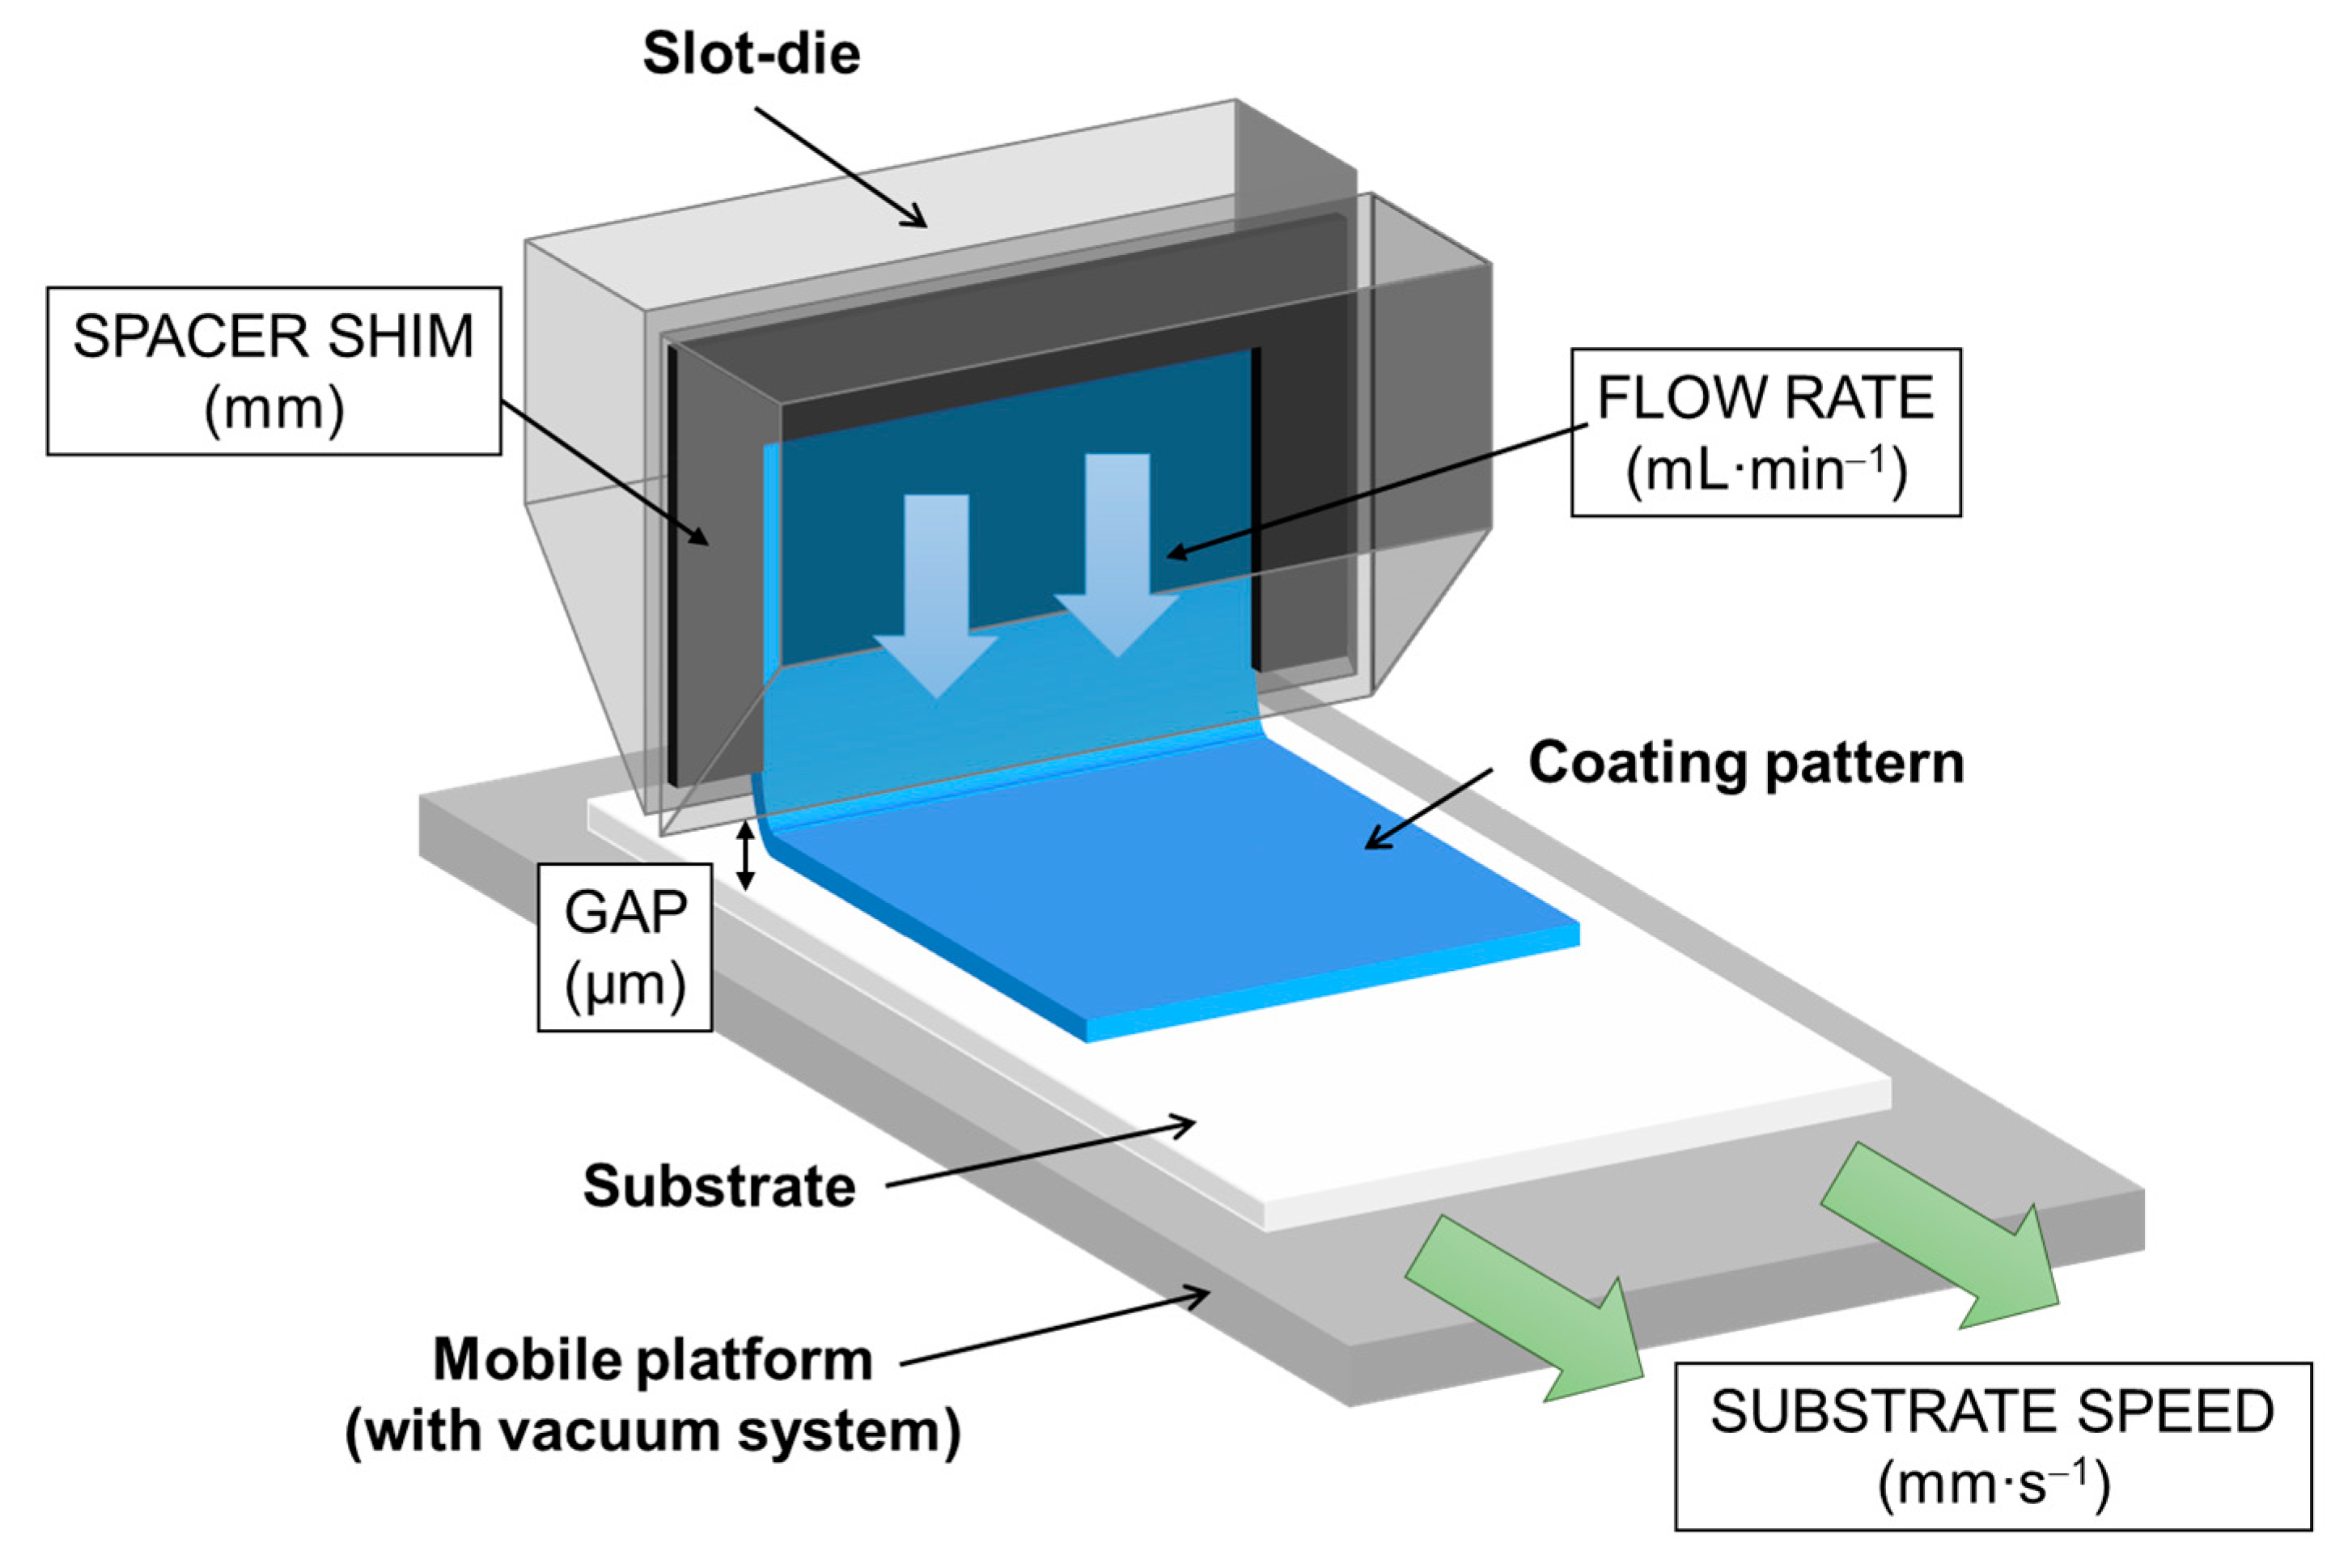
The slot-die process needs a previous study due to all the variables involved. For this reason, a design of experiments (DoE) was proposed. 
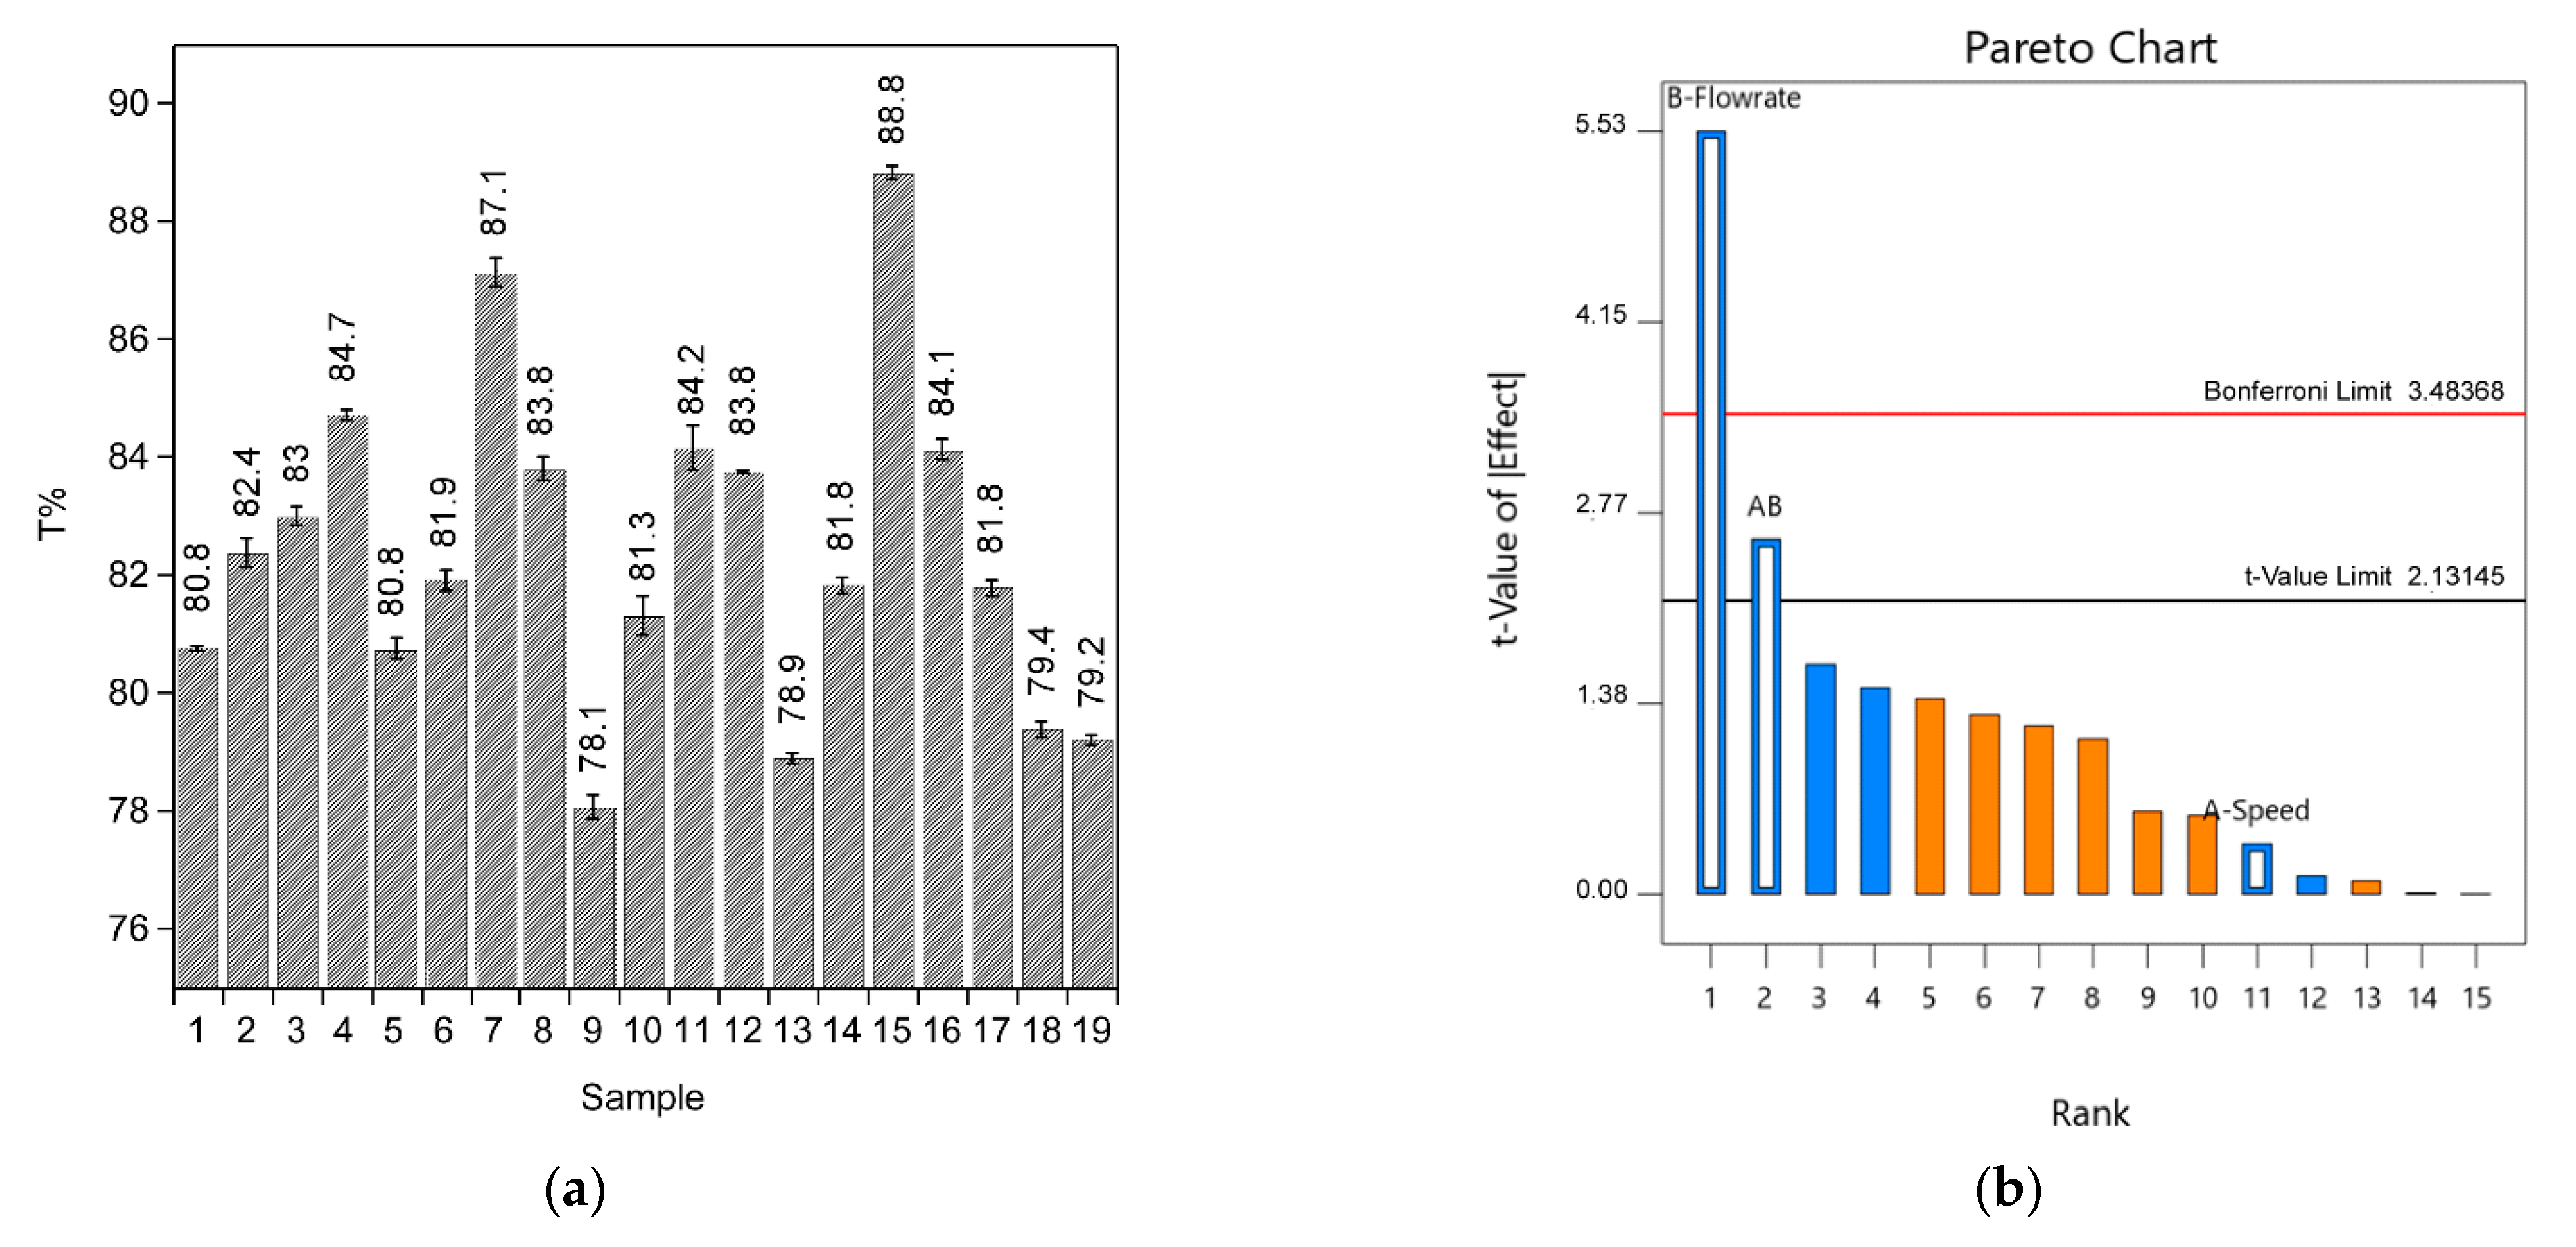
Figure 9a shows the results obtained for the DoE. TiO2 coating was measured by three points per sample. These responses were analyzed by the Unscrambler X software. The pareto chart (Figure 9b) was used to evaluate which variables and effects are the most important. Factor B (Flow rate) and interaction AB (Velocity-Flow rate) were found to be the most significant factors. The analysis model forces variable A (speed) to be considered as a main factor, but the pareto chart and ANOVA resolve it as a non-significant factor.
Table 6 shows the ANOVA results. The Model F-value of 12.46 implies the model is significant. p-values less than 0.0500 indicate that the model terms are significant. In this case, B and AB are significant model terms.
In view of these results, it was considered that an optimization of the parameters was not necessary. The DoE provided parameters to obtain coatings by the slot-die process with similar characteristics to those obtained by immersion. Thus, coatings obtained by both deposition techniques were compared.

2.4. Comparison between Dip Coatings and Slot-Die Coatings

One of the objectives of this work was to assess if coatings of similar characteristics can be obtained by two different application methods (dip coating and slot-die) while retaining the same sol formulation. Therefore, with the help of the DoE, the parameters were established to obtain a coating by the slot-die process with the same optical characteristics to the one obtained by dip coating. These parameters were 50 mm·s−1 speed, 1 mL·min−1 flow rate, 200 μm gap and 0.127 mm shim. To evaluate the slot-die results, substrates were coated by immersion on one side (shielding the other side). Photocatalytic performance was tested by immersing the coated substrates in a borosilicate glass reactor containing 45 mL of an aqueous solution (0.11 mmol dye per m2 coating).
Both types of coatings showed similar photocatalytic activity, but in all cases it is slightly higher in the dip coated substrate (Figure 10), as the degradation constants are higher for the dip coating technology (Table 7). One of the hypotheses of this behavior is associated to the edge effect generated by immersion (area with a thicker coating). This effect is due to the dip coating method. During extraction from the substrate, the liquid slowly evaporates while being subjected to drag forces, including gravity, and more liquid accumulates at the edge of the substrate. Another common defect of this technique is rippling [
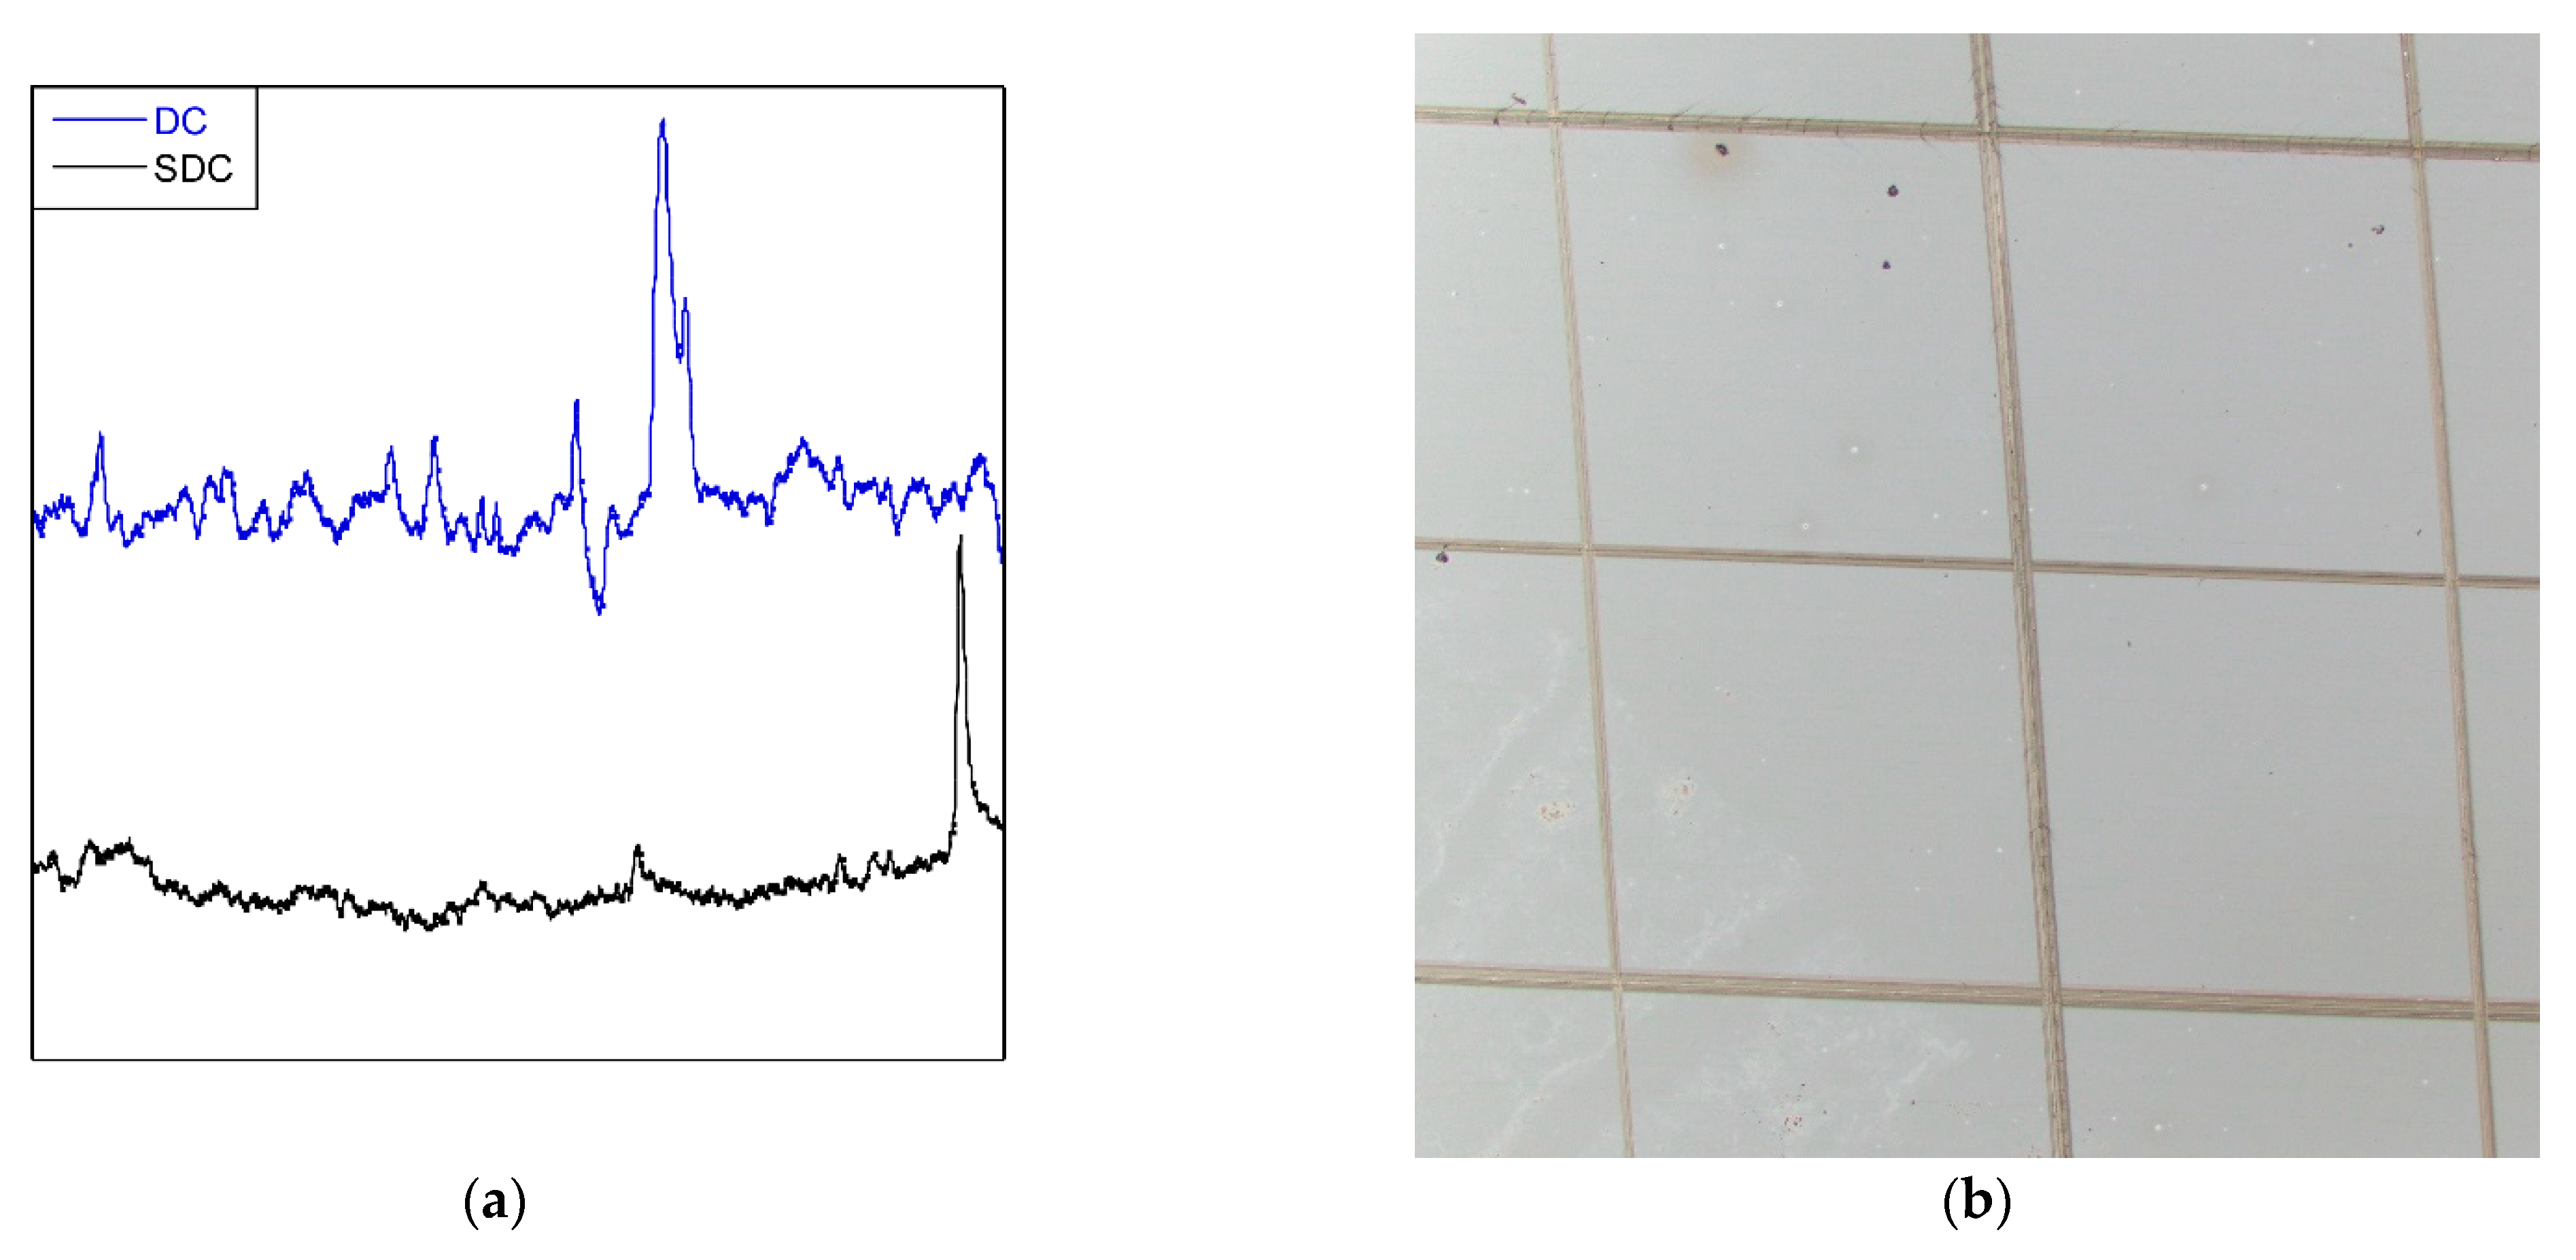
26]. Therefore, slot-die coatings have less roughness due to the process, with Ra values of 0.0074 μm for SDC versus 0.0248 μm for DC. It is an obvious difference in roughness when looking at Figure 11a, which shows the surface profiles of coatings obtained by profilometry. Due to all the aforementioned reasons, dip coating is more active, though the difference between the two methods is small. These are promising results for large-scale sol–gel application, due to its advantages over the immersion method.
As a dip coating sample (Figure 7), the adhesion of the slot-die coating was tested by the cross-cut test, exhibiting good adhesion to the substrate (Figure 11b).

3. Materials and Methods

3.1. Reagents

Titanium butoxide (TNBT, 99%), tetraethyl orthosilicate (TEOS, 98%) and hexadecyltrimethylammonium bromide (CTAB, 99%) were purchased from Acros Organics (Geel, Belgium, EU). Ammonium lauryl sulfate (ALS), Tween80 (TWEEN80), Methyl orange (MO) and Methylene blue (MB) were purchased from Sigma Aldrich (Saint Louis, MO, USA). Remazol Black B 133% (BB) was purchased from Dystar (Singapore, Asia). Absolute ethanol (EtOH), Nitric acid (HNO3, 65%) and distilled water (H2O) from Scharlab, S.L. (Barcelona, Spain, EU), were used in this work.

3.2. Preparation and Deposition of Photocatalytic Coatings

The substrates used in this study are soda-lime glasses previously coated with a SiO2 layer. As demonstrated, a SiO2 interlayer prevents the diffusion of sodium ions from the glass to the TiO2, which would inhibit the photocatalytic activity of the TiO2 layer [27].
Titanium butoxide (TNBT, 99%) was used as a precursor to prepare the photocatalytic films (three porous coatings prepared with three different surfactants and one coating without any surfactant). First, the titanium precursor was dissolved in ethanol (implying a 90% of the total ethanol volume). Secondly, the remaining ethanol was mixed with water and nitric acid and the surfactant was added. The latter solution was added dropwise into the titanium solution, under continuous stirring.
The molar ratio of TNBT:EtOH:H2O:HNO3 was set to 1:165:2:0.04. The surfactant amount was set to 20 wt.% with respect to TNBT. The selected surfactants were non-ionic polyoxyethylene sorbitan monooleate (TWEEN80), cationic Cetyltrimethylammonium Bromide (CTAB) and anionic ammonium lauryl sulfate (ALS) and gave rise to porous photocatalytic coatings labeled PPC-TWEEN, PPC-CTAB and PPC-ALS. The coating obtained in the absence of a surfactant was labeled PPC-0.
Sols were aged for a minimum of 5 days before proceeding with the deposition of the coatings. It was ascertained that before this time the affinity between the liquid and the substrate was not suitable. This meant that the coatings showed defects due to poor wettability and were not homogeneous. As a consequence, the photocatalytic layers showed less activity. Thus, in order to obtain optimum and reproducible coatings, this aging time was established. Coatings were deposited by dip coating and slot-die coating methods. The slot-die parameters (speed, flow rate and gap) were adjusted with the help of a design of experiments (DoE) to obtain coatings of a similar thickness and transmittance to those obtained by dip coating with extraction velocities set at 200 mm·min–1.
All coated substrates were first air dried and then heat treated at 450 °C for 2 h.

3.3. Characterization Measurements

Physical measurements such as X-ray diffraction and gas adsorption were performed on xerogel samples due to the sensibility limitations of performing these measurements on coatings. The xerogel samples were prepared using the same heat treatment as that used for the coatings and then ground with a mortar to obtain a fine powder. The rest of the characterizations were performed on the coatings.
The adhesion of the coating to the substrate was evaluated by optical microscopy. For this purpose, the results of the cross-cut test performed on the substrates according to ASTM D 3359-09e2 standard were studied. The surface roughness of each coating was measured using a roughness tester Perthometer M2 equipped with a diamond tip from Mahr GmbH (Gottingen, Germany, EU), and film thicknesses were measured using mechanical profilometry Veeco Dektak 8, Stylus Profiler from Bruker (Billerica, MA, USA). Morphologies of the samples were observed using a scanning electron microscope (SEM) Ultra Gemini-II Carl Zeiss SMT (Thornwood, NY, USA).
X-ray diffractograms (XRD) were collected on a Phillips X’PERT powder diffractometer (Panalytical, Eindhoven, the Netherlands) equipped with Cu-Kα radiation (λ = 1.54060 Å) over the 2θ range 5°–70°, with a step size of 0.02° and an acquisition time of 2 s per step. The surfaces analysis was carried out by N2 (77 K) adsorption with a Quantachrome Autosorb-iQ-MP (Quantachrome Instruments, Florida, United States). Pore size distribution was estimated by density functional theory (DFT) methods implemented in Quantachrome’s ASiQwin software (ASiQwin V5.21, October 2010). Fourier transform infrared spectroscopy (FTIR, FT/IR-4700LE, JASCO International Co., Ltd., Tokyo, Japan) was used to obtain information on the chemical features of the coatings. FTIR spectra were measured in the 3600–400 cm−1 range.
The optical characterization of the coatings was performed on a UV/VIS/NIR Perkin Elmer Lambda 950 spectrophotometer equipped with an integrating sphere (150 mm Int. Sphere). The transmission (T%) and specular reflectance (R%) measurements were collected over the range 250 to 800 nm with a resolution of 2 nm. On the other hand, the transparency of the coatings was evaluated by calculating the maximum transmittance at 550 nm. The measurements were performed three times and the standard deviation was estimated as required for the designs of experiments.

3.4. Photocatalytic Study Parameters

The photocatalytic activity of the coatings was tested by immersing the substrates in a borosilicate glass reactor containing 80 mL of an aqueous solution (0.11 mmol dye per m2 coating) of a textile dye with an initial concentration of 16.5 μM and pH ≈ 2. The textile dyes were: Methylene Blue (MB), Methyl Orange (MO) and Remazol Black B (BB). The size of the molecule can be an important factor in the elimination of substances, so the study is carried out with different dyes, of which the molecular volumes are 0.30, 0.42, and 1.36 nm3, respectively. The molecular volume was calculated on the basis of the molecular weight, density and the Avogadro’s number.
The source of UV radiation were two fluorescence lamps possessing a maximum emission wavelength of 365 nm. Lamps were placed one on each side of the reactor at 1 cm. Experiments were performed inside a black box to avoid external interference. The radiation emission was produced for 2 h. UV/VIS optical absorption spectrometry (250–800 nm) was used to follow the evolution of the dye concentration over time to evaluate the photocatalytic performance of each coating. The dye concentration was determined with a previous calibration for each dye with its corresponding maximum absorption peak: 505, 597 and 665 nm for MO, BB and MB, respectively. No adsorption phenomena occurred on the surface of the coatings since in the absence of UV radiation no dye was degraded. The effects of the phenomena of photolysis have also been studied, which was not produced under UV radiation, to rule out the influence of these on the results.

3.5. Slot-Die Process

The development of coatings by the slot-die method has many variables. Firstly, one must consider the variables of the fluid, such as viscosity, surface tension and solid content. These variables can be considered constant. On the other hand, there are the mechanical variables of the process, such as deposition speed, flow rate, substrate–head gap and shim (Figure 12). By modifying these variables, coatings of different thicknesses can be obtained. The difficulty of this process lies in correlating these variables to obtain the desired thicknesses, as, unlike other methods, such as spin-coating or dip-coating, the thickness does not depend on a single variable.
The coatings applied by the slot-die method were carried out using equipment developed entirely by Tekniker (Eibar, Spain), except the head, which is manufactured by Nordson EDI (Westlake, OH, USA). The machine consists of two motors to control the elevation and levelling of the head. A third motor controls the movement of the platform on which the substrate is placed, at speeds of 20–150 mm·s−1. This platform has a vacuum system to fix the substrate. Flat substrates with dimensions of 20 × 30 cm2 are used. The liquid is displaced by a peristaltic pump model NE1800 from New Era Pump Systems Inc. (Farmingdale, NY, USA) at flow rates of 1–30 mL·min−1 towards the head, depositing a 10 cm wide coating. The width, as well as the pattern deposition, can be controlled using special masks. The head space can also be varied with masks from 0.005 to 0.035 mm.
Design of experiments (DoE) analysis was carried out using the Design Expert 11 tool of The Unscrambler X software (10.5 version, 2019) to analyze all process variables. 2K full factorial design was selected to study the variables of the process against the transmittance response. Table 8 shows the selected variables and its ranges, needing a total of 16 trials and 3 central points for DoE. Table 9 shows the DoE matrix. The effect of transmittance was gained by using the analysis of variance (ANOVA), which is the method for hypothesis testing in statistics.

4. Conclusions

The results reveal the suitability of these coatings to be applied by an industrially scalable method with the advantages that it involves maintaining the properties achieved with a laboratory-scale method. The use of selected surfactant provided a coating with increased surface area (78.1 m2·g−1) by reducing the particle size (11.3 nm). Coatings exhibited suitable optical properties, and band gap energy values close to expectation (3.26 eV) were also obtained. This leads to an improvement in the rate of matter removal, with increases of 14–23%.
Slot-die coatings were obtained with a transmittance of 87% and band gap energy of 3.26 eV, the same properties as those obtained in the immersion process. The photocatalytic layers removed 39, 51 and 62% of remazol black B, methyl orange and methylene blue dyes in 2 h, respectively. The differences between the two methods were less than 3–6% in terms of photocatalytic performance. One of the major differences between these methods is the volume of dilution used in immersion. This implies a greater control of the stability of the solution and of the risks due to solvent evaporation.
Achieving coatings that maintain optical and photocatalytic properties by the slot-die method can be regarded as a successful result that supports the suitability of this technique to develop sol–gel coatings on a large scale. Furthermore, compared to other industrial coating methods, such as spray-coating, the slot-die method implies appealing cost saving in terms of raw material use and in terms of safety issues, as the presence of volatile compounds in the environment is considerably reduced.

Author Contributions

Conceptualization, A.A.-I., A.M.G. and E.A.; methodology, A.A.-I. and A.M.G.; software, A.A.-I. and A.M.G.; validation, A.M.G., E.A., G.B. and S.P.-Y.; formal analysis, A.A.-I., A.M.G. and A.V.; investigation, A.A.-I.; resources, A.M.G., E.A., G.B., O.C. and S.P.-Y.; data curation, A.A.-I., A.M.G. and A.V.; writing—original draft preparation, A.A.-I., A.M.G. and E.A.; writing—review and editing, A.M.G., E.A., G.B., O.C. and S.P.-Y.; supervision, A.M.G. and E.A.; project administration, A.M.G., E.A. and G.B.; funding acquisition, E.A. All authors have read and agreed to the published version of the manuscript.

Funding

This research was funded by the Basque Government (IT1291-19), the Spanish Ministry of Science and Innovation (MICINN project: PID2019-108028GB-C21), and the European Union’s Horizon 2020 research and innovation program (grant agreement N° 792103 SOLWARIS).

Conflicts of Interest

The authors declare no conflict of interest.

References

  1. Ji, Y.; Mattsson, A.; Niklasson, G.A.; Granqvist, C.G.; Österlund, L. Synergistic TiO2/VO2 Window Coating with Thermochromism, Enhanced Luminous Transmittance, and Photocatalytic Activity. Joule 2019, 3, 2457–2471. [Google Scholar] [CrossRef]
  2. Powell, M.J.; Quesada-Cabrera, R.; Taylor, A.; Teixeira, D.; Papakonstantinou, I.; Palgrave, R.G.; Sankar, G.; Parkin, I.P. Intelligent Multifunctional VO2/SiO2/TiO2 Coatings for Self-Cleaning, Energy-Saving Window Panels. Chem. Mater. 2016, 28, 1369–1376. [Google Scholar] [CrossRef]
  3. Serpone, N.; Emeline, A.V. Suggested terms and definitions in photocatalysis and radiocatalysis. Int. J. Photoenergy 2002, 4, 93–131. [Google Scholar] [CrossRef] [Green Version]
  4. Ola, O.; Maroto-Valer, M.M. Review of material design and reactor engineering on TiO2 photocatalysis for CO2 reduction. J. Photochem. Photobiol. C Photochem. Rev. 2015, 24, 16–42. [Google Scholar] [CrossRef] [Green Version]
  5. Dette, C.; Pérez-Osorio, M.A.; Kley, C.S.; Punke, P.; Patrick, C.E.; Jacobson, P.; Giustino, F.; Jung, S.J.; Kern, K. TiO2 anatase with a bandgap in the visible region. Nano Lett. 2014, 14, 6533–6538. [Google Scholar] [CrossRef] [PubMed]
  6. Vera, M.L.; Leyva, G.; Litter, M.I. Simple TiO2 coatings by sol-gel techniques combined with commercial TiO2 particles for use in heterogeneous photocatalysis. J. Nanosci. Nanotechnol. 2017, 17, 4946–4954. [Google Scholar] [CrossRef]
  7. Ramirez-del-Solar, M.; Blanco, E. Porous Thin Films from Sol-Gel. In Submicron Porous Materials; Springer International Publishing: Cham, Switzerland, 2017; pp. 157–188. ISBN 9783319530352. [Google Scholar]
  8. Tanaka, H.; Obana, S. Coatings with Photocatalyst on Architectural Glass. In Handbook of Sol-Gel Science and Technology; Klein, L., Aparicio, M., Jitianu, A., Eds.; Springer International Publishing: Cham, Switzerland, 2016; pp. 1–15. ISBN 978-3-319-19454-7. [Google Scholar]
  9. Cha, H.C.; Huang, Y.C.; Hsu, F.H.; Chuang, C.M.; Lu, D.H.; Chou, C.W.; Chen, C.Y.; Tsao, C.S. Performance improvement of large-area roll-to-roll slot-die-coated inverted polymer solar cell by tailoring electron transport layer. Sol. Energy Mater. Sol. Cells 2014, 130, 191–198. [Google Scholar] [CrossRef]
  10. Park, J.; Shin, K.; Lee, C. Improvement of cross-machine directional thickness deviation for uniform pressure-sensitive adhesive layer in roll-to-roll slot-die coating process. Int. J. Precis. Eng. Manuf. 2015, 16, 937–943. [Google Scholar] [CrossRef]
  11. Wang, J.; Mao, Q. Methodology Based on the PVT Behavior of Polymer for Injection Molding. Adv. Polym. Technol. 2012, 32, 474–485. [Google Scholar] [CrossRef]
  12. Whitaker, J.B.; Kim, D.H.; Larson, B.W.; Zhang, F.; Berry, J.J.; Van Hest, M.F.A.M.; Zhu, K. Scalable slot-die coating of high performance perovskite solar cells. Sustain. Energy Fuels 2018, 2, 2442–2449. [Google Scholar] [CrossRef]
  13. Jagodzinski, H. H.P. Klug und L.E. Alexander: X-ray Diffraction Procedures for Polycrystalline and Amorphous Materials, 2. Auflage. John Wiley & Sons, New York-Sydney-Toronto 1974, 966 Seiten, Preis: £18.55. In Berichte der Bunsengesellschaft für Physikalische Chemie; John Wiley & Sons: Hoboken, NJ, USA, 1975; Volume 79, p. 553. ISBN 978-0-471-49369-3. [Google Scholar]
  14. Holzwarth, U.; Gibson, N. The Scherrer equation versus the ‘Debye-Scherrer equation’. Nat. Publ. Gr. 2011, 6, 534. [Google Scholar]
  15. Vasconcelos, D.C.L.; Costa, V.C.; Nunes, E.H.M.; Sabioni, A.C.S.; Gasparon, M.; Vasconcelos, W.L. Infrared Spectroscopy of Titania Sol-Gel Coatings on 316L Stainless Steel. Mater. Sci. Appl. 2011, 2, 1375–1382. [Google Scholar] [CrossRef] [Green Version]
  16. Thommes, M.; Kaneko, K.; Neimark, A.V.; Olivier, J.P.; Rodriguez-Reinoso, F.; Rouquerol, J.; Sing, K.S.W. Physisorption of gases, with special reference to the evaluation of surface area and pore size distribution (IUPAC Technical Report). Pure Appl. Chem. 2015, 87, 1051–1069. [Google Scholar] [CrossRef] [Green Version]
  17. Tauc, J.; Grigorovici, R.; Vancu, A. Optical Properties and Electronic Structure of Amorphous Germanium. Phys. Status Solidi 1966, 15, 627–637. [Google Scholar] [CrossRef]
  18. Makuła, P.; Pacia, M.; Macyk, W. How To Correctly Determine the Band Gap Energy of Modified Semiconductor Photocatalysts Based on UV-Vis Spectra. J. Phys. Chem. Lett. 2018, 9, 6814–6817. [Google Scholar] [CrossRef] [PubMed] [Green Version]
  19. Luttrell, T.; Halpegamage, S.; Tao, J.; Kramer, A.; Sutter, E.; Batzill, M. Why is anatase a better photocatalyst than rutile?—Model studies on epitaxial TiO2 films. Sci. Rep. 2015, 4, 1–8. [Google Scholar] [CrossRef] [PubMed] [Green Version]
  20. Tang, H.; Berger, H.; Schmid, P.E.; Lévy, F.; Burri, G. Photoluminescence in TiO2 anatase single crystals. Solid State Commun. 1993, 87, 847–850. [Google Scholar] [CrossRef]
  21. Tang, H.; Prasad, K.; Sanjinès, R.; Schmid, P.E.; Lévy, F. Electrical and optical properties of TiO2 anatase thin films. J. Appl. Phys. 1994, 75, 2042–2047. [Google Scholar] [CrossRef]
  22. Anpo, M.; Shima, T.; Kodama, S.; Kubokawa, Y. Photocatalytic hydrogenation of CH3CCH with H2O on small-particle TiO2: Size quantization effects and reaction intermediates. J. Phys. Chem. 1987, 91, 4305–4310. [Google Scholar] [CrossRef]
  23. Kim, D.S.; Han, S.J.; Kwak, S.Y. Synthesis and photocatalytic activity of mesoporous TiO2 with the surface area, crystallite size, and pore size. J. Colloid Interface Sci. 2007, 316, 85–91. [Google Scholar] [CrossRef]
  24. Das, N.S.; Ghosh, P.K.; Mitra, M.K.; Chattopadhyay, K.K. Effect of film thickness on the energy band gap of nanocrystalline CdS thin films analyzed by spectroscopic ellipsometry. Phys. E Low-Dimens. Syst. Nanostructures 2010, 42, 2097–2102. [Google Scholar] [CrossRef]
  25. Houas, A.; Lachheb, H.; Ksibi, M.; Elaloui, E.; Guillard, C.; Herrmann, J.M. Photocatalytic degradation pathway of methylene blue in water. Appl. Catal. B Environ. 2001, 31, 145–157. [Google Scholar] [CrossRef]
  26. Schwartz, R.W. Chemical solution deposition—Basic principles. In Solution Processing of Inorganic Materials; John Wiley & Sons: Hoboken, NJ, USA, 2009; pp. 33–76. ISBN 9780813801247. [Google Scholar]
  27. Hashimoto, K.; Irie, H.; Fujishima, A. TiO2 photocatalysis: A historical overview and future prospects. Jpn. J. Appl. Phys. Part 1 Regul. Pap. Short Notes Rev. Pap. 2005, 44, 8269–8285. [Google Scholar] [CrossRef]
Figure 1. PXRD patterns of PPCs (pink line: Simulated PXRD from the crystallographic information file retrieved in the Inorganic Crystal Structure Database for anatase ICSD no.: 024276; black line: PPC-0; blue line: PPC-ALS; green line: PPC-CTAB; red line: PPC-TWEEN).
Catalysts 11 00711 g001
Figure 2. Excerpt of the PXRD patterns showing the broadening of (101) reflection.
Catalysts 11 00711 g002
Figure 3. Infrared spectra of sol–gel titania xerogel.
Catalysts 11 00711 g003
Figure 4. N2 isotherms and pore size distribution (inset). The pore size distribution was modelled using DFT fitting: (a) PPC-0; (b) PPC-ALS; (c) PPC-CTAB; (d) PPC-TWEEN.
Catalysts 11 00711 g004aCatalysts 11 00711 g004bCatalysts 11 00711 g004c
Figure 5. (a) Tauc plots of TiO2 layers. The linear part of the plot is extrapolated to the abscissa axis. (b) Enlarged section of the linear part extrapolated to the x-axis.
Catalysts 11 00711 g005
Figure 6. SEM image of surface morphologies: (a) PPC-ALS and (b) PPC-0.
Catalysts 11 00711 g006
Figure 7. Microscope images of the samples after the cross-cut test: (a) PPC-0; (b) PPC-ALS; (c) PPC-CTAB; (d) PPC-TWEEN.
Catalysts 11 00711 g007
Figure 8. Evolution of the relative dye concentration for the photocatalytic coatings with diferent surfactants. Fitting of the dyes’ photodegradation to the first-order kinetic model, showing the resulting rate constants for all coatings: BB photocatalysis (a) and kinetics (b); MO photocatalysis (c) and kinetics (d); MB photocatalysis (e) and kinetics (f).
Catalysts 11 00711 g008
Figure 9. (a) Transmittance results for the design of experiments; (b) Pareto chart.
Catalysts 11 00711 g009
Figure 10. (a) Comparison of evolution of the relative dye concentration between different applications methods. (b) Fitting of the dye photodegradation to the first-order kinetic model, showing the resulting rate constants. Blue circles: remazol black B (BB); red squares: methyl orange (MO); black rhombuses: methylene blue (MB). Filled figures: dip coating (DC); empty figures: slot-die coating (SDC).
Catalysts 11 00711 g010
Figure 11. (a) Surface profile of DC (dip coating) and SDC (slot-die coating) coatings obtained by profilometry. (b) Microscope image of the sample SDC after the cross-cut test.
Catalysts 11 00711 g011
Figure 12. Diagram of the slot-die process and coating parameters.
Catalysts 11 00711 g012
Table 1. Full width at half maximum (FWHM) and crystallite sizes.
CodeFWHM (°)Dcrystallite (nm)
PPC-00.49517.2
PPC-ALS0.75111.3
PPC-CTAB0.61013.9
PPC-TWEEN0.59014.4
Table 2. Thickness (th) and roughness (Ra) values of the coatings.
Codeth (nm)Ra (μm)
PPC-052.50.0172
PPC-ALS32.20.0565
PPC-CTAB39.30.0537
PPC-TWEEN33.90.0365
Table 3. Pore size distribution (Dmode and Drange), surface area (BET) and porosity values.
CodeDmode (nm)Drange (nm)BET (m2·g−1)Porosity (%)
PPC-05.54.0–11.214.47.9
PPC-ALS5.42.8–8.178.123.1
PPC-CTAB5.33.92–41.626.914.9
PPC-TWEEN5.93.5–8.838.815.8
Table 4. Optical measurements data.
T(550nm)%Band Gap (eV)
SiO2 layer89.43
PPC-087.253.25
PPC-ALS86.923.26
PPC-TWEEN87.733.28
PPC-CTAB89.813.31
Table 5. Dye photocatalytic decomposition in 2 h (R) and rate constant (K) values.
CodeR (%)K (h–1)
PPC-0
-(BB)28.120.159
-(MO)41.990.269
-(MB)41.230.271
PPC-ALS
-(BB)42.780.284
-(MO)56.050.412
-(MB)64.770.552
PPC-CTAB
-(BB)25.430.152
-(MO)46.760.310
-(MB)47.520.312
PPC-TWEEN
-(BB)33.600.209
-(MO)52.110.374
-(MB)55.480.436
Table 6. Results of the ANOVA test for transmittance.
SourceSum of SquaresDfMean SquareF-Valuep-Value
Model86.27328.7612.460.0003
A-Speed0.316410.31640.13710.7168
B-Flowrate70.60170.6030.58<0.0001
AB15.35115.356.650.0219
Curvature18.64118.648.070.0131
Residual32.32142.31
Lack of Fit28.15122.351.130.5633
Pure Error4.1722.08
Cor Total137.2318
Table 7. Comparison of dye photocatalytic decomposition (R) and rate constant (K) values for dip (DC) and slot-die (SDC) coatings.
CodeR (%)K (h–1)
DC
-(BB)42.780.284
-(MO)56.050.412
-(MB)64.770.552
SDC
-(BB)38.870.252
-(MO)50.670.357
-(MB)62.050.493
Table 8. Experiment factors of DoE.
VariableRangeUnit
Velocity20–50mm·s−1
Flow rate1–5mL·min−1
Gap200–500μm
Shim0.005–0.035mm
Table 9. Experimental matrix for 24 full factorial design.
SpeedFlow RateGapShim
1++++
2+++
3+++
4++
5+++
6++
7++
8+
9+++
10++
11++
12+
13++
14+
15+
16
Publisher’s Note: MDPI stays neutral with regard to jurisdictional claims in published maps and institutional affiliations.

