Article

Mesoporous TiO2 from Metal-Organic Frameworks for Photoluminescence-Based Optical Sensing of Oxygen

by
Michela Alfè
1,*,
Valentina Gargiulo
1,*,
Matteo Amati
2,
Valentin-Adrian Maraloiu
3,
Pasqualino Maddalena
4 and
Stefano Lettieri
5
1
Istituto di Scienze e Tecnologie per l’Energia e la Mobilità Sostenibili (CNR-STEMS), 80125 Naples, Italy
2
Elettra-Sincrotrone Trieste S.C.p.A di Interesse Nazionale, I-34149 Trieste, Italy
3
National Institute of Materials Physics, 077125 Magurele, Romania
4
Dipartimento di Fisica “E. Pancini”, Università degli Studi di Napoli “Federico II”, 80126 Naples, Italy
5
Istituto di Scienze Applicate e Sistemi Intelligenti “Eduardo Caianiello” (CNR-ISASI), 80078 Pozzuoli, Italy
*
Authors to whom correspondence should be addressed.
Catalysts 2021, 11(7), 795; https://doi.org/10.3390/catal11070795
Submission received: 8 June 2021 / Revised: 26 June 2021 / Accepted: 27 June 2021 / Published: 29 June 2021
(This article belongs to the Special Issue TiO2-Based Nanostructures and Photocatalysts)

Abstract

:
Metal−organic frameworks (MOFs) are a class of porous coordination networks extraordinarily varied in physicochemical characteristics such as porosity, morphologies, and compositions. These peculiarities make MOFs widely exploited in a large array of applications, such as catalysis, chemicals and gas sensing, drug delivery, energy storage, and energy conversion. MOFs can also serve as nanostructured precursors of metal oxides with peculiar characteristics and controlled shapes. In this work, starting from MIL125-(Ti), a 1,4-benzenedicarboxylate (BDC)-based MOF with Ti as metallic center, mesoporous TiO2 powders containing both anatase and rutile crystalline phases were produced. A challenging utilization of these porous MOF-derived Ti-based oxides is the optically-based quantitative detection of molecular oxygen (O2) in gaseous and/or aqueous media. In this study, the photoluminescence (PL) intensity changes during O2 exposure of two MOF-derived mixed-phase TiO2 powders were probed by exploiting the opposite response of rutile and anatase in VIS-PL and NIR-PL wavelength intervals. This result highlights promising future possibilities for the realization of MOF-derived doubly-parametric TiO2-based optical sensors.

1. Introduction

The detection of gaseous oxygen (O2) in gas mixtures and/or aqueous environments is important for many of applications, such as air quality control, packaging, life sciences, and automotive and chemical industry [1,2,3,4].
The most employed techniques for measuring the O2 concentration include Winkler titration, electroanalytic methods, pressure-based methods and optics-based (optical) methods [4].
Optical sensors, or opt(r)odes, are chemical sensors in which the interaction of the electromagnetic radiation with the sample causes the change of a particular optical parameter, the resulting change being related to the concentration of the analyte [5]. Optical sensors can be based on various optical principles (absorbance, reflectance, luminescence, fluorescence) and can cover different regions of the electromagnetic spectrum (UV, Visible, IR, NIR). Moreover, optical sensors can allow for the measurement not only of the light intensity, but also of other related properties, such as lifetime, refractive index, scattering, diffraction, and polarization [5]. Optical oxygen sensors have become attractive in the last years thanks to: (a) The lack of oxygen consumption during measurements; (b) The full reversibility; (c) The good precision and accuracy; (d) The possibility to employ remote sensing using optical fibers; (e) The ease of miniaturization; (f) The possibility of performing non-invasive measurements; (g) The possibility of enabling O2 imaging both over large areas and on a micrometer scale [4]. However, optical sensors also exhibit some shortcomings connected to possible interferences with ambient light, the occurrence of indicator leaching or photobleaching in long-term applications, and, in some cases, poor selectivity and limited dynamic range [5].
The most commonly applied methods for optical oxygen sensing are those based on light absorption or light emission. Compared to absorption-based methods, those based on molecular emission (luminescence) are particularly attracting because they ensure extreme sensitivity and good specificity, coupled with a very simple and cheap instrumentation. Many O2 sensors are based on the effect of the luminescence (fluorescence or phosphorescence) quenching of oxygen-sensitive probes (OSPs) [4]. The O2 concentration is determined by the change in the emission properties of the OSP and real-time measurements can be performed. After a dynamic collision between molecular (triplet) oxygen and the excited electronic state of the OSP, a reduction in the luminescent intensity, as a consequence of the oxygen quenching of the emitting state, is detected, as well as the luminescent intensity decay time. The precision and the accuracy of luminescence intensity-based methods are greatly affected by: (i) The fluctuations in the intensity of the light source; (ii) The detector sensitivity; (iii) The inner filter effects; (iv) The indicator concentration (bleaching and leaching); (v) The sample turbidity or the sensing layer thickness. However, some of these problems can be minimized or even overcome by measuring luminescence lifetimes instead of intensities [5].
A variety of fluorescent and luminescent materials ranging from molecules, complexes, and nanoparticles (NPs) have been proposed and tested in recent years for luminescent-based sensing. In particular, the photoluminescence (PL) properties of metal oxide nanopowders as ZnO, TiO2, SnO2, WO3 have been studied for the sensing of gases (O2, N2, H2, CO, CO2) [6]. Among semiconductor materials for gas sensors, metal oxide nanopowders are particularly interesting, since they exhibit limited or no toxicity, are easy to handle materials with high sensitivity to external stimuli, and can be grown with excellent crystal quality using different physical [7,8,9] and chemical fabrication techniques [6].
Nowadays, metal oxides are routinely exploited for chemical sensing and are considered the materials of choice for the preparation of chemoresistive sensors. Interestingly, some of them (ZnO, SnO2, TiO2) have been shown to be similarly suitable for optical sensing based on PL response to the analytes [10,11,12,13,14]. TiO2 has been proven to be especially interesting for PL-based sensing due to its phase-dependent photoluminescence emission [15]. Moreover, TiO2 plays a key role in many applications due to its photocatalytic properties [16,17] that fostered its utilization in several fields, even including plasmonic photocatalysis [18] and the preparation of photonic structures such as multilayered systems [19,20] or metasurfaces [21], employable in biological sensing [22] and photocatalysis [23,24]. Moreover, improved properties have been reported for materials obtained by the hybridization of TiO2 with organic or inorganic phases [25,26,27,28].
The possible use of TiO2 as PL-based probe of O2 has been investigated by Lettieri et al. in studies on TiO2 nanostructures having different preparations routes and morphologies. The evidence indicates that opposite responses to O2 exposure are exhibited by rutile phase (whose near-infrared PL is enhanced by O2 adsorption) and by anatase phase (whose visible PL is instead quenched by O2) [14,29,30]. A clear understanding for the origin of such difference has not been reached. However, from an application standpoint, it is worth underlining that this phenomenon allows using mixed-phase TiO2 for the preparation of inorganic (and hence unconventional) ratiometric O2 optical sensors [29]. This finding highlights the potentialities of the photoluminescence-based sensing compared to conventional conductometric methods based on single-parameter responses.
Starting from such a result, in this work we explored the possibility of producing mesoporous mixed-phase TiO2 from a metal organic framework (MOF) and testing it as a dual-emitting O2 optical probe. As far as we know, this is the first study evidencing the performances of the MOF-derived TiO2 for this specific application [31].
The preparation of functional materials such as metal oxides, metal carbides, and carbon-supported metal particles using MOFs as solid precursors is referred to as the MOF-mediated synthesis route (MOFMS), and has been demonstrated in the recent literature as an effective and extremely versatile approach [32,33,34,35]. Such a method implies the use of the MOF as a sacrificial template by exploiting the framework collapse at high temperature under a controlled atmosphere [34,35]. By properly selecting the calcination/pyrolysis atmosphere, temperature, heating rate, and holding time, the organic linker of the framework is completely or partially burnt away or carbonized, establishing a new metal ions/clusters matrix with well controlled structural properties [34]. The porosity, particle dimension, carbon content, and functional groups distribution of the MOF-derived material can be thus finely tuned. During the thermal treatment, the typical MOF porous framework evolves into metal oxides or mixed metal oxides/carbonaceous porous structures with metals highly dispersed on the ligand-derived carbon matrix and exposing large amounts of active sites [36]. MOFMS is a convenient, eco-friendly, and versatile synthesis route. In contrast with conventional approaches, namely those based on templating strategy, MOFMS allows for the development of highly simplified preparation protocols, free of the drawbacks related to the template removal [37]. A relevant advantage of the MOFMS is also the improving of the stability of the obtained materials, and the limitation of the metal oxides nanoparticle aggregation [36].
In this work, the MIL125-(Ti) has been selected as the TiO2 precursor. MIL125-(Ti) is a highly porous MOF made up of titanium-oxo-hydroxo clusters and dicarboxylate linkers (Ti8O8(OH)4(BDC)6, BDC = benzene-1,4-dicarboxylate), and was proposed for the first time by Dan-Hardi et al. in 2009 [38]. The MIL125-(Ti) structure consists of cyclic octamers (built up from corner- or edge-sharing octahedral titanium units) connected to 12 other cyclic octamers through BDC linkers, leading to a porous, three-dimensional quasi-cubic tetragonal structure having two types of cages, an octahedral (12.5 Å) and a tetrahedral (6 Å) one, accessible through narrow triangular windows of ~6 Å [39]. The presence of triangular windows allows for the strong rigidity of the structure [38].
Two calcination temperatures were explored in the 500–600 °C range, with the aim of obtaining anatase and rutile mixed-phase TiO2, since the transition from anatase to rutile occurs in this specific range. The as-synthesized samples, identified in the following sections as MT-500 and MT-600 (where MT hereinafter stands for MIL125-(Ti)-derived TiO2 and 500 and 600 for the applied calcination temperature) were characterized by TGA, SEM, HRTEM, N2 adsorption–desorption isotherms, XRD and PL, FTIR, and XPS. The effects of calcination temperature on the specific surface area of the samples, the transformation of the TiO2 crystal phase, and the performances toward O2 sensing were investigated for application as doubly-parametric TiO2-based optical sensors.

2. Results and Discussion

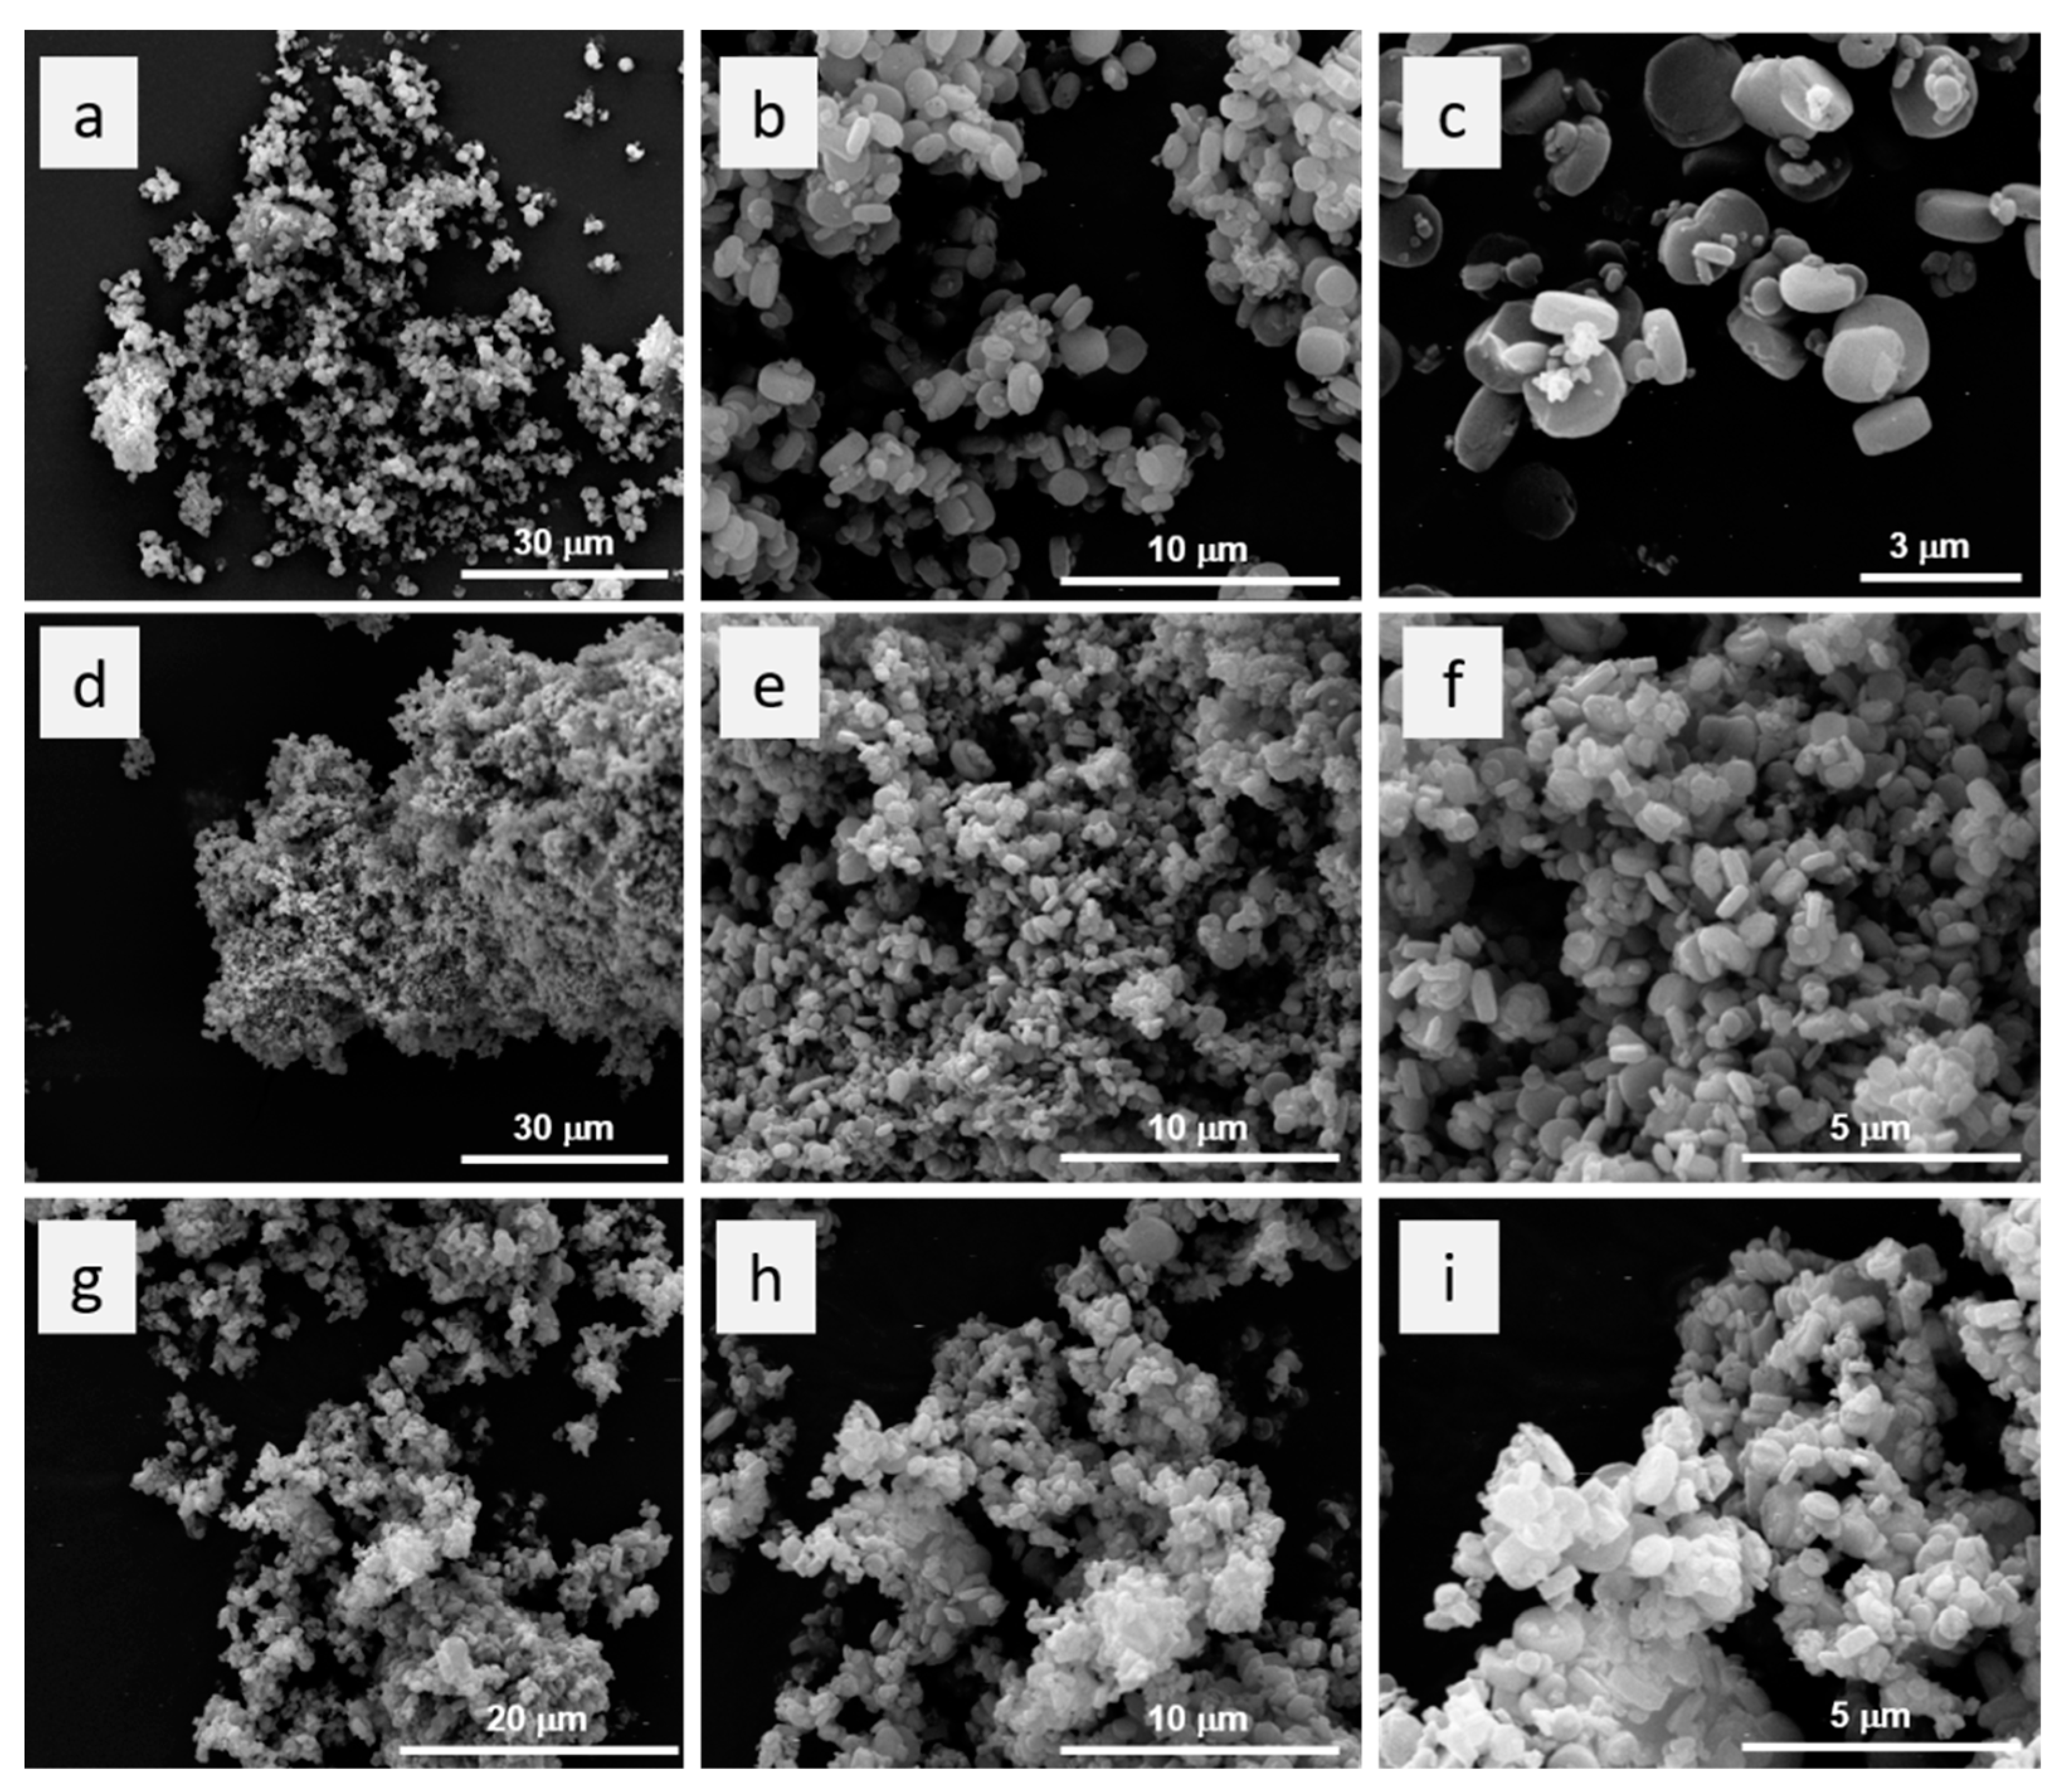
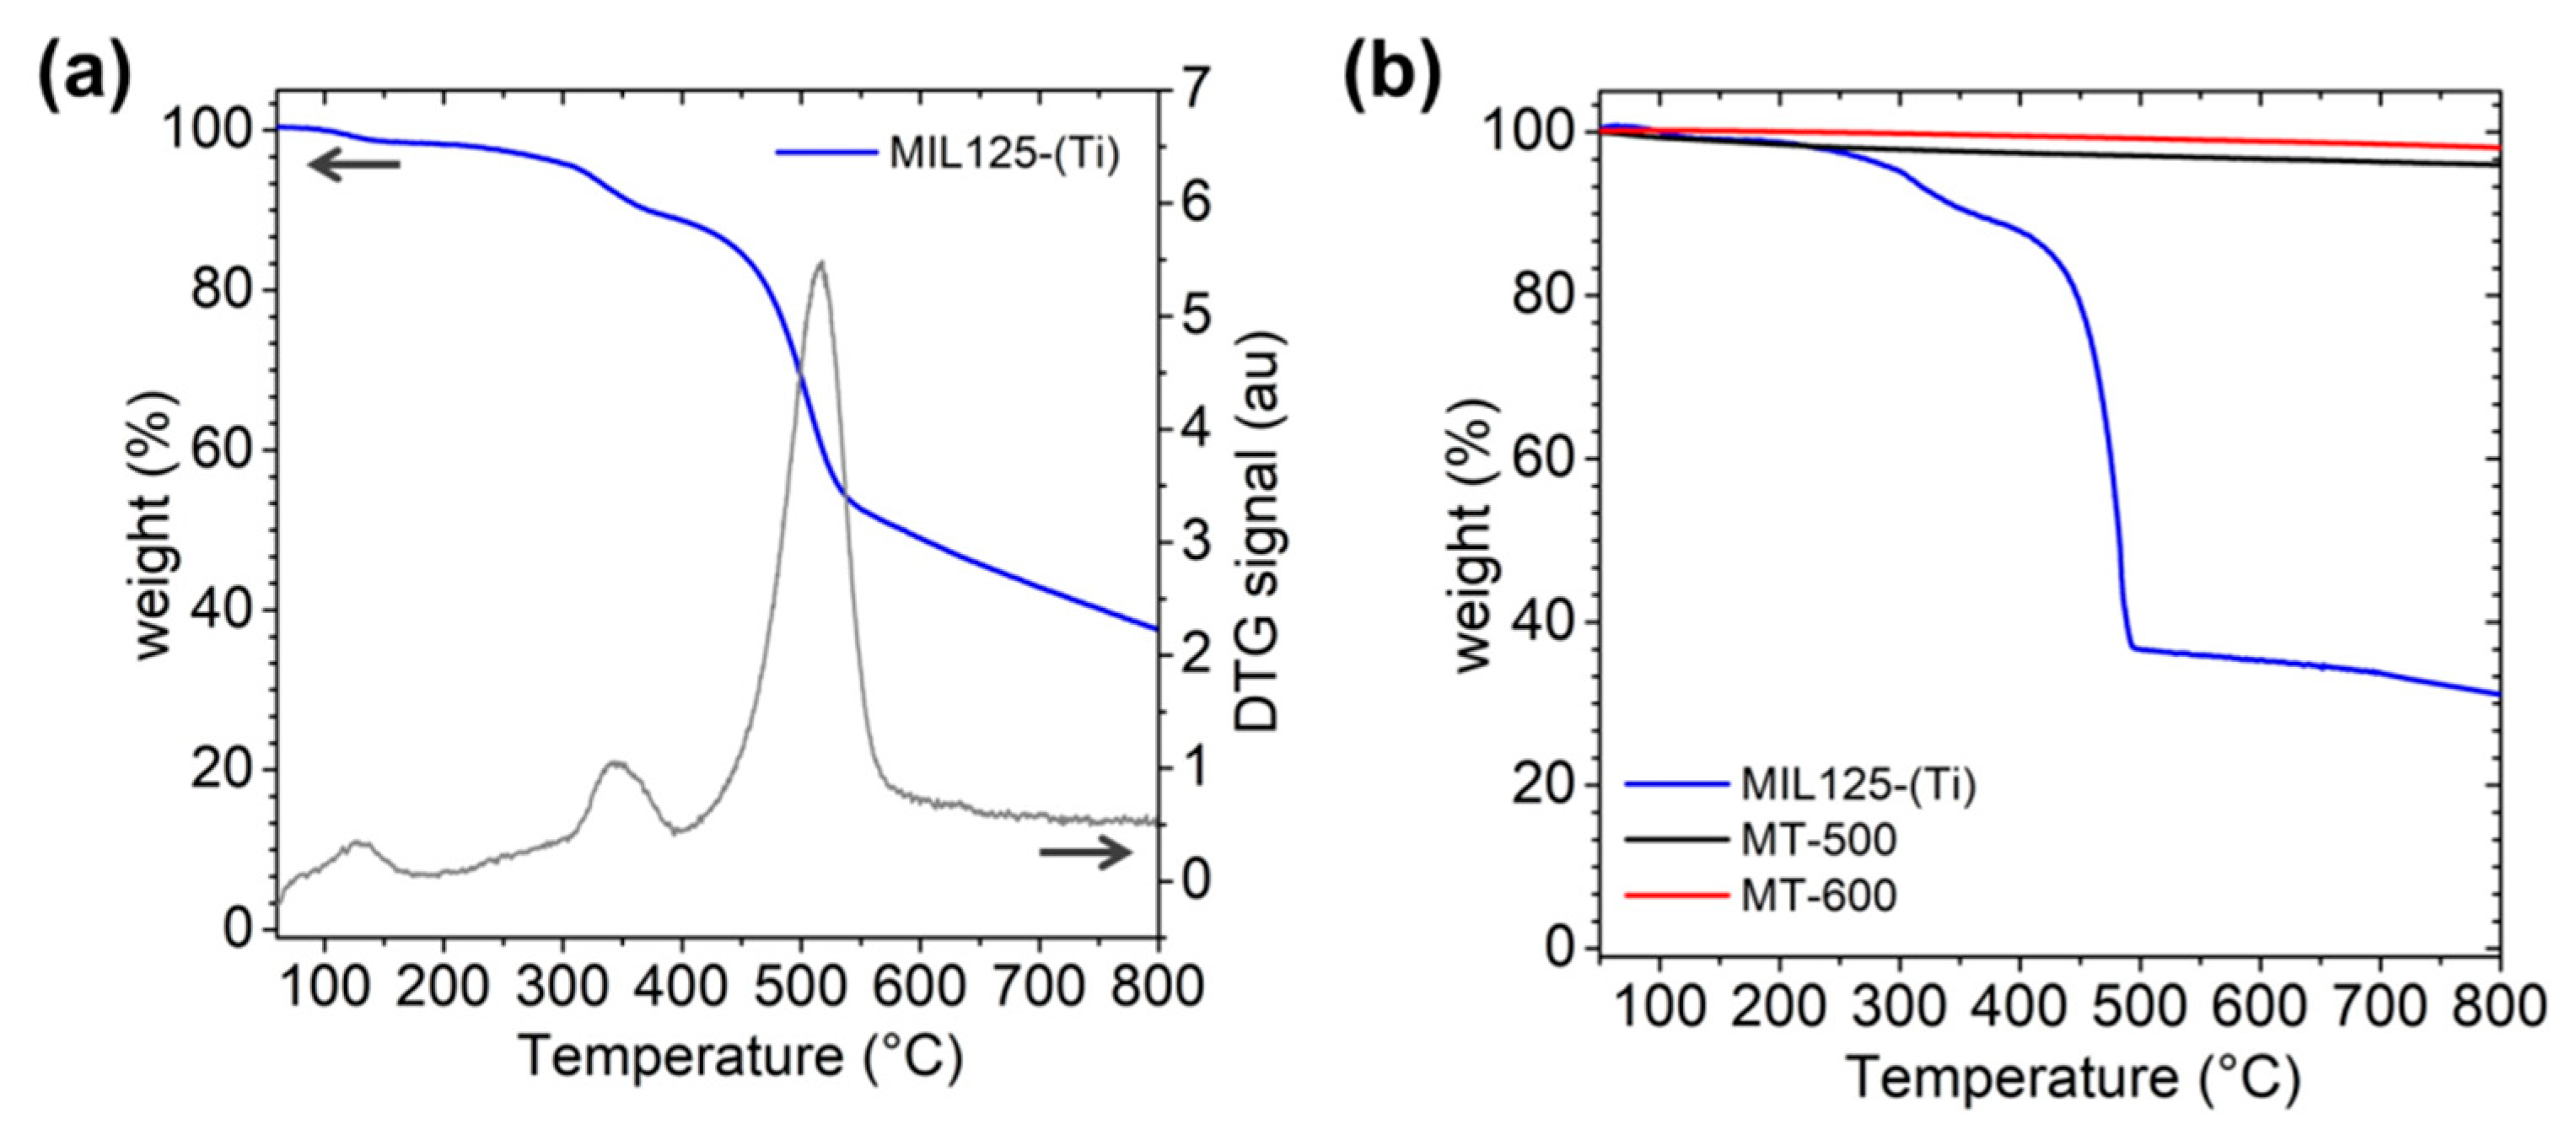
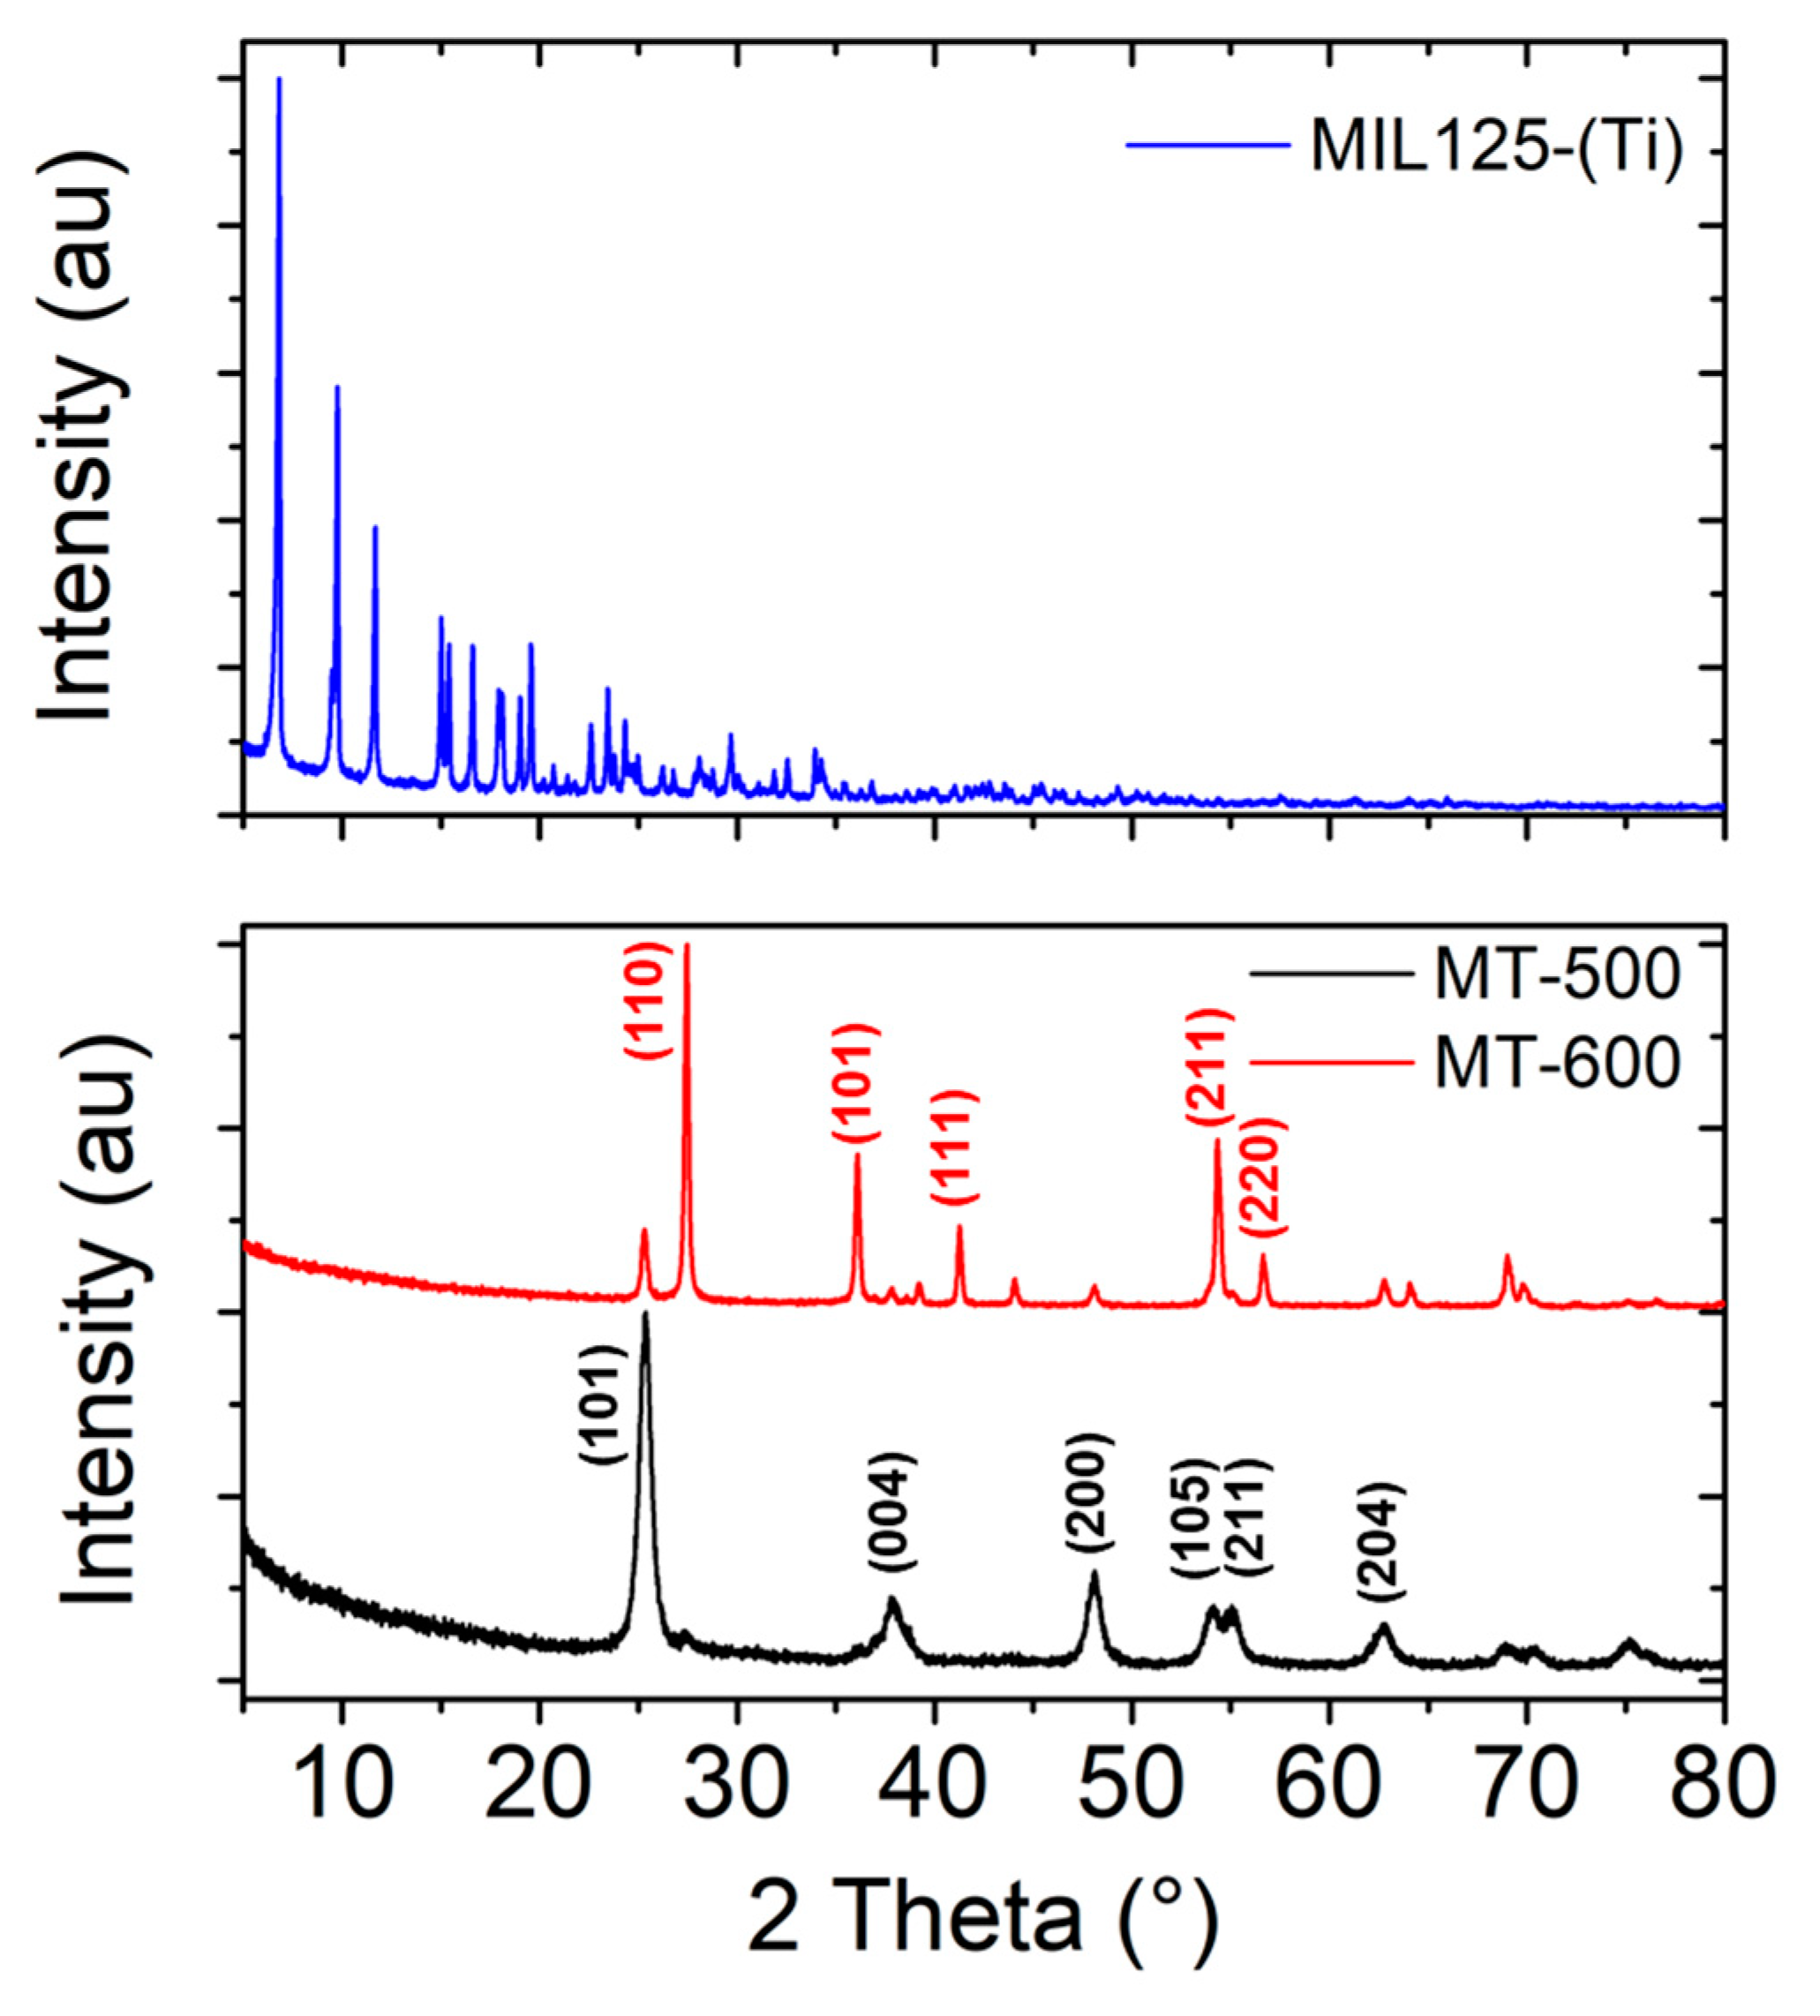
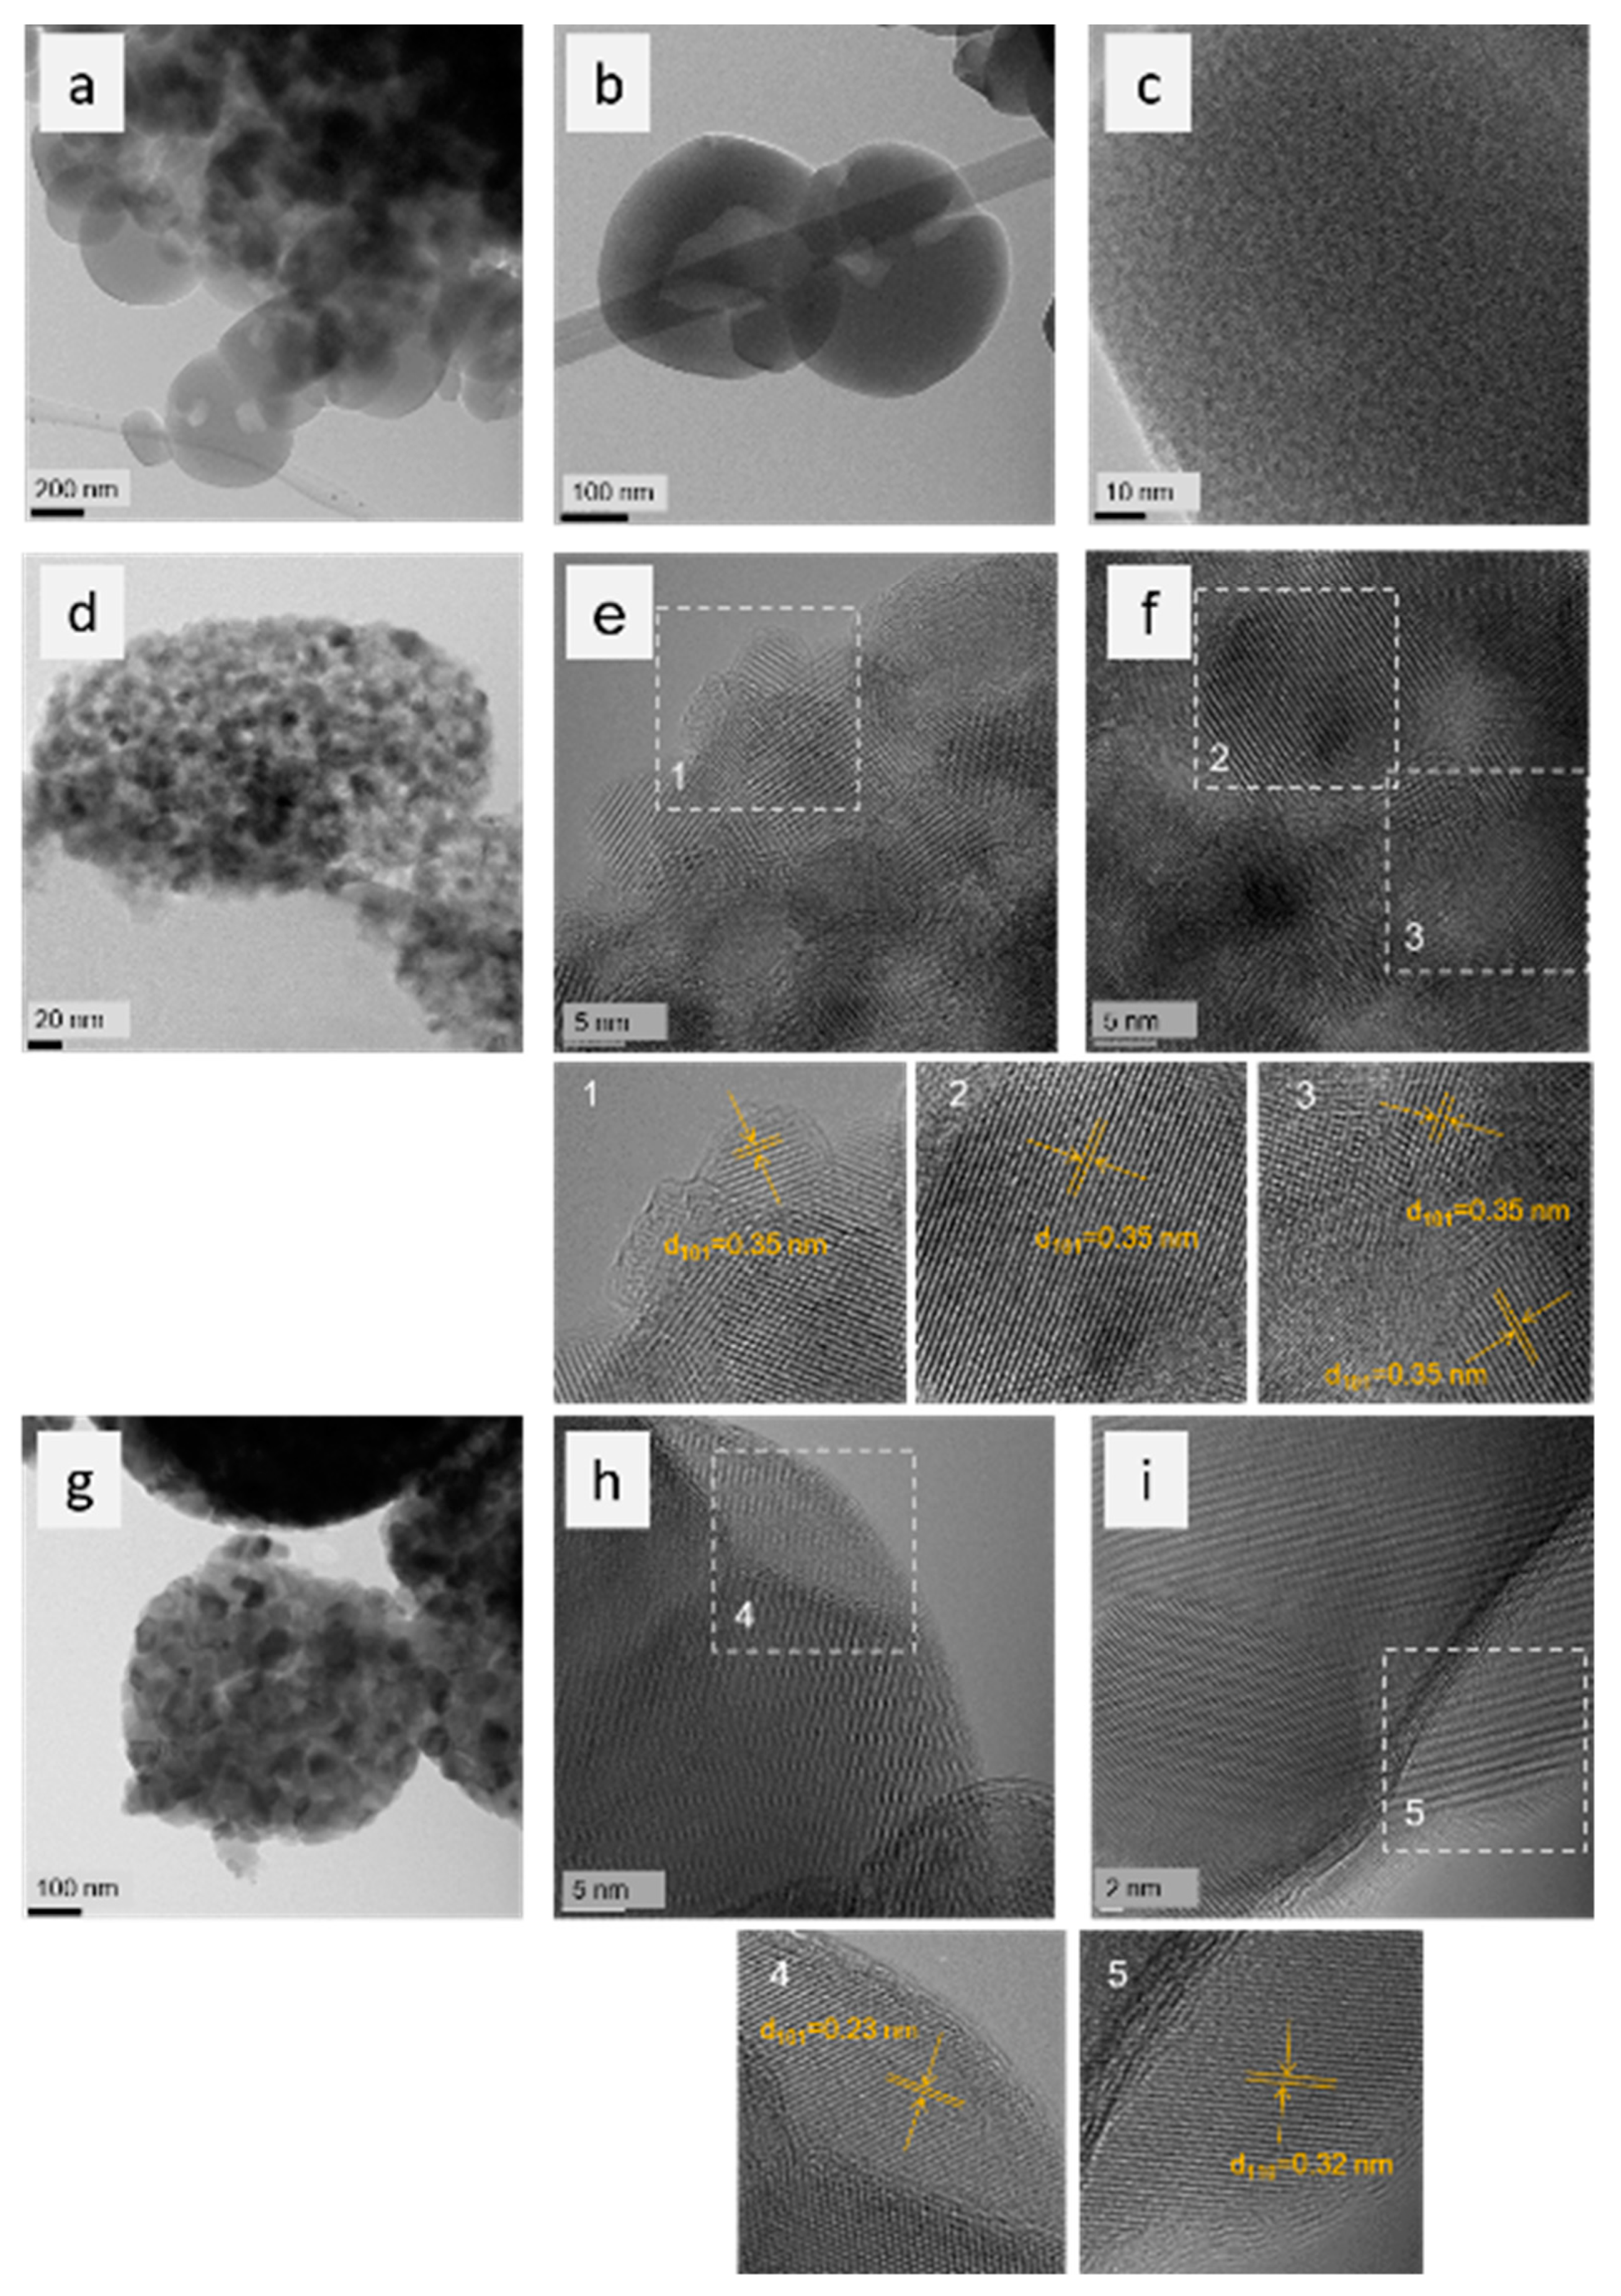
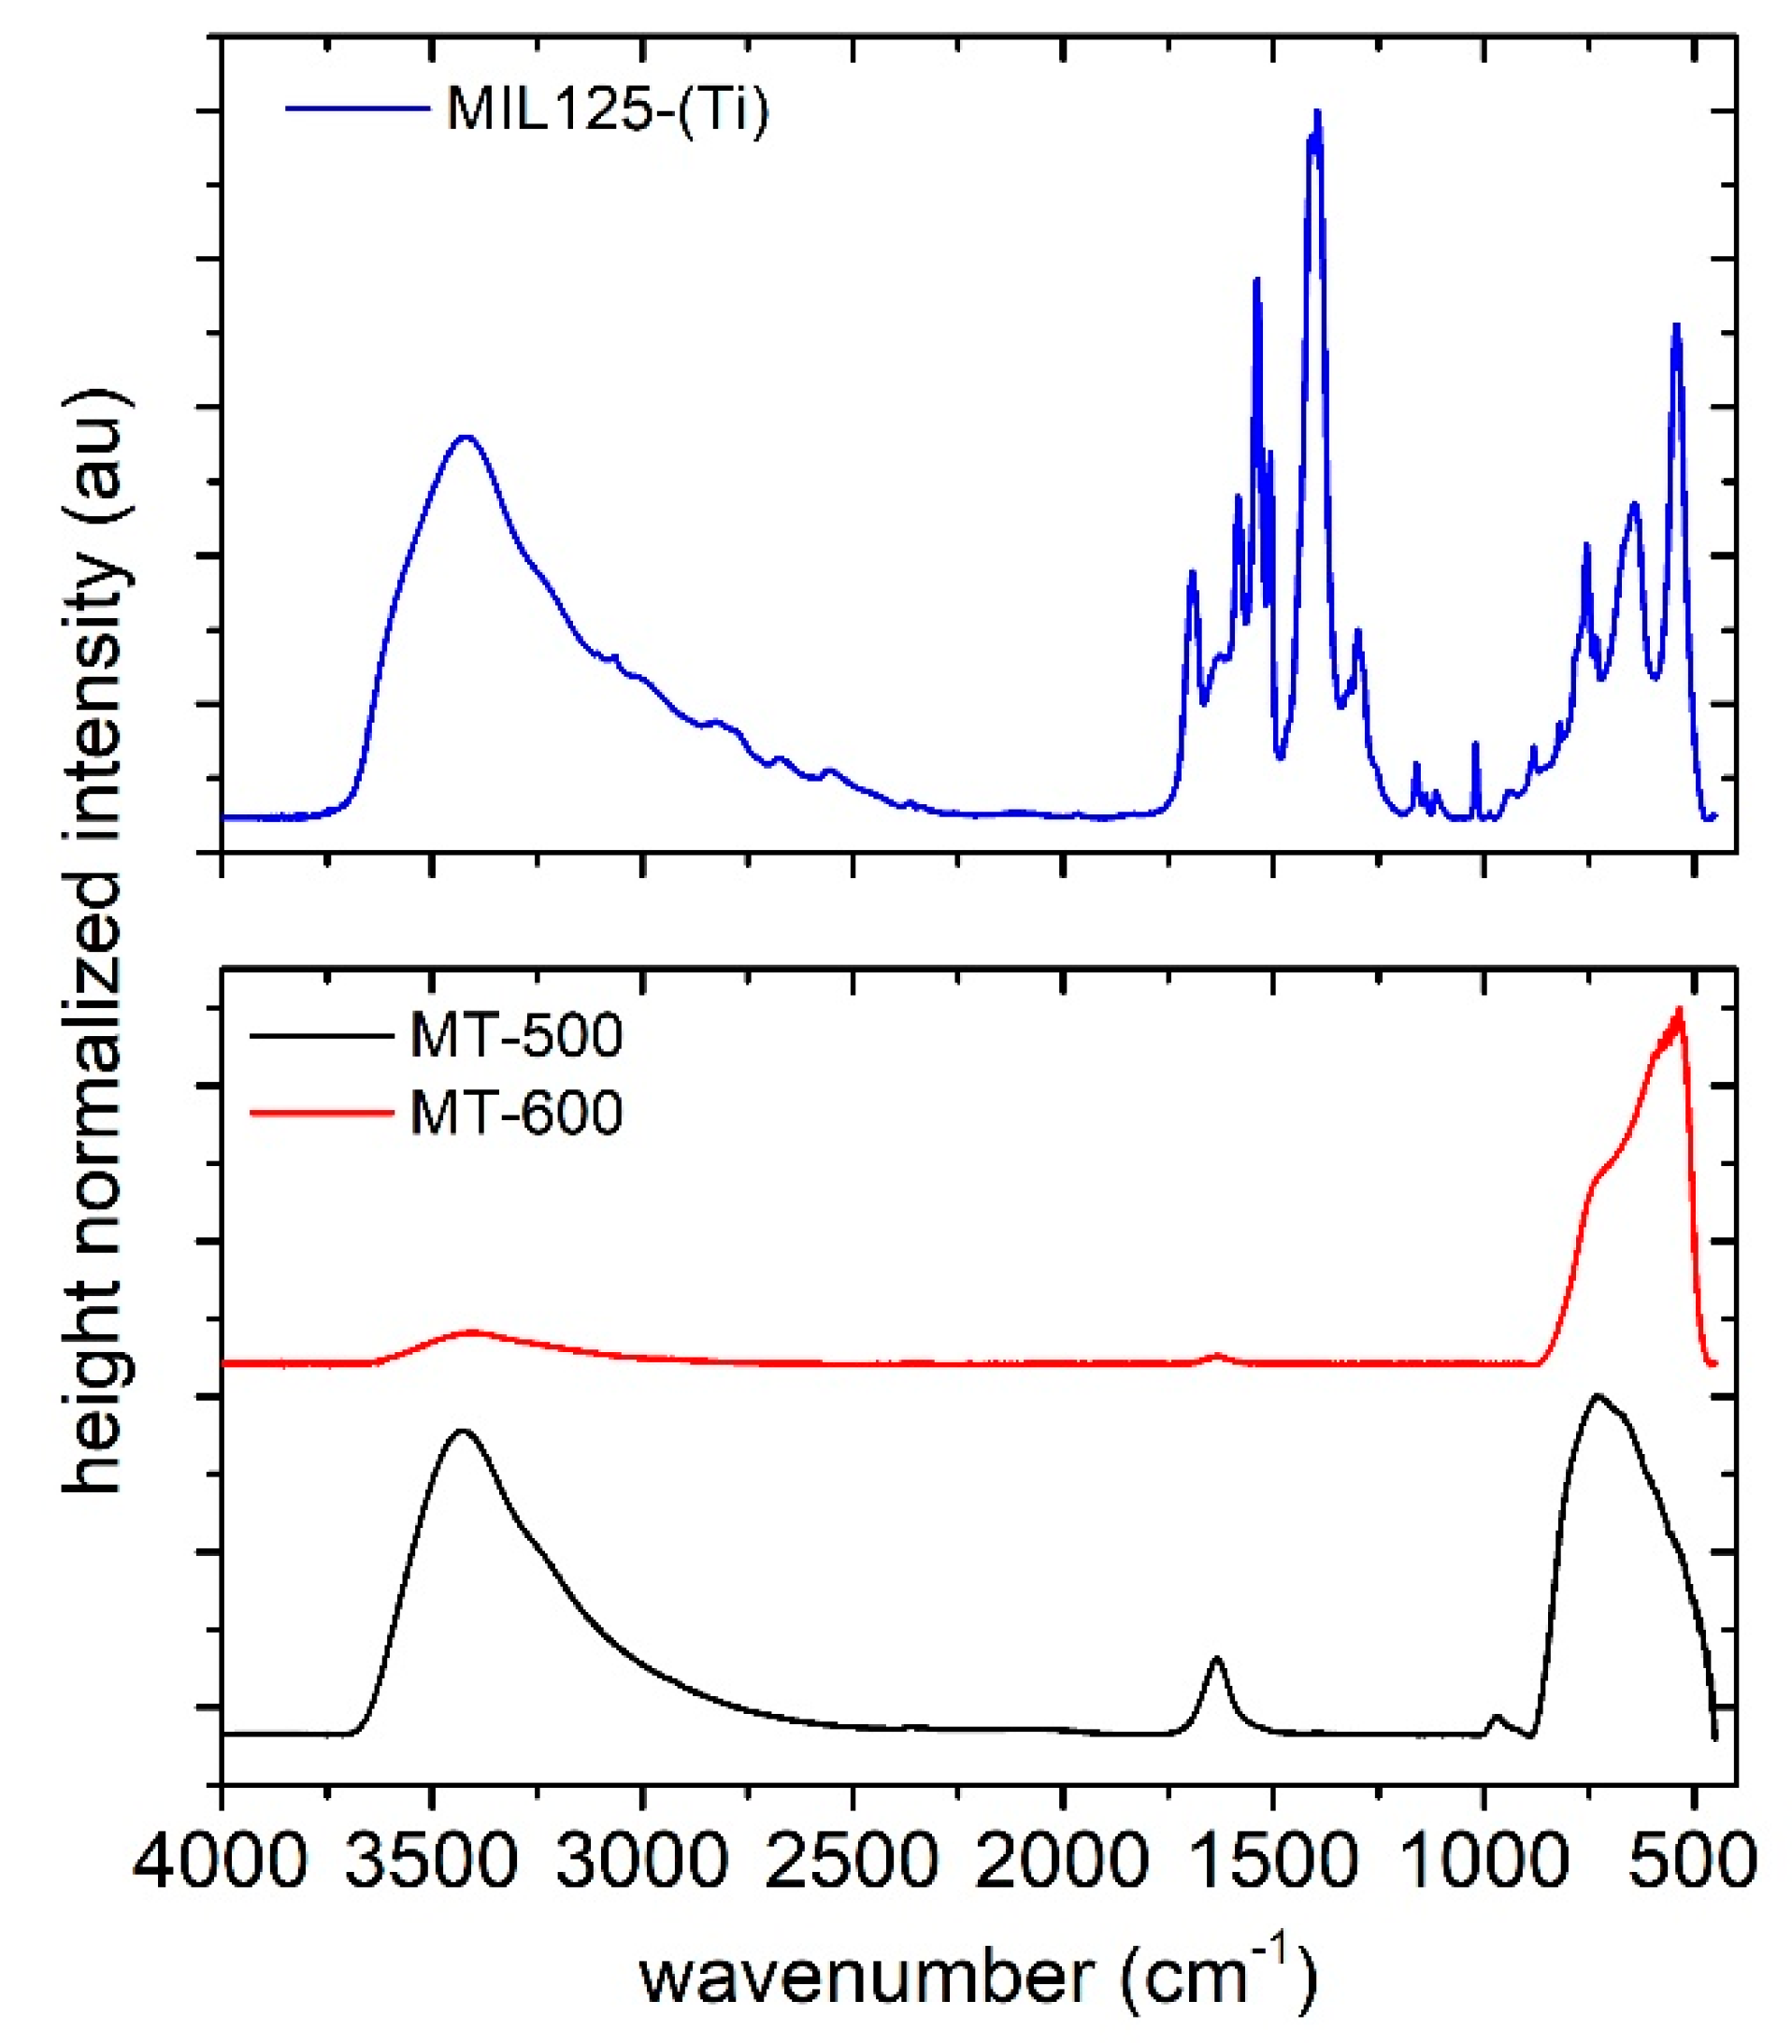
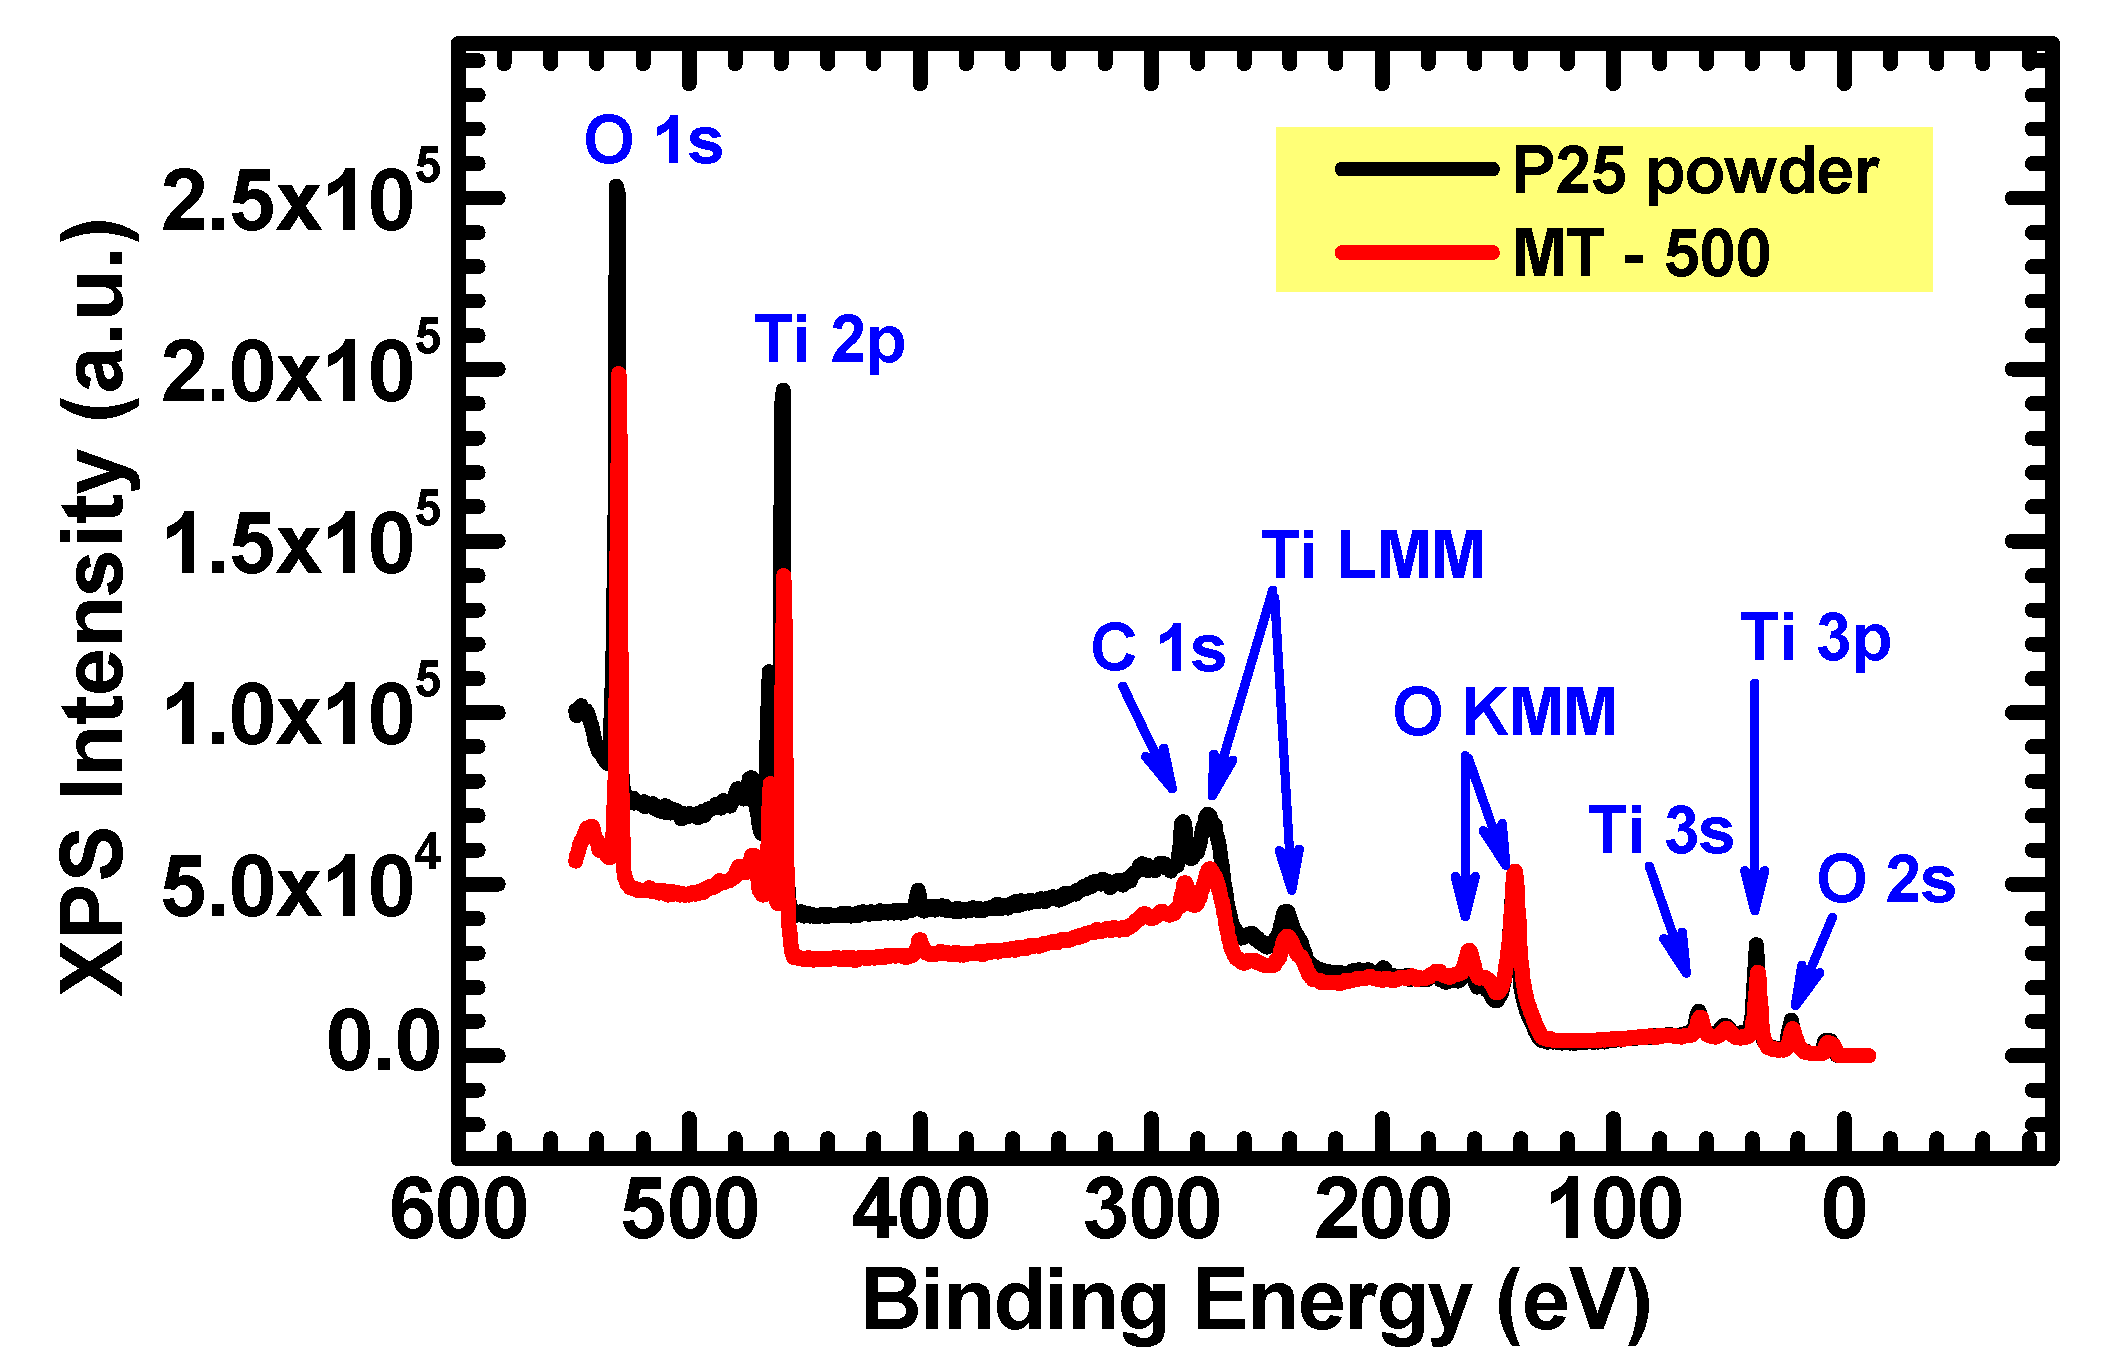
2.1. MIL125-(Ti), MT-500 and MT-600 Structural Characteristics

MIL125-(Ti) crystals are characterized by a thin disk-like shape (about 600 nm thick and less than 1.5 μm wide) with a rough surface morphology (Figure 1a–c), in agreement with the results of other authors applying solvothermal synthetic approaches [36,37,40,41].
MT-500 and MT-600 preserve the disk-like shape of the precursor (Figure 1d–i), despite the high calcination temperatures (500 °C and 600 °C, respectively) applied for their production.
MIL125-(Ti) is thermally stable up to 300 °C, as indicated by TGA in N2 environment (Figure 2a). Before that temperature, a 2% weight loss was observable and ascribable to the removal of solvent molecules entrapped inside the MOF pores. After 300 °C a weight loss of about 5%, probably ascribable to hydroxyl groups loss [38], was detected. In the end, the great weight loss around 550 °C, accounting for 60% mass loss, was due to the decomposition of the organic ligand, accompanied by the collapse of the framework. The white residue at 800 °C was around 38 wt.%. The overall thermal behavior was in accordance with previous findings [34,35,36,38,39,40].
Before the calcination procedure for the MT-500 and MT-600 production, the thermal behavior of the precursor MIL125-(Ti) was probed under oxidative conditions (air) to properly set the final calcination temperatures (Figure 2b). MIL-125-(Ti) is stable in air up to 400 °C, and it is fully converted into TiO2 after 500 °C. The white residue at 800 °C was 31% of the initial MOF weight (Figure 2b, blue line).
The MT-500 and MT-600 yields (wt.%) were around 35 wt.% for both samples (Figure 2b). The TiO2 content of MT-500 and MT-600, estimated by full combustion in air in the TG apparatus [35], was between 96–98 wt.% (Figure 2b) and, as expected on the basis of the higher calcination temperature, MT-600 contained the highest TiO2 content (98 wt.% vs. 96 wt.% as measured at 800 °C).
The effect of the calcination temperature on the specific surface areas (SSA) and the pore size distribution of the MOF-derived TiO2 was evaluated by N2 adsorption–desorption isotherm measurements. The specific surface area of MIL125-(Ti), calculated in accordance with the BET method, was 1079 m2/g and, based on the shape of N2 adsorption isotherm (Figure 3a), the material exhibits a microporous character (type I isotherm [37]), in agreement with previously reported findings [34,36,39,40]. A slight hysteresis loop at high pressure values was also detected and attributed to the mesoporous voids existing among the crystalline particles [42]. The microporous nature of MIL125-(Ti) was also testified by the high total pore volume (Table 1). The pores are mainly distributed below 30 Å (Figure 3b), a finding that also agrees with the values reported in literature [36].
The isotherms of the MT-500 and MT-600 shown in Figure 3a can be classified as type IV [43], and both exhibited a hysteresis loop at relative pressures P/P0 above 0.5, which is characteristic of mesoporous materials. As the calcination temperature increased, the SSA decreased from 1079 m2/g of pristine MOF to 120 m2/g and 14 m2/g of MT-500 and MT-600, respectively (Table 1). The external surface area of the samples has been also evaluated by using the t-plot method. It was found that the external surface area and the specific surface area (BET method) coincided in the case of the MT-500 and MT-600 samples, confirming the mesoporous nature of the two materials. In the case of MIL-125(Ti), the external surface area is 139 m2/g, in line with the highly microporous nature of such sample. The mesopores distribution, evaluated by the BJH model, moved from an average value of 40 Å of the parent MOF, to an average value of 55 Å and 65 Å for MT-500 and MT-600, respectively (Figure 3b).
SSA values below 250 m2/g for MOF-derived TiO2 have also been reported by other authors [44]. It is worth noting that commercial TiO2 powders are characterized by lower SSA and scarce porosity [26] compared to those achievable by MOF mediated synthesis.
Wang et al. [44] affirmed that, on the basis of the MIL125-(Ti) structure, at the beginning of conversion due to the homogenous reaction conditions, the formation of many tiny TiO2 subunits takes place, leading to nanosized TiO2 particles, also at a low calcination temperature (350 °C). Moreover, since each Ti atom is surrounded by six O atoms in MIL125-(Ti), long-range atomic migration is not needed, allowing for the partial preservation of the MOF porous structure inside of a porous TiO2 network [44].
The crystallinity change from MOF network to TiO2 was testified by XRD. The diffraction pattern of the as-synthesized MIL125-(Ti) (Figure 4 (top)) showed diffraction peaks at 2θ = 6.8, 9.8, 11.7, 15.0, 15.4, 16.6, 18.1, 19.0, 19.6, 22.6, 23.5, 24.3, and 29.7°, which were in agreement with the typical MIL125-(Ti) diffraction pattern [36,40].
After the calcination at 500 and 600 °C, the diffraction peaks ascribable to the pristine MIL125-(Ti) were completely lost (Figure 4 (Bottom)).
The XRD pattern of MT-500 exhibited intense peaks at 25.8°, 38.7°, 48.3°, 54.4°, 55.4°, 63°, 69.5°, and 75°, typical of the crystal planes of the anatase phase [35]. Less intense diffraction peaks at 27.1° and 36.1°, ascribable to rutile phase, were also detected.
When the calcination temperature reached 600 °C, the rutile crystalline phase (peaks at 27.8, 36.1, 41.3°, and 54.4° assigned to the (110), (101), and (211) planes of rutile [35]) prevails over the anatase phase, however such phase was still present. This finding implies that both MT-500 and MT-600 were characterized by a mixed anatase/rutile phase.
The weight fraction of anatase phase in both MOF-derived TiO2 nanoparticles was evaluated on the basis of the intensities of the anatase (101) and rutile (110) diffraction peaks [45], and resulted in 97.8% and 10.6% in MT-500 and MT-600, respectively.
The average crystallite sizes of the dominant phase were evaluated using Scherrer’s formula and were 10.3 nm for MT-500 (evaluated on the basis of the anatase (101) diffraction peak) and 35.6 nm for MT-600 (evaluated on the basis of the rutile (110) diffraction peak). These results indicated that a higher calcination temperature allows for the production of TiO2 particles with a larger crystallite size [36], accompanied by a lower SSA.
The microstructures of MIL125-(Ti) and of the MOF-derived TiO2 (MT-500 and MT-600) were investigated by low- and high-magnification TEM imaging (Figure 5). The TEM imaging clearly evidences the TiO2 crystal growth for MT-500 and MT-600, in agreement with the findings from the XRD analysis, while any particles were distinguishable in the MOF network, confirming the absence of TiO2.
Mixed lattice fringes were present in both MT-500 and MT-600 samples. The lattice fringes of MT-500 presented dominant interplanar distances of 0.350 nm assigned to the (101) planes of anatase [46], while lattice fringes with an interplanar spacing of 0.325 nm, assigned to the (110) plane of rutile, were largely present in MT-600. The interplanar distance of 0.238 nm between the fringes perpendicular to the (101) planes of rutile [47] was also evidenced in the MT-600 sample (Figure 5h).
The phase transition from MOF to TiO2 has been also monitored by FTIR spectroscopy. The FTIR spectrum of MIL125-(Ti) (Figure 6 (top)) was characterized by the following absorption signals: a large broad band centered at 3430 cm−1, assigned to –OH stretching; strong bands at 1657 and 1408 cm−1, assigned to the vibrational stretching frequencies of the carboxylate (–COO) groups of the ligand units; bands at 1013 and 740 cm−1, ascribable to the vibrations of benzene rings; bands between 400 and 800 cm−1, attributed to O–Ti–O vibrations [36,40,42].
The FTIR spectra of MT-500 and MT-600 (Figure 6 (Bottom)) did not contain bands ascribable to the MOF precursor, but only broad bands typical of TiO2 [48] (e.g., the wide band in the region 800–4500 cm−1, typical of Ti-O and/or Ti-O-Ti bonds and O-H bending mode around 1650 cm−1), confirming the complete conversion into TiO2.
The complete conversion of MIL125-(Ti) into TiO2 was also probed by X-ray photoelectron spectroscopy (XPS) measurements. The full survey spectrum of the MT-500 (Figure 7) demonstrated that the material contained the typical signatures of a mixed phase TiO2 (the survey of a commercial P25 specimen is reported in Figure 7 for comparison).

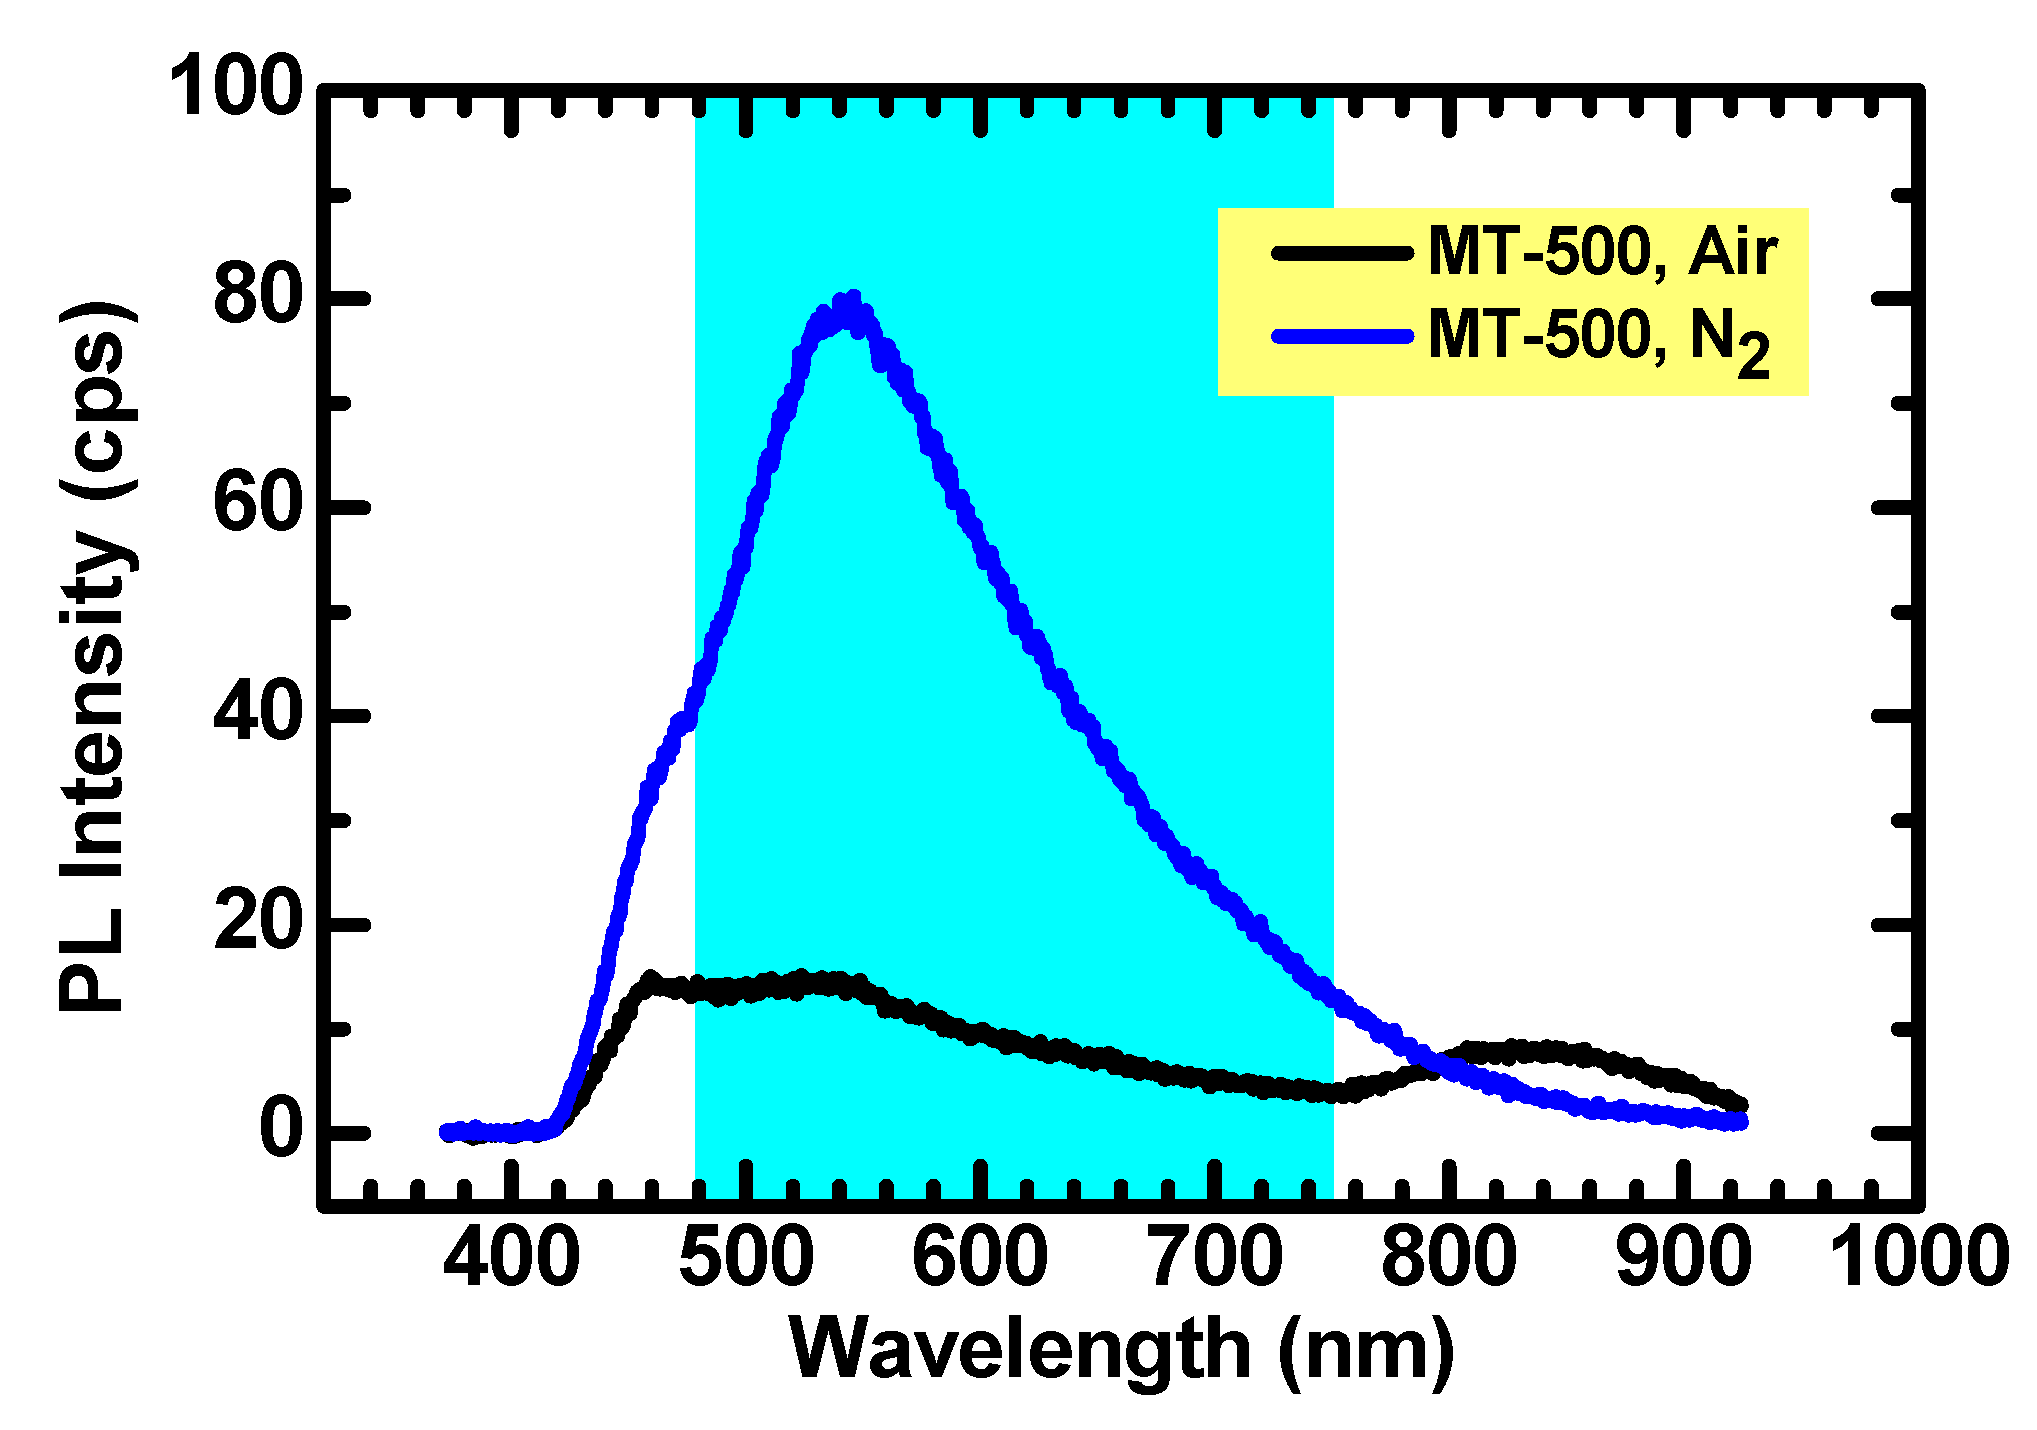
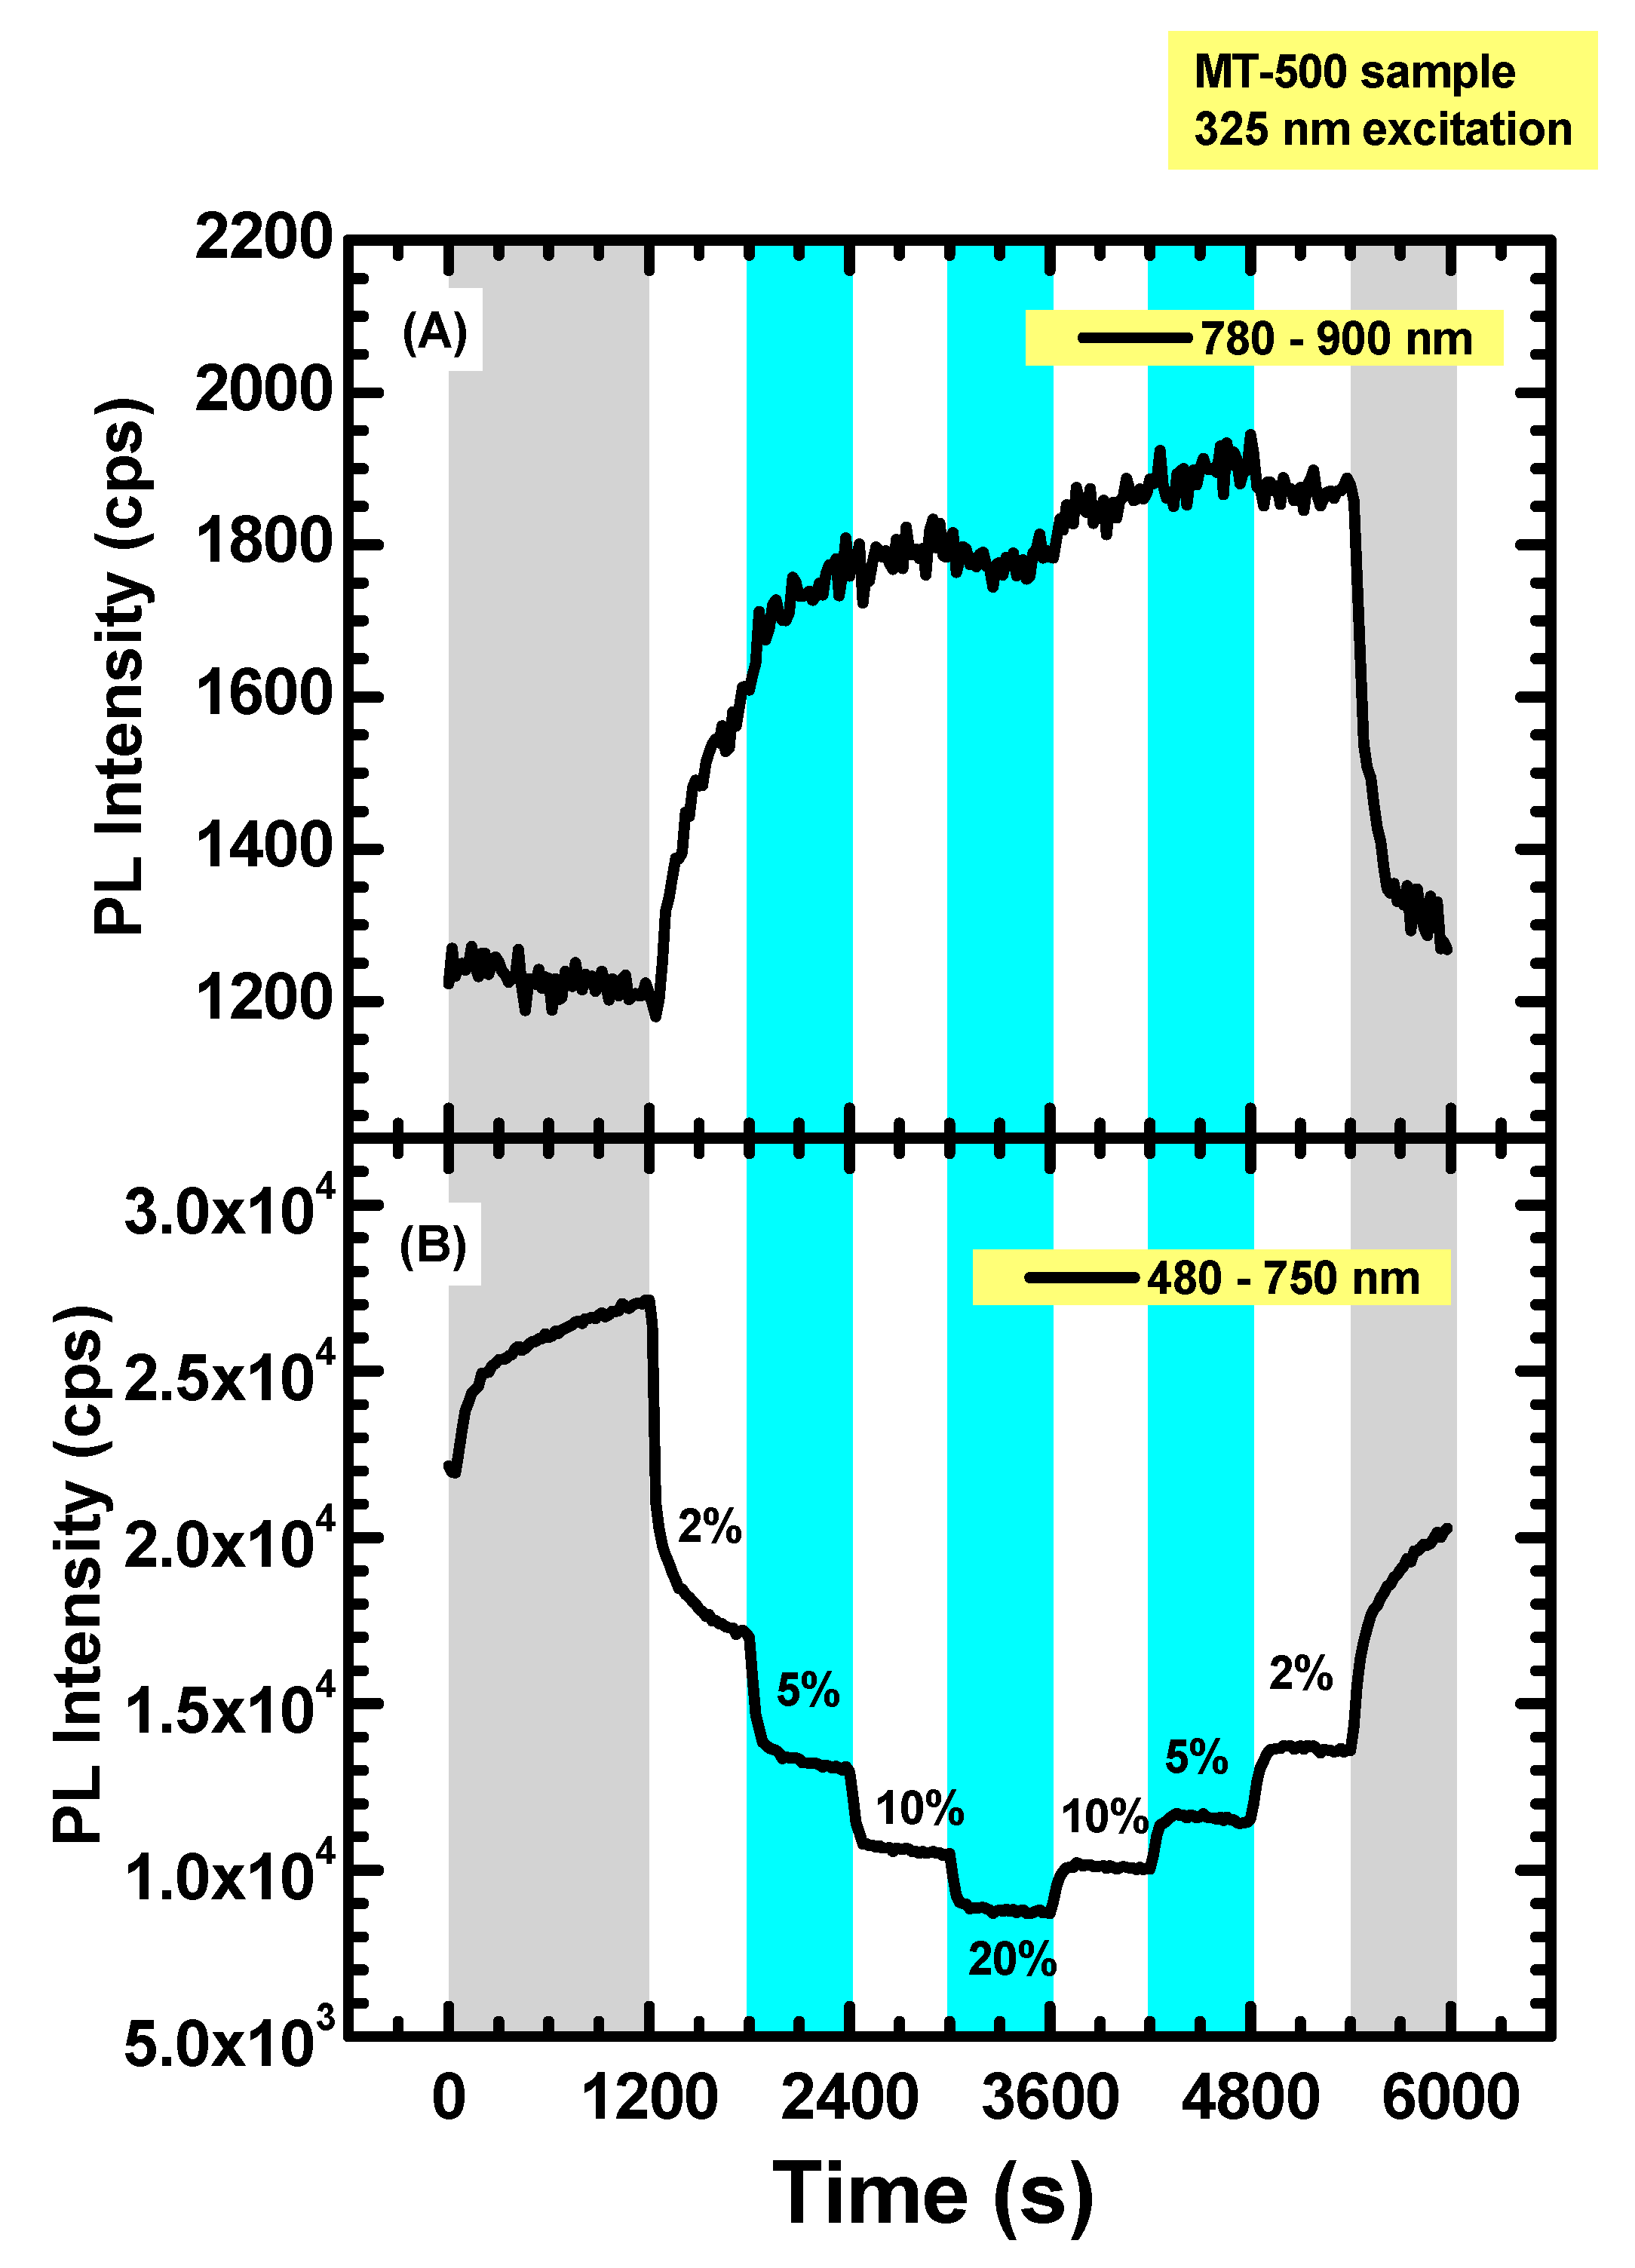
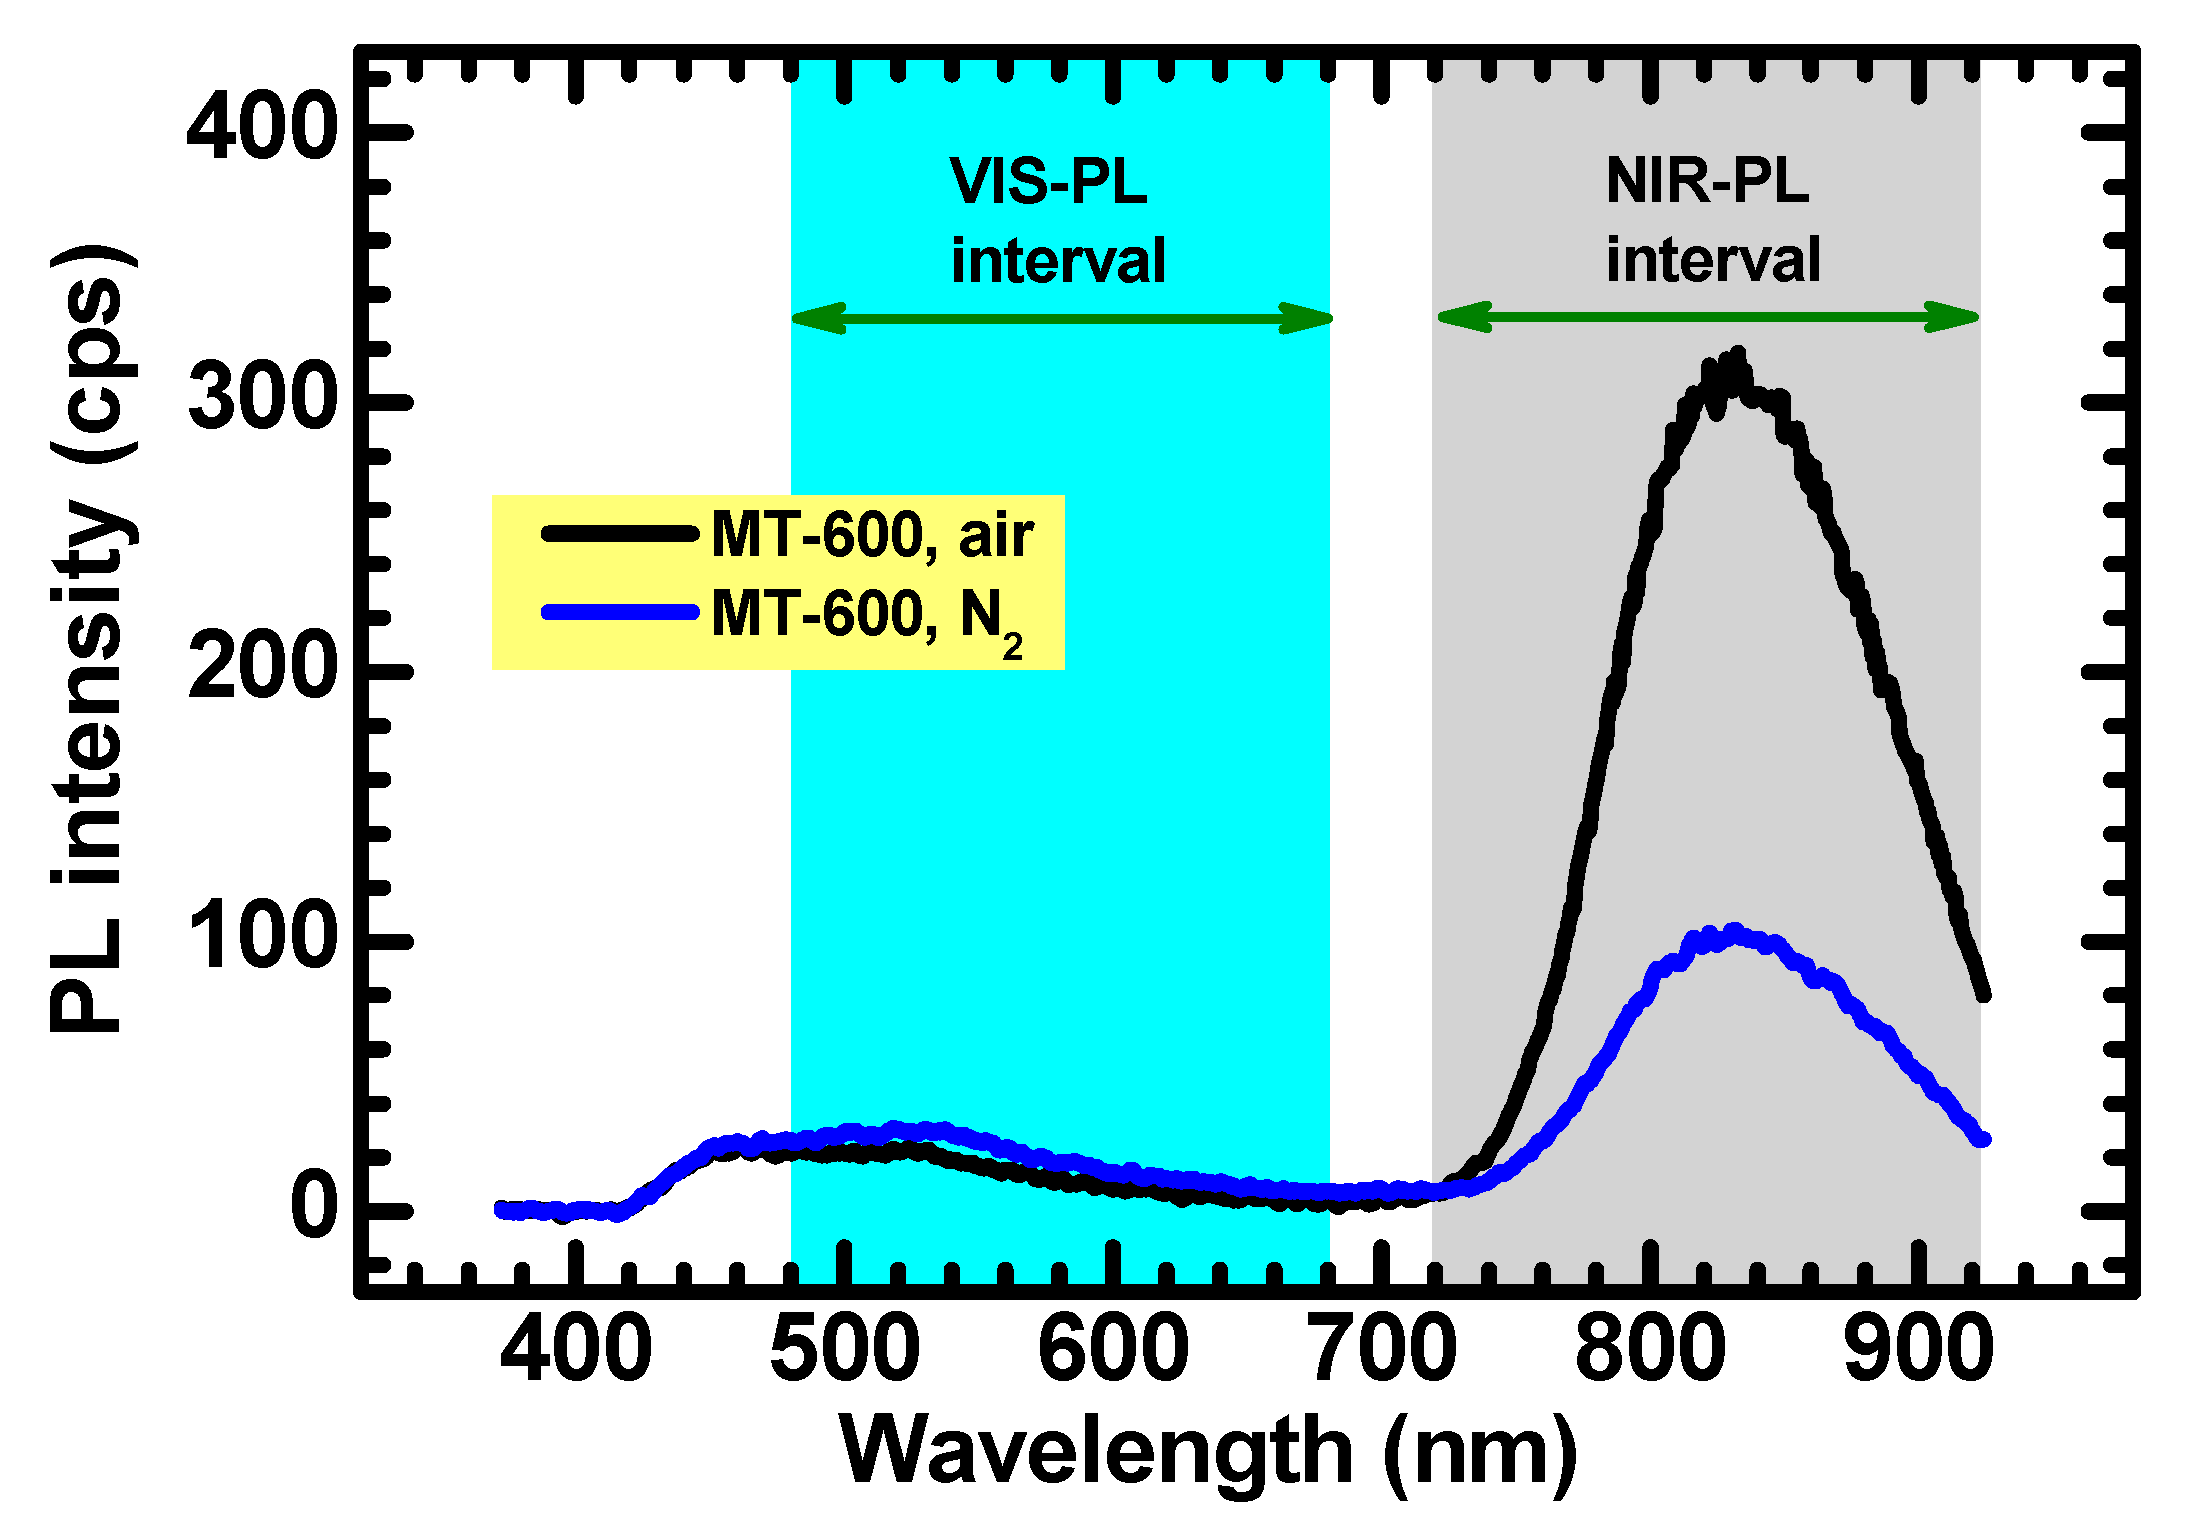
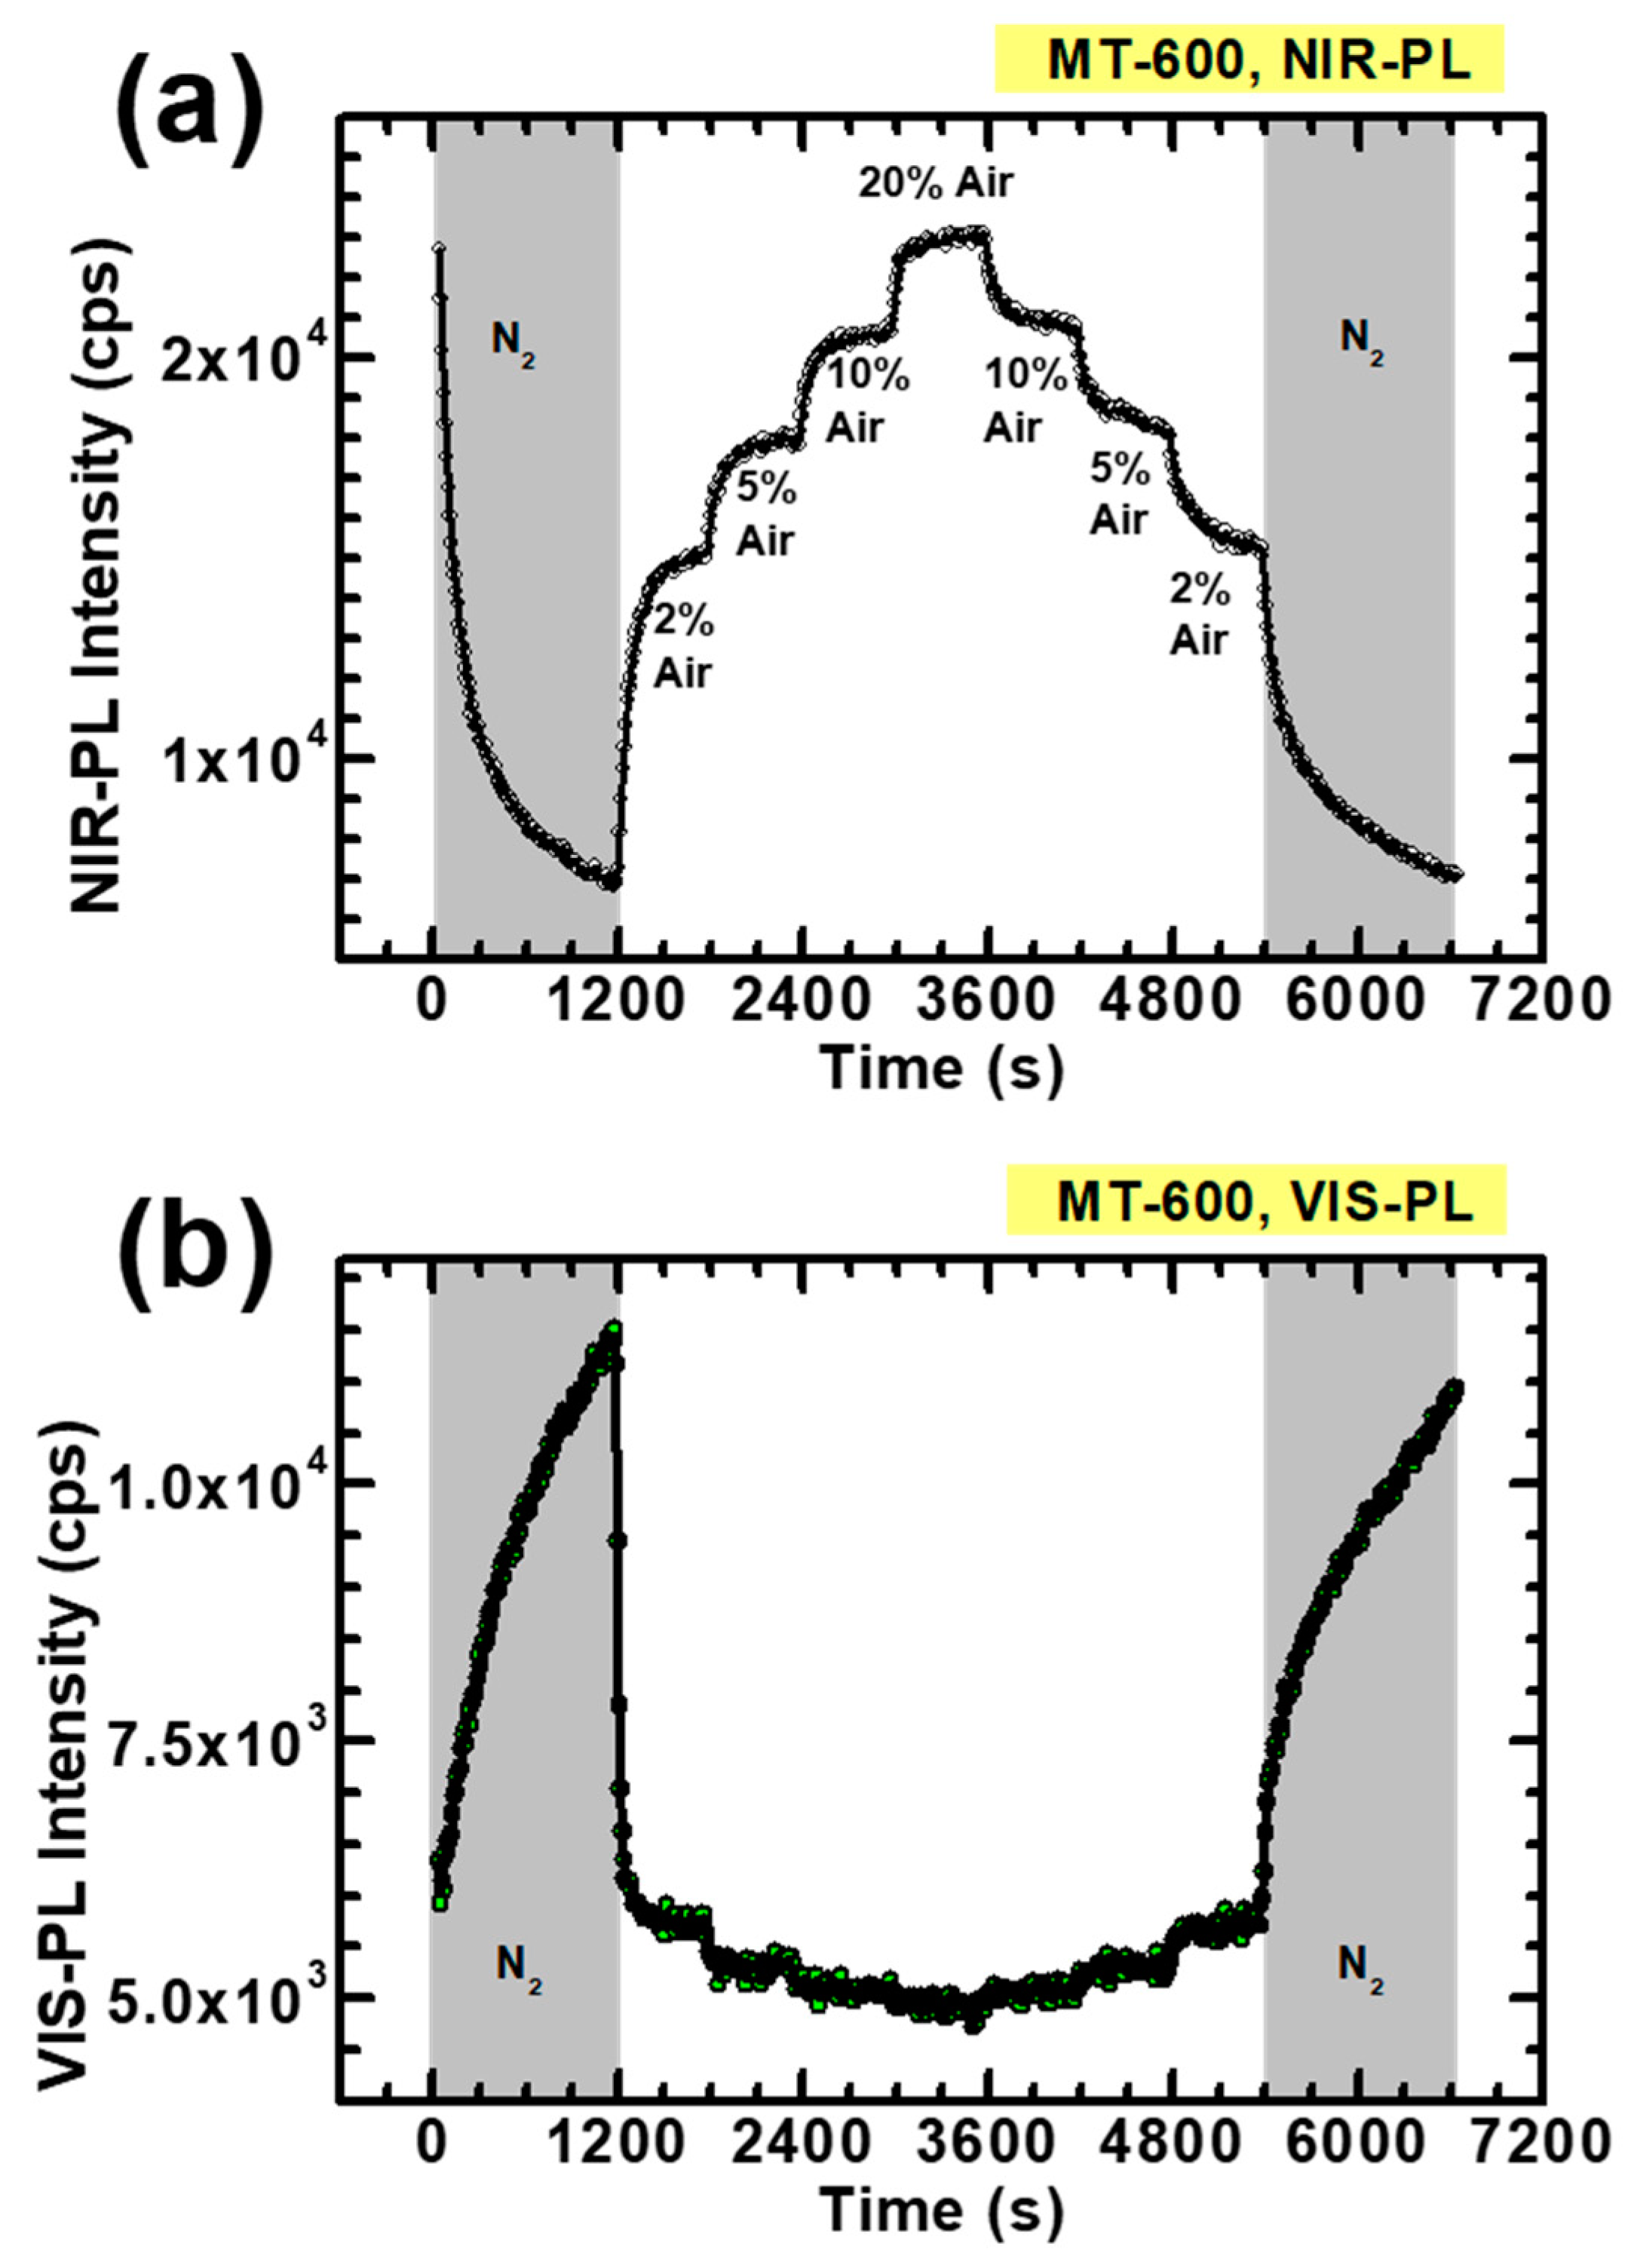
2.2. O2 Sensing Measurements

In this section the PL spectra and the O2 detection properties of both MT-500 and MT-600 are reported.
Figure 8 reports the PL spectra for the MT-500 obtained at 325 nm excitation in ambient air (black curve) after 20 min exposure to flowing N2 (blue curve). The gas flows were set at a constant value of 300 standard cubic centimeters per minute (sccm) in all cases.
The PL spectra measured in ambient air (black curve) showed an emission band in the visible range extending up to about 750 nm and a near-infrared (NIR) emission. The shape of the PL band in the interval 430–460 nm was affected by the presence of the long-wave pass filter, the use of which is necessary to prevent the detection of a second order diffraction peak of the excitation light that could significantly alter the detected PL spectrum. Nonetheless, the spectral intensities were accurate for wavelengths longer than 460 nm. The NIR photoluminescence had the typical characteristics of that observed in rutile TiO2, suggesting that rutile phase is present to some limited extent, detectable by means of photoluminescence, as confirmed by the XPS survey (Figure 7).
As the sample was exposed to flowing nitrogen (N2, 300 standard cubic centimeters flow), the NIR-PL band disappeared quickly (it became undetectable in ~1 min), while the visible PL emission intensity increased. The blue curve in Figure 8 has been obtained after 20 min of N2 exposure, a time sufficient to stabilize the growth of the PL intensity.
The time dynamics of the PL modulation for the two emission bands was investigated by measuring the PL spectra during exposure to flowing Air-N2 mixtures at different relative concentrations.
Figure 9 shows the total PL intensity numerically integrated over the intervals 780–900 nm (near-infrared range) and 480–750 nm (visible range). The PL intensities are measured in count per seconds (cps) units. It was observed that the near-infrared emission of the MT-500 senses the presence of O2 in air, which causes an enhancement of the PL intensity. However, the variations were not sensitive to the investigated concentrations, as the variation of the PL intensity already saturated at the first exposure of 2% air (i.e., 0.4% O2 concentration). The data in Figure 9B indicates a quenching of the total visible PL intensity of the sample, with a response that is not totally saturated by the air exposure.
The different behaviors reported in Figure 9 can be qualitatively interpreted by considering the different amount of rutile vs. anatase surface sites available for O2 adsorption. The sample MT-500 had a small quantity of rutile (about 2% in relative rutile vs. anatase weight fraction, according to the XRD data discussed before). Hence, despite the large specific surface area, the number of sites on rutile surfaces available to the O2 molecules is much lesser than that on anatase surfaces. Hence, it has to be expected that the surface concentration of adsorbed oxygen species (e.g., superoxide ions O 2 ) saturates at lower air densities for the rutile. In fact, Figure 9A indicates that the PL intensity of rutile nearly saturates as the sample is exposed to gaseous flows of about 2% air concentration (i.e., 0.4% O2 concentration), while higher concentrations do not produce a very significant PL enhancement.
The situation is quite different for the visible PL, originating from anatase TiO2, reported in Figure 9B and showing that the response to increasing O2 concentrations remained significant. The combined effect of large SSA and the anatase being by far the dominant phase implies a much larger amount of adsorption sites on anatase, so that the saturation effect is reached at larger concentrations.
Another feature to be noticed for the total (i.e., integrated over the entire 480–750 nm interval) visible PL is that it showed an overall drift vs. time, as evidenced in Figure 9B. Nevertheless, if we select only the PL emission at longer wavelengths, the drift effect is reduced, while the overall response and sensitivity improves. This is shown in Figure 10, where the PL intensity integrated in the 530–600 nm interval (panel (a)) is compared with that integrated in the 680–750 nm interval (panel (b)). The blue curves indicate the air concentration (percent units). The employed experimental parameters were the same as those used to obtain the results of Figure 9.
It can be seen that the drift behavior mostly affected the “green” component (black curve), which was the dominant contribution to the total emission, and in fact the behavior of the black curve in Figure 10a closely resembled that of Figure 9B.
Considering the PL intensity associated to the “red” components (Figure 10b), the PL stability and reversibility significantly improved. The reasons behind such difference are not completely established. However, some considerations and hypothesis can be made.
Previous works have reported that the visible PL of anatase PL is likely made of the superposition of two distinct recombination processes, one leading to light emission at shorter wavelengths (about 450–600 nm) and the other to light emission at longer wavelengths (about 670–750 nm) [11,15]. The first of the two processes—leading to “green” PL—has been attributed to the recombination of trapped electrons with photogenerated holes, also in consideration of its larger sensitivity to O2 exposure [49]. In Figure 10, we can indeed see a larger sensitivity to O2 exposure for the PL response at shorter wavelengths (Figure 10a), with PL decreases of about 55%, 65%, and 70% of the initial value observed for air percentages of 5%, 10%, and 20%, while for the same air percentages the corresponding PL values in Figure 10b are about 78%, 52%, and 62%; i.e., their sensitivity to O2 is lesser than that of the short wavelength components (green PL).
The green PL also exhibited an unstable baseline, i.e., a decay of the PL intensity during illumination. This phenomenon might be explained as follows: The green PL has been attributed to the radiative recombination of free conduction band electrons and/or electrons trapped in shallow states with photogenerated holes trapped in sites close to oxygen vacancies [11,15,50]. Under this hypothesis, a progressive oxidation of TiO2 would cause a decrease in the intensity of the green PL. Such a process might be caused by dissociative adsorption of O2 molecules close to a surface oxygen vacancy site, stimulated by the presence of surface excess charge carriers (due to UV illumination) [14,51,52].
On another hand, according to the previously mentioned studies [11,15,50] the “red component” represented in Figure 9B is caused by the radiative recombination of electrons trapped to defect sites of various origin with photogenerated holes. The better stability of the PL intensity in Figure 9B, in comparison with that of Figure 9A, might be a consequence of the fact that oxygen vacancy defect sites are much more involved in the “green” PL than in the “red” one.
We consider now the samples calcinated at 600 °C (MT-600). Figure 11 shows the PL spectra of the MT-600 sample obtained at 325 nm excitation in flowing air (black curve) after 20 min exposure to flowing N2 (blue curve). The experimental parameters involved were the same as that of Figure 8.
The PL spectra are clearly indicative of mixed-phase TiO2, as they evidence the co-presence of a near-infrared and a visible PL band, labelled hereinafter as NIR-PL and VIS-PL, respectively. In accordance with previous investigations on mixed-phase TiO2 [29,30], NIR-PL was enhanced, while VIS-PL quenched due to exposure to O2.
The time dynamics of the PL modulation for the two emission bands was investigated by measuring the PL spectra during exposure to flowing Air-N2 mixtures at different relative concentrations. The data are shown in Figure 12, referring to air concentrations of 0% (i.e., pure nitrogen flow), 2%, 5%, 10%, 20%, 10%, 5%, 2% and 0%.
The data in Figure 12a evidence the enhancement of NIR-PL intensity caused by O2. The PL intensity levels were reasonably reversible. As expected for Langmuir type kinetics characterized by a maximum surface density of adsorption sites [30], the response was not linear vs. concentration. Figure 12b shows instead the results obtained for the VIS-PL intensity. In this case, it is evident that the O2 adsorption completely saturated the response: after the first exposure to 2% air (i.e., 0.4% O2), the PL became unsensitive to further variations of O2 concentrations.
As predicted, the combination of a lower SSA (compared to MT-500) and a small amount of anatase in the sample led to a situation which is somehow reversed with respect to the one reported in Figure 9: the PL modulation of anatase now easily saturates at 2% concentration, with a relatively fast response. This result might be as promising for the detection of O2 at much lower concentrations. On the other hand, the larger amount of rutile phase available for O2 adsorption gives a NIR-PL response which responded to all of the investigated concentrations, even though it exhibited the expected sub-linear responsivity.

3. Materials and Methods

All the chemicals (ACS grade) used in this work were supplied by Merck-Life Science Srl (Milan, Italy).

3.1. Materials Synthesis

The Ti-based MOF (MIL125-(Ti)) was synthesized by adapting the procedure proposed by Wang et al. [44] and here briefly summarized: Exactly 3 g of benzene-1,4-dicarboxylic acid (BDC or terephthalic acid) were dissolved in mixture of N,N-dimethylformamide (54 mL) and methanol (6 mL) and stirred at room temperature for 30 min and then mixed with 1.6 mL of Ti(OiPr)4. The mixture was then heated up and kept at 150 °C under reflux and stirring for 24 h. The MIL125-(Ti) white crystals were recovered by filtration and purified by several washings with methanol. The crystals were dried and activated under vacuum at 50 °C for 5 h and stored. The yield of the reaction was ~53% with respect to the starting amount of BDC.
MT-500 and MT-600 (where MT stands for MIL125-(Ti)-derived TiO2) were prepared as follows: Exactly 2 g of MIL125-(Ti) white crystals were placed into a ceramic crucible and heated up to 500 or 600 °C. The material was calcinated for 1 h in an air environment, obtaining a white powder. Both MT-500 and MT-600 yielded around 35 wt.% with respect to the parent MIL-125(Ti).

3.2. Materials Characterization Methods

Thermogravimetric analyses were conducted both in oxidative (air) and inert (N2) environments on a Perkin–Elmer STA6000 thermogravimetric analyzer (gas flux 40 mL min−1) from 50 °C up to 800 °C at a heating rate of 10 °C min−1. Samples were loaded in an alumina crucible thermally preconditioned up to 950 °C for an accurate evaluation of the mass losses.
Textural properties were measured by N2 adsorption at 77 K on a Quantachrome Autosorb 1. The samples were outgassed under vacuum at 120 °C for 10 h before the analysis and the data were processed in accordance with the BET method for SA evaluation and the BJH model for evaluation of the pore size distribution. The external surface area of the samples has been evaluated by using the t-plot method.
FTIR spectra in the 450–4000 cm−1 range were recorded on a Perkin–Elmer Frontier MIR spectrophotometer in transmittance mode. The spectra were acquired on KBr pellets (1 wt. %), collecting 8 scans and correcting the background noise.
X-ray powder diffraction (XRD) analysis in the 2θ range 5–80 ° was performed on powder samples by using a Philips PW1730/3710 automated diffractometer (CuKα radiation).
Morphological properties of the materials were probed by a FEI Inspect™ S50 Scanning Electron Microscope (SEM). The powdered samples were previously dried and sputter-coated with a thin layer of gold to avoid charging.
XPS analysis was performed at the electron spectroscopy for chemical analysis (ESCA) microscopy beamline at the Elettra Sincrotrone Trieste, with the hosted scanning photoemission microscope (SPEM) using a 650.2 eV X-ray beam. The SPEM system employed Fresnel lenses, allowing the achievement of a spot diameter down to ∼130 nm. The system was operated in microspot mode [53] and the ESCA−SPEM measurements were related to an illuminated area of about 70 μm diameter and a penetration depth of about 1 nm.
HRTEM images were acquired using the atomic resolution analytical JEOL JEM ARM200F microscope operated at 200 kV. The samples were observed in conventional TEM (CTEM) and HRTEM modes at magnifications ranging from 4 × 10⁴ to 2 × 10⁶. The preparation of the samples was the following: the powders at first were gently crushed in an agate mortar and dispersed in ethanol, then a droplet of this suspension was deposited onto a 200 mesh carbon lacey TEM Cu grid and allowed to dry at room temperature.
The PL measurements in controlled environment (i.e., flowing gas mixtures) were performed via an in-house designed system allowing to perform PL measurements at variable excitation wavelength for samples exposed to controlled gas flows. More specifically, the system consisted of a test chamber equipped with a UV-transparent (fused silica) optical window and connected to a mass flow controller system, allowing to set-up the desired mixtures of pure nitrogen and air. The excitation light was provided by a monochromatized Xe lamp coupled with a double-grating monochromator (180 mm effective focal length). The PL light was focused via a system of achromatic converging optical lenses and to a multimode optical fiber (core diameter = 1000 μm), coupled with the entrance slit of an f = 320 mm effective focal length monochromator. The detection of the PL spectra was performed by a cooled CCD camera. The data were acquired and post-processed via a home-made LabVIEW routine, correcting the raw data to account for the spectral responsivity of the various optical components. All intensities were expressed in counts per second (cps) units.

3.3. O2 Sensing Measurements

PL intensity measurements were performed during exposures to O2/N2 flows of different O2 concentrations, alternating to sample recovery in N2 flows. In a typical experiment, a powder sample was loaded in the chamber and then exposed to flowing N2 for the first 20 min while illuminated. Next, air flow at a variable concentration was introduced in the gas mixture, maintaining the total flow fixed at 300 standard cubic centimeter per minute (sccm). The air concentration was changed at regular steps of 10 min each. The air flow was interrupted in the final step and the sample was exposed to pure nitrogen for 20 min. The sample was excited at a fixed wavelength of 325 nm. PL acquisition was carried out each 30 s at an integration time of 1 s.
The O2 concentration in the test chamber was maintained at the desired values by means of a computer-controlled mass flow control system, mixing and flowing dry N2 (99.9995% purity) and dry air (20% O2, 80% N2, impurities concentration < 5 ppm). The total gas flow was kept constant during the entire experiment at a value of 300 sccm.

4. Conclusions

Mixed-phase TiO2 has been produced from a Ti-based, metal-organic framework (MIL125-(Ti)) by a post-synthesis heat treatment in an air environment at two different temperatures (500 and 600 °C).
Lower calcination temperature leads to a larger surface area in MOF-derived TiO2 without significantly activating the anatase/rutile transition. We showed that the obtained sample is tailored for the use of anatase PL, which exhibits responses to air densities in the 2–20% range. The situation is reversed as a higher calcination temperature is employed, leading to anatase/rutile transition and allowing O2 detection via the NIR-PL signal. The results suggest that an optimized thermal treatment of the metal-organic framework (with suitable values of the calcination temperature and process duration) might allow a reasonably good responsivity for both the TiO2 phases towards O2 sensing. Moreover, the experimental evidence indicated that the red component of anatase PL could be employed to improve the baseline stability. This is, to the best of our knowledge, the first study aimed to test the performances of the MOF-derived TiO2 as doubly-parametric optical sensors for O2 detection. Further experimentation will focus on the possibility to improve the responsivity of both NIR and VIS PL components—and thus employ a double-signal ratiometric scheme—and to test the detection of lower concentrations of O2.

Author Contributions

Conceptualization, M.A. (Michela Alfè) and S.L.; Investigation, M.A. (Michela Alfè), V.G., M.A. (Matteo Amati), V.-A.M. and S.L.; Formal analysis, M.A. (Michela Alfè), V.G., and S.L.; Data curation, M.A. (Michela Alfè), V.G., M.A. (Matteo Amati), V.-A.M. and S.L.; Supervision, M.A. (Michela Alfè), P.M. and S.L.; Writing—review and editing, M.A. (Michela Alfè), V.G., M.A. (Matteo Amati), V.-A.M., P.M. and S.L. All authors have read and agreed to the published version of the manuscript.

Funding

This research was funded by CERIC Consortium under the proposal 20187033 for the access to experimental facilities of ESCA Microscopy at Elettra Synchrotron in Trieste (Italy) and of HRTEM at the National Institute of Materials Physics in Magurele (Romania). The work has also been partially supported by the Romanian Ministry of Research and Innovation (Core Program PN19-03, contract no. 21 N/08.02.2019).

Data Availability Statement

Data is contained within the article.

Acknowledgments

The assistance of Paola Giudicianni (BET) and Luciano Cortese (SEM-EDX) from STEMS-CNR and of Paolo Aprea (XRD) from DICMAPI-University of Naples was kindly acknowledged. M. Alfé and V. Gargiulo also acknowledge the contribution of the EsSENce Cost Action CA1911. Finally, the authors would like to thank Corneliu Ghica from National Institute of Materials Physics (Magurele, Romania), Luca Gregoratti from ELETTRA synchrotron (Trieste, Italy) and Giovanni Ausanio from University of Naples “Federico II” (Naples, Italy) for useful discussions.

Conflicts of Interest

The authors declare no conflict of interest. The funders had no role in the design of the study; in the collection, analyses, or interpretation of data; in the writing of the manuscript, or in the decision to publish the results.

References

  1. Kiisk, V.; Akulitš, K.; Kodu, M.; Avarmaa, T.; Mändar, H.; Kozlova, J.; Eltermann, M.; Puust, L.; Jaaniso, R. Oxygen-Sensitive Photoluminescence of Rare Earth Ions in TiO2Thin Films. J. Phys. Chem. C 2019, 123, 17908–17914. [Google Scholar] [CrossRef]
  2. Bittig, H.C.; Körtzinger, A.; Neill, C.; van Ooijen, E.; Plant, J.N.; Hahn, J.; Johnson, K.S.; Yang, B.; Emerson, S.R. Oxygen Optode Sensors: Principle, Characterization, Calibration, and Application in the Ocean. Front. Mar. Sci. 2018, 4, 429. [Google Scholar] [CrossRef]
  3. Quaranta, M.; Borisov, S.; Klimant, I. Indicators for optical oxygen sensors. Bioanal. Rev. 2012, 4, 115–157. [Google Scholar] [CrossRef] [Green Version]
  4. Wang, X.-D.; Wolfbeis, O.S. Optical methods for sensing and imaging oxygen: Materials, spectroscopies and applications. Chem. Soc. Rev. 2014, 43, 3666–3761. [Google Scholar] [CrossRef] [Green Version]
  5. Lobnik, A.; Turel, M.; Urek, S.K. Optical chemical sensors: Design and applications. In Advances in Chemical Sensors, 1st ed.; Wang, W., Ed.; InTech: London, UK, 2012; pp. 3–28. [Google Scholar]
  6. Zhyrovetsky, V.M.; Popovych, D.I.; Savka, S.S.; Serednytski, A. Nanopowder Metal Oxide for Photoluminescent Gas Sensing. Nanoscale Res. Lett. 2017, 12, 1–5. [Google Scholar] [CrossRef] [Green Version]
  7. Sanz, M.; Castillejo, M.; Amoruso, S.; Ausanio, G.; Bruzzese, R.; Wang, X. Ultra-fast laser ablation and deposition of TiO2. Appl. Phys. A 2010, 101, 639–644. [Google Scholar] [CrossRef] [Green Version]
  8. Sanz, M.; López-Arias, M.; Marco, J.; De Nalda, R.; Amoruso, S.; Ausanio, G.; Lettieri, S.; Bruzzese, R.; Wang, X.; Castillejo, M. Ultrafast Laser Ablation and Deposition of Wide Band Gap Semiconductors. J. Phys. Chem. C 2011, 115, 3203–3211. [Google Scholar] [CrossRef]
  9. Coscia, U.; Ambrosone, G.; Lettieri, S.; Maddalena, P.M.; Rigato, V.; Restello, S.; Bobeico, E.; Tucci, M. Preparation of microcrystalline silicon–carbon films. Sol. Energy Mater. Sol. Cells 2005, 87, 433–444. [Google Scholar] [CrossRef]
  10. Setaro, A.; Bismuto, A.; Lettieri, S.; Maddalena, P.M.; Comini, E.; Bianchi, S.; Baratto, C.; Sberveglieri, G. Optical sensing of NO2 in tin oxide nanowires at sub-ppm level. Sens. Actuators B Chem. 2008, 130, 391–395. [Google Scholar] [CrossRef]
  11. Mercado, C.; Seeley, Z.; Bandyopadhyay, A.; Bose, S.; McHale, J.L. Photoluminescence of Dense Nanocrystalline Titanium Dioxide Thin Films: Effect of Doping and Thickness and Relation to Gas Sensing. ACS Appl. Mater. Interfaces 2011, 3, 2281–2288. [Google Scholar] [CrossRef]
  12. Cretì, A.; Valerini, D.; Taurino, A.; Quaranta, F.; Lomascolo, M.; Rella, R. Photoluminescence quenching processes by NO2 adsorption in ZnO nanostructured films. J. Appl. Phys. 2012, 111, 73520. [Google Scholar] [CrossRef]
  13. Sanchez-Valencia, J.R.; Alcaire, M.; Romero-Gomez, P.; Macias-Montero, M.; Aparicio, F.J.; Borras, A.; Gonzalez-Elipe, A.R.; Barranco, A.; Rebollo, F.J.A. Oxygen Optical Sensing in Gas and Liquids with Nanostructured ZnO Thin Films Based on Exciton Emission Detection. J. Phys. Chem. C 2014, 118, 9852–9859. [Google Scholar] [CrossRef]
  14. Pallotti, D.K.; Orabona, E.; Amoruso, S.; Maddalena, P.M.; Lettieri, S. Modulation of mixed-phase titania photoluminescence by oxygen adsorption. Appl. Phys. Lett. 2014, 105, 031903. [Google Scholar] [CrossRef] [Green Version]
  15. Pallotti, D.K.; Orabona, E.; Amoruso, S.; Aruta, C.; Bruzzese, R.; Chiarella, F.; Tuzi, S.; Maddalena, P.M.; Lettieri, S. Multi-band photoluminescence in TiO2 nanoparticles-assembled films produced by femtosecond pulsed laser deposition. J. Appl. Phys. 2013, 114, 043503. [Google Scholar] [CrossRef]
  16. Naldoni, A.; Altomare, M.; Zoppellaro, G.; Liu, N.; Kment, Š.; Zbořil, R.; Schmuki, P. Photocatalysis with Reduced TiO2: From Black TiO2 to Cocatalyst-Free Hydrogen Production. ACS Catal. 2019, 9, 345–364. [Google Scholar] [CrossRef] [Green Version]
  17. Lettieri, S.; Pavone, M.; Fioravanti, A.; Amato, L.S.; Maddalena, P. Charge Carrier Processes and Optical Properties in TiO2 and TiO2-Based Heterojunction Photocatalysts: A Review. Materials 2021, 14, 1645. [Google Scholar] [CrossRef]
  18. Zhang, X.; Chen, Y.L.; Liu, R.-S.; Tsai, D.P. Plasmonic photocatalysis. Rep. Prog. Phys. 2013, 76, 046401. [Google Scholar] [CrossRef] [Green Version]
  19. Ricciardi, C.; Ballarini, V.; Galli, M.; Liscidini, M.; Andreani, L.; Losurdo, M.; Bruno, G.; Lettieri, S.; Gesuele, F.; Maddalena, P.M.; et al. Amorphous Silicon Nitride: A suitable alloy for optical multilayered structures. J. Non-Cryst. Solids 2006, 352, 1294–1297. [Google Scholar] [CrossRef]
  20. Passoni, L.; Criante, L.; Fumagalli, F.; Scotognella, F.; Lanzani, G.; Di Fonzo, F. Self-Assembled Hierarchical Nanostructures for High-Efficiency Porous Photonic Crystals. ACS Nano 2014, 8, 12167–12174. [Google Scholar] [CrossRef] [PubMed]
  21. Wu, Y.; Yang, W.; Fan, Y.; Song, Q.; Xiao, S. TiO2 metasurfaces: From visible planar photonics to photochemistry. Sci. Adv. 2019, 5, eaax0939. [Google Scholar] [CrossRef] [Green Version]
  22. Terracciano, M.; Galstyan, V.; Rea, I.; Casalino, M.; De Stefano, L.; Sbervegleri, G. Chemical modification of TiO2 nanotube arrays for label-free optical biosensing applications. Appl. Surf. Sci. 2017, 419, 235–240. [Google Scholar] [CrossRef]
  23. Chiarello, G.L.; Zuliani, A.; Ceresoli, D.; Martinazzo, R.; Selli, E. Exploiting the Photonic Crystal Properties of TiO2 Nanotube Arrays to Enhance Photocatalytic Hydrogen Production. ACS Catal. 2016, 6, 1345–1353. [Google Scholar] [CrossRef]
  24. Likodimos, V. Photonic crystal-assisted visible light activated TiO2 photocatalysis. Appl. Catal. B Environ. 2018, 230, 269–303. [Google Scholar] [CrossRef]
  25. Kubiak, A.; Siwinska-Ciesielczyk, K.; Jesionowski, T. Titania-Based Hybrid Materials with ZnO, ZrO2 and MoS2: A Review. Materials 2018, 11, 2295. [Google Scholar] [CrossRef] [Green Version]
  26. Lettieri, S.; Gargiulo, V.; Pallotti, D.K.; Vitiello, G.; Maddalena, P.; Alfè, M.; Marotta, R. Evidencing opposite charge-transfer processes at TiO2/graphene-related materials interface through a combined EPR, photoluminescence and photocatalysis assessment. Catal. Today 2018, 315, 19–30. [Google Scholar] [CrossRef]
  27. Alfè, M.; Spasiano, D.; Gargiulo, V.; Vitiello, G.; Di Capua, R.; Marotta, R. TiO2/graphene-like photocatalysts for selective oxidation of 3-pyridine-methanol to vitamin B3 under UV/solar simulated radiation in aqueous solution at room conditions: The effect of morphology on catalyst performances. Appl. Catal. A Gen. 2014, 487, 91–99. [Google Scholar] [CrossRef]
  28. Clarizia, L.; Vitiello, G.; Pallotti, D.K.; Silvestri, B.; Nadagouda, M.; Lettieri, S.; Luciani, G.; Andreozzi, R.; Maddalena, P.; Marotta, R. Effect of surface properties of copper-modified commercial titanium dioxide photocatalysts on hydrogen production through photoreforming of alcohols. Int. J. Hydrogen Energy 2017, 42, 28349–28362. [Google Scholar] [CrossRef]
  29. Lettieri, S.; Pallotti, D.K.; Gesuele, F.; Maddalena, P.M. Unconventional ratiometric-enhanced optical sensing of oxygen by mixed-phase TiO2. Appl. Phys. Lett. 2016, 109, 031905. [Google Scholar] [CrossRef] [Green Version]
  30. Pallotti, D.K.; Passoni, L.; Gesuele, F.; Maddalena, P.; Di Fonzo, F.; Lettieri, S. Giant O2-Induced Photoluminescence Modulation in Hierarchical Titanium Dioxide Nanostructures. ACS Sens. 2017, 2, 61–68. [Google Scholar] [CrossRef]
  31. Wang, G.; Yang, S.; Cao, L.; Jin, P.; Zeng, X.; Zhang, X.; Wei, J. Engineering mesoporous semiconducting metal oxides from metal-organic frameworks for gas sensing. Coord. Chem. Rev. 2021, 445, 214086. [Google Scholar] [CrossRef]
  32. Song, Y.; Li, X.; Sun, L.; Wang, L. Metal/metal oxide nanostructures derived from metal–organic frameworks. RSC Adv. 2014, 5, 7267–7279. [Google Scholar] [CrossRef]
  33. Liu, Y.; Xu, X.; Shao, Z.; Jiang, S.P. Metal-organic frameworks derived porous carbon, metal oxides and metal sulfides-based compounds for supercapacitors application. Energy Storage Mater. 2020, 26, 1–22. [Google Scholar] [CrossRef]
  34. Valero-Romero, M.; SantaClara, J.; Oar-Arteta, L.; Van Koppen, L.; Osadchii, D.; Gascon, J.; Kapteijn, F. Photocatalytic properties of TiO2 and Fe-doped TiO2 prepared by metal organic framework-mediated synthesis. Chem. Eng. J. 2019, 360, 75–88. [Google Scholar] [CrossRef]
  35. McNamara, N.D.; Kim, J.; Hicks, J.C. Controlling the Pyrolysis Conditions of Microporous/Mesoporous MIL-125 To Synthesize Porous, Carbon-Supported Ti Catalysts with Targeted Ti Phases for the Oxidation of Dibenzothiophene. Energy Fuels 2015, 30, 594–602. [Google Scholar] [CrossRef]
  36. Liu, Z.; Wu, Y.; Chen, J.; Li, Y.; Zhao, J.; Gao, K.; Na, P. Effective elimination of As(iii)viasimultaneous photocatalytic oxidation and adsorption by a bifunctional cake-like TiO2derived from MIL-125(Ti). Catal. Sci. Technol. 2018, 8, 1936–1944. [Google Scholar] [CrossRef]
  37. Shi, X.; Zhang, Z.; Du, K.; Lai, Y.; Fang, J.; Li, J. Anatase TiO2@C composites with porous structure as an advanced anode material for Na ion batteries. J. Power Sour. 2016, 330, 1–6. [Google Scholar] [CrossRef]
  38. Dan-Hardi, M.; Serre, C.; Frot, T.; Rozes, L.; Maurin, G.; Sanchez, C.; Férey, G. A New Photoactive Crystalline Highly Porous Titanium(IV) Dicarboxylate. J. Am. Chem. Soc. 2009, 131, 10857–10859. [Google Scholar] [CrossRef]
  39. Kim, S.-N.; Kim, J.; Kim, H.-Y.; Cho, H.-Y.; Ahn, W.-S. Adsorption/catalytic properties of MIL-125 and NH2-MIL-125. Catal. Today 2013, 204, 85–93. [Google Scholar] [CrossRef]
  40. Oveisi, M.; Asli, M.A.; Mahmoodi, N.M. MIL-Ti metal-organic frameworks (MOFs) nanomaterials as superior adsorbents: Synthesis and ultrasound-aided dye adsorption from multicomponent wastewater systems. J. Hazard. Mater. 2018, 347, 123–140. [Google Scholar] [CrossRef]
  41. Fu, Y.; Sun, D.; Chen, Y.; Huang, R.; Ding, Z.; Fu, X.; Li, Z. An Amine-Functionalized Titanium Metal-Organic Framework Photocatalyst with Visible-Light-Induced Activity for CO2 Reduction. Angew. Chem. Int. Ed. 2012, 51, 3364–3367. [Google Scholar] [CrossRef]
  42. Guo, Z.; Cheng, J.K.; Hu, Z.; Zhang, M.; Xu, Q.; Kang, Z.; Zhao, D. Metal-organic frameworks (MOFs) as precursors towards TiOx/C composites for photodegradation of organic dye. RSC Adv. 2014, 4, 34221–34225. [Google Scholar] [CrossRef] [Green Version]
  43. Thommes, M.; Kaneko, K.; Neimark, A.V.; Olivier, J.P.; Rodriguez-Reinoso, F.; Rouquerol, J.; Sing, K.S.W. Physisorption of gases, with special reference to the evaluation of surface area and pore size distribution (IUPAC Technical Report). Pure Appl. Chem. 2015, 87, 1051–1069. [Google Scholar] [CrossRef] [Green Version]
  44. Wang, Z.; Li, X.; Xu, H.; Yang, Y.; Cui, Y.; Pan, H.; Wang, Z.; Chen, B.; Qian, G. Porous anatase TiO2constructed from a metal–organic framework for advanced lithium-ion battery anodes. J. Mater. Chem. A 2014, 2, 12571–12575. [Google Scholar] [CrossRef]
  45. Spurr, R.A.; Myers, H. Quantitative Analysis of Anatase-Rutile Mixtures with an X-Ray Diffractometer. Anal. Chem. 1957, 29, 760–762. [Google Scholar] [CrossRef]
  46. Liu, B.; Khare, A.; Aydil, E. Synthesis of single-crystalline anatase nanorods and nanoflakes on transparent conducting substrates. Chem. Commun. 2012, 48, 8565–8567. [Google Scholar] [CrossRef] [Green Version]
  47. Sun, Z.; Kim, J.H.; Zhao, Y.; Bijarbooneh, F.; Malgras, V.; Lee, Y.; Kang, Y.-M.; Dou, S.X. Rational Design of 3D Dendritic TiO2Nanostructures with Favorable Architectures. J. Am. Chem. Soc. 2011, 133, 19314–19317. [Google Scholar] [CrossRef]
  48. Praveen, P.; Viruthagiri, G.; Mugundan, S.; Shanmugam, N. Structural, optical and morphological analyses of pristine titanium di-oxide nanoparticles—Synthesized via sol–gel route. Spectrochim. Acta Part A Mol. Biomol. Spectrosc. 2014, 117, 622–629. [Google Scholar] [CrossRef]
  49. Pallotti, D.K.; Passoni, L.; Maddalena, P.; Di Fonzo, F.; Lettieri, S. Photoluminescence Mechanisms in Anatase and Rutile TiO2. J. Phys. Chem. C 2017, 121, 9011–9021. [Google Scholar] [CrossRef]
  50. Rex, R.E.; Knorr, F.J.; McHale, J.L. Surface Traps of TiO2 Nanosheets and Nanoparticles as Illuminated by Spectroelectrochemical Photoluminescence. J. Phys. Chem. C 2014, 118, 16831–16841. [Google Scholar] [CrossRef]
  51. Epling, W.S.; Peden, C.H.; Henderson, M.A.; Diebold, U. Evidence for oxygen adatoms on TiO2(110) resulting from O2 dissociation at vacancy sites. Surf. Sci. 1998, 412–413, 333–343. [Google Scholar] [CrossRef]
  52. Lira, E.; Hansen, J.Ø.; Huo, P.; Bechstein, R.; Galliker, P.; Lægsgaard, E.; Hammer, B.; Wendt, S.; Besenbacher, F. Dissociative and molecular oxygen chemisorption channels on reduced rutile TiO2(110): An STM and TPD study. Surf. Sci. 2010, 604, 1945–1960. [Google Scholar] [CrossRef]
  53. Lettieri, S.; Gargiulo, V.; Alfè, M.; Amati, M.; Zeller, P.; Maraloiu, V.-A.; Borbone, F.; Pavone, M.; Muñoz-García, A.B.; Maddalena, P. Simple Ethanol Refluxing Method for Production of Blue-Colored Titanium Dioxide with Oxygen Vacancies and Visible Light-Driven Photocatalytic Properties. J. Phys. Chem. C 2020, 124, 3564–3576. [Google Scholar] [CrossRef]
Figure 1. SEM images of MIL125-(Ti): (ac), MT-500 (df) and MT-600 (gi) at different magnifications.
Catalysts 11 00795 g001
Figure 2. (a) TGA profile of MIL125-(Ti) in inert atmosphere (N2) along the DTG signal; (b) TGA profiles of MIL125-(Ti), MT-500 and MT-600 in air.
Catalysts 11 00795 g002
Figure 3. (a) N2 adsorption isotherms of MIL125-(Ti), MT-500, and MT-600 at 77 K; (b) Pore size distributions of MIL125-(Ti), MT-500, and MT-600 estimated by applying the BJH model.
Catalysts 11 00795 g003
Figure 4. (Top) panel: XRD pattern of MIL125-(Ti); (Bottom) panel: XRD patterns of MT-500 and MT-600.
Catalysts 11 00795 g004
Figure 5. TEM images of MIL125-(Ti): (ac), MT-500 (df) and MT-600 (gi) at different magnifications. Distinctive interplanar spacings are evidenced in yellow (enlargements of selected areas are also reported for a better visualization of the interplanar distances).
Catalysts 11 00795 g005
Figure 6. (Top) panel: Height normalized MIL125-(Ti) FTIR spectrum; (Bottom) panel: Height normalized MT-500 and MT-600 FTIR spectra.
Catalysts 11 00795 g006
Figure 7. XPS surveys of MT-500 (red line) and P25 (black line).
Catalysts 11 00795 g007
Figure 8. Room-temperature PL spectra of MT-500 acquired in air (black curve) and, after 20 min, exposure to flowing N2 at 300 sccm flow (blue curve). The cyan-colored region indicates the wavelength interval (i.e., 480–750 nm) used to extract the wavelength-integrated data reported in Figure 9B.
Catalysts 11 00795 g008
Figure 9. Time dynamics of MT-500 PL intensity integrated over the wavelength intervals 780–900 nm (A) and 480–750 nm (B) as the sample is exposed to variable concentrations of dry air: The highlighted gray regions indicate exposure to pure nitrogen. The air percentages are indicated in figure.
Catalysts 11 00795 g009
Figure 10. Time dynamics of MT-500 PL intensity integrated over the “green” and “red” wavelength intervals, defined as 530–600 nm interval (a) and 680–750 nm (b) as the sample is exposed to variable concentrations of dry air. The blue curves indicate the air concentration in percentage units.
Catalysts 11 00795 g010
Figure 11. PL spectra of the MT-600 sample acquired in air (black curve) after 20 min exposure to flowing N2 (300 sccm flow): The spectra are acquired at room temperature. The wavelength interval used as definition for “VIS-PL” and “NIR-PL” are highlighted.
Catalysts 11 00795 g011
Figure 12. Time dynamics of the NIR-PL emission (a) and of the VIS-PL emission (b) during exposure of MT-600 to variable concentrations of dry air: The highlighted gray regions indicate exposure to pure nitrogen.
Catalysts 11 00795 g012
Table 1. Materials textural properties.
SampleSSA, m2/gVtot, cm3/g
MIL125-(Ti)10790.666
MT-5001200.504
MT-600140.103
Publisher’s Note: MDPI stays neutral with regard to jurisdictional claims in published maps and institutional affiliations.

