Heterogeneous Photocatalysis and Prospects of TiO2-Based Photocatalytic DeNOxing the Atmospheric Environment

PhotoGreen Laboratory, Dipartimento di Chimica, Università di Pavia, via Taramelli 12, 27011 Pavia, Italy
Catalysts 2018, 8(11), 553; https://doi.org/10.3390/catal8110553
Submission received: 18 October 2018
/
Revised: 3 November 2018
/
Accepted: 5 November 2018
/
Published: 16 November 2018
(This article belongs to the Special Issue Emerging Trends in TiO2 Photocatalysis and Applications)
Abstract
:This article reviews the efforts of the last two decades to deNOxify the atmospheric environment with TiO2-based photocatalytic materials supported on various cementitious-like substrates. Prior to undertaking this important aspect of applied photocatalysis with metal-oxide emiconductor photocatalysts, however, it is pertinent to describe and understand the fundamentals of Heterogeneous Photocatalysis. The many attempts done in a laboratory setting to degrade (deNOxify) the major components that make up the NOx, namely nitric oxide (NO) and nitrogen dioxide (NO2), but most importantly the efforts expended in deNOxifying the real environment upon depositing titania-based coatings on various model and authentic infrastructures, such as urban roads, highway noise barriers, tunnels, and building external walls among others, are examined. Both laboratory and outdoor experimentations have been performed toward NOx being oxidized to form nitrates (NO3−) that remain adsorbed on the TiO2-based photocatalytic surfaces (except in tunnels—indoor walls) but get subsequently dislodged by rain or by periodic washings of the infrastructures. However, no serious considerations have been given to the possible conversion of NOx via photocatalytic reduction back to N2 and O2 gases that would restore the atmospheric environment, as the adsorbed nitrates block the surface-active sites of the photocatalyst and when washed-off ultimately cause unduly damages to the environment.
1. Introduction
The atmosphere is a very complex matrix that, in addition to nitrogen (N2) and oxygen (O2) gases, so important to human survival, consists of various other pollutant gases albeit at much lower concentrations: (i) carbonaceous oxides (COx); (ii) nitrogen oxides (NOx); (iii) sulfur oxides (SOx); (iv) various hydrocarbons (HCs); and (v) particulate matter. These pollutants originate from both natural sources (e.g., volcanic eruptions, wildfires, lightning, and natural degradation of forests among others) and anthropogenic areas (fertilizers and livestock, farms, and urban areas), stationary sources (e.g., industries, power plants, and sewage treatment plants), and mobile sources (e.g., automobiles, trucks, buses, motorcycles, ships, and airplanes) (see Figure 1) [1]. The natural sources of chemical pollutants, however, are of lesser concerns as they are part of the natural environment equilibrium, contrary to the anthropogenic sources that keep increasing in number and concentration with the ever increasing global human population and society’s continuous increasing demand for energy and associated technological advances.
Undoubtedly, the most important sources of air pollutants implicate the combustion of fossil fuels to produce energy (residential heating and electricity-generating power plants), together with major metallurgical industries, cement/construction industries, and the transportation sector. Figure 1 also identifies the primary pollutants from various sources: carbon monoxide, sulfur dioxide, ammonia, volatile organic compounds (VOCs), particulates and, relevant to the present article, the two major NOx agents (NO and NO2). Subsequently, through various interacting events that involve the Sun’s radiation, secondary pollutants are generated, among which are sulfur trioxide, ozone, hydrogen peroxide, and sulfuric and nitric acids (the causes of acid rain). Another class of air pollutants generated from internal combustion engines and industrial fumes that react in the atmosphere with sunlight produce secondary pollutants that, in combination with the primary emissions, create photochemical smog [2].
Pre-industrial concentrations of atmospheric nitrogen oxides have increased steadily from about 280 ppbv to ca. 320 ppbv until a decade ago (2010), with estimated annual emissions of 13.8 Tg of N per year (teragrams; 1012 g), of which ca. 70% is produced by nitrification and denitrification processes in undisturbed terrestrial environments and world’s oceans, and ca. 3 Tg of N per year (~8%) from agricultural tillage, fertilizer use, and animal wastes [3].
The NOx gases are formed in large measure in gasoline/diesel combustion engines and in power plants that use fossil fuels to produce electricity via high-temperature combustion/oxidation of the fuel’s nitrogen with air oxygen. Initially, only NO is formed followed by formation of NO2 after combustion in the exhaust and in the atmosphere in the presence of more O2. Figure 2a reports the 2011 levels of NOx emissions in the European Union [4], while Figure 2b reports the 2005 NOx emission levels in the United States [5]. The major anthropogenic sources of nitrogen oxides are combustion engines (transportation sector) and the electricity/heating sectors.
Most of the tropospheric ozone is formed when NOx, CO and VOCs react in the atmosphere in the presence of sunlight, and, although they might originate in urban areas, airstreams can carry the NOx far from its sources causing ozone formation in less populated regions. Globally, a VOC whose atmospheric concentration has increased greatly during the last century (viz., methane) contributes to the formation of ozone [6]. A series of complex reactions that involve a VOC (e.g., CO) in the formation of ozone implicates oxidation of this VOC by a hydroxyl radical (•OH) [7] first to yield the radical species HO•CO (Equation (1)), which subsequently reacts with oxygen to produce the hydroperoxy radical HOO• (Equation (2)) that later reacts with NO to give NO2 (Equation (3)); the latter photolyzes in sunlight to NO and atomic O(3P) (Equation (4)), which by reaction with oxygen yields ozone (O3; Equation (5)).
OH + CO → HO•CO
HO•CO + O2 → HOO• + CO2
HOO• + NO → •OH + NO2
NO2 + hν → NO + O(3P)
O(3P) + O2 → O3
While the chemistry involving other VOCs might be more complex, the critical step that leads to ozone formation remains nonetheless the oxidation of NO to NO2 by HOO• radicals. Nitrogen dioxide also reacts with hydrocarbon molecules present in VOCs to produce yet another pollutant (peroxyacetyl nitrates; PAN), a component of photochemical smog that is mostly responsible for eye irritation and is more damaging to plants than ozone [8].
The NOx family of pollutants (NO, NO2, N2O, and their derivatives) causes a wide range of health issues. Nitric oxide (NO) spreads to all parts of the respiratory system because of its low solubility in water, while the health effects of NO2 are related to its ability to dissolve in moisture to produce HNO3 acid—a strong mineral acid. Some of the acute health effects include eye irritation (stinging and watering), throat irritation (pungent smell, stinging nose, and coughing), lung irritation (coughing, wheezing and tight chest—difficulty in breathing), and asthma triggered in asthmatics [9,10]. The most serious acute effects occur after significant exposure to NO2 causing: (a) acute pulmonary edema—fluid from damaged lung tissue pours out into air spaces preventing air from getting to deeper lung thereby causing choking (asphyxia); and (b) other chronic health effects such as asthma and obliterative bronchiolitis, in which the smallest air passages (the bronchioles) are seriously scarred and become distorted and blocked. Consequently, no one questions the need for NOx-free clean air as essential to maintain/enhance an individual’s health, and to maintain the integrity of the surrounding environment. In this regard, transformation of the two major NOx species (NO and NO2), indeed their suppression, has become a necessity as they underwrite (with the VOCs) the formation of hazardous secondary air pollutants and the accompanying photochemical smog.
Two cities where photochemical smog is not insignificant are the Greater Los Angeles (LA) area in the United States and Beijing, China. Home to nearly 19 million people and located in a geological basin confined by the Pacific Ocean and mountains, LA is the basin of considerable pollution caused by its car-centric culture, its bustling industries and ports, its sprawling development, and its sunny climate with often stagnant winds. It was only in the 1950s that hydrocarbons and NOx were recognized as the source of photochemical smog (Figure 3); however, with the implementation of mandatory catalytic converters in automobiles in the last two decades, smog has been attenuated somewhat.
With its rapid growth and home to nearly 20 million people, and being an important industrial hub, Beijing is a city where poor air quality has been for decades a regrettable fact of everyday life owing to the presence of significant quantities of particulate matter and photochemical smog, as (Figure 4) experienced by the author in the early 1990s; in subsequent trips several years later, however, this author experienced significant improvements of air quality but by no means have the pollutants and smog been totally eliminated.
There have been many attempts to remediate the occurrence of NOx and VOC species in polluted urban environments with TiO2-based photocatalytic cementitious-like materials and photocatalytic coatings (paints) on various supports [11]. Several studies report on the performance of titania deposited on, or otherwise incorporated into cementitious substrates toward the minimization, if not suppression, of air pollutants (see, for example, Refs. [12,13,14,15,16,17,18]). Laboratory studies have shown, rather conclusively, that NOx can be oxidized to nitrate anions [19,20], while VOCs can be converted into CO2 and H2O [21]. Of some concern, however, are studies that demonstrate the formation of harmful intermediates (e.g., nitrous acid, HONO), which are far more harmful to human health than either NO or NO2 during the disposal of NOx [22,23]. Not least is the potential that nitrates (NO3−) produced and deposited on the TiO2 particulate surface in the disposal of NOx may be implicated in reNOxification reactions; that is, back to NOx [24,25,26] and formation of ozone [26] that would forestall the application of TiO2-based photocatalytic surfaces to improve the quality of urban air environments.
The objective of this review article is to examine the various attempts at eliminating NOx species in the urban environment produced mostly by vehicular traffic through application of commercially available titania-based photocatalytic materials, coatings and paints in tunnels, highways, highway noise barriers, and urban roads. However, before tackling that discussion, we describe briefly some fundamentals from basic research that underpin this TiO2-based photocatalytic technology. In its pristine or modified form, TiO2 has been the most popular and most extensively investigated photocatalyst, and is the primary source of modern third generation composite photoactive materials [27,28].
Photocatalytic processes occurring in heterogeneous systems are complex and multifarious starting from the absorption of photons by the solid photocatalyst, and ending with the evolution of reaction products. This complexity is particularly reflected in the terminology used to describe various characteristics of heterogeneous photocatalysis, which, although it has come to some maturity in recent years, continues to undergo extensive developments through efforts of many researchers from the fields of catalysis, photochemistry and materials science, among others. Accordingly, prior to tackling the many deNOxing efforts in cleaning up the atmospheric environment, an important aspect of applied photocatalysis with metal-oxide semiconductor photocatalysts, it is imperative to appreciate and understand some of the fundamentals underlying Heterogeneous Photocatalysis (following Section 2 and Section 3)—the primary approach in these efforts.
2. Some Fundamentals of Heterogeneous Photocatalysis
Historically, Heterogeneous Photocatalysis is an interdisciplinary field at the intersection of Chemistry and Physics. It rests on four basic pillars (Figure 5): (a) heterogeneous catalysis; (b) photochemistry; (c) molecular/solid-state spectroscopy; and (d) materials science of semiconductor photocatalysts of interest (in the present context: metal oxides). Accordingly, it is worth looking into each of these pillars to assess how they have shaped present-day knowhow, particularly Pillars (a)–(c) (Section 2) together with the photophysics of metal-oxide semiconductors (Section 3).
Currently, photocatalysis is best described as a change in the rate of a chemical reaction or its initiation under the action of ultraviolet, visible, or infrared radiation in the presence of a substance that absorbs light and is involved in the chemical transformation of the reaction partners; the photocatalyst is the substance that causes, by absorption of ultraviolet, visible, or infrared radiation, the chemical transformation of the reaction partners, repeatedly coming into intermediate chemical interactions with them and regenerating its chemical composition after each cycle of such interactions [29].
2.1. Influence of Catalysis on Photocatalysis—Comparisons and Contrasts
Some researchers consider photocatalysis a component of the field of Catalysis. However, some postulates that are typical of traditional catalysis are somewhat antagonistic to photocatalysis. For instance, by analogy with catalysis, one of the postulates would suggest that a photocatalytic process should favor only thermodynamically allowed chemical reactions. From this point of view, light should cause a decrease of the potential energy barrier relative to the dark catalytic reaction and thus accelerate the establishment of chemical equilibrium between reagents and products in the heterogeneous system. Photoreactions that take place in heterogeneous systems and are thermodynamically unfavorable (e.g., photolysis of water) are classified as non-photocatalytic but photosynthetic, despite similarities in all major steps of the photoprocesses. The sole reason for both types of photoreactions is the free energy of the actinic light. In fact, the action of the free energy of light turns the system into a thermodynamically open system so that, by definition, the concept of thermodynamic equilibrium is not applicable.
The definitions given to photocatalysis and photocatalysts are very similar to the definitions of catalysis and catalyst commonly used in conventional (thermal) catalysis. This similarity suggests a strong impact of catalysis to the field of photocatalysis. According to current thinking, photocatalysis is viewed as an alteration of the reaction rate in the presence of a substance that interacts repeatedly with reagents subsequent to which its original state is restored after each reaction cycle just like in catalytic processes. Thus, photocatalysis could, in principle, be considered as catalysis involving the action of light. Formally speaking then, the transformation of a reagent in a catalytic process may be exemplified by a simple chemical reaction (e.g., Equation (6)):
where Cat is the catalyst, R is the reagent, and P is the product. For a photocatalytic process, we need only involve the interaction of the system with light (Equation (7)):
Cat + R → Cat + P
Cat + R + hν → Cat + P
Certain similarities between catalysis and photocatalysis support such considerations, as both are characterized by the alteration of: (i) the reaction rate; and (ii) the reaction pathway; as well as (iii) by the essential role of adsorption of the reagent R and desorption of the product P in the (photo)catalytic cycle. In addition, the red-shift of the spectral limit of a photocatalytic process, in contrast to a catalyzed photochemical process, can be taken as an analog of the decrease of the activation energy required for the catalyzed reaction compared to the non-catalyzed reaction. Not surprisingly then, some terminology, major characteristics, and quantitative parameters typically used in catalysis have been adapted to the field of photocatalysis. For example, the terms activity and selectivity of a photocatalyst, as well as the terms surface-active center, turnover number and turnover frequency are examples transferred from catalysis to photocatalysis. Within the present context, the most important feature in photocatalysis borrowed from catalysis is the notion of a surface-active center that can best be described as a surface regular site or a surface defect site capable of initiating chemical transformations of the reactants [29].
In heterogeneous photocatalysis, surface-active centers (sites) initiate a chemical sequence subsequent to the centers being activated by absorption of (light) photons by the photocatalyst. That is, before the reaction cycle, the surface-active centers (S) on the photocatalyst are initially in their inactive ground state unable to react with other molecules. However, once the solid photocatalyst has been electronically excited by absorption of photons with the appearance of free charge carriers, electrons (e−) and holes (h+), or excitons (e°), this excitation energy may be localized on the surface-active centers to yield centers in their chemically active excited states (S+ and S−; Equation (8)), which can also form by interaction with the excitons (Equation (9)), or otherwise the photons may excite the surface-active sites directly to give S* (Equation (10)). The surface-active centers in their electronically activated excited state are then capable of initiating surface chemical reactions.
S + e− → S−
S + h+ → S+
S + e° → S− + h+
S + e° → S+ + e−
S + hν → S*
The photoactivated states of the surface-active centers can decay back to the ground state of the centers through different physical relaxation pathways: (a) by recombination of the charge carriers trapped at surface-active centers with free charge carriers of the opposite sign, or with free excitons (Equations (11) and (12)); (b) by thermal ionization when the activation energy of ionization is comparable to kT (Equation (13)); (c) photo-ionization in the spectral range of photexcitation corresponding to the absorption band of the surface-active centers (Equation (14)); and (d) by spontaneous deactivation (Equation (15)).
S+ + e− → S
S− + h+ → S
S+ + e° → S + h+
S− + e° → S + e−
S+ → S + h+
S− → S + e−
S+ + hν → S + h+
S− + hν → S + e−
S* → S + hν’
Concurrently, chemical reactions of molecules with the photoactivated states of the surface-active centers (S*) also lead to the return of the centers back to their ground state (S; Equation (16)).
S* + R → S + P
In summary, there are two states of surface-active centers in heterogeneous photocatalysis: (i) the initial inactive ground state S; and (ii) the chemically active excited state(s) (S+, S− or S*). Both physical relaxation and chemical interactions of these excited state(s) with molecules return the centers back to their initial ground state.
2.1.1. Is the Process Photocatalytic or Stoichiometric?
The photocatalytic cycle begins by absorption of photons causing the activation of surface-active centers, followed by chemical reactions that terminate by desorption of product(s) from the active centers, and restoring the centers back to their initial ground state. This is essential in determining quantitatively the parameters borrowed from catalysis: namely, the turnover frequency (TOF) and the turnover number (TON) [29]. TOF refers to the number of photoinduced transformations (product formed or reactant consumed) per catalytic site per unit time as expressed by Equation (17); Na is the number of catalyst active sites, and N is the number of photocatalytic transformations.
It is important to recognize that TOF considers the number of surface-active centers in their initial ground state before photactivation. When the number of such active sites is unknown, the surface area is often used to normalize the number of turnovers—this is known as the areal turnover frequency [29].
In catalysis, TOF describes the activity of the catalytic centers. In photocatalysis, however, the rate of a chemical transformation of a molecule in a photocatalytic process depends on the light intensity, so that TOF is also light intensity-dependent and is generally taken as a characteristic feature of a photocatalyst. TOF can be used to compare the activities of various photocatalysts only if the photocatalysts were photoactivated under identical conditions. This is extremely important! Otherwise, any comparison of the activities of various photocatalysts will have no physical/chemical meaning.
Another turnover quantity taken from conventional catalysis is TON that describes the number of times an overall reaction (the photochemical transformation) goes through a photocatalytic cycle for a given period, t (Equation (18)). Again, it is important to recognize that it is the number of photocatalytic centers in their ground state that is relevant when assessing TON in photocatalysis.
Since the photocatalytic reaction rate, and thus the number of photoinduced chemical transformations, depends on light intensity, TON cannot be considered an intrinsic property of a photocatalyst. Nonetheless, TON is an important parameter in experimental studies of heterogeneous photochemical reactions as it shows whether the photochemical transformation is catalytic. Where TON > 1, the active center is restored back to its initial ground state after the chemical transformation cycle and is ready to initiate subsequent cycles: the photochemical process is then said to be photocatalytic. When TON ≤ 1 after the first cycle, the active center is completely deactivated and cannot initiate subsequent cycles of the chemical transformations; this means that the surface-active center only interacts with one molecule. In this case, the process is a stoichiometric process, as encountered in photostimulated adsorptions of molecules on solid surfaces.
If a stoichiometric surface reaction were to occur on the same surface-active center as a photocatalytic reaction, it would provide a method with which to account for the number of surface-active centers and thus aid in establishing the magnitude of TON. For instance, if a photostimulated adsorption of a molecule is the first step in a complex photocatalytic process that concludes the photocatalytic cycle at the photoadsorption step, then it is possible to determine the number of photoadsorbed molecules that corresponds to the number of surface-active centers involved in the photocatalytic reaction. This method was used by Emeline and coworkers [30] to assess quantitatively TON for the photooxidation of hydrogen by oxygen and the photoreduction of oxygen in the presence of hydrogen over solid particles of ZrO2. The authors showed that the photostimulated adsorption of oxygen on zirconia, which by default is a stoichiometric reaction, is the first step in the photooxidation of hydrogen. Therefore, the maximal number of photoadsorbed oxygen molecules gives the number of surface-active centers for the photooxidation of hydrogen. They determined that TON > 1 for this process, and consequently the process was deemed to be a photocatalytic process.
2.1.2. Mechanistic Implications
Another common feature between catalytic and photocatalytic processes are the two general mechanisms of surface chemical reactions: (a) the Eley–Rideal mechanism (ER); and (b) the Langmuir–Hinshelwood (LH) mechanism. The Eley–Rideal mechanism assumes that molecules in the bulk solution phase interact with surface species (either pre-adsorbed molecules or surface-active centers), whereas the Langmuir–Hinshelwood mechanism presupposes that the reaction involves pre-adsorbed molecules and surface species (either pre-adsorbed molecules or surface-active centers). For decades, the LH mechanism was the favorite mechanism among experimentalists (although erroneously) because of the experimentally observed dependence of the rate of the photocatalytic process on reagent concentration (Equation (19)).
where k is the apparent rate constant, K is the apparent equilibrium constant, and C is the concentration of reactant molecules. This equation correlates with the Langmuir isotherm (Equation (20)):
where KL is the adsorption/desorption equilibrium constant (KL = kads/kdes) provided the rate of the process is proportional to the surface coverage (θ) by pre-adsorbed molecules (Equation (21)). That is, the adsorption/desorption equilibrium is not disturbed during the photoprocess.
If K = KL, then by default the observation that the rate dependence followed Equation (19) was taken as an indicator that the process followed the LH mechanism. However, for many heterogeneous photoprocesses, it was established conclusively that K ≠ KL and K depended on light intensity. Later, Emeline and coworkers [31,32] demonstrated that the dependence expressed by Equation (19) was also consistent with the ER mechanism, considering that the lifetime of the activated state of the surface-active centers is limited (see above). Moreover, if the physical relaxation pathway of the excited state of the active center involved recombination or photo-ionization, then K became dependent on light intensity in accord with experimental results (Figure 6 and Figure 7).
The approach based on a limited lifetime of the excited state of active centers is applicable to both ER and LH mechanisms, provided a quasi-steady-state is valid for the concentration of active centers in the activated state. The alternative view (i.e., LH mechanism) is also based on a quasi-steady-state approach for the concentration of adsorbed molecules and on a strong disruption of the adsorption equilibrium in accord with experimental data [33,34]. Kinetic measurements alone, as typically conducted in photocatalytic studies, cannot distinguish unambiguously which mechanism is operative in a photocatalytic process. Whatever the actual mechanism (ER or LH), however, the role of adsorption of a molecule on the surface is not insignificant and in fact is typical in heterogeneous photocatalysis. The only difference occurs in the ER mechanism, whereby photostimulated adsorption plays an important role rather than dark adsorption, with the latter so crucial to the LH mechanism.
In summary, heterogeneous catalysis has had a non-insignificant impact on the field of heterogeneous photocatalysis. Nonetheless, a serious discrepancy between these two phenomena remains. In catalysis, the catalyst is in its electronic ground state and is in thermodynamic equilibrium with the environment at a given temperature; it accelerates both direct and back reactions, and promotes a faster establishment of the reaction equilibrium. By contrast, in heterogeneous photocatalysis, the photocatalyst becomes active in an electronically excited state that is not in thermodynamic equilibrium with its surroundings, so that the sole relaxation pathway back to its ground state is acceleration of the direct reaction, because the photocatalytic heterogeneous system is an open system under a permanent flow of light energy as occurs in photochemistry.
2.2. Influence of Photochemistry on Photocatalysis—Comparisons and Contrasts
Photochemistry of heterogeneous systems is also an important pillar of photocatalysis, as it considers thermodynamically open systems. Thus, photocatalysis can also induce reactions that lead to light energy conversion and storage through formation of higher energy products, as occurs in natural photosynthesis [35,36]. Concepts taken from photochemistry suggest that the photocatalytic process occurs through electronically excited states of the photocatalyst prompted by light absorption. It should be noted that photocatalyzed reactions are often indistinguishable from photosensitized reactions examined in photochemistry [37]. Historically, many photocatalytic reactions were considered photosensitized reactions, so that what was once called a photosensitizer is now referred to as a photocatalyst. Two major characteristics of photosensitized reactions are also typical of photocatalytic processes: (i) a red-shift of the spectral limit of the photoreaction; and (ii) the alteration of the reaction pathway compared to that of the photochemical reaction. The red-shift of the spectral limit of a photoprocess and alteration of the reaction pathway are distinguishable fingerprints of heterogeneous photocatalytic reactions. Enhancing the ability of photocatalysts to sensitize photochemical reactions, especially toward visible light, is a major challenge in applied heterogeneous photocatalysis.
Photochemistry is concerned with the chemical effects of ultraviolet, visible, or infrared radiation while the photocatalyst is a substance that can produce on absorption of light chemical transformations of the reaction partners subsequent to formation of an excited state of the photocatalyst, which interacts repeatedly with the reaction partners forming reaction intermediates and regenerates itself after each cycle of such interactions [37]. Hence, a photocatalytic process (Equation (22)) is similar to a photochemical reaction (Equation (23)).
where Cat and Cat* denote the photocatalyst in the ground state and in its electronically excited states, respectively; R is the reagent in its ground electronic state; R* is the reagent in the electronically excited state formed by absorption of photons; and P is the product of the photochemical/photocatalytic transformation.
Cat + hν → Cat* + R
R + hν → R* → P
Thus, a photocatalytic process could be viewed as a particular case of a photochemical reaction, whereby the photocatalyst plays the double role as one of the reagents and as one of the products subsequent to restoring its initial ground state.
2.2.1. Photocatalytic Versus Photochemical Processes
There are far more mechanistic similarities between photocatalytic and photochemical reactions than there are between photocatalyzed and catalyzed reactions. Both the photochemical reaction and the photocatalytic reaction require absorption of photons to form electronically excited states of one of the reaction partners, which cause distortions of the initial thermodynamic equilibrium and both reactions then occur through non-equilibrium states. This means that the subsequent sequence of molecular transformations can only proceed in one direction to restore the equilibrium state of the system and there is no path for a back reaction. Both photoreactions are characterized by the existence of physical relaxation pathways of the electronically excited states: radiative and non-radiative relaxation processes. For a solid photocatalyst, these relaxation processes are excitonic decay, free charge carrier recombination, and charge carrier trapping. In addition, all photocatalytic processes obey the general law of photochemistry: only absorbed photons initiate chemical transformations, and one absorbed photon results in only one elementary transformation. Accordingly, photocatalysis can be viewed as catalysis of a photochemical reaction. Consequently, three major characteristics used in photocatalysis have been adopted from photochemistry: (a) spectral sensitivity of a photoprocess; (b) photoactivity of a photocatalyst; and (c) selectivity of a photocatalyst.
Spectral Sensitivity of a Photoprocess
The spectral sensitivity of a photoprocess is described by the spectral range wherein photon absorption by the system initiates a chemical transformation; for a photocatalytic process this is the red spectral limit that corresponds to the lowest energy photons to initiate photocatalytic cycles. Note that the blue spectral limit of all photocatalysts expands into the vacuum UV region and so cannot be determined under typical conditions. We have often noted that the photocatalysis literature claims (albeit incorrectly) that photons with energy lower than bandgap of the photocatalyst cannot initiate chemical reactions, and so the red spectral limit of a photocatalytic process is taken as the bandgap energy. Theoretically, this is true only for ideal solids with no defect states, although even for an ideal solid structure there are always regular surface states (e.g., the Tamm and Shockley states) whose energies of photoexcitation could be lower than the bandgap energy. In practice, however, one deals with real solid photocatalysts whose structures possess various imperfections: for example, intrinsic point defects, impurity defects, dislocations, and defect surface states (e.g., add-atoms, corners, edges, steps etc.). Photoexcitation of such defect states results in a significant shift of the red limit of the photocatalytic effect toward lower energy photons compared to the bandgap energy—for the case of TiO2, although the bandgap energies are 3.0 eV for the rutile polymorph and 3.2 eV for the anatase counterpart, the red limits for both oxidative and reductive pathways are 2.2 eV (λ = 560 nm), well below bandgap.
Accordingly, from a practical application of heterogeneous photocatalysis, the longer is the wavelength of the red spectral limit of the photocatalytic process, the larger is the fraction of sunlight that can be exploited for a higher overall activity of the photocatalytic system. Increasing the spectral sensitivity of a photocatalyst toward visible light is a major challenge in applied photocatalysis, currently being examined through modification of pristine photocatalysts by metal and non-metal doping and by physical modifications to form intrinsic defects, which give rise to extended extrinsic absorption of visible light. A detailed assessment of this issue and corresponding problems have been described elsewhere [38,39,40].
Photoactivity of a Photocatalyst: The Quantum Yield Φ
The photoactivity of photocatalysts describes the ability of a solid to transform the absorbed actinic light into a chemical sequence, for which the quantum yield (Φ) is its most relevant parameter. In heterogeneous photocatalysis, Φ is the ratio between the number of molecules that have reacted (Nm) to the number of photons actually absorbed (Nhν) at a given wavelength of the actinic light (Equation (24)), provided the photocatalytic process has reached a stationary state [29], otherwise Φ can be expressed by the differential form (Equation (25)):
Typically, Equation (25) is used since the reaction rate, and thus Φ, depends on such parameters as time, temperature, wavelength of the actinic light, concentration of reagent, light intensity, and the solution pH (among others). Regrettably, the rate of absorption of photons and the number of absorbed photons remain inaccessible quantities in heterogeneous photocatalysis because of experimental limitations. Consequently, the photonic yield (ξ) was introduced and defined in a manner similar to the quantum yield (Φ) with the main difference being that reference is made to the number of photons of a given wavelength of the actinic light (N°hν) incident on the photoreactor, and not on the number of photons absorbed by the photocatalyst under stationary conditions, as expressed by Equation (26) or in differential form by Equation (27) [28].
Both Φ and ξ are defined as in photochemistry [37]; the former is more appropriate, however, since only absorbed photons can initiate interfacial chemical reactions, thus Φ is an intrinsic characteristic of a photocatalyst. Nonetheless, ξ may be a more practical parameter to assess experimentally as it depends on the number of incident photons and not on the number of photons actually absorbed by the photocatalyst; ξ is also an intrinsic characteristic of a photocatalyst.
In the field of Chemical Engineering, the parameters often used are quantum efficiency and photonic efficiency; the former describes the rate of a given photophysical or photochemical process divided by the total photon flux absorbed [29]; it applies especially when using polychromatic radiation to activate the photocatalyst. The photonic efficiency describes the ratio of the rate of the photoreaction measured at t = 0 (initial rates) to the rate of incident photons within a given wavelength range [29]. Consequently, these parameters provide an estimate of the overall photoactivity of the photocatalysts, but provide no information regarding light absorption, photoexcitation mechanisms, and specific details as to the efficiencies of excitation transfer to the surface or to the initiation of surface chemical transformation as they denote engineering efficiencies.
We cannot overemphasize that the above parameters used in photocatalysis and borrowed from photochemistry characterize the efficiency of photocatalysts, unlike TON and TOF from catalysis which are light intensity-dependent. Photochemical parameters may also depend on the intensity of photoexcitation; however, experimental conditions can be controlled such as to obtain a linear dependence of the reaction rate on light intensity as established by Emeline and coworkers [30,31] to obtain the maximal photoefficiency of photocatalysts when all the quantum and photonic parameters become independent of light intensity. The quantum yield value (and other photochemical parameters) is essentially governed by the reaction rate of a heterogeneous photocatalytic reaction that depends on the stationary surface concentration of charge carriers (either electrons or holes) (Equations (28) and (29)).
R + e− → P
R + h+ → P
d[R]/dt = k [R] [e]
d[R]/dt = k [R] [h]
Selectivity of a Photocatalyst
The selectivity of a photocatalyst is the ability of a photocatalyst to drive a photoprocess toward a certain reaction product. Emeline and coworkers [41,42,43,44] established two possible causes for the selectivity of a photocatalyst when the rate of the surface photochemical reaction is dictated by the surface concentration of photocarriers (electrons for reduction, holes for oxidation).
The first originates from the ratio between the concentrations of electrons and holes at the surface of a photoactive material, so that alteration of this ratio caused by various factors leads to changes in the ratio between the efficiencies of surface redox reactions for molecules displaying both electron-acceptor and electron-donor behavior. For example, if a given reaction product (Pi) were formed by a reduction pathway during the photostimulated surface reaction with reagent (R) interacting with both electrons (e) and holes (h), the surface selectivity toward the formation of the given product (SPi) would then be expressed by Equation (30): ke,i and kh,j are the rate constants for a given reaction pathway. A similar expression can be formulated for the products formed by the oxidation reaction pathway.
By default, it is assumed that the reaction rate does not depend on reagent concentration, which would correspond to saturation of the rate dependence on reagent concentration for the LH-like kinetics. Equation (30) clearly indicates that the selectivity of the photocatalyst is determined by the ratio between the surface concentrations of electrons and holes.
The second origin of selectivity is related to the formation of surface-active sites of a different type, which may display different activity and selectivity. Different types of surface-active sites can be formed through photoexcitation of localized surface and sub-surface electronic states (intrinsic defects and/or dopant states), or through formation on different types of surface structures (e.g., dominating surface plane). This type of selectivity is clearly observed for molecules that demonstrate only electron-donor or electron-acceptor behavior, although it is typical of any surface photochemical reaction. As such, the selectivity of the surface toward formation of a given reaction product can be expressed by Equation (31), which is determined by the ratio of a given rate constant characteristic of a given sort of active site to the sum of rate constants corresponding to all possible types of active sites on the surface of the photocatalyst (here rate constants are apparent constants and implicitly include the surface concentrations of active sites). Obviously, this factor (ratio of rate constants) is also significant for the selectivity in the earlier scenario (Equation (30)).
Unlike macro crystals with their clearly manifested crystal faces, the dominant surface planes in nanoparticles of photocatalysts are strongly affected by the method and conditions of their synthesis. Concomitantly, in the course of photoprocesses, various planes of photocatalyst particles may display different selectivities, which may be due to different atomic structures, or magnitude and distribution of surface charge, or to a dominant type of defects (e.g., surface-active centers, among others) [45,46,47,48,49]. Hence, altering the nanoparticle surface structure via formation of various dominating faces with strong selectivity toward either oxidation or reduction can alter the overall selectivity of the photocatalyst.
2.2.2. Correlation between Activity and Selectivity
The correlation between activity and selectivity of a photocatalyst has been demonstrated by Emeline et al. [50] in the photodegradation of 4-chlorophenol taking place over irradiated TiO2 with formation of three primary intermediates: (i) benzoquinone formed by a reductive pathway; (ii) 4-chlorocatechol formed by an oxidative pathway; and (iii) hydroquinone produced by both oxidative and reductive pathways. Figure 8 shows that the selectivity toward formation of hydroquinone and the activities of the photocatalyst are strongly correlated (r = 0.984; p = 0.0004).
According to the balance of charge, as expressed by Gerisher [51], a true (photo)catalytic process is characterized by the equality of the rates of consumption of electrons and consumption of holes in the overall reaction (Equation (32)). That is,
This charge balance is a required condition for the effective photocatalytic process, or else the deviation from catalytic equilibrium (Equation (32)) would result in the transformation of charge balance according to Equation (33) [38,52].
where F and V denote, respectively, electrons and holes trapped in bulk defects (color centers), which accelerate bulk charge carrier recombination and decrease the activity of the photocatalyst. Since formation of hydroquinone consumes both electrons and holes, these reaction pathways create a favorable condition for the photodegradation of the phenol being truly photocatalytic by suppressing bulk recombination. Therefore, the higher is the selectivity of the photocatalyst surface toward formation of hydroquinone, the higher is the activity of the photocatalyst during the photodegradation. In general, this rule can be formulated thus: a higher activity of photocatalysts can be expected provided both reductive and oxidative pathways occur with equally high efficiency.
2.3. Influence of Molecular Spectroscopy on Heterogeneous Photocatalysis
Another major pillar of heterogeneous photocatalysis is molecular spectroscopy of adsorbed molecules. Most pioneering studies focused on understanding the changes in molecular structure induced by adsorption of molecules on solid surfaces [53,54,55], with light being an active factor in transforming these adsorbates. The effects of photodissociation and photodesorption of adsorbed molecules have been established together with the photoadsorption of simple molecules on dispersed semiconductors [55,56].
The photocatalytic cycle begins with the absorption of light quanta by the solid photocatalyst and culminates with the chemical transformations of surface-adsorbed molecules, ultimately evolving reaction products into either the gaseous or liquid phase. The role of the photocatalyst and corresponding photophysical events taking place in solids are often treated in a simplistic manner. The ensemble of particles that absorb photons is the light harvesting system, whereby the photocatalyst particle is both a sensitizer and the source of intermediates—i.e., photoelectrons and photoholes. In addition, the intrinsic, that is, the fundamental absorption of light by the solids is of primordial importance in photocatalysis; this was a reasonable approach in most studies that were oriented on mechanistic investigations of chemical reactions, or else on practical applications of heterogeneous photocatalysis. The complexity and variety of photophysical processes in solid photocatalysts, together with the interdependence between physical and chemical events at the microparticles’ and nanoparticles’ surfaces, must always be kept in mind, even in applied heterogeneous photocatalysis. Accordingly, next we describe some relevant events that precede surface chemical reactions on the photocatalyst particle (Figure 9).
2.3.1. Absorption of Light by Solid Photocatalysts
Absorption of electromagnetic radiation represents the transfer of energy from an electromagnetic field to a material (the photocatalyst) or to a molecular entity [29]. The transformation of light energy into the energy of electronic excitations (electrons, holes) of a solid photocatalyst is fundamental in heterogeneous photocatalysis, with these excitations being created as a result of absorption of photons in a solid during some time (lifetime of charge carriers) before relaxation (recombination of charge carriers), i.e., before transformation of the electronic energy into thermal energy. Electron–hole pairs in solids then transfer the energy within some sub-surface space, the depth of which depends on both the linear absorption coefficient of the photocatalyst and the diffusion length of the photocarriers and, in some particular cases, on particle size.
2.3.2. Quantities that Describe Light Absorption in Heterogeneous Photocatalysis
Dispersed (powdered) photocatalysts in contact with gaseous or liquid phases in irregular shaped reactors are typically the light absorbing media, and so require consideration of the absorption and scattering of light together with a few quantities that we now outline for the absorption of light used in experimental photocatalytic reactions.
Absorption of light is manifested by the decrease of the energy of the light beam when it passes through a medium because of the transformation of the photon’s energy into another energy form. Experience has taught us that IR + IT < I0 for light absorbing substances and so in accord with the energy conservation law, the intensities of the incident (I0), transmitted (IT) and specular reflected (IR) beams are given by Equation (34),
where IA is the intensity of the absorbed light beam. For moderate intensities of the incident light beam and in the absence of additional input of energy to the substance, we have (Equation (35))
I0 = IR + IT + IA
IR = R I0
IT = T I0
IA = A I0
The dimensionless coefficients R (here it denotes the reflectance), T (transmittance) and A (absorbance) in Equations (34) and (35a)–(35c) satisfy Equation (36),
R + T + A = 1
Typically, absorbance can be determined optically using a dual-beam spectrophotometric technique such that the ratio IT/I0 is detected, while reflectance is compensated using a reference sample. From experience, we have that (Equation (37))
And, from Equations (35a)–(35c) and (37), we obtain for A (Equation (38)) that
which describes the Lambert–Bugger law for absorbance by a solid parallel plate of thickness d; the quantity α is the linear (Naperian) absorption coefficient (in cm−1). In general (Equation (39)),
where I(x) is the intensity of the light beam a distance × from the illuminated surface of the optically uniform plate.
Equation (39) can also be obtained from Equation (40) which expresses the independence of the absorption coefficient α from the light intensity,
where dI is the fraction of light absorbed by a thin layer dx a distance × from the plate surface. The density of absorbed photons (Equation (41)) can be deduced from Equations (39) and (40). If the light beam of intensity I0 were given in units of photons per unit area per second, then the units of dI/dx are cm−3 s−1.
dI = −α I(x) dx
The absorption coefficient α is a spectrally dependent parameter (α = α(λ)), whose magnitude varies in a wide range for different solids and can reach values up to ca. 106 cm−1 for the fundamental absorption band but can be very small for extrinsic absorption bands of solids.
Where absorption of light is due to defects or to structural imperfections (i.e., in the extrinsic absorption region for a transparent solid), the linear absorption coefficient α is proportional to the concentration of defects n (Equation (42)); σa is the absorption cross section of a defect.
α = σa n
Equation (42) represents Beer’s law (for defects in solids); the law fails at very high defect concentrations (typically > 1018 cm−3) when the interaction between defects in the solid becomes significant.
Taking into account Equations (42) and (37)–(39), a comparison with corresponding formulas in UV-Vis absorption spectroscopy of solvents indicates that the wavelength-dependent quantity σa becomes the extinction coefficient that characterizes the optical properties of a given defect in the solid. The absorption cross-section, σa, for optical transitions in defects that are allowed by appropriate selection rules can reach values of ~10−16 cm2. Consequently, α ≈ 102 cm−1 for n ≈ 1017–1018 cm−3; this is typical of imperfect photocatalyst particles. When the nominal concentration of regular entities (atoms, ions) in solids (n ≈ 1022 cm−3) is multiplied by σa ≈ 10 −16 cm2 leads to a realistic estimation of the absorption coefficient (α ≈ 106 cm−1) for fundamental absorption bands, despite breaching the conditions of Beer’s law validity. Variation of α with wavelength of the actinic light is an important factor in the activity of solid photocatalysts and other spectrally dependent parameters.
2.3.3. Absorbance and Reflectance of Photocatalysts in Powdered Form
Powdered solids with sufficiently high BET surface areas (SBET = 10–100 m2 g−1) are typically used in photocatalytic studies and correspond to characteristic mean particle sizes in the microscale to nanoscale comparable to the wavelength of the actinic light. Contrary to the optically uniform plate noted earlier, light scattering now plays a major role in the action of light on powdered photocatalysts. Because of light scattering, a powdered photocatalyst in pellet form is now opaque to light compared with the optically uniform plate of the same material, even in the spectral region where absorbance is very low (extrinsic absorption region). Consequently, most of the light is reflected back in various directions and gives rise to diffuse reflectance. The light intensity decreases with distance from the illuminated side of the pellet. In this case, the Lambert–Bugger law is not valid in its original form (Equation (6)) so that in practice the energy conservation law (Equation (34)) should be applied to powdered materials with some restraint since care must be taken in measuring the diffuse reflected light.
Diffuse reflectance spectroscopy has proven a useful method in experimental measurements of the optical absorption of powdered metal-oxide photocatalysts. For instance, the absorbance A of a sample and the diffuse reflectance coefficient, R, are related by Equation (43) for zero transmittance (i.e., for T = 0); in practice, this is valid when the thickness of the powdered sample is around 3–5 mm.
A = 1 − R
UV-Vis-NIR diffuse reflectance spectra, R(λ), are usually recorded with spectrophotometers equipped with an integrating sphere assembly and a standard reference sample of known diffuse reflectance spectrum. Accordingly, R(λ) or A(λ) spectra provide the spectral information about the initial state of a powdered sample.
Additional spectral information can be obtained from difference diffuse reflectance spectra, ∆R(λ), when changes in reflection/absorption occur from controllable treatments of the photocatalyst (e.g., annealing or illumination in a vacuum or in the presence of gases) (Equation (44)).
where R1(λ) and R2(λ) are the diffuse reflectance spectra measured, respectively, before and after the treatment. The case where ∆R(λ) > 0 corresponds to the treatment-induced absorption spectrum. Hence, from Equation (43) we obtain (Equation (45)):
∆R(λ) = R1(λ) − R2(λ)
∆R(λ) = ∆A(λ) = A2 − A1
Thus, alteration of the diffuse reflectance coefficient in photocatalytic experiments corresponds to changes in the absorbance of the photocatalyst sample, which for practical applications is more important than changes in the absorption coefficient (such as quantum yield measurements) as it provides the information about the spectral behavior of the whole heterogeneous system. Difference diffuse reflectance spectra (∆R(λ)) not only increase significantly the accuracy of measurements but make information accessible with regard to absorption spectral shapes induced by whatever treatment the photocatalyst is subjected to. Hence, measurements of a set of induced absorption spectra of different spectral shapes allow for a numerical analysis of the spectral data that could be very important for absorption spectra consisting of several overlapping single absorption bands.
2.4. Intrinsic and Extrinsic Absorption of Light by Semiconductor Photocatalysts
Two different spectral regions of light absorption can be distinguished in the field of optics and in the photophysics of the solid state: (i) intrinsic or fundamental absorption; and (ii) extrinsic absorption of light. Intrinsic light absorption is due to photoinduced electronic transitions between occupied delocalized states in the valence band and unoccupied delocalized states in the conduction band of semiconductor photocatalysts [57,58].
The intensity of the inter-band photoexcited transitions, characterized by the coefficients α and σa, is determined by selection rules similar to those for atomic photoexcitation and by the additional requirement for a quasi-momentum conservation. As a case in point, photoinduced electronic transitions in TiO2 from the top of the valence band (mostly oxygen p-states) to the bottom of the conduction band (mostly titanium d-states) are allowed transitions (p → d transitions) as are the p → s transitions in alkali halides. The intensities of photoinduced transitions from the VB to the CB in alkali halides are much greater than those observed in TiO2. The reason for this difference in solids may be found in the momentum conservation law for electrons that requires the fulfillment of the condition expressed by Equation (46):
where k1 and k2 are the wave vectors of electrons in the states between which the transition occurs and khν is the wave vector of the photon which, when absorbed by the solid, causes the transition. To the extent that the momentum of photons resulting in the electronic transition in a typical spectral range of photoexcitation of a solid is much smaller than the quasi-momentum of electrons occupying the band states, the condition expressed by Equation (44) can be simplified to Equation (47) with the proviso that khν ≈ 0.
k1 − k2 = khν
Δk = k1 − k2 ≈ 0
The transition between states in the VB and CB bands that follows Equation (46) is referred to as a direct transition (i.e., the transition preserves the momentum of the electron) and is characterized by high intensity at the edge of the fundamental absorption. Where the positions of the maxima do not coincide in k-space (typical of TiO2), direct transition between these states is then forbidden because momentum conservation is not preserved. Nevertheless, photoinduced electronic transitions between such states can occur via involvement of phonons that possess the required momentum. Accordingly,
where khω is the wave vector of either the absorbed or the emitted phonon. Such transition is referred to as an indirect transition characterized by lower intensity as it requires a three-body interaction of the electron, the photon and the phonon.
Δk ± khω ≈ 0
Extrinsic light absorption in solids may originate from the photoexcitation of such defect states as: (i) zero-dimensional (0-D) intrinsic point defects (e.g., vacancies, interstitials) and impurity atoms/ions; (ii) one-dimensional (1-D) linear defects (e.g., dislocations); and (iii) two-dimensional (2-D) states (e.g., intrinsic surface states).
Special interest in heterogeneous photocatalysis concerns the surface absorption of light associated with the electronic excitation of surface states, for which the energy of absorption corresponds to the extrinsic spectral region of the solids. In this regard, the greater the specific surface area is, the greater is the impact of surface absorption into extrinsic absorption. The important issue here is that the generation of charge carriers that may induce surface chemical reactions occurs only at the surface of the solid photocatalyst.
To recap, the various absorption bands corresponding to photoexcitation of different types of defects, impurities, and surface states can cover a wide spectral range of extrinsic light absorption. This photoexcitation generates free charge carriers or surface-localized excited states that can initiate interfacial chemical processes. Accordingly, the red spectral limit of a heterogeneous photochemical or photocatalytic reaction corresponds to photon energy much less than the bandgap energy of the solid photocatalysts. The photoactivity in the extrinsic absorption spectral region is typical of most metal-oxide photocatalysts, including TiO2.
3. Photophysical Processes in Metal-Oxide Photocatalysts
3.1. Intrinsic Structural Point Defects in Metal Oxides
Point defects related to anion (oxygen) and cation (metal) vacancies in sub-lattices are the main types of defects in metal-oxide semiconductors/insulators. Structure, together with the optical and EPR properties of families of both oxygen vacancies (Vo) and cation vacancies (Vm) are now fairly understood for wide bandgap metal oxides such as MgO, Al2O3, and ZrO2 (among others) [59,60,61,62,63,64,65,66,67].
3.1.1. Defects Related to Oxygen Vacancies (Vo)
There are three main types of defects in the oxygen sub-lattice of MgO related to oxygen vacancies, the so-called F-type centers: (i) doubly charged (with respect to the lattice) and optically silent anion oxygen vacancies (F2+ centers); (ii) anion vacancies with one trapped electron (F+ centers); and (iii) two trapped electrons (F centers) [59,60,61,62]. A main feature of F+ and F centers is a strong localization of the electron(s) within the vacancy. Semi-empirical quantum chemical calculations based on the INDO approach [61] have shown that the optimized geometry of oxygen vacancies with both bare and trapped electrons is characterized by a displacement of the nearest-neighbor cations in a direction away from the vacancy. Atomic relaxation is largest for F2+ centers (6.5% of regular Mg–O distance), whereas cation displacement for neutral F centers is <2% [61]. Calculations of ionic MgO crystals have shown that electrons trapped by Vo are indeed localized in the vacancy, and that the effective charge of F+ and F centers in the ground state was −1.002 and −2.002, respectively, while the changes in the effective charges of Mg and O ions surrounding Vo were inconsequential with respect to regular ones [61].
In the wurtzite ZnO lattice, the value and direction of the relaxations of Zn atoms adjacent to an oxygen vacancy strongly depend on the charge state of the defect. For the F center (Voo), the Zn atoms are displaced inward by approximately 11–12%, while, for the F2+ center (Vo2+), an outward relaxation of about 19–23% occurs (Figure 10) [64].
The optical absorption by F+ and F centers and electron processes subsequent to absorption of light is of some importance in metal oxides, because the energy of a photostimulated electron transition from the ground state to the exited state and the position of the exited state within the bandgap relative to the bottom of the CB band determine the formation of free electrons in the CB band.
An explanation of the formation of free charge carriers by photoexcitation of F or F+ centers had been proposed in two earlier studies by Kuznetsov and coworkers [68,69]; it is illustrated schematically in Figure 11. It was implied that the first photophysical event is the optically- activated electronic transition from the ground state F (or F+) center to its excited state (F)* (or (F+)*). Free electrons in the conduction band then result from a thermally-activated electron transition from the F* (or (F+)*) state to the conduction band, while the free holes in the valence band appear through a thermally-activated capture of an electron from the valence band by the lower level of the excited F* (or (F+)*) center. After the photoformation of electron–hole pairs through such a scheme, the F* (or (F+)*) center returns to its initial ground state that ensures the stability of these processes during the photoexcitation events. The thermal energy needed for the occurrence of such processes is about 0.1 eV for the 2.95 eV absorption band and ~0.5 eV for the 2.56 eV band that significantly exceeded the energy of phonons at the temperatures employed (bandgap energy Eg of VLA rutile was 3.05 eV at 90 K and 3.01 eV at 290 K). A recent study based on experimental results and literature data further led Kuznetsov and coworkers [70] to hypothesize that, following the prime optical excitation of defects in the solid (Ti3+ centers), the heat released during the non-radiative electron transitions dissipated into the nearest neighborhood of these centers with consequences (see Section 5). Localized non-equilibrated excitation of the phonon subsystem was equivalent to energies up to 1 eV.
Experimentally determined positions of the absorption band maxima of F and F+ centers in several other metal oxides have been reported [60,61,71,72]. In accord with experimental results, theoretical calculations placed the ground state levels of both F and F+ centers in MgO (bandgap, 7.8 eV) at 3 eV above the top of the VB band [61]; this means that the exited states of these centers are near the bottom of the CB band (experimentally, ca. 0.06 eV below CB; see Ref. [61] and references therein). In the case of TiO2, the F centers have been located at 2.9 and 2.55 eV [61].
The ground state of the F center in α-Al2O3 is at 5.3 eV from the VB band, and thus the excited state F* lies within the conduction band manifold [61]. The ground state of the F+ center is distant from the VB band by 3.1 eV so that the exited state (F+)*, corresponding to the absorption band at 6.3 eV, lies within the CB band. Indeed, irradiation at 6.1 eV within the spectral range corresponding to the F+ center’s absorption band produces photoconductivity down to at least 10 K (see Ref. [63] and references therein). For other F+-center’s exited states corresponding to the 5.4 eV and 4.8 eV absorption bands are 1.0 eV and 1.7 eV distant, respectively, from the CB band. Thus, UV irradiation in the absorption bands of F and F+ centers in MgO or F centers in α-Al2O3 result in the photo-ionization of the defects and ultimately initiation of surface reactions in the absence of any significant number of bulk electron traps.
Absorption spectra of strongly defective crystals of MgO and Al2O3 revealed additional absorption bands that were ascribed to aggregates of oxygen vacancies [61,73,74,75,76], the main types being F2 centers (i.e., 2 Vos with 4 trapped electrons), and F2+ and F22+ centers (two Vos with three and two trapped electrons, respectively). Under irradiation with fast neutrons (E > 1.2 MeV) [75] or bombardment by Cu+ or Ti+ ions (E = 30 KeV) [74], F and F+ centers were shown to be the dominating defects in the oxygen sub-lattice. It is evident that the family of intrinsic defects related to oxygen vacancies yields in toto broad absorption spectra covering the UV, visible and near-IR spectral regions.
A full understanding of the pathways of photoactivation of wide bandgap metal oxides requires a detailed examination of the photoconversion F+ → F. In his 1982 review article, Crawford called attention to a puzzling feature of the behavior of F+ centers in Al2O3 when irradiated into the 4.8 eV and 5.4 eV absorption bands, which decreased the number of F+ centers and increased the number of F centers (absorption band at 6.0 eV) [63]. Photoconversions F+ → F were also found in MgO crystals and were accompanied by formation of hole centers [61,62,63], which excludes thermal ionization of the excited (F+)* center followed by further electron trapping by another F+ center. Hole formation was connected with the spontaneous electron capture from an O2− adjacent to the (F+)*-center’s empty ground state [63].
Semi-empirical calculations have also offered explanations for the F+ → F photoconversions [61,62]. Theory predicted the existence of several quasi-local energy levels of the F+ center in the upper part of the VB band, which consist mainly of atomic orbitals of O2− ions surrounding the F+ center. Under optical excitation, electron transition from these quasi-local levels to the ground state of the F+ center yielded an F center and a hole in the VB band [61,62]; ultimately, the hole was trapped either by a cation vacancy Vm or by some impurity.
Predictable schemes of the photogeneration of electrons and holes on excitation of F-type centers in wide bandgap oxides can be summarized by Equations (49)–(51c).
F + hν → F* → F+ + e−cb
F+ + hν → F+* → F2+ + e−cb
F+ + hν → F+*
F+* + (O2−)vb → F + (O−)vb
(F+)ql + hν + (O2−)vb → F + (O−)vb
Equations (49) and (50) represent cases of the photoionization of defect centers with formation of free electrons in the CB band. Equation (51b) corresponds to electron capture from an O2− ion adjacent to the F+*-center, whereas Equation (51c) represents electron excitation from quasi-local levels of an F+-center (i.e., F+ql) in the VB band accompanied by formation of an F center.
Emeline and coworkers [77] reported a single maximum at 4.6 eV in the spectral dependence of the quantum yield of photoadsorption of O2 on powdered MgO, whereas Kuznetsov et al. [78] and Lisachenko [79] reported the maximum to occur at 5.0 eV. Spectral dependences of Φ of photo-adsorption of H2 and CH4 on powdered MgO displayed maxima at 4.6–4.55 eV [77] and a well-resolved shoulder at 3.75 eV. The photogeneration of holes on excitation within the spectral range, corresponding to the absorption band of F+ centers with maximum at 4.9 eV, was likely responsible for the photoadsorption; however, the spectral feature at 3.75 eV found no counterpart in the absorption spectra of F+ and F centers. Only the absorption band of an F2 center at 3.63 eV was near the feature at 3.75 eV, but nothing is known about the processes that followed the photon absorption by this center. Note that hole trap point defects related to cation vacancies in MgO absorbed light in the region 2.2–2.35 eV [67], far from the spectral feature just described.
Spectral efficiencies of the photoadsorption of O2 and the photodissociation of N2O on Al2O3 displayed a maximum at 5.6–5.4 eV and a shoulder at ~4.8 eV [79], in good agreement with the absorption bands of F+ centers at 5.4 and 4.8 eV; as noted earlier, however, direct photoionization of these centers in Al2O3 in this spectral region appeared unlikely.
Although optical properties of F-type centers in wide bandgap metal oxides have been studied sufficiently both theoretically and experimentally, interpretation of the data on the spectral response subsequent to irradiation, even for simple photoreactions such as photoadsorption of O2 and H2, has encountered some problems.
Indeed, the spectral dependencies of the quantum yield of O2 and H2 photoadsorption in the visible and near-bandgap spectral regions for powdered TiO2 reported by Cherkashin’s group [80,81], by Emeline and coworkers [77,82], and by Komaguchi et al. [83] have been digitized; results are illustrated in Figure 12 and Figure 13. The majority of the action spectra appear as a sum of two bands, the main band occurring at 3.0–2.9 eV with a half-bandwidth of 0.15–0.3 eV, independent of the type of gas used (O2, H2 or CH4) and irrespective of the crystalline structure of TiO2 (rutile or anatase). Spectra 2 and 3 in Figure 12 and 3 and 4 in Figure 13 display an additional band (seen as a shoulder) with maximum at ca. 2.5–2.7 eV. The action spectra of the photogeneration of paramagnetic O2−• (Figure 12, Curve 4) and [O–O2] species (Figure 13, Curve 5) show broad spectra with a single maximum around 2.6–2.8 eV.
The action spectra of the photogeneration of electrons (photoadsorption of O2 or photoformation of O2−•) or of the photogeneration of holes (photoadsorption of H2 and CH4 or the photoformation of [O−O2]) originate from excitation of intrinsic defects, which have a biographical origin because all samples examined were nominally pure (undoped). Note that the rutile specimen displaying the broad action spectrum (Figure 13, Curve 5) had been strongly reduced by a H2 heat treatment at 773 K; it showed an absorption spectrum with a well-resolved shoulder at 2.7 eV and a broad absorption in the near-IR region (after bleaching the initial absorption in the presence of O2) [83].
Four principal reasons led Kuznetsov and Serpone [84] to model the photoactivation of (modified) TiO2 in the visible region: (1) the spectral position of the bands constituting the action spectra (i.e., bands at 3.0–2.9 and 2.5–2.7 eV); (2) the coincidence of the bands for the photo- generation of electrons and holes with the latter allowing the authors to propose that photoexcitation of intrinsic defects leads to the simultaneous generation of electrons and holes (electron–hole pairs); (3) the spectral position of the absorption bands at 2.95–2.75 eV and at 2.55–2.50 eV in the spectra of reduced TiO2 attributed to F centers [84]; and (4) the known regularities of photoexcitation of F type centers and consequent physical processes. In this regard, the authors [84] proposed a simple reasonable mechanism to interpret the experimental results reported in Figure 12 and Figure 13. In accord with their study of TiO2 specimens, the first photophysical event of photoinduced absorption and photoreactions was light absorption by the F center that led to the formation of the corresponding excited state F* (Equation (52)).
F + hνAB → F*
F* → F+ + e−cb
F* + Δ → F+ + e−cb
F+ + (O2−)vb → F + (O−)vb
F* + (O2−)vb →F + (O−)vb + e−cb
If the ground state of the F center lay within the bandgap near the VB band, then F* should lie within or close to the CB band. The energy difference (Ebg – hνAB) was only about 0.2–0.3 eV between the Ebg of the rutile/anatase TiO2 and the AB1 band, and 0.55–0.60 eV between the Ebg and the AB2 band. The excited F* center transforms spontaneously into the F+ center and a conduction band electron (Equation (53a)), or else it does so through thermal stimulation (Equation (53b)). Formation of a hole supposes the capture of an electron by the F+ center from the VB band, i.e., from the O2− ion (Equation (54)). Equation (55) describes the synchronous formation of an electron–hole pair. Hence, Equations (52)–(55) infer the photogeneration of both CB band electrons and VB band holes under visible light irradiation, and recovery of the centers of light absorption during irradiation.
3.1.2. Defects Related to Cation Vacancies (Vm)
The main type of defects in the cation sub-lattice of metal oxides are defects related to cation vacancies, Vm, which have one or two holes trapped, i.e., V− or V° centers, respectively. The atomic and electronic structure, the mechanism of optical excitation, and thus optical properties of hole V-type centers are defined by hole localization (trapping) at one of several equivalent oxygen ions surrounding the metal vacancy. The term bound small polaron also applies to emphasize the interconnection of carrier (hole) trapping at a single site and the stabilization of the hole at this site by a lattice distortion. INDO calculations [61] showed that, in the V− center of MgO, the O− ion is closer to the cation vacancy by 3% of the Mg–O distance in the perfect crystal. In the V° center, the two O− ions that can capture two holes are located on the opposite side of the cation vacancy; they are shifted inward toward the vacancy by 2% of the regular Mg–O distance.
It is clear from the brief description of optical properties of photocatalytically active metal oxides that, in addition to the photoexcitation of solids in the fundamental absorption bands, there are many other pathways for the generation of electrons and holes. Concurrently, the same defects can play either negative or positive roles with respect to heterogeneous photocatalysis. For instance, they can act as recombination centers that reduce the concentration of photocarriers. However, being localized at the surface of photocatalyst particles, the defects are more likely to play the role of surface-active centers in photocatalytic processes.
3.1.3. Photogeneration, Recombination and Trapping of Charge Carriers in Photoactive Solids
Photoexcitation of solid photocatalysts in their fundamental absorption bands is the most appropriate type of photoexcitation in heterogeneous photocatalysis, as both electrons (reductants) and holes (oxidants) are generated. Concurrently, the generation of carriers also occurs as a result of light irradiation at wavelengths corresponding to extrinsic absorption bands, i.e., in the longer wavelength spectral region with respect to the fundamental absorption edge of the solids. The same is true of dopant-sensitized photocatalysts.
Recombination of electrons and holes can occur by two pathways: (i) direct recombination of free electrons from the conduction band with free holes from the valence band; and (ii) indirectly through the participation of defects (recombination centers). In the latter case, sequential trapping of free carriers of opposite charge by recombination centers takes place in each recombination cycle. The quasi-stationary concentrations of carriers established under stationary illumination of the photocatalyst depends on the concentration and trapping cross-section of the recombination centers. When photogeneration of carriers takes place in the bulk of the photocatalyst particle (a typical case), photoelectrons and photoholes reach the surface via diffusion. On the other hand, a fraction of the carriers is captured by various carrier traps, both in the bulk and at the surface of the solid particle in sufficiently high number, provided that trapping cross sections of one carrier takes place relatively slow (so-called deep traps of the color center type). Deep traps that capture the carriers may be centers of the V-type or of the F-type, depending on the charge of the captured carrier. Surface traps of this kind play the role of photocatalytic active centers. In relation to the chemical interaction with molecules, it is useful to distinguish two states of such centers—the inactive state (without trapped carriers) and the active state (trap is occupied by either an electron or a hole).
3.1.4. Trapping of Carriers by Defects
Carrier trapping by a defect is a good example of a perfect inelastic collision of carriers with the defect. The effectiveness of carrier trapping in solids is characterized by the phenomenological trapping cross-section, σtr (Equation (56)).
where dN/dt is the number of carriers trapped by the defect per unit time; v is the mean velocity of the carriers (v ≈ 107 cm s−1); and n is the concentration of thermal carriers (or stationary concentration of photocarriers). The quantity dN/dt has dimensions and notion of frequency; its inverse can be treated as the lifetime of a defect (unoccupied by a carrier) relative to a trapped carrier.
Trapping cross-sections are determined by the properties of the defects; they vary within a rather wide range from 10−21–10−20 cm2 (trapping is energetically favorable but an activation barrier exists) p to 10−11–10−10 cm2 (strongly attractive Coulomb center; scattering of excess energy is effective). Typical values of σtr lie in the range between 10−16 and 10−15 cm2 for neutral defects.
3.1.5. Stationary Concentration of Photocarriers and Band-to-Band Recombination
Figure 14 outlines the generation and recombination of carriers of various kinds that determine the stationary concentration of photocarriers in wide bandgap solids [85].
In general, both electrons and holes generated in wide bandgap solids on absorption of photons with hν > Ebg initially transit into states at some energy distance from the bottom of the CB and the top of the VB, respectively (Step 1 in Figure 14a). Thermal equilibrium between the crystal lattice and the photocarriers is established as a result of relaxation of the energy and momentum of carriers within the timescale of ~10−10 s (Steps 2 and 2′). Subsequent lowering of the energy of carriers occurs via recombination and trapping. For ideal (non-defective) solids, only radiative and nonradiative band-to-band recombination is possible (Steps 3 and 3′). The nonradiative electron transitions CB → VB in wide bandgap solids (Ebg ≥ 3 eV) have low probability since participation of many phonons with energy of 0.1 eV is required in the process. In general, the higher is Ebg, the higher is the probability of radiative transitions in solids with emission of photons manifested as an inter-band or edge luminescence. At the same time, the probability of radiative band-to-band transitions is rather low, since the momentum conservation law (see above) requires that the condition similar to that for band-to-band direct transitions be satisfied. Typically, band-to-band luminescence in wide bandgap solids with photon energy close to Ebg (Step 3, Figure 14a) is detected at moderate intensities of the exciting light for rather perfect crystals, for which competitive radiative recombination of carriers through defects (recombination centers, R) is suppressed, or in the case of intense photoexcitation of the crystal when a high concentration of photocarriers is achieved in the solid.
A more detailed treatment of band-to-band recombination was outside the scope of this review article, but suffices to note that band-to-band recombination in line with band-to-band optical excitation in TiO2-based heterogeneous photocatalysis is often treated following Equations (57) and (58).
TiO2 + hν → (e− + h+)
(e− + h+) → TiO2 (band-to-band recombination)
With regard to the effectiveness of band-to-band recombination, one should use caution in believing the bimolecular stage described by Equation (58) as being real (not symbolic) in kinetic studies of heterogeneous photocatalytic reactions, even though it can easily explain experimental non-linear dependencies of reaction rates on light intensities, which typically follow a square-root dependence.
3.1.6. Recombination of Carriers via Defects
Recombination of photocarriers via recombination centers is the main pathway of carrier recombination in imperfect wide bandgap solids. In this case, a given recombination center R subsequently captures a free electron and a free hole, or vice versa, in a single recombination cycle (Steps 4 and 4′ in Figure 14a). In an alternative approach (without the concept of holes), recombination via defects means a consequent two-step transition of electrons from the CB to an empty state of the defect and from the defect to an empty state of the VB, or from the defect to the VB and then from the CB to an empty state of the recombination center R. The excess energy of the electron is dissipated at both steps of the recombination. Typically, the dissipation of excess energy at one of the two stages occurs via a nonradiative pathway with the assistance of existing phonons. Normally, the probability of nonradiative transitions increases as the number of emitted phonons decreases so that the energy levels corresponding to efficient recombination centers typically lie near the middle of the energy gap in wide bandgap solids. Radiative transitions at any stage of the two-step recombination via a center R are responsible for recombination luminescence in solids.
3.1.7. Trapping of Carriers with Formation of Centers Similar to Color Centers
In addition to the recombination centers R, other types of centers can be distinguished in wide bandgap solids—e.g., the color centers of the V- and F-type and shallow (or thermal) traps (Figure 14b). Discrimination between centers is rather arbitrary. Following the work of Siline and Trukhin [86], we may assume that a center captures photocarriers with a probability p and loses them with probability q (units: number of events per unit time). The rate of formation of defects in a state with a trapped carrier dn/dt (units: cm−3 s−1) is then given by Equation (59) with N0 defining the initial concentration of empty trap centers.
Equation (59) leads to the kinetics of formation of filled traps n(t) given by Equation (60), and to the stationary concentration of filled traps n∞ by Equation (61),
Three possible events can occur for a carrier trapped at a trap center (Figure 14c):
- Stage I, recombination via trapping of carriers of the opposite sign;
- Stage II, thermal emission of carriers into the corresponding band; and
- Stage III, photo-ionization of the trapped carrier by absorption of photons.
Accordingly, q in Equation (61) is given by,
q = qr + qth + qph
For simplicity, if the process defined by Stage III were neglected (i.e., qph = 0), and if q = (qr + qth) >> p, and qr >> qth, then n∞ << N0. In other words, filled traps do not accumulate in a solid in numbers compared with the initial number of empty traps N0. Typically, these deep trap centers with high cross-section of carrier trapping that do not accumulate in illuminated solids are the recombination centers. In contrast to deep centers, carriers trapped in shallow traps with energy ~kT from the CB (electrons) or from the VB (holes) can be detrapped via thermal emission with probability qth such that qth ~ exp(–E/κT) >> qr.
Deep centers with a low probability of trapping a second carrier (p ≈ q) accumulate in illuminated solids in sufficiently high number (n∞ ≈ No). Historically, they have been referred to as color centers. The ultimate concentration of color centers can reach values of n∞ = 1017–1018 cm−3 for some samples of wide bandgap solids. The term color center originated from the accumulation of such traps in crystals that display absorption bands in the visible spectral region. The result of these traps is that transparent (white when powder) solids become colored under UV illumination, with the color tending to be rather stable at ambient temperature. Such solids can be discolored by calcination, or by thermal bleaching (probability of this process given by qth ≅ exp(−E/κT) is high), or partly by photobleaching (qph is also high) via illumination of the crystalline specimen with light at the wavelengths corresponding to the absorption bands of the color centers.
3.1.8. Lifetime and Concentration of Free Charge Carriers
A major factor affecting processes in heterogeneous photocatalysis is the stationary (surface) concentration of charge carriers. As such, a consideration of some basic approaches that describe the processes responsible for the charge carrier concentration is worth noting.
The spatially uniform photogeneration of charge carriers occurs at a constant rate of generation, g, in some space of the solid bulk. The rate of the temporary alteration of the charge carrier concentration is then given by Equation (63),
where τ is the lifetime of the free charge carrier, independent of the charge carrier concentration. In the case of several types of trapping and recombination centers, the lifetime of the charge carriers can then be expressed by Equation (64), provided that the various centers do not interact with each other. Otherwise, the determination of the lifetime becomes rather more complex [87].
where τi = 1/σtr vNi is the lifetime of the charge carrier with respect to trapping by the defects of a given i-sort; σtr is the trapping cross-section; v is the velocity of the charge carrier; and Ni is the concentration of the defects of a given sort.
After an initial period of irradiation, recombination centers and trapping centers are filled with charge carriers to a stationary level; the lifetime of the charge carriers becomes pseudo-constant and its value determines the stationary concentration of the free charge carriers. Thus, dn/dt = 0, and the stationary concentration of charge carriers is then (Equation (65)),
Obviously, the higher the concentration of recombination centers and the larger the trapping cross-section are, the shorter is the lifetime and the smaller is the concentration of free charge carriers. For semiconductors and isolators, the lifetime of photoinduced charge carriers can vary in a wide range from picoseconds (10−12 s) to milliseconds (10−3 s).
When stationary conditions are established for the charge carriers, one fraction of the carriers remains in the delocalized state, while the other fraction is trapped by the defects. The relation between charge carriers obeys the electroneutrality principle (Equation (66)),
where netr and nhtr are the concentrations of electrons and holes, respectively, trapped by the defects.
The lifetime of a trapped charge carrier is determined by the efficiency of either thermo- or photo-ionization of the center or by the efficiency of the recombination event. When thermo-ionization dominates, the lifetime τth (Equation (67)) varies from picoseconds for shallow traps with depth comparable to kT, to infinite time for color centers in wide bandgap insulators.
However, when the lifetime of the trapped charge carrier is determined by recombination (Equation (68)) then
where σr is the recombination cross-section, v is the velocity of the charge carrier of the opposite sign, and ni is the concentration of the charge carrier of the opposite sign. The higher is the concentration of the opposite charge carrier, the shorter is the lifetime of the trapped charge carrier.
Charge carrier trapping and recombination processes determine the stationary concentration of charge carriers at the surface. Moreover, considering that surface defects with trapped charge carriers can act as surface-active centers that initiate surface chemical sequences, the lifetime of trapped charge carriers on such surface defects corresponds to the lifetime of the chemically active states of the surface-active centers. Recombination processes then return the surface-active centers to their (initial) chemically inactive ground states.
4. Applied Photocatalysis: Laboratory-Scale deNOxing of NOx Agents (NO & NO2)
As discussed earlier, nitrogen oxides (NOx) are major atmospheric pollutants that play an important role in atmospheric chemistry, and have been the object of a significant number of investigations toward their minimization, if not complete removal from the environment. The concentration of NOx in polluted urban air is around 100 ppbv, whereas in the unpolluted troposphere, it ranges from 10 to 500 pptv [88]. Recall that NOx are emitted primarily from artificial sources (e.g., traffic, coal burning boilers, thermal power plants, and industries of various sorts) and from natural sources (e.g., biological degradation in soil and from lighting thunder). NOx participate in various environmental processes: for instance, in the formation of acid rain; in the greenhouse effect in synergy with sulfur oxides; in the formation of photochemical smog in the presence of CO and VOCs; in the depletion of stratospheric ozone; and in the formation of peroxyacetyl nitrates (PAN), all of which have negative effects on ecosystems and lead to non-insignificant human health issues. With regard to the latter, NOx pollutants cause problems in the respiratory tract that include lung edema and the reduction of the oxygen-caring capacity of blood—e.g., in the transformation of hemoglobin to methemoglobin.
No wonder then that significant efforts have been expended to reduce environmental NOx agents back to N2 via a thermal technology using a variety of reductants (e.g., CO, hydrocarbons, H2 and NH3) in what is known as Selective Catalytic Reduction (SCR). While reduction of NO occurs around 100 °C in the presence of H2 and a Pd-supported catalyst [89], other reactions require significantly greater temperatures. In fact, reduction of NO to N2 through selective catalytic reduction with NH3, and thus potentially treat NOx agents, the costs of the SCR technology for the construction and operation of a facility to treat NOx pollutants, together with the required consumption of energy, may prove prohibitively high. Nonetheless, despite the many efforts to eliminate the NOx emitted from the various sources noted earlier by SCR, the fact remains that the concentration of NO in air in Japan was nearly constant throughout the 1980s, and was often higher than the air quality standard set for NO2, principally along heavily trafficked roads in densely populated areas [90]. This led to the development of a new technology for the disposal of NOx at sub-ppm level from air and from trafficked roads and tunnels, and other environmental sources that emit NOx.
Recognition that plants and micro-organisms can easily consume nitrite (NO2−) and nitrate (NO3−) ions as raw materials for nitrogen assimilation provided a further impetus to examine alternative technologies to achieve a practical removal of dilute NOx agents from the environment using sunlight (UV-Visible) radiation at significantly lower costs. In this regard, Takeuchi and Isubuki [91] investigated the dry deposition of NOx onto the ground and found that the rate of adsorption of NOx on some soil particles was enhanced by photoillumination. Of the metal oxides constituting the soil particles, TiO2 showed the highest activity for NOx adsorption under photoillumination with ca. 60% of NOx being captured as nitric acid (HNO3) on the surface of TiO2 particulates. Accordingly, the authors thought that the photocatalytic oxidation of NOx to HNO3 by illuminated TiO2 might be most advantageous to treat dilute environmental NOx, as any extra reactants such as NH3 were not required and HNO3 could be trapped on the surface as nitrates.
One of the first studies to examine the fate of one of the NOx agents, namely NO, in the presence of (Degussa) P-25 TiO2 exposed to UV irradiation was reported in 1984 by Courbon and Pichat [92] who exposed isotopically labeled N18O at 295 K in the dark to pre-oxidized and pre-reduced TiO2 powder; subsequent to UV illumination resulted in three phenomena: photoadsoprtion, photoexchange, and photodecomposition of NO to yield N2O and, to a lesser extent, N2. The formation of N2O + N2 corresponded to a photodecomposition of ca. 15% of the NO pressure (decrease) for a pre-reduced titania sample and ca. 20% for a pre-oxidized titania; N2 formed only at the beginning and the percent N216O produced was initially greater for the pre-oxidized titania sample. This early study [92] confirmed that illumination of TiO2 with UV light considerably increased the ease of detachment of surface oxygen atoms, as the isotopic hetero-exchange of N18O occurred at room temperature, while it required higher temperatures in the absence of bandgap (3.2 eV) illumination of the mostly anatase TiO2. Adsorbed oxygen species were involved, as pre-oxidized titania exhibited higher initial efficiency; however, the instantaneous exchange with a pre-reduced titania sample in H2 at 723 K showed that detachment also involved surface oxygen atoms that were replenished from NO. Another aspect of this study was the corroboration of the direct involvement of O− species in photocatalytic oxidations over TiO2 and other n-type semiconductors, since NO and O2 played similar roles in yielding dissociated oxygen species active in both oxidation and oxygen isotopic exchange.
A later study (1985) by Hori and coworkers [93] demonstrated that NO2− ions are oxidized to NO3− with or without O2 in aqueous suspensions of some semiconductor powders (Ag2O, PbO, anatase TiO2, Si, ZnO, SnO2, CdS, and Bi2O3) under bandgap illumination; with TiO2, 96% of nitrite was oxidized to nitrate in the presence of oxygen. Along similar lines, Anpo and coworkers [94] found that Cu+ ions on SiO2 (Cu+/SiO2 catalyst) could decompose NO molecules photocatalytically and stoichiometrically into N2 and O2 at 275 K, which they attributed to the significant role played by the excited state of the Cu+ species; the photoreaction involved an electron transfer from the excited state of the Cu+ ion into an anti-bonding π orbital of the NO molecule within the lifetime of its excited state. The relationship between the local structures of Cu+ ions in zeolite and their photocatalytic reactivity in the decomposition of NOx into N2 and O2 at 275 K was reviewed by Anpo and coworkers [95] after which Anpo’s group [96] reported on the metal ion-implantation of TiO2 with various transition metal ions that subsequent to calcination in oxygen at ca. 723 K resulted in a large shift of the absorption edge of TiO2 toward visible light regions depending on the amount and type of metal ions implanted; the resulting metal ion-implanted TiO2s proved active in the photocatalytic decomposition of NO to N2, O2 and N2O at 275 K under irradiation with visible light at wavelengths longer than 450 nm.
Following their 1989 report [91], Ibusuki and Takeuchi [97] examined the photocatalytic destructive oxidation of NO to NO3− using a mixture (200–250 mg) of TiO2, activated carbon (AC) and Fe2O3 particles located in a flow-type photochemical reactor system (Figure 15) that was photo-illuminated by a cylindrical bank of 12 black lights (wavelength: 300–400 nm) [97]. The AC and Fe2O3 had a remarkable effect in increasing the catalytic activity for NOx removal, likely due to their high adsorptive activity for NO and NO2. The authors inferred that photo-illuminated TiO2 generated reactive oxygen species that oxidized NO and NO2, respectively, to NO2 and NO3−, while activated carbon trapped NO2 to allow enough time for TiO2 to oxidize NO2 to NO3−; it appears that Fe2O3 acted as a promoter for more NO/NO2 molecules to be adsorbed on the surface of the titania photocatalyst [97].
In a further study, the Takeuchi group [98] examined the use of TiO2 to eliminate NOx in open air with the photocatalyst being activated by sunlight, but noted, however, that in so doing desorption of NO2 occurred during the oxidative removal of NO; the NO2 also needed to be suppressed as it is also a regulated pollutant. Although NOx adsorb on activated carbon to be oxidized ultimately to NO3−, development of an activated carbonaceous photocatalytic material proved difficult. Accordingly, recognizing that thin films have many micropores they designed and prepared TiO2 thin film photocatalysts by a dip-coating process using titanium alkoxide as the TiO2 precursor and the polymer additive polyethylene glycol (PEG) of different molecular masses (PEG-300, PEG-600, PEG-1000) to give TiO2-PX films with thicknesses of 1.0, 0.5 and 0.25 μm after calcination of the films at 450 °C for 1 h deposited on silica-coated glass plates.
Table 1 summarizes the extent of NO removal [98]. Adsorbed NO was photooxidized to NO2 by the thin films, while the produced NO2 was re-photooxidized to NO3− before it desorbed from the film surface.
Following reports that TiO2 prepared by high-temperature hydrolysis of titanium tetra-alkoxides, Ti(OR)4, in a hydrocarbon solvent was very active toward the photocatalytic dehydrogenation of iso-propanol in aqueous media under deaerated conditions [99] and mineralization of acetic acid under aerated conditions [100], Hashimoto et al. [101] prepared TiO2 by the hydrolysis of titanium alkoxide in a hydrocarbon solvent, followed by calcination at various temperatures; the titania calcined at 300 °C proved most active for the photocatalytic oxidation of NO (Table 2), in comparison with P-25 titania. The photocatalytic oxidation was carried out in a fixed bed continuous flow Pyrex-glass reactor under atmospheric pressure with the TiO2 (0.12 g) UV-irradiated with a 10-Wh black light; air contained 10 ppm of NO; flow rate, 110 mL min−1. IR spectral results indicated that UV irradiation promoted the oxidation of NO in the presence of oxygen to yield nitrate species, while the data from ESR measurements for oxygen radicals showed that UV irradiation increased the number of O2−• adsorbed on the surface of titania in the presence of oxygen. These O2−• species vanished simultaneously with their exposure to NO, whereas the spectral intensity of the radical generated from secondary products of O− showed no change. The number of O2−• radical anions generated by UV irradiation reflected the photocatalytic oxidative activity of titania toward the oxidation of NO. The rate of formation of O2−• and the number of free electrons induced by UV irradiation decreased significantly with an increase in post-calcination temperature (Table 2) [101].
A photocatalytic reaction that takes place in a gas/solid reactor necessitates both the exposure of the catalysts to light irradiation and good contact between reactants and catalyst. In this regard, Lim and coworkers [102] noted that a two-dimensional fluidized-bed photoreactor not only increased the contact of catalyst and gas, but also enhanced UV light penetration compared with a packed bed reactor in which light could not easily penetrate the interior of the catalyst bed, so that it was important to design and fabricate a fluidized-bed photoreactor with higher light throughputs and lower pressure drops. Accordingly, they used: (i) an annular flow-type photoreactor; and (ii) a modified two-dimensional fluidized-bed photoreactor to examine the photocatalytic decomposition of NO. In the first case, two serial annular flow photoreactors were used to increase contact time between the gas and the photocatalyst (Figure 16).
By comparison, the modified two-dimensional fluidized-bed reactor (Figure 17) consisted of an annular-type reactor made of a larger quartz glass tube (internal diameter, 30 mm; height, 400 mm) in which a small diameter quartz tube (inner diameter, 20 mm; height, 375 mm) was located at the center of the larger tube such that the thickness of the annulus in the bed was 5 mm [102]. A quartz filter (100-mesh size) was used to distribute a uniform fluidization of the catalyst; a square mirror box surrounded the photoreactor to minimize loss of light irradiation and to improve utilization of reflected and deflected light.
In their study [102], the authors examined the effects of gas-residence time, initial NO concentration, reaction temperature and UV light source on the photocatalytic decomposition of NO carried out in the annular flow-type reactor. P-25 titania powder was used to cover a quartz tube (430 mm) by dipping it into a stirred 5% TiO2 slurry solution and then air-dried for 24 h, after which the TiO2-coated quartz tube was fired in a high-temperature furnace at 400 °C for 1 h; TiO2 coating was repeated several times until the amount of TiO2 deposited on the quartz tube reached 0.10 g. The quartz tube had been sandblasted previously to create a granular texture to anchor the fine TiO2 powder. In addition, precursor solutions for coating TiO2 on silica gel were prepared using titanium ethoxide as a precursor to prepare the TiO2 sample.
A gas stream (200 mL min−1) of 138 ppmv NO in He in the annular flow-type reactor was irradiated by four UV lamps without TiO2 photocatalyst at ambient temperature for 140 min with no variation in the NO concentration; in the presence of TiO2, however, irradiation led to the decomposition of NO with formation of NO2, N2O and N2 products [102]. The reaction rate followed the power law R = Ro In with n = 0.48 and n = 0.87 depending on the UV intensity of the germicidal white lamp (254 nm) and the fluorescent black lamp (365 nm), respectively (gas flow rate, 100 mL min−1; TiO2 loading, 0.1 g; reaction temperature, 311 K; initial NO concentration, 50 ppm). Adsorption of nitrate on the surface of the photocatalyst increased with irradiation time leading to the deactivation of the photocatalyst. The decomposition of NO decreased linearly on increasing the initial NO concentration and on decreasing the residence time of gas in the photoreactor, so that it was necessary to increase the residence time of the gaseous reactant to provide effective contact of UV light, gaseous reactant and photocatalyst to obtain higher NO decomposition in the annular photoreactor.
In the modified two-dimensional fluidized-bed photoreactor, four reaction conditions (without TiO2/SiO2 and UV lamp on/off, with TiO2/SiO2 and UV lamp-on/off) were tested to confirm whether the decomposition of NO really took place by a photocatalytic process. Indeed, in the presence of TiO2/SiO2 and UV lamp-on, the NO concentration decreased indicating that it was in fact decomposed [101]. Decomposition of NO increased with decreasing initial NO concentration and increasing gas-residence time; the reaction rate increased with increasing UV light intensity. Clearly, the modified photoreactor displayed efficient contact between photocatalyst and reactant gas with good transmission of UV-light and, consequently, increased the NO decomposition efficiency (>70%) compared with the annular flow-type photoreactor. Hence, the former photoreactor was an effective tool with which to carry out significant NO decomposition with efficient utilization of photon energy [102].
Anpo and coworkers [96] had earlier prepared a TiO2 photocatalyst that subsequent to the implantation of Cr ion and upon irradiation with visible light (>450 nm) decomposed NO into N2, O2, and N2O under O2-free conditions. Additionally, the Cr ion-implanted TiO2 catalyst displayed the exact same photocatalytic efficiency as the original TiO2 catalyst, albeit under UV irradiation. As a follow-up to this study, Nakamura et al. [103] examined the role of oxygen vacancies in the removal of NO under an oxidative atmosphere using a commercial TiO2 (Ishihara ST-01; 100% anatase; crystallite size, 7 nm; nominal specific surface area, 300 m2 g−1) and hydrogen plasma-treated TiO2 powders; the latter was photoactive up to 600 nm without a decrease in UV light activity. Reactions to remove 1.0 ppm of NO were carried out in a Pyrex glass flow reactor (500 cm3) with irradiation from a 300-W Xe light source; the UVA (315–400 nm) irradiance at the photocatalyst surface was 0.03 mW cm−2 (flow rate, 1500 mL min−1; TiO2 loading, 0.20 g; total pressure, 760 Torr)—no removal of NO occurred without the metal oxide photocatalyst. NO was converted mainly to NO3− (also less than 2% NO2− formed) by oxidation over the TiO2 powder; NO3− ions accumulated on the catalyst surface. Electrons trapped in oxygen vacancies in the plasma-treated TiO2 were detected under visible light irradiation (F-type color centers; ESR measurements displayed a signal at g = 2.004) with the number being proportional to the percent of NOx removed, which suggested that the number of trapped electrons determined the activity of the photocatalytic oxidation of NO to NO3−. The visible-light photocatalytic activity of the plasma-treated TiO2 was due to photoexcitation of the F-type color centers with energy levels within the forbidden bandgap of the metal oxide (see Figure 18).
The Anpo group [104] investigated the photocatalytic decomposition of NOx (NO and NO2) on five well-characterized standard reference ultrafine powdered TiO2 photocatalysts (grain size, 0.02–1 μm) denoted TiO2 (JRC-TIO-2, -3, -4, and -5) supplied by the Catalysis Society of Japan (properties summarized in Table 3) in a large-scale continuous flow reaction system (Figure 19a) with high efficiency. Special attention was expended on the effects of pretreatment and reaction conditions on the reaction and conversion rates of NO. The authors established that surface hydroxyl groups played a significant role as active sites in the decomposition of NO.
When used on a large scale for long periods in photoreactions, photocatalysts tended to lose, albeit gradually, their photocatalytic activity. In Anpo’s study [104], after 2 h, conversion of NO for each photocatalyst leveled off and dropped to between 0.25 and 0.20 the photocatalytic activity observed initially, indicating a decline in photocatalytic activity of the TiO2 in the decomposition of NO in the absence of O2 and/or H2O. Reaction products in the flow reaction system were N2, O2, and N2O, just as occurred in a closed reaction system. The JRC-TIO-4 photocatalyst displayed the highest photocatalytic activity for the conversion of NO, while for the other three there were small differences: JRC-TIO-4 (11%) >>> −3 (~2%) > −5 (1.8%) > −2 (1%) (see Figure 19b). The anatase TiO2 catalyst with the larger surface area, wider bandgap, and numerous surface –OH groups (Table 3) exhibited the highest photocatalytic reactivity in the decomposition of NO, which the authors deduced that these were the principal factors that affected photocatalytic efficiency. The increased bandgap of JRC-TiO-4 was accompanied by a shift in the conduction band edge to higher negative energies, thus moving the redox potential to more negative values thereby enhancing photocatalytic reactivity. Moreover, surface –OH groups and/or physisorbed H2O also played a significant role in the photocatalytic reactions through the facile formation of reactive •OH radicals. The intensity of the incident light is also an important factor that affects the kinetics of the photocatalytic decomposition. The quantum efficiency of the photocatalytic reaction was higher at the lower intensities of the incident light, and lower at higher intensities of the incident UV light; in addition, the efficiency of conversion of NO increased with increase in the O2 flow rate.
The activity of the JRC-TiO-4 photocatalyst was also tested by Tanaka and coworkers [105] in the photoassisted selective catalytic reduction of NO with ammonia (photo-SCR) at low temperature over irradiated TiO2 in a flow reactor; the process was efficient and the adsorbed ammonia reacted with NO under irradiation of TiO2 (Figure 20); note the nearly identical kinetics of formation of both N2 and N2O.
The total amount of N2 formed was 0.23 mmol gcat−1, consistent with the amount of ammonia (0.24 mmol gcat−1) adsorbed over TiO2 in equilibrium at 323 K. The kinetic experiment carried out under differential conditions in the pressure range 300 < p(NO), p(NH3) < 2000 ppm, and the presence of excess O2 affected the evolution rate of N2 which depended only on partial pressure of NO; kinetics were first order on NO, and zeroth order on O2 and NH3, which strongly suggested that the rate-determining step was adsorption of NO to the irradiated TiO2 adsorbing ammonia molecules [105]. To the extent that the selective catalytic reduction (SCR) with ammonia is a downhill reaction, it also proceeded in the dark at low temperature with a 20% conversion of NO. However, photoirradiation caused a remarkable enhancement of the activity: the evolution rate of N2 gradually increased attaining a steady rate at ca. 80% conversion after 2 h of irradiation.
To achieve a further understanding of surface reactions involved in TiO2-based photocatalysis, Dalton and coworkers [106] examined two titania samples (one of unknown source) using X-ray photoelectron spectroscopy and Raman spectroscopy to investigate the NOx adsorbate reaction at the surface of these two TiO2 substrates. The NOx gas was composed of 109 ± 5 ppm of NOx, 21.0 ± 0.4% O2, the remaining ca. 79% being N2; dry air was the mixer gas to dilute the NOx (NOx concentration, 10–100 ppm) during the reaction performed under UV exposure for 6 and 48 h in a glass vessel (ca. 3 mm thick; Figure 21) that allowed > 80% transmission of the radiation at λ = 320 nm. Formation of NO3− did not vary significantly with either exposure time or NOx concentration. The authors [106] proposed a stepwise mechanism (Figure 22) in which the surface hydroxyls increased the efficacy of the process and participated by reacting with NOx molecules to yield nitrate ions formed indirectly via initial reductive (formation of O2−• radical anions by conduction band electrons) and oxidative (formation of •OH radicals by valence band holes) processes.
Dalton et al. [106] concluded that TiO2 was effective at converting NOx agents to NO3− and that XPS proved useful in quantifying the efficiency of the reaction, while Raman spectroscopy was a quick and simple way of ascertaining the surface crystal structure of the titania. XPS confirmed only one oxidation state of Ti on the untreated TiO2 materials; however, the O1s peak indicated the presence of two additional components of TiO2: Ti–OH and Ti–OH2. After exposure to UV radiation, XPS spectra revealed nitrogen peaks attributable to organic species (also present before reaction), to some unreacted NO adsorbed on the surface, and to nitrate anions.
Reactive nitrogen (NOy) in the atmosphere consists of the sum of the two NOx oxides (NO + NO2) and all compounds produced by atmospheric oxidation of NOx that include the minor species: HNO3, HNO2, the nitrate radical NO3•, N2O5, peroxynitric acid HNO4, peroxyacetyl nitrate (PAN) (CH3C(O)OONO2) and its homologs, and peroxyalkyl nitrates (RC(O)OONO2) [107]. Such compounds can be regarded as reservoirs of NO2 but apparently play no critical role in the formation of ozone O3 that the precursors NO2 and NO do. The oxidative removal of NO over irradiated TiO2 catalyst was examined by Devahasdin and coworkers [107] at source levels (5–60 ppm) in a thin-film photoreactor systems (see Figure 23); the process involved a series of oxidation steps through the action of photoformed •OH radicals (NO → HNO2 → NO2 → HNO3). Light intensity increased the capability to oxidize NO (from 0 to 0.8 mW cm−2); the selectivity for NO2 increased with light intensity for 5 ppm inlet NO but remained constant for 40 ppm inlet NO. The steady-state conversion of NO increased with relative humidity from 0 to 50% leveling off at higher relative humidity; the ratio of NO2− to NO3− from spent catalyst liquor decreased with irradiation time until steady state was reached.
Transient behavior of TiO2 during the first 2 h of operation with the system setup of Figure 23 (conditions: space time: 12 s; inlet concentration, 40 ppm; light source, two 8-W black lamps; relative humidity, 50%; TiO2 loading: 1.07 mg cm−2) revealed that initially the conversion of NO was very high (ca. 95% after 0.5–3 min of irradiation depending on TiO2 loading) and decreased approaching steady state after 6 h of operation; all the nitrogen was accounted for in the gas phase: NO out (26 ppm) + NO2 out (14 ppm) = NO in (40 ppm). Conversion of NO was 35%; gas phase mass balance showed no N2O formed in the reaction system under steady-state conditions [106]; NO2 selectivity remained constant at 100% for 40 ppm inlet NO and increased with light intensity for 5 ppm inlet NO with a 50% relative humidity, which suggested that for 40 ppm inlet NO at steady state, all the NO should have been converted to NO2. However, the authors [107] believed that, for the 5 ppm inlet NO, the true steady state had not yet been reached, so that increasing light intensity caused the HNO3 to dissociate back to NO2 and •OH and to promote NO2 selectivity from 82% to 95%. The latter inference called attention for the first time to the possible reNOxification of the nitrates produced in the deNOxification of the environment (see Section 5).
Toma and workers [108] reported using a test chamber built specifically for the TiO2 (Degussa P-25; in powder or pellet form) photocatalytic decrease of NOx. The experimental device consisted of three parts: (a) a chamber where gaseous NOx were prepared in situ by chemical reaction of Cu powder with a dilute solution of HNO3; (b) an environmental chamber; and (c) a NOx analyzer. The pollutants were subsequently injected at ambient temperature into the environmental chamber (volume, ~0.4 m3) until the concentration of NOx reached 1–2 ppmv. A fan ensured homogenization of the gaseous pollutants in the environmental chamber. A polycarbonate photoreactor (100 mm × 100 mm × 50 mm box) equipped with a 70 × 70 mm Plexiglas window allowed light transmission from a 15-W daylight lamp (30% UVA, 4% UVB) placed inside the environmental chamber and crossed by the NOx flow (flow rate, 0.6 L min−1); NOx concentrations were continuously monitored with a chemiluminescence NOx analyzer.
For small TiO2 powder quantities, conversion rates increased proportionally reaching maximal value at 0.2 g loading of TiO2; at higher quantities of TiO2 the decrease in NOx remained constant and independent of TiO2 powder amount. After 30 min of UV irradiation (surface, 54 cm2), conversion rates were about 32–35% and 15–18%, respectively, when the mass of the catalyst varied from 0.2 to 1.2 g; maximal conversion was reached at 3.7–4 mg cm−2 of TiO2 powder [108]. Exposing a TiO2 pellet surface (mass, 0.4 to 1.2 g; 54 cm2) to UV radiation from one side only led to a photocatalytic conversion of ca. 28–30% of NO and 10–12% of NOx (Figure 24); the conversion efficiency increased with the surface area of the pellet. The amount of compressed TiO2 powder and the thickness of the pellet had little influence on the extent of NOx decomposition. Anatase TiO2 showed better efficiency for the photocatalytic decrease of NOx relative to rutile TiO2, accounting for only 10% and 5%, respectively, for NO and NOx removal.
We noted above that the photocatalytic decomposition of NO over TiO2 reported in some of the literature led to the formation of N2O as the main reaction product [92,94,98] with minor N2, NO2 and O2 products. Only Anpo’s group [96] reported the selectivity of NO photodecomposition over a TiO2 photocatalyst to yield N2O and N2, and no other products. According to the views of Bowering and coworkers [109], use of only TiO2 as the catalyst is not ideal for removing NO from the atmosphere as N2O itself is also a regulated pollutant. As such, Tanaka et al. [105] reported that photoassisted selective catalytic reduction (photo-SCR) of NO over TiO2 with NH3 as a reductant was very selective towards N2 formation, with relatively small amounts of N2O. As NH3 is also a pollutant, it would need to be eliminated from the exhaust gas, thereby causing an increase in overall costs of a system.
Car exhaust and industrial emissions are mostly controlled using selective catalytic reduction (SCR) to convert NOx to N2. Accordingly, Bowering et al. [109] used CO as the reductant in eliminating NO photocatalytically with Degussa P-25 TiO2 in a continuous flow reactor (Figure 25) with the objective to convert the NOx preferentially into N2 gas. The authors added TiO2 powder (ca. 0.2 g) to acidified triply deionized water (TDW; 6 mL of 0.05 M HNO3 in 500 mL of TDW) yielding a dispersion that was stirred for 12 h and then dried at 70 °C for 48 h, after which the resulting powders were calcined for 2 h at 120, 200, 450 or 600 °C. Subsequently, 25-mL fractions of the dispersion were evaporated at 70 °C onto degreased borosilicate glass slides; an amount of TiO2 powder (~1 mg) was deposited on the slides and then calcined following the same methodology as for the powders.
The effect of calcination temperatures on the composition and crystallite sizes of P-25 photocatalysts, and the effect of pretreatment temperature on rate of NO conversion and selectivity for N2 formation for NO decomposition and reduction reactions are presented in Table 4 [109]. Pretreatment (calcination) temperatures caused no appreciable change in phase composition; original composition (ca. 77 vol.% anatase, 23 vol.% rutile) was maintained even after treatment at 600 °C. The photocatalytic activity for both decomposition and reduction reactions decreased with increasing pretreatment temperature, which was attributed to removal of surface hydroxyl species that acted as active sites for reaction. The only products observed in the decomposition reactions were N2 and N2O; the selectivity for nitrogen formation remained constant (ca. 23%) regardless of pretreatment temperature. However, the presence of CO in the reaction gas had a dramatic effect on selectivity of the reactions with N2 selectivity as high as 65%; in addition, an increase in the CO/NO ratio led to increased selectivity for N2 formation.
It is likely that under UV illumination electron transfer occurred from electron trapped centers into antibonding orbitals of adsorbed NO molecules, resulting in their decomposition and formation of N(ads) and O(ads) surface species, which can then scan the TiO2 surface and react with other surface species (e.g., NO(ads), N(ads), O(ads)) to form N2O, NO2, O2 and N2. To the extent that neither O2 nor NO2 was detected led the authors [109] to deduce that Reactions (69) and (70) did not occur on P-25 surfaces under decomposition conditions; the main surface reaction was Reaction (71), as N2O was the major reaction product under these conditions.
NO(ads) + O(ads) → NO2(ads
O(ads) → O2(ads)
NO(ads) + N(ads) → N2O(ads)
In the presence of CO on the photocatalyst surface, and under UV illumination, other reactions are possible between adsorbed CO and NO molecules together with reactions of CO with N(ads) and O(ads) atoms. No reaction occurred in the dark and under UV illumination without TiO2 indicating that both TiO2 and UV are required for adsorbed NO and CO species to react. Under decomposition conditions, the major reaction product was N2O (~75%) with N2 being the minor product (ca. 25%). On the other hand, under reduction conditions selectivity for N2 formation increased (ca. 48%) at the pretreatment temperatures of 70 and 120 °C. However, at higher pretreatment temperatures, the selectivity was similar to that achieved in the absence of CO suggesting that the surface N2 forming reaction was favored on a titanium surface rich in hydroxyl groups [109].
Germane to the previous study [109], Roy and coworkers [110] examined a photocatalytic route to destroy NOx by developing a new Pd ion-substituted TiO2 system (Ti1−xPdxO2−δ) with which to reduce NO in the presence of CO via creation of redox adsorption sites and using anion oxygen vacancies on titania; the optimal Pd2+ ion concentration was 1 at.% in TiO2 (anatase). Apparently, even though both NO and CO competed for the same Pd2+ adsorption sites, reduction of NO to N2O was two orders of magnitude higher with the Ti0.99Pd0.01O1.99 photocatalyst under ambient conditions than unsubstituted TiO2; using UV irradiation with a 125-W high-pressure Hg lamp and an inlet 5000 ppm of NO in a flow-type reactor, the rate of reduction of NO was 0.53 μmol g−1 s−1.
The photocatalytic deNOxing activities of TiO2, N-doped TiO2, Fe-loaded N-doped TiO2, and Pt-loaded N-doped TiO2 exposed to irradiation from monochrome LED lamps at various wavelengths have been investigated in some detail by Yin and coworkers [111], unlike many studies that have typically used 100–500 Watt high-pressure Hg or otherwise Xe light sources to activate titania-based photocatalysts. Bare TiO2−xNx (denoted TiON) powders were prepared by treating 20-nm Ishihara ST-01 anatase TiO2 in an NH3 atmosphere at 600 °C for 3 h, followed by annealing at 300 °C for 2 h in humid air (N content, ca. 0.25 at.%); for comparison, the ST-01 anatase TiO2 powder was heat-treated in air at 500 °C for 1 h (S-TiO2)—BET specific surface areas were 57.7 m2 g−1 and 100.7 m2 g−1, respectively, for TiON and S-TiO2 powders. The Fe- and Pt-loaded N-doped TiO2 systems were prepared by dispersing TiON powder in a HNO3 aqueous solution containing either Fe(NO3)3 or Pt(NH3)2(NO3)2 at ambient temperature, followed by stirring for 1 h, heated at 150 °C to remove the water, and then calcined at 300 and 400 °C for 2 h, respectively (loading of Fe and Pt, 0.5 wt.%; systems denoted TiONFe and TiONPt; BET areas were 61.1 m2 g−1 and 59.0 m2 g−1, respectively).
The specifics of irradiation from the four LED sources were (wavelength, irradiance): (i) red light LED (627 nm, 72.76 μmol m−2 s−1); (ii) green light LED (530 nm, 125.12 μmol m−2 s−1); (iii) blue light LED (445 nm, 76.22 μmol m−2 s−1); and (iv) UV light LED (390 nm, 73.70 μmol m−2 s−1). Different samples showed different wavelength dependencies; for instance, S-TiO2 displayed excellent activity at 390 nm but very weak activity at 445 nm, while TiON showed excellent UV light (390 nm) and visible light-induced photocatalytic activity on exposure to 445 nm and 530 nm irradiation (Figure 26) [111]. By comparison, both TiONFe and TiONPt showed excellent deNOxing abilities even under red light irradiation at 627 nm. Specifically, TiONPt showed the highest deNOx abilities at all light wavelength ranges: about 37.8%, 36.8%, 28.2%, and 16.0% of NOx was removed, respectively, under continuous irradiation by monochromatic light at 390 nm (UV LED), 445 nm (blue LED), 530 nm (green LED), and 627 nm (red LED).
Because of the newly formed N2p level within the bandgap of titania above the O2p valence band, N-doped titania displayed an extrinsic bandgap smaller than the intrinsic bandgap of titania such that TiON absorbed visible light. In addition, TiON displayed significant chemiluminescence emission attributed to formation of singlet oxygen 1O2 relative to undoped S-TiO2 which failed to display any light emission. For comparison, TiONFe and TiONPt also displayed relatively high chemiluminescence emission, albeit lower than TiON; the latter showed chemiluminescence intensity increases in the order: UV < blue < green < red.
For the undoped S-TiO2 sample, the study of Yin et al. [111] showed a correlation between very weak chemiluminescence emission intensities and very low visible-light induced photocatalytic activity that they attributed to its relatively large intrinsic bandgap. By contrast, for TiON, TiONFe, and TiONPt, results demonstrated that the deNOx ability decreased with an increase in chemiluminescence emission intensity. Nonetheless, the photocatalytic deNOx activity of TiON was nearly the same as that of S-TiO2 under 390 nm (UV LED) and 627 nm (red LED) irradiation. However, TiON exhibited greater activity than S-TiO2 under 445 nm and 530 nm irradiation, but lower than TiONFe and TiONPt samples under every type of LED light irradiation. The authors ascribed this variation to different band structures and to the presence of Fe and Pt loaded onto the surface of the TiON.
Mechanistically, the sequence of events that led to deNOxing by these four titania samples was summarized [110] by the series of Reactions (72)–(77). Subsequent to irradiation of the titania that yields conduction band electrons (e−) and valence band holes (h+), formation of singlet oxygen 1O2 (Equation (76)) competes with formation of superoxide radical anions (Equation (73)) and hydroxyl radicals (Equation (74)) in air (molecular oxygen; relative humidity, ca 25%). Fe and Pt loading on TiON increased charge transfer and charge separation on the surface of the TiONFe and TiONPt photocatalysts [111].
TiO2 + hν → e− + h+
e− + O2 → O2−•
O2−• + H+ → HOO•
H2O + h+ → •OH + H+
O2−• + h+ → 1O2
O2−• + h+ → 3O2
In the present context, deNOxing reportedly occurred by oxidation of the NOx molecules via the active oxygen •OH and O2−• species (Equations (78)–(80)), whereby NO is converted to NO2 and subsequently to NO3− ions.
NO + 2 •OH → NO2 + H2O
NO2 + •OH → NO3− + H+
NO + O2−• → NO3−
In a NOx atmosphere, the NOx molecules adsorb onto the photocatalyst’s surface and then interact with the superoxide radical anions O2−• to form NO3− (Equation (80)), as a result of which the NOx molecules consume O2−• and delay singlet oxygen formation (Equation (76)), thereby causing the chemiluminescence emission intensity in the NOx atmosphere to be much lower than in air. To recapitulate, Yin and coworkers [111] deduced that:
- Nanosized titania exhibited very low deNOx ability under visible light irradiation, irrespective of their excellent UV light-induced (390 nm) deNOx ability.
- N-doped titania displayed excellent photocatalytic activity under 445 nm and 530 nm light irradiation.
- Fe and Pt loading improved the photocatalytic activity of N-doped TiO2 under not only UV light but also long-wavelength visible-light irradiation (λ = 530 nm and λ = 627 nm).
- Pt-loaded, N-doped titania possessed the best visible light- and UV-induced photocatalytic activity. In addition, Fe- and Pt-loaded N-doped titania exhibited relatively high quantum yields of deNOxing under long-wavelength LED light irradiation.
In their extensive 2009 review article on the catalytic abatement of NOx in the environment, Roy and coworkers [112] focused mostly on thermal methods in the presence of suitable reducing agents, and briefly gave a short account of the alternative photocatalytic methodology at ambient conditions; summarized was also some of the earlier work reported by selected researchers noting that direct photocatalytic decomposition of NO would yield N2 and O2, which would indeed be the ideal outcome and sole products if that could be realized. Unfortunately, as noted above, different conditions and different titania-based photocatalysts lead to significantly different results that are worth recalling briefly. For instance,
- Anpo and coworkers showed that metal ion-implanted TiO2 decomposed NO photo- catalytically to N2, O2 and N2O at 275 K under irradiation with visible light at wavelengths longer than 450 nm [96].
- Lim et al. [102] found that the photocatalytic decomposition of NO over Degussa P-25 TiO2 in an annular flow type reactor produces NO2, N2O and N2, with the efficiency increasing with light intensity and residence time and decreasing with initial NO concentration.
- Bowering et al. [109] showed that the photocatalytic activity of Degussa P-25 TiO2 toward deNOxing decreased with increasing pretreatment temperature.
- Roy and coworkers [110] reported that reduction of NO over the catalyst Ti1−xPdxO2−δ was two orders of magnitude greater than unsubstituted TiO2. Direct NO decomposition into N2 and N2O occurred via dissociation of NO in the presence of UV radiation at room temperature yielding N2, N2O and O2 with the O2 evolved reacting with NO to give NO2 that is adsorbed by the catalyst upon formation. Prolonged NO2 adsorption makes the surface inactive for NO dissociation; NO dissociation resumed when CO was passed to scavenge the evolved dissociated O2 [110].
On the other hand, the seminal review article by Skalska et al. [113] presented an extensive survey of NOx emission control technologies for three major anthropogenic emission sources: power plants, vehicles and the chemical industry, and further described new and alternative methods such as a hybrid system of SCR (selective catalytic reduction) and O3 injection, fast SCR, and electron beam gas treatment, among others. Also described was the influence of NOx on the environment and human health. The main focus was put on NOx control methods applied in the combustion of fossil fuels in power stations and mobile vehicles, together with methods used in the chemical industry; the authors emphasized the implementation of ozone and other oxidizing agents in NOx oxidation.
Following these footsteps, Heo and coworkers [114] combined photocatalysis and SCR with hydrocarbons as reducing agents (HC/SCR) to improve the activity and durability of deNOx catalysts. The authors developed a photocatalytic HC/SCR system that exhibited high deNOx performance (54.0−98.6% NOx conversion) at low temperatures (150−250 °C) using dodecane as the HC reductant over a hybrid SCR system that included a photocatalytic reactor (PCR) and a dual-bed HC/SCR reactor (Figure 27). The PCR generated the highly active oxidants O3 and NO2 from O2 and NO in the feed stream, followed by subsequent formation of the highly efficient reducing oxygenated hydrocarbon (OHC), NH3, and organo-nitrogen compounds. These reductants were key in enhancing the low-temperature deNOx performance of the dual-bed HC/SCR system containing Ag/Al2O3 and CuCoY in the front and rear bed of the reactor, respectively (Table 5). Moreover, the OHCs proved particularly effective for both NOx reduction and NH3 formation over the Ag/Al2O3 catalyst, while NH3 and organo-nitrogen compounds were effective for the reduction of NOx over CuCoY. The photocatalytic assisted hybrid HC/SCR system demonstrated an overall deNOxing performance comparable to that of the NH3/SCR, thus its potential as a promising alternative to the current urea/SCR technology [114].
To the extent that the deNOx performance of the conventional HC/SCR catalyst was enhanced by both OHCs and NHx-containing reductants, the two representative PCR catalysts V2O5/TiO2 and Ag/Al2O3 were chosen by the authors [114] for further examination in the PCR + HC/SCR hybrid system: the V2O5/TiO2 PCR for its superior OHC formation and the Ag/Al2O3 PCR for its formation of NH3 and possibly organo-nitrogen compounds as precursors of NH3.
Table 6 lists the conversions of NO and NOx, the conversion of NOx to N2, and the yields of NO2, N2O, and NH3 during the reduction of NO with the PCR + HC/SCR system [114]. The NOx conversion to N2 was estimated from the conversion of NOx and the yields of NO2, N2O, and NH3 by the mass balance of nitrogen. The selectivity of the Ag/Al2O3 PCR + HC/SCR system for N2 was 94%, 91%, and 82% at 200, 250, and 300 °C, respectively. The slight decrease N2 in selectivity of the Ag/Al2O3 PCR + HC/SCR system at 300 °C was ascribed to increased formation of NH3 by reaction of NO with OHCs over the HC/SCR reactor, since the PCR readily converted dodecane to OHCs. At 400 °C, the HC/SCR system alone completely reduced NOx with high N2 selectivity up to 96% so that the PCR could be turned off and bypassed to save energy at temperatures above 400 °C.
Key to the successful demonstration of this advanced deNOx process was the unique design and functionality of the PCR, which led to three major conclusions [114]: (1) PCR with catalysts was very efficient for both OHC formation and reduction of NOx because of its dual function: in situ UV-induced formation of OHC and conversion of NOx over the catalysts; (2) blank PCR (no catalyst) was very efficient for oxidation of NO to NO2 and HC to OHC, but was inefficient for converting NOx because of the absence of a catalyst; and (3) Ag/Al2O3 PCR (with BaY + Ag/Al2O3) produced OHC and NH3 as intermediates that could be used subsequently to further convert NOx in a downstream reactor containing a dual-bed catalyst such as Ag/Al2O3 (for OHC/SCR) and CuCoY (for NH3/SCR).
5. Applied Photocatalysis: Prospective Attempts at DeNOxing the Atmospheric Environment
Energy-related emissions of nitrogen oxides continue to increase worldwide, standing close to 110 Mt in 2015 with the transportation sector accounting for 52%, followed by industry (26%) and power generation (14%). China (23 Mt) and the United States (13 Mt) accounted for ca. 33% of global NOx emissions that year. According to the International Energy Agency [115], power generation in 2015 was a major source of worldwide emissions of nitrogen oxides (14% of total NOx) with coal being the principal fuel responsible for 70% of those NOx emissions; burning oil to generate electricity also produced significant quantities of NOx. Natural gas-fired plants emitted fewer air pollutants than either coal-fired or oil-fired power plants; however, in 2015, gas-fired power generation emitted close to 20% of NOx, while biomass played a negligible role in global power generation, although, in relative terms, it performed only slightly better than coal-fired plants for NOx emissions. Manufacturing industries and other transformation sectors (e.g., refining and mining) accounted for ca. 30% of NOx (28 Mt) in 2015. Process-related NOx emissions were mostly released in cement making (1.5 kt of NOx per Mt of cement that accounted for >50% of global process-related NOx emissions) followed by pulp and paper production (1.2 kt NOx Mt−1 of paper) (see Figure 28) [115]. Considering combustion and process emissions from a regional perspective, China was the largest emitter of NOx, accounting for nearly 40% followed by the United States (11%). However, the United States witnessed considerable decreases in NOx emissions in decades prior to 2015, while NOx emissions from Chinese and Indian industries increased significantly. Together with ammonia, NOx and SO2 are the main precursors to formation of acid rain, which affects soil and water (with adverse impact on vegetation and animal life) and accelerates the deterioration of equipment and cultural heritage [115]. The presence of NOx and volatile organic compounds (VOCs) in the environment leads to formation of ground-level ozone (O3) under sunlight.
Thus, the considerable research interest witnessed over the last 2–3 decades to attenuate the extensive presence of NOx in the environment is not surprising. In a 1999 Technical Bulletin, the United States Environmental Protection Agency (EPA) [116] described the various components that make up the NOx pollutants, together with their properties, some of the health concerns, and how the environmental NOx could be abated and controlled by external combustion—pollution prevention methods and add-on control technologies—that is, by non-photocatalytic technologies. In this regard, methods to reduce thermally the NOx emissions at the origins include improved combustion techniques (e.g., fuel denitrogenation, modification to combustion methods, modification of operating conditions, and tail-end control processes) and installation of low-NOx burners in process heaters and industrial heat and electricity generation plants. Another primary combustion technology is a fluidized-bed combustion technology for solid fuels, while end-of-pipe technologies focus on the removal of NOx from flue gases by means of either physical separation or chemical reactions before their release to the atmosphere. Selective catalytic reduction (SCR; NH3 as the reductant; presence of a combination of TiO2 and V/W oxides as catalysts (Equations (81) and (82)) or selective non-catalytic reduction systems (SNR; urea or ammonia (Equations (83) and (84)) can significantly reduce NOx in the flue gas of stationary sources into N2 and H2O.
Reduction of NOx in the environment may not only involve SCR and SNR technologies, but also and of particular relevance herein is the TiO2-based photocatalytic technology that is the subject of this section.
(a) Selective Catalytic Reduction (SCR)
4 NO + 4 NH3 + O2 + Cat. → 4 N2 + 6 H2O
2 NO2 + 4 NH3 + O2 + Cat. → 3 N2 + 6 H2O
Conditions: Temperature: 300–400 °C; typical efficiencies: about 80%
(b) Selective Non-catalytic Reduction (SNR)
4 NO + 4 NH3 + O2 → 4 N2 + 6 H2O
4 NO + 2 (NH2)2CO + O2 → 4 N2 + 4 H2O + 2 CO2
Conditions: Temperature: 900–1000 °C; 40–60% reduction is obtained.
Several review articles have appeared in the last decade [117,118,119] that described, among others, some of the early attempts in the abatement of NOx agents under indoor and outdoor experimental conditions. The 2008 article by Fujishima et al. [117] offered an overview of some highlights of TiO2 photocatalysis, reviewed some of its origins, and indicated some useful applications: self-cleaning surfaces, water purification, air purification, self-sterilizing surfaces, anti-fogging surfaces, heat dissipation and heat transfer, anticorrosion applications, environmentally friendly surface treatment, photocatalytic lithography, photochromism of metal oxides, and microchemical systems. In the air purification application (i.e., deNOxing), the 2008 article briefly noted that some Japanese companies were considering covering roads with the TiO2 photocatalyst, and removing the NOx from automobile exhaust with sunlight using TiO2-coated road bricks, prepared by mixing colloidal TiO2 solutions with cement: the photo-road technology applied to no less than 14 different locations in Japan, one of which was the 7th belt highway in Tokyo (surface area covered, ca. 300 m2); NOx removed from this testing area was ca. 50–60 mg per day, equivalent to NOx discharged by 1000 automobiles (Figure 29); however, no relative efficiency was provided with respect to total NOx in the environment.
The 2013 article by Hanus and Harris [118] entertained some innovations of nanotechnology for the construction industry, most noteworthy being improvements in concrete strength, durability and sustainability being achieved with use of metal/metal-oxide nanoparticles and engineered nanoparticles (carbon nanotubes and carbon nanofibers), as well as environment-responsive anticorrosion coatings formed using nano-encapsulation techniques.
For their part, Fresno and coworkers [119] described achievements, near-future trends and critically assessed many photocatalytic materials on the basis of knowledge accumulated in pre-2014 years as to which materials or multicomponent systems, among the multitude of developments, could be taken as a ready consolidated technology or else as more likely to become a real alternative in the short term. Germane to this, they noted that a photocatalyst could be incorporated during material manufacturing either as an additive, most often the case of construction materials, or as a coating on an already conformed cementitious surface with the mechanical resistance of the coating, the optimal amount of photocatalyst (TiO2) and binder, their impact on the properties of the materials and their long-term performance and aesthetic durability being factors to consider in their applications as carbonation can lead to deactivation after several months of use, a point we shall emphasize later with regard to a most celebrated example: the Dives in Misericordia church in Rome (see below) [120] built with Italcementi’s TX-Active® photocatalytic concrete [121] for self-cleaning purposes and for reduction of NOx pollution (among others). Incorporation of anatase titania into the wearing layer, and the use of a double-layered concrete with addition of the photocatalyst to the top layer were two of the possible strategies noted for this application to reduce NOx. Most importantly, the authors [119] emphasized the need for further assessments of the durability of the photoactive coatings, and their capability of abating other air pollutants (e.g., the VOCs).
Along these lines, the discussion below will first emphasize the results from TiO2-based photocatalytic deNOxing the environment with the photocatalyst deposited on cementitious substrates in an indoor laboratory setting using small photoreactors set in flow-through systems and UV light sources. This is then followed by deNOxing results from various outdoor settings in wide open air environments with sunlight as the light source to activate the photocatalytic surfaces.
5.1. Indoor DeNOxing Environment Tests with TiO2 Photocatalytic Cementitious Surfaces
One of the first articles in the search for means to reduce NOx from the various emission sources, which affected the air quality in Japan because of relatively high concentrations of NOx, particularly along heavily trafficked roads in densely populated areas, was that of Ibusuki and Takeuchi in 1994 [94]. They proposed a new non-thermal technology for removing NOx at sub-ppm level from the air of trafficked roads, tunnels and other environmental emission sources (see Section 4) following their earlier findings [91] that NOx deposited onto the ground caused an enhancement of the rate of adsorption of NOx on soil particles upon photoillumination, with TiO2 exhibiting the highest activity for NOx adsorption—about 60% of NOx was captured as nitric acid on the TiO2 surface. Their follow-up laboratory experiments indicated that up to 90% of NO could be removed using mixtures of TiO2, activated carbon (AC), and iron oxide (Fe2O3) particulates in a flow-through reactor [96].
Along similar lines, at the 2000 JIPEA World Congress, Murata and coworkers [122] reported the development of interlocking cementitious bricks loaded with TiO2 (NOXER©) for the oxidative removal of NOx under sunlight UV radiation, humidity, and NOx concentrations that paralleled roadside environments. This novel technology at the time was implemented in a couple of Tokyo suburbs. The permeable interlocking bricks (Figure 30) were prepared by mixing aggregates, cement, TiO2 powder and water in an appropriate template, and then cured at ambient temperature for one month, after which they were used for the photocatalytic indoor tests in a flow-through small PVC reactor (conditions in Figure 31).
After 12 h of UV irradiation, ca. 88% of NO was removed at a relative humidity (RH) of 10%, decreasing to 52% at 80% RH, whereas the quantity of NO removed increased with increase in UV intensity (from 10% at 0 W m−2 to 88% at 12 W m−2). Varying the NO concentration from 0.05 to 5.0 ppm showed that in the 0.05–0.15 ppm range of NO—a range similar to roadside levels—a constant removal of ca 90% was observed decreasing to ca. 45% at 5 ppm of NO [122]. In an outdoor test in which NOx from the roadside (ca. 0.5 ppm) was passed through the PVC reactor exposed to natural sunlight (T = 17 °C and RH = 47%) led to ca. 80% decrease in NOx.
Evidence of the effectiveness of NOx abatement was also carried out by the Italcementi Group using their TX-Active® photocatalytic TiO2 deposited on a suitable substrate [121,123] and subsequently placed in a small reactor (top in Figure 32 [121]) of predetermined volume in which NOx gas was introduced, and then diluted with air to reach a certain pollutant concentration; the schematic of the flow-through reactor assembly is also displayed (bottom of Figure 32). The efficacy against NOx gases was also demonstrated during the project PICADA with tests conducted at the European Laboratory of Ispra (Italy), inside an Indoortron—an environmental chamber with people access and characterized by such controlled parameters as temperature, relative humidity, air quality and air exchange rate—to also study the fate of various other internal VOC contaminants. Figure 33 illustrates the time course of the removal of NOx with the reactor assembly of Figure 32. Evidently, complete NOx removal under the ISO conditions occurred within ca. 6 h of light (UV) irradiation in the presence of TX Active® in the absence of which no changes in NOx concentration occurred. Tests on the best formulations of a white and a grey photocatalytic paint with TX Active®, chosen for tunnel renovation (see below), showed a NOx abatement capacity of 88–90% after only 60 min under UV light irradiation in the reactor assembly of Figure 32; however, under similar conditions, the same paints necessitated nearly 26 h of UV irradiation to decolorize 70% of a rhodamine-B dye stain on the paint’s surface [124].
An otherwise similar reactor assembly was used by Martinez and coworkers [125] to examine the degradation of NO present in the air by means of a photocatalytic oxidation process based on TiO2 nanoparticles that had been incorporated in a polymer-matrix-based coating. The experimental setup consisted of a flow type reactor (Figure 34) adapted from the ISO 22197-1 standard; the final products detected were NO2 in the gas phase and nitrate ions adsorbed on the photocatalytic surface. The photocatalyst (anatase-TiO2) was a commercial slurry solution available from Evonik (Aerodisp® W740X). The coatings were primarily formulated for the surface treatment of building materials. To identify the possible influence of the nature of the substrate on the photocatalytic efficiency, various types of substrates were tested. The coatings were applied to: (i) mortars; (ii) glass plates; and (iii) non-absorbent cardboard materials. The wet thickness of coatings was 40 μm (other conditions are reported in Figure 34).
Results indicated that irradiation for 60 min and relative humidity of 60% led to ca. 25% of an initial concentration of 8.61 μmol of NO to be degraded at a flow rate of 1.5 L min−1 [125]. On mortar and glass substrates, the influence of increasing humidity on the degradation rates depended on the nature of the substrate and on initial NO concentrations; no significant influence of humidity was observed at initial NO concentrations of 400 and 1000 ppb, while a significant decrease in the kinetics was seen with a decrease of humidity at higher initial concentrations of NO (1500 and 2000 ppb). Generation of NO2 on mortar was very low, because of good adsorption capacities of the supporting substrate. On glass, NOx degradation rates decreased strongly on generation of NO2 owing to competition between pollutant and humidity (water) for the adsorption sites [125].
Using a specifically-developed test apparatus (Figure 35), Staub de Melo and Triches [126] assessed the efficiency of a photocatalytic mortar under no less than 27 different environmental conditions: varying the relative air humidity (30%, 50% and 70%), the UVA radiation (10, 25 and 40 W m−2), pollutant mass flow rate (1, 3 and 5 L min−1), and initial concentration of NO (20 ppmv). Results showed that the higher were the levels of UVA radiation, the better was the performance of the mortar in degrading NOx. By contrast, at higher relative humidity levels and flow rate caused a decrease in photocatalytic activity, which showed that environmental conditions have a significant impact on the efficiency of the photocatalytic mortar in the degradation of NOx.
The photocatalytic mortar was produced using Portland cement with Pozzolan (CP II Z 32); the catalyst was a nanometric rutile TiO2 bar (dia. = 10 nm; length = 40 nm; 98% purity; specific surface area = 150 ± 10 m2 g−1; real density = 4.23 g cm−3). Mortars with addition of 3%, 6% and 10% TiO2 were investigated; layers of photocatalytic mortar with thicknesses of 3, 6 and 10 mm were applied to samples of precast concrete paving (PCP). The gas system consisted of dry air and 500 ppmv of NO stabilized with N2 gas, which simulated a polluted atmosphere. Maximal removal of NOx was 50% for an initial 20 ppmv of NO, relative humidity of 50%, a flow rate of 1.0 L min−1 and a UVA irradiation (10 W m−2) period of 25 min. A cost to photocatalytic efficiency evaluation led to a 3-mm coated mortar incorporating 3% of TiO2. For the application of such materials, the authors [126] suggested that locations with lower relative humidity, high incidence solar radiation and little air mass movement should be sought in the field, as they would provide better conditions to achieve high efficiency of the TiO2-coated precast concrete paving materials.
An examination of the past literature shows that different types of photoreactors have been used in standardization methods to quantify the activity of photocatalysts in air remediation with commercially available photocatalytic materials. Classically, the degradation of NOx has been a major subject of investigations because relatively simple and inexpensive chemiluminescence instruments are available to quantify NOx and because NO2 is of crucial importance for urban air quality. Nonetheless, when investigating the photodegradation of NOx in laboratory settings, only NO was used because of its facile detection, its lower ability to adsorb on reactor surfaces, and because of slower dark reactions that might occur on photocatalytic surfaces [127]. To reduce the time for establishing adsorption equilibrium and to increase precision of the NOx data from low-sensitive instruments, unrealistically high NO concentrations (500–1000 ppbv) have been commonly used; and as analyses of reaction products require more sophisticated instrumentation, no reaction products (e.g., nitrite and nitrate) other than NO2 are quantified. To the extent that NO2 is an intermediate in the photocatalytic oxidation of NO by reaction with O2−•/HOO• radicals, the photocatalytic removal of NOx, not just NO, is quantified by different standardization methods that are still under development (as we speak).
In this regard, Ifang and coworkers [127] demonstrated that transport limitations can lead to an underestimation of the activity, if fast heterogeneous reactions were investigated in bed photoreactors. When using stirred tank photoreactors, complex secondary chemistry can lead to an overestimation of the photocatalytic remediation of NOx, if NO2 were also present, not to mention that the quantities used for ranking the activity of photocatalysts in air remediation in the different methods currently used are not independent of experimental conditions, so that any inter- comparison between different methods or extrapolation to atmospheric conditions is a futile exercise. Consequently, the authors [127] proposed a modified method for quantifying air remediation activity of photocatalytic surfaces that would overcome such problems. The method is based on a bed flow reactor (Figure 36) that can easily be adapted to the ISO method. The extent of degradation of NOx on photocatalytic surfaces in continuous stirred tank reactors can be significantly influenced: (a) by the gas-phase Leigthon chemistry (Equations (85)–(87)); (b) by unwanted wall losses of reactive agents and products; and (c) by heterogeneous formation of products on reactor walls (e.g., HONO) [127]. In such a photoreactor, short reaction times of only a few seconds and more homogeneous inert surfaces (no fan, among others) should minimize the aforementioned issues.
NO2 + hν → NO + O(3P)
O(3P) + O2 → O3
NO + O3 → NO2 + O2
The bed flow photoreactor was constructed of a single block of Teflon in which photocatalytic samples up to 40 cm × 5 cm × 1 cm could be investigated; recommended light sources were two 20-W UVA fluorescence lamps (300–500 nm, λmax = 370 nm; length, 57 cm) mounted at variable distances to the reactor to adjust the irradiance level measured by a calibrated spectroradiometer [127]. Because of differences in photoactivity of commercial photocatalysts toward NOx (and VOCs), the authors suggested that at least one compound from each class be examined in standardization methods for air remediation. Moreover, to avoid saturation problems, laboratory experiments would have to be performed under relevant atmospheric conditions (i.e., for RH = 50%; reactant concentrations ≤ 100 ppb), and, as NO2 is of much greater environmental importance compared to NO, the use of NO2 as the test reactant was strongly recommended [127].
On their part, Zouzelka and Rathousky [128] investigated the photocatalytic activity of two commercial titania-based products: (1) Protectam FN2 that consisted of ca. 74% of Evonik’s Aeroxide P-25 TiO2 powder and 26% of an inorganic binder; and (2) Aeroxide P-25 TiO2 powder as photocatalytic coatings (10 μm thick) on concrete and plaster supports toward the abatement of NO and NO2. Photocatalytic experiments on the coatings were performed in two types of flow reactors, one with laminar flow while the other with an ideally-mixed flow (Figure 37), under real world conditions in terms of temperature, relative humidity, irradiation intensity and pollutant concentrations. Results showed that the photocatalytic process reduced significantly the concentration of both NOx agents in the air.
The decrease in the concentration of NOx achieved in the steady-state for an inlet concentration of NO and NO2 of 0.1 ppmv, corresponding to highly polluted urban air, was up to 75 μmol m−2 h−1 (for the Protectam FN2) and 50 μmol m−2 h−1 (for the Aeroxide P-25 TiO2) at a flow rate of 3000 cm3 min−1 and a relative humidity of 50%. Because of a conspicuous lack of data regarding the performance of photocatalytic coatings over long periods, the authors [128] also examined aged photocatalytic FN2 coatings on a 300-m2 concrete noise barrier that had been exposed to heavily-trafficked (ca. 30,000 vehicles a day) thoroughfare in Prague where the NOx concentration reached 30–40 μg m−3, often exceeding the permitted NO2 limit of 40 μg m−3 (or 0.021 ppmv).
Experimentally, the area of irradiated photocatalytic surface was 50 cm2 (5 cm × 10 cm); flow rate of air mixture was 3000 cm3 min−1; total volume of air treated in 24 h was 4.32 × 106 cm3; volume of purified air and area of irradiated photocatalytic surface were the same in both photoreactors, although the reactors differed substantially in volume/irradiated area (65 times greater for the ideally-mixed flow reactor); volume of the ideally-mixing flow reactor was 5200 cm3 (18 × 32 × 9 cm); the free volume of the laminar flow reactor was 80 cm3 (5 × 32 × 0.5 cm); and linear streaming velocity of the gas was 0.2 m s−1. The bandgaps of the TiO2 in the two materials were 3.2 eV for the P-25 sample and 3.05 eV for the FN2 sample, the red-shift in the latter being attributed to the effect of the binder on titania [128].
Comparison of the photocatalytic performance of P-25 and FN2 materials reported in Figure 38 shows the reaction rate with the FN2 coating to be greater than for the P-25, even though the quantity of TiO2 in the FN2 coating was lower. For instance, the reaction rate with the FN2 coating on concrete in both laminar and ideally-mixed flow reactors at an inlet NO concentration of 1.0 ppmv was 40% and 49% higher, respectively, than the corresponding reaction rate of P-25 which, according to the authors [128], was likely due to the nearly twofold larger surface area of the FN2 specimen (82 m2 g−1) relative to the P-25 sample (47 m2 g−1).
Evidently, the inlet concentration of NO had a substantial influence on the reaction rate in both reactors, as evidenced on comparing the data for the FN2 coating in the laminar flow reactor in which the reaction rate was approximately proportional to the inlet NO concentration; in other words, for an inlet NO concentration of 1.0 ppmv, the rate was about ten times greater than for a concentration of 0.1 ppmv [128]. With regard to the effect of NO2 concentration used (0.1 ppmv) the trends differed from those for NO. First, the difference in the reaction rate at the beginning of the reaction and in the steady-state was much smaller for both P-25 and FN2 coatings when applied on plaster than on concrete. On plaster, the reaction rate was practically unchanged, whereas on concrete the decrease in rate was between 40% and 60%. Moreover, the steady-state reaction rate (after a 24 h period) on the coatings applied on plaster was consistently 1.5–1.8 times higher in comparison with the coatings on concrete.
Another important issue emphasized by Zouzelka and Rathousky [128] was the durability of the performance of the photocatalytic coatings under real-world conditions, as exemplified by the commercial photocatalytic coating Protectam FN2 that maintained relatively high efficiency in removing NOx from contaminated air even after two years under the harsh conditions noted above; this was likely due to good mechanical properties of the binder.
Moving from small benchtop laboratory photoreactors to actual field studies to investigate the efficiencies (activities) of photocatalytic concrete/mortar with embedded titania photocatalysts, simulation chambers have also proven suitable to test photocatalytic materials under controlled environmental conditions, as they represent a mid-way step between laboratory and actual environ-ment (a sort of pilot plant scale). Additionally, simulation chambers offer the opportunity to examine the impact of photocatalytic surfaces, also on secondary air chemistry, in contrast to the smaller flow-type reactors. In this regard, within the framework of the Life + project PhotoPAQ (2010–2014) that will be described later (Section 5.2), Mothes and coworkers [25] tested the behavior of O3, NOx, and selected VOCs (toluene and isoprene) on a photocatalytic cementitious coating material (with Italcementi’s TX-Active®) under UV irradiation and atmospherically relevant conditions (relative humidity, temperature, and realistic pollutant concentration) using the aerosol chamber LEipziger Aerosol Kammer (LEAK) at the Leibniz Institute for Tropospheric Research (TROPOS)—a 19 m3 aerosol cylindrical chamber with a surface-to-volume ratio of 2.0 m−1 and illuminated with UV lamps (λ = 300–400 nm) with an average light intensity of 11 W m−2.
The TX-Active® material was mixed with ultrapure water and subsequently applied manually on both sides of sand-blasted glass plates supported by a home-made device to obtain a rough but uniform surface (final thickness, ca. 3–4 mm), after which the material was cured for ca. 1 month. The cleaned coated glass plates were then inserted into a special aluminum rack installed inside the chamber—the area of the photocatalytically active surface was 6.65 m2 (boosted specimen)—a blank specimen devoid of TX-Active® titania was also made for comparison. Both specimens were flushed with clean air (200 L min−1) with the UV lamps turned ON for ca. 30 h to remove any potentially adsorbed pollutants; RH varied between dry air and 50%—the photocatalytic tests were performed following the 2007 ISO-22197-1 standard methodology. Results obtained for the NO and NOx degradation experiments together with formation of O3 at three RHs and at 293 K are displayed in Figure 39; dark period ca. 120 min, irradiation period also 120 min, initial concentrations of NO and NOx = 40 ppb [25].
Contrary to the behavior of NOx during the dark period, NO showed only a slightly different behavior at the different RHs; NO’s behavior was nearly constant at 50% RH and 70% RH, whereas at 10% RH a slight decrease was seen that was attributed to slightly adsorbed NO on the specimens’ surface [25]. Comparison of the blank and boosted materials revealed that UV irradiation had a significant influence on NOx owing to the photocatalytic properties of TiO2 embedded in the boosted material. The small increase of NO at the beginning of the light period was attributed by the authors [25] to photolysis of NO2 according to the Leighton sequence described by Reactions (85)–(87).
Results from the chamber studies also showed a photocatalytic effect on O3, evidenced by an increase of the geometric uptake coefficient from 5.2 × 10⁻⁶ for the inactive to 7.7 × 10⁻⁶ for the active material under irradiation. Measured first-order rate constants for NOx under irradiation ranged from 2.6 × 10⁻⁴ s−1 to 5.9 × 10⁻⁴ s−1, significantly higher compared to the range for the inactive materials (7.3–9.7 × 10⁻⁵ s−1), thus demonstrating the photocatalytic effect. However, no significant photo- catalytic degradation was observed for the VOCs (toluene, isoprene); the upper limit uptake coefficient for both was only 5.0 × 10⁻⁷. Small carbonyl (C1–C5) gas-phase compounds were identified when using the photocatalytically active material, a result of the photocatalytic degradation of the organic additives [25]. In contrast to the uptake observed for pure O3, a clear photocatalytic formation of O3 was observed (ko(O3) ≈ 5 × 10⁷ molecules cm−3 s−1) during the experiments with NOx (RH ≥ 50%). The authors further noted the necessity for detailed studies of heterogeneous reactions on such surfaces under more complex simulated atmospheric conditions as enabled by simulation chambers.
Although many studies have been done on TiO2 photocatalytic cementitious substrates to deNOxify the environment—as we discuss below—nearly all studies neglected to consider the inter- relationship between the metal-oxide photocatalyst and the non-negligible chemistry that might occur on the cementitious support—in fact, this inter-relationship is particularly relevant for an appropriate understanding of deNOxification processes. In this regard, the investigations carried out by Macphee and Folli [129] on Photocatalytic concretes—The interface between photocatalysis and cement chemistry have opened up the proverbial Pandora’s Box in which they addressed: (i) the photocatalytic mechanisms applicable to atmospheric depollution; (ii) the influence of doping the metal oxide; and (iii) the application of TiO2-based photocatalysts to concrete. These authors further emphasized some of the points described earlier that the catalyst efficiency is influenced by several factors, none of which are negligible: for instance: (i) energy and intensity of the activating radiation incident on the photocatalyst; (ii) the number and relative energy positions of the electronic states in the photocatalyst, defined by the crystal structure and the redox potentials associated with the required redox processes; (iii) the charge carrier mobility within the semiconductor’s conduction and valence bands; (iv) the kinetics of charge transfer processes; and (v) the accessible catalyst surface for adsorption of the pollutants, oxygen, and water [129].
Of greater importance, they noted that the chemistry of the cement environment is quite different from the ambient conditions normally prevalent in environmental photocatalysis, which will have a non-insignificant influence on the normal behavior of the catalysts in the concrete [129]. In freshly mixed cement, the high pH and the high ionic strength aqueous mix containing multiply charged ions dramatically modifies the surface chemistry and behavior of TiO2 dispersions, and thus will have a strong impact on dispersion behavior and adsorption properties, as the mode of adsorption and strength of binding between an adsorbing molecule and a surface are conditioned by their relative charges. Additionally, pH changes during the early stages of mixing and ageing the cementitious substrate will also have an impact on the band edge positions in the semiconductor photocatalyst as well as the oxidation chemistry of NOx. The alkalinity of wet cement/concrete is typically greater than pH 13, which can change rapidly at the surface as the concrete sets and the formwork is removed (Figure 40a) [129]. The highly alkaline aqueous phase can react with atmospheric CO2 to produce CO32− ions, causing the pH to decrease and induces surface deposition of calcite—a carbonate mineral and the most stable polymorph of calcium carbonate—that can obstruct deposited photocatalysts. Figure 40b–d displays the microscopic details of the surface calcite layer that obstructs TiO2 clusters present in the hardened cementitious matrix.
The alkali nature of the cementitious surface also has significant consequences on the chemistry taking place at the surface when NOx molecules are adsorbed, even in the absence of any catalyst and under non-irradiating conditions, as both NO and NO2 (NOx molecules) can undergo an oxidative reaction with the alkali to yield nitrite and nitrate ions (Equations (88) and (89)) [130]. These two reactions must be considered whenever photocatalytic efficiencies are assessed in deNOxification processes.
2 NO2 + 2 OH− → NO2− + NO3− + H2O
NO2 + NO + 2 OH− → 2 NO2− + H2O
To address the geographical limitations of UV intensity and recognizing that sunlight is the light source to activate the photocatalyst in practical applications of photocatalytic concrete in deNOxification, the Macphee group [129,131] also investigated M-doped titania (M = W, Nb) photo-catalysts toward removal of NOx because unmodified TiO2 releases a significant quantity of toxic NO2 in the deNOxification process, a problem rarely raised in several previous studies as NOx abatement is commonly assessed only on the basis of NO removal rather than NO2 or total NOx removal. Accordingly, to highlight the problem, they performed a systematic study on a number of commercial titania powders and doped titania specimens by determining both the photocatalytic activity (i.e., the photonic efficiency ξ [29], as defined by Equation (90)) and the selectivity (S defined by Equation (91)) toward formation of NO2 and NO3− in the oxidation of NO.
where Cdark and Cirr are the concentrations of the species of interest under dark and irradiated conditions, respectively; V is the volumetric flow rate; p is the pressure; ρo is the photon flux impinging on the photocatalyst surface; A is the irradiated area; R the gas constant; and T is the Kelvin temperature.
In the case of W-doped TiO2, Figure 41 demonstrates that while doping titania with tungsten significantly improved the selectivity toward formation of NO3−, it considerably reduced the photonic efficiency [131]. This raised the question as to how one could evaluate various photocatalysts toward NOx abatement when both activity and selectivity needed to be considered. To resolve this matter, the authors [129,131] defined a new figure of merit: the DeNOx index (Equation (92)), which was derived by assigning a toxicity value to both NO and NO2 and then expressing the change in total toxicity rather than the concentration change of the individual NOx gases [129,131]:
The deNOx index is positive if the photocatalyst lowers the NOx toxicity.
Figure 42a illustrates the results from several photocatalyst compositions and demonstrates a positive deNOx index at nominal W contents > 4.2 at.% for the W-doped TiO2 [129]. A range of commercial TiO2 photocatalysts were tested under comparable conditions giving a DeNOx index between 0 and −4000 representing poor nitrate selectivity and, most importantly, meaning that the more toxic NO2 was generated [129]. These data were further supported by analyses on powder and mortar samples incorporating W-doped and Nb-doped TiO2, as displayed in Figure 42b [129]. Interestingly, although undoped P-25 TiO2 has been the workhorse in photocatalysis, it displayed a net negative effect owing to its high activity but low nitrate selectivity; that is, it efficiently converted NO to NO2 rather than to NO3− ions. By contrast, both W- and Nb-doped TiO2 showed a higher tendency towards NO3− and thus are better suited as remediation photocatalysts, whether in powdered form or embedded in mortars.
Continuing their interesting studies on photocatalytic concrete, in their most recent article, the Macphee group [132] examined the effect of photocatalyst placement as regards photocatalyst efficiencies in concrete technology, and pointed out that even though the technology represents a well-established concept and notwithstanding the significant opportunities for air quality improve-ments to be derived from the considerable concrete surfaces exposed to the atmosphere, especially in cities highly polluted by vehicle exhaust and industrial emissions, photocatalytic concretes have so far remained in the investigative sphere, rather than in the mainstream of applications. As with any commercial new technology, the likely barriers for widespread implementation may well be cost effectiveness that might emanate from the photocatalyst impact and the challenges in measuring directly what the impact of this new concrete technology may actually be on air quality. The challenges are indeed very complex. Accordingly, the authors [132] placed photocatalytic efficiencies into context by comparing performances of conventional photo-catalyst dispersions in surface mortar coatings vis-à-vis photocatalysts supported on surface-exposed aggregates as well as on the nature and impact of catalyst binding to aggregate supports. However, as we discuss below, the efficiencies in real-world environmental applications differ significantly from the efficiencies experienced in a laboratory setting where small photo-reactors have been used to measure the efficacies of various TiO2 photocatalyst concrete specimens indoor, wherein experimental conditions can be controlled in contrast to outdoor environmental conditions, which are not only widely different, but are also uncontrollable conditions that one experiences in the real world. Nonetheless, their findings in photocatalyst placement as regards efficacies of photocatalytic concrete are worth noting [132].
In treating NOx gases by TiO2-based photocatalytic substrates, the currently accepted sequence is represented by Reaction (93); the greater is the degree of conversion of NO and NO2 to nitrates, the greater is the catalytic activity of the substrates.
NO → HNO2 → NO2 → NO3−
Although this oxidation sequence is thought to be the preferred reaction with respect to air quality, as claimed by the authors [132], a far better process to improve air quality would be the reduction of NOx back to N2 and O2 as can be achieved by selective catalytic reduction (SCR) and selective non-catalytic reduction (SNCR) technologies (see above). Regardless, in TiO2-based photocatalytic methods, both oxidative entities (valence band holes) and reductive entities (conduction band electrons) are generated upon sunlight UV activation of the TiO2 photocatalyst, so that the oxidation sequence (Reaction (93)) may also lead to intermediates—for example, ozone and peroxyacyl nitrates—in addition to those in the sequence (Reactions (94)–(96)) produced in surface processes in the NO2 production regime, and those produced in the sequence (Reactions (97)–(100)) in surface processes in the N2O5 production regime when ozone is present [133], all of which could be released into the atmospheric environment not forgetting that NO2 is nearly three times more toxic than NO.
2 NO2(ads) ←→ NO3−(ads) + NO+(ads)
NO+(ads) + O2−(ads) ←→ NO2−(ads)
NO2−(ads) + NO2(ads) ←→ NO3−(ads) + NO(gas)
TiO2 + O3 → O–TiO2 + O2
NO2(ads) + O–TiO2 → NO3 − TiO2
NO3(ads) + NO2(g) → N2O5(ads)
N2O5(ads) → N2O5(g)
Notwithstanding the above sequences, accumulation of NO3− on catalytic surfaces must be managed since adsorbed NO3− ions block catalytic sites from further NO/NO2 adsorption—thus, affecting catalytic activity—as the nitrates back react to form NO2 thereby causing nitrate selectivity to be diminished. This calls attention to the notion that reNOxification may be an important event in deNOxification processes. Accordingly, NO3− must be removed periodically by washings [132] at least on a weekly basis for certain infrastructures (tunnels, noise barriers, and buildings, among others) but especially for road tunnels where rain has no impact; this maintenance would carry increased costs. Moreover, where rain is sparse in the summer months as often occurs in Southern Italy and California (USA), such periodic washings may well be necessary. In addition, in conventional photo-catalytic concretes, nitrate washings via condensed atmospheric moisture represents but a mild risk from acidification of the cement (carbonated at the near surface) which may influence leaching-induced damage over time [132].
In their earlier articles [129,131], Macphee’s group addressed various factors that limit photocatalytic efficiencies in cement-based systems in which the metal-oxide photocatalyst was incorporated in the mortar/concrete. They have now proposed to separate the chemistry taking place on the photocatalyst surface from the chemistry occurring on the cementitious support, so as to enhance photocatalytic efficiency by depositing the photocatalyst on the surface of the cementitious aggregate (Figure 43) [132]; that would require some sort of binder which unfortunately would also add to the complexity of the events as the binder may not only photodegrade but may also bring about changes to the electronic structure of the photocatalyst [128].
The aggregate used to support the prepared TiO2 photocatalyst was quartz sand (1–2 mm diameter) that was subsequently treated in aqueous solution of Ca(OH)2 followed by carbonation with CO2 (aggregates denoted QST) [132]. The aggregates were placed in the flow-through reactor displayed in Figure 44 (monolayer; area, 5 × 10⁻³ m2), after which they were irradiated with a 500-W Xe-lamp solar illuminator (photon flux at the aggregates, 3.05 μmol m−2 s−1); other conditions were: 1 ppm NO gas in synthetic air; relative humidity, 40%; temperature, 25 °C; volumetric flow rate, 5 × 10⁻⁵ m3 s−1 through the reactor.
Three stages were identified by the authors in the process of converting NO to nitrate: (i) stabilization of NO concentrations on the QST specimens in the dark for achieving an adsorption/desorption equilibrium; (ii) the photocatalytic conversion of NO under illumination; and (iii) recovery of NO concentrations after illumination was terminated [132]. Results showed that the concentration of NO decreased rapidly on illumination, remaining nearly constant for a while, whereas the concentration of NO2 increased significantly during this time; stopping the illumination caused the NO2 concentration to go back to zero (Figure 45). The photonic efficiency ξNO increased initially with increasing TiO2 mass fractions but became steady around 0.76%. Concomitantly, the ξNOx and nitrate selectivity (S%) increased with increasing mass fraction of TiO2, which led to a corresponding decrease of the rate of production of NO2. Compared with the NOx removal results for pure TiO2, the estimated ξNO for the QST specimens was ca. 0.6%, while nitrate selectivity was ca. 40%; the supported TiO2 particles presented higher photonic efficiency for NO removal, but lower nitrate selectivity owing to reduced NO2 removal efficiency.
Clearly, the photocatalytic performance depended on the TiO2 loading with the activity increasing with TiO2 content up to ca. 0.76%, while nitrate selectivity increased across the range of TiO2 loading used, and was strongly conditioned by the negative influence of Ti–O–Si bonds on selectivity and the effect of dilution as TiO2 loading was increased. Washing to remove weakly bonded TiO2 led to a decrease of the photocatalytic activity ξNO by about 30%, even though nearly half of the TiO2 had been lost (only 0.34% remaining); however, selectivity was not significantly affected [132]. While such a low photocatalytic activity could be explained, in part, by fast charge carrier recombination and charge carrier trapping dynamics within intra-bandgap defect states in TiO2 photocatalytic substrates, mechanical loss of titania particulates from the support, coupled with the observed activity under controlled indoor experimental conditions (small flow-through reactor), as reported by the authors [132], do not bode well to convince implementation of the photocatalytic concrete technology to outdoor real-world environments where, as noted earlier, the conditions are different and uncontrollable.
The results of the few studies reported herein with regard to the extent of removal of NOx gases (NO and NO2) are summarized in Table 7 [25,97,121,122,124,125,126,128,132,134] for indoor laboratory experiments carried out with small bed flow-through reactors employing a variety of different conditions from one study to the next. Various standardization protocols have been proposed in the last few years that have led to significant variation in the results—as should have been expected.
5.2. DeNOxing the OUTDOOR Environment with TiO2 Photocatalytic Cementitious Materials
As shown above, many studies have been reported, albeit not all have been cited herein, on the photocatalytic abatement of NOx in a laboratory setting wherein experimental conditions could be controlled. Relatively speaking, however, only a few field trials have been conducted outdoors in open air environment under real-world conditions; as we have noted, the conditions are not only different but, more importantly, they also cannot be controlled. As an example of the latter, some reduction of NOx levels was achieved at the laboratory scale and in outdoor field experiments in Antwerp (Belgium) where a surface of ca. 10,000 m2 was covered with photocatalytic pavement blocks—researchers that did the study were unable to conclude the extent to which NOx was reduced because the measurement period was too short [135]. Additionally, an experiment to test the efficacy of photocatalytic TiO2-mortar panels to degrade NOx in a setting that involved artificial canyon streets showed NOx concentrations to be reduced by as much as 37–82% depending on the conditions [136]. Likewise, a study carried out in 2006 in Bergamo (Italy) over a four-week period in a segment of a local street covered with photocatalytic paving stones showed a 30–40% reduction in the NOx concentration compared to a similar section left untreated [137]; elsewhere, NOx reduction levels of 20 to 50% have been quoted that depended on weather and traffic conditions [138]. A study done in the city of Segrate (Italy) [137] where a concrete road segment (7000 m2) was constructed using a thin-layer of a photocatalytic mortar was said to display a 57% NOx abatement level, while a similar study in an industrial section near the town of Calusco (Italy) reported a NOx abatement level of 45% for an 8000 m2 pavement built with photocatalytic concrete blocks. By contrast, field studies carried out in an artificial model street canyon in Petosino, Italy [15] and in the Leopold II tunnel in Brussels (Belgium) [14] reported photocatalytic reductions of NOx well below measurement precision errors (1–2%). An “indoor” field study of the Umberto I Tunnel (Rome), for which the walls were coated with a photocatalytic paint and a new UV-Visible lighting system installed, showed more than 20% reduction of NOx [138]. The latter two field studies [14,138] are discussed in some detail below.
Clearly, the many discrepancies in NOx reduction levels when using photocatalytic paints, photocatalytic paving bricks, or photocatalytic mortar/concrete on streets, highways, or roadside noise barriers: (i) call attention to highly differing prevailing atmospheric conditions in field experiments; (ii) call into question how these field experiments were carried out; and (iii) call into question how the empirical results were interpreted. For that reason, we now describe the various attempts carried out using TiO2-based photocatalytic substrates/aggregates in a few countries and discuss their findings with an emphasis on three major undertakings funded wholly or in part by the European Union: the PICADA Project (2002–2006); the Life+-funded Project PhotoPAQ (2010–2014); and the LIFE MINOX-STREET Project (2014–2018).
One of the first applications of photocatalytic cement-based materials for self-cleaning purposes was Richard Meier’s Dives in Misericordia Church project in Rome where Italcementi served as the principal technical sponsor, analyzed the concrete mix (Figure 46) [139], and provided continuous supervision during the construction period (1999–2001). The church was erected with three huge, totally white sails made of precast photocatalytic concrete blocks (Figure 47) that would ensure unparalleled and time-enduring white color to the built elements thanks to the self-cleaning properties of the final TX-Active® surfaces [140,141]. The photocatalytic cement-based product used was expected to maintain its aesthetic characteristics unchanged over time, especially the color, even in the presence of aggressive urban environments. Laboratory pilot-scale tests demonstrated that NOx abatement with photocatalytic cement-based products was impacted by temperature, relative humidity, contact time of NOx with the surface (flow velocity, height of the air flow above the sample, among others); it was also noted that reduction efficiency increased with longer contact times (larger surfaces, lower velocities, and higher turbulence/mixing), higher temperatures and lower relative humidity—however, in real situations, conditions such as high temperatures, no wind and no rain present the largest risk of ozone formation [142].
Guerrini and Corazza [142] claimed that a building element containing cement to which TiO2 had been added was capable of maintaining its aesthetic appearance unaltered in time (see also [121]), thus contributing to reduce the dirtiness of surfaces exposed to specific polluted environments. A look at the photographs illustrated in Figure 48, however, shows that the long-term effectiveness of anatase TiO2 photocatalytic cement-based external walls of the church failed the test of time.
Another important sponsorship of the CTG-Italcementi Group was the renovation of the Umberto I Tunnel located in the center of Rome (dimensions: length, 347.7 m; width, 17 m; height: 8.5 m) for which renovation, carried out in the Summer of 2007, was deemed necessary because, among others, of the griminess of the indoor vault that was coated with an oily thickness of smog (Figure 49a) [123]. After a thorough clean-up, the tunnel walls were coated with a photocatalytic cement-based paint, with the gray paint applied on both sides of the tunnel (up to 1.80 m height from the road surface) and with a white paint for the remaining surface (total surface, 9000 m2)—it is not clear, however, what the source of the paints was (Cimax Ecosystem Paint by Calci Idrate Marcellina srl, a photovoltaic product patented by Italcementi [123], or Airlite paint, as claimed by Ref. [143]). Pollution and weather conditions were expected to be less variable in the indoor vault of the tunnel than in a typical outdoor environment, thus the researchers thought would facilitate the evaluation of the photocatalytic depolluting action of the photocatalytic grey and white paints with a reduced number of parameters and making the interpretation of the data less complex. During the first campaign of July 2007, the extent of NOx abatement was determined to be 20–25% in the center of the tunnel, whereas in the second campaign of September–October 2007, the NOx abatement level was estimated at 51–64% based on a statistical approach [138]. Regardless, Figure 49b [123] displays a photograph of the renovated tunnel before inauguration day of 9 September 2007, while the photographs in Figure 50 show the characteristics of the Umberto I Tunnel in Rome nearly 11 years after the renovation. Evidently, the long-term effectiveness of the photocatalytic product is also an issue here, not to mention the degradation (blisters) of the painted cementitious walls.
As the adsorbed nitrates (NO3−) formed subsequent to the oxidative conversion of the NOx gases on the surface of the photocatalytic cement-based paints cannot be washed off from the tunnel’s indoor walls, a problem arises with regard to the chemistry that occurs on the walls as accumulation of adsorbed NO3− on the catalytic surfaces block the catalytic sites from further NO/NO2 adsorption—thus, not only is the catalytic activity of the photocatalytic paint affected, but also the NO3− may be reduced catalytically back to NO2. In other words, reNOxification is likely to occur subsequent to the deNOxification process, unless the adsorbed nitrates are removed regularly by washings [132], not possible by natural means in a tunnel configuration unless done manually and periodically by appropriate maintenance of the infrastructure (best done on a weekly basis, also because the lamps will be covered with dirt and dust from the traffic (see, e.g., Figure 57), thereby diminishing the UV irradiance of the lamps—compare Figure 49b and Figure 50).
The principal goal of the European funded PICADA project (Photocatalytic Innovative Coverings Applications for Depollution Assessment) [134] was the development of a range of innovative materials that could easily be applied to various structures (buildings, tunnels, streets, roadside noise barriers, etc.) and that possessed despoiling and depolluting capabilities such as the TiO2 semiconductor photocatalyst (in powder format) that had earlier shown excellent photocatalytic properties toward the oxidative/reductive destruction of organic contaminants in aqueous media and in air (VOCs), removal of toxic metals (Hg and Pb), recovery of precious metals (Ag, Au, Pt, Pd, and Rh) [144,145,146,147,148], and self-cleaning capabilities when deposited on glass and other supports (in colloidal format). The PICADA project involved a consortium (eight partners) that assembled both industry and research institutes from Greece, France, Italy, Denmark and Great Britain, and whose two main objectives were: (i) to develop and optimize industrial formulations of TiO2 and application methodologies; and (ii) to establish local behavior models under different exposure conditions in realistic urban environments [134].
Various cement-based and ready-to-use products within this project involved nano-sized TiO2 and suitable additives/binders with products to be developed with regard to desoiling and depolluting efficiencies, ease-of-use, durability, and cost effectiveness; Table 8 gives a brief description of these products.
Laboratory tests of these products toward NOx destruction were carried out in a 0.45-m glass chamber equipped with a UV lamp 50 cm above the eight petri dishes and a fan to circulate the inlet air/NOx mixture (NOx, 200 ppb); the materials displayed significant performance toward destruction of NOx (especially NO) that disappeared completely at the end of the experiments. By comparison, tests toward the destruction of NO2 were carried out in a 20 L glass chamber with one petri dish per experiment; UV lamp was located 25 cm above the dish, air/NO2 mix (NO2, 200 ppb) was recirculated within a closed circuit; nitrite and nitrate ions were detected. Materials again performed well toward destruction of NO2 with an efficiency ca. 10 times greater than a control material without TiO2 [134].
Subsequently, three of the products (the 10-mm thick B1 mortar, the 1-mm thick B2 mineral coating, and the translucent C1 coating) were coated on a 4-m2 glass surface and tested in a much larger chamber (23 °C; relative humidity, 50%) equipped with a fan to keep the air/NOx (NOx, 200 ppb) circulating; lamp was located 150 cm above the samples. Results of the latter tests showed that in all cases ca. 80% of NO was destroyed. The TiO2-treated B1 mortar was also tested in a pilot-scale three-canyon streets (dimensions: 18 m long, 2 m wide and 5 m high) near Paris; NOx gas was emitted from an engine into the test and reference canyons by a perforated pipe. The B1 mortar reduced NOx by 40–80% relative to the reference canyon without the B1 test material [134]; another report with more details is also available [149].
Gurol [150] examined the results of the PICADA project and concluded (at that time) that there were several unanswered questions that needed to be addressed in a laboratory environment with regard to reaction rates, mechanisms, reaction products, fate of reaction products, and types of pollutants; the effect of various variables that include TiO2 particle size, type of TiO2, percent loading of TiO2 in the mixture, thickness of the mixture required (penetration distance of reactions), temperature, humidity, and concentration of pollutants; identification and quantification of reaction products under various indoor and outdoor conditions to establish that no hazardous chemicals were released from photocatalytic reactions; determination of the useful life of the TiO2-containing material; and evaluation of the effectiveness of TiO2 in a colored matrix as all buildings are not necessarily painted white. In addition, laboratory experiments ought to be conducted in a fully-controlled system that can operate under steady-state and continuous-flow conditions (as opposed to batch lab experiments) to be able to simulate realistic conditions. Furthermore, Gurol [150] recommended that a conceptual process model be developed to describe mass transport and reaction of various pollutants under various realistic scenarios for outdoor atmospheric conditions, together with evaluating the sensitivity of the model to all possible variables and atmospheric conditions. Whether these issues were considered and examined is typically not disclosed by industries, as they too often maintain that the results are proprietary.
Nonetheless, additional concerns with regard to outdoor applications remain to this day: (i) the long-term effectiveness of TiO2-containing materials; (ii) the possible desorption of pollutants at night time; (iii) the decrease of the effectiveness of TiO2 over time if adsorbed reaction products and chemicals are not washed off from the surface; and (iv) formation of ozone during the degradation of NO2 as reported by Maggos et al. [151].
Field studies undertaken in 2005–2009 in the Netherlands by an international panel of air quality experts sought innovative solutions to improve air quality on and around motorways in densely populated bottlenecks (hot spots) along some of the Dutch motorways. To this end, two series of practical trials were conducted using four panels with different TiO2 coatings fitted to an existing noise barrier along the A1 highway at Terschuur, and on a later erected TiO2-coated porous concrete noise barrier along the A28 motorway at Putten (Figure 51); measurements of NO2 and NOx performed under various weather conditions at both locations showed very low conversion rates of the NOx gases [152] that were attributed to the short contact time between air and barrier, to the relatively unfavorable meteorological conditions (wind direction and light intensity), to the high relative humidity, and to frequent low temperatures in the Netherlands. The experts concluded that improved air quality with TiO2 coatings on concrete had not been demonstrated!
Road rehabilitation of Petersbergerstraße in Fulda (Hesse, Germany) was undertaken to investigate possible effects on the concentration of NO2 emission by TiO2-coated photocatalytic paving stones installed on sidewalks (ca. 800 m) on both sides of the street [153]. Measurements were carried out at two points (Points 1 and 2) across from each other and taken in June 2010 (Point 1) and in October 2010 (Point 2) at two different heights: 10 cm and 3 m above the road surface; for comparison, similar measurements were undertaken beyond the 800-m stretch as a reference. The average traffic volume on this street amounted to about 24,000–30,000 vehicles per day; proportion of light and heavy trucks and buses was 3.2% and 2.1% and 0.2%, whereas the car share was 88%, and motorcycles 6.5%. The whole TiO2-coated surface was ca. 4500 m2, a relatively small proportion compared to the remaining road surface of ca. 15,000 m2. Relative to the reference section, the NO2-reducing effectiveness appeared somewhat greater directly above the pavement surface (at 10 cm) than at the 3 m height; at Point 2 the effectiveness was, respectively, 17% and 9%, whereas at Point 1 the effectiveness was 3.5% at 10 cm above ground while the NO2 level remained virtually unchanged at 3 m above. The large fluctuations in the individual values cast doubt as to whether the results were significant [153]. It must be noted that dirt, dust and oily layer on the sidewalks caused by the traffic and pedestrians had a non-insignificant impact on reducing the level of NOx emitted. By contrast, Cristal Global (producer of CristalACTiV™; anatase TiO2 nanoparticulate powder or colloidal sols) carried out a trial in 2006 in which TiO2 was incorporated into paving slabs laid down at either side along the length of a street (covering ca. 1200 m2) in the Borough of Camden (London, UK); a chemiluminescence analysis of NOx showed a reduction of ca. 20% (no other details were given) [154].
A field trial conducted at a train station in Manila (Philippines) by coating a 4100-m2 exterior wall with TiO2-based photocatalytic paint (Cristal Global) showed that about 26 g of NOx per 100 m2 of painted surface was removed; it was also claimed that each painted square meter could remove 80 g of NOx per year [154,155]. In another trial that ran over a four-year period, a 135 m2 wall in London was treated with a Cristal photocatalytic paint; the company claimed a reduction of 60% of NO and 20% of NO2 in the vicinity of the wall (again short in details regarding the exact physical steps taken in the trials). In addition, a depolluting 12-month trial in an indoor car park in 2007 in Paris, in which two Cristal specialist paints were used with a very active photocatalyst within the matrix of the coating, revealed (analysis of monthly nitrate accumulation) reduction levels of NOx between 53% and 99% depending on paint type and lighting levels [154]. However, another trial carried out, this time in a courtyard behind the Central St. Martin’s College of Art & Design (London, UK) by Cristal Global with one of its photocatalytic coatings, showed that, subsequent to chemiluminescence monitoring of NO, NO2 and NOx for nearly two years after the application of the photocatalytic coating, NOx reductions amounted to 35–65% depending on time of year and local weather conditions [154].
With regard to processes that might take place on paint surfaces, Laufs and coworkers [156] examined the photocatalytic reactions of nitrogen oxides (NOx = NO + NO2) on commercial TiO2-doped façade paints in a flow-tube photoreactor under simulated atmospheric conditions in a laboratory setting. Both NO and NO2 were rapidly converted photocatalytically, albeit only on the photocatalytic paints but not on non-catalytic reference paints. Nitrous acid (HONO) was formed in the dark on all paints examined; however, HONO decomposed efficiently under irradiation only on photocatalytic samples, so that photocatalytic paint surfaces did not represent a daytime source of HONO, contrary to pure TiO2 surfaces. Formation of adsorbed nitric acid/nitrate anion (HNO3/NO3−) occurred with near unity yield. The mechanism proposed by Laufs et al. for the photocatalytic reactions of NO, NO2, and HONO carried out on photocatalytic paint surfaces in a laboratory setting is displayed in Figure 52 [156].
A full-scale outdoor field demonstration of air purifying pavement in Hengelo (The Netherlands) was carried out by Ballari and Brouwers [157] on the full width of a street surfaced with a concrete pavement containing C-doped TiO2 (Kronos International; 4% w/w TiO2 water suspension; 50 L of suspension covered a 750 m2 surface; TiO2 loading was 2.67 g m−2) sprayed over a length of 150 m; for comparison, another part of the street (ca. 100 m) was paved with normal paving blocks; outdoor monitoring was done during 26 days over a period of more than a year. Prior and during the field measurements, the used blocks were examined simultaneously in a laboratory setting (small flow-through reactor) to assess performance. The first coating applied May 2010 gave good results in the laboratory setting (7.7% of NO and 6.9% of NOx under visible light illumination) and in the field. NOx levels were sampled at different heights: 5 cm (near the active surface), 30 cm (car exhaust height) and 1.5 m (the breathing zone) to assess the extent of deNOxing as a function of distance from the active surface. Unfortunately, the TiO2 photocatalytic coating vanished after the blocks were exposed outdoors for 2.5 months due to normal wear, to vehicular traffic, to weather, and/or else due to solid dust and dirt deposits on the surface. A second coating was subsequently applied to the surfaced road in September 2010; after being exposed for 1.5 months to the street environment, the photocatalytic performance returned to values of the first coating (laboratory testing). On average, the extent of NOx converted (to nitrates) outdoors determined by the chemiluminescence technique was 19.2 ± 17.8% (daily readings) and 28.3 ± 20.0% (afternoon readings)—note the high fluctuations in the samplings, not typically reported by many researchers; under ideal weather conditions (high radiation; low relative humidity) the decrease of NOx was 45% [157].
We have seen thus far that although NOx levels can be reduced effectively with TiO2-based photocatalytic surfaces in an indoor laboratory setting, significant variable results have been more the rule than the exception with regard to NOx reduction levels in an outdoor urban setting. For instance, NOx reduction levels of 40–80% [134,136,149], 26–66% [137], and ca. 19% [157] have been reported in various outdoor field trials; however, as we have seen in the field trial in Putten (The Netherlands) [152], the measured NOx reductions were at or well below detection limits. Such variations are likely the result: (i) of limited contact between the pollutant NOx and the photo-catalytic surface; (ii) of variable features of field sites; (iii) of prevailing local atmospheric conditions (wind velocity, wind direction, relative humidity, light intensity, etc.); (iv) of the time of measurements; and (v) of the nature and source of TiO2 photocatalytic products and their associated reactivity upon photo-activation.
Attempts to reduce NOx levels in an external “indoor” environment such as a road tunnel, as was the case with the Umberto I tunnel in Rome [123,138], were expected to bring about certain benefits: reduced health issues of pedestrians that use the tunnel, no need for a ventilation system, and decrease of the contribution of pollutants to the surrounding areas. To ascertain the benefits of photocatalysis toward NOx reductions in such indoor infrastructures and as part of field studies within the PhotoPAQ program, Gallus and coworkers [14] undertook an extensive field study of the Leopold II tunnel in Brussels (2011–2013) where photocatalytic cementitious coating materials (first campaign; Italcementi’s TX-Active® Skim Coat) were applied on the side walls and ceiling of a test section (73 m long) of one tube of the Leopold II tunnel (Figure 53) [158], followed by a monitoring campaign and later by a third campaign in which the same section was extended to 160 m and covered by a novel photocatalytically more active mortar (Italcementi’s TX-Active Skim Coat Boosted) [14]. Installed UV lighting (wavelength range, 315–420 nm) had an average irradiance on the active surfaces of 0.6 ± 0.3 W m−2 (TX-Active; second campaign) and 1.6 ± 0.8 W m−2 (TX-Active Boosted; third campaign).
Most interesting in the field trial of Gallus et al. [14] was the highly recommendable experimental approach used to assess the level of photocatalytic reduction of NOx gases inside the tunnel based on the realization that changes in atmospheric compositions, traffic flow, and dilution (i.e., different wind speeds) occur inside the road tunnel. Consequently, the authors monitored NOx concentrations and normalized them to the photocatalytically inert tracer CO2 gas that was emitted by the vehicular traffic at the same time as the NOx (and others) to yield NOx/CO2 concentration ratios; the instruments used throughout the campaigns had typical detection limits of 1–2 ppb, precisions of ~1% and accuracies of ~7% and ~10% for NO and NO2, respectively; CO2 levels were measured by a nondispersive infrared absorption technique: detection limit, 2 ppm; precision, 1%; accuracy, 7%.
The NOx/CO2 ratios so obtained from the slopes of plots of NOx against CO2 were independent of the absolute pollution level and thus of the emissions from the vehicular source and variable dilution inside the tunnel. Comparison of such slopes obtained in a control setting (dark conditions or otherwise under light illumination but without the TiO2 photocatalyst) relative to a setting in which the slopes of NOx versus CO2 plots obtained under light illumination should show significant variations if NOx were photocatalytically converted (to nitrates and others, such as HONO). Moreover, changes in the NOx/CO2 ratio—e.g., between upwind and downwind of the active section—could then be attributed to a photocatalytic remediation of the pollutants. The demonstration of NOx levels at different heights within the tunnel were also relevant in their approach; in this regard, Figure 54 shows NOx levels at Site 2 (under normal traffic conditions, only air at this site was in contact with the photocatalytic surfaces) were sampled at 1.1 m and 3.2 m above the street level and then plotted against the corresponding data at the tunnel ceiling (4.4 m above the street level) [14]. No significant gradients were observed at Site 2 under normal driving conditions with similar concentrations at the different heights above the street (note the slopes of the lines are nearly unity for data at the two heights).
Plotting the NOx data from the downwind Site 2 of the third campaign against CO2 data yielded a slope that gave a NOx/CO2 ratio of (3.09 ± 0.04) × 10−3 (Figure 55). More comprehensive results obtained under various conditions are summarized in Table 9 [14].
Comparison of all upwind (Site 1) and downwind (Site 2) data from the second campaign showed a minor formation of NOx (70 m test section; TX-Active used), whereas a small reduction was inferred at Site 2 from the third campaign (160-m section; TX-Active Boosted used) in qualitative accord with laboratory experiments on sample plates exposed to tunnel air. In the latter experiments, the authors [14] observed photocatalytic formation of NOx on dirty tunnel samples when the TX-Active material was used (second campaign), whereas only a very small reduction in NOx was measured on sample plates exposed to tunnel air when TX-Active Boosted was used. An examination of the combined errors of the NOx/CO2 ratios together with the precision of the duplicate instruments used (±2% for NOx) (see Table 9) led the authors to deduce that the observed differences in results from the second and third tunnel campaigns were insignificant.
To substantiate whether there was a potentially small photocatalytic reduction of NOx from the upwind/downwind data from the third campaign, the authors [14] further examined the influence of reaction time on the photocatalytic NOx remediation in the tunnel, in which a greater photocatalytic reduction was expected at lower wind speeds because of longer reaction times (residence times). However, no photocatalytic reduction of NOx was observed on comparing upwind and downwind data for both sets of wind speeds (or reaction times), thereby precluding any (expected) increase in reduction of NOx pollution at the lower wind speed. Comparing the NOx/CO2 ratios obtained with lights ON (active) and lights OFF (non-active) also showed no quantifiable remediation beyond experimental uncertainty, as also observed when only low wind speed data were used for which highest reduction was expected (Table 9). Accordingly, in view of the precision errors in the data analysis, the authors concluded that the extent of photocatalytic NOx remediation in the 160 m more active tunnel section from the third campaign was at best ≤2% [14].
A theoretical model showed that, in accord with the 20% NOx reduction observed in the 350 m long tunnel in Rome [123,138], a reduction upper limit of ≤20%, would have been possible in the 160 m test section of the Leopold II tunnel conditions as relative humidity (RH, 50%), wind speed (1 m s−1) and UVA light irradiance (10 W m−2) were optimal, and deactivation of the tunnel’s photocatalytic surfaces was disregarded. Unfortunately, deactivation of these surfaces was not insignificant under the heavily polluted tunnel conditions as demonstrated by laboratory experiments, not to mention that UVA irradiances of 0.6 and 1.6 W m−2 were far below the targeted value above 4 W m−2, which was therefore a contributing factor in the deactivation phenomenon and further decreased the photocatalytic activity. Moreover, typical wind speed (ca. 3 m s−1 during daytime) and the cold and humid (RH, 70–90%) conditions during the third campaign of January 2013 also caused a decrease of the activity of the photocatalytic material. Interestingly, another simple model calculation [14] that used uptake kinetics determined from laboratory experiments under the polluted tunnel conditions indicated an upper limit of only if such 0.4% for the photocatalytic NOx remediation, in fairly good accord with the experimental tunnel results of <2%. Not to be neglected, photocatalytic degradation of NO led to significant formation of NO2, particularly under humid conditions, thereby lowering the expected NOx reduction even further.
Thus far, the description of some field trials carried out under a variety of experimental approaches and conditions that could not be controlled, as the trials were performed in an open air environment, have led to a large variation in results associated with the extent of TiO2-based photocatalytic removal of NOx gases. Accordingly, it is worth summarizing the results, which are collected in Table 10 [14,15,134,136,137,138,139,149,152,153,154,155,156,157,159,160]. Clearly, the results are all over the place.
It has been reported time and again that photocatalysis, especially with TiO2-based commercial products, could degrade environmental pollutants as shown, within the present context, by the removal of NOx gases from the environment not only in a laboratory setting (Table 7), but to some extent also outdoors under environmental conditions (Table 10). Taking artificial model street canyons as examples for the removal of NOx, we have seen that the reported extent of NOx removal varies from 25–30% to 40–80% and 37–82%, while in a real urban street canyon values of 19% and 26–66% have been reported (Table 10). By contrast, similar TiO2-based products have shown no effect in removing environmental NOx gases in urban streets or on the highways’ noise barriers.
All the outdoors field trials expected the NOx to be transformed into nitrates on the photocatalytic surfaces ultimately to be desorbed when raining. However, there are also reports that other intermediate species are likely to form also such as nitrous acid (HONO) [156,161,162,163,164], which is far more toxic than the NOx pollutants, and not least is the potential for reNOxification and formation of ozone from the reaction of adsorbed nitrates with reducing agents (TiO2 conduction band electrons) [164,165]. For these very reasons and as part of the PhotoPAQ investigative program, Gallus and coworkers [15] structured a two-step campaign to investigate the fate of NOx gases outdoors in two artificial model street canyons in Petosino (Italy) (see Figure 56). In the first campaign, both model canyons had their side walls covered with a photocatalytically inactive fibrous cement, while in the second campaign one of the canyons had its side walls and ground surface covered with a photocatalytic cementitious coating material (Italcementi’s TX-Active Skim Coat Boosted), while the other was used as the reference canyon; the experimental approach used was otherwise similar to the approach used to examine the fate of NOx in the Leopold II tunnel [14]. The results of their investigations are reproduced herein to demonstrate, what we consider the best approach, their highly recommended protocol and their actual results, not simply the authors’ conclusions [15].
Results from monitoring and analyzing the NO, NO2 and NOx gases (10-min averaged values) from the active canyon were plotted against the results obtained in the reference canyon (Figure 57), with the expectation that differences in the respective slopes (Table 11) between daytime data and nighttime data would reflect the photocatalytic effect independent of any artificial differences. Perusal of the slopes that are summarized in Table 11 indicates that only for the conversion of NO was there a hint of a photocatalytic effect (−3.5 ± 3.3%). In addition, comparison of the daytime and nighttime results led the authors [15] to infer that less than 2% (that is, ≤2%) of the NOx was converted photocatalytically to nitrates (Table 12).
The field trial carried out in the Leopold II tunnel in Brussels found that the photocatalytic active surface was deactivated [14]. Accordingly, laboratory tests were undertaken to verify whether deactivation might also have occurred in the canyon trial campaign by taking samples of the active surface in the canyon (before and after) and using a flow-through reactor to examine their photocatalytic behavior toward degradation of the gas pollutants. Results showed that no deactivation of the canyon surfaces had occurred. Consequently, the authors [15] surmised that this was due to several evident differences in the model canyon campaign versus those from the Leopold II tunnel; that is,
- Much lower pollution levels exist in the canyon than in the tunnel; in the latter case, the greater pollutant level (very dirty ambient conditions–dirt/dust/grime/air pollutants) blocked the active sites (see Figure 58).
- Much higher UV irradiance was available in the canyon (sunlight UV in the canyon versus an artificial UV light system in the tunnel) causing the pollutants to degrade faster.
- In the tunnel case, the cementitious surfaces were allowed to cure in the dark for several days, whereas photocatalytic and non-photocatalytic surfaces in the canyons were freshly exposed to sunlight UV radiation.
Even though they expected to confirm NOx removal levels of ca. 20%, if not greater (see Table 10), as reported in earlier field trials in open atmospheric environments, the findings that there was no significant photocatalytic remediation of NOx (and VOCs, O3, and particulate matter)—removal level of ca. 2% or less—was somewhat enigmatic to say the least [15], albeit consistent with non-measurable NOx reduction levels found in highways (The Netherlands) and in a real urban street (Fulda, Germany). Such minute NOx reductions were likely due to low surface-to-volume ratios (Sactive/V) of the open structures; note that the Sactive/V ratio is a very significant factor that reflects the available active surface versus the space volume occupied by gaseous pollutants, i.e., the limiting heterogeneous uptake of a species onto a solid surface [166,167], as is also the associated deposition velocity. Evidently, other factors must have played a role, and/or some differences in experimental approaches might aid in explaining such very low levels of NOx reductions, namely:
- Although the overall geometry of the PhotoPAQ canyon model was otherwise similar to earlier model street canyons, the dimensions were different with respect to smaller model sites (e.g., 5 m wide canyon versus the earlier 2.4-m wide canyons that led to unrealistically higher Sactive/V ratios and as such to higher NOx reduction levels of 20–80% (Table 10) versus ≤2%. Note that the large reduction levels of NOx on photocatalytic TiO2 surfaces experienced in laboratory settings (Table 7) are also explained by this surface-to-volume ratio factor which is considerably greater: typically, 167 m−1 for a small flow-through reactor in a laboratory setting versus 0.6 m−1 for the model street canyon in the open environment in the industrial zone of Petosino (Italy). If one were to scale down the earlier results [134,136,149,166,167] to real urban street canyon conditions, it would result in only approximately 5% NOx reduction.
- Previous field trials considered results of monitoring the fate of NOx pollutants during daytime hours only, contrary to other field trials where the whole diurnal data were considered. NOx levels during nighttime were often comparable to those during daytime (higher emissions during the day were often compensated by stronger convective vertical dilution) so that the above estimate of ~5% based on daytime data was further reduced to ca. 3%, comparable to expectations typical of a main urban street [15].
- The distance at which the NOx gases were sampled from the photoactive surface is another important factor. Gallus et al. [15] recommended sampling NOx at a distance of 3 m above the photoactive surface for urban network stations, contrary to earlier field trials where sampling of NOx was done but a few centimeters from the active surface (5 cm to 1.5 m [148]; 30 cm to 1 m [137]; 50 cm [166,167])—indeed, since conversion of NOx gases to nitrates requires the NOx to be adsorbed onto the photocatalytically active surface, it is obvious that close to the surface is where the greatest change in NOx concentration will be felt—this means that, as you stroll on a photocatalytic street surface, your feet will experience a healthier environment than your head.
- High reductions of NOx levels in earlier field trials [134,137,149,157,166,167] likely reflected some differences between active sites and reference sites in terms of the quantity of NOx artificially injected into the active and reference canyons [134,136,149,166,167], whereas the field trial in the Petosino model canyon the NOx gases were those present in the homogeneous industrial environment [15].
- Where the active and reference model street canyons were distant from each other [137,157] may also have resulted in non-insignificant differences in the quantity of NOx artificially injected and in pollution dispersion (e.g., different wind speeds and different wind direction), thus leading to non-insignificant uncertainties in the results.
With regard to the latter issue, model studies have re-evaluated the daytime results from the experimental street canyon in Bergamo and determined that the upper limit of photocatalytic NOx remediation was more like 4–14% [160], rather than the claimed 26–66% [137], because of: (a) strong differences in the vehicle NOx emissions at the active and reference sites with much higher vehicle fleet density at the reference site; and (b) different dispersion conditions (geometry of sites, micrometeorology). However, Gallus et al. [15] contended that, if in the model studies one were to assume a reasonable wind speed of 1 m s−1 and a realistic photocatalytic deposition velocity of NOx on the active surface of 0.3 cm s−1, the upper limit of 4% [160] would be reduced further to <2% considering diurnal averages and transport limitations and more in line with real environmental results [152,153,168]. Clearly, the above factors and discussion call attention to the necessity of some care into how the data are treated and how the data are interpreted.
Several TiO2-based photocatalytic materials were also tested in 2015 by Pujadas and coworkers [169] of CIEMAT (Madrid, Spain) within the framework of the 2013–2018 LIFE MINOx-STREET European project. Tests were first carried out in a laboratory setting to choose the most photoactive TiO2-based material (fresh sample showed 45% reduction of NO in a flow-type reactor, dropping to 20% for a used street sample caused by traffic and ageing over a month) so designed as to be used on bituminous mixtures with which to examine the effect of reducing NOx levels in the two-way Boulevard Paseo de la Chopera, a real urban setting in the Municipality of Alcobendas (Madrid)—conditions were: ground level wind speed, 2 m s−1; relative humidity, <65%; solar radiation, >400 W m−2; TiO2-based coated active area, 1000 m2; length of section, ca. 60 m. The experimental approach was similar to that used in the PhotoPAQ project in that the daytime and nighttime NOx collected data in the median strip at two active sites (Site 2 and Site 3) and at the inactive site (Site 4) were plotted against NOx data collected at the inactive Site 1; the plots yielded the slopes reported in Table 13 [169]. The similarities between the data collected in daytime and at nighttime during the most optimal measurement periods before and after application of the photocatalytic coating led the researchers to deduce that there was no photocatalytic reduction of NO levels, in line with observations made by others in a real urban setting (see above).
A real scale examination of NOx depollution by TiO2-based photocatalytic sidewalk pavement and façade was performed by Pujadas and coworkers of CIEMAT [170] in an urban environment that resembled a model street canyon, albeit narrower, in which they also found no significant NOx reduction during their experiments in the sidewalk model in open air, even though in a laboratory setting the extent of NOx removal by the photocatalytic material was 65%. Nonetheless, a small ambient NOx reduction effect was observed on the photocatalytic façade (mimicking a building brick wall), although for only a very short time and very close to the active surface (e.g., <10 cm), and then only under very specific ambient and meteorological conditions.
At a presentation of their research at a conference in Barcelona (Spain) that was performed within the MINOx-STREET project, Palacios and coworkers [171] described results on urban street experiments, as well as experiments with model sidewalks and model building façades. Two principal conclusions are worth noting from that conference:
- A great difficulty was experienced in urban scenarios to establish a possible cause-effect relationship between any observed ambient NOx reductions in the presence of photocatalytic surfaces. In road bituminous pavement (the Alcobendas experiment) and sidewalk scenarios, the NOx removal effect of photocatalytic materials had not been unequivocally demonstrated experimentally; however, in the case of the façade scenario that effect was documented, albeit the effect was seen only at distances very close to the wall surface.
- Physicochemical characteristics of heterogeneous photocatalysis, such as low quantum yield for absorption of solar radiation by TiO2, heterogeneous molecular processes, and the high dependence on ambient conditions helped to explain the weak macroscopic effects observed in open urban air. Consequently, a low NOx concentration reduction was only attained very close to photoactive surfaces with poor global incidence on ambient air.
- The CIEMAT group [171] also investigated the NOx depolluting effect of TiO2-based photocatalytic materials in a medium-scale tunnel reactor under semi-controlled conditions using 200 ppbv of NO and compared the results with those from a real-scale outdoor tunnel (street in Alcobendas) and from a laboratory-scale reactor—Table 14 summarizes the parameters and the extent of NO removed in all three cases [171].
6. Concluding Remarks
One of the objectives of this review article is to provide an introduction to the basic approaches and terminology inherently and commonly used in heterogeneous photocatalysis. Relevant characteristic features of solid semiconductor/insulator photocatalysts are examined, together with some initial and subsequent events that follow the absorption of photons by these solids. The relationship(s) between traditional heterogeneous catalysis, on the one hand, and photochemistry and molecular spectroscopy, on the other hand, with heterogeneous photocatalysis have been made. The closer interconnection of photocatalysis to photochemistry is emphasized. Where similar symbols are used to mean different things, they are nonetheless fully described in the context used. The other objective is to examine closely the various attempts made to apply the photocatalytic technology—albeit briefly with regard to the published literature on environmental remediation of contaminated ecosystems—through incorporation of the extensively investigated TiO2 photocatalyst into various cementitious substrates (concrete, mortar, plaster, paints, etc.) applied to various infrastructures (highways, urban streets, building external walls and road tunnels, among others) and through the use of various coating materials.
With regard to the latter aspect, we have witnessed the external conditions of the Dives in Misericordia Church and the Umberto I tunnel in Rome (Italy) over a decade later from when the photoactive coatings were first applied to these structures. Evidently, deactivation of TiO2-based photoactive surfaces may become an issue over time so that, as Gallus et al. [15] aptly noted, experiments should be carried out at the field site of interest in small scale experiments exposed to the prevailing atmospheric conditions of the site—and not in a laboratory setting miles away from the application—before giving any consideration to apply the photocatalytic technology to surfaces of large infrastructures. Only when these surfaces display high activity towards NOx (NO and/or NO2) removal, in particular, and degradation of VOC pollutants, in general, and no strong deactivation of the photoactive surface occurs under the prevailing specific field conditions, should photocatalysis be advocated as a possible technology to reduce NOx and VOC levels in open urban environments.
We have also seen that the photocatalytic technology has demonstrated significant removal of NOx pollutants in a laboratory setting, whereas the overall results from real-scale application in an open air environment have been, to say the least, highly variable, but quite disappointing at best even under appropriate approaches in carrying out the experiments. Such deviations from a laboratory setting to a real outdoor environmental setting is due to several factors that advantage the laboratory results: (1) a small flow-through photoreactor was used in the laboratory tests against a vast open environment reactor system; (2) the photocatalytic surface used in the laboratory was a clean surface against an outdoor surface that in relatively short time is ultimately covered with dust, filth etc., thereby blocking the surface active sites where the reaction between the NOx and the oxidizing entities at these sites takes place—while rain might wash off the nitrates, the dust, and the filth from the open outdoor, that is not the case where the indoor walls of tunnels are concerned; (3) the rate of flow of the NOx gases could be controlled in the laboratory tests, unlike the open environment where no control of wind speed and/or its direction are possible; (4) the UV/Visible radiance could be controlled in the laboratory versus lack of control of the sunlight impinging on the photocatalytic surfaces; (5) unlike the open environment, in laboratory tests, the flow rate of the NOx gases in the photoreactor could be controlled which, therefore, affected the deposition velocity of the NOx onto the photocatalytic surface (i.e., a competition between horizontal flow versus vertical flow) as well as the residence time spent by the NOx gases within the reactor; (6) the Sactive/volume ratio in the laboratory reactor was far more advantageous than it could be in the open environment; (7) the relative humidity within the laboratory reactor could also be controlled, unlike the open environmental reactor; and (8) laboratory tests were carried out for a relatively short period (minutes to a few hours) within which the photocatalytic surface retained its integrity versus the open environment where the wished-for expectations were that the photocatalytic surfaces should remain active for months if not years and beyond.
Nonetheless, despite the disadvantages experienced in the open environment, there is no reason to throw away the baby with the bath water. It suffices to carry out cost-efficiency analyses (as they may be geographically different) and compare them with other technologies available out there—for example, selective catalytic reduction (SCR) and selective non-catalytic reduction (SNCR) together with natural means (e.g., trees on road sides). Photocatalysis may yet be found more attractive on a cost-efficiency basis compared to other, perhaps more expensive methods if extra costs of photocatalytic surfaces associated with application to normal urban surfaces (roads, paints, roof tiles, etc.) were minimized by the industrial sector in the future, and if photocatalytic materials were applied when urban infrastructures were being renovated [15].
It cannot be overemphasized that the effective use of photocatalysts in cementitious substrates in the deNOxification of the environment requires serious considerations of some fundamental physical and chemical notions prior to any attempt at implementation of the TiO2-based photo-catalytic methodology, and as appropriately emphasized by Macphee and Folli [129], the following concerns are worth noting and sharing:
- Photocatalysis is a surface phenomenon that is impacted by the chemistry of the immediate environment, so that the cementitious photocatalytic surface must be engineered to maximize light absorption by the photocatalytic surface and for the reactants to access the surface.
- Redox potentials of pollutants considered for elimination must match the semiconductor band edge positions (i.e., flatband potentials) of the conduction and valence bands for a successful deNOxification as the band edges are pH-dependent, especially for a metal-oxide photo-catalyst.
- More fundamental research is needed toward optimizing photonic efficiencies of visible-light activation of photocatalysts if anion- and/or cation-doped photocatalysts were used, as geographical locations may be limiting the usage of photocatalytic concrete if conventional pristine TiO2-based surfaces were used.
- There is a need to maximize both the dispersion of photocatalytic particles in the cementitious substrate and the photoactive surface area toward target applications and agglomeration of particles in a porous structure should be minimized as it could block access of larger pollutant molecules to the internal photoactive surface.
- Oxidative removal of NOx pollutants by their conversion to nitrates occurs only if they are adsorbed on the photocatalytic surface; recall that the adsorption mode of molecules on the photoactive surface is highly pH-dependent (surface charge) and could thus affect the oxidative efficiency.
- The deNOx index that combines photonic efficiency and selectivity into one environmental impact parameter for a given photocatalytic material should be considered whenever screening candidate photocatalytic materials; for instance, if this index for a photoactive surface were negative shows that the oxidative removal of NO favors formation of the more toxic product NO2 rather than the NO3− species, as demonstrated for a conventional unselective TiO2 (e.g., bare P-25 titania) that exhibited a large negative deNOx index [129], a sign that the catalytic process was ineffective. Consequently, both photocatalyst selectivity and photo-catalyst activity must be assessed to reduce emission of harmful by-products.
- On the more fundamental side, the thermodynamics (energetics) are the most valuable tool in understanding and designing selective photocatalytic processes. Recall that, after the rapid e−/h+ pair recombination, the next fastest process is charge carrier trapping. This calls attentions that not only is the semiconductor band edge positions relevant, but also charge transfer from traps to adsorbate molecules need to be fully appreciated in interpreting photocatalytic processes as also the engineering and design of band structures of single semiconductors or semiconductor composites.
Additionally, using a tunnel as an example of an infrastructure in need of eliminating NOx agents, Gallus et al. [14] also expressed the notion that a reasonable photocatalytic remediation of NOx in a road tunnel can only be obtained under suitable/special experimental conditions, as photocatalytic remediation will not be effective where the photoactive materials are strongly deactivated under highly polluted conditions. Accordingly, photocatalytic materials should always be tested in small-scale bed-flow reactors on site using: (1) the UVA irradiance equivalent to that of the tunnel; and (2) the NOx present in ambient air sucked from the tunnel as the reactant.
Only if NOx were efficiently decomposed under these conditions, would larger scale applications in a road tunnel be worth considering. Regardless of the possible deactivation of photo-catalytic materials under high pollution conditions, model calculations have shown that applications of such materials are unlikely to result in significant remediation of NOx to nitrates at low UVA irradiances and where high wind speeds and/or high relative humidity prevail. With regard to NOx conversions in road tunnels, this calls further attention to the need for a careful characterization of tunnel conditions, for a quantification of possible deactivation of the photocatalytic materials, and for performing simple upper limit model calculations of expected NOx reductions, together with a cost–benefit analysis well before considering application of photocatalytic materials and installation of costly UV lighting systems. These same considerations also apply to pollutant remediation in other infrastructures.
7. Recommendations
In practical applications of photocatalysis, conventional TiO2-based photocatalytic surfaces have been used to oxidize NOx to nitrate species; the latter species do not desorb spontaneously and consequently deactivate or block the surface-active centers of the photocatalyst from carrying out the next cycles. To avoid such deactivation, the nitrates (or nitric acid) should typically be washed away by rain [172]; however, the nitric acid is corrosive and could pollute the soil when its concentration at the site becomes too high. A promising way to resolve this problem, which the users of applied photocatalysis have failed to consider but known to occur in a laboratory setting since the first report by Courbon et al. [92] in 1984, would be to change the selectivity of the photocatalytic reaction so that the NOx gases are converted back to N2 and O2 by some photoreduction pathway as reported some time ago by Anpo and coworkers [94,95], who used Cu+ ions in SiO2 or in zeolite to effect the photocatalytic reduction of NOx. No deactivation of the active sites would occur for this photoreduction reaction since nitrogen and oxygen readily desorb from the surface [173]. The selectivity toward the photoreduction of NO could be improved greatly by reducing the hexacoordinated Ti4+ species (TiO6 octahedra) to tetracoordinated Ti4+ species (TiO4 tetrahedra) [174], as successfully achieved by depositing isolated TiO4 clusters inside cavities of zeolite-Y using ion beam implantation [174,175].
In a more recent article, Wu and van de Krol [176] proposed a novel strategy to change the photocatalytic selectivity of TiO2 by creating a large and stable concentration of oxygen vacancies in TiO2 nanoparticles through thermal reduction in a reducing atmosphere; these oxygen vacancies were stabilized by doping the TiO2 nanoparticles with an electron acceptor-type dopant such as Fe3+ which also greatly enhanced the activity of the photoreduction process. The authors [176] further showed that with this strategy NO was indeed photoreduced to N2 and O2 and that photooxidation of NO was largely suppressed. Moreover, photoreducing Fe3+ to Fe2+ provided a recombination pathway that suppressed nearly quantitatively the formation of NO2 and consequently enhanced the selectivity of the reaction for N2 formation [176]. The authors also alluded to formation of N2 and O2 via two different routes. One route would see a small amount of tetrahedrally coordinated Ti formed in the Fe-doped TiO2 samples, which Anpo et al. [175,177] claimed as the active site for the catalytic decomposition of NO to N2 and O2 at Ti-modified zeolites. As most TiIV ions at the TiO2 surface are fivefold-coordinated, a single oxygen vacancy created at or near the surface could lead to a fourfold-coordinated Ti4+ center; however, this would require a strong reduction of the Ti–O bond length that would be possible only at very high oxygen vacancy concentrations, which the authors [177] deemed an unlikely pathway and proposed the other route that implicated oxygen vacancies acting as the catalytic centers through the capture of the oxygen side of NO as illustrated in Figure 59 and summarized in Reactions (101)–(104); the associated experimental data are also displayed in Figure 59.
Vo++(surf) + 2 e− + NO(g) → Osurf − N
2 Osurf − N → 2 Osurf + N2(g)
2 Osurf → 2 Vox + O2(g)
Vox + 2h+ → Vo++
Summing Reactions (101)–(104) yields the overall Reaction (105).
2 Vo++
2 NO(g) + 4 hν → N2(g) + O2(g)
2 NO(g) + 4 hν → N2(g) + O2(g)
Although the conversion efficiency was somewhat modest (ca. 4.5% after 1050 min correspond-ing to a TON of ∼2 NO molecules per O vacancy site), the Fe-doped TiO2 photocatalyst showed no signs of deactivation as the NO conversion centers were not blocked by nitrate species [168], contrary to standard deNOx TiO2-based photocatalysts that have to be washed away periodically.
In a most recent article, Cao and coworkers [178] investigated the adsorption of NO and the consequent reactions on differently treated rutile TiO2(110) surfaces using polarization/azimuth-resolved infrared reflection absorption spectroscopy. Apparently, surface defects (e.g., oxygen vacancies, Vo) and reconstructions on TiO2(110) had a strong effect on the reaction pathways of NO → N2O conversion (N2O is laughing gas). The pathway proposed involved a defect-free oxidized TiO2(110) surface in which two NO molecules are adsorbed on adjacent surface-pentacoordinated Ti (Ti5c) sites first, which then couple to form a cis-(NO)2/Ti&Ti dimer through the N−N bond of the dimer, and then are converted to N2O species (or perhaps even to N2 gas) [178].
Clearly, much fundamental research in TiO2-based photocatalysis needs to be undertaken in the optic toward applications to environmental deNOxification, with special attention and efforts directed at titania doped with Fe, Cr, Co and Ni dopants that may yet prove interesting [176].
As a case in point, a recent article by Kuznetsov and coworkers [70] examined possible additional specific channels of photoactivation of solid semiconductors with regard to thermo-/photo-stimulated bleaching of photoinduced Ti3+ color centers in visible-light-active (VLA) photo-chromic rutile TiO2, which an optical emission spectroscopic analysis had shown to contain 99.4 at.% Ti and 0.2 at.% Al as the principal impurity, together with 0.09 at.% Fe, 0.05 at.% Sn, 0.04 at.% Nb, and 0.03 at.% Cr as minor impurities. Considering that the prime photophysical process of photostimulated bleaching of Ti3+ color centers is absorption of light quanta by the Ti3+ centers, the authors [70] found that no selectivity of photostimulated bleaching of a certain type of Ti3+ centers could be ascertained, and that photogenerated holes captured at a set of traps were also participants in the photostimulated bleaching of these color centers. Based on current findings and earlier results, the authors hypothesized that the heat released during nonradiative electron transitions, following the prime photophysical processes of excitation and ionization of Ti3+ centers, dissipates in the nearest neighborhood of the Ti3+ centers and that localized nonequilibrated excitation of the phonon subsystem leads to thermal detrapping of the photoholes with different depths up to 1 eV. Subsequent recombination of free holes with trapped electrons from Ti3+ centers leads to the observable photostimulated bleaching of the color centers [70]. Based on experimental evidence, the authors further argued that following absorption of vis–NIR light by the color centers, the subsequent release of thermal energy accompanying nonradiative electron transitions provides an additional specific channel to photoactivate the VLA rutile TiO2, in particular, and possibly other photocolorable metal-oxide semiconductors as well.
Following their interest of the photophysics of color centers in VLA rutile titania ceramics and titania powder resulting from the photoformation and separation of charge carriers, Kuznetsov et al. [179] noted that the action spectrum of the photoformation of Ti3+ centers at very low temperatures (90 K) accorded fully with the absorption spectra of intrinsic defects that consisted of a set of individual absorption bands that they attributed to several different Ti3+ centers. Analysis of the dependencies of the photoformation of separate centers on the wavelength of illumination and light exposure, which provided extraction of specific Ti3+ centers, led the authors to identify Ti3+-based centers with excessive negative charge that formed at significantly high concentration upon maximal exposure of the titania specimens to Vis-light illumination: (2Ti3+ + Vo2+) ←→ (Tiδ+ + Vo2+) with 3 > δ > 2. They also showed from thermoprogrammed annealing (TPA) that the spectra of Ti3+ color centers in the range 90–500 K consisted of a set of first-order peaks corresponding to traps, whose depths ranged from ~0.2 eV (peak at 130 K in the powder specimen) to 1.06 eV (peak at 455 K in the ceramics specimen). The highest rate of recombination of holes released to the valence band with Ti3+ centers—an event attributed to Tiδ+ centers—provided TPA spectra that clearly manifested the existence of shallow traps. In addition, mass spectrometric experiments on the photoadsorption of molecular oxygen and photodesorption of photoadsorbed oxygen from the surface of powdered VLA titania specimens provided further evidence of the photoformation of electrons and holes in VLA TiO2 under Vis-light illumination, and allowed the authors [179] to determine the kinetics of photo- desorption of O2 under orange light illumination subsequent to photoadsorption of O2 stimulated by blue light excitation. Those experiments provided further proof of the occurrence of another specific channel toward the photoactivation of VLA TiO2 via photoexcitation of photoinduced Ti3+ color centers.
It is important to recognize that Ti3+-based centers (i.e., Tiδ+ centers) appeared after many other Ti3+ centers had already been formed. In other words, such Ti3+-based centers appeared at high density of Ti3+ centers (see below). Accordingly, specific properties of Ti3+-related centers responsible for the (extrinsic) absorption bands at 1.56 eV and 1.26 eV were postulated to account for the excess negative charge characteristic of such Ti3+-based centers. In line with the work of Déak and coworkers [180], the two adjacent Ti3+ centers located near a single oxygen vacancy forming a (2Ti3+ + Vo2+) complex (Figure 60a) were taken by Kuznetsov et al. [179] as extra charged Ti3+ centers when compared to isolated Ti3+ centers (Figure 60b). The two Ti3+ species in the (2Ti3+ + Vo2+) complex can, in principle, disproportionate to (Ti2+ + Ti4+ + Vo2+) so that, in accord with the more generally accepted view, these extra-negatively charged Ti3+ centers are best referred to as Tiδ+ centers for which 3 > δ > 2. Clearly, the appearance of such Tiδ+ centers, whether photogenerated or resulting from the removal of the structural oxygen during a reduction event, is of lower probability because of the electrostatic repulsion of the two trapped electrons and the well-known instability of such centers to oxidation. Consequently, the formation and increase in the concentration of such photoinduced Tiδ+ centers appears to occur only at high density of photogenerated Ti3+ centers that ensue upon prolonged exposure to Vis-light illumination in the later stages of photocoloration (i.e., formation of Ti3+ color centers).
Germane to the above, the work of Déak and coworkers [180] showed that the first case scenario is that two self-trapped electrons in the (Vo2+ + 2e) complexes are located at two equivalent first neighbors of the oxygen vacancy (extra-negatively charged Ti3+ → Tiδ+ centers; Figure 60a), while in the second scenario both electrons are more remote from the Vo2+ vacancy and are not in the same plane as the vacancy (isolated Ti3+ centers; Figure 60b); the energies of the vertical transitions of these self-trapped electrons to the conduction band are ca. 1.1 eV. Following this reasoning, a question arose as to why the growth of the number of such Tiδ+ centers was observed only under Vis-light illumination. This led Kuznetsov and coworkers [70] to focus attention on the differences in the spatial photoexcitation events that occur in the microparticle when illuminated in the UV and Vis spectral regions. Such differences had not heretofore been considered in the literature; their views of the events that occur under UV and Visible light illumination are summarized in Figure 61.
When hν > Eg, light quanta are absorbed spontaneously in solids in an arbitrary manner, each time producing e-h pairs at new spatial sites (black stars in Figure 61a) for which charge carrier transport and localization in the microparticle are determined by the distribution of charge carrier traps (Processes 2 and 3 in Figure 61a). At moderate UV-light irradiances, the authors [70] supposed that since every subsequent photoformation of charge carriers and trapping event occur in other spatial sites, a significant density of Ti3+ centers would not be reached. However, photoformation of electrons and holes can also be achieved on illumination in the Vis region at hν ≤ Eg when light quanta are absorbed by the native point defects (i.e., F (or F+) centers); the latter are limited in number and are located at definite sites in the microparticle (Figure 61b). Moreover, because photoexcitation of F (or F+) centers can produce charge carriers followed by their subsequent decay to their initial electronic states, as proposed in earlier studies [68,69], repetitive absorption of light quanta and photogeneration of electrons and holes occurs each time at the same spatial sites (F or F+ centers) in the microparticle (blue stars in Figure 61b). Such considerations then lead to the reasonable inference that transport of carriers and occupation of traps (processes 2 and 3 in Figure 61b) start repetitively at the same sites in the microparticle. In that case, filling of the nearest neighbor F (or F+) center traps facilitates the attainment of a high density of Ti3+ centers and the consequent formation of the Tiδ+ centers [70].
The above notwithstanding regarding the TiO2-based technology, people intending to deNOxify the environment must first come to appreciate and understand the rich chemistry of nitrogen oxides, in general, and NO and NO2, in particular, in a homogeneous phase and in hetero- geneous media.
For instance, NO dimerizes to N2O2 upon condensing to a liquid, although the association is weak and reversible [181]. In addition, to the extent that the enthalpy of formation of NO is endothermic, NO can easily undergo disproportionation back to its constituent elements N2 and O2 as might occur in catalytic converters—for example, Reaction (106) occurs over the zeolite Cu2+-ZSM-5 [182].
2 NO → N2 + O2
Nitric oxide is also thermodynamically unstable at 25 °C and 1 atm; under pressure, it decomposes readily in the temperature range 30–50 °C to yield NO2 and N2O (Reaction (107)) and may react either as NO2 or as N2O3 [183].
3 NO → N2O + NO2
When exposed to atmospheric oxygen, nitric oxide converts instantly to NO2 (Reaction (108)) [181], which likely occurs via the intermediate ON–O–O–NO.
2 NO + O2 → 2 NO2
In water, NO reacts with oxygen and water to form nitrous acid HONO (Reaction (109)).
4 NO + O2 + 2 H2O → 4 HONO
Since both NO2 and NO are radical species, they combine to form the intensely blue dinitrogen trioxide N2O3 (Reaction (110)) [184].
NO + NO2 ⇆ ON − NO2
Both the brown gas nitrogen dioxide, NO2, and the colorless gas dinitrogen tetroxide, N2O4, exist in a strongly temperature-dependent equilibrium (Reaction (111)) for which ΔH = −57.23 kJ mol−1, with NO2 being favored at higher temperatures, while N2O4 predominates at lower temperatures.
2 NO2 ⇆ N2O4
Because of the relatively weak N–O bond in NO2, nitrogen dioxide is a relatively good oxidizing agent in aqueous media (Reaction (112); nearly comparable to Br2 gas), which makes the mixed oxides NO2 and N2O4—also known as nitrous fumes—react vigorously if not explosively with several compounds, particularly with hydrocarbons via hydrogen abstraction as a first step (Reaction (113)) [181].
N2O4 + 2 H+ + 2 e− → 2 HONO E0 = 1.07 V
NO2 + RH → R• + HONO
In aqueous media, NO2 also hydrolyzes to form nitrous acid and nitric acid via Reaction (114), which is one of the steps in the industrial production of nitric acid from ammonia via the Ostwald process [185].
H2O
2 NO2 ⇆ N2O4 → HONO + HNO3
2 NO2 ⇆ N2O4 → HONO + HNO3
Although Reaction (114) is negligibly slow at the low concentrations of NO2 characteristically encountered in the ambient atmosphere, it does proceed upon uptake of NO2 onto surfaces to produce gaseous HONO in outdoor and indoor environments [186].
Several studies have examined the interactions of NO2 on the TiO2 surface under various experimental conditions, such as different NO2 partial pressures and various temperatures in the range 323–573 K [102,106,108,172]. All these studies reported production of NO in the gas phase, and formation of nitrates on the TiO2 surface, albeit under photocatalytic conditions.
However, other aspects that seem to have been overlooked by many are the potential specific interactions between the two NOx molecules and the TiO2 surface under dark conditions, which need to be re-emphasized constantly.
In this regard, in their 2003 FTIR study carried out in the dark in borosilicate glass vessels, Finlayson-Pitts et al. [186] discovered that the loss of gaseous NO2 was accompanied by formation of HONO, NO and N2O; further FTIR studies also revealed the formation of HNO3, N2O4 and NO2+ species, which led them to hypothesize that the symmetric form of the NO2 dimer, N2O4, is taken up on the surface and isomerizes to the asymmetric form, ONONO2, with the latter undergoing autoionization to NO+NO3−. Apparently, it is the latter intermediate species that react with water to generate HONO and surface-adsorbed HNO3. Subsequently, NO is generated by secondary reactions of HONO on the highly acidic surface. The authors further noted that a key aspect of this chemistry is that in the atmospheric boundary layer where human exposure occurs and many measurements of HONO and related atmospheric constituents (e.g., ozone) are made, a major component for this heterogeneous chemistry is the surface of buildings, roads, soils, vegetation and other materials [186].
A more recent investigation by Sivachandrian and coworkers [187] on the adsorption of NO and NO2 molecules on the metal oxide TiO2 at ambient temperature, specifically carried out under dark experimental conditions to avoid any photocatalytic interference, showed no significant adsorption of NO on TiO2. By contrast, not only did NO2 significantly influence the adsorption of VOCs and mineralization on the TiO2 surface, but once the threshold surface coverage of NO2 was reached at room temperature, the NO2 adsorbed reactively on the TiO2 surface by evolving NO in the gas phase. Quantitative measurements performed downstream of the reactor led the authors [187] to propose a new mechanism expressed by the Reactions (115)–(118) for the adsorption of NO2 on TiO2 at room temperature under dry air conditions:
2 NO2(ads) ⇆ NO2− + NO+(ads)
NO + O2−(TiO2 Surface latice) ⇆ NO2−(ads)
NO2−(ads) + NO2(ads) ⇆ NO3−(ads) + NO(g)
According to this sequence, the global reaction of NO2 adsorption is then (Reaction (118)):
3 NO2(ads) ⇆ 2 NO3−(ads) + NO(g)
Accordingly, the proposed NO2 adsorption mechanism on TiO2 at room temperature in the dark [187], together with the experimental observations, could be summarized thus: (i) three NO2 molecules adsorb on TiO2, produce two NO3− ions on the TiO2 surface, and evolve one NO molecule in the gas phase; (ii) the ratio between consumed NO2, TPD desorbed NO2 subsequent to adsorption, and NO produced during NO2 adsorption = 3:2:1; (iii) the NO2 adsorption time (i.e., the TiO2 surface coverage) significantly modified the nature of the adsorbed species at ambient temperature; (iv) the NO formation time was controlled principally by the surface coverage of NO2− and NO3− ions, rather than by the NO2 inlet concentration; and (v) at higher NO2 gas phase concentrations (greater than 35 ppm) at room temperature, the total amount of consumed NO2 decreased as a result of self-poisoning of the sites by adsorbed NO3− species.
Similarly, Haubrich and coworkers [188] examined the interaction of NO2 on rutile TiO2(110) and discovered that the presence of NO2 and water led to the formation of multilayers under dark conditions of nitric acid, HNO3, contrary to exposure of the surface to pure water after saturation of the surface with 200 mTorr of NO2; no further growth of the AP-XPS (ambient pressure X-ray photoelectron spectroscopy) nitrate signals occurred under the latter conditions. Apparently, formation of HNO3 requires weakly adsorbed NO2 molecules, an important finding with important implications in environmental processes since their study [188] confirmed that metal oxides facilitate the formation of nitric acid under ambient humidity (in the dark) conditions typically encountered in atmospheric environments.
It is evident that there is much more that needs to be investigated to fully understand whatever events occur in and on the TiO2 (and others) semiconductor photocatalyst. Laboratory experiments using models and solar simulators are just the beginning, after which what is needed is to bring the laboratory outdoors using actual environmental quantities of NOx as the reagents and humid air as prevails in the environment being investigated for application of the photocatalytic substrates. A careful study of the levels of NOx or its products at various distances from the photocatalytic surface, both vertically and horizontally, without precluding determination of all other environmental factors is also needed. The deNOx index has shown that metal-doped TiO2 systems are also worth investigating further.
Funding
This research received no external funding.
Acknowledgments
We are grateful to Angelo Albini for his gracious hospitality in the PhotoGreen Laboratory at the University of Pavia, Italy.
Conflicts of Interest
The author declares no conflict of interest.
References
- Engineering Alliance, Inc. Air Quality Services, Types_of_sources_02-2012. Available online: https://www.eaincglobal.com/air-quality/attachment/types_of_sources_02-2012/ (accessed on 12 October 2018).
- Smog. Available online: https://en.wikipedia.org/wiki/Smog (accessed on 12 October 2018).[Green Version]
- Popescu, F.; Ionel, I. Anthropogenic Air Pollution Sources. In Air Quality; Kumar, A., Ed.; InTech Europe: Rijeka, Croatia, August 2010; Chapter 1; pp. 1–22. ISBN 978-953-307-131-2. Available online: http://www.intechopen.com/books/airquality/anthropogenic-air-pollution-sources (accessed on 15 July 2018).
- European Union Emission Inventory Report 1990–2011 under the UNECE Convention on Long-Range Trans-Boundary Air Pollution (LRTAP). Available online: http://www.icopal-noxite.co.uk/nox-problem/nox-pollution.aspx (accessed on 12 October 2018).
- United States Environmental Protection Agency. Air Emission Sources. 4 November 2009. Available online: http://www. epa.gov/air/emissions/index.htm (accessed on 12 October 2018).
- Tropospheric Ozone. Available online: https://en.wikipedia.org/wiki/Tropospheric_ozone#cite_note-5 (accessed on 12 October 2018).
- Reeves, C.E.; Penkett, S.A.; Bauguitte, S.; Law, K.S.; Evans, M.J.; Bandy, B.J.; Monks, P.S.; Edwards, G.D.; Phillips, G.; Barjat, H.; et al. Potential for photochemical ozone formation in the troposphere over the North Atlantic as derived from aircraft observations during ACSOE. J. Geophys. Res. 2002, 107, 4707. [Google Scholar] [CrossRef]
- Deziel, C. How Is Photochemical Smog Formed? Available online: https://sciencing.com/photochemical-smog-formed-6505511.html (accessed on 25 April 2017).
- Health Effects of Nitrogen Oxides, Department of Employment, Economic Development and Innovation, Queensland Government, Australia. Available online: https://www.dnrm.qld.gov.au/data/assets/pdf_file/0020/212483/2-health-effects-of-nitrogen-dioxide.pdf (accessed on 12 October 2018).
- McCarron, G. Air Pollution and human health hazards: A compilation of air toxins acknowledged by the gas industry in Queensland’s Darling Downs. Int. J. Environ. Stud. 2018, 75, 171–185. [Google Scholar] [CrossRef]
- Chen, J.; Poon, C.-S. Photocatalytic construction and building materials: From fundamentals to applications. Build. Environ. 2009, 44, 1899–1906. [Google Scholar] [CrossRef]
- Mendoza, C.; Valle, A.; Castellote, M.; Bahamonde, A.; Faraldos, M. TiO2 and TiO2–SiO2 coated cement: Comparison of mechanic and photocatalytic properties. Appl. Catal. B 2015, 178, 155–164. [Google Scholar] [CrossRef]
- Pei, C.C.; Leung, W.W.F. Photocatalytic oxidation of nitrogen monoxide and o-xylene by TiO2/ZnO/Bi2O3 nanofibers: Optimization, kinetic modeling and mechanisms. Appl. Catal. B 2015, 174–175, 515–525. [Google Scholar] [CrossRef]
- Gallus, M.; Akylas, V.; Barmpas, F.; Beeldens, A.; Boonen, E.; Boréave, A.; Cazaunau, M.; Chen, H.; Daële, V.; Doussin, J.F.; et al. Photocatalytic depollution in the Leopold II tunnel in Brussels: NOx abatement results. Build. Environ. 2015, 84, 125–133. [Google Scholar] [CrossRef]
- Gallus, M.; Ciuraru, R.; Mothes, F.; Akylas, V.; Barmpas, F.; Beeldens, A.; Bernard, F.; Boonen, E.; Boréave, A.; Cazaunau, M.; et al. Photocatalytic abatement results from a model street canyon. Environ. Sci. Pollut. Res. 2015, 22, 18185–18196. [Google Scholar] [CrossRef] [PubMed]
- Sikkema, J.K.; Ong, S.K.; Alleman, J.E. Photocatalytic concrete pavements: Laboratory investigation of NO oxidation rate under varied environmental conditions. Constr. Build. Mater. 2015, 100, 305–314. [Google Scholar] [CrossRef]
- Gandolfo, A.; Bartolomei, V.; Gomez-Alvarez, E.; Tlili, S.; Gligorovski, S.; Kleffmann, J.; Wortham, H. The effectiveness of indoor photocatalytic paints on NOx and HONO levels. Appl. Catal. B 2015, 166–167, 84–90. [Google Scholar] [CrossRef]
- Martinez, T.; Bertron, A.; Escadeillas, G.; Ringot, E.; Simon, V. BTEX abatement by photocatalytic TiO2- bearing coatings applied to cement mortars. Build. Environ. 2014, 71, 186–192. [Google Scholar] [CrossRef]
- Folli, A.; Pade, C.; Hansen, T.B.; De Marco, T.; Macphee, D.E. TiO2 photocatalysis in cementitious systems: Insights into self-cleaning and depollution chemistry. Cem. Concr. Res. 2012, 42, 539–548. [Google Scholar] [CrossRef]
- Karapati, S.; Giannakopoulou, T.; Todorova, N.; Boukos, N.; Antiohos, S.; Papageorgiou, D.; Chaniotakis, E.; Dimotikali, D.; Trapalis, C. TiO2 functionalization for efficient NOx removal in photoactive cement. Appl. Surf. Sci. 2014, 319, 29–36. [Google Scholar] [CrossRef]
- Mo, J.; Zhang, Y.; Xu, Q.; Lamson, J.J.; Zhao, R. Photocatalytic purification of volatile organic compounds in indoor air: A literature review. Atmos. Environ. 2009, 43, 2229–2246. [Google Scholar] [CrossRef]
- Bartolomei, V.; Sörgel, M.; Gligorovski, S.; Alvarez, E.G.; Gandolfo, A.; Strekowski, R.; Quivet, E.; Held, A.; Zetzsch, C.; Wortham, H. Formation of indoor nitrous acid (HONO) by light-induced NO2 heterogeneous reactions with white wall paint. Environ. Sci. Pollut. Res. 2014, 21, 9259–9269. [Google Scholar] [CrossRef] [PubMed]
- Langridge, J.M.; Gustafsson, R.J.; Griffiths, P.T.; Cox, R.A.; Lambert, R.M.; Jones, R.L. Solar driven nitrous acid formation on building material surfaces containing titanium dioxide: A concern for air quality in urban areas? Atmos. Environ. 2009, 43, 5128–5131. [Google Scholar] [CrossRef]
- Ndour, M.; Conchon, P.; D’Anna, B.; Ka, O.; George, C. Photochemistry of mineral dust surface as a potential atmospheric renoxification process. Geophys. Res. Lett. 2009, 36, 1–4. [Google Scholar] [CrossRef]
- Mothes, F.; Böge, O.; Herrmann, H. A chamber study on the reactions of O3, NO, NO2 and selected VOCs with a photocatalytically active cementitious coating material. Environ. Sci. Pollut. Res. 2016, 23, 15250–15261. [Google Scholar] [CrossRef] [PubMed]
- Monge, M.E.; George, C.; D’Anna, B.; Doussin, J.-F.; Jammoul, A.; Wang, J.; Eyglunent, G.; Solignac, G.; Daële, V.; Mellouki, A. Ozone formation from illuminated titanium dioxide surfaces. J. Am. Chem. Soc. 2010, 132, 8234–8235. [Google Scholar] [CrossRef] [PubMed]
- Emeline, A.V.; Kuznetsov, V.N.; Ryabchuk, V.K.; Serpone, N. On the way to the creation of next generation photoactive materials. Environ. Sci. Pollut. Res. 2012, 19, 3666–3675. [Google Scholar] [CrossRef] [PubMed]
- Serpone, N.; Emeline, A.V. Semiconductor photocatalysis—Past, present, and future outlook. J. Phys. Chem. Lett. 2012, 3, 673–677. [Google Scholar] [CrossRef] [PubMed]
- Braslavsky, S.E.; Braun, A.M.; Cassano, A.E.; Emeline, A.V.; Litter, M.I.; Palmisano, L.; Parmon, V.N.; Serpone, N. Glossary of terms used in photocatalysis and radiation catalysis (IUPAC Recommendations 2011). Pure Appl. Chem. 2011, 83, 931–1014. [Google Scholar] [CrossRef] [Green Version]
- Emeline, A.V.; Panasuk, A.V.; Sheremetyeva, N.; Serpone, N. Mechanistic studies of the formation of different states of oxygen on irradiated ZrO2 and the photocatalytic nature of photoprocesses from determination of turnover numbers. J. Phys. Chem. B 2005, 109, 2785–2792. [Google Scholar] [CrossRef] [PubMed]
- Emeline, A.V.; Rudakova, A.V.; Ryabchuk, V.K.; Serpone, N. Photostimulated reactions at the surface of wide bandgap metal oxides {ZrO2 and TiO2}: Interdependence of rates of reactions on pressure- concentration and on light intensity. J. Phys. Chem. B 1998, 102, 10906–10916. [Google Scholar] [CrossRef]
- Emeline, A.V.; Ryabchuk, V.K.; Serpone, N. Factors affecting the efficiency of a photocatalyzed process in aqueous metal-oxide dispersions. Prospect for distinguishing between the two kinetic models. J. Photochem. Photobiol. A Chem. 2000, 133, 89–97. [Google Scholar] [CrossRef]
- Ollis, D.F. Kinetics of liquid phase photocatalyzed reactions: An illuminating approach. J. Phys. Chem. B 2005, 109, 2439–2444. [Google Scholar] [CrossRef] [PubMed]
- Mills, A.; Wang, J.; Ollis, D.F. Kinetics of liquid phase semiconductor photoassisted reactions: Supporting observations for a pseudo-steady-state model. J. Phys. Chem. B 2006, 110, 14386–14390. [Google Scholar] [CrossRef] [PubMed] [Green Version]
- Graetzel, M. (Ed.) Energy Resources through Photochemistry and Catalysis; Academic Press: New York, NY, USA, 1983; p. 573. [Google Scholar]
- Clayton, R.K. Photosynthesis: Physical mechanisms and chemical patterns. IUPAB Biophys. Ser. 1980, 4, 281. [Google Scholar]
- Braslavsky, S.E. Glossary of terms used in photochemistry. (IUPAC Recommendations 2006). Pure Appl. Chem. 2007, 79, 293–465. [Google Scholar] [CrossRef]
- Emeline, A.V.; Sheremetyeva, N.V.; Khomchenko, N.V.; Kuzmin, G.N.; Ryabchuk, V.K.; Teoh, W.Y.; Amal, R. Spectroscopic studies of pristine and fluorinated nano-ZrO2 in photostimulated heterogeneous processes. J. Phys. Chem. C 2009, 113, 4566–4583. [Google Scholar] [CrossRef]
- Serpone, N. Is the band gap of pristine TiO2 narrowed by anion- and cation-doping of titanium dioxide in second-generation photocatalysts? J. Phys. Chem. B 2006, 110, 24287–24293. [Google Scholar] [CrossRef] [PubMed]
- Serpone, N.; Emeline, A.V.; Kuznetsov, V.N.; Ryabchuk, V.K. Visible-light-active titania photocatalysts. The case of N-doped TiO2s—Properties and some fundamental issues. Int. J. Photoenergy 2008, 1, 1–19. [Google Scholar]
- Serpone, N.; Emeline, A.V. Modeling heterogeneous photocatalysis by metal-oxide nanostructured semiconductor and insulator materials; Factors that affect the activity and selectivity of photocatalysts. Res. Chem. Intermed. 2005, 31, 391–432. [Google Scholar] [CrossRef]
- Emeline, A.V.; Serpone, N. Spectral selectivity of photocatalyzed reactions on the surface of titanium dioxide nanoparticles. J. Phys. Chem. B 2002, 106, 12221–12226. [Google Scholar] [CrossRef]
- Emeline, A.V.; Zhang, X.; Jin, M.; Murokami, T.; Fujishima, A. Spectral dependences of the activity and selectivity of N-doped TiO2 in photodegradation of phenols. J. Photochem. Photobiol. A Chem. 2009, 207, 13–19. [Google Scholar] [CrossRef]
- Emeline, A.V.; Kuzmin, G.N.; Serpone, N. Quantum yields and their wavelength-dependence in the photoreduction of O2 and photooxidation of H2 on a visible-light-active N-doped TiO2 system. Chem. Phys. Lett. 2008, 454, 279–283. [Google Scholar] [CrossRef]
- Murakami, N.; Chiyoya, T.; Tsubota, T.; Ohno, T. Switching redox site of photocatalytic reaction on titanium(IV) oxide particles modified with transition-metal ion controlled by irradiation wavelength. Appl. Catal. A 2008, 348, 148–152. [Google Scholar] [CrossRef]
- Baye, E.; Murakami, N.; Ohno, T. Exposed crystal surface-controlled TiO2 nanorods having rutile phase from TiCl3 under hydrothermal conditions. J. Mol. Catal. A Chem. 2009, 300, 72–79. [Google Scholar] [CrossRef]
- Murakami, N.; Kurihara, Y.; Tsubota, T.; Ohno, T. Shape-controlled anatase titanium(IV) oxide particles prepared by hydrothermal treatment of peroxo titanic acid in the presence of polyvinyl alcohol. J. Phys. Chem. C 2009, 113, 3062–3069. [Google Scholar] [CrossRef]
- Baye, E.; Ohno, T. Exposed crystal surface-controlled rutile TiO2 nanorods prepared by hydrothermal treatment in the presence of poly(vinyl)pyrrolidone. Appl. Catal. B Environ. 2009, 91, 634–639. [Google Scholar] [CrossRef]
- Tachikawa, T.; Yamashita, S.; Majima, T. Evidence for crystal-face-dependent TiO2 photocatalysis from single-molecule imaging and kinetic analysis. J. Am. Chem. Soc. 2011, 133, 7197–7204. [Google Scholar] [CrossRef] [PubMed]
- Emeline, A.V.; Zhang, X.; Murakami, T.; Fujishima, A. Activity and selectivity of photocatalysts in photodegradation of phenols. J. Hazard. Mater. 2012, 211–212, 154–160. [Google Scholar] [CrossRef] [PubMed]
- Gerisher, H.; Heller, A. The role of oxygen in photooxidation of organic molecules on semiconductor particles. J. Phys. Chem. 1991, 95, 5261–5267. [Google Scholar] [CrossRef]
- Emeline, A.V.; Kataeva, G.V.; Panasuk, A.V.; Ryabchuk, V.K.; Sheremetyeva, N.; Serpone, N. Effect of surface photoreactions on the photocoloration of a wide band gap metal oxide: Probing whether surface reactions are photocatalytic. J. Phys. Chem. B 2005, 109, 5175–5185. [Google Scholar] [CrossRef] [PubMed]
- Terenin, A.N. Optical investigations of the adsorption of gas molecules. Uchenye Zapiski Leningrad. Gosudarst. Univ. Ser. Fiz. Nauk 1939, 5, 26–40. (In Russian) [Google Scholar]
- Terenin, A.N. Optical investigations of activated adsorption. Z. Fiz. Khim. 1940, 14, 1362–1369. (In Russian) [Google Scholar]
- Kasparov, K.Ya.; Terenin, A. Optical investigations of activated adsorption. I. Photodecomposition of NH3 adsorbed on catalysts. Acta Physicochim. USSR 1941, 15, 343–365. [Google Scholar]
- Terenin, A.N.; Sоlопitzyn, Y. Асtion of light on the gas adsorption by solids. Discuss. Faraday Soc. 1959, 28, 28–35. [Google Scholar] [CrossRef]
- Ashcroft, N.W.; Mermin, N.D. Solid State Physics; Holt, Rinehart and Winston: New York, NY, USA, 1976. [Google Scholar]
- Pankove, J.I. Optical Processes in Semiconductors; Dover Publications: New York, NY, USA, 1971. [Google Scholar]
- Stoneham, A.M. Theory of Defects in Solids; Clarendon Press: Oxford, UK, 1975. [Google Scholar]
- Henderson, B.; Werts, J.E. Defects in the Alkaline Earth Oxides; Taylor & Francis Ltd.: London, UK, 1977; p. 152. [Google Scholar]
- Kotomin, E.A.; Popov, A.I. Radiation-induced point defects in simple oxides. Nucl. Instrum. Methods Phys. Res. B 1998, 141, 1–15. [Google Scholar] [CrossRef]
- Popov, A.I.; Kotomin, E.A.; Maier, J. Basic properties of the F-type centers in halides, oxides and perovskites. Nucl. Instrum. Methods Phys. Res. B 2010, 268, 3084–3089. [Google Scholar] [CrossRef]
- Crawford, H.J. Recent developments in Al2O3 color-center research. Semicond. Insul. 1982, 5, 599–620. [Google Scholar]
- Seebauer, E.G.; Kratzer, M.C. Charged point defects in semiconductors. Mater. Sci. Eng. R 2006, 55, 57–149. [Google Scholar] [CrossRef]
- Schirmer, O.F. O– bound small polarons in oxide materials. J. Phys. Condens. Matter 2006, 18, R667–R704. [Google Scholar] [CrossRef]
- Schirmer, O.F. Holes bound as small polarons to acceptor defects in oxide materials: Why are their thermal ionization energies so high? J. Phys. Condens. Matter 2011, 23, 334218. [Google Scholar] [CrossRef] [PubMed]
- Dolgov, S.A.; Kärner, T.; Lushchik, A.; Maaroos, A.; Nakonechnyi, S.; Shablonin, E. Trapped hole centers in MgO single crystals. Phys. Solid State 2011, 53, 1244–1252. [Google Scholar] [CrossRef]
- Kuznetsov, V.N.; Emeline, A.V.; Glazkova, N.I.; Mikhaylov, R.V.; Serpone, N. Real-time in situ monitoring of optical absorption changes in visible-light-active TiO2 under light irradiation and temperature-programmed annealing. J. Phys. Chem. C 2014, 118, 27583–27593. [Google Scholar] [CrossRef]
- Kuznetsov, V.N.; Ryabchuk, V.K.; Emeline, A.V.; Mikhaylov, R.V.; Rudakova, A.V.; Serpone, N. Thermo- and photo-stimulated effects on the optical properties of rutile titania ceramic layers formed on titanium substrates. Chem. Mater. 2013, 25, 170–177. [Google Scholar] [CrossRef]
- Kuznetsov, V.N.; Glazkova, N.I.; Mikhaylov, R.V.; Serpone, N. Additional specific channel of photo-activation of solid semiconductors. A revisit of the thermo-/photo-stimulated bleaching of photo-induced Ti3+ color centers in visible-light-active photochromic rutile titania. J. Phys. Chem. C 2018, 122, 13294–13303. [Google Scholar] [CrossRef]
- Zecchina, A.; Lofthouse, M.G.; Stone, F.S. Reflectance spectra of surface states in magnesium oxide and calcium oxide. J. Chem. Soc. Faraday Trans. 1 Phys. Chem. Condens. Phases 1975, 71, 1476–1490. [Google Scholar] [CrossRef]
- Zecchina, A.; Stone, F.S. Reflectance spectra of surface states in strontium oxide and barium oxide. J. Chem. Soc. Faraday Trans. 1 Phys. Chem. Condens. Phases 1976, 72, 2364–2374. [Google Scholar] [CrossRef]
- Kristianpoller, N.; Rehavi, A.; Shmilevicha, A.; Weiss, D.; Chen, R. Radiation effects in pure and doped Al2O3 crystals. Nucl. Instrum. Methods Phys. Res. B 1998, 141, 343–346. [Google Scholar] [CrossRef]
- Kortov, V.S.; Vainshtein, I.A.; Vokhmintsev, A.S.; Gavrilov, N.V. Spectroscopic characteristics of anionic centers in α-Al2O3 crystals bombarded by Cu+ and Ti+. J. Appl. Spectrosc. 2008, 75, 452–455. [Google Scholar] [CrossRef]
- Izerrouken, M.; Benyahia, T. Absorption and photoluminescence study of Al2O3 single crystal irradiated with fast neutrons. Nucl. Instrum. Methods Phys. Res. B 2010, 268, 2987–2990. [Google Scholar] [CrossRef]
- Itou, M.; Fujiwara, A.; Uchino, T. Reversible photoinduced interconversion of color centers in α-Al2O3 prepared under vacuum. J. Phys. Chem. C 2009, 113, 20949–20957. [Google Scholar] [CrossRef]
- Emeline, A.V.; Kuzmin, G.N.; Purevdorj, D.; Ryabchuk, V.K.; Serpone, N. Spectral dependencies of the quantum yield of photochemical processes on the surface of wide band gap solids. 3. Gas/Solid systems. J. Phys. Chem. B 2000, 104, 2989–2999. [Google Scholar] [CrossRef]
- Kuznetsov, V.N.; Lisachenko, A.A. Spectral manifestation of wide-band oxide own defects in photo- stimulated surface reactions. Russ. J. Phys. Chem. 1991, 65, 1328–1334. [Google Scholar]
- Lisachenko, A. Photon-driven electron and atomic processes on solid-state surface in photoactivated spectroscopy and photocatalysis. J. Photochem. Photobiol. A Chem. 2008, 196, 127–137. [Google Scholar] [CrossRef]
- Zakharenko, V.S.; Cherkashin, A.E.; Volodin, A.M.; Keier, N.P. Spectral dependence of oxygen and carbon monoxide photoadsorption on rutile. React. Kinet. Catal. Lett. 1979, 10, 325–332. [Google Scholar] [CrossRef]
- Volodin, A.M.; Cherkashin, A.E.; Zakharenko, V.S. Influence of physically adsorbed oxygen on the separation of electron-hole pairs on anatase irradiated by visible light. React. Kinet. Catal. Lett. 1979, 11, 103–106. [Google Scholar] [CrossRef]
- Emeline, A.V.; Smirnova, L.G.; Kuzmin, G.N.; Basov, L.L.; Serpone, N. Spectral dependence of quantum yields in gas/solid heterogeneous photosystems. Influence of anatase/rutile content on the photo- stimulated adsorption of dioxygen and dihydrogen on titania. J. Photochem. Photobiol. A. Chem. 2002, 148, 99–104. [Google Scholar]
- Komaguchi, K.; Maruoka, T.; Nakano, H.; Imae, I.; Ooyama, Y.; Harima, Y. Electron-transfer reaction of oxygen species on TiO2 nanoparticles induced by sub-band-gap illumination. J. Phys. Chem. C 2010, 114, 1240–1245. [Google Scholar] [CrossRef]
- Kuznetsov, V.N.; Serpone, N. On the origin of the spectral bands in the visible absorption spectra of visible-light-active TiO2 specimens: Analysis and assignments. J. Phys. Chem. C 2009, 113, 15110–15123. [Google Scholar] [CrossRef]
- Artemiev, Y.M.; Ryabchuk, V.K. Introduction to Heterogeneous Photocatalysis (A Textbook); Saint Petersburg State University: Saint Petersburg, Russia, 1999. (In Russian) [Google Scholar]
- Siline, A.R.; Trukhin, A.N. Point Defects and Elementary Excitations in Crystalline and Non-Crystalline SiO2; Zinatne: Riga, Latvia, 1985. [Google Scholar]
- Ryvkin, S.M. Photoelectric Effects in Semiconductors; Consultants Bureau: New York, NY, USA, 1964. [Google Scholar]
- Delany, A.C.; Dickerson, R.R.; Melchior, F.L.; Wartburg, A.F. Modification of a commercial NOx detector for high sensitivity. Rev. Sci. Instrum. 1982, 12, 1899–1902. [Google Scholar] [CrossRef]
- Wolf, C.A.; Nieuwenhuys, B.E. The NO–H2 reaction over Pd(III). Surf. Sci. 2000, 469, 196–203. [Google Scholar] [CrossRef]
- Environmental Agency of Japan. Kankyo Hakusho; State of Environment in Japan: Tokyo, Japan, 1991. (In Japanese)
- Takeuchi, K.; Ibusuki, T. Heterogeneous Photochemical Reactions and Processes in the Troposphere. In Encyclopedia of Environmental Control Technology; Cheremisonoff, P.N., Ed.; Gulf Publishing: Houston, TX, USA, 1989; p. 279. [Google Scholar]
- Courbon, H.; Pichat, P. Room-temperature interaction of N18O with ultraviolet-illuminated titanium dioxide. J. Chem. Soc. Faraday Trans. 1 1984, 80, 3175–3185. [Google Scholar] [CrossRef]
- Hori, Y.; Nakatsu, A.; Suzuki, S. Heterogeneous photocatalytic oxidation of NO2 in aqueous suspension of various semiconductor powders. Chem. Lett. 1985, 14, 1429–1432. [Google Scholar] [CrossRef]
- Anpo, M.; Nomura, T.; Kitao, T.; Giamello, E.; Murphy, D.; Che, M.; Fox, M.A. Approach to de-NOx-ing photocatalysis. II. Excited state of copper ions supported on silica and photocatalytic activity for NO decomposition. Res. Chem. Intermed. 1991, 15, 225. [Google Scholar] [CrossRef]
- Anpo, M.; Matsuoka, M.; Hanou, K.; Mishima, H.; Yamashita, H.; Patterson, H.H. The relationship between the local structure of copper(I) ions on Cu+/zeolite catalysts and their photocatalytic reactivities for the decomposition of NOx into N2 and O2 at 275 K. Coord. Chem. Rev. 1998, 171, 175–184. [Google Scholar] [CrossRef]
- Anpo, M.; Ichihashi, Y.; Takeuchi, M.; Yamashita, H. Design of unique titanium dioxide photocatalysts by an advanced metal-ion implantation method and photocatalytic reactions under visible light irradiation. Res. Chem. lntermed. 1998, 24, 143–149. [Google Scholar] [CrossRef]
- Ibusuki, T.; Takeuchi, K. Removal of low concentration nitrogen oxides through photoassisted heterogeneous catalysis. J. Mol. Catal. 1994, 88, 93–102. [Google Scholar] [CrossRef]
- Negishi, N.; Takeuchi, K.; Ibusuki, T. Surface structure of the TiO2 thin film photocatalyst. J. Mater. Sci. 1998, 33, 5789–5794. [Google Scholar] [CrossRef]
- Kominami, H.; Matsuura, T.; Iwai, K.; Ohtani, B.; Nishimoto, S.; Kera, Y. Ultra-highly active titanium(IV) oxide photocatalyst prepared by hydrothermal crystallization from titanium(IV) alkoxide in organic solvents. Chem. Lett. 1995, 24, 693–694. [Google Scholar] [CrossRef]
- Kominami, H.; Kato, J.; Kohno, M.; Kera, Y.; Ohtani, B. Photocatalytic mineralization of acetic acid in aerated aqueous suspension of ultra-highly active titanium(IV) oxide prepared by hydrothermal crystallization in toluene. Chem. Lett. 1996, 25, 1051–1052. [Google Scholar] [CrossRef]
- Hashimoto, K.; Wasada, K.; Toukai, N.; Kominami, H.; Kera, Y. Photocatalytic oxidation of nitrogen monoxide over titanium(IV) oxide nanocrystals large size areas. J. Photochem. Photobiol. A Chem. 2000, 136, 103–109. [Google Scholar] [CrossRef]
- Lim, T.H.; Jeong, S.M.; Kim, S.D.; Gyenis, J. Photocatalytic decomposition of NO by TiO2 particles. J. Photochem. Photobiol. A Chem. 2000, 134, 209–217. [Google Scholar] [CrossRef]
- Nakamura, I.; Negishi, N.; Kutsuna, S.; Ihara, T.; Sugihara, S.; Takeuchi, K. Role of oxygen vacancy in the plasma-treated TiO2 photocatalyst with visible light activity for NO removal. J. Mol. Catal. A Chem. 2000, 161, 205–212. [Google Scholar] [CrossRef]
- Zhang, J.; Ayusawa, T.; Minagawa, M.; Kinugawa, K.; Yamashita, H.; Matsuoka, M.; Anpo, M. Investigations of TiO2 photocatalysts for the decomposition of NO in the flow system: The role of pretreatment and reaction conditions in the photocatalytic efficiency. J. Catal. 2001, 198, 1–8. [Google Scholar] [CrossRef]
- Tanaka, T.; Teramura, K.; Arakaki, K.; Funabiki, T. Photoassisted NO reduction with NH3 over TiO2 photocatalyst. Chem. Commun. 2002, 22, 2742–2743. [Google Scholar] [CrossRef]
- Dalton, J.S.; Janes, P.A.; Jones, N.G.; Nicholson, J.A.; Hallam, K.R.; Allen, G.C. Photocatalytic oxidation of NOx gases using TiO2: A surface spectroscopic approach. Environ. Pollut. 2002, 120, 415–422. [Google Scholar] [CrossRef]
- Devahasdin, S.; Fan, C., Jr.; Li, K.; Chen, D.H. TiO2 photocatalytic oxidation of nitric oxide: Transient behavior and reaction kinetics. J. Photochem. Photobiol. A Chem. 2003, 156, 161–170. [Google Scholar] [CrossRef]
- Toma, F.L.; Bertrand, G.; Klein, D.; Coddet, C. Photocatalytic removal of nitrogen oxides via titanium dioxide. Environ. Chem. Lett. 2004, 2, 117–121. [Google Scholar] [CrossRef]
- Bowering, N.; Walker, G.S.; Harrison, P.G. Photocatalytic decomposition and reduction reactions of nitric oxide over Degussa P25. Appl. Catal. B Environ. 2006, 62, 208–216. [Google Scholar] [CrossRef]
- Roy, S.; Hegde, M.S.; Ravishankar, N.; Madras, G. Creation of redox adsorption sites by Pd2+ ion substitution in nano-TiO2 for high photocatalytic activity of CO oxidation, NO reduction, and NO decomposition. J. Phys. Chem. C 2007, 111, 8153–8160. [Google Scholar] [CrossRef]
- Yin, S.; Liu, B.; Zhang, P.; Morikawa, T.; Yamanaka, K.-I.; Sato, T. Photocatalytic oxidation of NOx under visible LED light irradiation over nitrogen-doped titania particles with iron or platinum loading. J. Phys. Chem. C 2008, 112, 12425–12431. [Google Scholar] [CrossRef]
- Roy, S.; Hegde, M.S.; Madras, G. Catalysis for NOx abatement. Appl. Energy 2009, 86, 2283–2297. [Google Scholar] [CrossRef]
- Skalska, K.; Miller, J.S.; Ledakowicz, S. Trends in NOx abatement: A review. Sci. Total Environ. 2010, 408, 3976–3989. [Google Scholar] [CrossRef] [PubMed]
- Heo, I.; Kim, M.K.; Sung, S.; Nam, I.-S.; Cho, B.K.; Olson, K.L.; Li, W. Combination of photocatalysis and HC/SCR for improved activity and durability of deNOx catalysts. Environ. Sci. Technol. 2013, 47, 3657–3664. [Google Scholar] [CrossRef] [PubMed]
- International Energy Agency. 2016 Energy and Air Pollution; World Energy Outlook Special Report: Paris, France, 2016. [Google Scholar]
- Nitrogen Oxides (NOx), Why and How They Are Controlled; Technical Bulletin; Report EPA-456/F-99-006R; United States Environmental Protection Agency: Research Triangle Park, NC, USA, 1999.
- Fujishima, A.; Zhang, X.; Tryk, D.A. TiO2 photocatalysis and related surface phenomena. Surf. Sci. Rep. 2008, 63, 515–582. [Google Scholar] [CrossRef]
- Hanus, M.J.; Harris, A.T. Nanotechnology innovations for the construction industry. Prog. Mater. Sci. 2013, 58, 1056–1102. [Google Scholar] [CrossRef]
- Fresno, F.; Portela, R.; Suarez, S.; Coronado, J.M. Photocatalytic materials: Recent achievements and near future trends. J. Mater. Chem. A 2014, 2, 2863–2884. [Google Scholar] [CrossRef]
- Church of 2000/Richard Meier & Partners. Available online: https://www.archdaily.com/20105/church-of-2000-richard-meier (accessed on 12 October 2018).
- Borgarello, E. TX Active® Principio Attivo Fotocatalitico—APPROFONDIMENTO TECNICO; Italcementi, Italcementi Group: Bergamo, Italy, October 2009; Available online: https://www.construction21.org/italia/data/sources/users/62/txactiveapprofondimentoottobre2009ita.pdf (accessed on 12 October 2018).
- Murata, Y.; Kamitami, K.; Takeuchi, K. Air purifying blocks based on photocatalysis. In Proceedings of the JIPEA World Congress, Tokyo, Japan, 17–21 September 2000. [Google Scholar]
- Guerrini, G.L.; Peccati, E. TUNNEL “UMBERTO I” IN ROME Monitoring Program Results; Report No. 24; CTG-Italcementi Group: Bergamo, Italy, 22 April 2008; Available online: http://www.tiocem.pl/files/references/TX_Active_Tunnel_Umberto_I_ENG.pdf (accessed on 28 September 2018).
- Guerini, G.L. Case Study: The Italcementi TX Active® Story. Cristal Global Conference, London, UK, 17 November 2011. Available online: http://www.cristalactiv.com/uploads/speaker/Case_Study_The_Italcementi_TX_ Active_Story_Gian_Luca_Guerrini.pdf (accessed on 12 October 2018).
- Martinez, T.; Bertron, A.; Ringot, E.; Escadeillas, G. Degradation of NO using photocatalytic coatings applied to different substrates. Build. Environ. 2011, 46, 1808–1816. [Google Scholar] [CrossRef]
- Staub de Melo, J.V.; Trichês, G. Evaluation of the influence of environmental conditions on the efficiency of photocatalytic coatings in the degradation of nitrogen oxides (NOx). Build. Environ. 2012, 49, 117–123. [Google Scholar] [CrossRef]
- Ifang, S.; Gallus, M.; Liedtke, S.; Kurtenbach, R.; Wiesen, P.; Kleffmann, J. Standardization methods for testing photocatalytic air remediation materials: Problems and solution. Atmos. Environ. 2014, 91, 154–161. [Google Scholar] [CrossRef]
- Zouzelka, R.; Rathousky, J. Photocatalytic abatement of NOx pollutants in the air using commercial functional coating with porous morphology. Appl. Catal. B Environ. 2017, 217, 466–476. [Google Scholar] [CrossRef]
- Macphee, D.E.; Folli, A. Photocatalytic concretes—The interface between photocatalysis and cement chemistry. Cem. Concr. Res. 2016, 85, 48–54. [Google Scholar] [CrossRef]
- Horgnies, M.; Dubois-Brugger, I.; Gartner, E.M. NOx de-pollution by hardened concrete and the influence of activated charcoal additions. Cem. Concr. Res. 2012, 42, 1348–1355. [Google Scholar] [CrossRef]
- Bloh, J.Z.; Folli, A.; Macphee, D.E. Photocatalytic NOx abatement: Why the selectivity matters. RSC Adv. 2014, 4, 45726–45734. [Google Scholar] [CrossRef]
- Yang, L.; Hakki, A.; Wang, F.; Macphee, D.E. Photocatalyst efficiencies in concrete technology: The effect of photocatalyst placement. Appl. Catal. B Environ. 2018, 222, 200–208. [Google Scholar] [CrossRef]
- Erme, K.; Raud, J.; Jogi, I. Adsorption of nitrogen oxides on TiO2 surface as a function of NO2 and N2O5 fraction in the gas phase. Langmuir 2018, 34, 6338–6345. [Google Scholar] [CrossRef] [PubMed]
- Official Presentation—Innovative Façade Coatings with De-soiling and De-polluting Properties. In The PICADA Project—Photocatalytic Innovative Coverings Applications for Depollution Assessment; EC Project No. GRD1-2001-40449; GTM Construction: Nanterre, France, 2006.
- Boonen, E.; Beeldens, A. Recent photocatalytic applications for air purification in Belgium. Coatings 2005, 4, 553–573. [Google Scholar] [CrossRef]
- Maggos, T.; Plassais, A.; Bartzis, J.G. Photocatalytic degradation of NOx in a pilot street canyon configuration using TiO2-mortar panels. Environ. Monit. Assess. 2008, 136, 35–44. [Google Scholar] [CrossRef] [PubMed]
- Guerrini, G.L.; Peccati, E. Photocatalytic cementitious roads for de-pollution. In Proceedings of the RILEM International Symposium on Photocatalysis ‘Environment and Construction Materials’, Florence, Italy, 8–9 October 2007; pp. 179–186. [Google Scholar]
- Guerrini, G.L. Photocatalytic performances in a city tunnel in Rome: NOx monitoring results. Constr. Build. Mater. 2012, 27, 165–175. [Google Scholar] [CrossRef]
- Cassar, L. Photocatalysis of cementitious materials: Clean buildings and clean air. MRS Bull. 2004, 29, 328–331. [Google Scholar] [CrossRef]
- Cassar, L.; Pepe, C.; Tognon, G.; Guerrini, G.L.; Amadelli, R. White cement for architectural concrete possessing photocatalytic properties. In Proceedings of the 11th International Congress on the Chemistry of Cement, Durban, South Africa, 11–16 May 2003; Volume 4, p. 12. [Google Scholar]
- Guerrini, G.L.; Plassais, A.; Pepe, C.; Cassar, L. Use of photocatalytic cementitious materials for self-cleaning applications. In Proceedings of the RILEM International Symposium on Photocatalysis ‘Environment and Construction Materials’, Florence, Italy, 8–9 October 2007; pp. 219–226. [Google Scholar]
- Guerrini, G.L.; Corazza, F. White cement and photocatalysis Part 1: Fundamentals. In Proceedings of the First Arab International Conference and Exhibition on The Uses of White Cement, Cairo, Egypt, 28–30 April 2008; Available online: https://www.researchgate.net/publication/266358310_WHITE_CEMENT_AND_PHOTOCATALYSIS_PART_1_FUNDAMENTALS (accessed on 29 September 2018).
- NOx Gas. Available online: http://www.airlite.com/air-quality/nox-gas/ (accessed on 28 September 2018).
- Borgarello, E.; Harris, R.; Serpone, N. Photochemical deposition and photorecovery of gold using semiconductor dispersions. A practical application. Nouv. J. Chim. 1985, 9, 743–747. [Google Scholar]
- Borgarello, E.; Terzian, R.; Serpone, N.; Pelizzetti, E.; Barbeni, M. Photocatalyzed transformation of cyanide to thio-cyanate by rhodium-loaded cadmium sulfide in alkaline aqueous sulfide media. Inorg. Chem. 1986, 25, 2135–2137. [Google Scholar] [CrossRef]
- Borgarello, E.; Serpone, N.; Emo, G.; Harris, R.; Pelizzetti, E.; Minero, C. Light-induced reduction of Rh(III) and Pd(II) on TiO2 dispersions, and the selective photochemical separation and recovery of Au(III), Pt(IV), and Rh(III) from dilute solutions. Inorg. Chem. 1986, 25, 4499–4503. [Google Scholar] [CrossRef]
- Serpone, N.; Borgarello, E.; Barbeni, M.; Pelizzetti, E.; Pichat, P.; Herrmann, J.-M.; Fox, M.A. Photo-chemical reduction of gold(III) on semiconductor dispersions of TiO2 in the presence of cyanide ions: Disposal of CN− with H2O2. J. Photochem. 1987, 36, 373–388. [Google Scholar] [CrossRef]
- Serpone, N.; Ah-You, Y.K.; Tran, T.P.; Harris, R.; Pelizzetti, E.; Hidaka, H. AM1 simulated sunlight photoreduction and elimination of Hg(II) and CH3Hg(II) chloride salts from aqueous suspensions of titanium dioxide. Sol. Energy 1987, 39, 491–498. [Google Scholar] [CrossRef]
- PICADA PROJECT—Performance Process Protocol, Workpackage 7 January 2006. Available online: http://www.picada-project.com/domino/SitePicada/Picada.nsf/1f9d19927a32e752c12569ab002c7ff8/50905a4f28b6ae58c12571320033f015/$FILE/D20.pdf (accessed on 18 September 2018).
- Gurol, M.D. Photocatalytic Construction Materials and Reduction in Air Pollutants, San Diego State University, San Diego, CA, USA, March 2006. Available online: https://www.csus.edu/calst/FRFP/PHOTO-CATALYTIC.pdf (accessed on 18 September 2018).
- Maggos, Th.; Kotzias, D.; Bartzis, J.G.; Leva, P.; Bellintani, A.; Vasilakos, C. Investigations of TiO2-containing construction materials for the decomposition of NOx in environmental chambers. In Proceedings of the 5th International Conference on Urban Air Quality, Valencia, Spain, 29–31 March 2005. [Google Scholar]
- The 2010 Report Dutch Air Quality Innovation Programme Concluded. Available online: https://laqm.defra.gov.uk/documents/Dutch_Air_Quality_Innovation_Programme.pdf (accessed on 29 September 2018).
- Jacobi, S. NO2-Reduzierung Durch Photokatalytisch Wirksame Oberflächen? Modellversuch Fulda, (Hesse, Germany) 2012. Available online: https://www.hlnug.de/fileadmin/dokumente/das_hlug/jahresbericht/2012/jb2012_059-066_I2_Jacobi_final.pdf (accessed on 30 September 2018).
- Photocatalytic Titanium Dioxide—A Demonstrated and Proven Technology (Cristal ACTiv™), Cristal Global, London, UK. Available online: http://www.cristalactiv.com/uploads/case/casePhotocatalysis%20-%20English.pdf (accessed on 1 October 2018).
- Burton, A. Titanium dioxide photocleans polluted air. Environ. Health Perspect. 2012, 120, A229. [Google Scholar] [CrossRef] [PubMed]
- Laufs, S.; Burgeth, G.; Duttlinger, W.; Kurtenbach, R.; Maban, M.; Thomas, C.; Wiesen, P.; Kleffmann, J. Conversion of nitrogen oxides on commercial photocatalytic dispersion paints. Atmos. Environ. 2010, 44, 2341–2349. [Google Scholar] [CrossRef]
- Ballari, M.M.; Brouwers, H.J.H. Full scale demonstration of air-purifying pavement. J. Hazard. Mater. 2013, 254–255, 406–414. [Google Scholar] [CrossRef] [PubMed]
- Boonen, E.; Akylas, V.; Barmpas, F.; Boreave, A.; Bottalico, L.; Cazaunau, M.; Chen, H.; Daele, V.; De Marco, T.; Doussin, J.F.; et al. Construction of a photo- catalytic de-polluting field site in the Leopold II tunnel in Brussels. J. Environ. Manag. 2015, 155, 136–144. [Google Scholar] [CrossRef] [PubMed]
- Fraunhofer. Clean Air by Airclean®. 2010. Available online: http://www.ime.fraunhofer.de/content/dam/ime/de/documents/AOe/2009_2010_Saubere%20Luft%20durch%20 Pflastersteine_s.pdf (accessed on 11 May 2015).
- Tera. In Situ Study of the Air Pollution Mitigating Properties of Photocatalytic Coating, Tera Environement, (Contract Number 0941C0978), Report for ADEME and Rhone-Alpe region, France. Available online: http://www.air-rhonealpes.fr/site/media/telecharger/651413 (accessed on 11 May 2015).
- Gustafsson, R.J.; Orlov, A.; Griffiths, P.T.; Cox, R.A.; Lambert, R.M. Reduction of NO2 to nitrous acid on illuminated titanium dioxide aerosol surfaces: Implications for photocatalysis and atmospheric chemistry. Chem. Commun. 2006, 3936–3938. [Google Scholar] [CrossRef] [PubMed]
- Ndour, M.; D’Anna, B.; George, C.; Ka, O.; Balkanski, Y.; Kleffmann, J.; Stemmler, K.; Ammann, M. Photoenhanced uptake of NO2 on mineral dust: Laboratory experiments and model simulations. Geophys. Res. Lett. 2008, 35, L05812. [Google Scholar] [CrossRef]
- Beaumont, S.K.; Gustafsson, R.J.; Lambert, R.M. Heterogeneous photochemistry relevant to the troposphere: H2O2 production during the photochemical reduction of NO2 to HONO on UV-illuminated TiO2 surfaces. Chem. Phys. Chem. 2009, 10, 331–333. [Google Scholar] [CrossRef] [PubMed]
- Monge, M.E.; D’Anna, B.; George, C. Nitrogen dioxide removal and nitrous acid formation on titanium oxide surfaces—An air quality remediation process? Phys. Chem. Chem. Phys. 2010, 12, 8991–8998. [Google Scholar] [CrossRef] [PubMed]
- Mothes, F.; Herrmann, H. Lab and field studies on photocatalysis to improve urban air quality—Results from the PhotoPAQ project. In Proceedings of the Life MINOx-STREET Project Ending Meeting: Results and Conclusions, CIEMAT, Madrid, Spain, 21 March 2018. [Google Scholar]
- Flassak, T. Numerical simulation of the depollution effectiveness of photocatalytic coverings in street canyons. In Proceedings of the Photocatalysis: Science and Application for Urban Air Quality, The 2012 LIFE+ PhotoPaq Conference, Proticcio, Island of Corsica, France, 14–17 May 2012. [Google Scholar]
- Bolte, G.; Flassak, T. Numerische simulation der wirksamkeit photokatalytisch aktiver betonoberflächen. In Proceedings of the Internationale Baustofftagung 18, Ibausil (Proceedings), Bauhaus-University Weimar, Weimar, Germany, 12–15 September 2012; Fischer, H.-B., Bode, K.-A., Beuthan, C., Eds.; Bauhaus-University Weimar: Weimar, Germany, 2012. [Google Scholar]
- Pujadas, M.; Palacios, M.; Nunez, L.; German, M.; Fernandez-Pampillon, J.; Iglesias, J.D.; Santiago, J.L. Real scale demonstration of the depolluting capabilities of a photocatalytic pavement in a real urban area. In Proceedings of the 17th International Conference on Harmonization within Atmospheric Dispersion Modeling for Regulatory Purposes, Budapest, Hungary, 9–12 May 2016. [Google Scholar]
- Pujadas, M.; Palacios, M.; Nunez, L.; German, M.; Fernandez-Pampillon, J.; Sanchez, B.; Santiago, J.L.; Sanchez, B.; Munos, R.; Moral, F.; et al. Real scale tests of the depolluting capabilities of a photocatalytic sidewalk pavement and a façade in an urban scenario. In Proceedings of the 18th International Conference on Harmonization within Atmospheric Dispersion Modelling for Regulatory Purposes, Bologna, Italy, 9–12 October 2017. [Google Scholar]
- Palacios, M.; Pujadas, M.; Nunez, L.; Sanchez, B.S.; Santiago, J.L.; Martilli, A.; Suarez, S.; Cabrero, B.S. Monitoring and modeling NOx removal efficiency of photocatalytic materials: A strategy for urban air quality management. In Proceedings of the Life-Platform Meeting on Air, Barcelona, Spain, 26–27 September 2017. [Google Scholar]
- Pujadas, M.; Palacios, M.; Nunez, L.; Fernandez-Pampillon, J.; German, M. Characterization of the NOx depolluting effect of photocatalytic materials in a medium-scale tunnel reactor. In Proceedings of the Air Quality Meeting, Barcelona, Spain, 12–16 March 2018. [Google Scholar]
- Wang, H.; Wu, Z.; Zhao, W.; Guan, B. Photocatalytic oxidation of nitrogen oxides using TiO2 loading on woven glass fabric. Chemosphere 2007, 66, 185–190. [Google Scholar] [CrossRef] [PubMed]
- Anpo, M.; Zhang, S.G.; Mishima, H.; Matsuoka, M.; Yamashita, H. Design of photocatalyst encapsulated within the zeolite framework and cavities for the decomposition of NO into N2 and O2 at normal temperature. Catal. Today 1997, 39, 159–168. [Google Scholar] [CrossRef]
- Anpo, M.; Takeuchi, M.; Ikeue, K.; Dohshi, S. Design and development of titanium oxide photocatalysts operating under visible and UV light irradiation: The applications of metal ion-implantation techniques to semiconducting TiO2 and Ti/zeolite catalysts. Curr. Opin. Solid State Mater. Sci. 2002, 6, 381–388. [Google Scholar] [CrossRef]
- Yamashita, H.; Ichihashi, Y.; Zhang, S.G.; Matsumura, Y.; Souma, Y.; Tatsumi, T.; Anpo, M. Photocatalytic decomposition of NO at 275 K on titanium oxide catalysts anchored within zeolite cavities and framework. Appl. Surf. Sci. 1997, 121, 305–309. [Google Scholar] [CrossRef]
- Wu, Q.; van de Krol, R. Selective photoreduction of nitric oxide to nitrogen by nanostructured TiO2 photocatalysts: Role of oxygen vacancies and iron dopant. J. Am. Chem. Soc. 2012, 134, 9369–9375. [Google Scholar] [CrossRef] [PubMed]
- Hu, Y.; Martra, G.; Zhang, J.; Higashimoto, S.; Coluccia, S.; Anpo, M. Characterization of the local structures of Ti-MCM-41 and their photocatalytic reactivity for the decomposition of NO into N2 and O2. J. Phys. Chem. B 2006, 110, 1680–1685. [Google Scholar] [CrossRef] [PubMed]
- Cao, Y.; Yu, M.; Qi, S.; Ren, Z.; Yan, S.; Hu, S.; Xu, M. Nitric oxide reaction pathways on rutile TiO2(110): The influence of surface defects and reconstructions. J. Phys. Chem. C 2018. [Google Scholar] [CrossRef]
- Kuznetsov, V.N.; Glazkova, N.I.; Mikhaylov, R.V.; Kozhevina, A.V.; Serpone, N. Photophysics of color centers in visible-light-active rutile titania. Evidence of the photoformation and trapping of charge carriers from advanced diffuse reflectance spectroscopy and mass spectrometry. Catal. Today 2018. [Google Scholar] [CrossRef]
- Déak, P.; Aradi, B.; Frauenheim, T. Quantitative theory of the oxygen vacancy and carrier self-trapping in bulk TiO2. Phys. Rev. B 2012, 86, 195206. [Google Scholar] [CrossRef]
- Cotton, F.A.; Wilkinson, G. Advanced Inorganic Chemistry, 5th ed.; John Wiley & Sons: New York, NY, USA, 1988. [Google Scholar]
- Iwamoto, M.; Furukawa, H.; Mine, Y.; Uemura, F.; Mikuriya, S.-I.; Kagawa, S. Copper(II) ion-exchanged ZSM-5 zeolites as highly active catalysts for direct and continuous decomposition of nitrogen monoxide. J. Chem. Soc. Chem. Commun. 1986, 1272–1273. [Google Scholar] [CrossRef]
- Chiu, K.W.; Savage, P.D.; Wilkinson, G.; Williams, D.J. Nitrosation of alkenes by nitric oxide: Crystal structures of bis-(1-nitroso-2-nitro-cyclohexane) and bis-(1-nitroso-2-nitro-1-phenylethane). Polyhedron 1985, 4, 1941–1945. [Google Scholar] [CrossRef]
- Greenwood, N.N.; Earnshaw, A. Chemistry of the Elements, 2nd ed.; Butterworth-Heinemann: Oxford, UK, 1997. [Google Scholar]
- Thiemann, M.; Scheibler, E.; Wiegand, K.W. Nitric Acid, Nitrous Acid, and Nitrogen Oxides. In Ullmann’s Encyclopedia of Industrial Chemistry; Wiley-VCH: Weinheim, Germany, 2005. [Google Scholar]
- Finlayson-Pitts, B.J.; Wingen, L.M.; Sumner, A.L.; Syomin, D.; Ramazan, K.A. The heterogeneous hydrolysis of NO2 in laboratory systems and in outdoor and indoor atmospheres: An integrated mechanism. Phys. Chem. Chem. Phys. 2003, 5, 223–242. [Google Scholar] [CrossRef]
- Sivachandrian, L.; Thevenet, F.; Gravejat, P.; Rousseau, A. Investigation of NO and NO2 adsorption mechanisms on TiO2 at room temperature. Appl. Catal. B Environ. 2013, 142–143, 196–204. [Google Scholar] [CrossRef]
- Haubrich, J.; Quiller, R.G.; Benz, L.; Liu, Z.; Friend, C.M. In Situ ambient pressure studies of the chemistry of NO2 and water on rutile TiO2(110). Langmuir 2010, 26, 2445–2451. [Google Scholar] [CrossRef] [PubMed]
Figure 1.
Graphic illustrating the natural and anthropogenic sources of atmospheric pollution together with primary and secondary atmospheric pollutants from various sources that ultimately lead to the formation of acid rain.
Figure 1.
Graphic illustrating the natural and anthropogenic sources of atmospheric pollution together with primary and secondary atmospheric pollutants from various sources that ultimately lead to the formation of acid rain.

Figure 2.
(a) Percent emission of NOx agents from various sources for 2011 in the European Union (Source: European Union emission inventory report 1990–2011 under the UNECE Convention on Long-range Trans-boundary Air Pollution (LRTAP)). Reproduced from Ref. [4]. (b) Percent emission of NOx agents for 2005 in the United States (Source: U.S. Environmental Protection Agency, Air Emission Sources, 4 November 2009). Reproduced from Ref. [5].

Figure 3.
Photochemical smog appearing in the Greater Los Angeles area, USA. (Source: United States Geological Survey); see, e.g., https://serc.carleton.edu/eet/aura/case_study.html (accessed 10 November 2018).
Figure 3.
Photochemical smog appearing in the Greater Los Angeles area, USA. (Source: United States Geological Survey); see, e.g., https://serc.carleton.edu/eet/aura/case_study.html (accessed 10 November 2018).

Figure 4.
Photochemical smog appearing on January 2016 in Beijing, China. Reproduced from https://i1.wp.com/dnnsociety.org/wp-content/uploads/2016/01/beijing.jpg?resize=845%2C450&ssl=1 (accessed 10 November 2018).
Figure 4.
Photochemical smog appearing on January 2016 in Beijing, China. Reproduced from https://i1.wp.com/dnnsociety.org/wp-content/uploads/2016/01/beijing.jpg?resize=845%2C450&ssl=1 (accessed 10 November 2018).

Figure 5.
The four pillars that have had a great impact on the development of heterogeneous photocatalysis.
Figure 5.
The four pillars that have had a great impact on the development of heterogeneous photocatalysis.

Figure 6.
Dependence of the apparent constants k and KL on light intensity for the photostimulated adsorption of oxygen on ZrO2. Reproduced with permission from Emeline et al. [31]; Copyright 1998 by the American Chemical Society.
Figure 6.
Dependence of the apparent constants k and KL on light intensity for the photostimulated adsorption of oxygen on ZrO2. Reproduced with permission from Emeline et al. [31]; Copyright 1998 by the American Chemical Society.

Figure 7.
Dependence of the apparent constants k and KL on light intensity for the photodegradation of phenol over TiO2. Reproduced with permission from Emeline et al. [32]. Copyright 2000 by Elsevier B.V. (License No. 4452260016035).
Figure 7.
Dependence of the apparent constants k and KL on light intensity for the photodegradation of phenol over TiO2. Reproduced with permission from Emeline et al. [32]. Copyright 2000 by Elsevier B.V. (License No. 4452260016035).

Figure 8.
Correlation between activities of six tested TiO2 photocatalysts in the photodegradation of 4-chlorophenol and their selectivity toward formation of hydroquinone. Reproduced with permission from Emeline et al. [50]. Copyright 2011 by Elsevier B.V. (License No.: 4452260940331).
Figure 8.
Correlation between activities of six tested TiO2 photocatalysts in the photodegradation of 4-chlorophenol and their selectivity toward formation of hydroquinone. Reproduced with permission from Emeline et al. [50]. Copyright 2011 by Elsevier B.V. (License No.: 4452260940331).

Figure 9.
Schematic illustration of a photocatalytic semiconductor nanoparticulate system in converting light energy into a solar fuel (H2) from the water splitting process.
Figure 9.
Schematic illustration of a photocatalytic semiconductor nanoparticulate system in converting light energy into a solar fuel (H2) from the water splitting process.

Figure 10.
Ball and stick representation of the local atomic relaxations around the oxygen vacancy in ZnO in the (0), (1+), and (2+) charged states. Reproduced with permission from Seebauer and Kratzer [64]. Copyright 2007 by Elsevier B.V. (License No.: 4452270159193).
Figure 10.
Ball and stick representation of the local atomic relaxations around the oxygen vacancy in ZnO in the (0), (1+), and (2+) charged states. Reproduced with permission from Seebauer and Kratzer [64]. Copyright 2007 by Elsevier B.V. (License No.: 4452270159193).

Figure 11.
Illustration of the relative positions of the energy levels of: (a) F° centers; and (b) hole traps and electron traps (e.g., Ti3+ centers) within the band gap of VLA TiO2 rutile. The scheme represents a simplistic description of the formation of charge carriers via the intrinsic absorption at 3.05 eV and absorption in the band at 2.33 eV. For simplicity, only three electron and three-hole traps are shown in (b). The blue arrows in (b) indicate the thermostimulated release of photoholes, while the red arrows indicate the recombination of holes in the valence band with electron Ti3+ centers; Reproduced with permission from Kuznetsov et al. [68]. Copyright 2014 by the American Chemical Society.

Figure 12.
Spectral dependencies of the quantum yields of photostimulated adsorption of O2 on the surface of TiO2 specimens: Degussa P25 pre-treated at 600 K (Curve 1) and at 850 K (Curve 1a) [82], rutile (Aldrich) pretreated at 600 K (Curve 2) [82], rutile pretreated at 820 K (Curve 3) [80]. Spectral dependence of the photogeneration of O2−• species at 77 K on the surface of rutile reduced by a H2 heat treatment at 773 K (Curve 4) [81].

Figure 13.
Spectral dependencies of the quantum yields of photostimulated adsorption of H2 (Curves 1, 1a, 2, and 3) and CH4 (Curve 4) on the surface of TiO2 specimens: Degussa P25 pre-treated at 600 K (Curve 1) and at 850 K (Curve 1a) [82], rutile (Aldrich) pre-treated at 600 K (Curve 2) [82], rutile (Curves 3 and 4) [77]. Spectral dependence of the efficiency of photogeneration of a hole species [O–O2] at 77 K on the surface of anatase pretreated at 800 K (Curve 5) [81].

Figure 14.
Schemes illustrating the processes of: recombination (a); and trapping (b) of photocarriers and events leading to discharge of the defect (for distinctness for defect with captured electron): Step 1: band-to-band optical transition with “hot” electron and “hot” hole generation, where the corresponding initial levels of excited electron and hole lay above the “bottom” of conduction band (Ec) and below the “selling” of the valence band (Ev); Steps 2 and 2′: thermal relaxation of hot carriers; Steps 3 and 3′: radiative and nonradiative band-to-band recombination; Steps 4 and 4′: radiative and nonradiative recombination via defects; Steps 5 and 5’: trapping of carriers with formation of color centers; and Steps 6 and 6′: trapping and de-trapping of carriers by shallow traps (for further details, see text). (c) various stages I, II, and III regarding recombination, thermal ipomnization and photoionization, respectively. Adapted from Artemiev and Ryabchuk [85].

Figure 15.
Schematic diagram of the flow-type reactor used for the heterogeneous photocatalytic reductions of NOx agents. Experimental conditions: 1–2 ppm NO/NO2; flow rate, 500 mL min−1 for 5–10 h at different relative humidity (dry to 72%); reactor volume, 126 mL; pure O2 or purified air; reaction temperature, ca. 310 K. Reproduced with permission from Ibusuki and Takeuchi [97]. Copyright 1994 by Elsevier B.V. (License No.: 4452271448487).

Figure 16.
Schematic diagram of the annular flow-type photoreactor composed of two quartz glass tubes (height, 500 mm; diameters, 12 mm and 20 mm). Reproduced with permission from Lim and coworkers [102]. Copyright 2000 by Elsevier Science S.A. (License No.: 4452641174439).
Figure 16.
Schematic diagram of the annular flow-type photoreactor composed of two quartz glass tubes (height, 500 mm; diameters, 12 mm and 20 mm). Reproduced with permission from Lim and coworkers [102]. Copyright 2000 by Elsevier Science S.A. (License No.: 4452641174439).

Figure 17.
Modified two-dimensional fluidized-bed photoreactor. Reproduced with permission from Lim and coworkers [102]. Copyright 2000 by Elsevier Science S.A. (License No.: 4452641174439).
Figure 17.
Modified two-dimensional fluidized-bed photoreactor. Reproduced with permission from Lim and coworkers [102]. Copyright 2000 by Elsevier Science S.A. (License No.: 4452641174439).

Figure 18.
Proposed band structure model for the anatase TiO2 with oxygen vacancies.

Figure 19.
(a) Flow system for the photocatalytic reaction of NOx. Conditions: 150 mg TiO2; NO reactant gas (NO + He), 10 ppm; flow rate, 100 mL min−1; irradiation time, 2 h; Toshiba SHL-100UV high-pressure Hg lamp; color filter, UV-27 (λ > 270 nm). (b) Conversion of the photocatalytic decomposition of NO on the standard reference TiO2 photocatalysts at room temperature; adapted from Ref. [104]. Reproduced with permission from Zhang et al. [104]. Copyright 2001 by Academic Press (License No.: 4452650162755).

Figure 20.
Outlet concentration of N2 and N2O in the SCR of NO with ammonia at 323 K under irradiation. Conditions: TiO2 loading, 1.2 g; volume of catalyst bed, 1.5 mL; irradiation, 300-W ultra-high pressure Xe lamp reflection by a cold mirror; composition of reaction gas, 1000 ppm NO + 5% O2, and balance was Ar gas; flow rate, 100 mL min−1; kN2 = 0.026 ± 0.003 min−1, kN2O = 0.021 ± 0.003 min−1. Adapted with permission from Tanaka et al. [105]. Copyright 2002 by the Royal Society of Chemistry (License No.: 4452660060880).

Figure 21.
Apparatus for NOx gas removal. Shown are: (i) UV exposure box; (ii) gas flow meters; (iii) NOx gas and air mixer gas in; (iv) gas out; (v) water bubbler for air mixer gas; (vi) glass reaction vessel; and (vii) sodium hydroxide bubbler for excess NOx removal. The system consisted of flow meters to allow an NOx concentration of between 10 and 100 ppm when used in conjunction with the air mixer gas; a water bubbler to allow the reaction to be studied with wet or dry gas’ a second bubbler containing aqueous NaOH was used after the reaction vessel to remove unreacted NOx. Reproduced with permission from Dalton et al. [106]. Copyright 2002 by Elsevier Science Ltd. (License No.: 4452660699057).

Figure 22.
Suggested mechanism for the photocatalyzed oxidative removal of NOx over the irradiated surface of the two TiO2 photocatalytic substrates.
Figure 22.
Suggested mechanism for the photocatalyzed oxidative removal of NOx over the irradiated surface of the two TiO2 photocatalytic substrates.

Figure 23.
Experimental setup used in the disposal of NOx. The system consisted of a thin-film photoreactor coated with Degussa P-25 TiO2 (typical loading, 1.0 mg cm2) irradiated with two 8 W or 25 W black lights from both sides; light intensity of 25 W bulbs varied with a dimming electronic ballast; reactor setup and light sources were contained in insulated chamber for control of temperature; light intensity measured with UVA radiometer (range, 320–390 nm) placed inside the reactor; NO and NO2 measured with a chemiluminescent NO–NOx gas analyzer; initial NO concentrations were 28.5 and 472 ppm; NO2 and NO3− measured by chromatography. Reproduced with permission from Devahasdin and et al. [107]. Copyright 2003 by Elsevier Science B.V. (License No.: 4452661132706).

Figure 24.
Comparative decrease of the NOx removal performed on TiO2 in the form of powder and pellets (plane surface, 54 cm2). Reproduced with permission from Toma et al. [108]. Copyright 2004 by Springer-Verlag (License No.: 4453250060579).
Figure 24.
Comparative decrease of the NOx removal performed on TiO2 in the form of powder and pellets (plane surface, 54 cm2). Reproduced with permission from Toma et al. [108]. Copyright 2004 by Springer-Verlag (License No.: 4453250060579).

Figure 25.
Schematic of the photoreactor used for testing the photocatalytic behavior of the various P-25 TiO2 catalytic samples (see text). Reproduced with permission from Bowering et al. [109]. Copyright 2005 by Elsevier B.V. (License No.: 4452670211528).
Figure 25.
Schematic of the photoreactor used for testing the photocatalytic behavior of the various P-25 TiO2 catalytic samples (see text). Reproduced with permission from Bowering et al. [109]. Copyright 2005 by Elsevier B.V. (License No.: 4452670211528).

Figure 26.
Photocatalytic deNOx abilities of samples under irradiation by various LED light sources: (a) S-TiO2; (b) TiON; (c) TiONFe; and (d) TiONPt. Reproduced with permission from Yin et al. [111]. Copyright 2008 by the American Chemical Society.
Figure 26.
Photocatalytic deNOx abilities of samples under irradiation by various LED light sources: (a) S-TiO2; (b) TiON; (c) TiONFe; and (d) TiONPt. Reproduced with permission from Yin et al. [111]. Copyright 2008 by the American Chemical Society.

Figure 27.
Schematic flow diagram of the hybrid PCR + HC/SCR reactor system. Reproduced with permission from Heo et al. [114]. Copyright 2013 by the American Chemical Society.
Figure 27.
Schematic flow diagram of the hybrid PCR + HC/SCR reactor system. Reproduced with permission from Heo et al. [114]. Copyright 2013 by the American Chemical Society.

Figure 28.
Global average NOx emissions from various sources in 2015 in kilo tonnes (kt) per million tonnes oil equivalent (Mtoe). Plot made from selected data from the International Energy Agency [115].
Figure 28.
Global average NOx emissions from various sources in 2015 in kilo tonnes (kt) per million tonnes oil equivalent (Mtoe). Plot made from selected data from the International Energy Agency [115].

Figure 29.
Usage of TiO2-based photocatalytic material on roadway surfaces to convert nitrogen oxides NOx to nitrate: finished roadway with the coated surface showing a lighter color—photo was courtesy of Fujita Road Construction Co., Ltd. to the authors of Ref. [117]. Reproduced with permission from Fujishima et al. [117]. Copyright 2008 by Elsevier B.V. (License No.: 4452671501245).

Figure 30.
Paving brick for NOx removal; dimensions of brick: 10 cm × 20 cm; thickness of the surface layer containing TiO2: 5–7 mm. Reproduced from Murata et al. [122].
Figure 30.
Paving brick for NOx removal; dimensions of brick: 10 cm × 20 cm; thickness of the surface layer containing TiO2: 5–7 mm. Reproduced from Murata et al. [122].

Figure 31.
Indoor flow-through PVC reactor system for evaluating the performance of a brick in removing NOx from the environment. Simulated emission gas consisted of mixing dry air, dilute NO gas (1.0 ppm); flow rate was 3 L min−1; air space between the brick and the Pyrex glass window was 5 mm; temperature, 25 °C; relative humidity RH, 50%; UV intensity from 2 black lights (300–400 nm), 6 W m−2. Reproduced from Murata et al. [122].

Figure 32.
(top) Indoor reactor used to measure NOx abatement using the TX-Active photocatalytic TiO2–based cementitious substrate Photograph reproduced from Borgarello Ref. [121]. (bottom) Schematic of the flow-through reactor assembly; reproduced from Guerrini and Peccati [123].

Figure 33.
Plots illustrating the immediate destruction of NOx upon turning the light on and after 60 min of lamp stabilization of the chamber (recirculation tests). Plot made from data reported in Borgarello [121].
Figure 33.
Plots illustrating the immediate destruction of NOx upon turning the light on and after 60 min of lamp stabilization of the chamber (recirculation tests). Plot made from data reported in Borgarello [121].

Figure 34.
Cylindrical reactor (borosilicate-glass; dia. = 60 mm; length = 300 mm; high transparency to UV-A radiation; low adsorption capacity) used by Martinez and coworkers [125] to test the photocatalytic TiO2 coatings toward the abatement of NOx pollutants; coated and control samples (100 × 50 mm2) were placed in the median plane of the reactor using a PTFE holder; gas circulated through the semi-cylindrical space between test piece and upper part of the reactor. Light source was a 300-W OSRAM Ultravitalux bulb with an emission spectrum close to that of daylight (light intensity = 5.8 W m−2). Other experimental conditions: flow rate, 1.5 L min−1; initial NO concentrations, 400–2000 ppb; relative humidity, 0–74%; temperature, 25 °C). Reproduced with permission from Martinez et al. [125]. Copyright 2011 by Elsevier Ltd. (License No.: 4452680979256).

Figure 35.
(a) Photoreactor in a flow-through assembly for the measurement of photocatalytic activity of a photocatalytic mortar for the abatement of NOx; and (b) photocatalytic mortar applied to a Precast Concrete Paving sample. Reproduced with permission from Staub de Melo and Triches [126]. Copyright 2012 by Elsevier Ltd. (License No.: 4452681429886).

Figure 36.
Modified bed flow photoreactor with movable injector and turbulence barriers. Reproduced with permission from Ifang et al. [127]. Copyright 2014 by Elsevier Ltd. (License No.: 4452690260303).
Figure 36.
Modified bed flow photoreactor with movable injector and turbulence barriers. Reproduced with permission from Ifang et al. [127]. Copyright 2014 by Elsevier Ltd. (License No.: 4452690260303).

Figure 37.
Experimental laminar flow (a); and ideally-mixed flow (b) reactors used to examine the photocatalytic oxidation of low concentrations of gas NOx streams at some specified humidity. Reproduced with permission from Zouzelka and Rathousky [128]. Copyright 2017 by The Authors (open access license).

Figure 38.
Comparison of the photocatalytic reaction rates in the degradation of NOx with the FN2 and P-25 in both ideally-mixed and laminar flow reactors for an inlet NO2 concentration of 0.1 ppmv and relative humidity (RH) of 50%. FN2 (black) and P-25 (blue) coated on concrete in laminar flow reactor. FN2 (red) and P25 (green) coated on plaster in ideally-mixed flow reactor. Reproduced with permission from Zouzelka and Rathousky [128]. Copyright 2017 by The Authors (open access license).

Figure 39.
NOx investigations under dark and light conditions in LEAK simulation chamber (RH = 10%, 50% and 70%; T = 293 K) to compare the behavior of the boosted (solid lines) and blank materials (dashed lines) for the time-dependent changes in the concentrations of NO, NOx, and O3 akin to environmental quantities. Reproduced with permission from Mothes et al. [25]. Copyright 2016 by Springer-Verlag Berlin Heidelberg (License No.: 4453250415918).

Figure 40.
(a) Schematic illustration of pH changes and light penetration profile in the ageing concrete; (b) optical microscope image of the cross section of a concrete specimen containing TiO2 under X-polarized light—note the surface exhibits a thin calcite layer that appears in a lighter colour; (c) optical microscope image of the cross section of a concrete specimen containing TiO2 under fluorescent light—note that the calcite layer now appears dark green indicative of low porosity; and (d) SEM image of the top surface of a concrete specimen containing TiO2 (same sample as in (b,c)) wherein the surface consists of a layer of small, closely spaced, euhedral calcite crystals—no TiO2 photocatalytic clusters are exposed. Reproduced with permission from Macphee and Folli [129]. Copyright 2016 by Elsevier Ltd. (License No.: 4453091259877).

Figure 41.
Plots illustrating the photonic efficiency of NOx removal and nitrate selectivity of W-modified TiO2 illuminated under broadband radiation. Adapted with permission from Bloh et al. [131]. Copyright 2014 by the Royal Society of Chemistry (license ID: 4453100929571).
Figure 41.
Plots illustrating the photonic efficiency of NOx removal and nitrate selectivity of W-modified TiO2 illuminated under broadband radiation. Adapted with permission from Bloh et al. [131]. Copyright 2014 by the Royal Society of Chemistry (license ID: 4453100929571).

Figure 42.
(a) deNOx index measured using W-doped TiO2 under broad band radiation simulating sunlight; and (b) deNOx data on powder and mortar samples containing W-and Nb-doped TiO2 (broad band and visible light exposure). Reproduced with permission from Macphee and Folli [129]. Copyright 2016 by Elsevier Ltd. (License No.: 4453091259877).


Figure 43.
Conventional mortar/concrete with the photocatalyst embedded within the aggregate (mixed), and aggregate-supported configuration of the photocatalyst (blue) applications in proposed concrete technology whereby the photocatalyst is supported on sort of binder that bonds both the photocatalyst and the cementitious support. Reproduced with permission from Yang et al. [132]. Copyright 2018 by The Authors (open access license).

Figure 44.
Schematic illustration of photoreactor used in testing the photocatalytic degradation of NOx gases. Reproduced with permission from Yang et al. [132]. Copyright 2018 by The Authors (open access license).
Figure 44.
Schematic illustration of photoreactor used in testing the photocatalytic degradation of NOx gases. Reproduced with permission from Yang et al. [132]. Copyright 2018 by The Authors (open access license).

Figure 45.
Concentration profiles for NO, NO2 and NOx (NO + NO2) during the photocatalytic oxidation of NO on TiO2 hydrosol (0.1 g) photocatalysts. Reproduced with permission from Yang et al. [132]. Copyright 2018 by the authors (open access license).
Figure 45.
Concentration profiles for NO, NO2 and NOx (NO + NO2) during the photocatalytic oxidation of NO on TiO2 hydrosol (0.1 g) photocatalysts. Reproduced with permission from Yang et al. [132]. Copyright 2018 by the authors (open access license).

Figure 46.
Laboratory tests of the anatase TiO2 photocatalytic cement-based products used in the precast concrete panels in the sails of the Dives in Misericordia Church (Rome): (a) under dark conditions; and (b) under UV irradiation for 7 h. Note the increased reduction of NO and NO2 under UV irradiation. Reproduced with permission from Cassar [139]. Copyright 2004 by the Materials Research Society (License No.: 4453250907572).

Figure 47.
Dives in Misericordia Church, Rome, constructed of TiO2 self-cleaning and depolluting TX Active cement (inaugurated in 2003). Reproduced from https://es.i-nova.net/content?articleId=96804 or https://www.archdaily.com/20105/church-of-2000-richard-meier.
Figure 47.
Dives in Misericordia Church, Rome, constructed of TiO2 self-cleaning and depolluting TX Active cement (inaugurated in 2003). Reproduced from https://es.i-nova.net/content?articleId=96804 or https://www.archdaily.com/20105/church-of-2000-richard-meier.

Figure 48.
(a) Google Earth photograph of the Dives in Misericordia Church in Rome, Italy (unloaded Spring of 2017); and (b–e) photographs of the Dives in Misericordia Church taken on 24 February 2018 (Copyright by N. Serpone). Note the breaking-up of the cementitious layer on the outside sails.
Figure 48.
(a) Google Earth photograph of the Dives in Misericordia Church in Rome, Italy (unloaded Spring of 2017); and (b–e) photographs of the Dives in Misericordia Church taken on 24 February 2018 (Copyright by N. Serpone). Note the breaking-up of the cementitious layer on the outside sails.

Figure 49.
(a) Conditions of the Umberto I tunnel in Rome (Italy) before the 2007 renovation; and (b) tunnel after renovation but before inauguration day of 9 September 2007. Reproduced from Guerrini and Peccati [123].
Figure 49.
(a) Conditions of the Umberto I tunnel in Rome (Italy) before the 2007 renovation; and (b) tunnel after renovation but before inauguration day of 9 September 2007. Reproduced from Guerrini and Peccati [123].

Figure 50.
Photographs showing the status of the Umberto I Tunnel in Rome nearly 11 years after the renovation. Photographs taken 4 March 2018 at 17:00 (Copyright by N. Serpone).
Figure 50.
Photographs showing the status of the Umberto I Tunnel in Rome nearly 11 years after the renovation. Photographs taken 4 March 2018 at 17:00 (Copyright by N. Serpone).

Figure 51.
Example of a TiO2-coated concrete noise barrier erected along the A1 and A28 highways in Terschuur and Putten, the Netherlands. Reproduced from Ref. [152].
Figure 51.
Example of a TiO2-coated concrete noise barrier erected along the A1 and A28 highways in Terschuur and Putten, the Netherlands. Reproduced from Ref. [152].

Figure 52.
Postulated mechanism for the photocatalytic reactions of NO, NO2 and HONO on photoactive paint surfaces. Reproduced with permission from Laufs et al. [156]. Copyright 2010 by Elsevier Ltd. (License No.: 4453150462958).
Figure 52.
Postulated mechanism for the photocatalytic reactions of NO, NO2 and HONO on photoactive paint surfaces. Reproduced with permission from Laufs et al. [156]. Copyright 2010 by Elsevier Ltd. (License No.: 4453150462958).

Figure 53.
(upper) Condition of the Leopold II tunnel after coating the walls and also showing the lighting system; and (lower) schematic representation of the test sites in the Leopold II tunnel during the PhotoPAQ field trials. Reproduced with permission from Boonen et al. [158]. Copyright 2015 by Elsevier Ltd. (License No.: 4453110422490).

Figure 54.
Plot of NOx concentration (10-min averages) monitored at 1.1 m and 3.2 m above the ground surface against the corresponding data at the tunnel ceiling (4.4 m); data recorded at Site 2 (downwind; see Figure 53 (lower)) during the third campaign (160 m section). Reproduced with permission from Gallus et al. [14]. Copyright 2014 by Elsevier Ltd. (License No.: 4453111244188).

Figure 55.
Plot of NOx against CO2 data (10-min averages) at Site 2 during the third campaign. Reproduced with permission from Gallus et al. [14]. Copyright 2014 by Elsevier Ltd. (License No.: 4453111244188).
Figure 55.
Plot of NOx against CO2 data (10-min averages) at Site 2 during the third campaign. Reproduced with permission from Gallus et al. [14]. Copyright 2014 by Elsevier Ltd. (License No.: 4453111244188).

Figure 56.
Image and schematic of the two artificial model street (reference and active) canyons with dimensions 5 × 5 × 53 m (width × height × length) at an Italcementi industrial site in Petosino near Bergamo, Italy. Reproduced with permission from Gallus et al. [15]. Copyright 2015 by Springer-Verlag Berlin Heidelberg (License No.: 4453120887380).


Figure 57.
Plots of the 10 min averaged data from the active canyon against the reference canyon for NO, NO2 and NOx gases during nighttime and daytime periods. Reproduced with permission from Gallus et al. [15]. Copyright 2015 by Springer-Verlag Berlin Heidelberg (License No.: 4453120887380).
Figure 57.
Plots of the 10 min averaged data from the active canyon against the reference canyon for NO, NO2 and NOx gases during nighttime and daytime periods. Reproduced with permission from Gallus et al. [15]. Copyright 2015 by Springer-Verlag Berlin Heidelberg (License No.: 4453120887380).

Figure 58.
Sample of a photoactive TiO2-based cementitious surface before and after one week in the Leopold II tunnel in Brussels. Courtesy of Dr. Falk Mothes of the Leibnitz Institute for Tropospheric Research (TROPOS), Germany.
Figure 58.
Sample of a photoactive TiO2-based cementitious surface before and after one week in the Leopold II tunnel in Brussels. Courtesy of Dr. Falk Mothes of the Leibnitz Institute for Tropospheric Research (TROPOS), Germany.

Figure 59.
(a) Cartoon illustrating the possible pathway to reduce NO to N2 and O2 gases through the involvement of oxygen vacancies; and (b) photocatalytic conversion of NO to N2 and O2 over 1% Fe-doped TiO2 under irradiation with UV light; concentration of NO: 100 ppm in He. Reproduced with permission from Ref. [176]. Copyright 2012 by the American Chemical Society.

Figure 60.
Cartoons representing the meaning of: (a) extra-negatively charged Ti3+ as being the complex formed between two adjacent Ti3+ species neighboring an oxygen vacancy (Vo) that can be viewed as a Tiδ+ center with 3 > δ > 2; and (b) isolated Ti3+ centers. Reproduced with permission from Kuznetsov et al. [70]. Copyright 2018 by Elsevier, B.V. (License No.: 4453641492289).

Figure 61.
Illustration of the absorption of light quanta and formation of: (1) electron–hole pairs; (2) electron; and (3) hole transport and their localization at traps; together with (4) electron–hole recombination under: (a) UV irradiation; and (b) Vis-light irradiation of a microcrystalline particle of VLA TiO2. In (a), the black stars denote the photogenerated electron–hole pairs, the blue stars the F-type centers (electron trapped in oxygen vacancy); the green circles the Ti3+ color centers, while the red circles refer to the trapped holes. In (b), the blue stars denote the F-type centers (electron trapped in oxygen vacancy), the green circles the Ti3+ color centers, while the red circles denote the trapped holes. Note the Tiδ+ centers in (b). Reproduced with permission from Kuznetsov et al. [70]. Copyright 2018 by Elsevier, B.V. (License No.: 4453641492289).


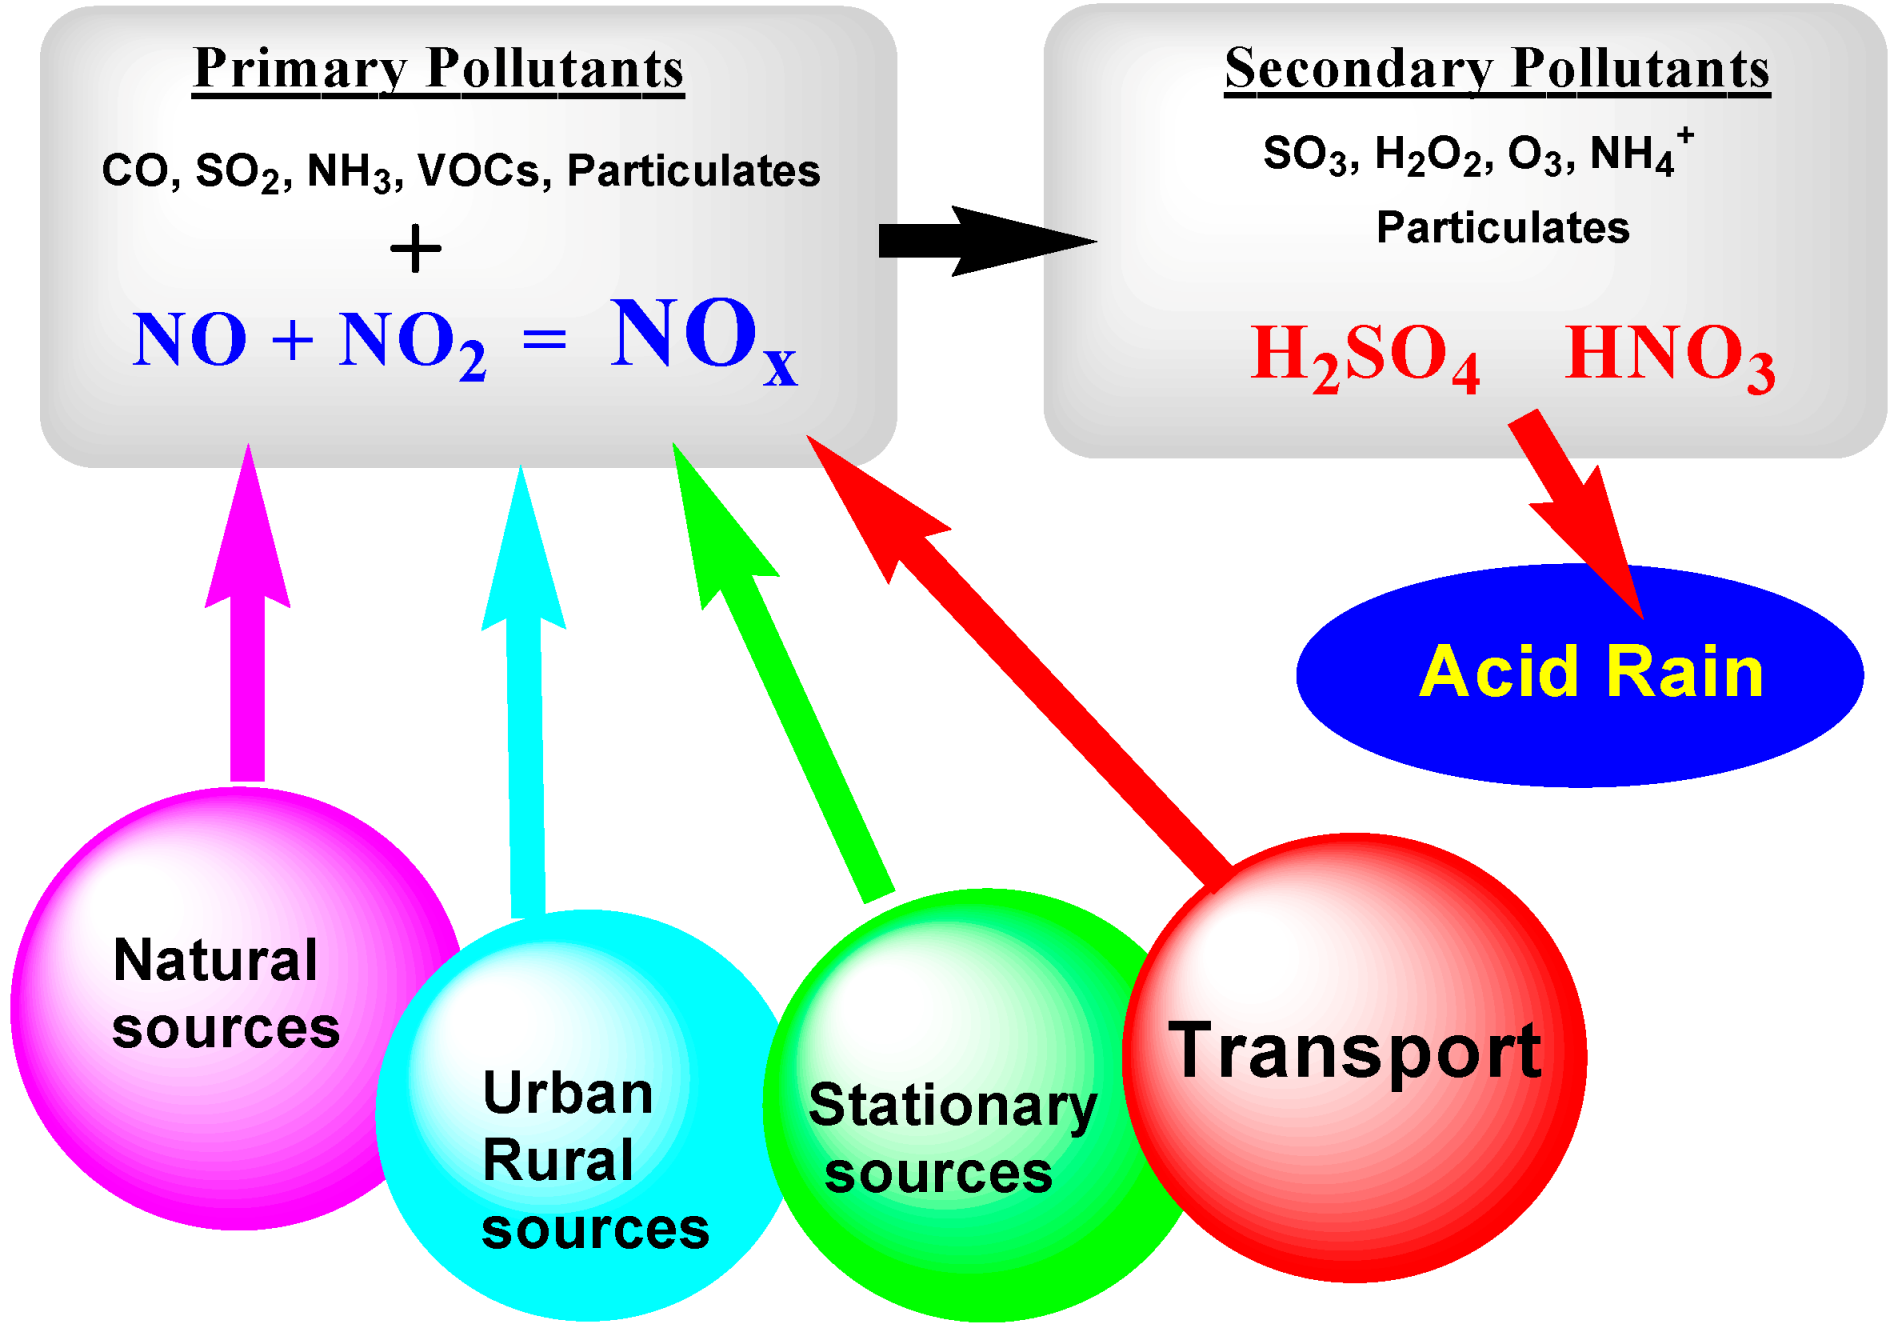
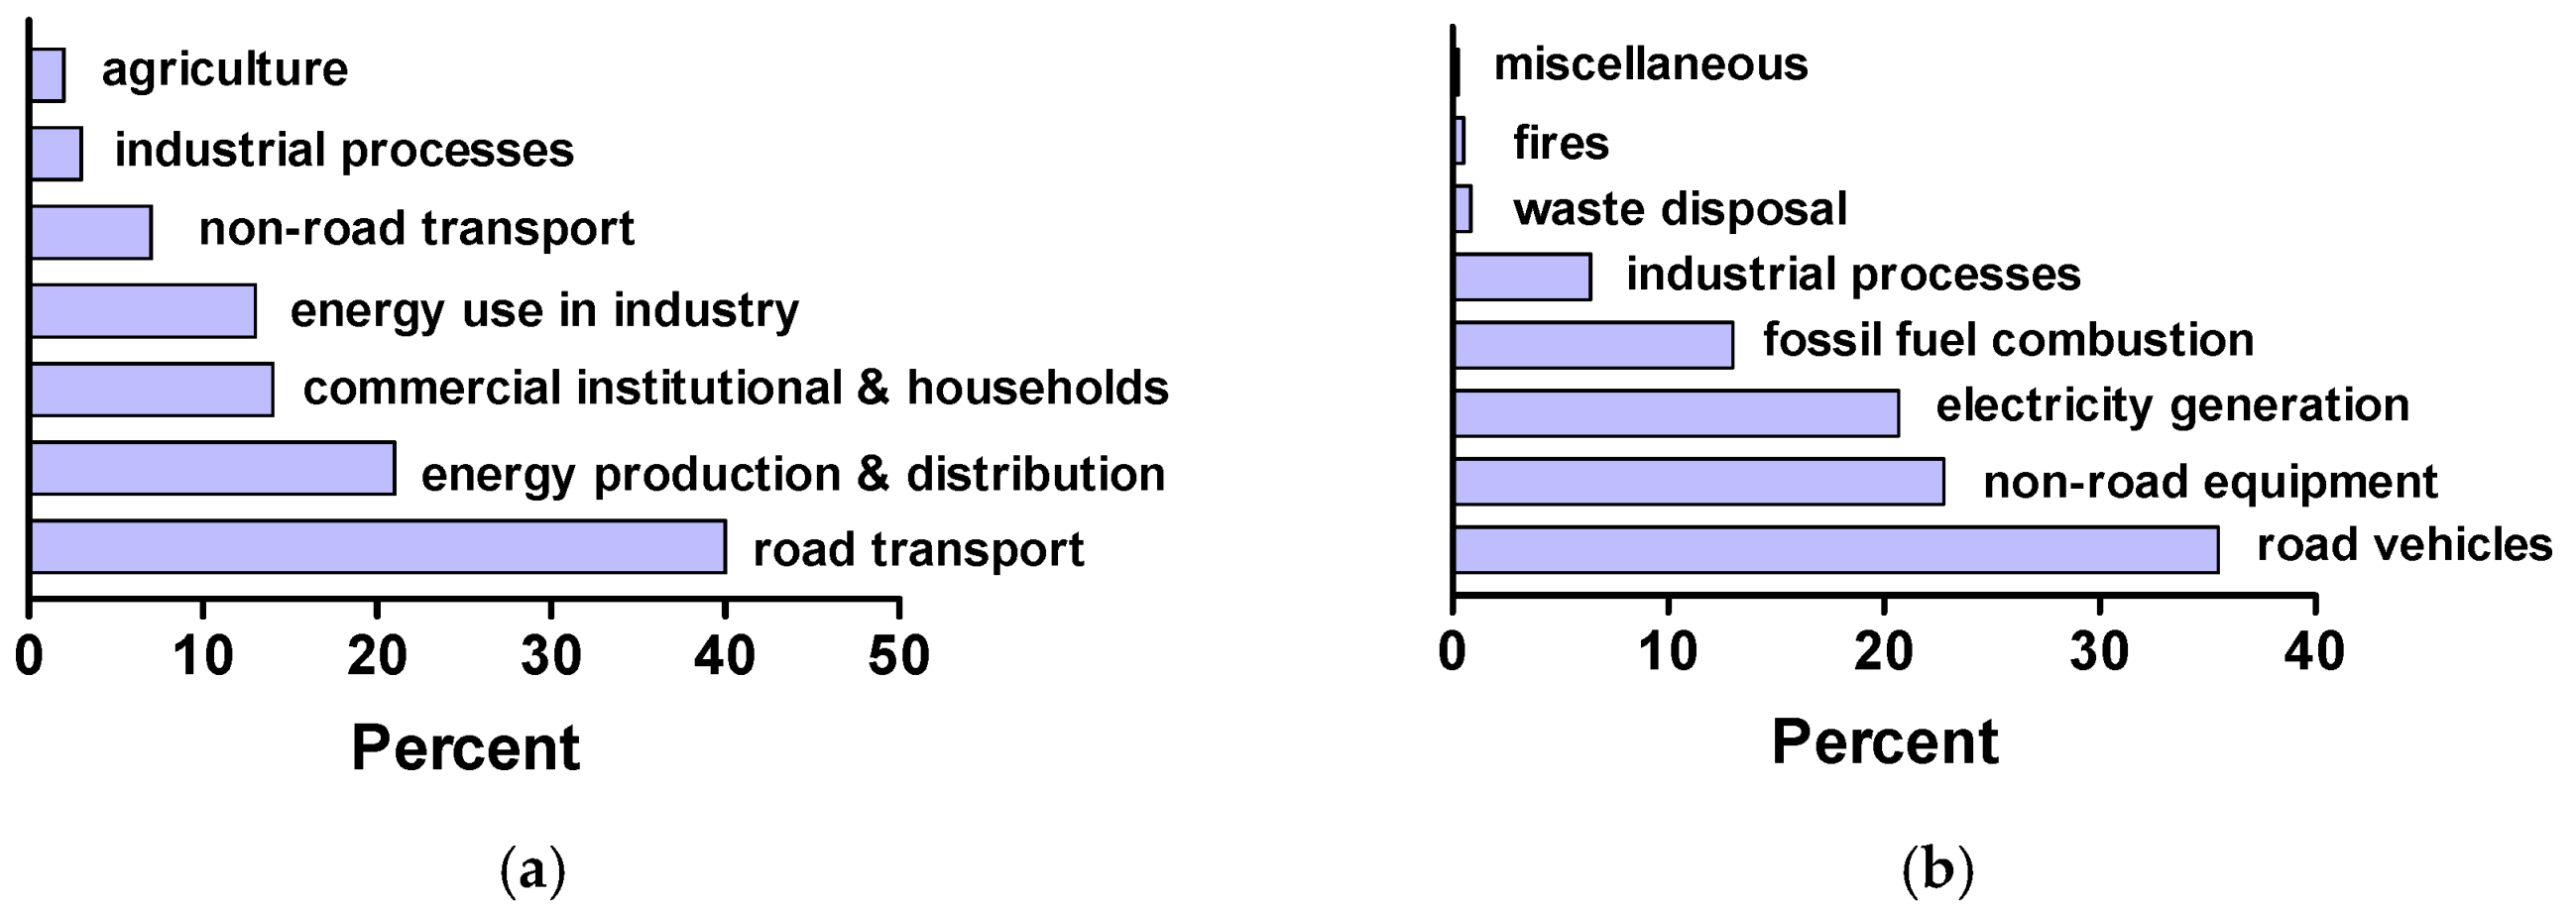
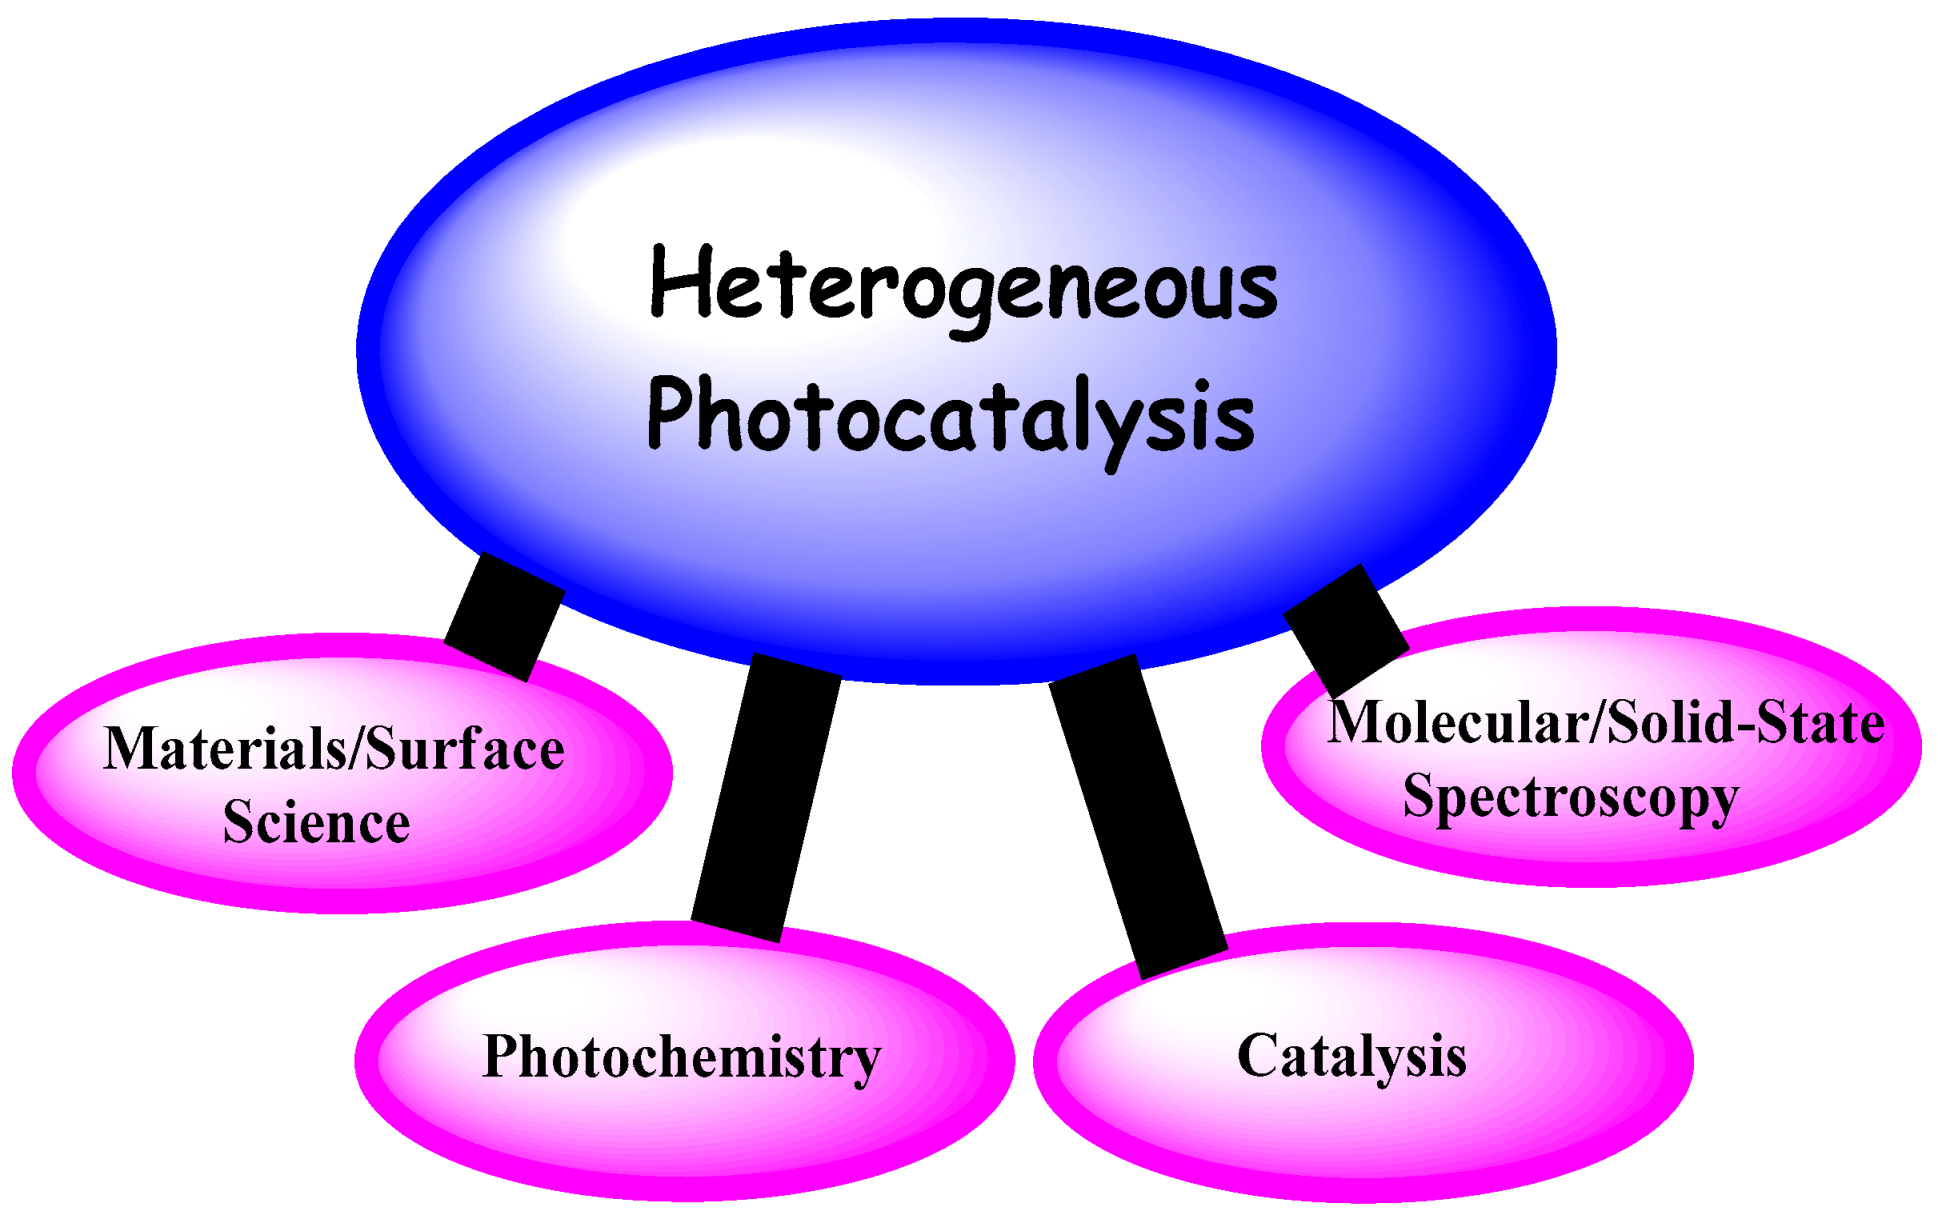
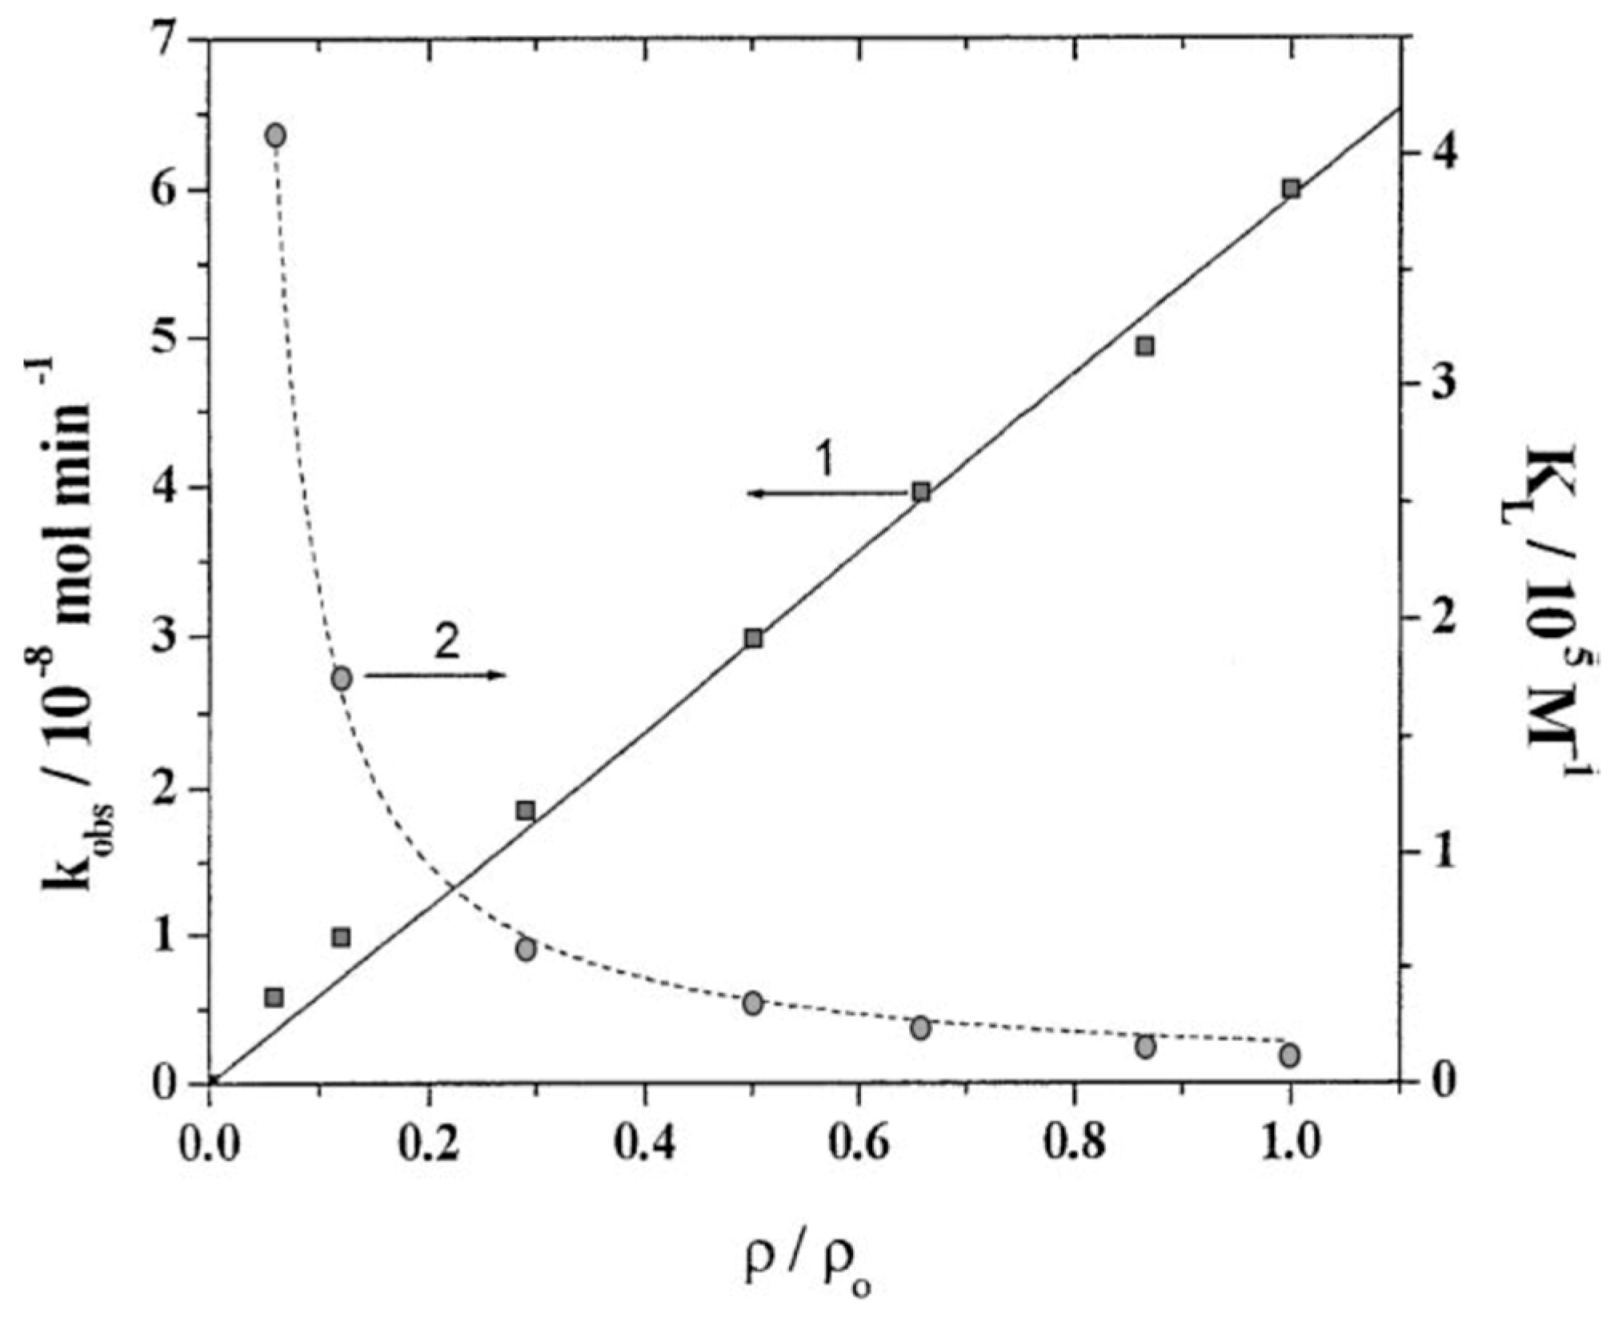
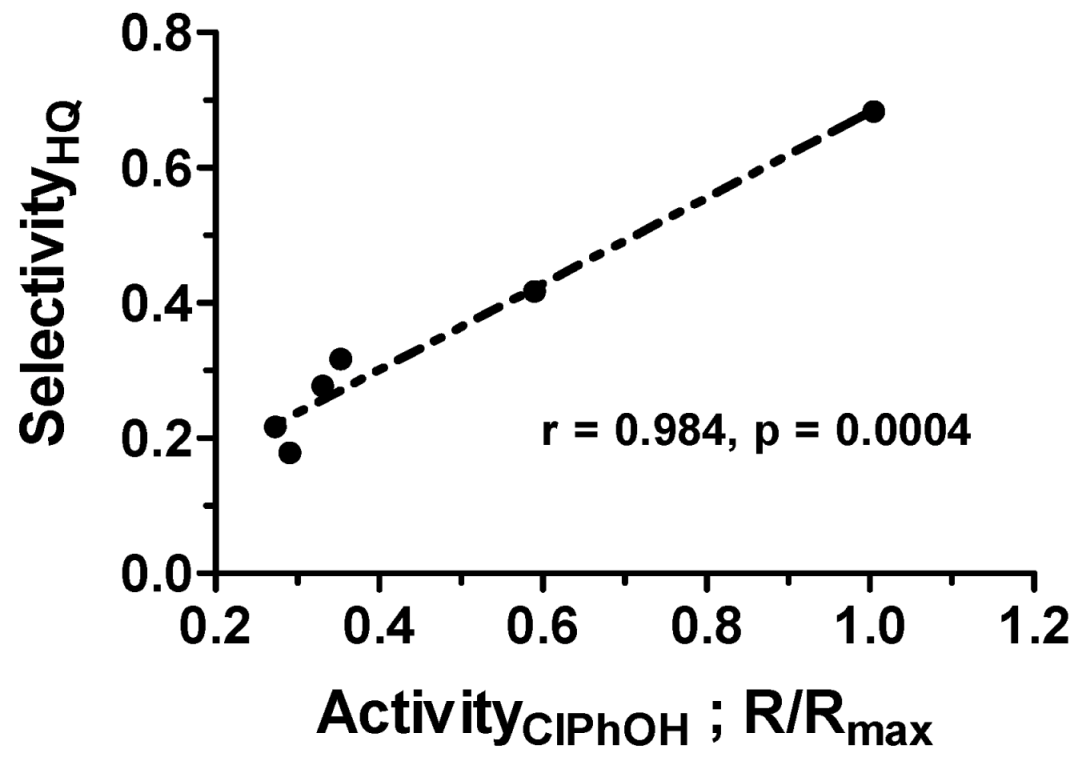
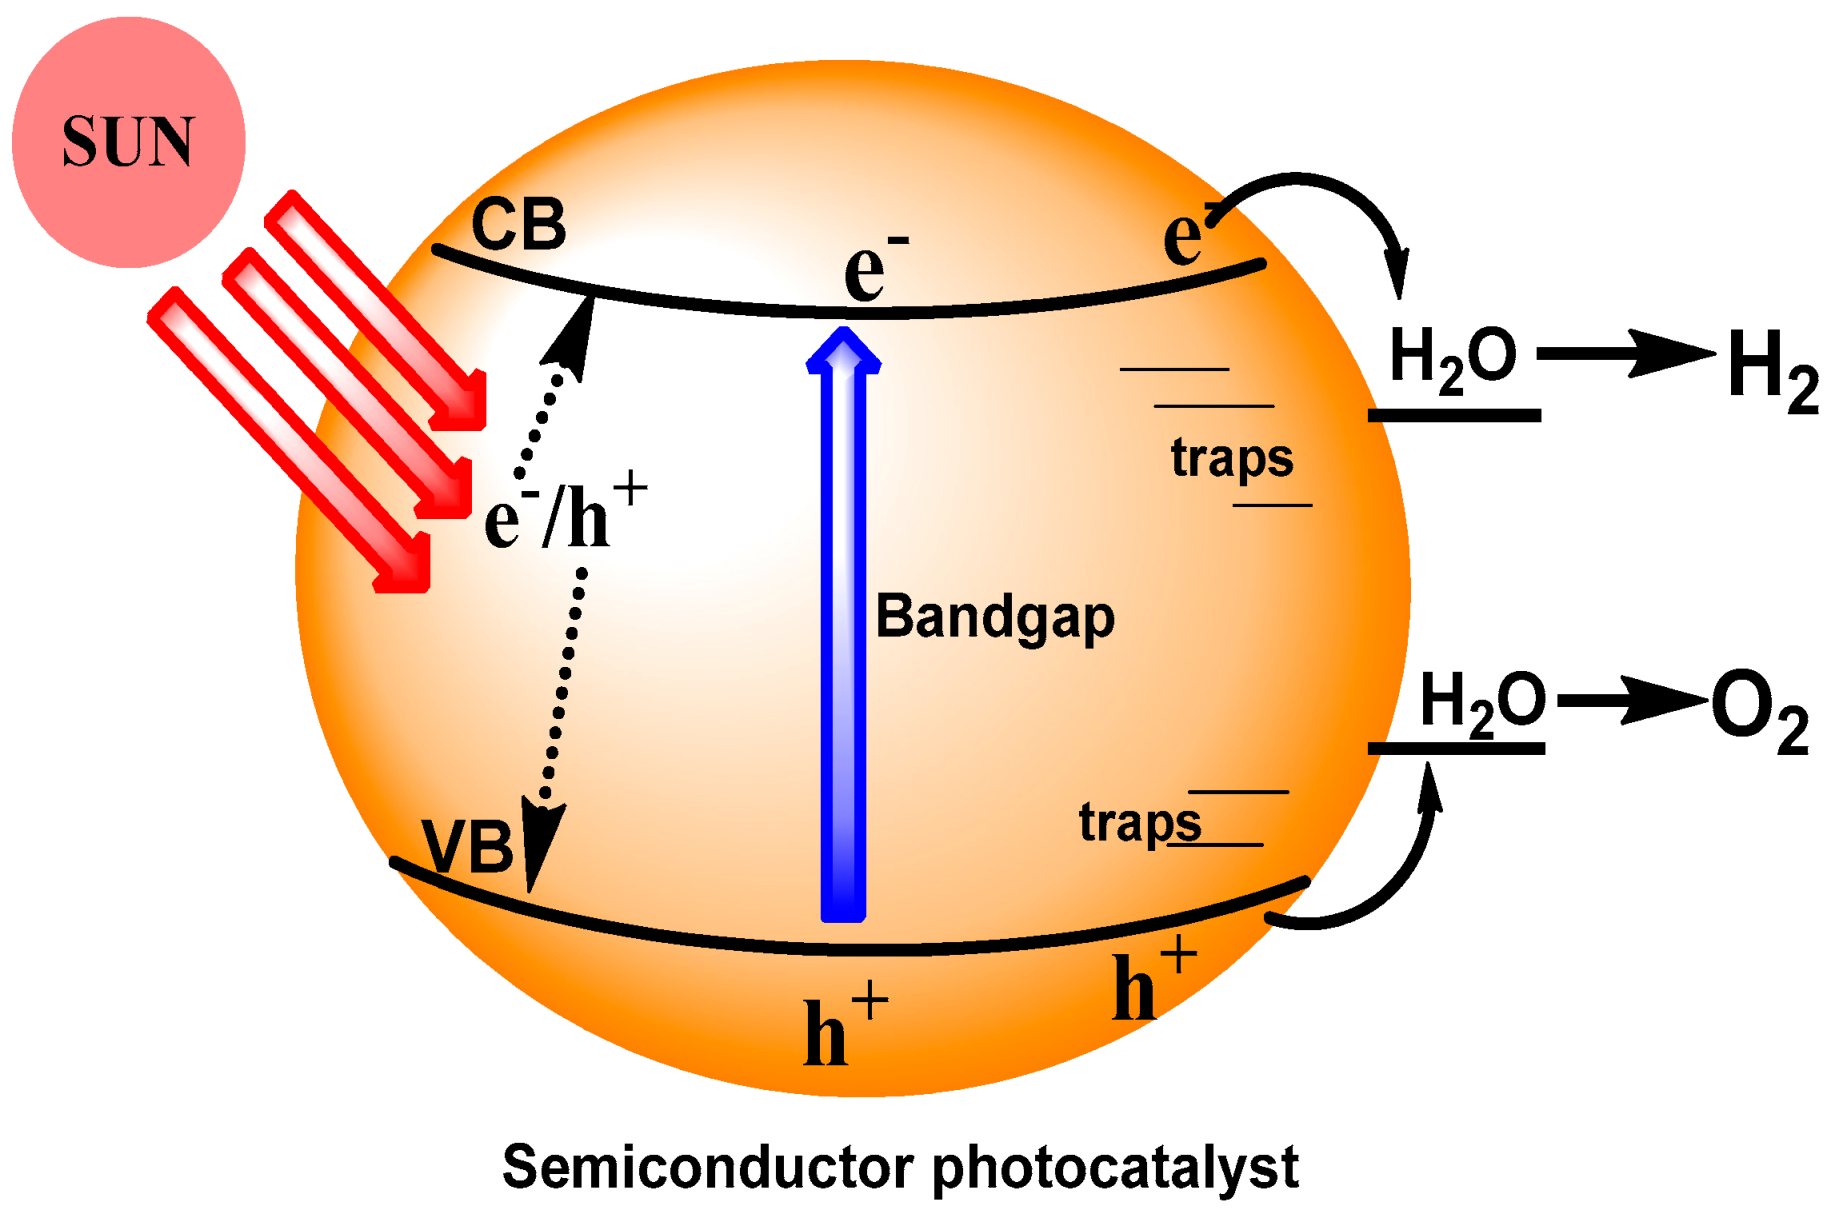
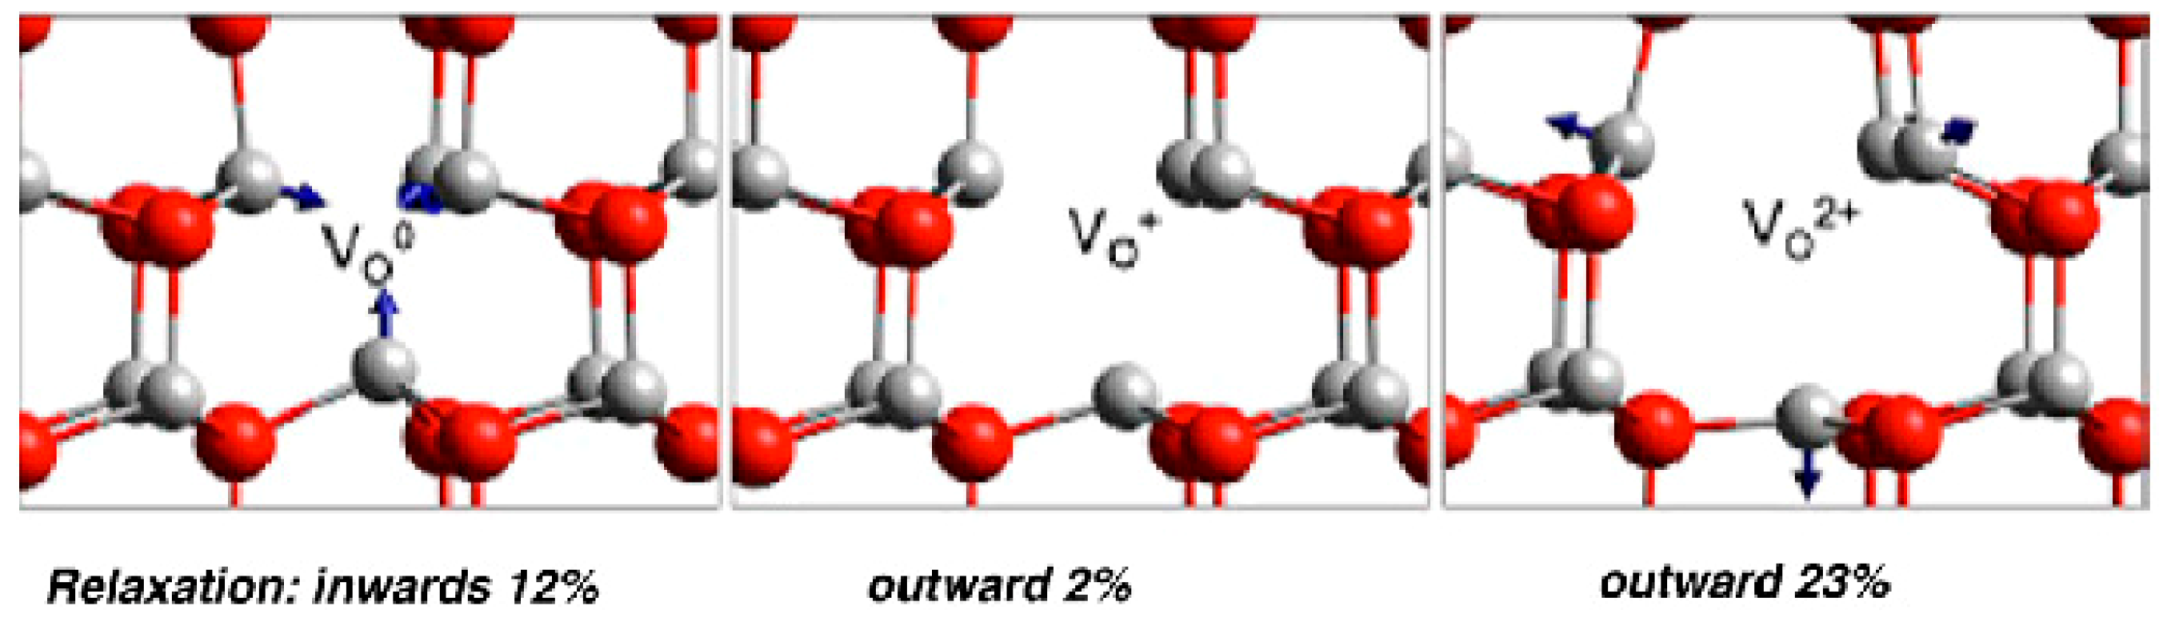
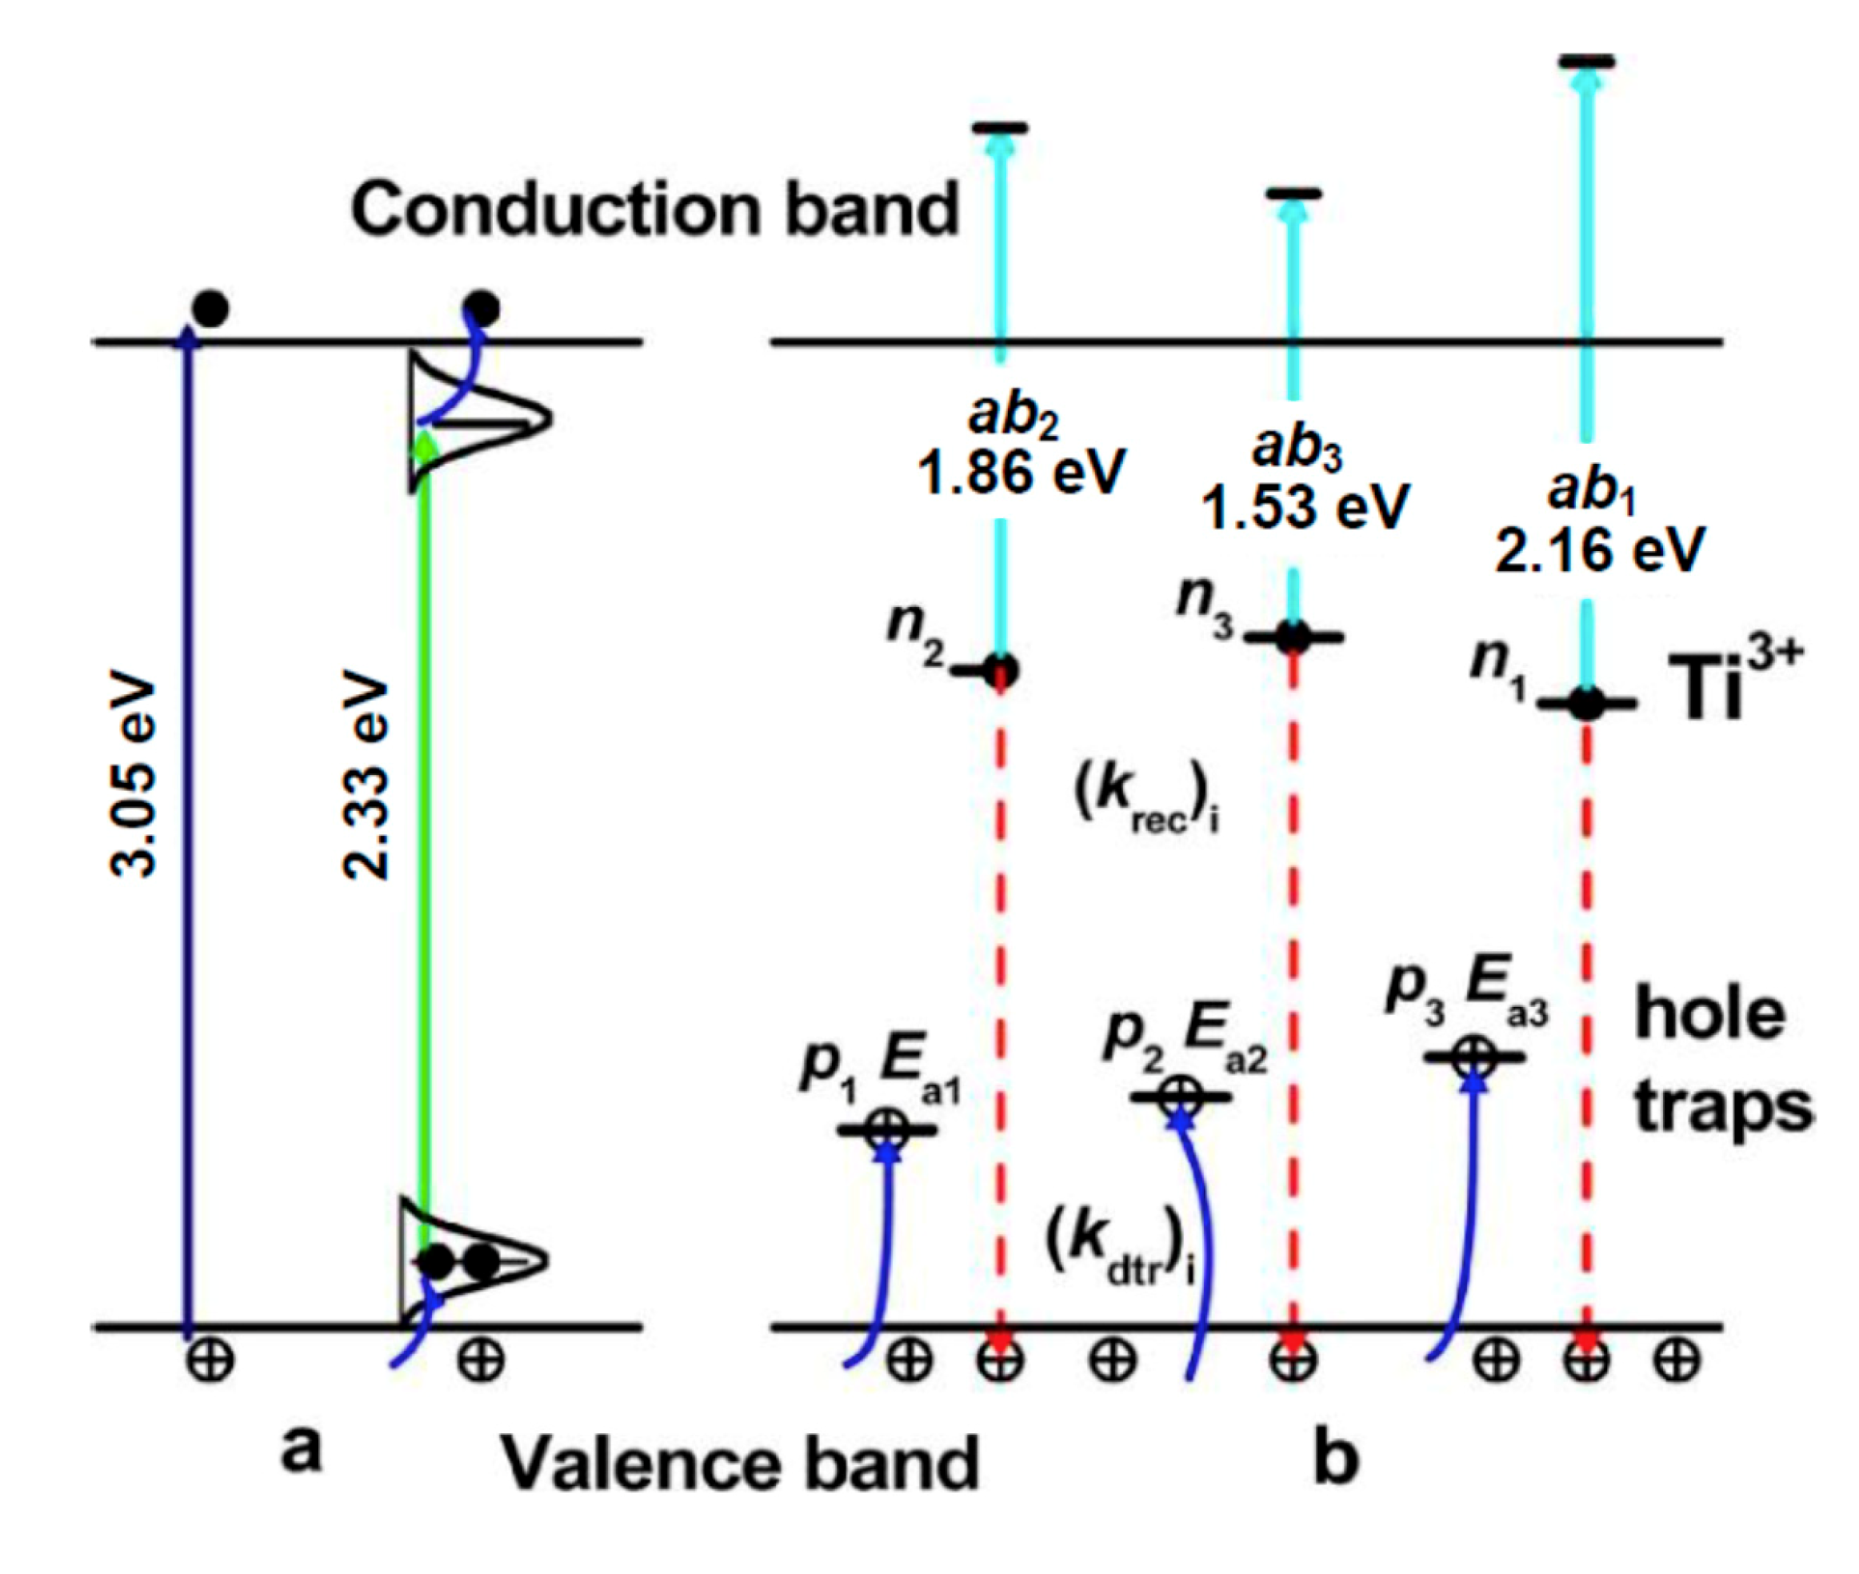
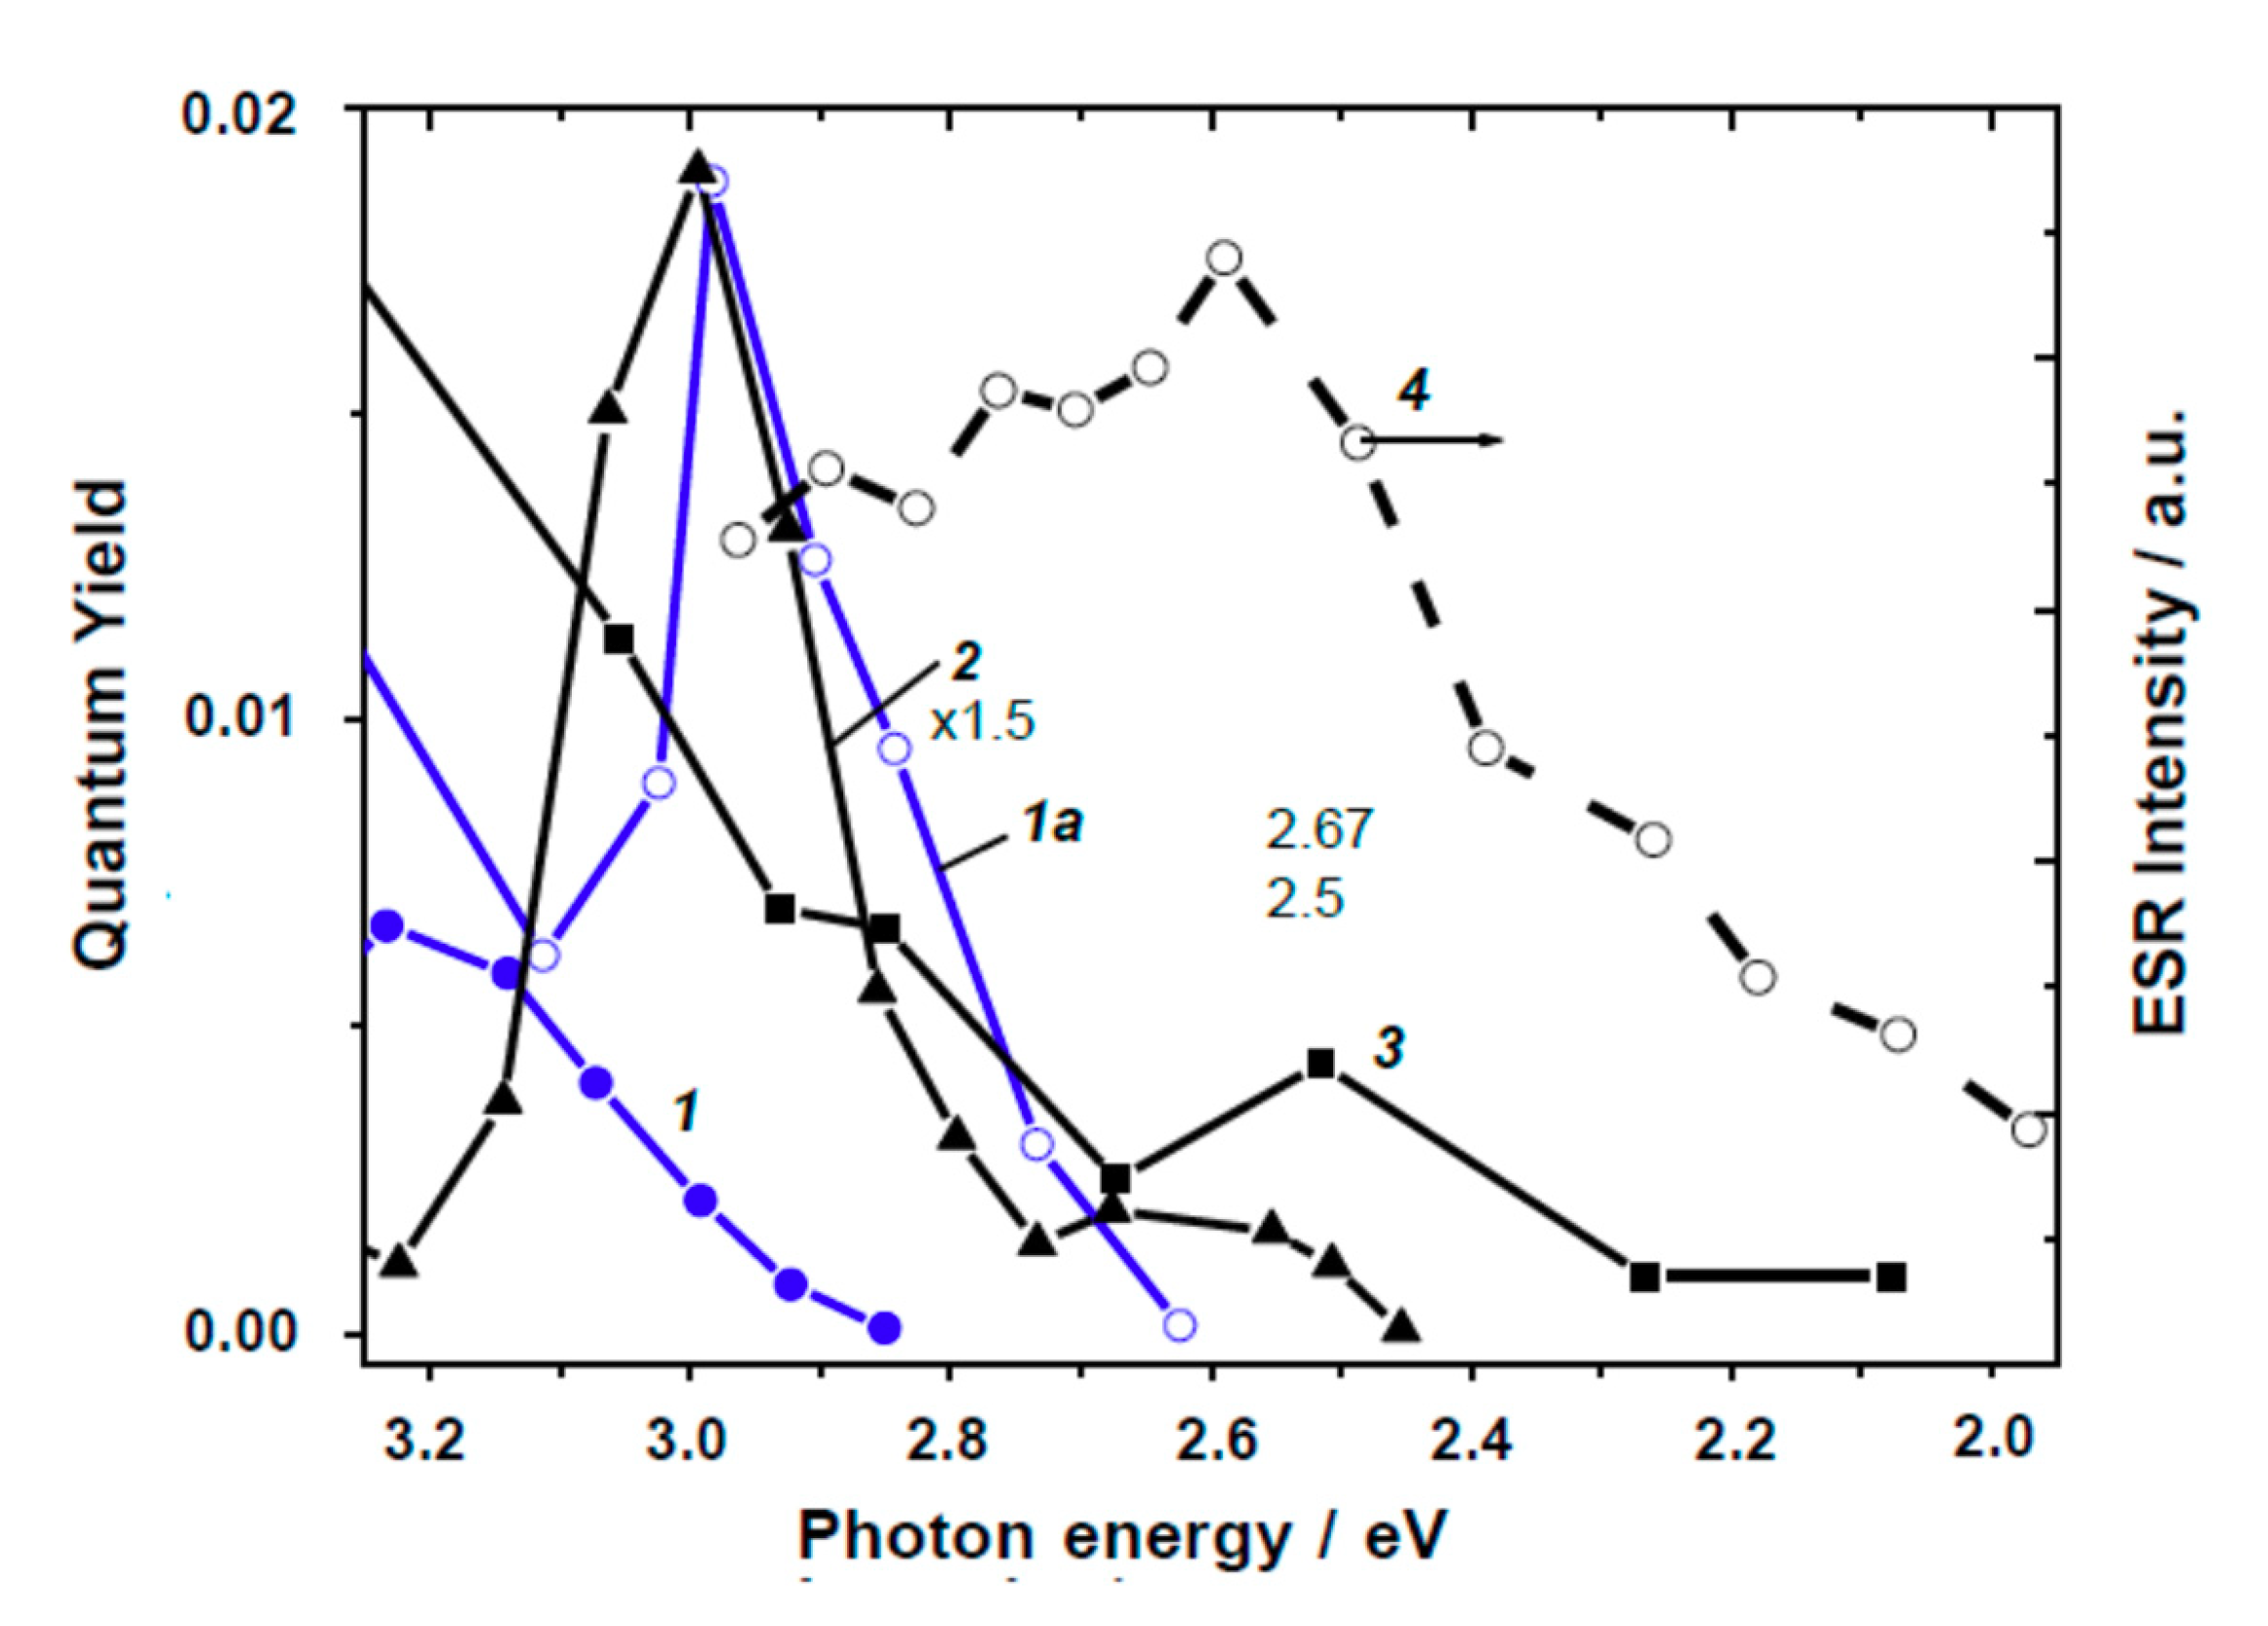
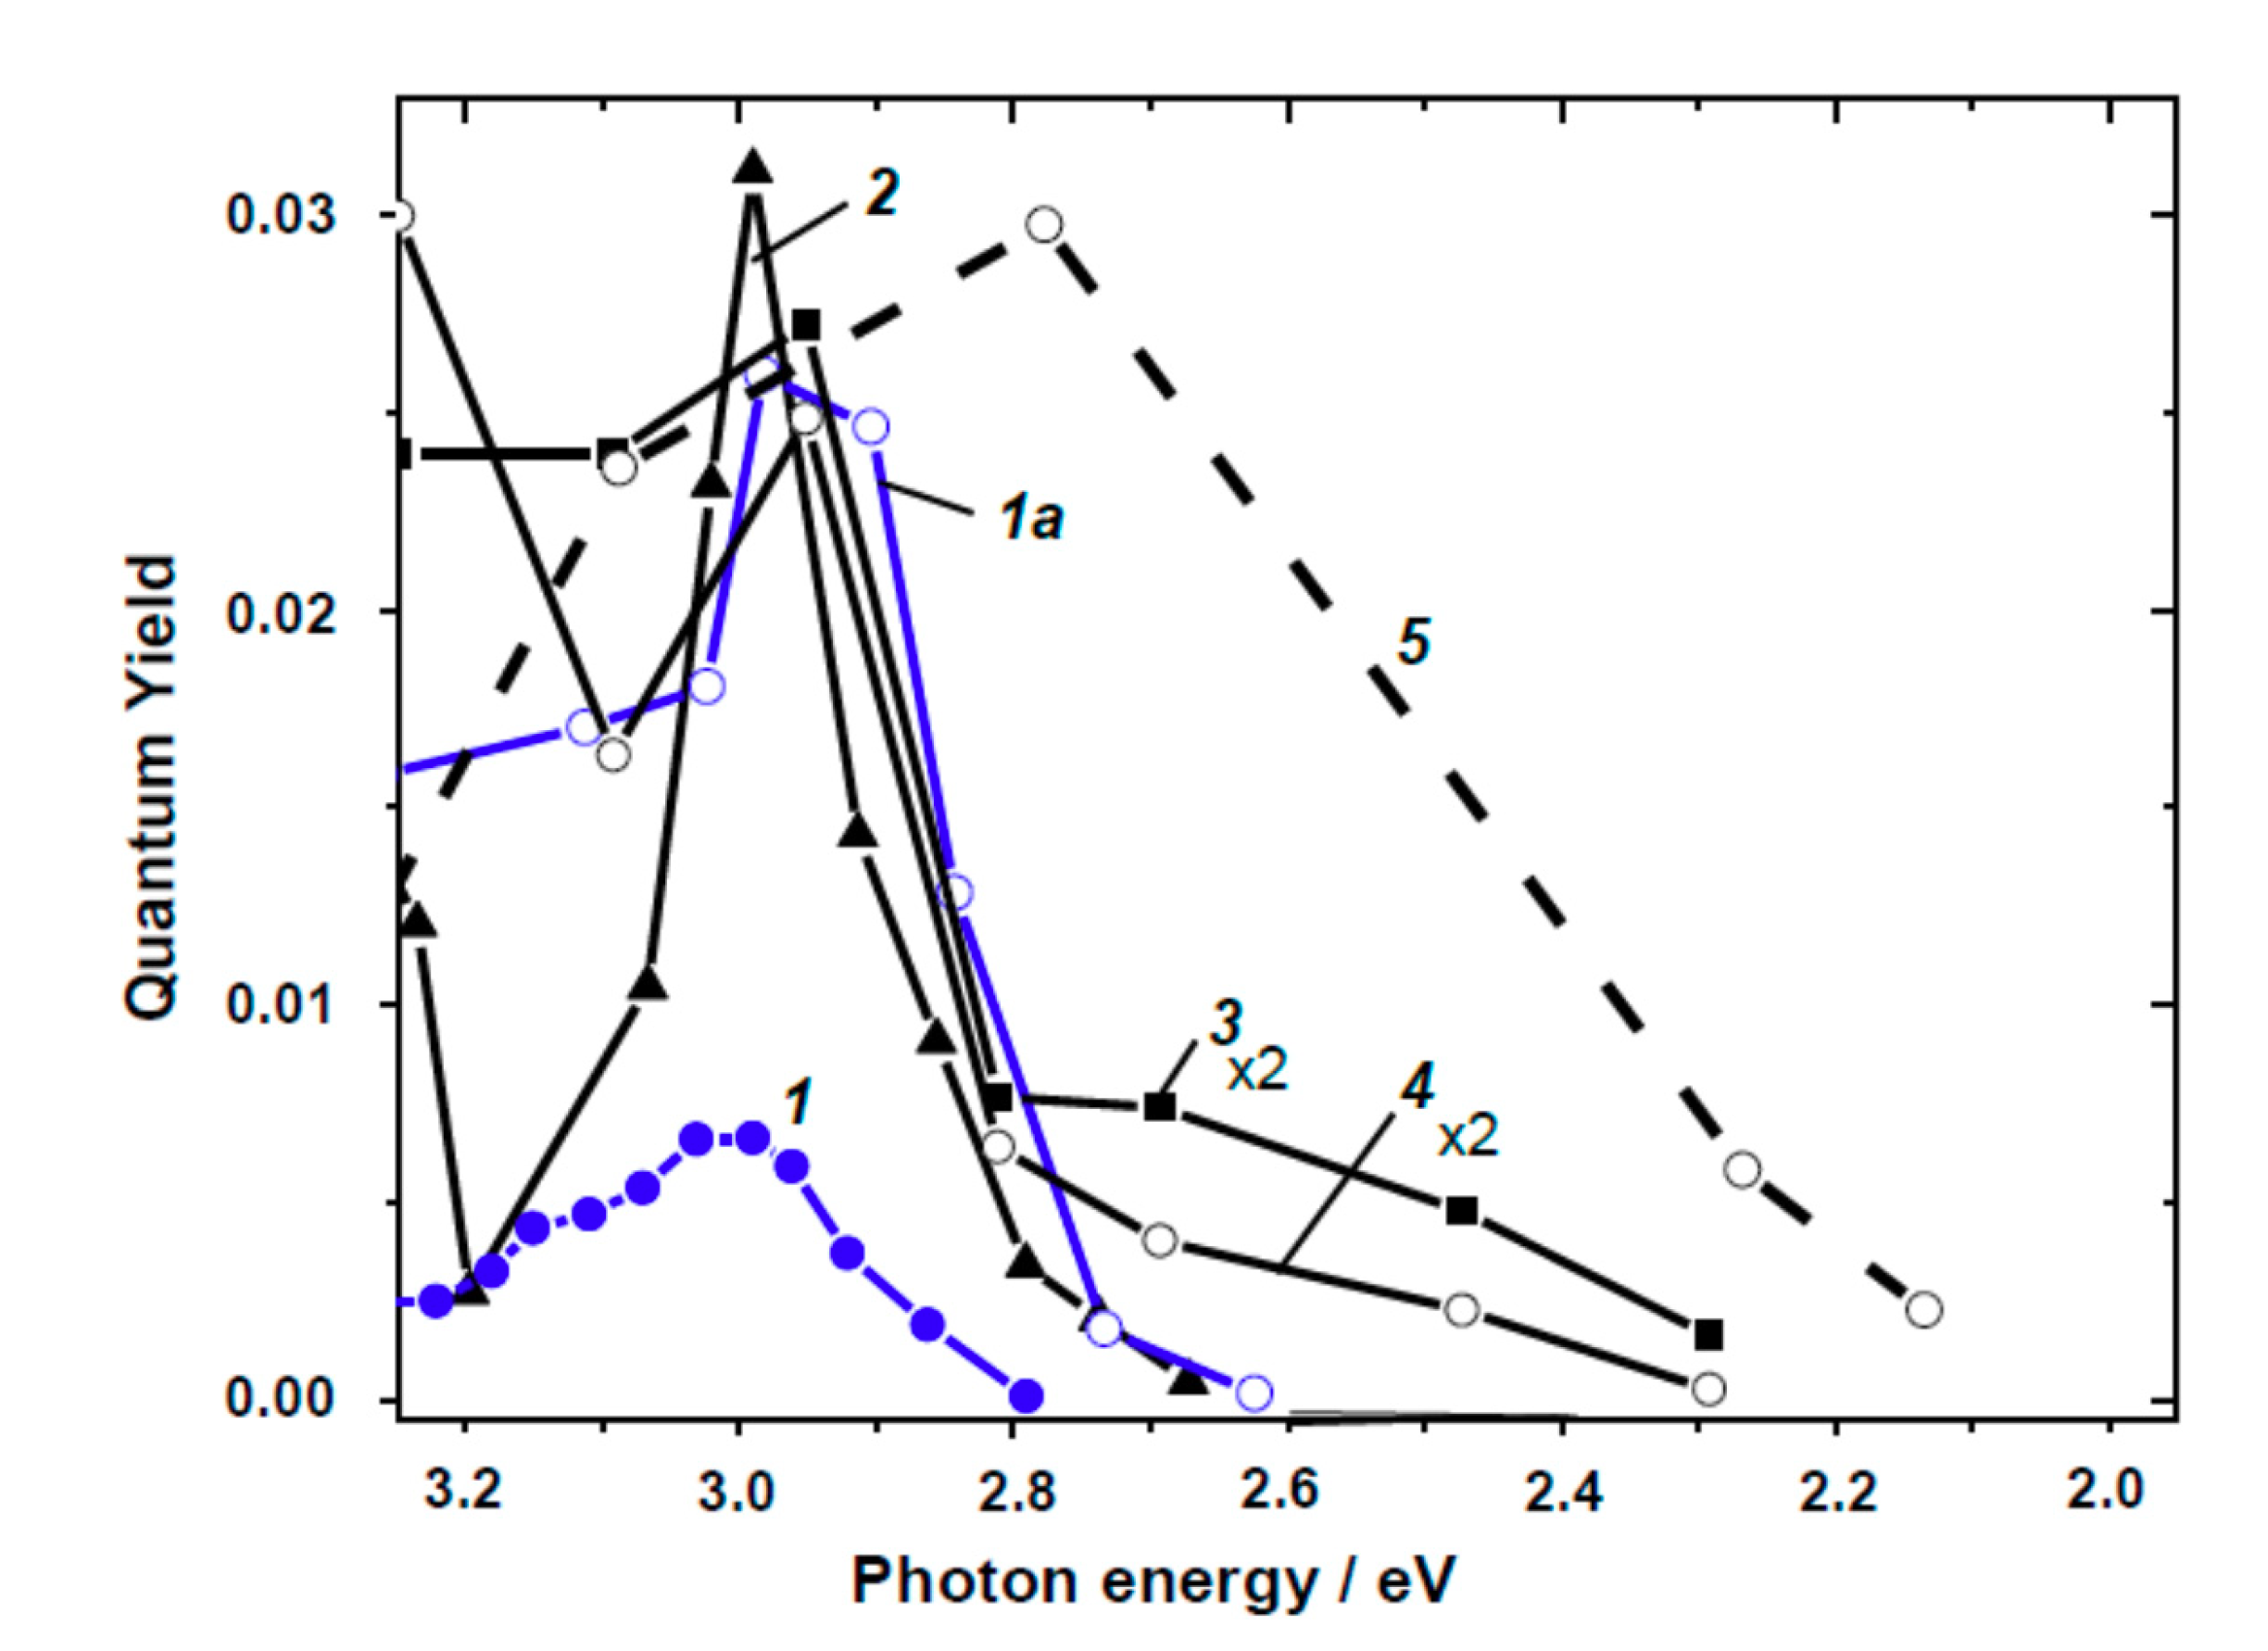
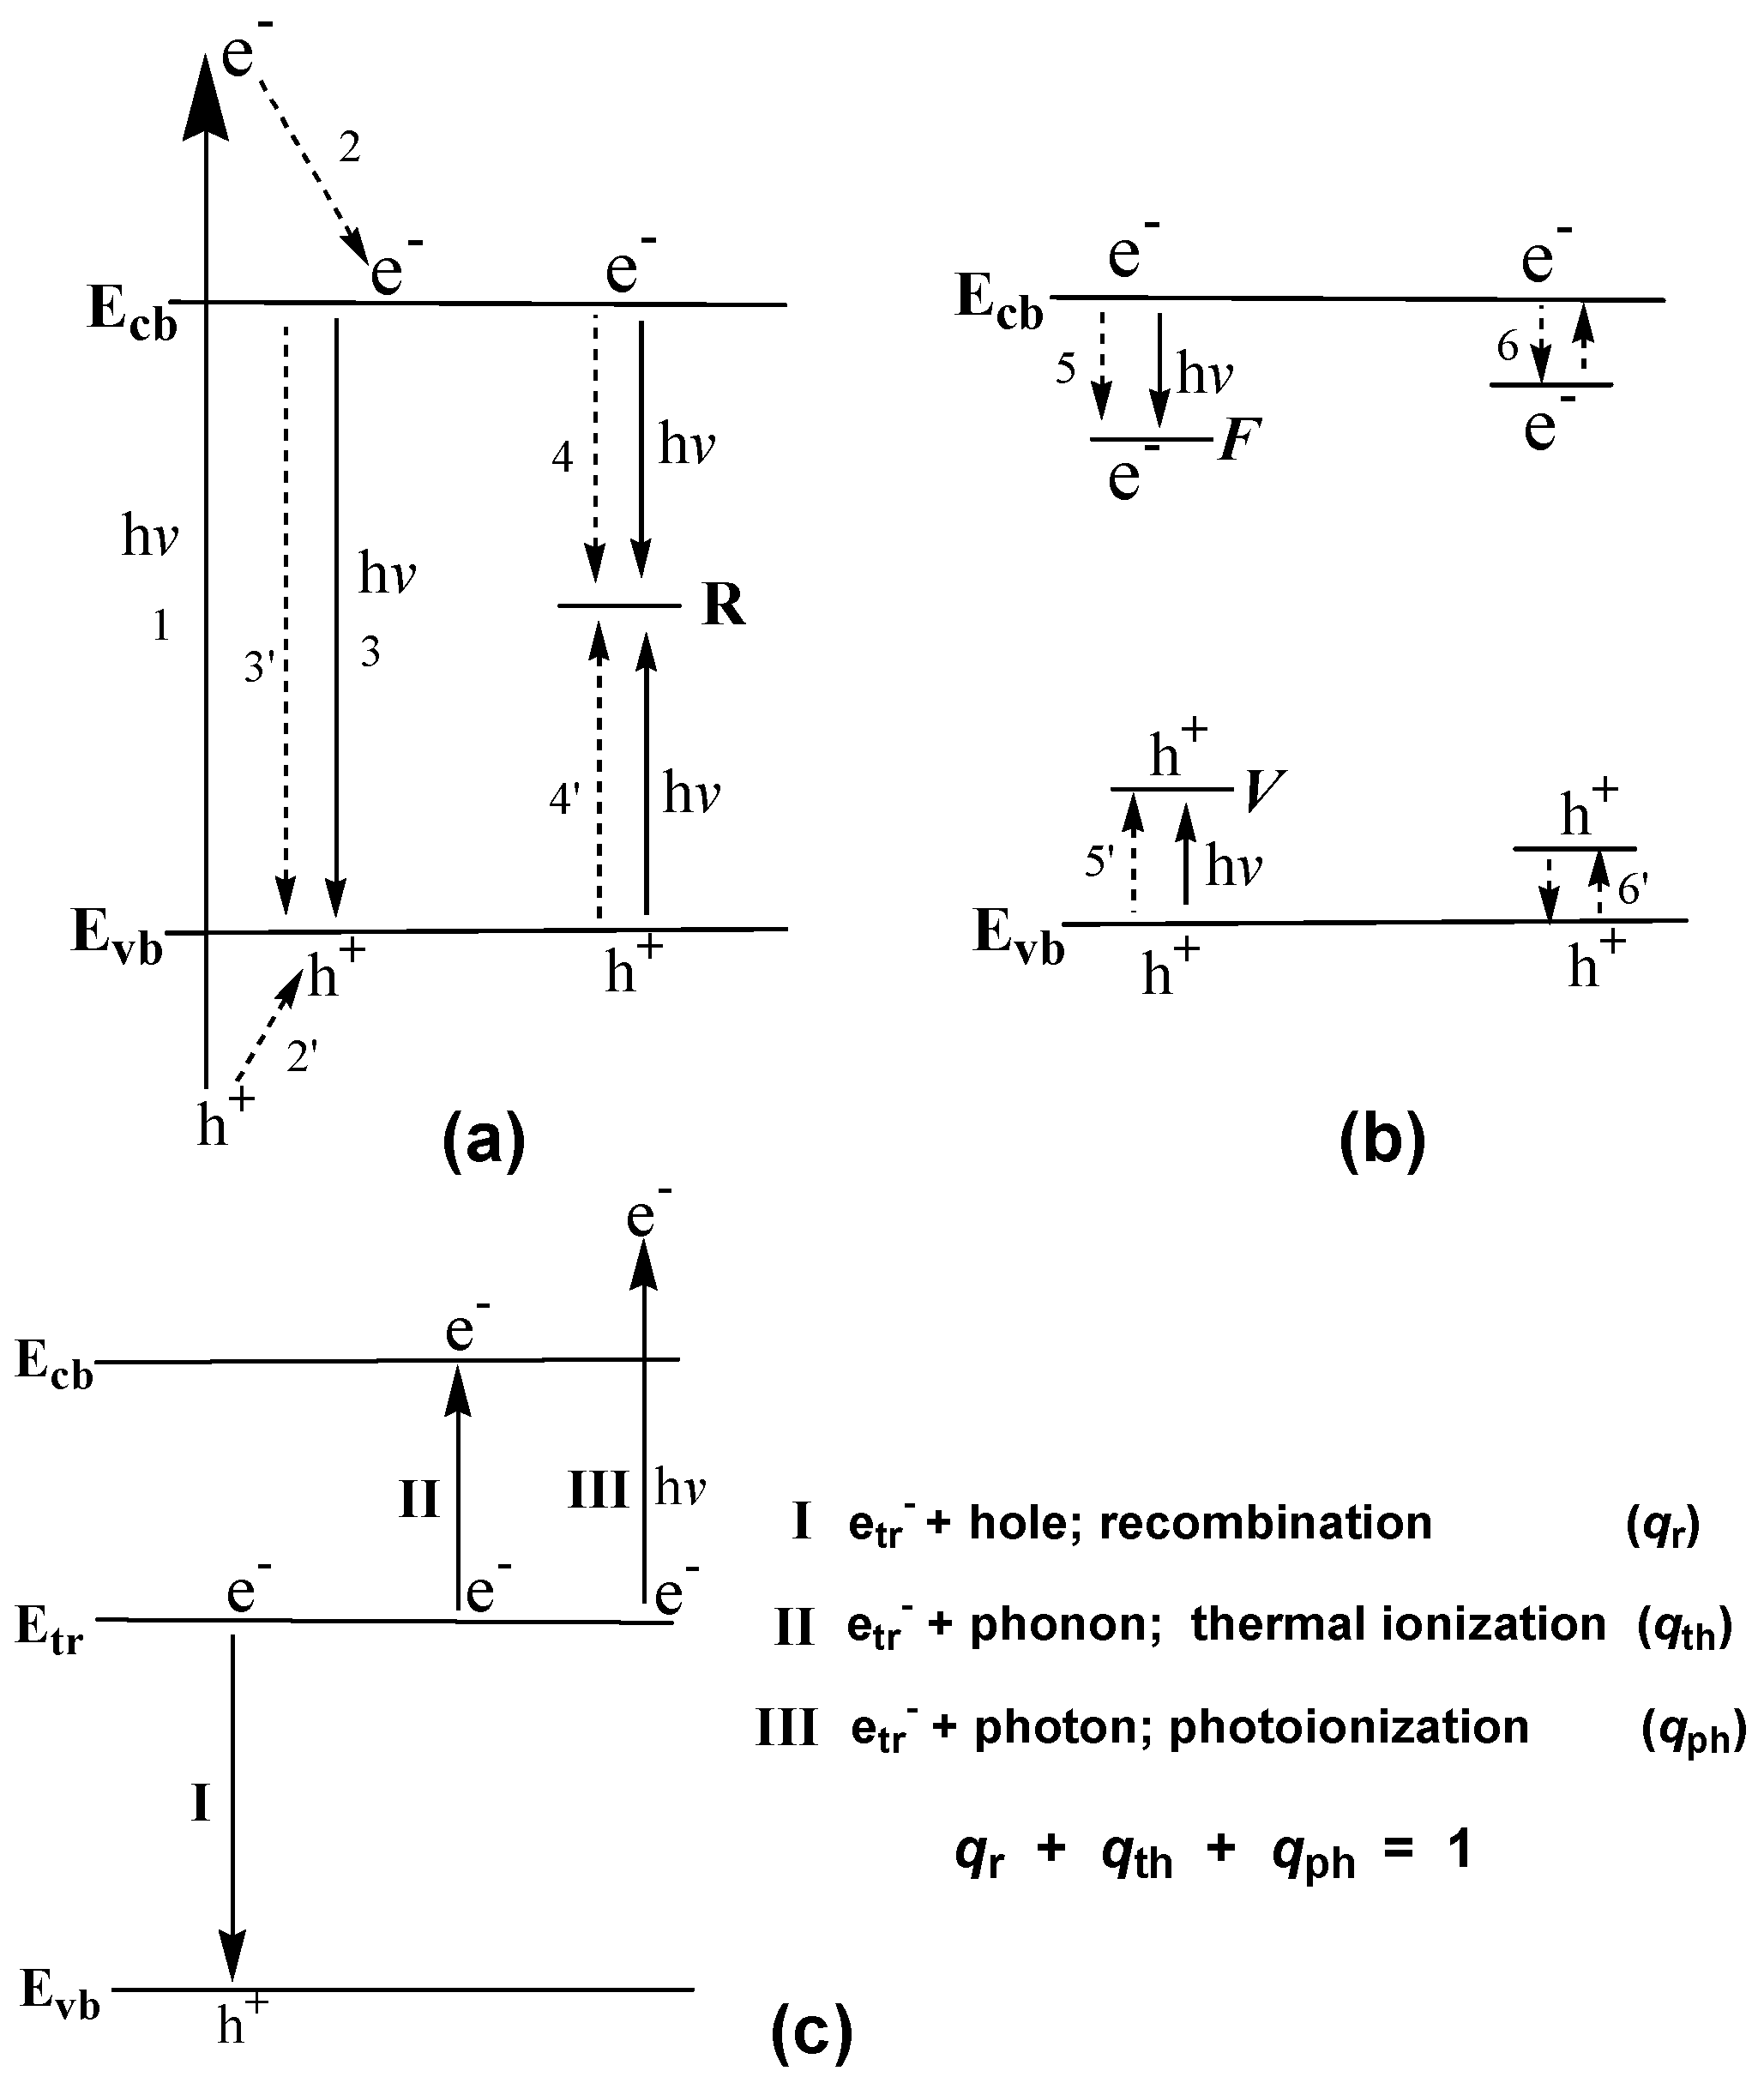
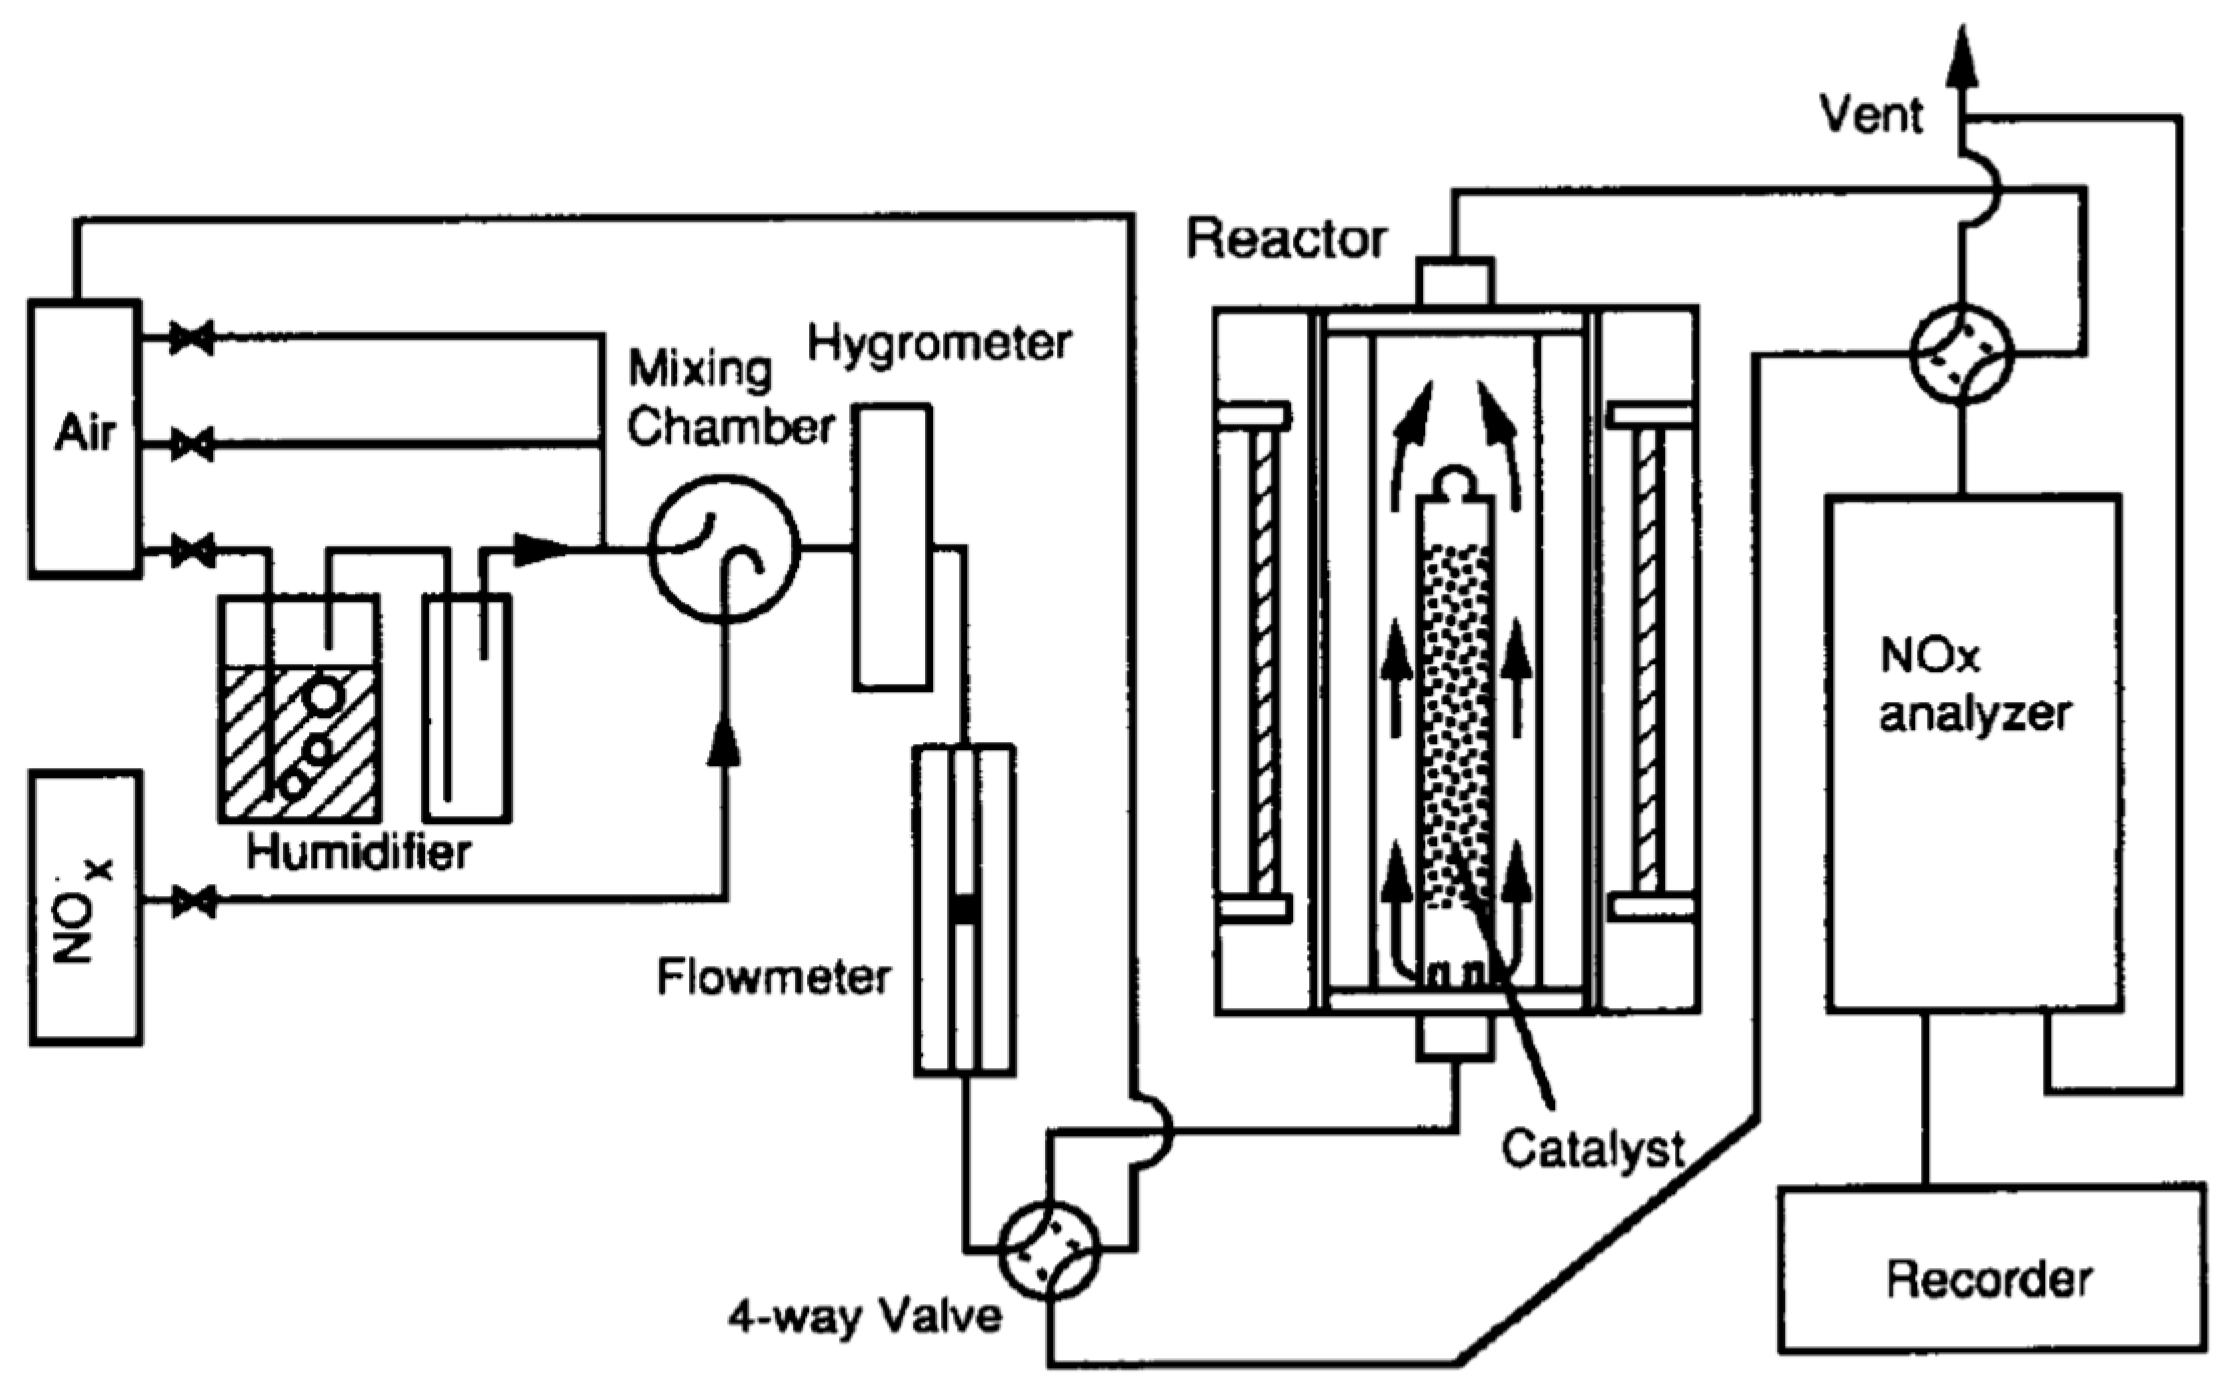
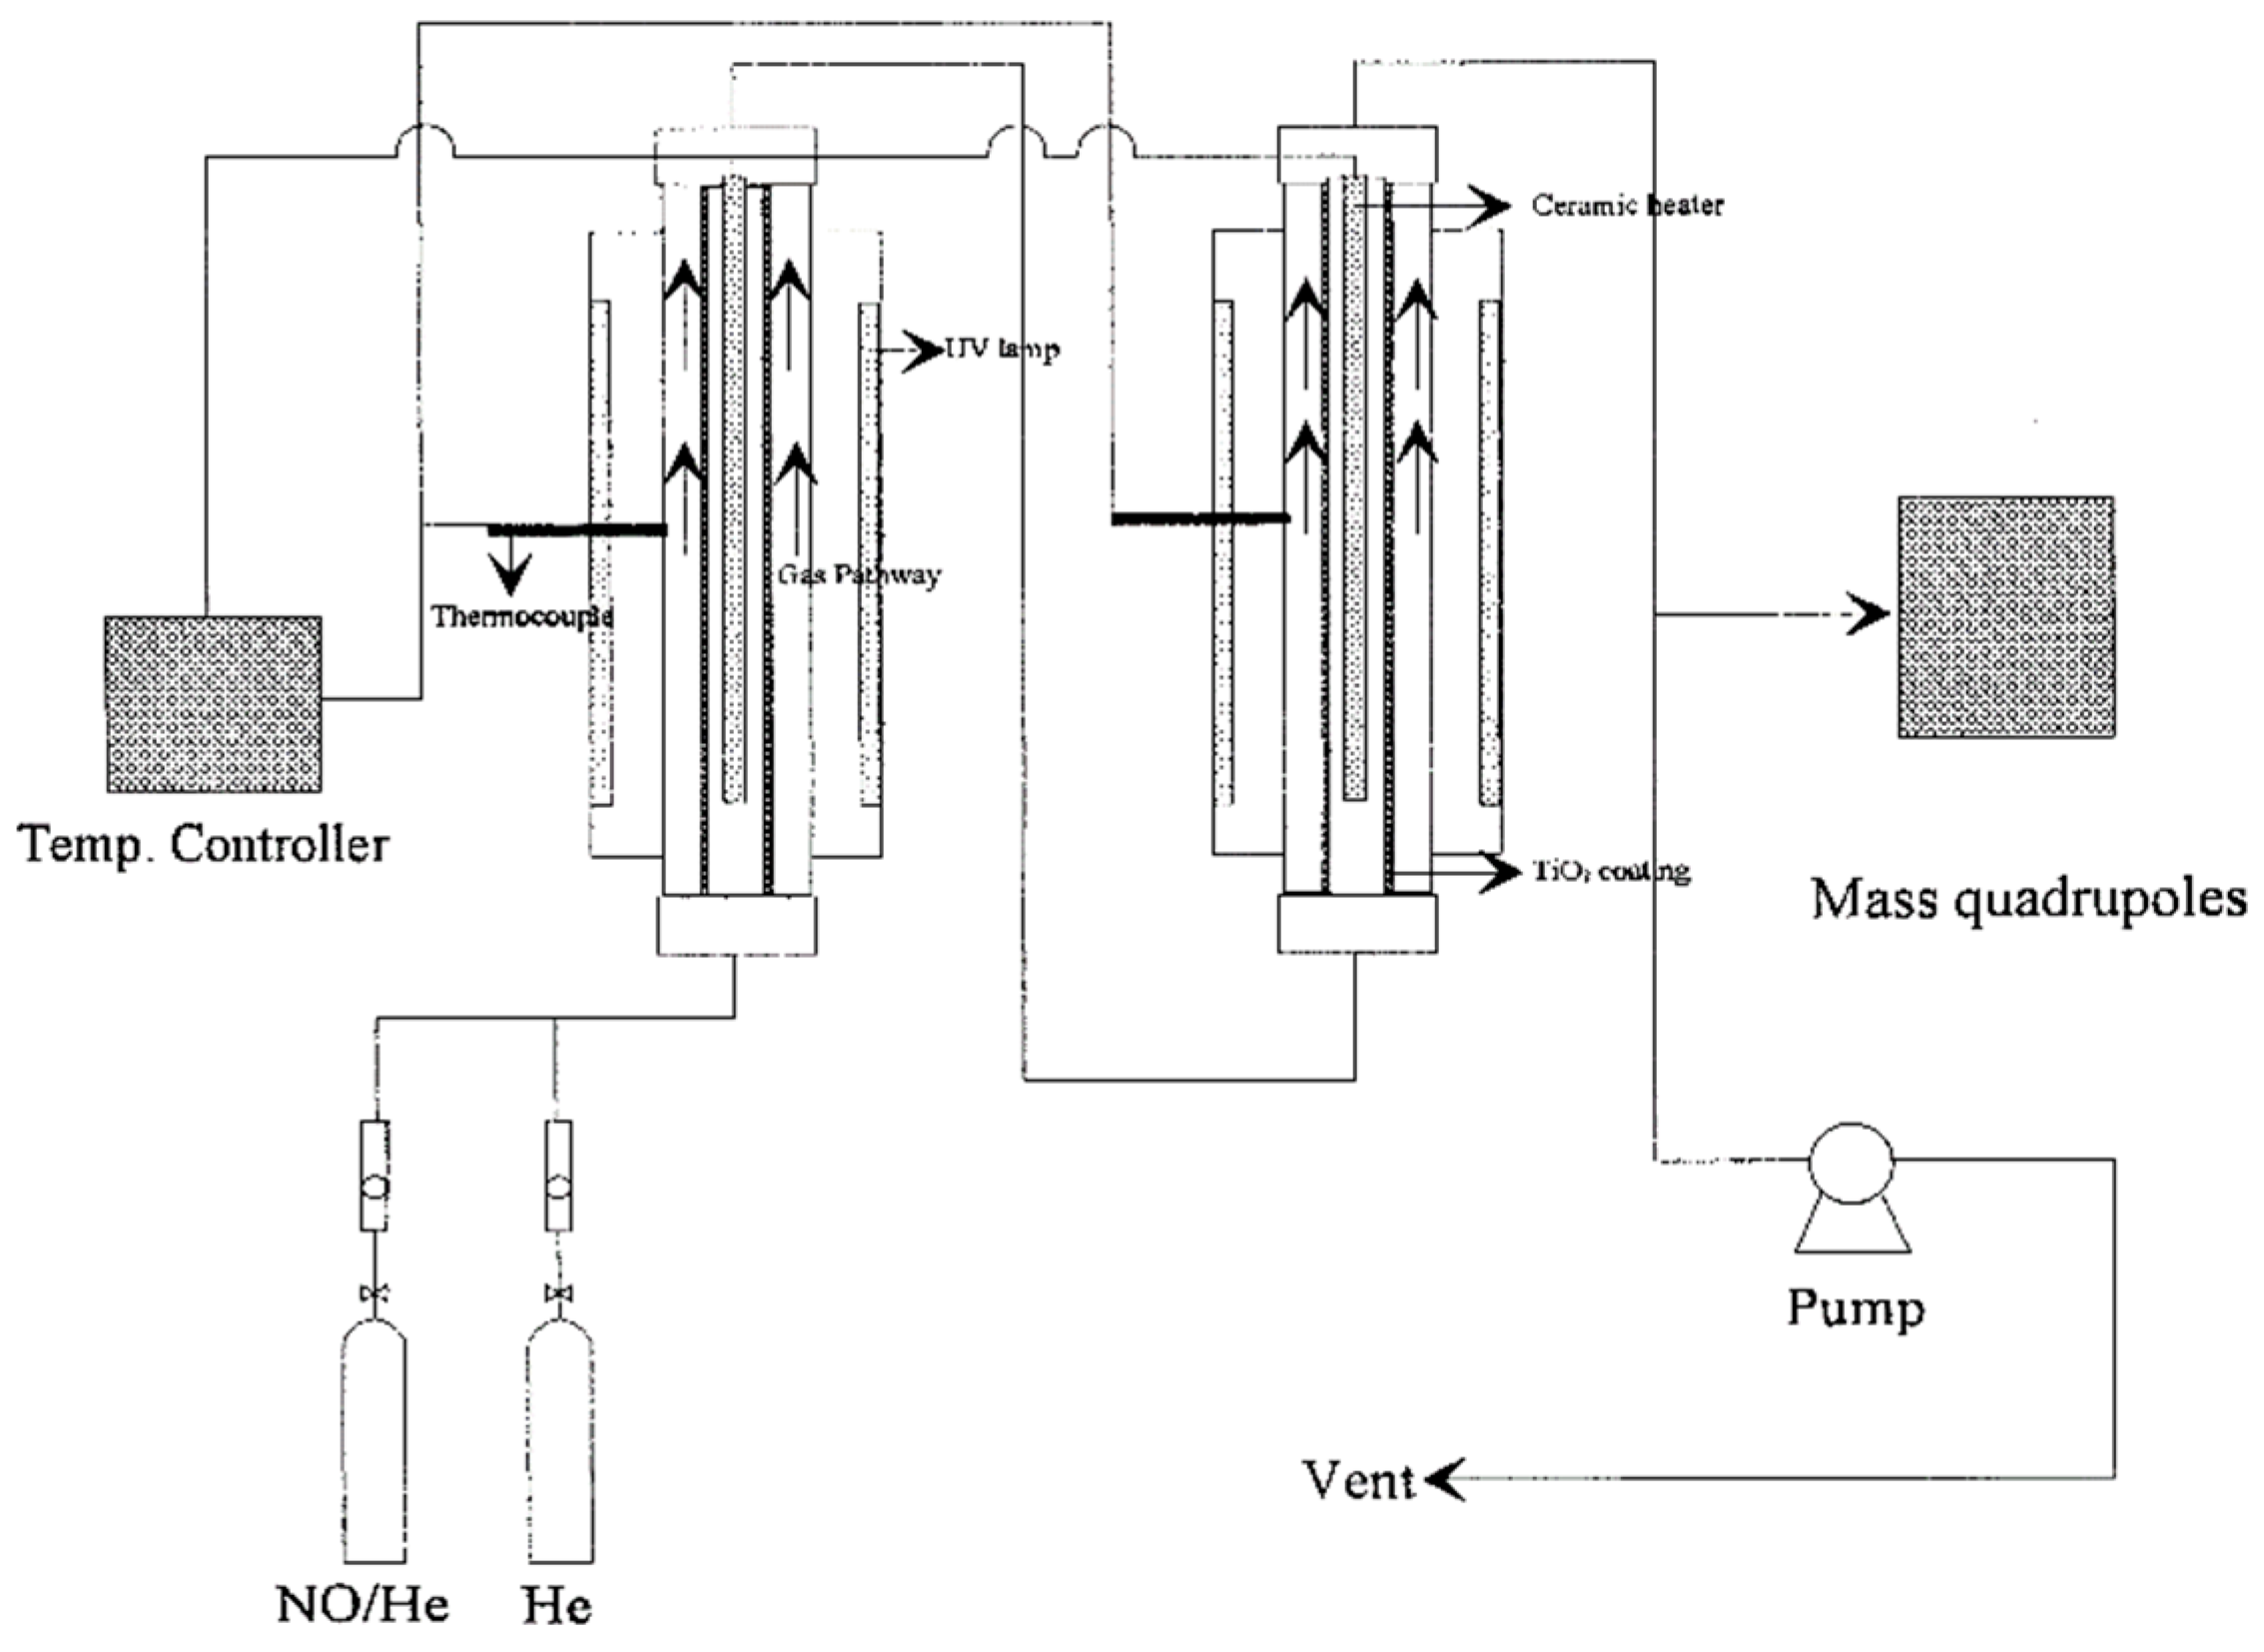
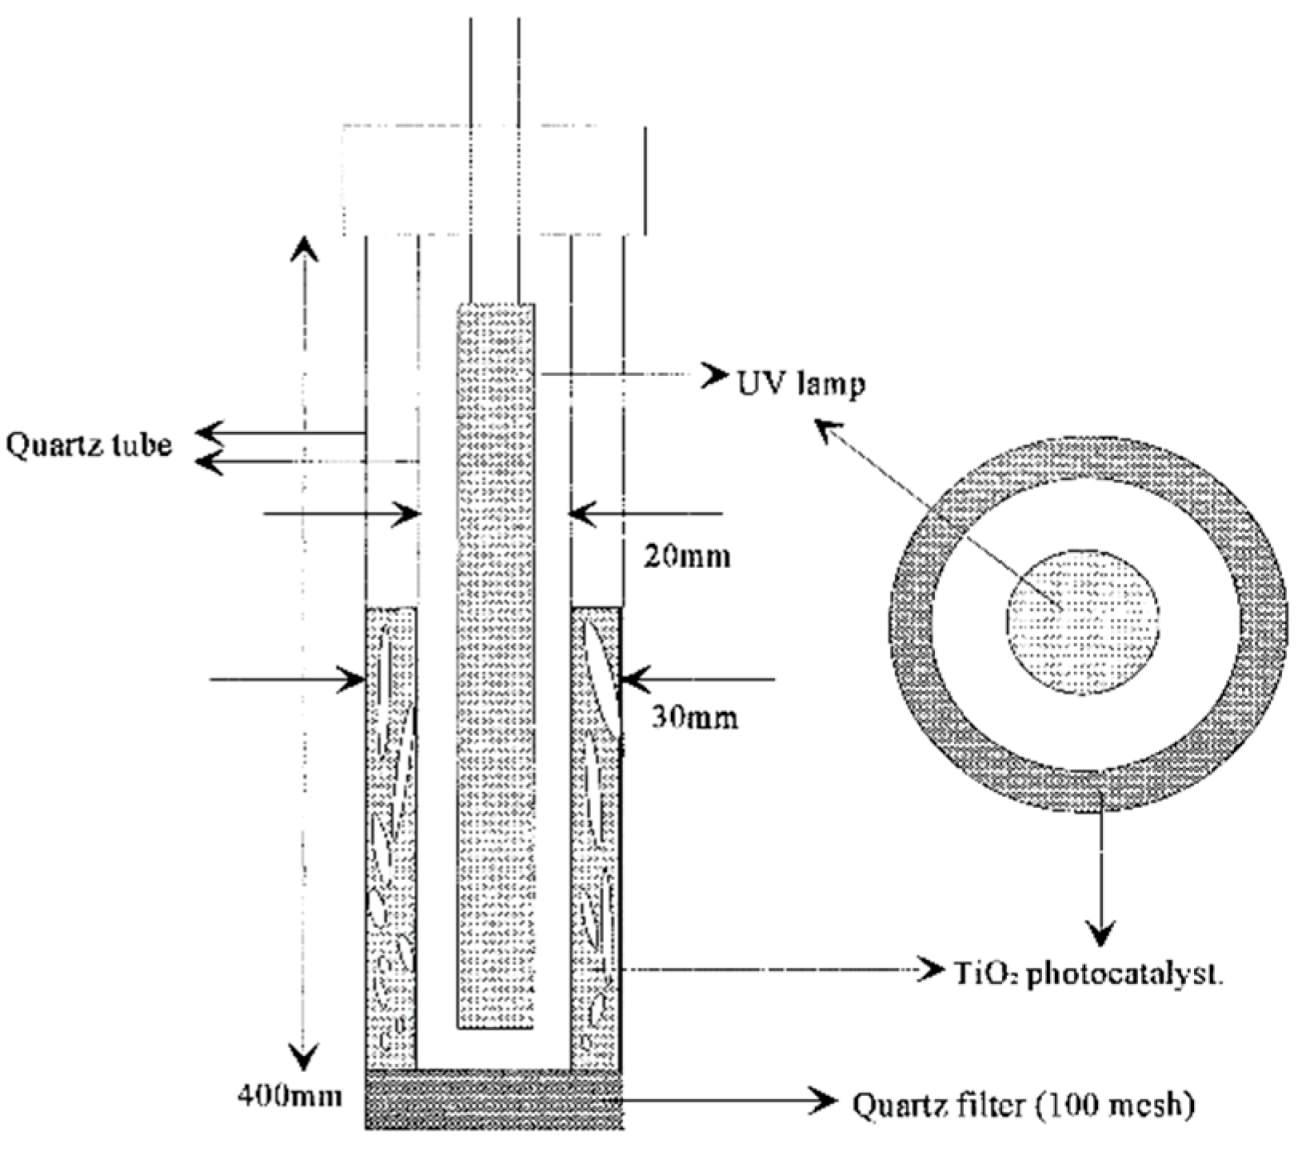
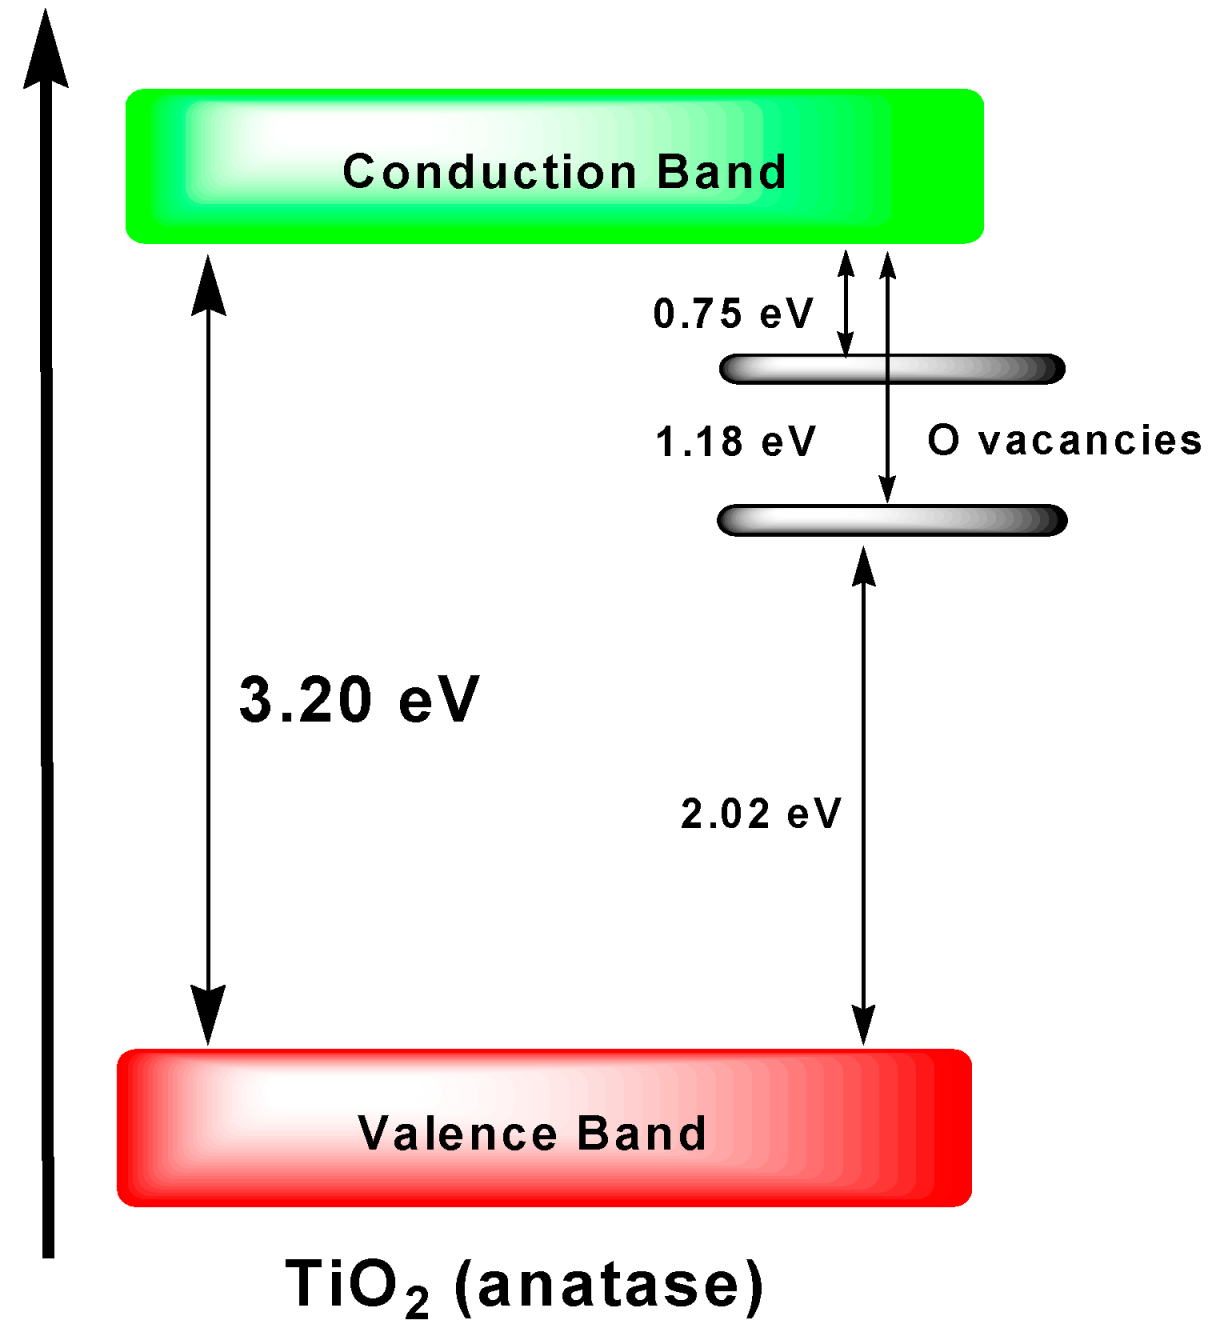
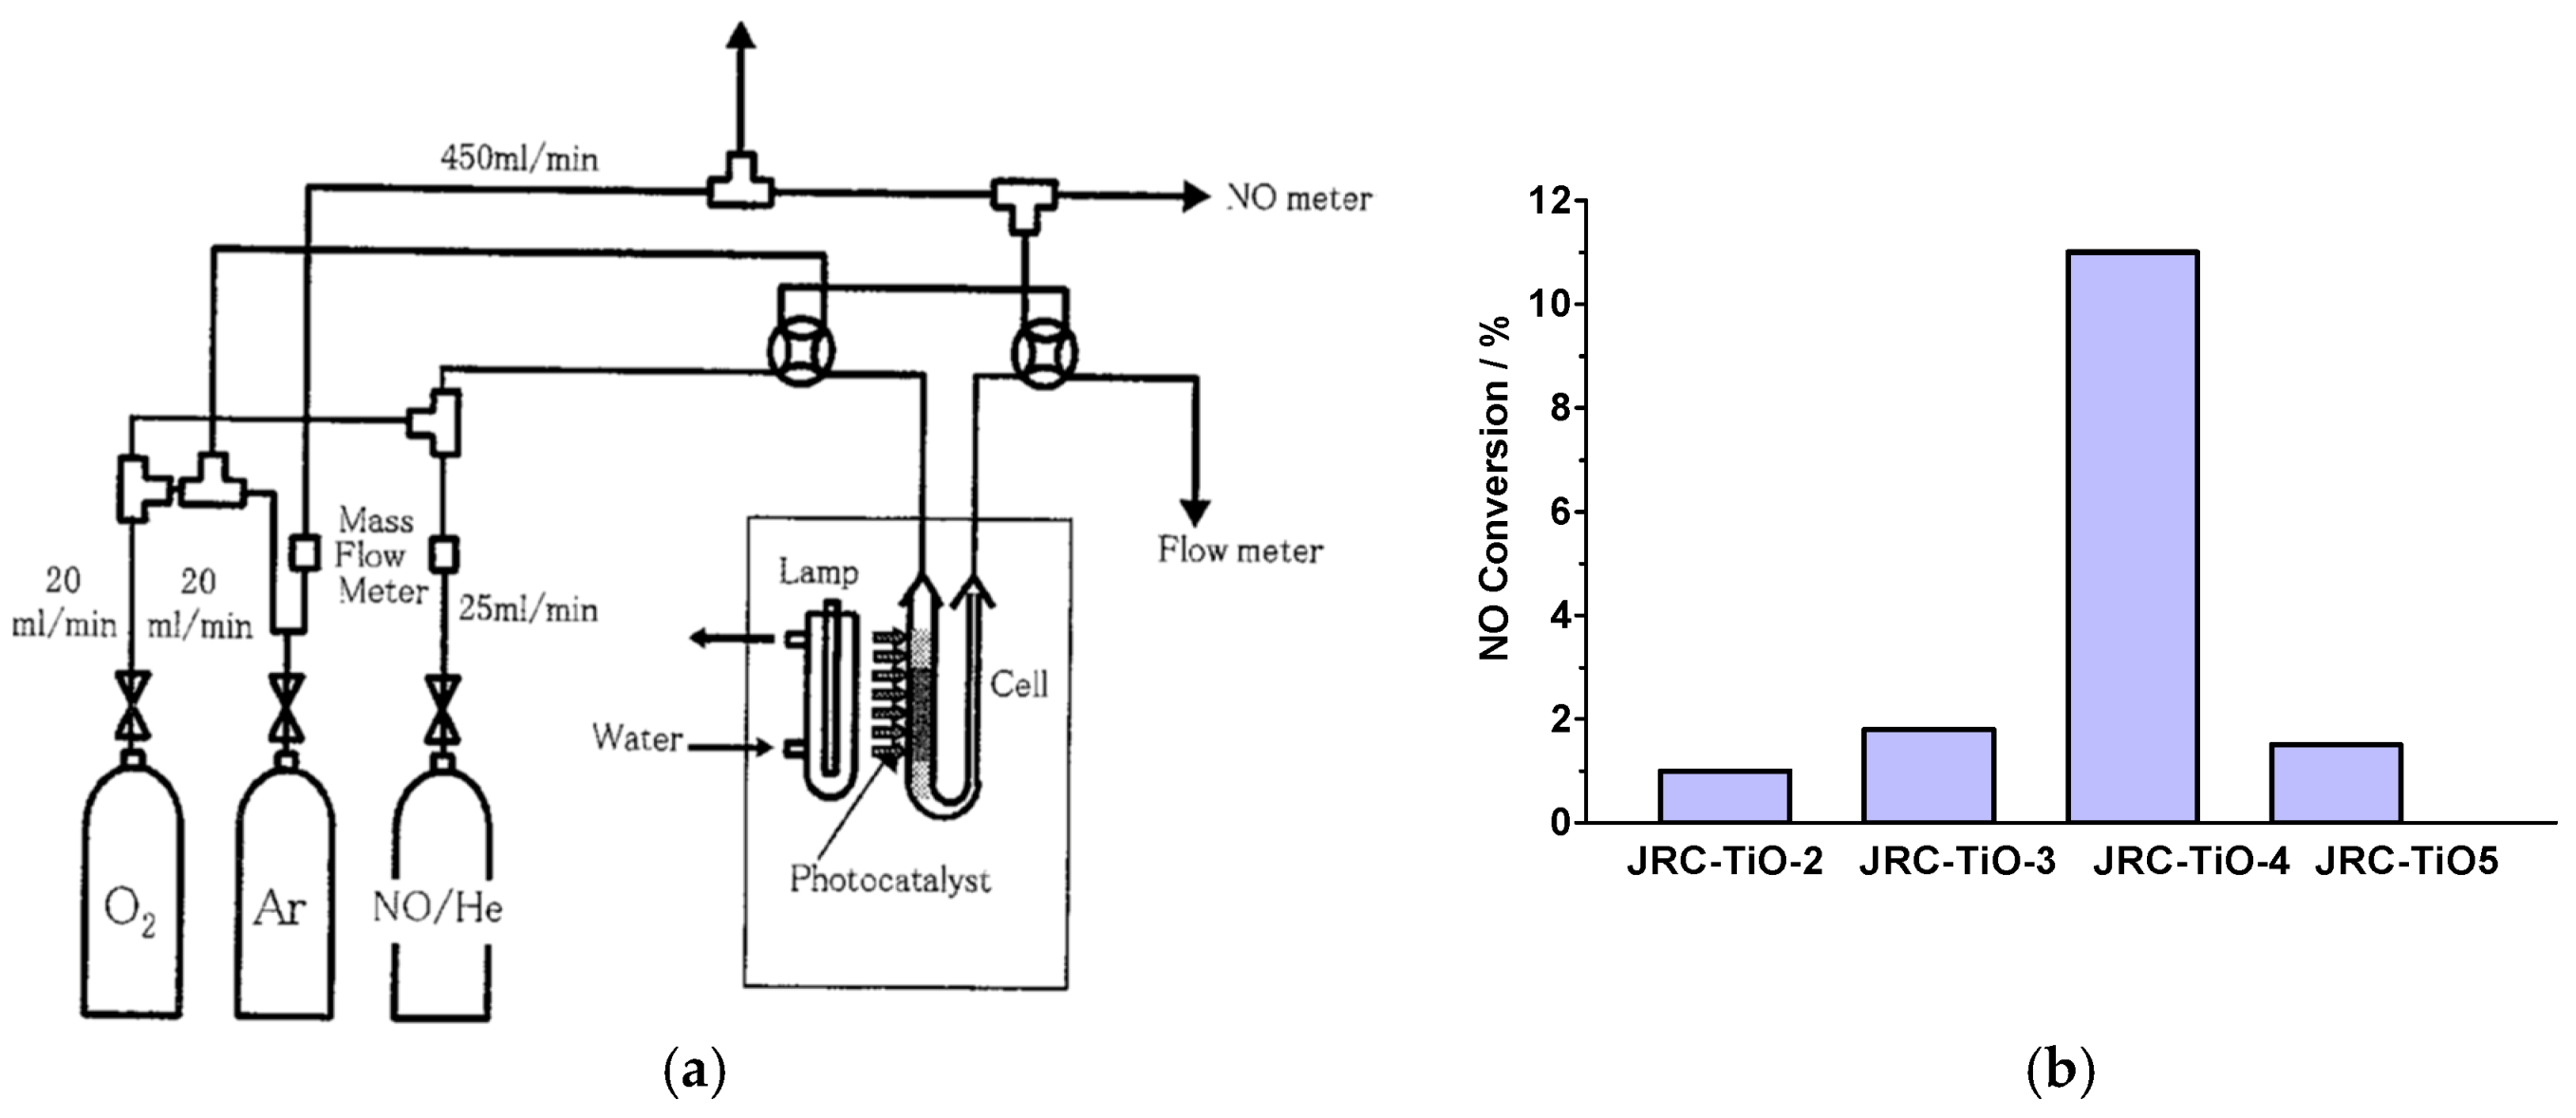
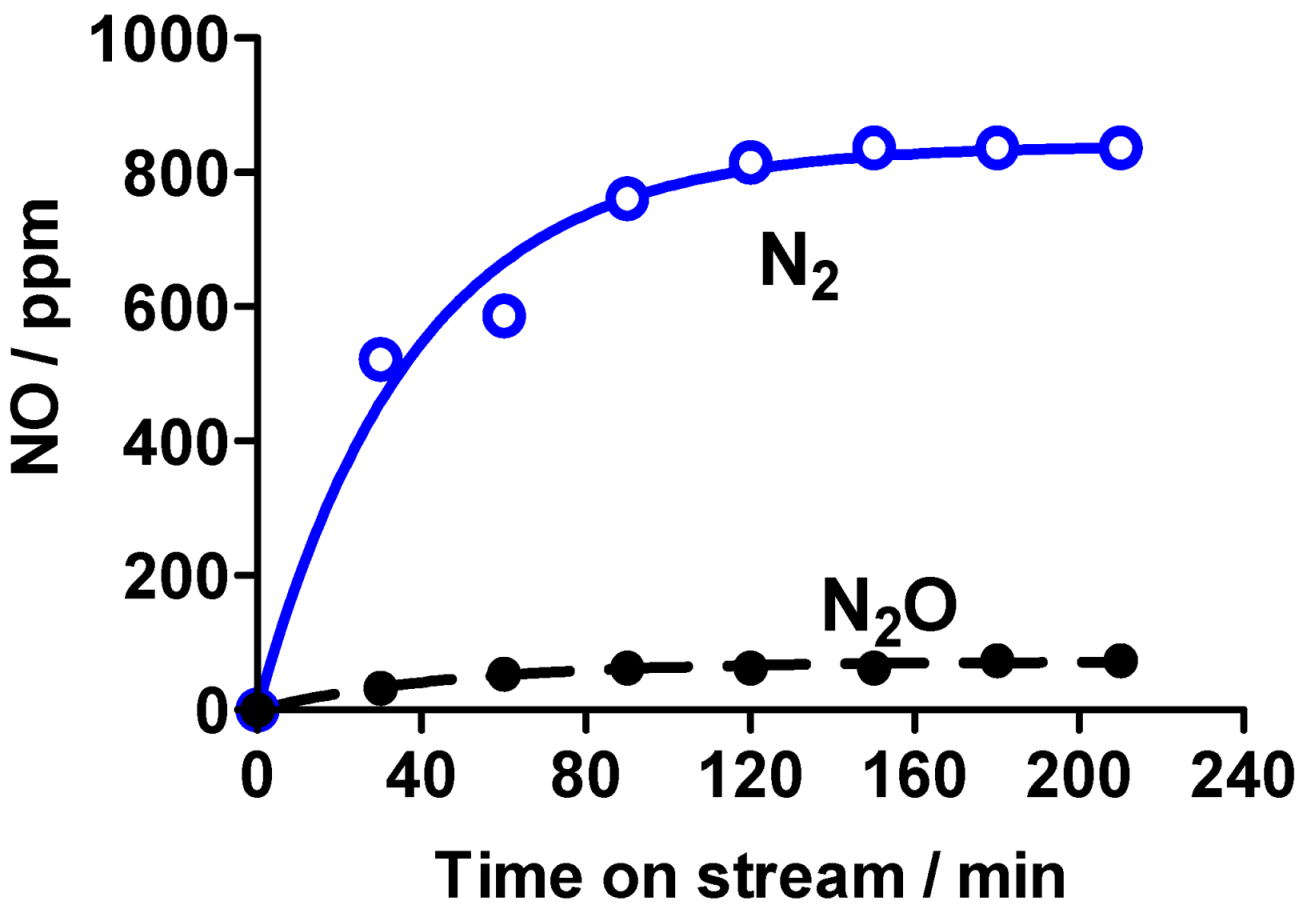
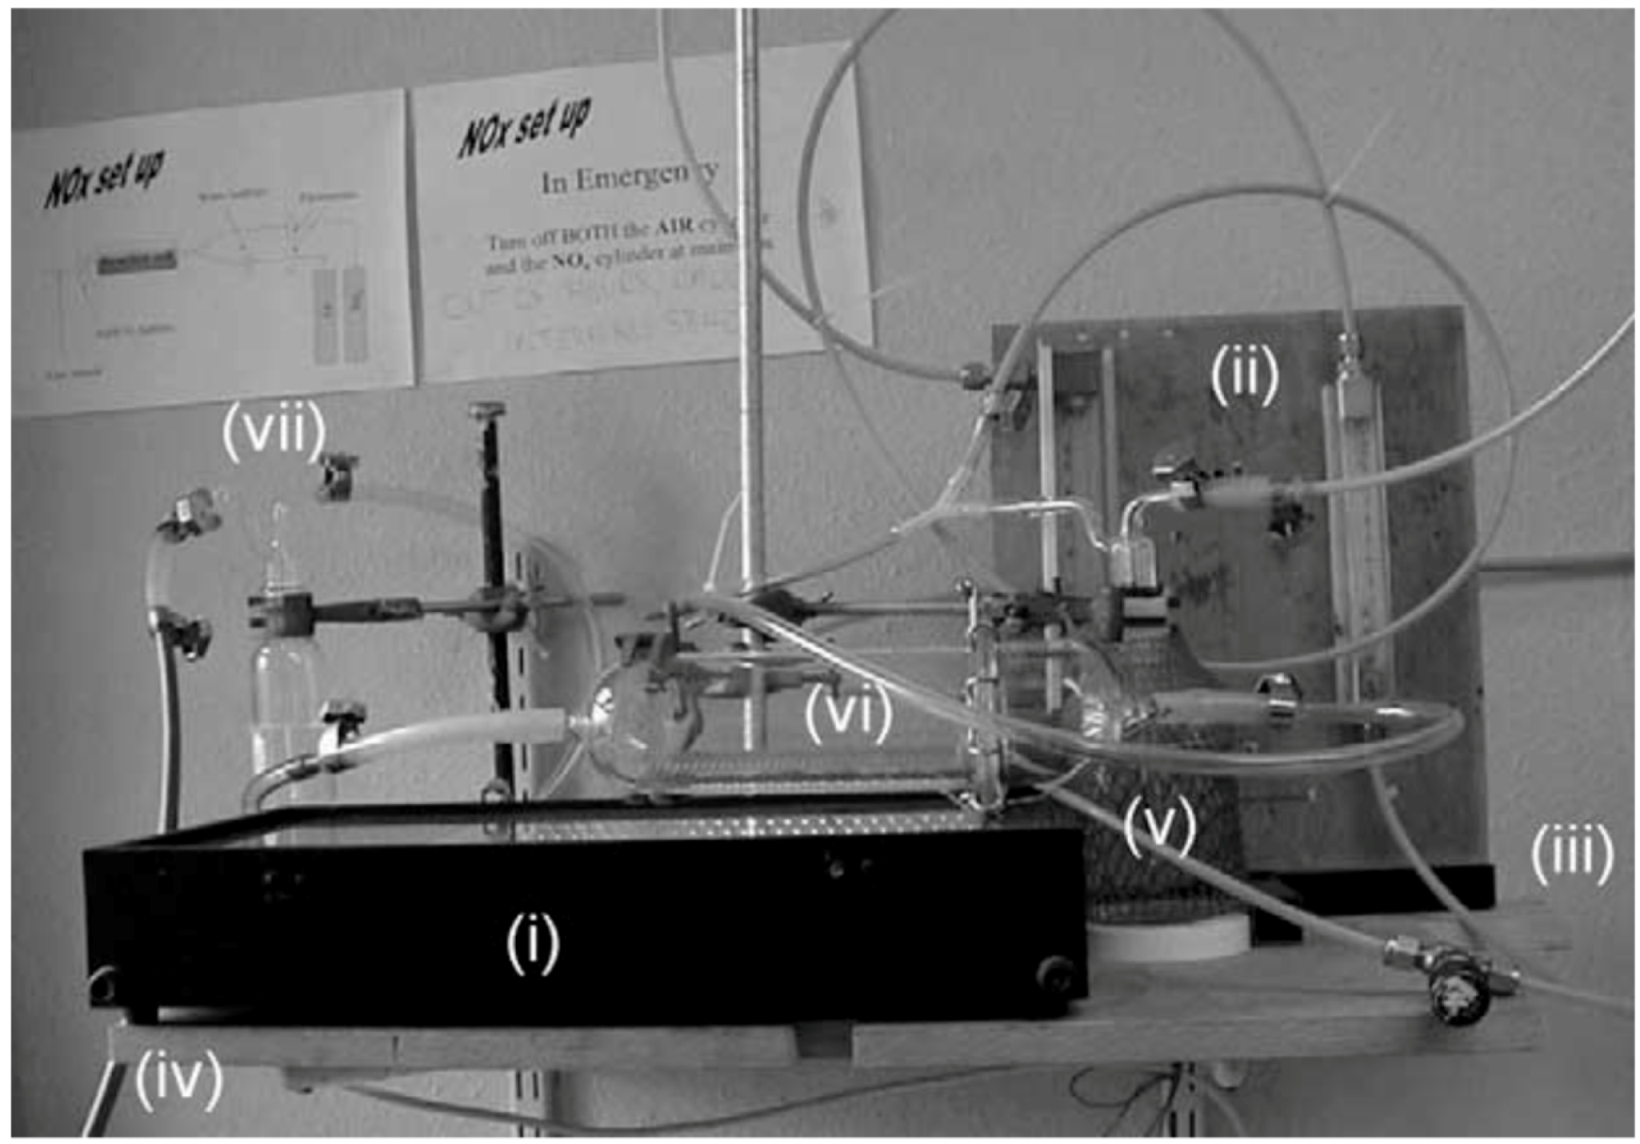
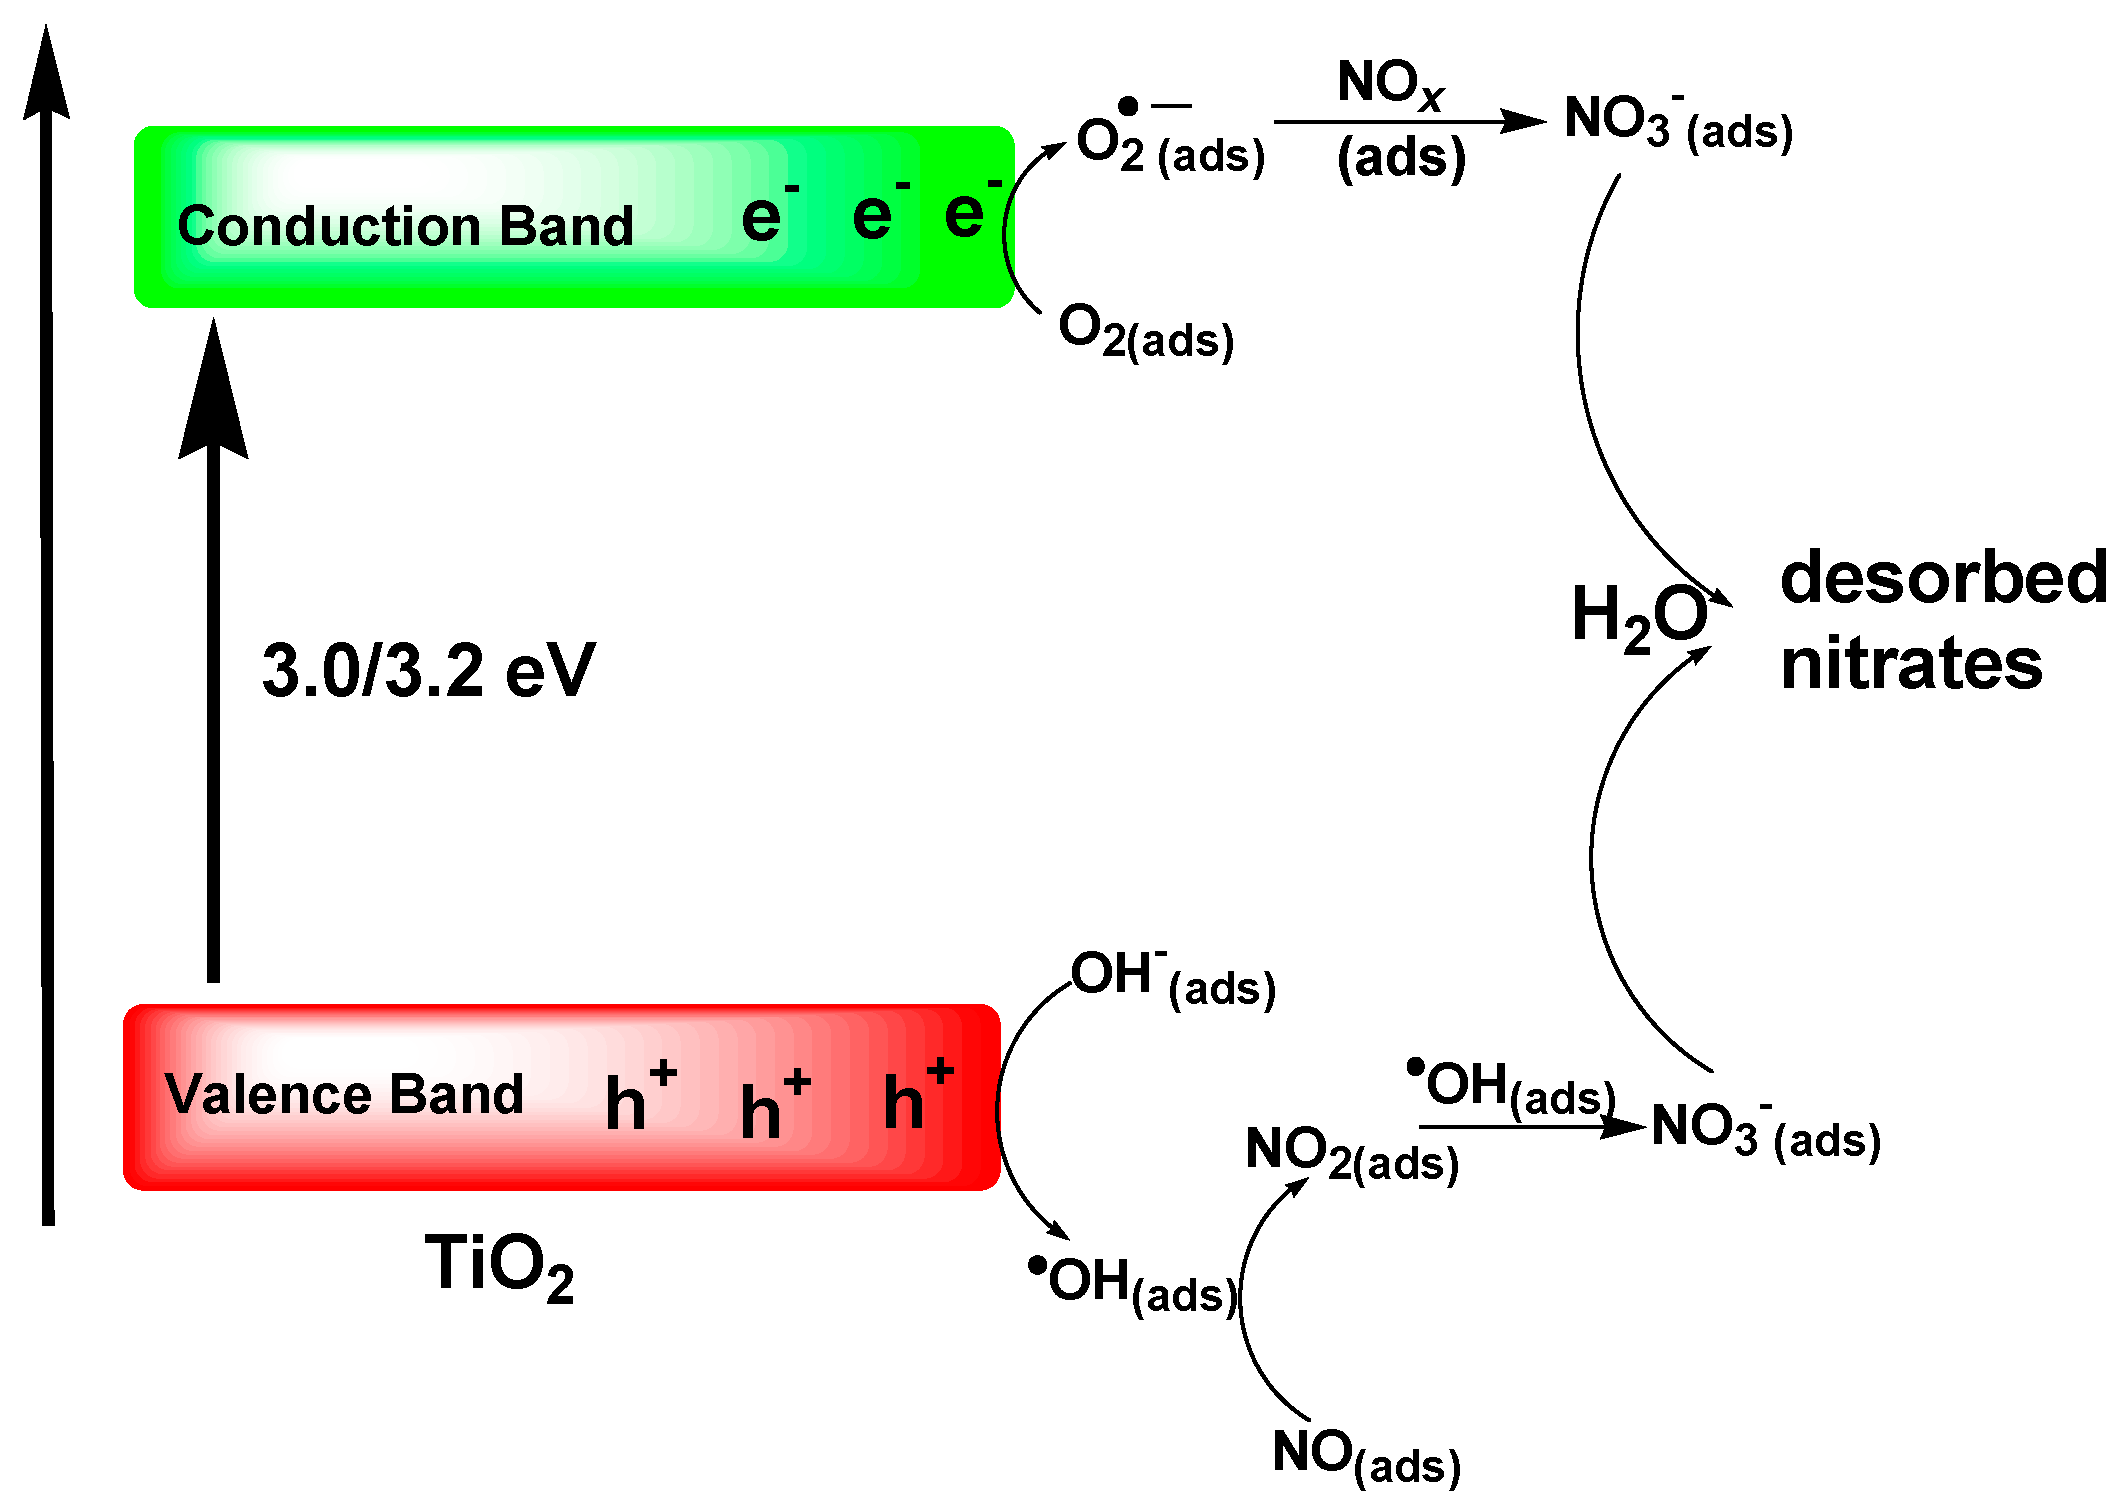
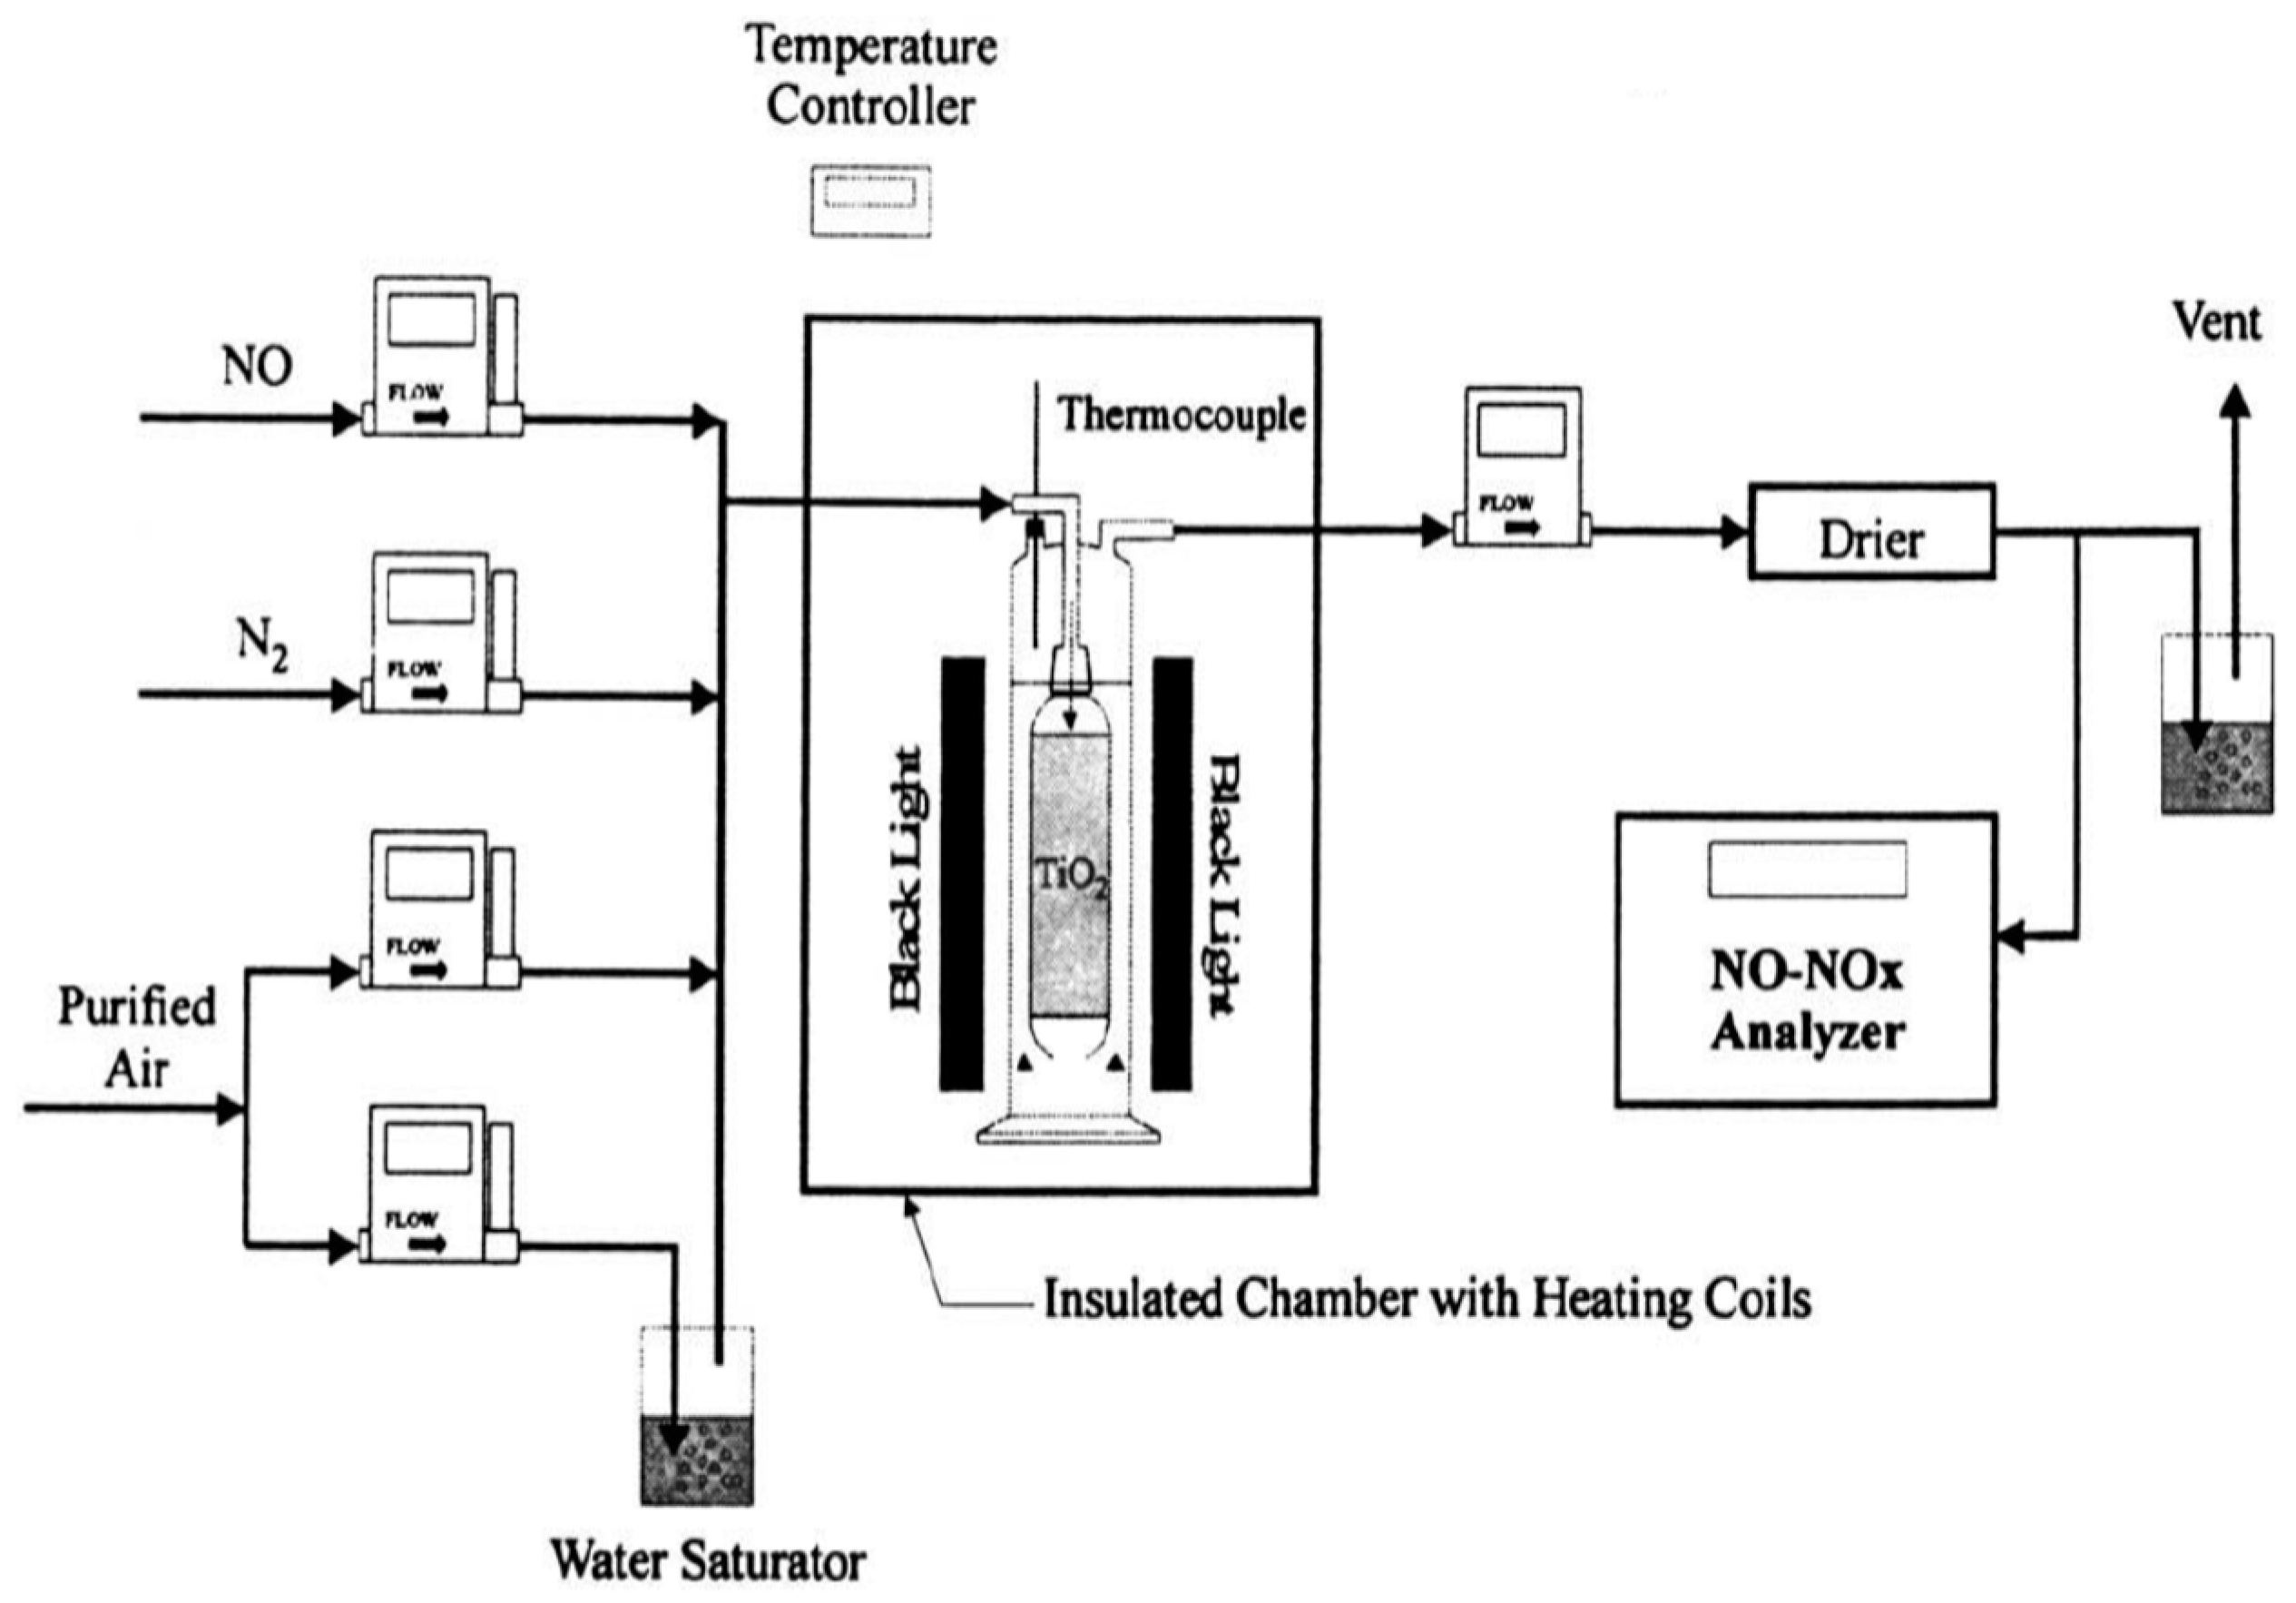
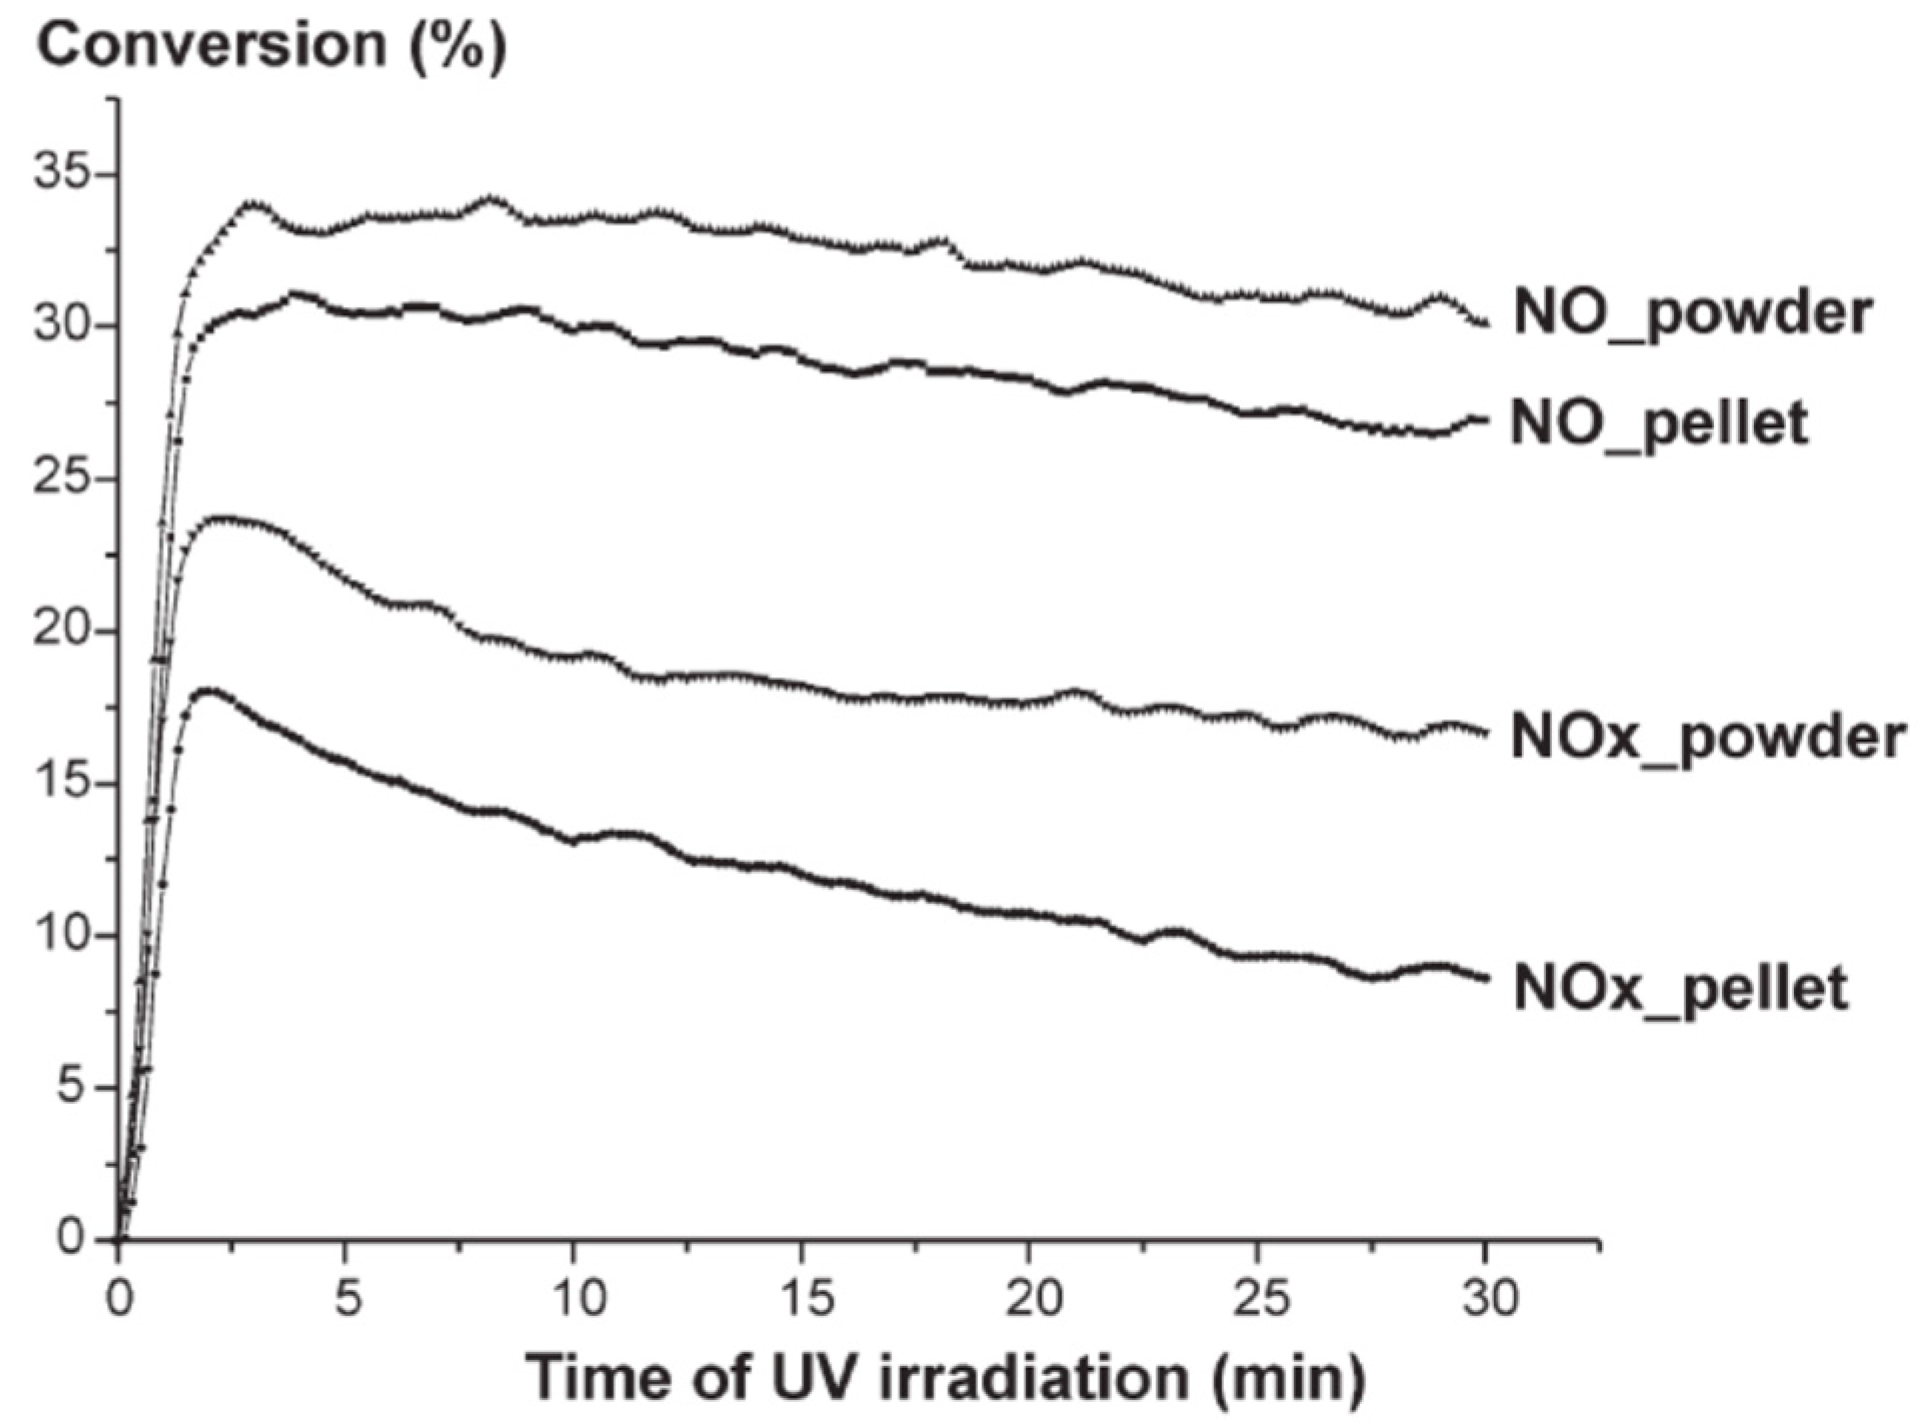
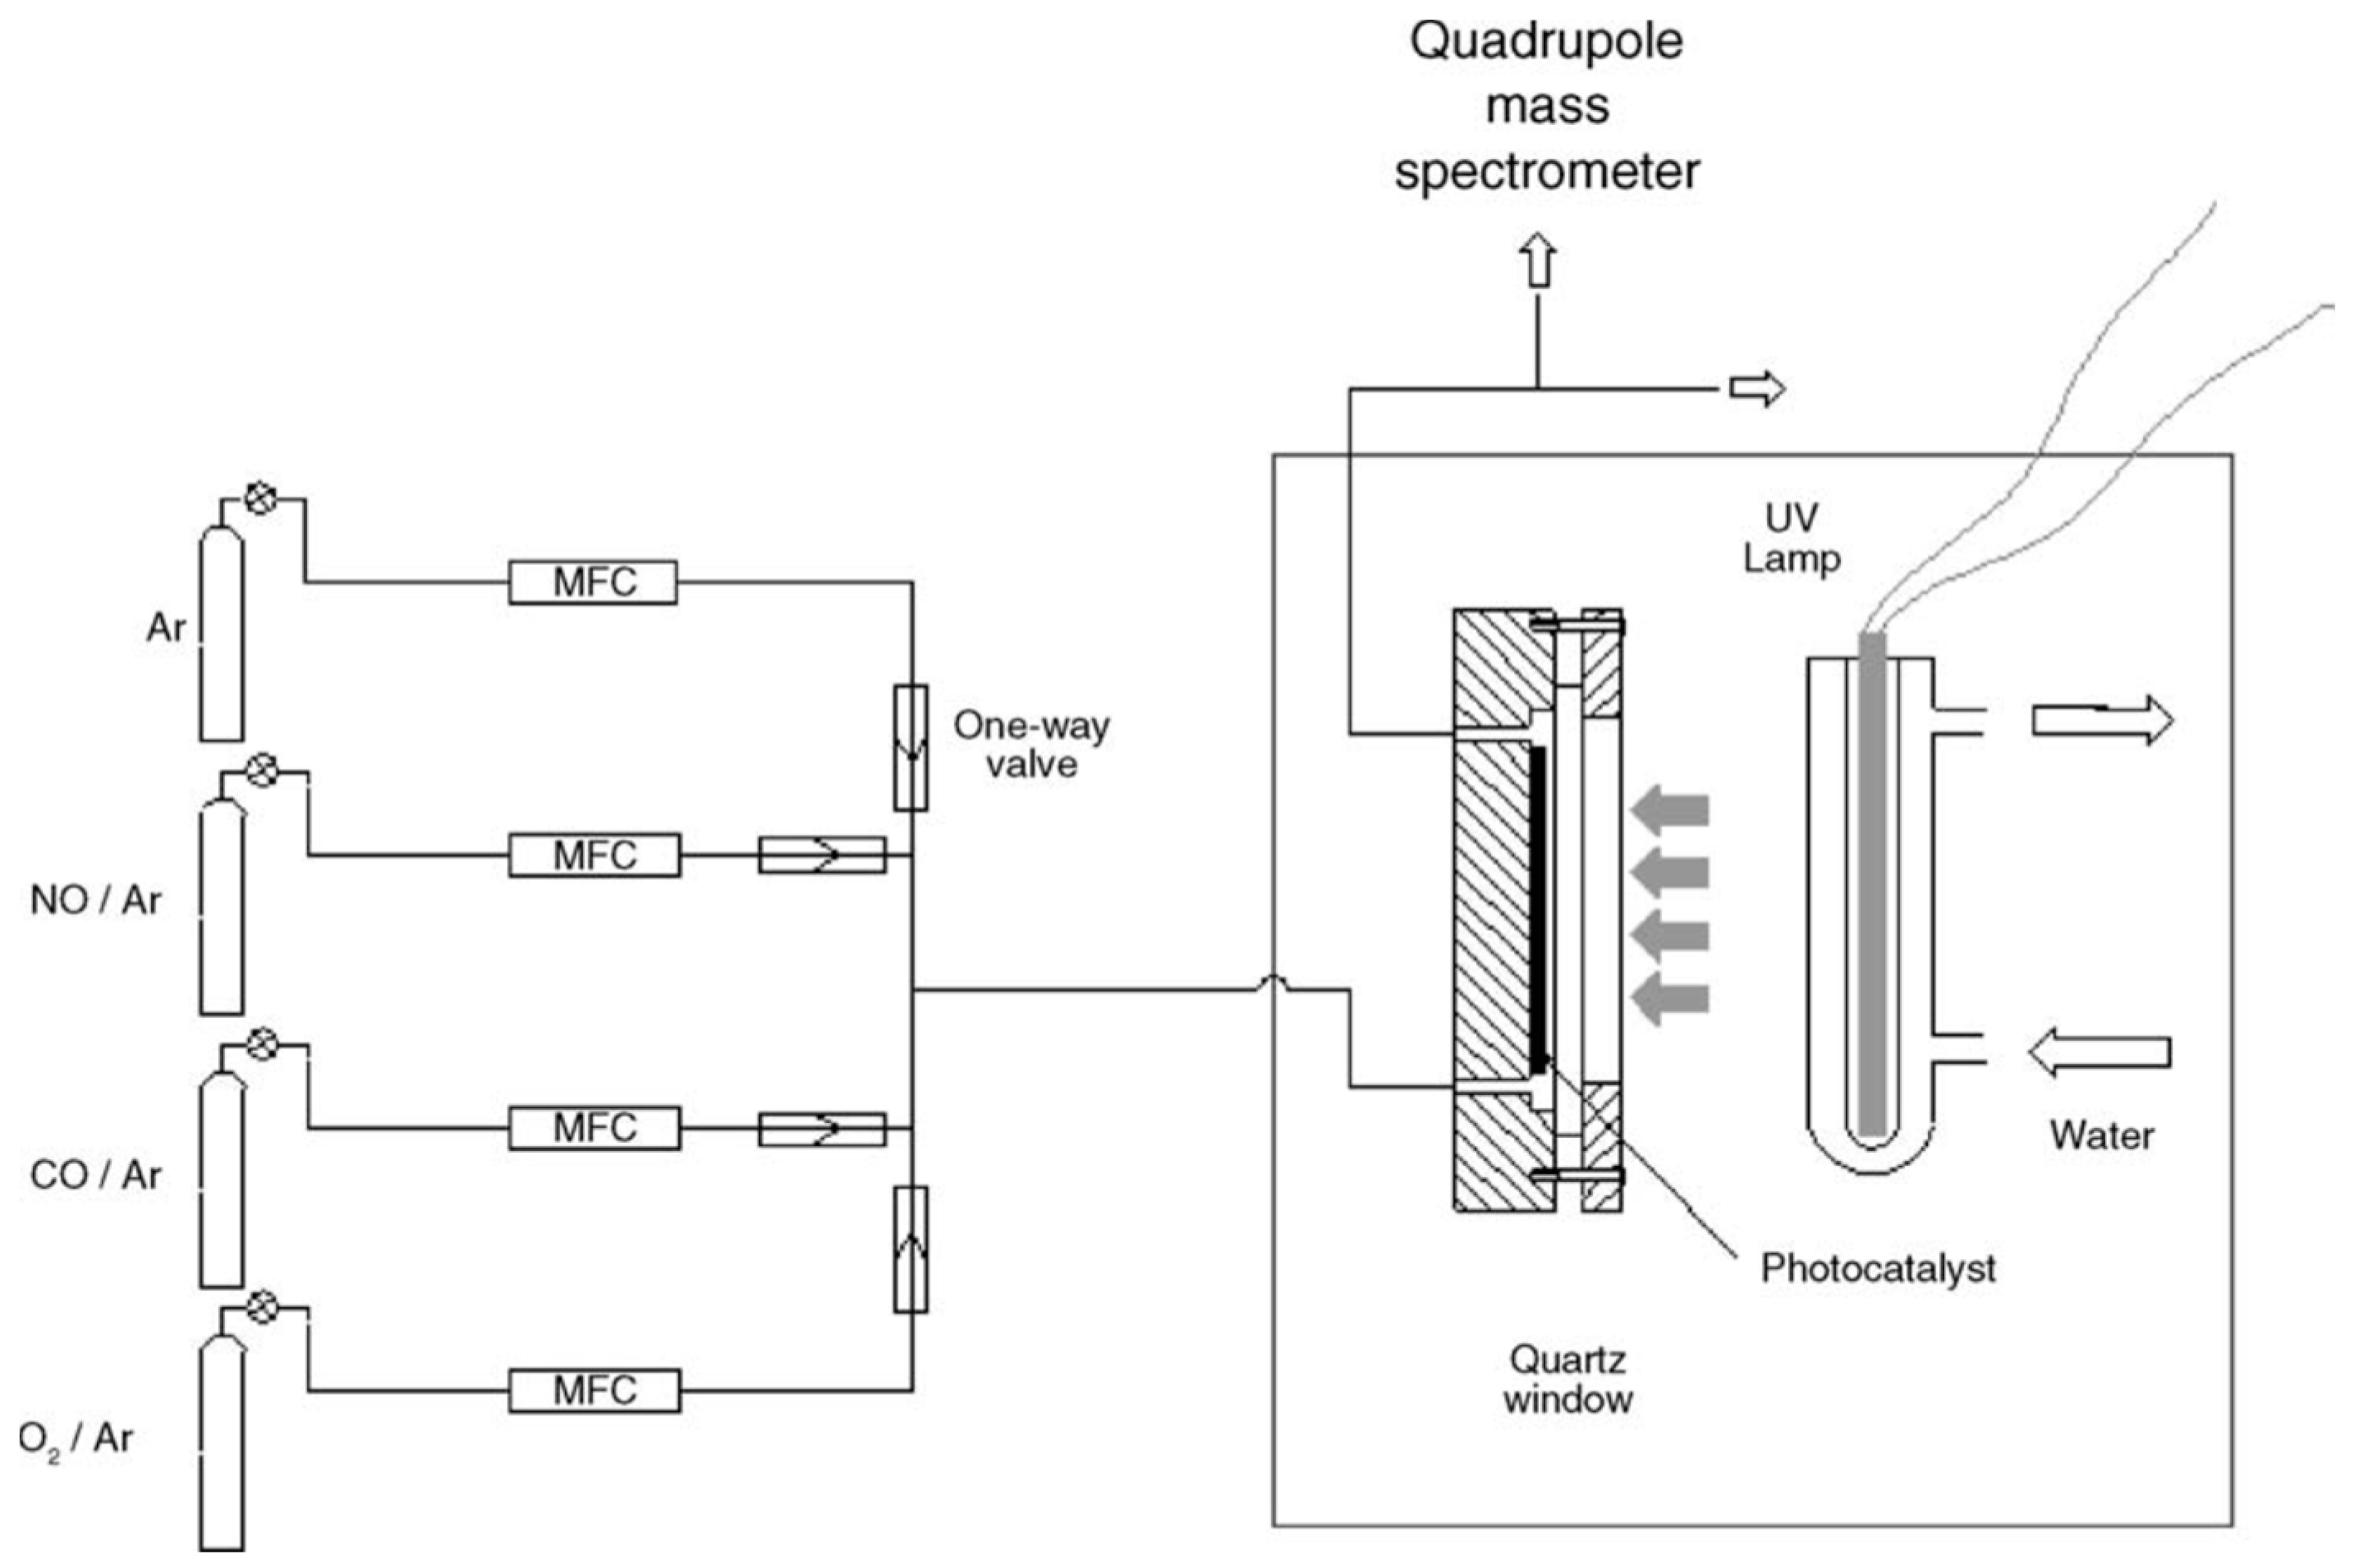
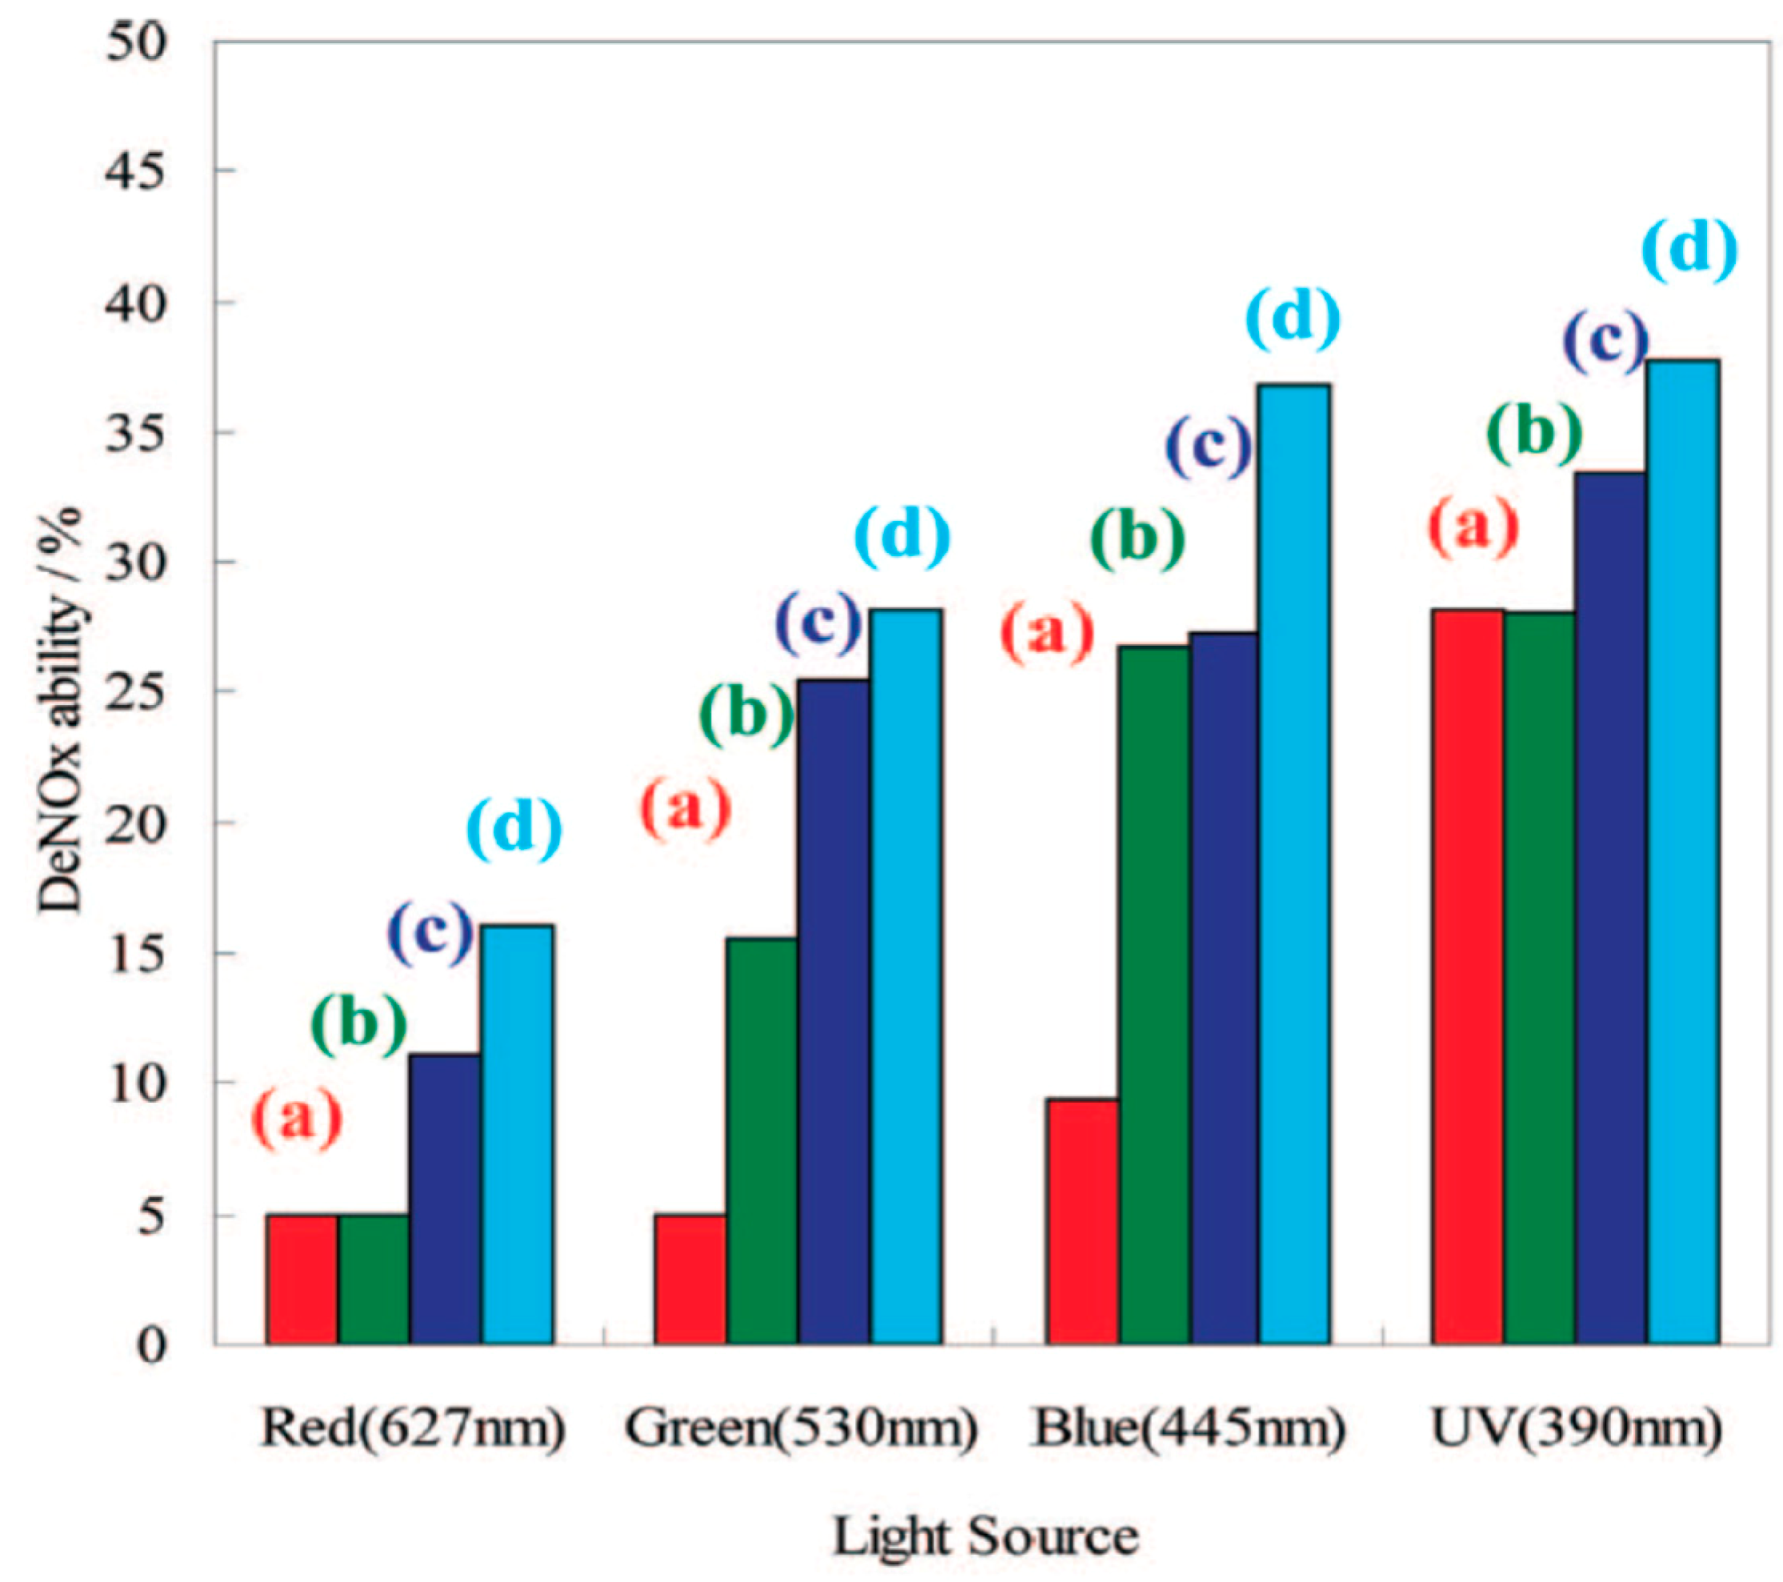
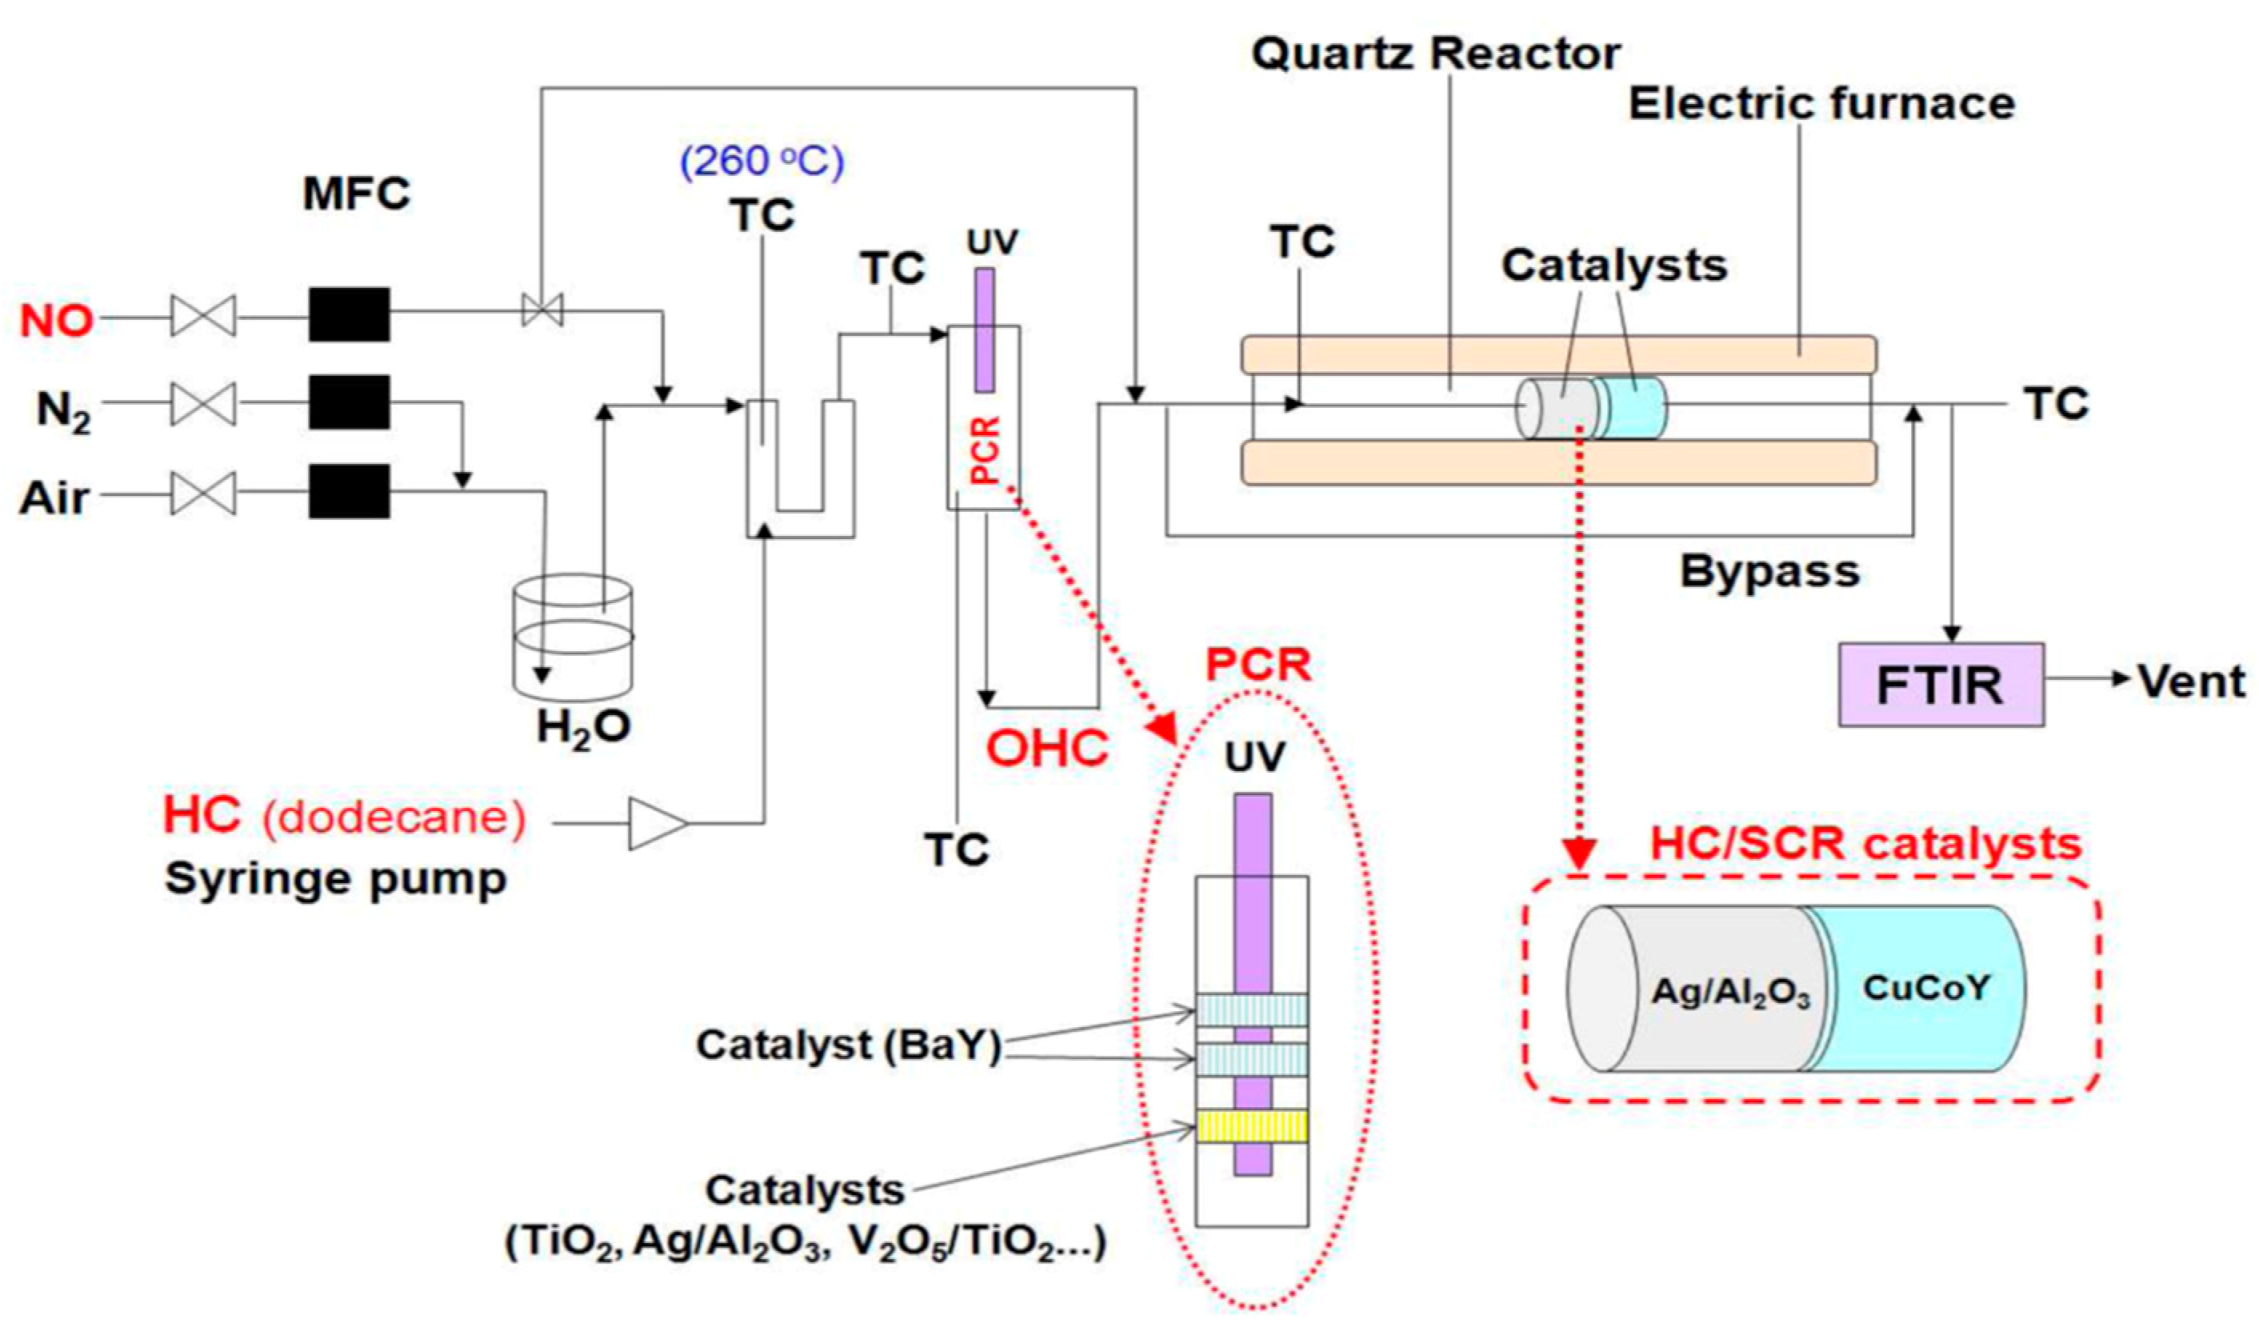
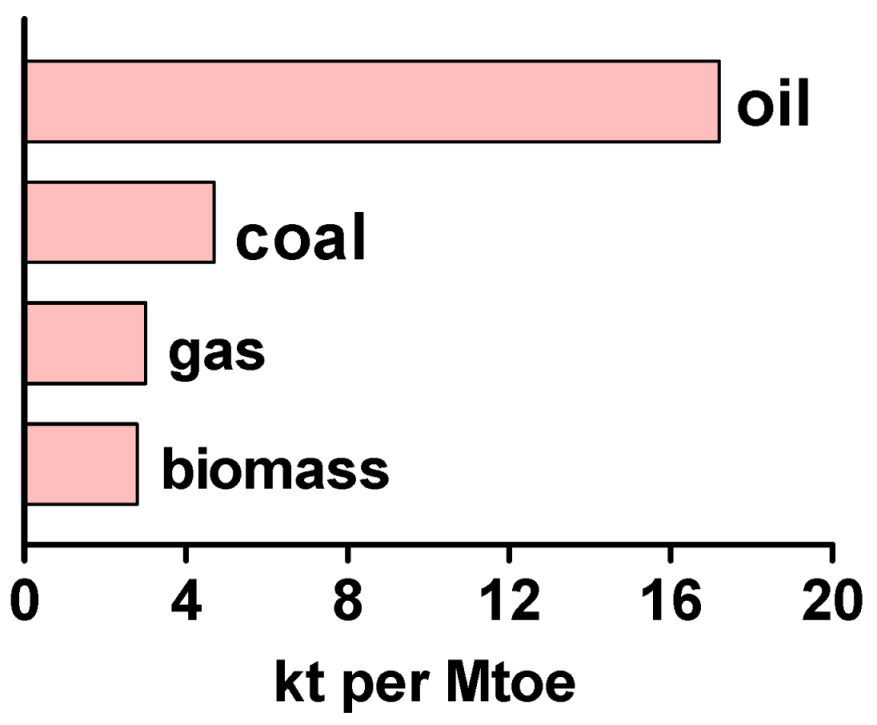
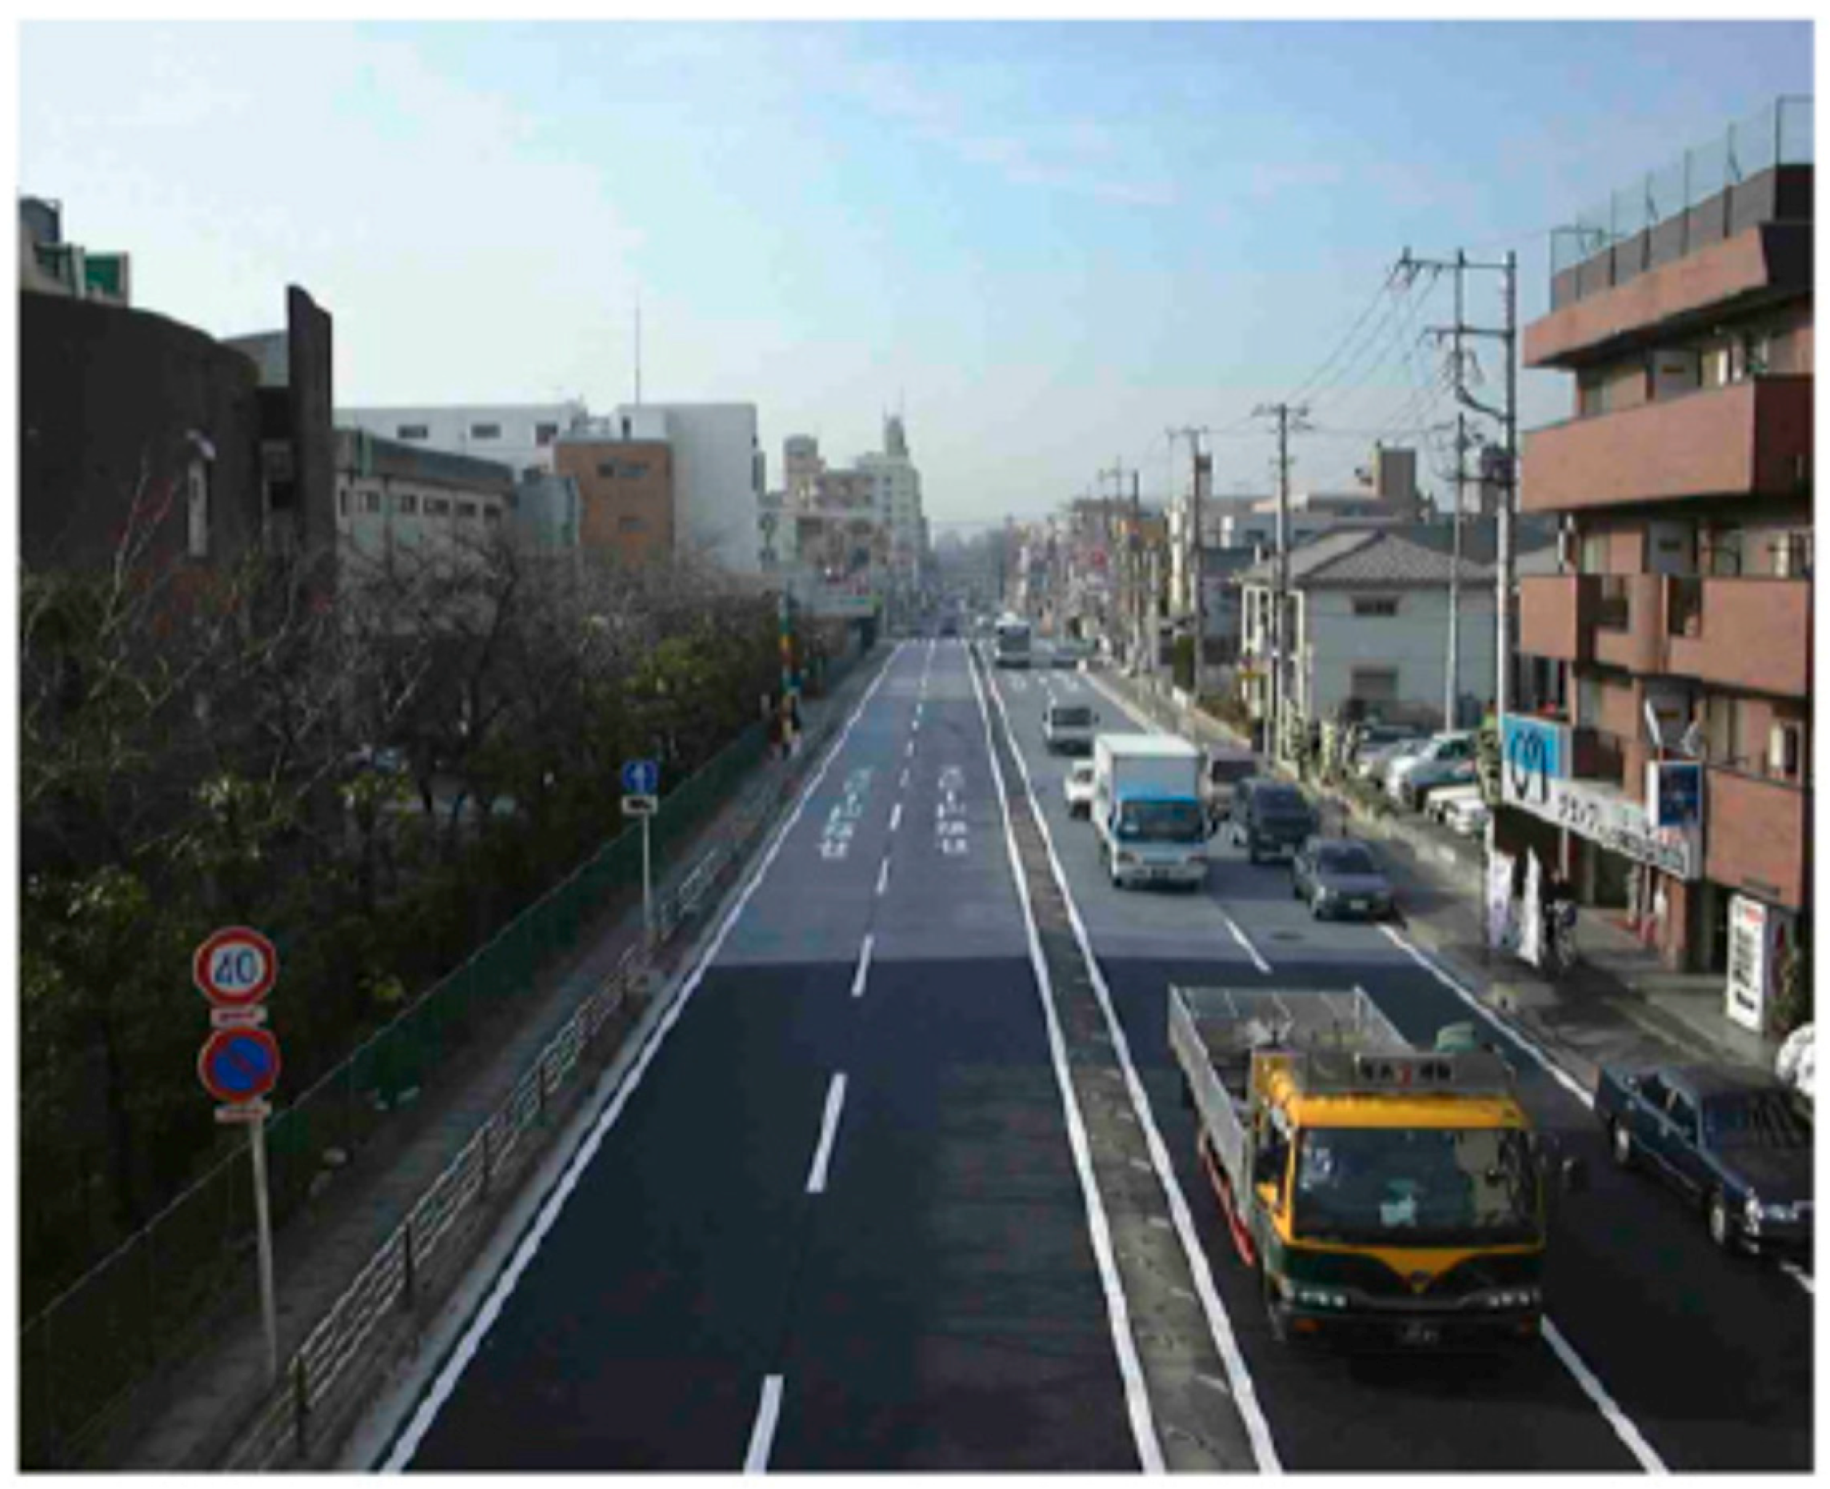
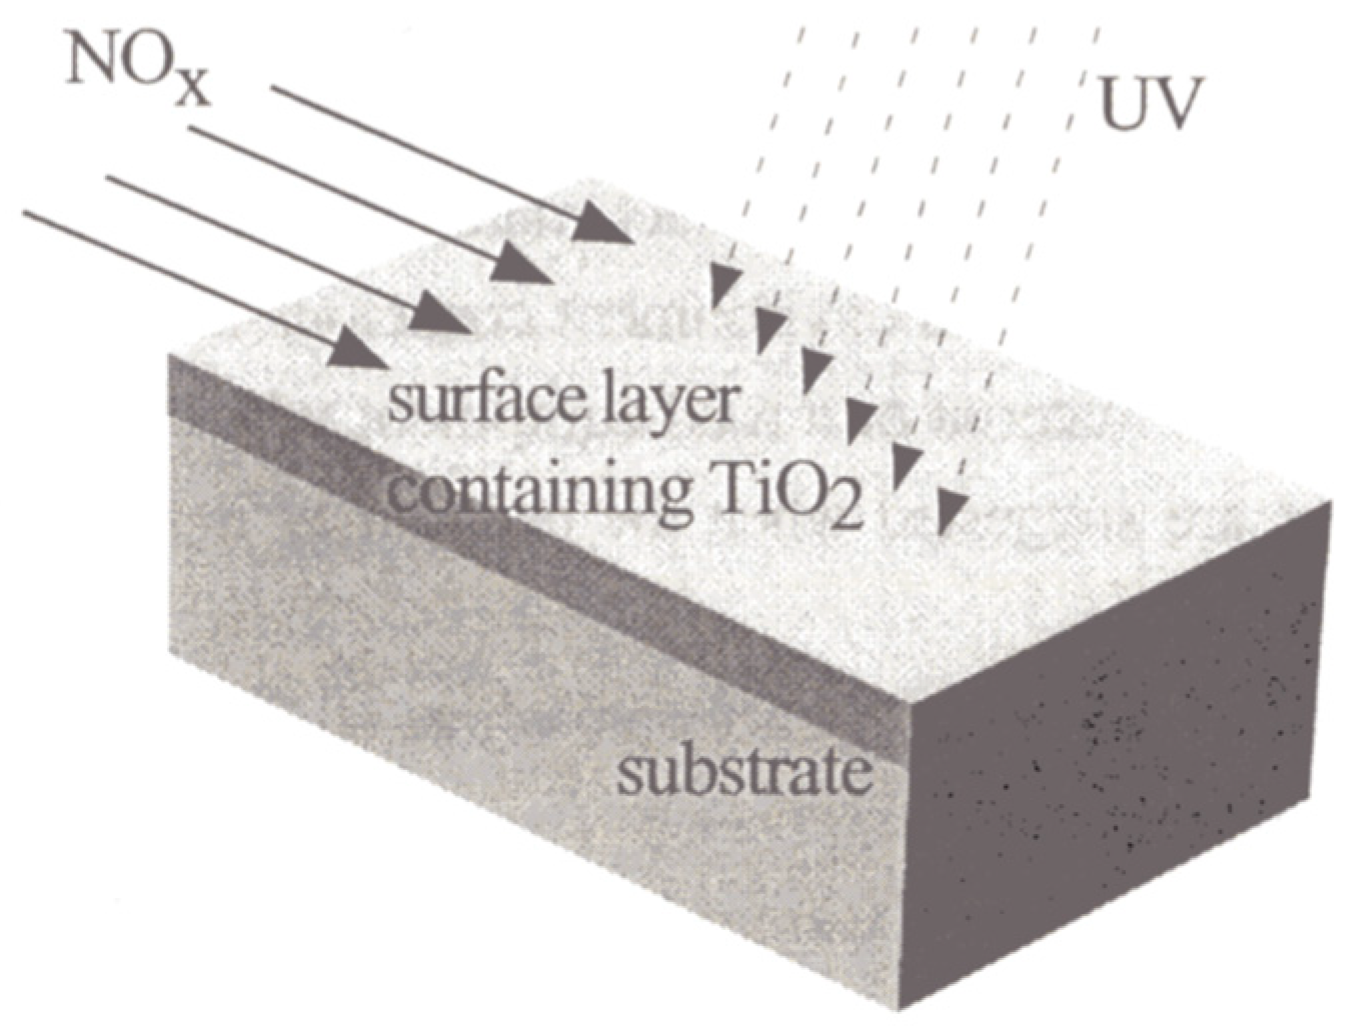
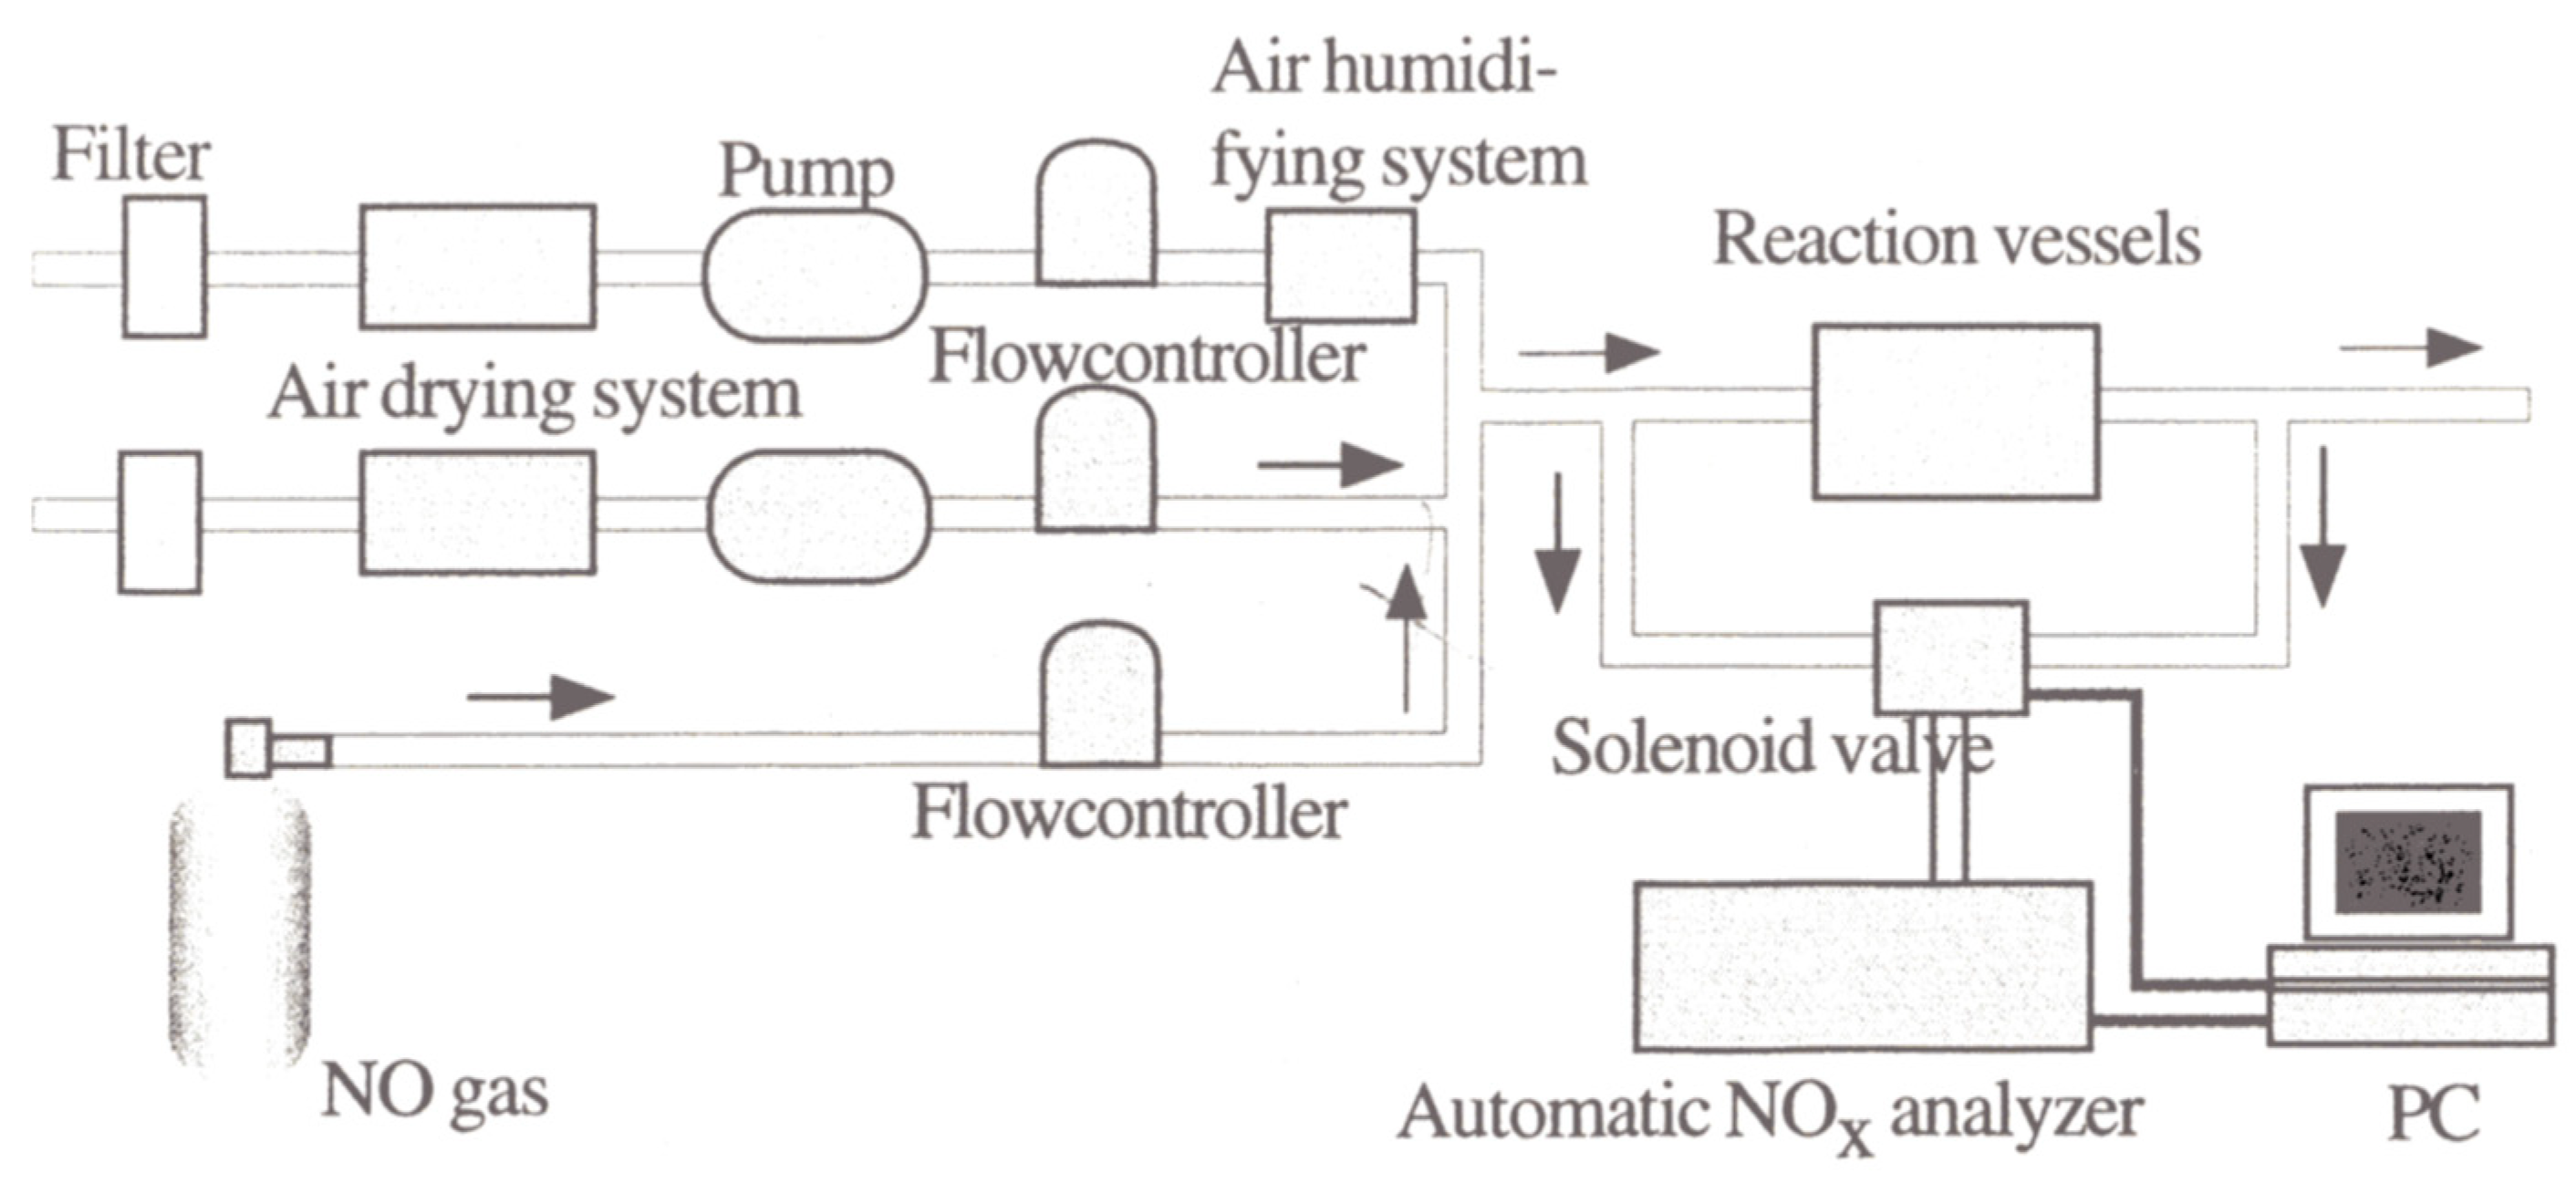
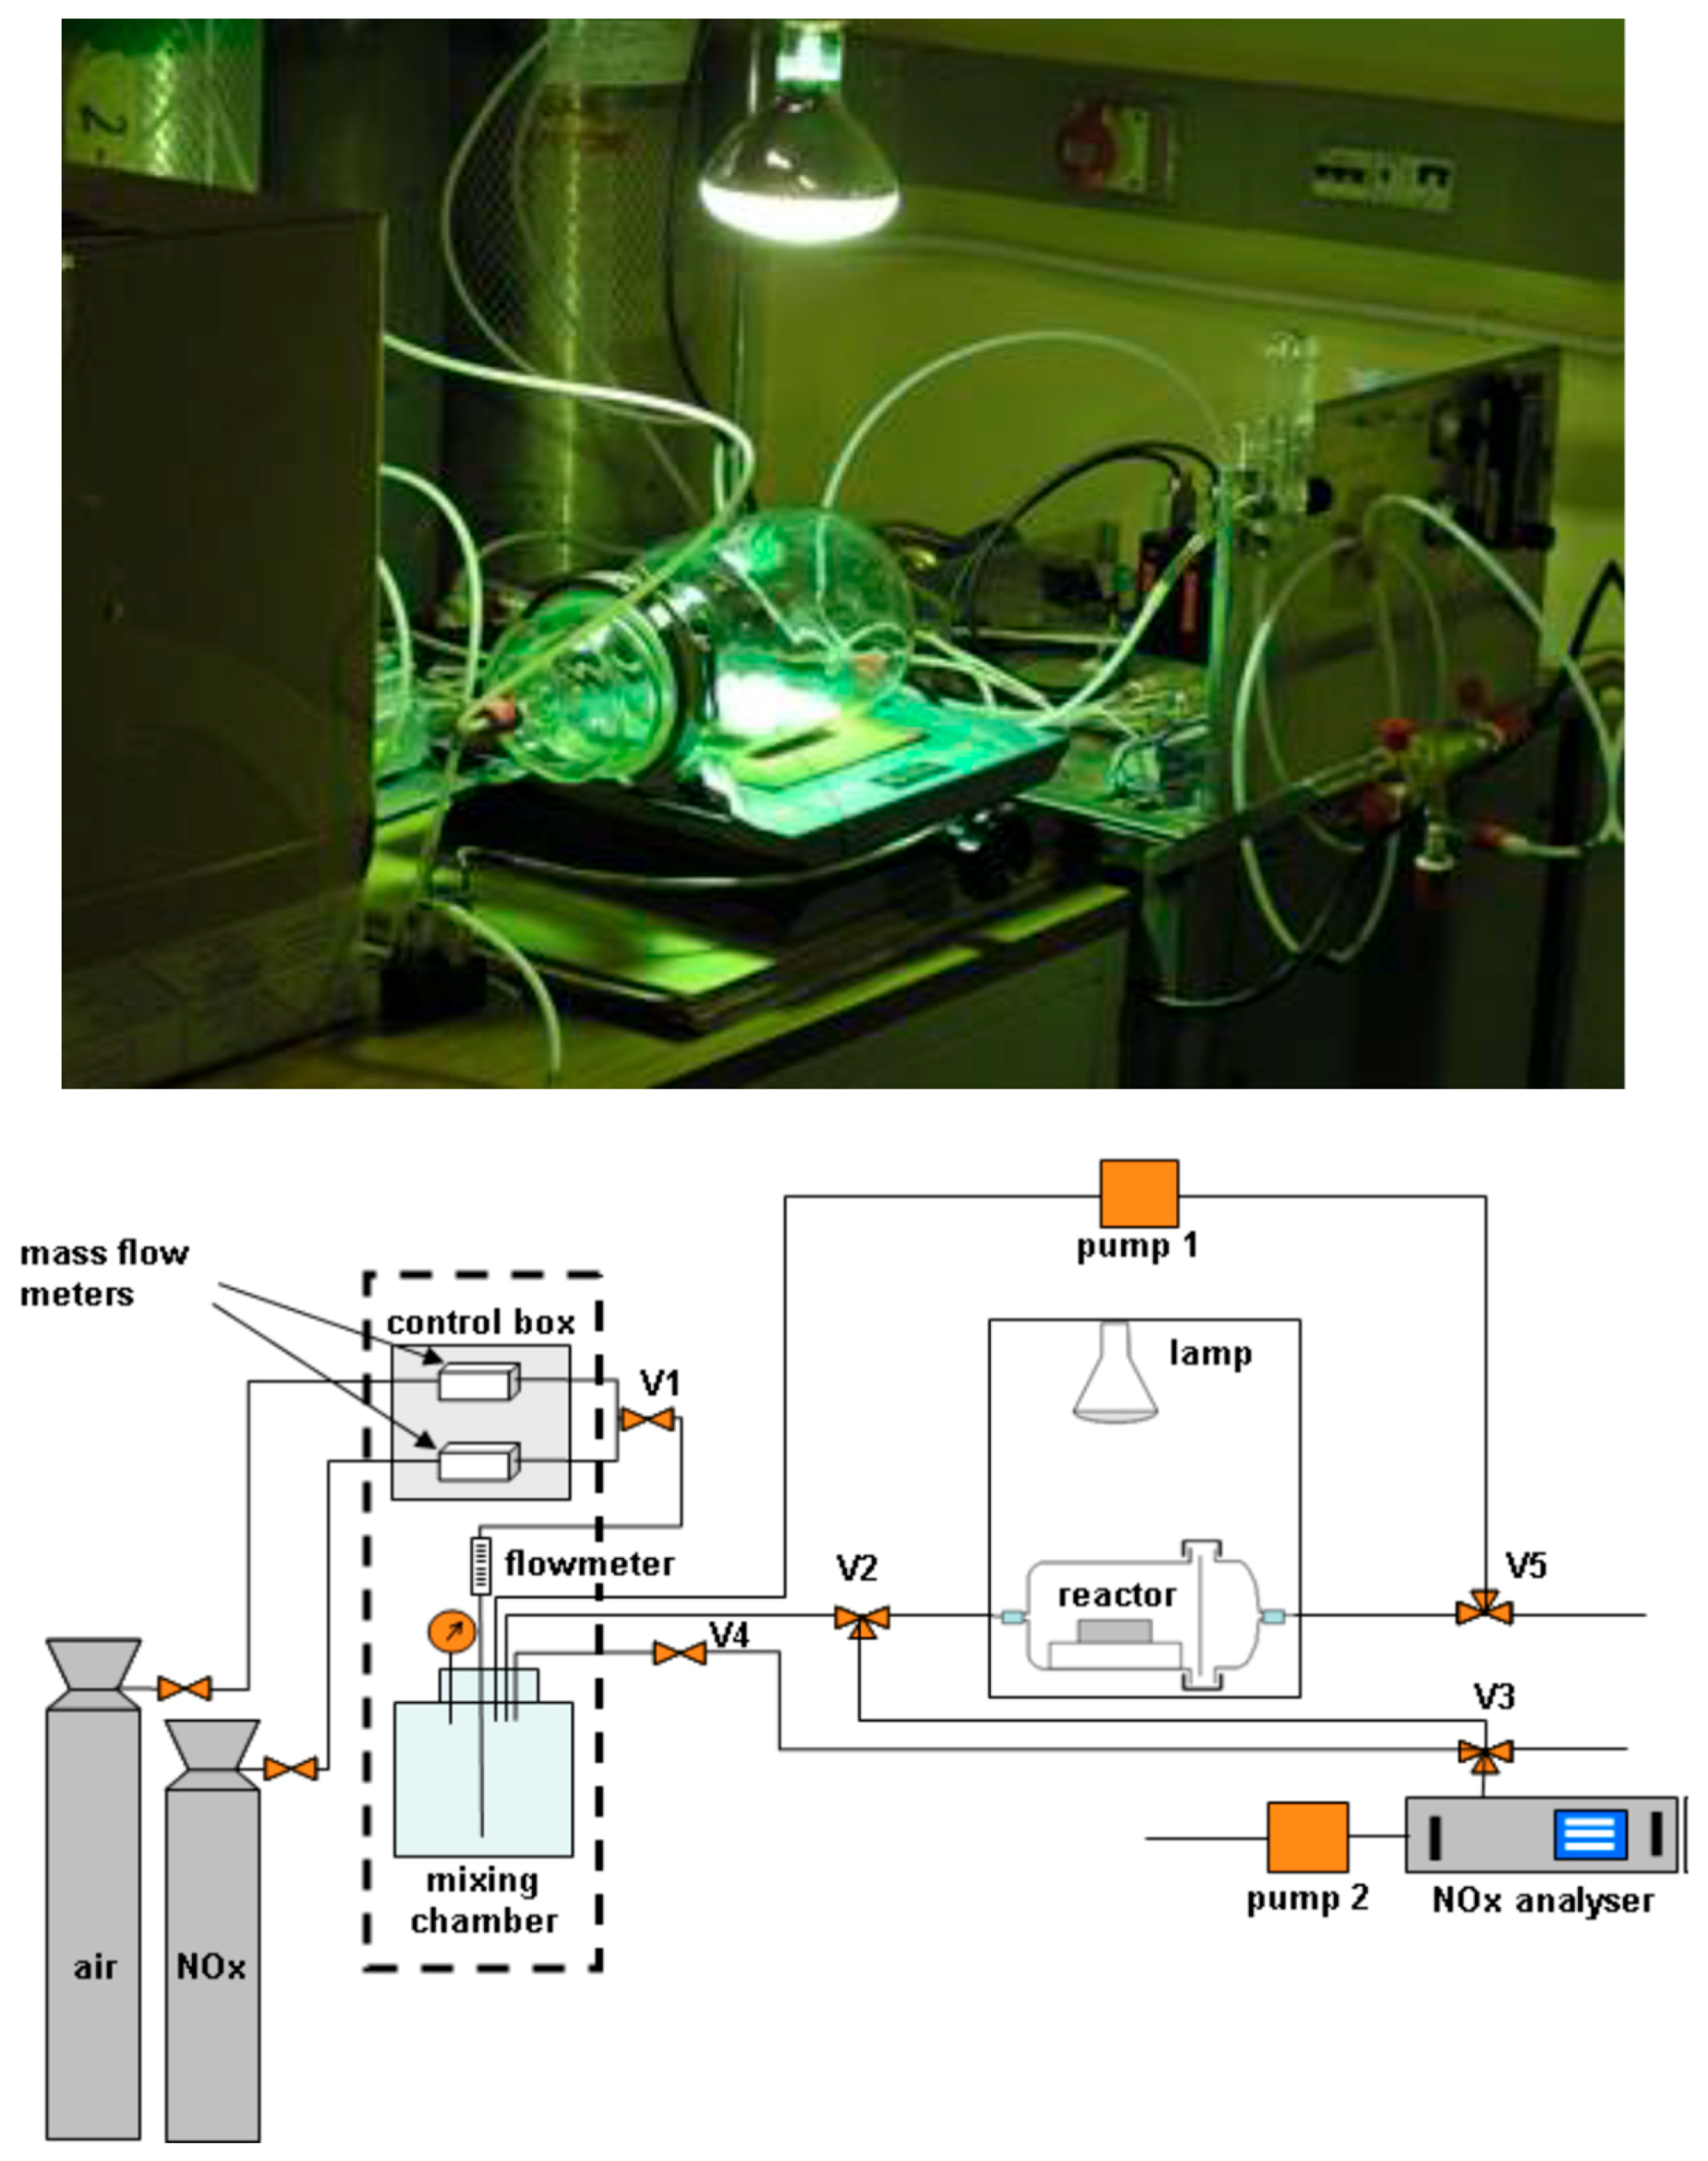
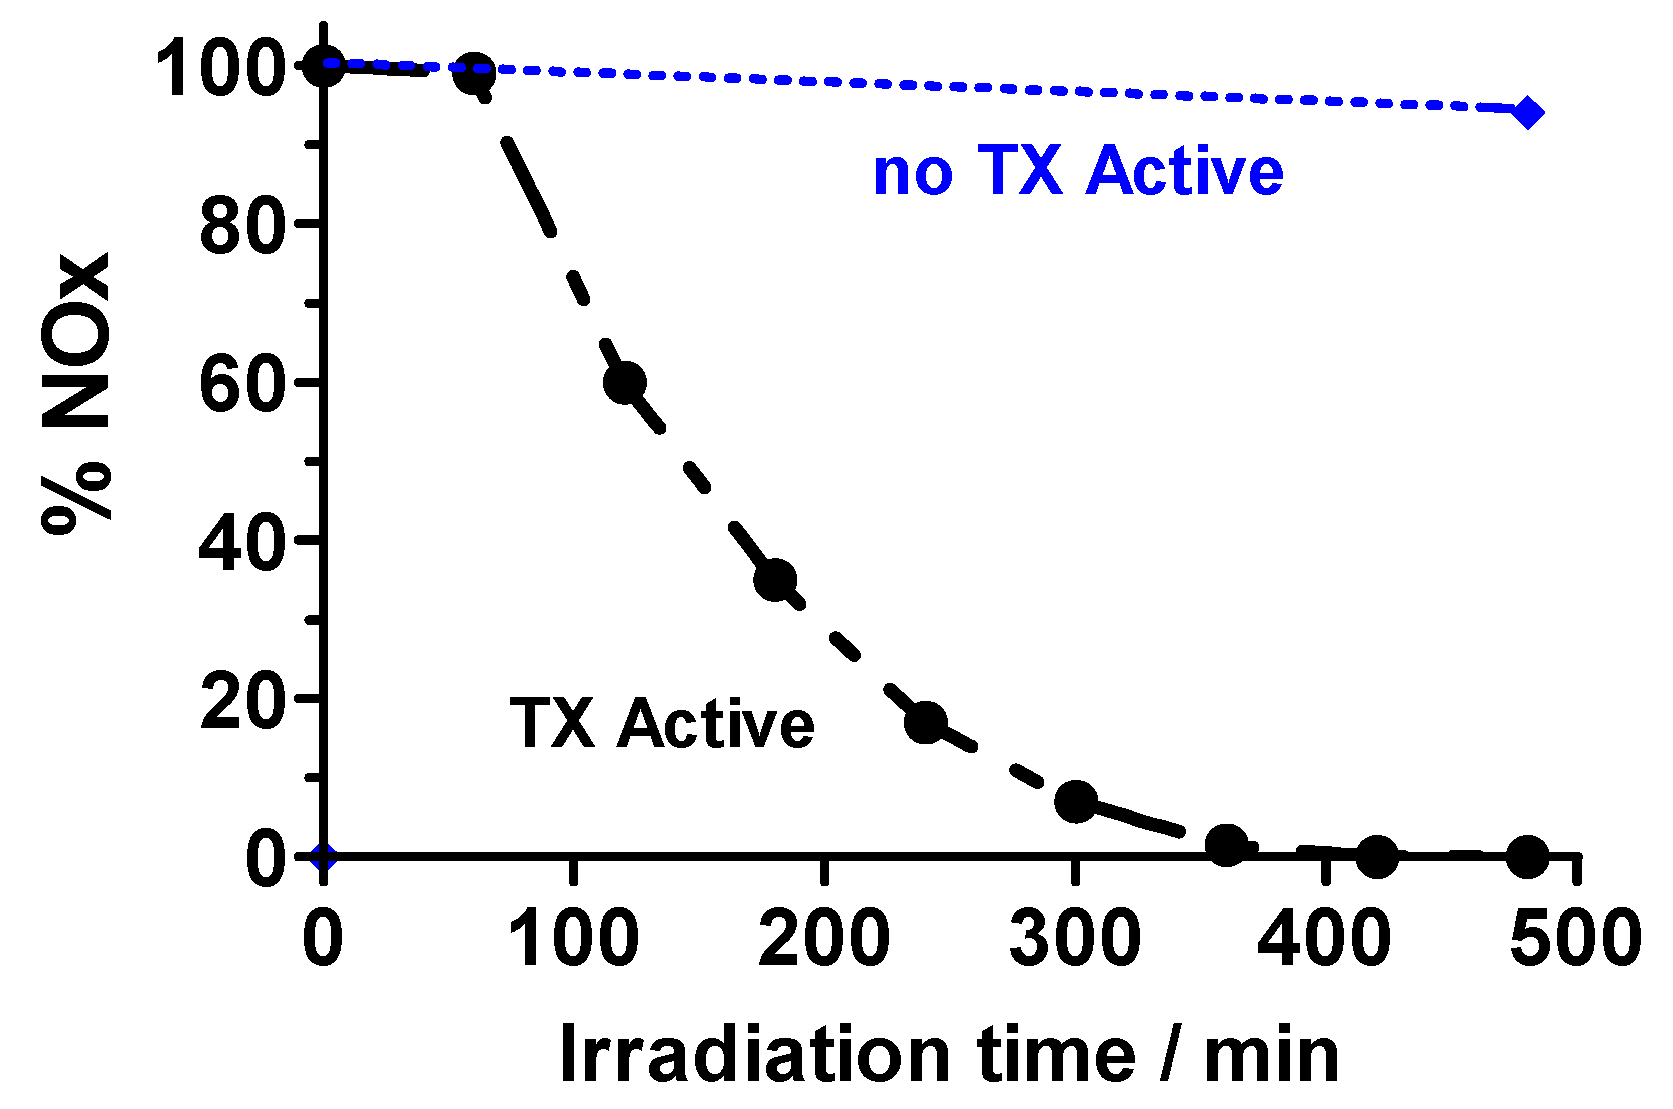
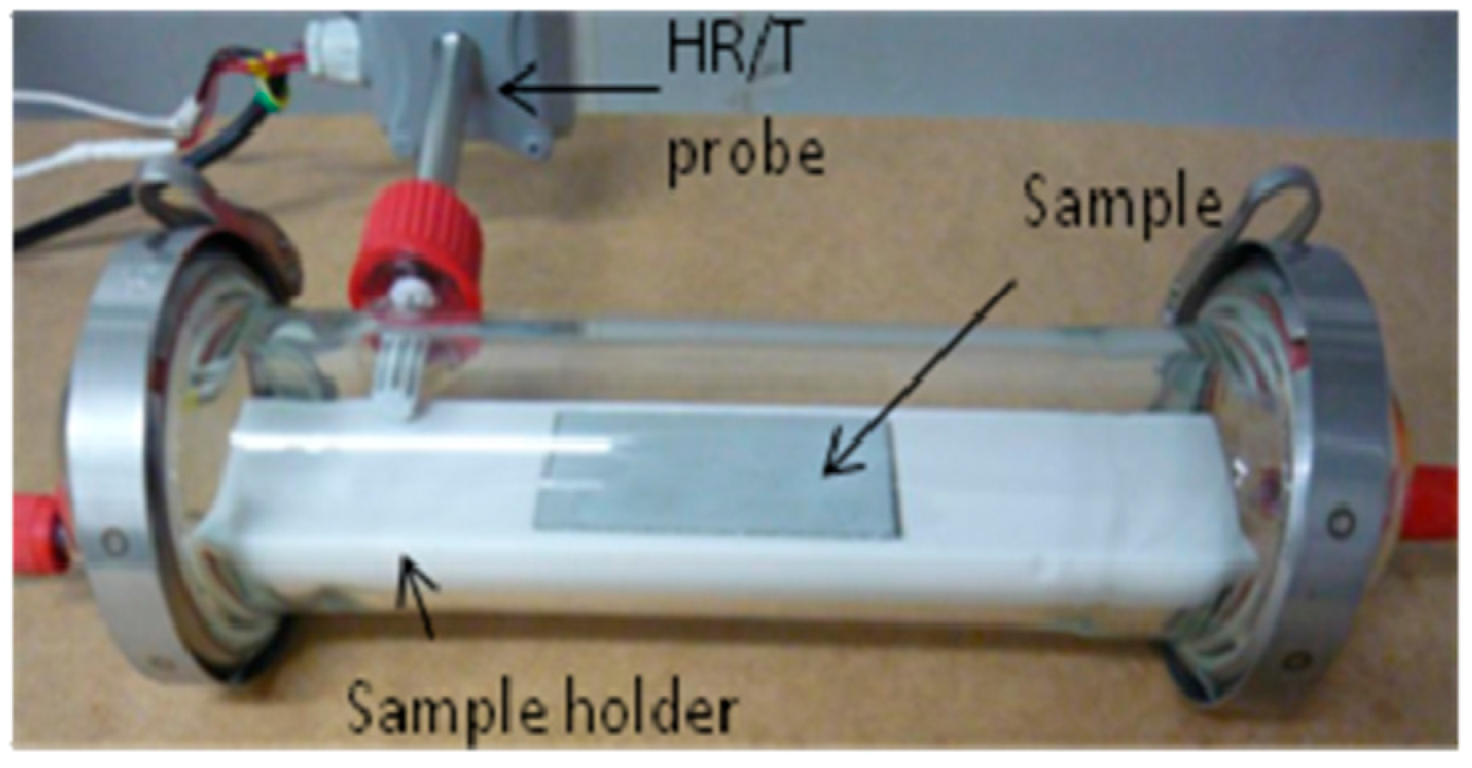
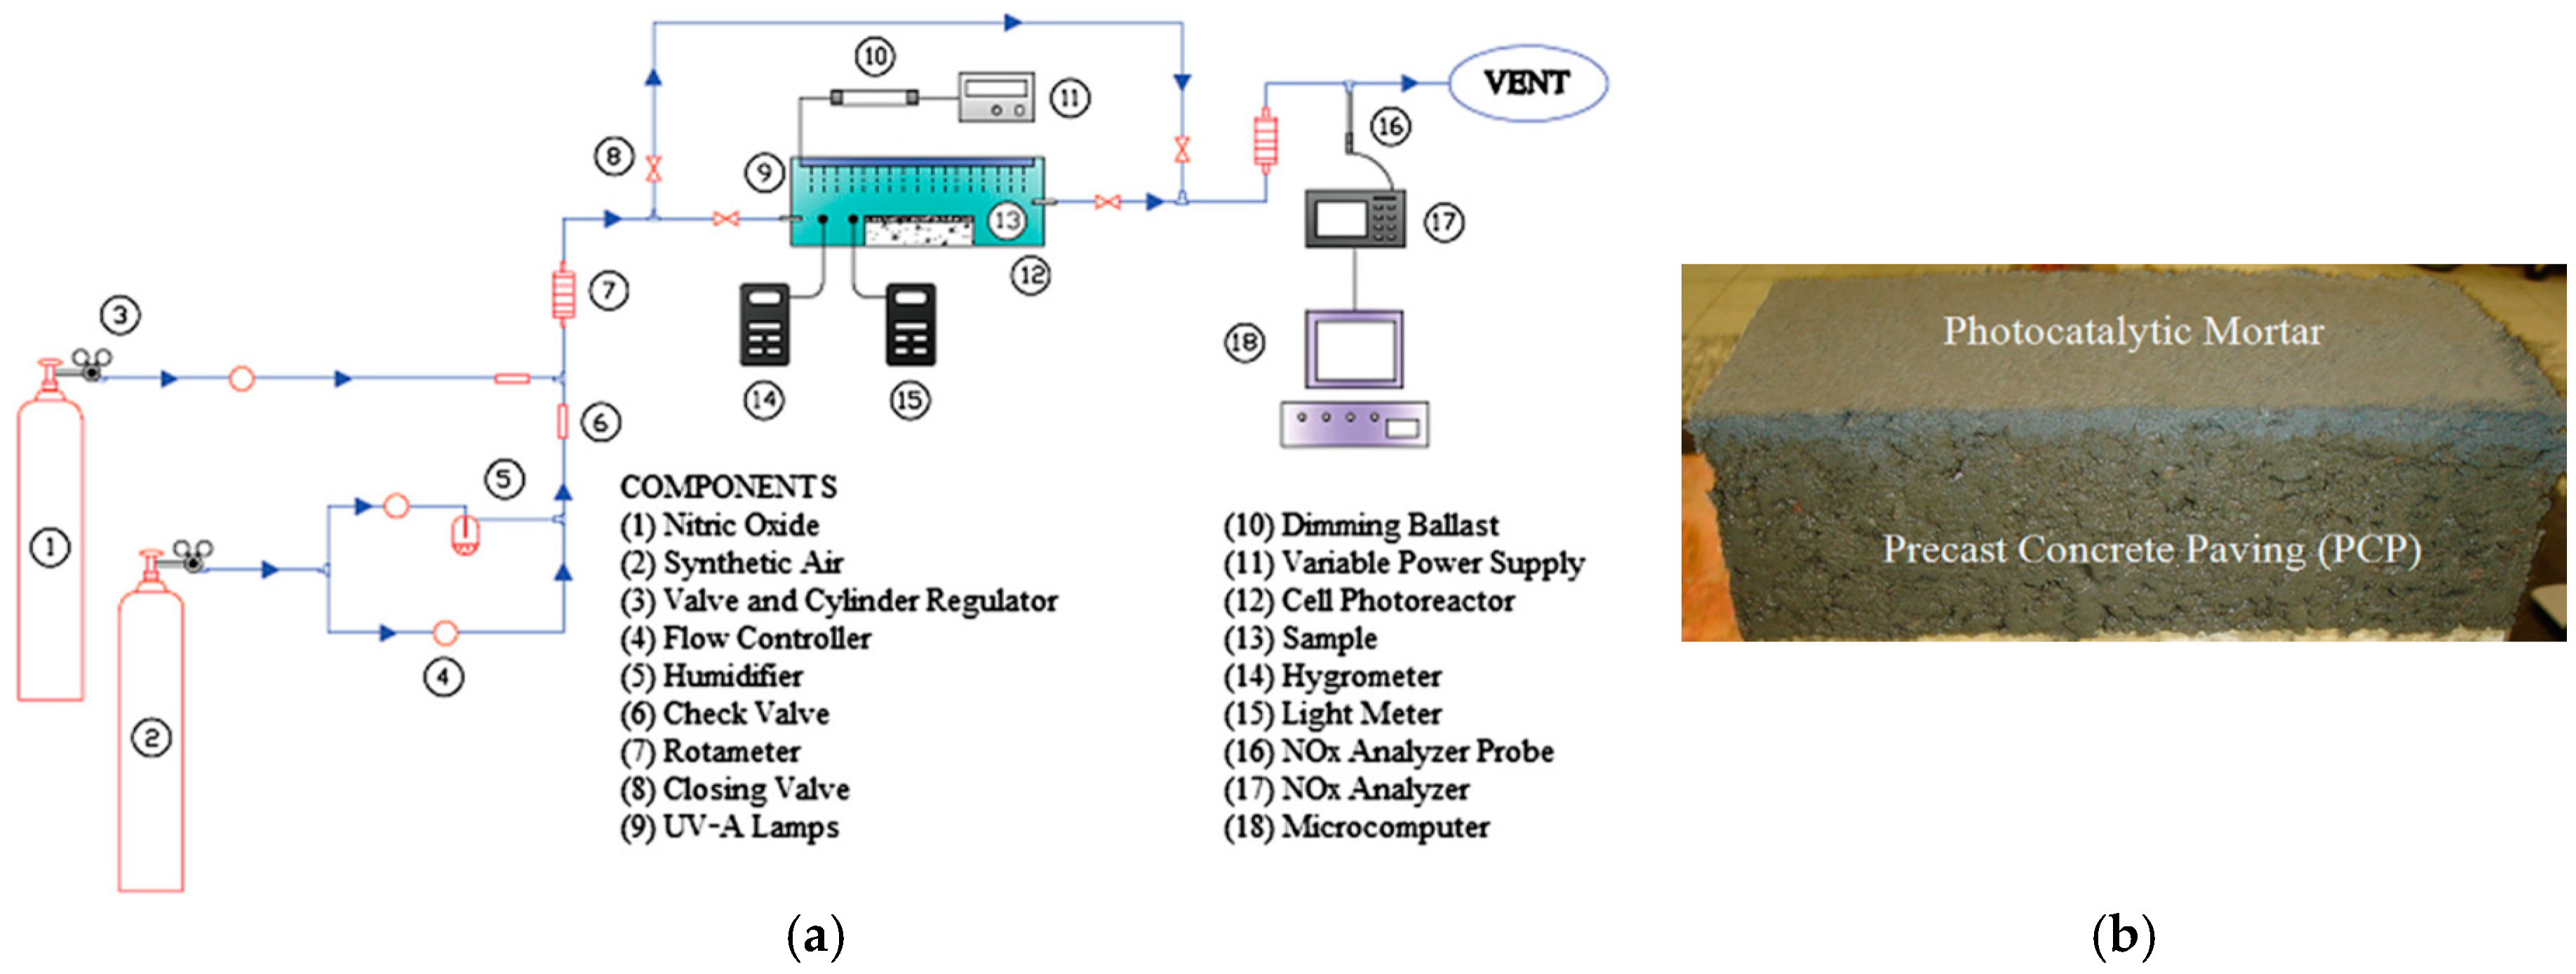
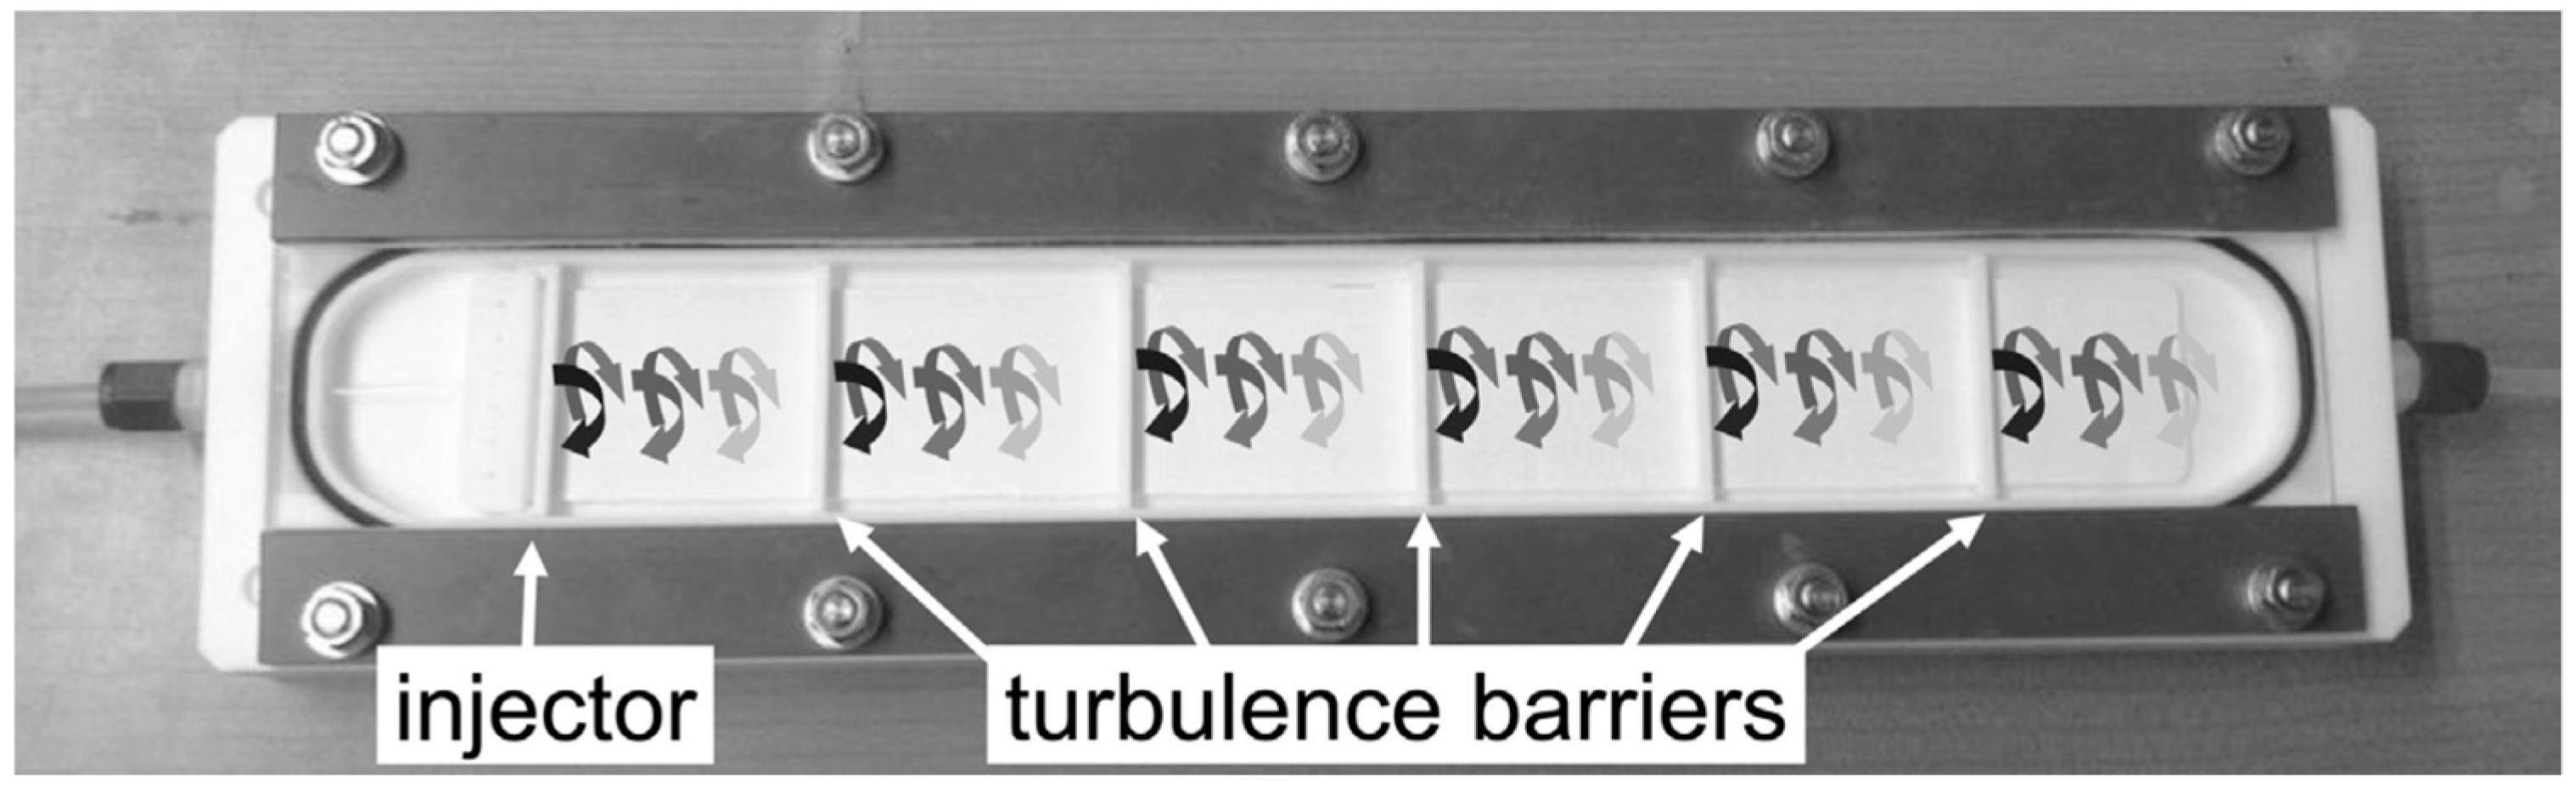
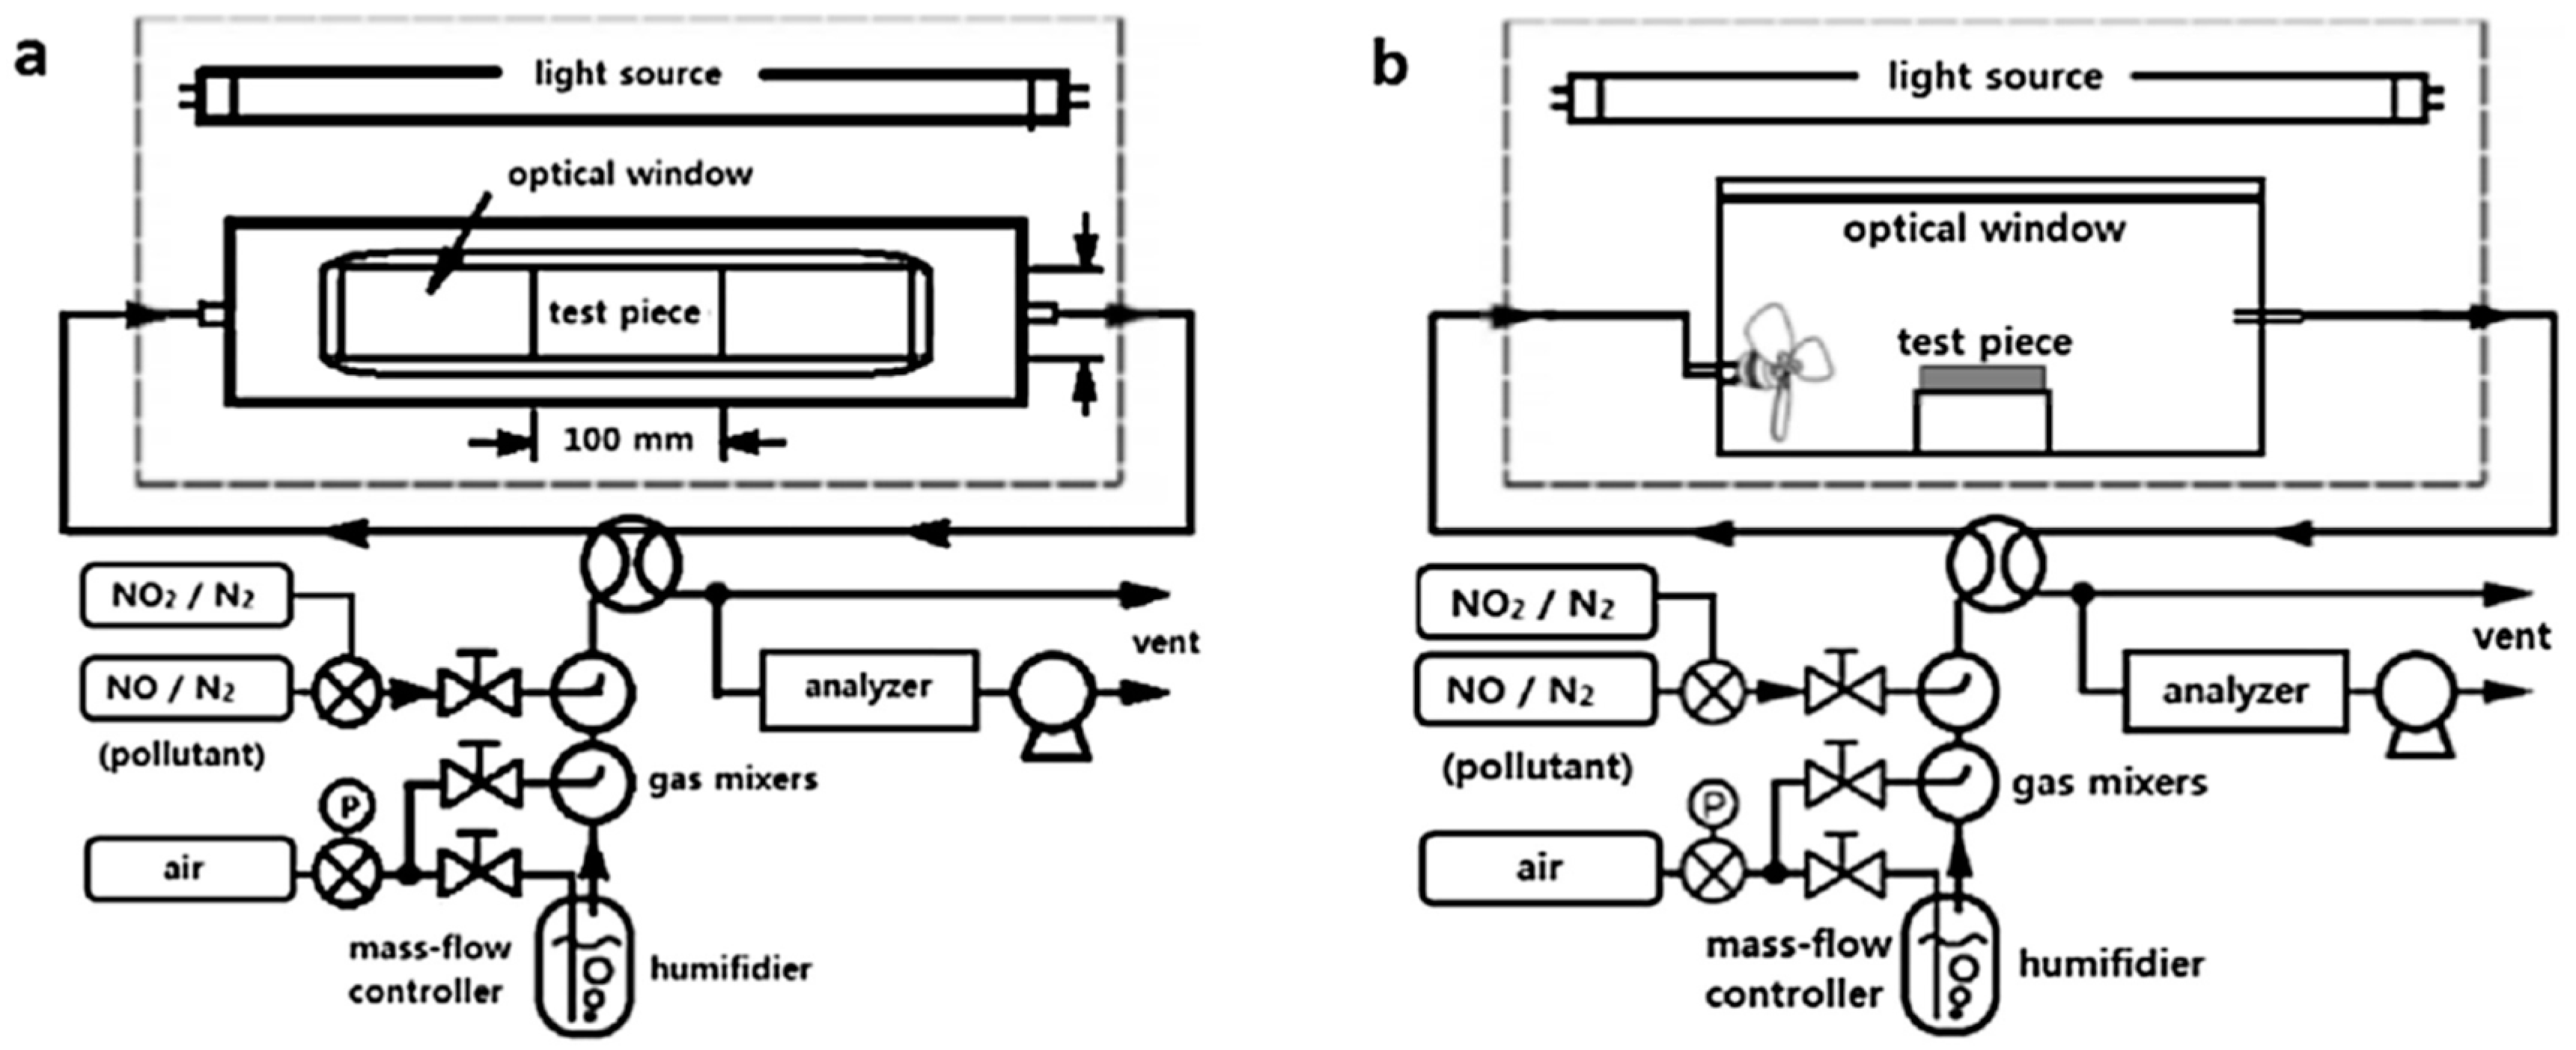
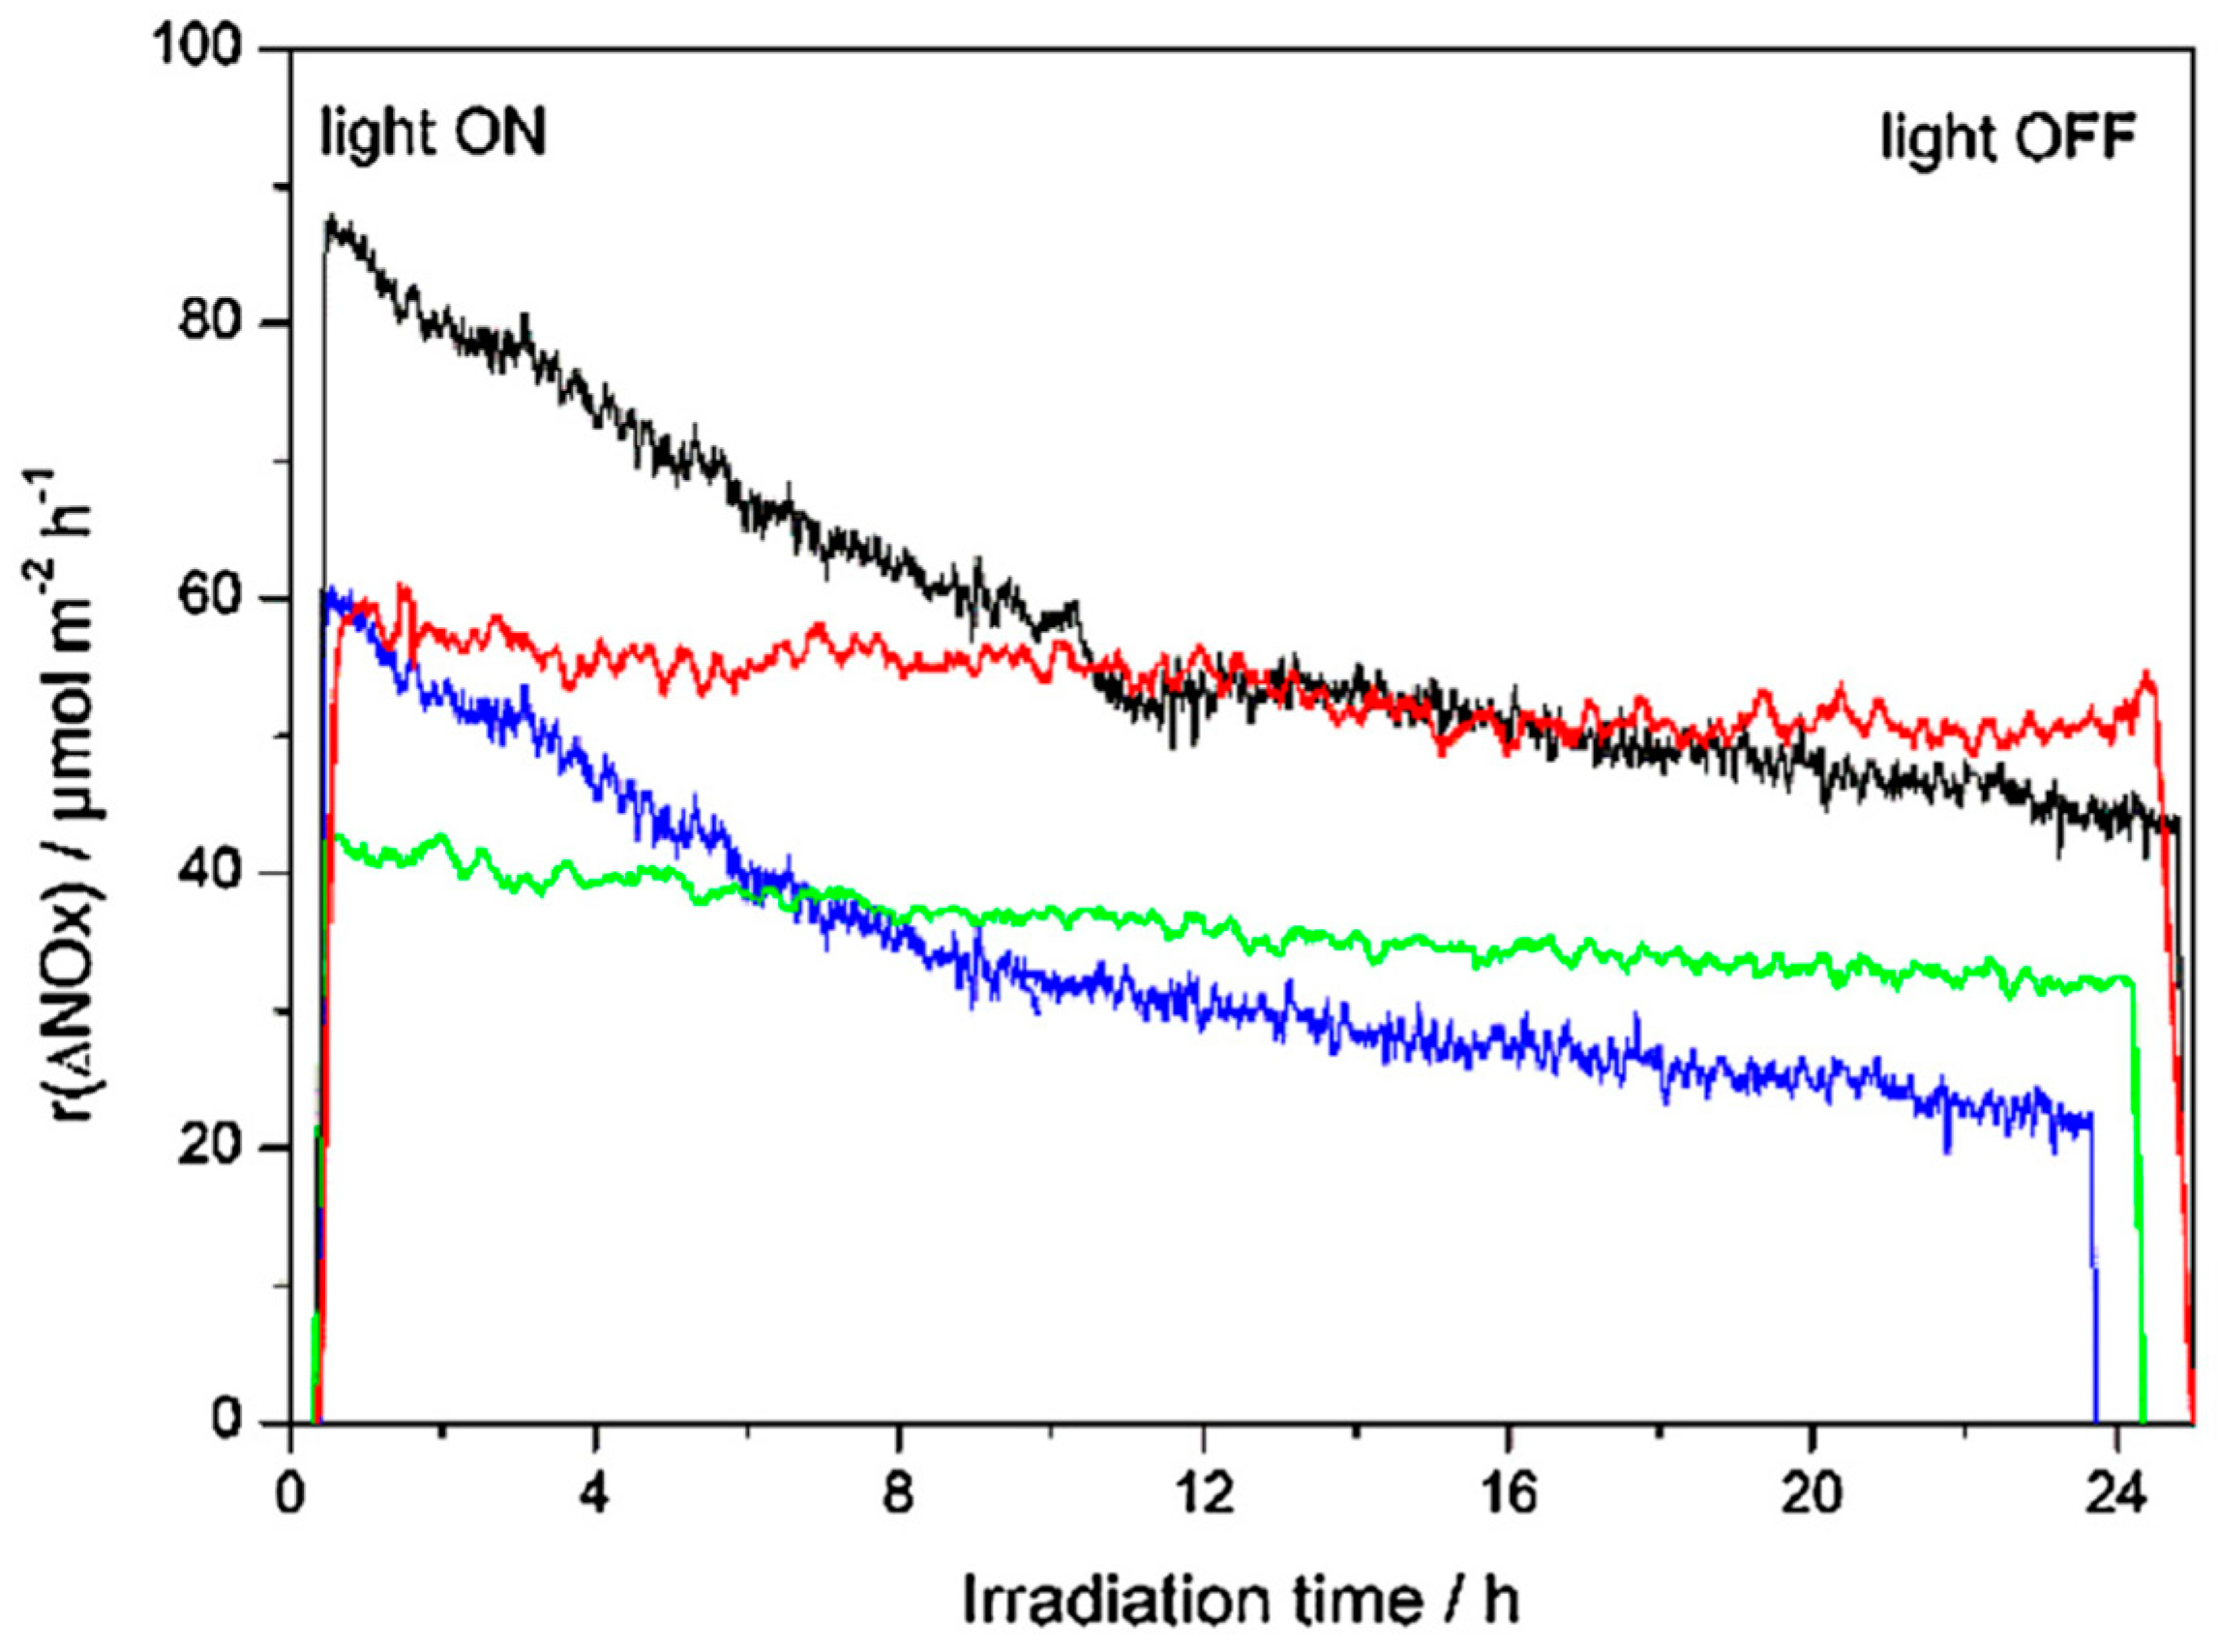
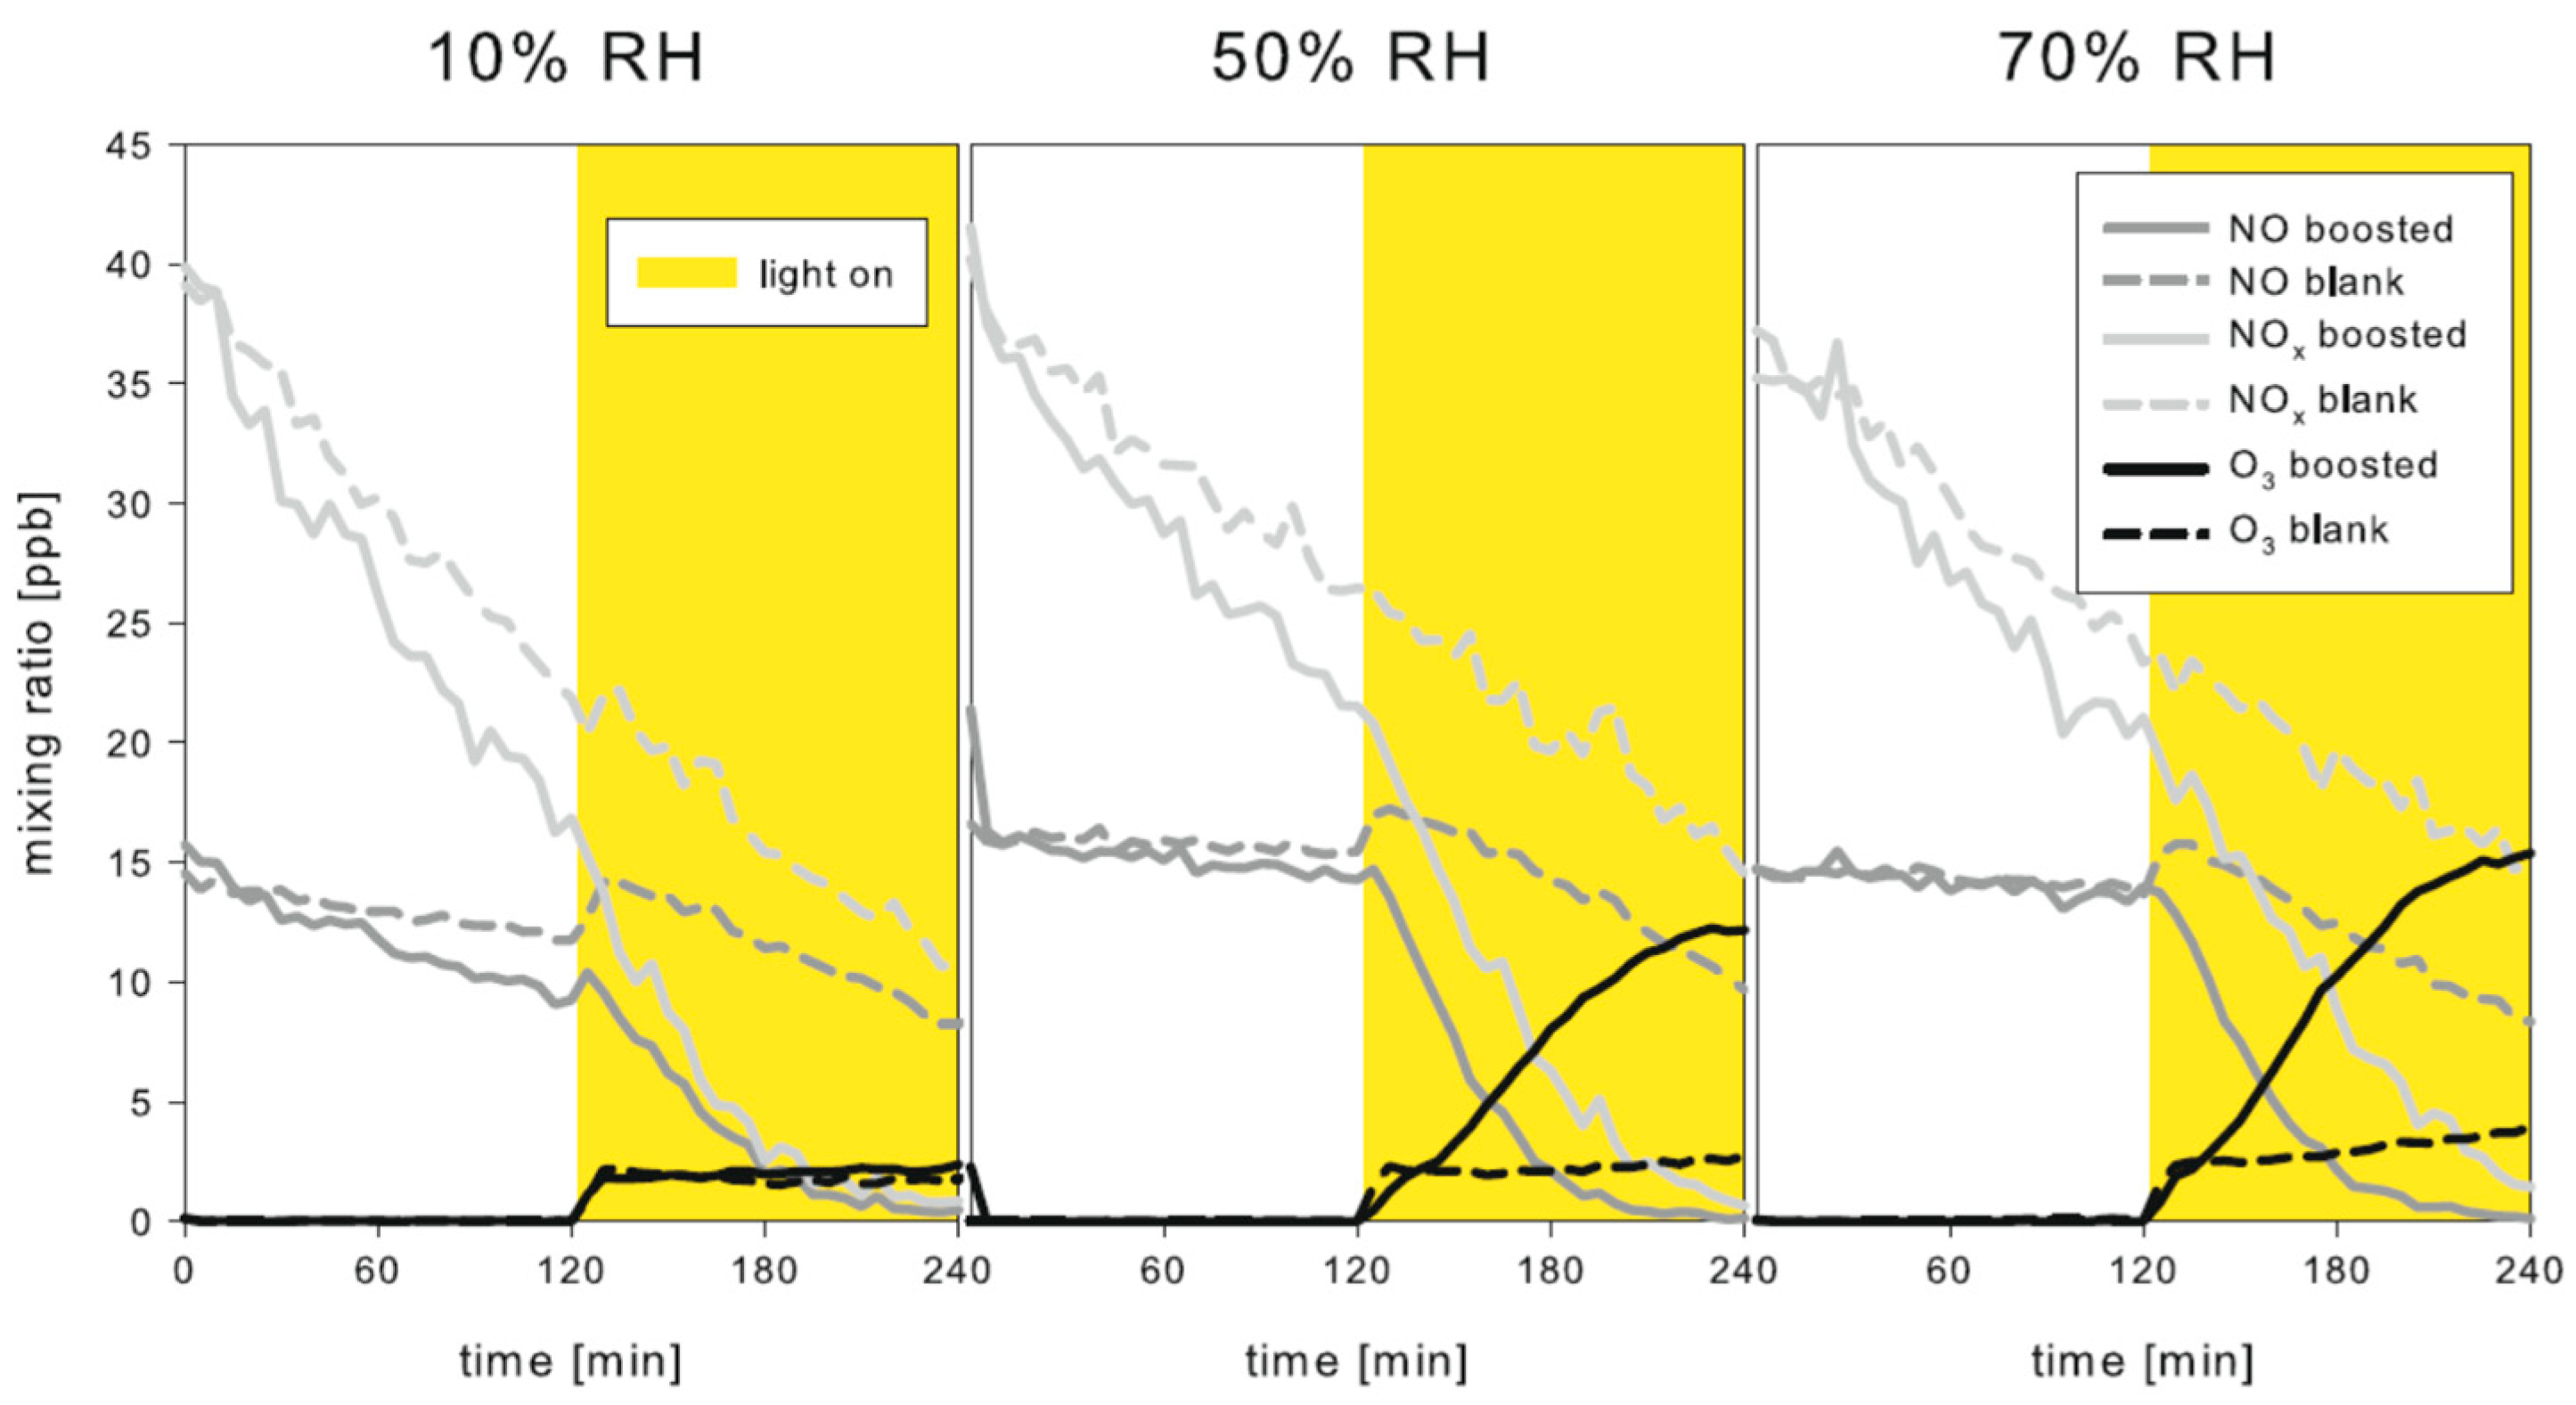
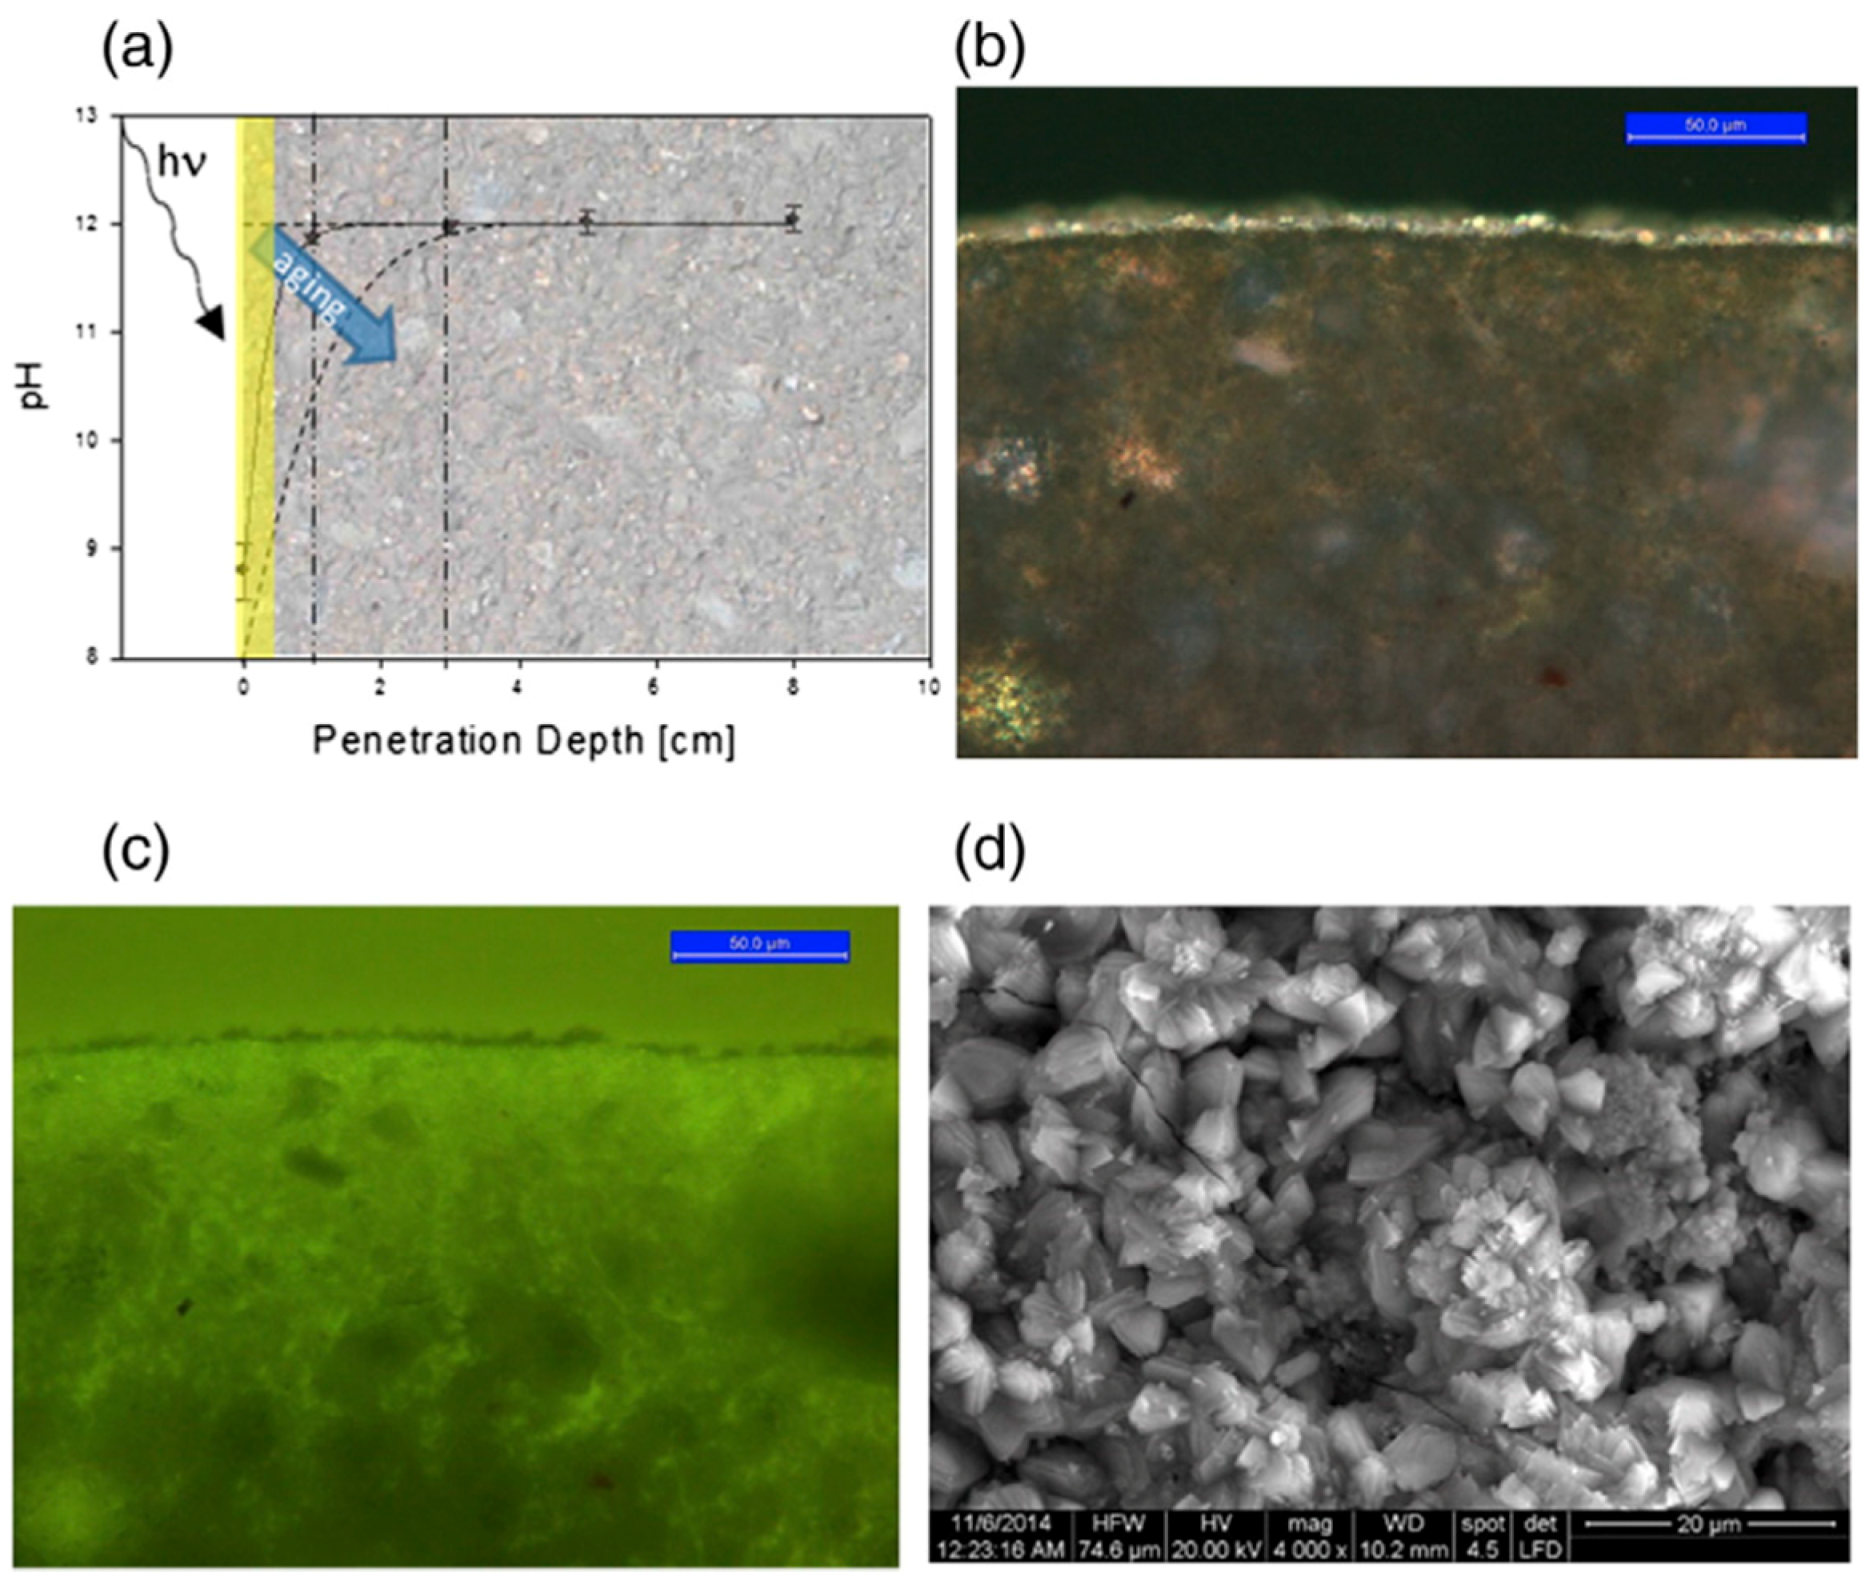
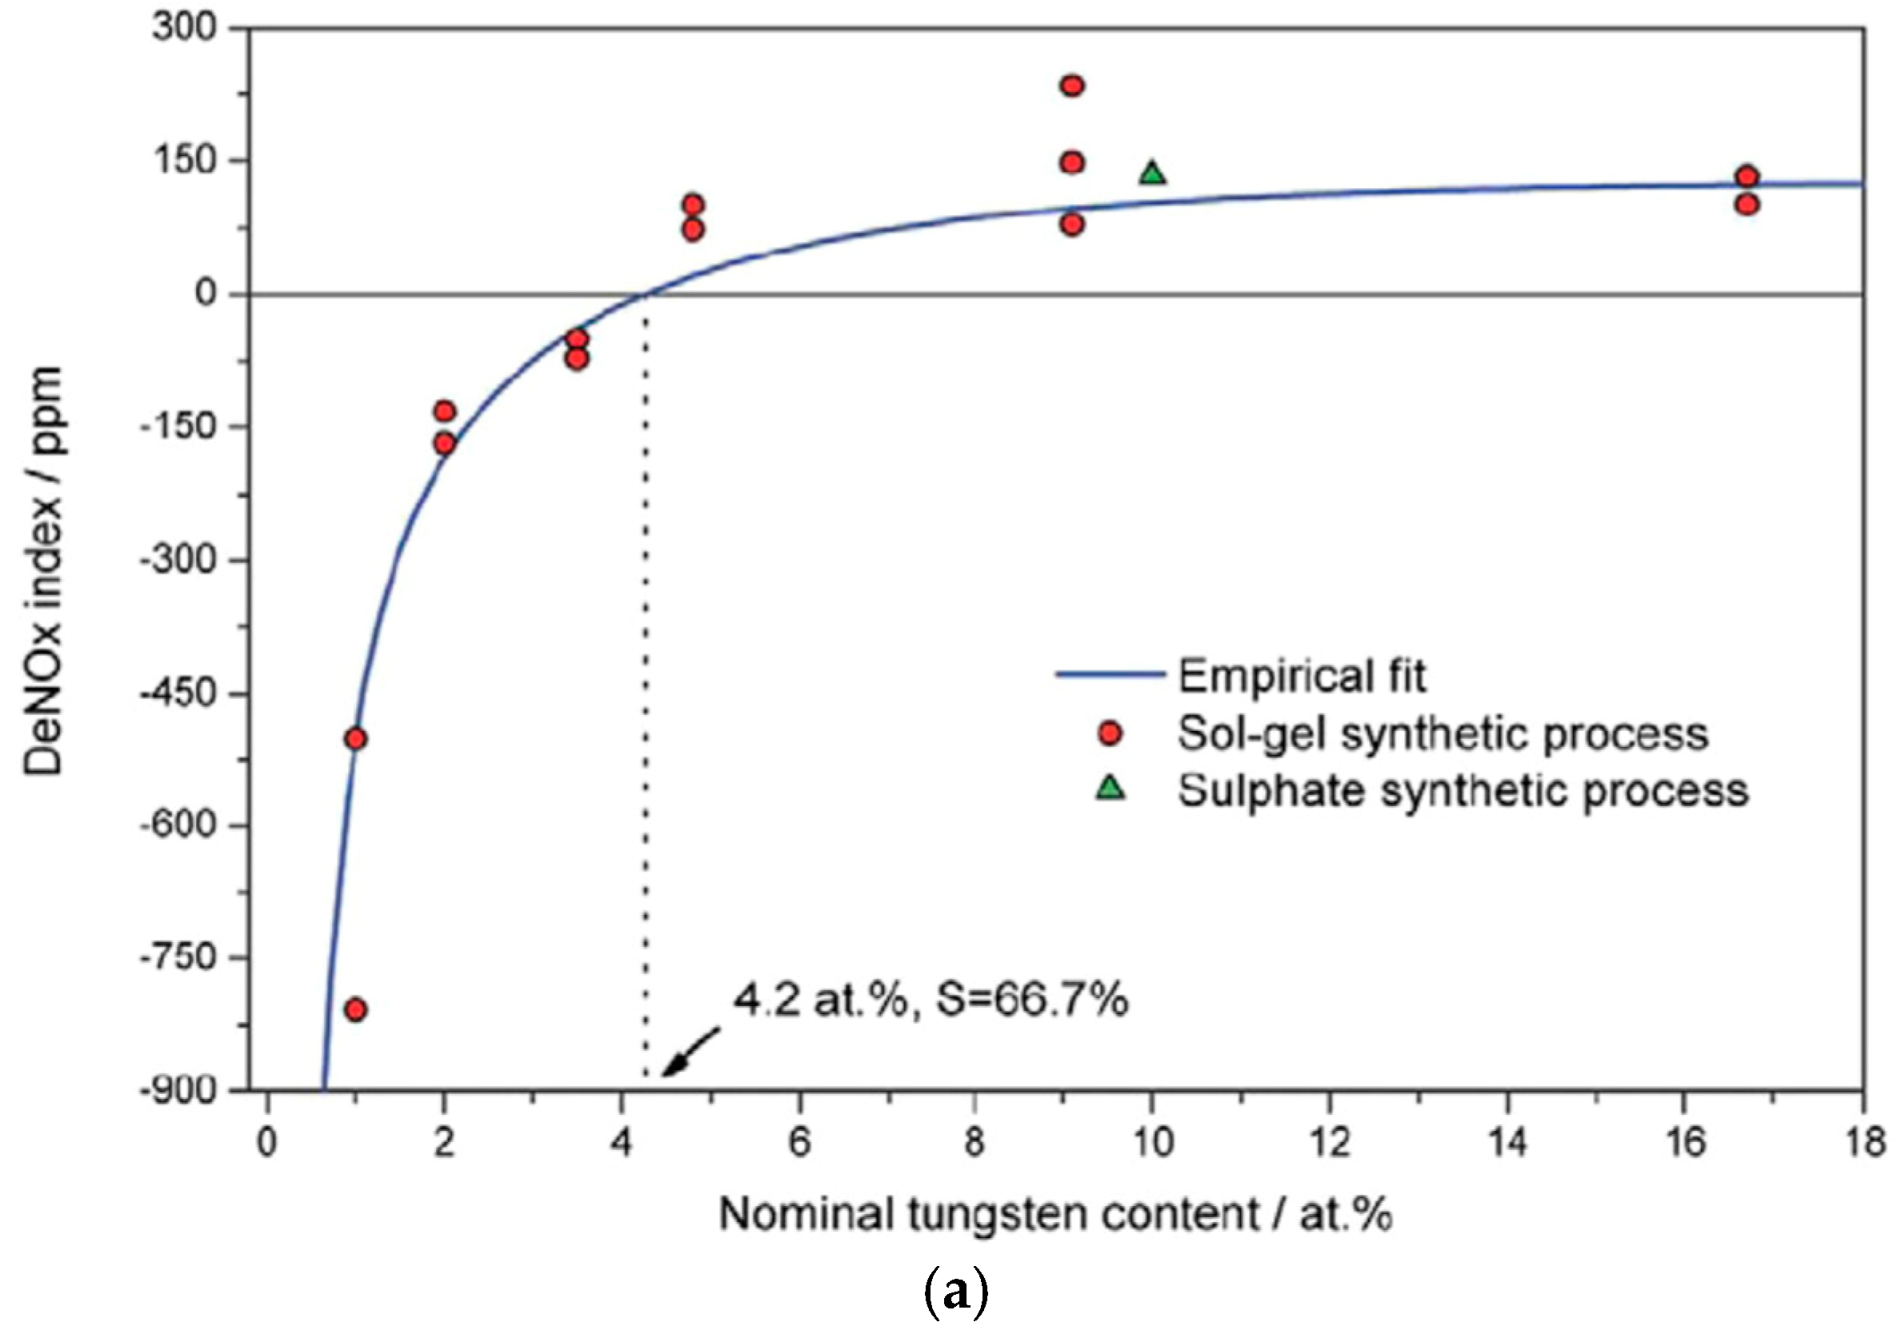
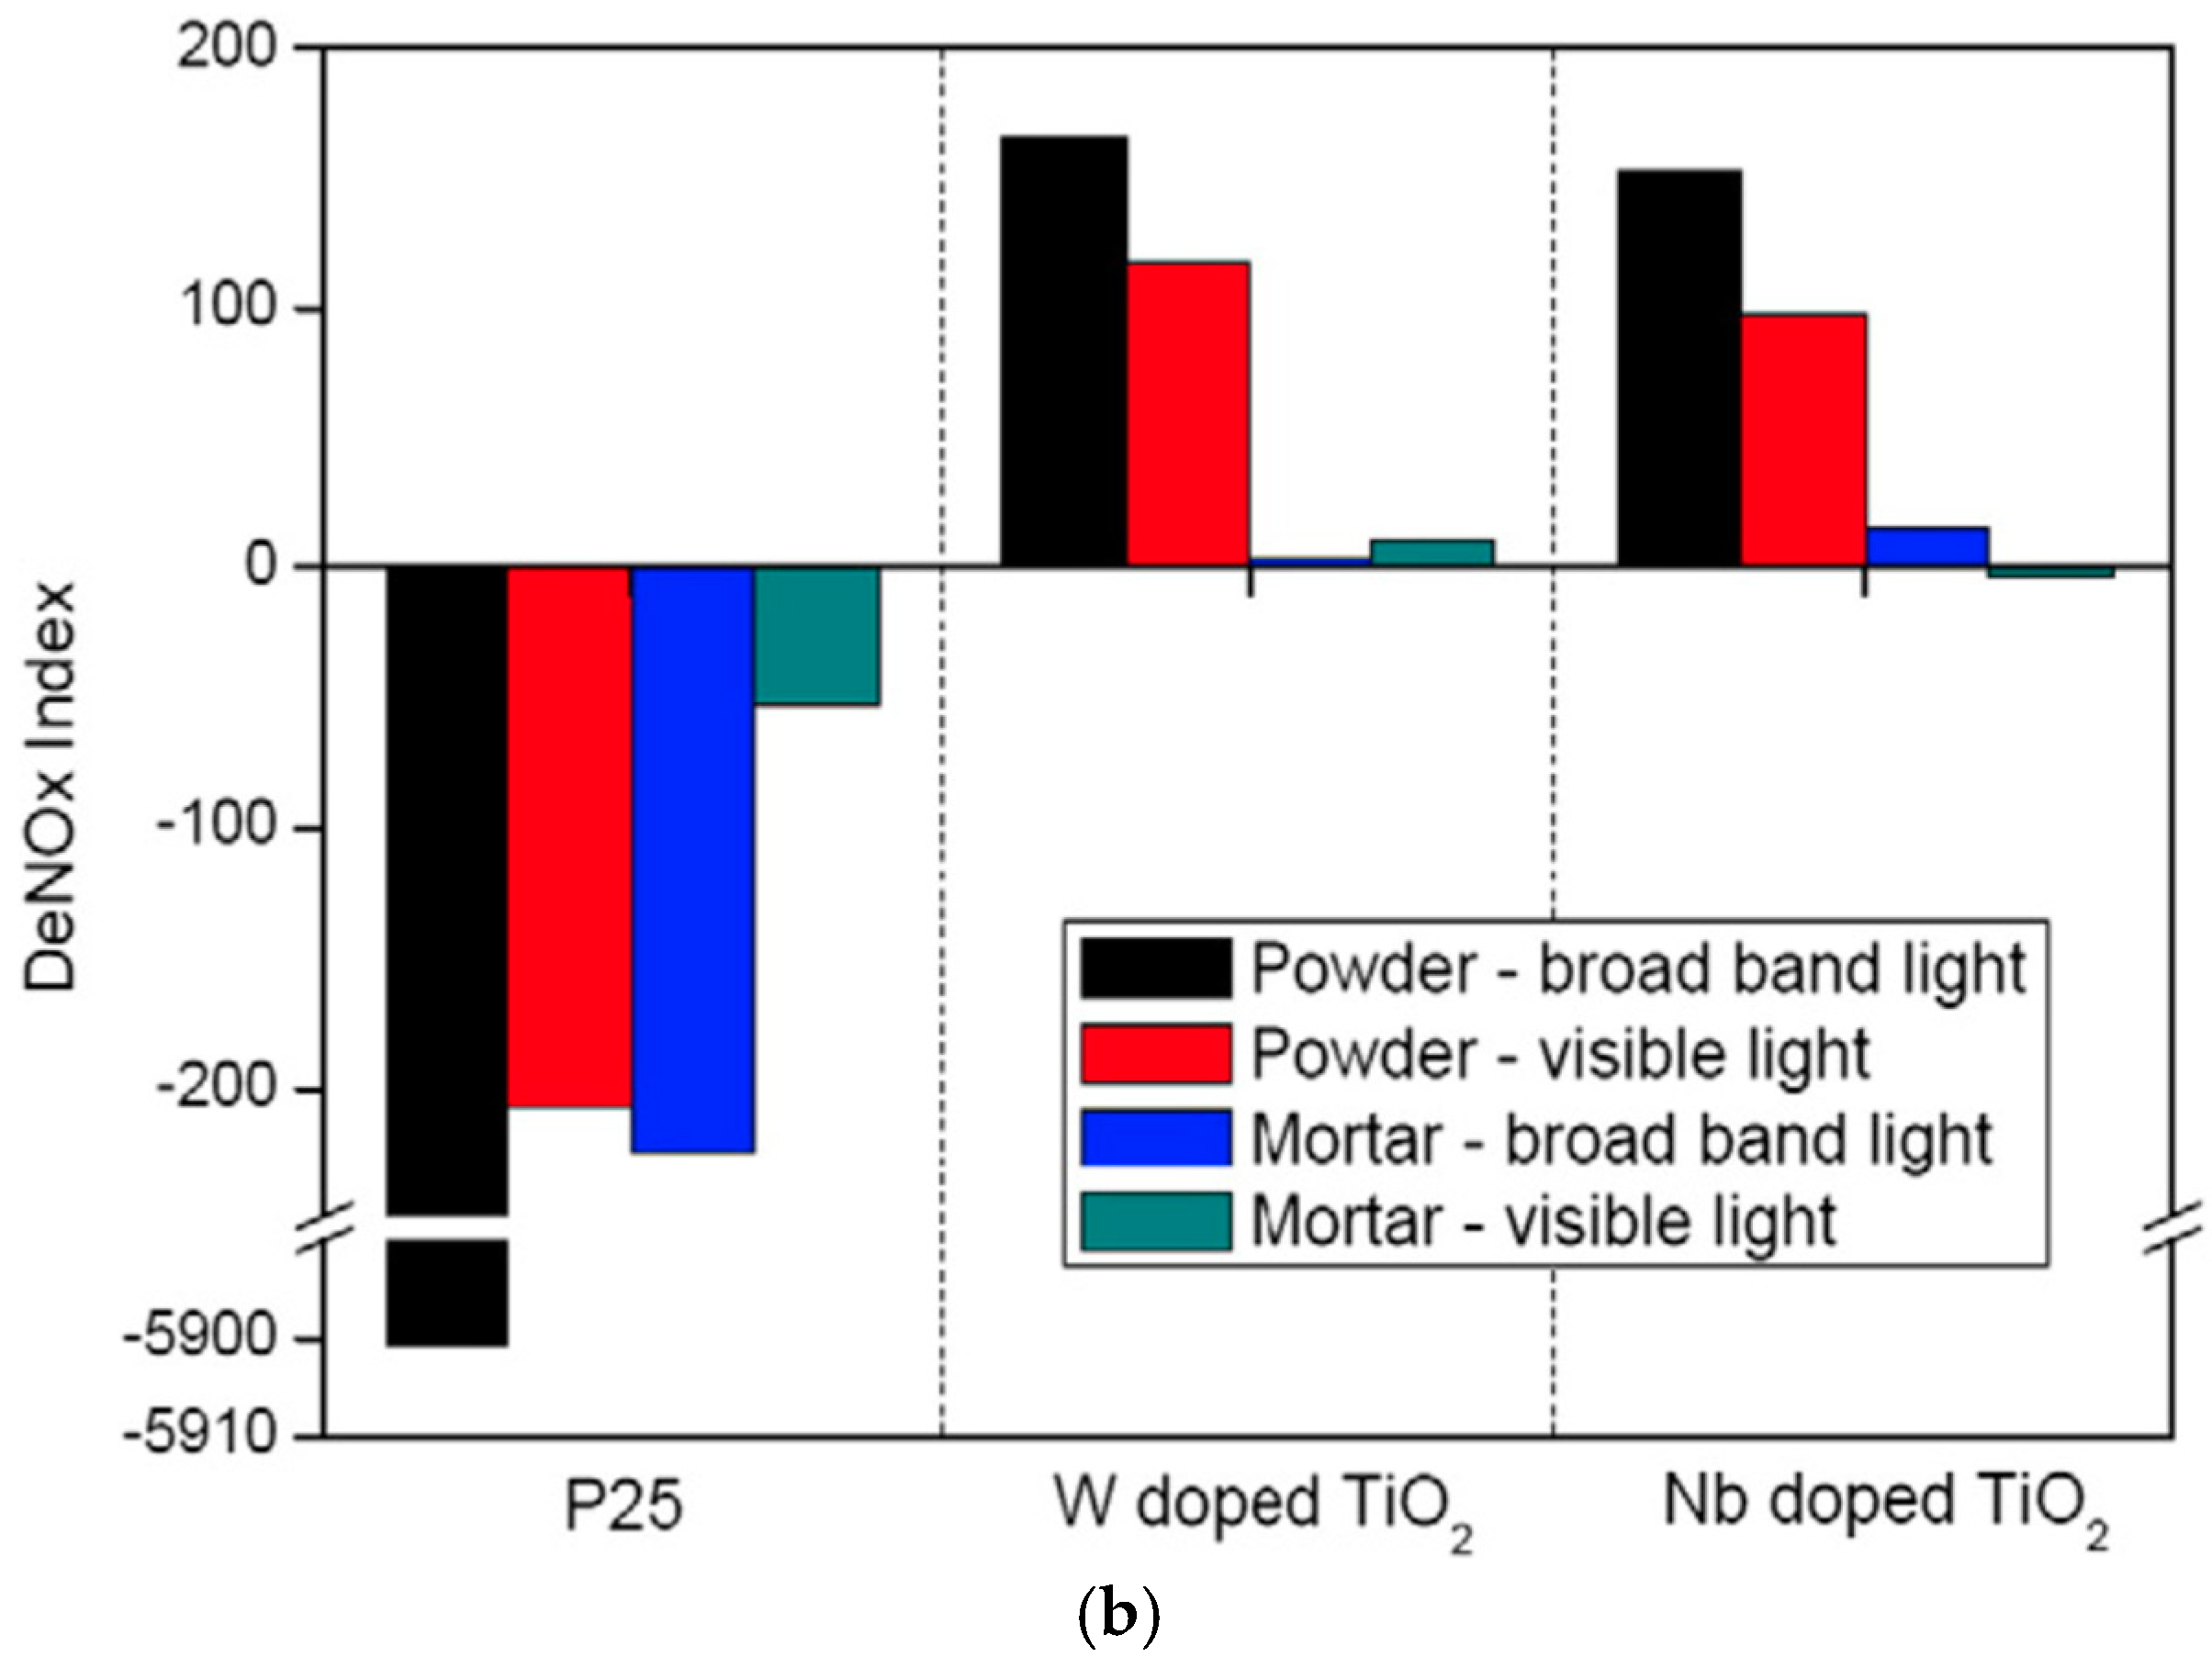
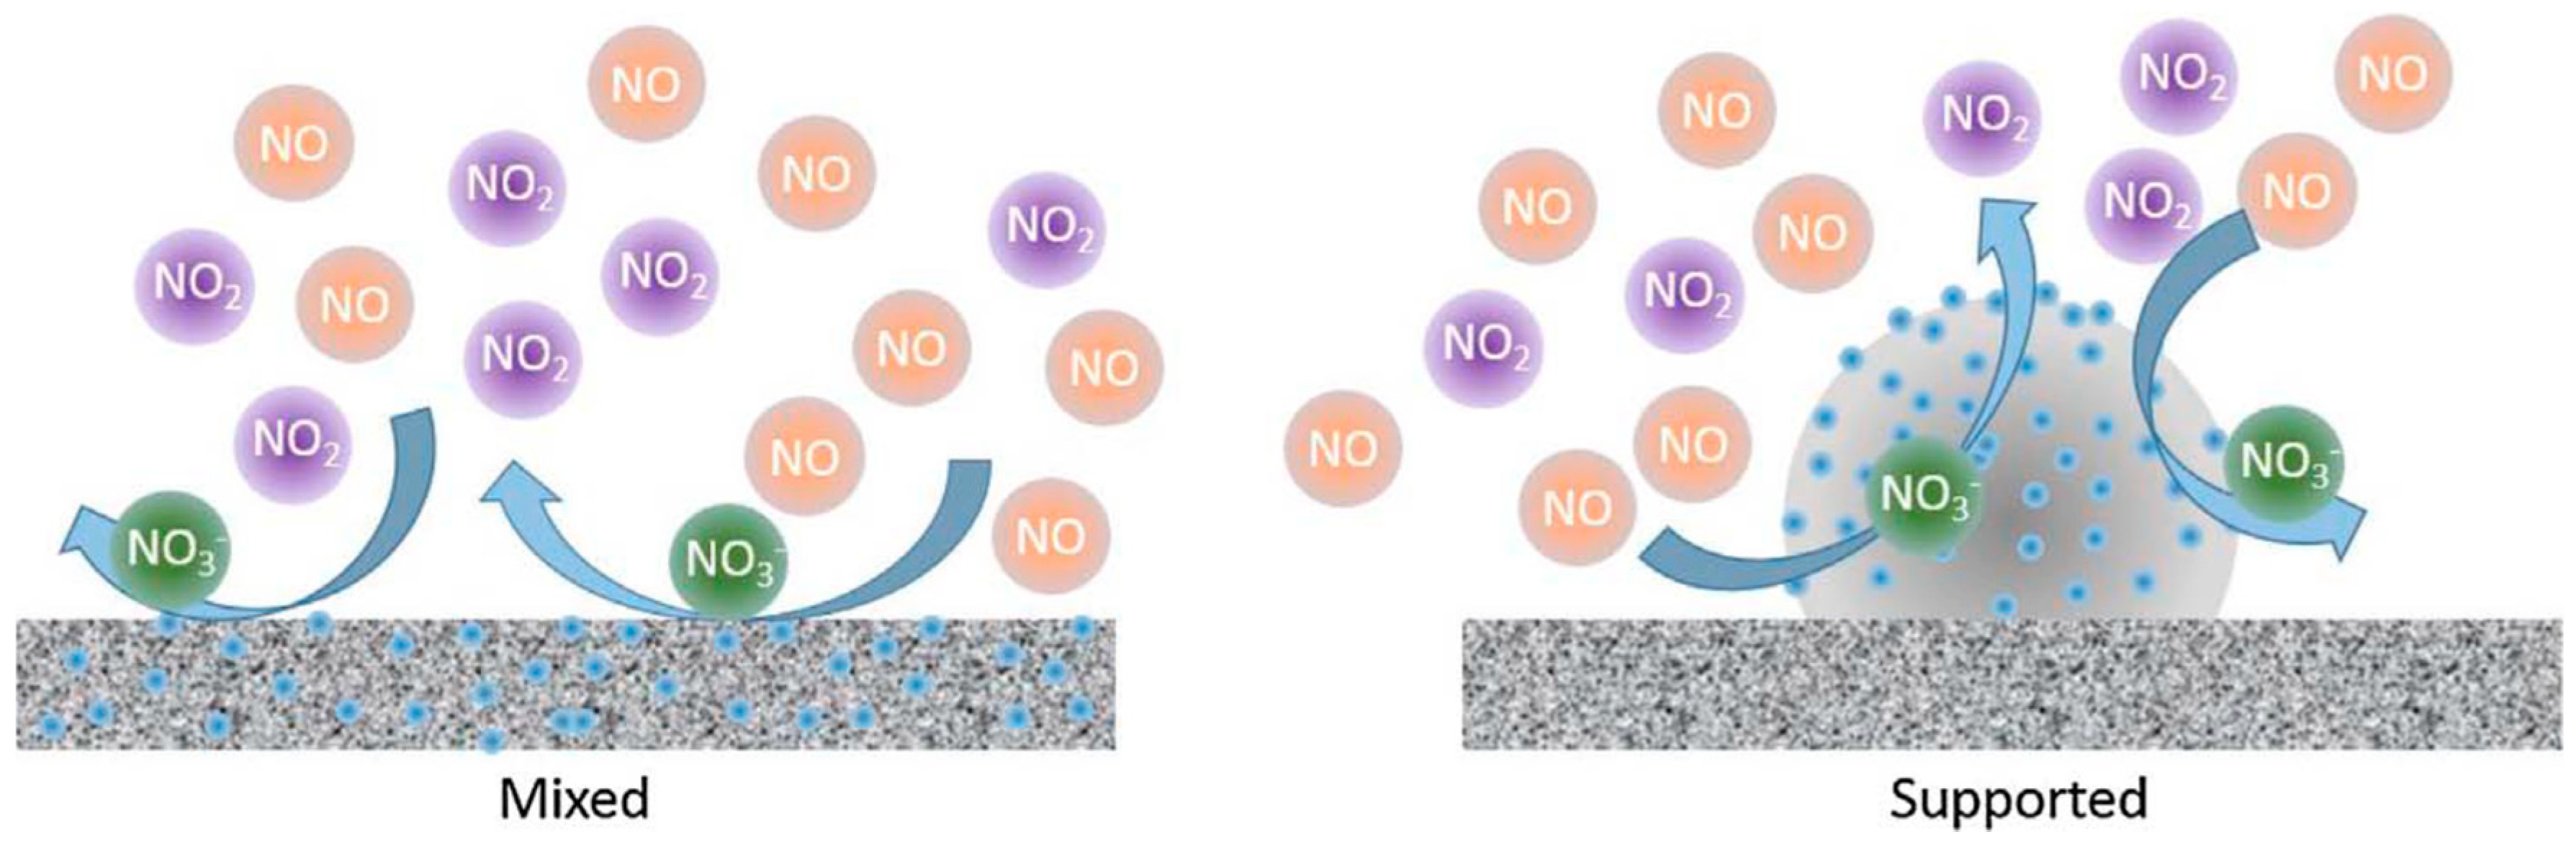
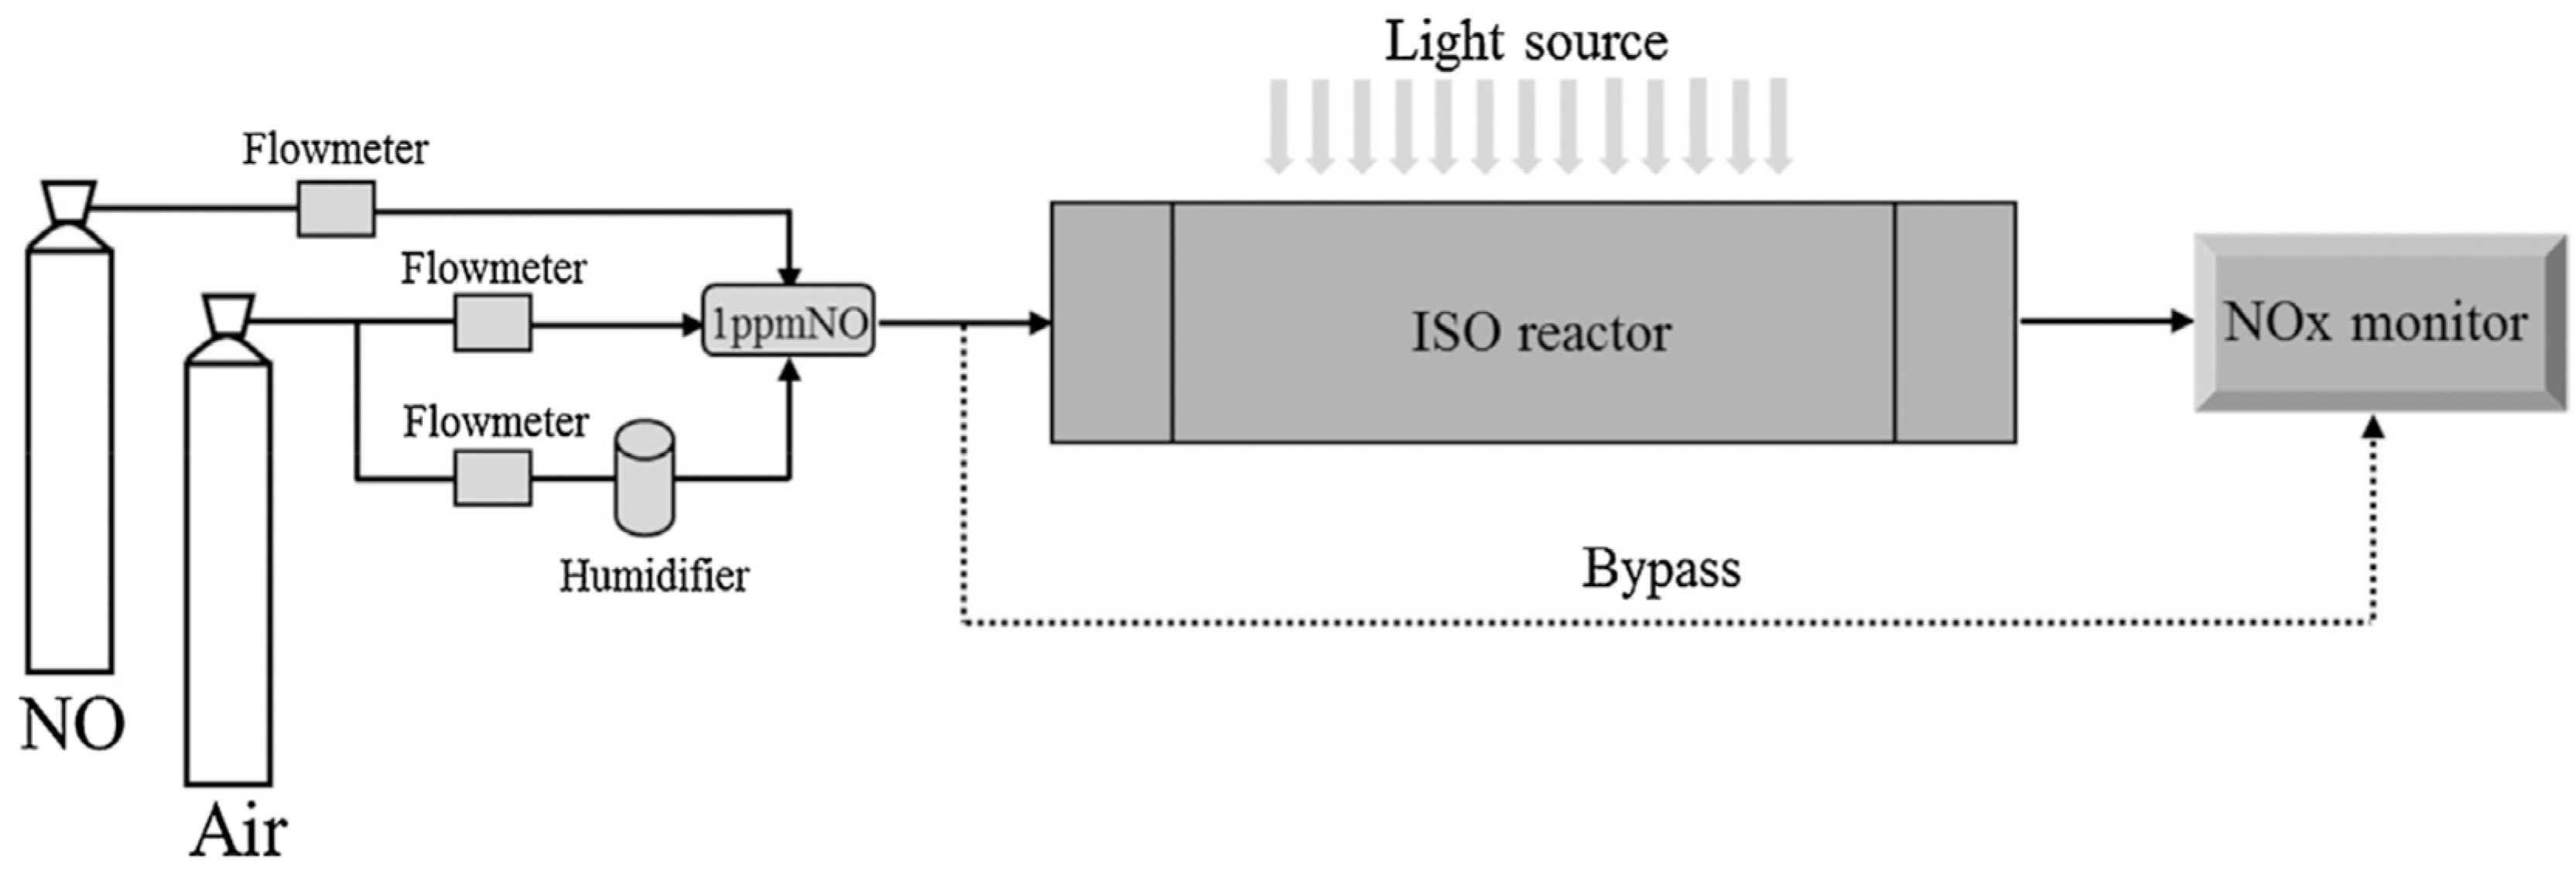
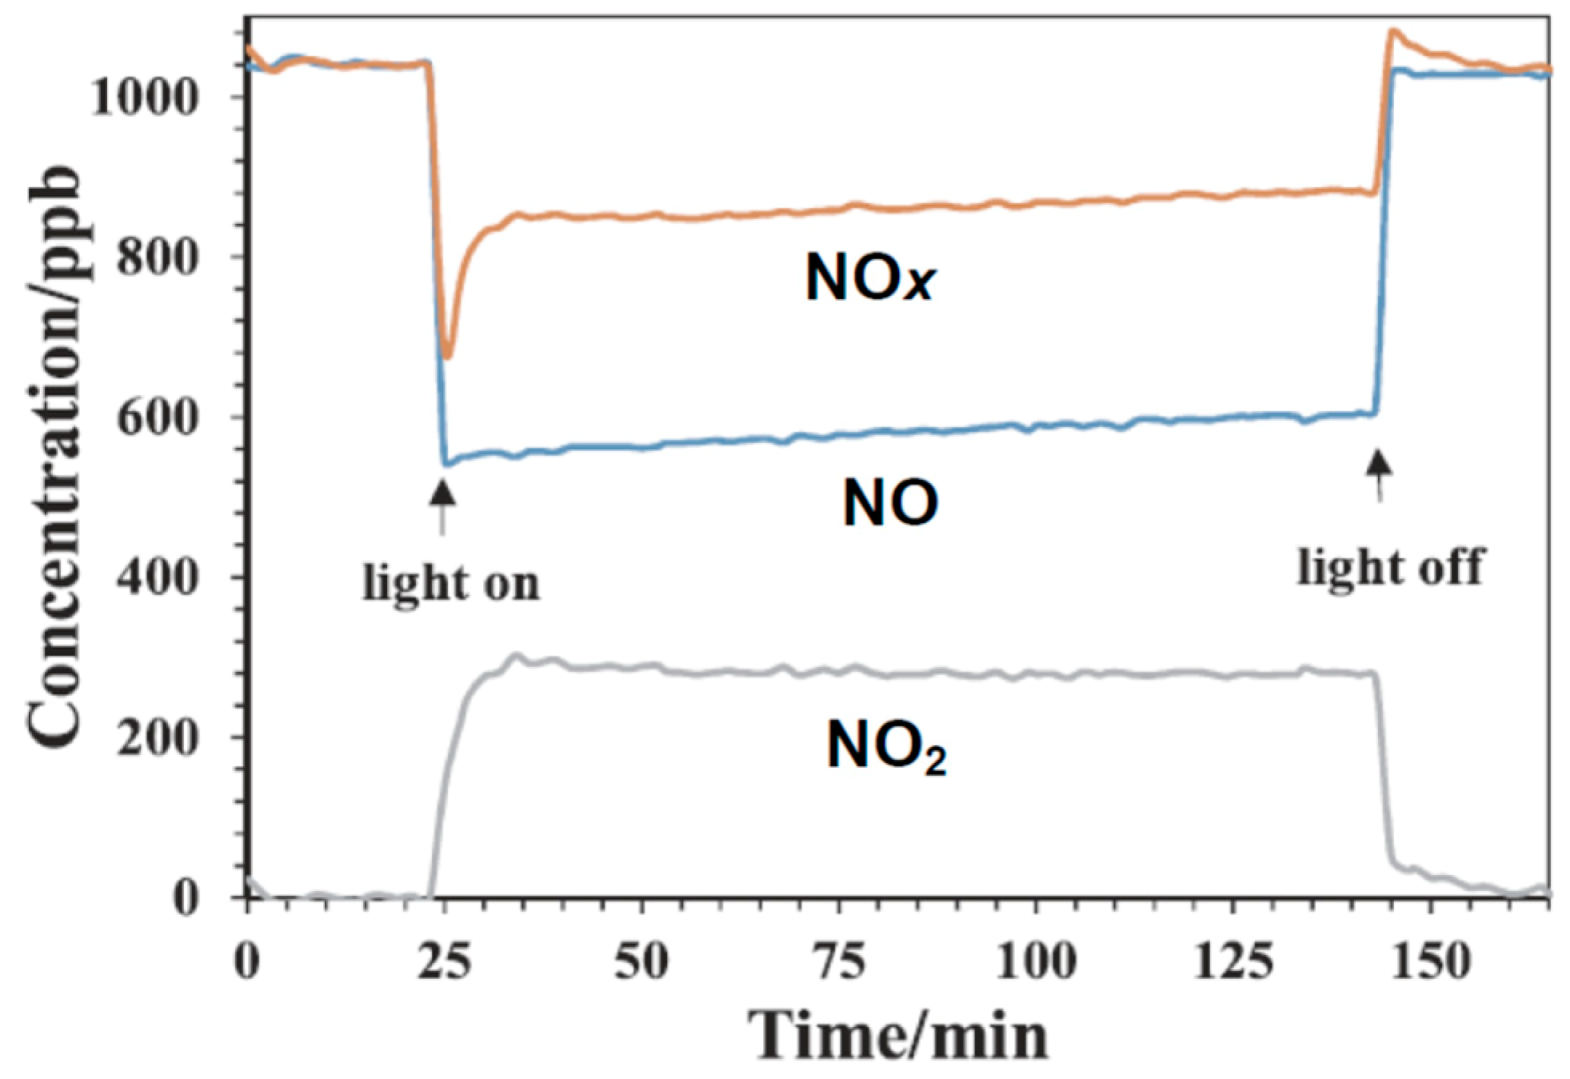
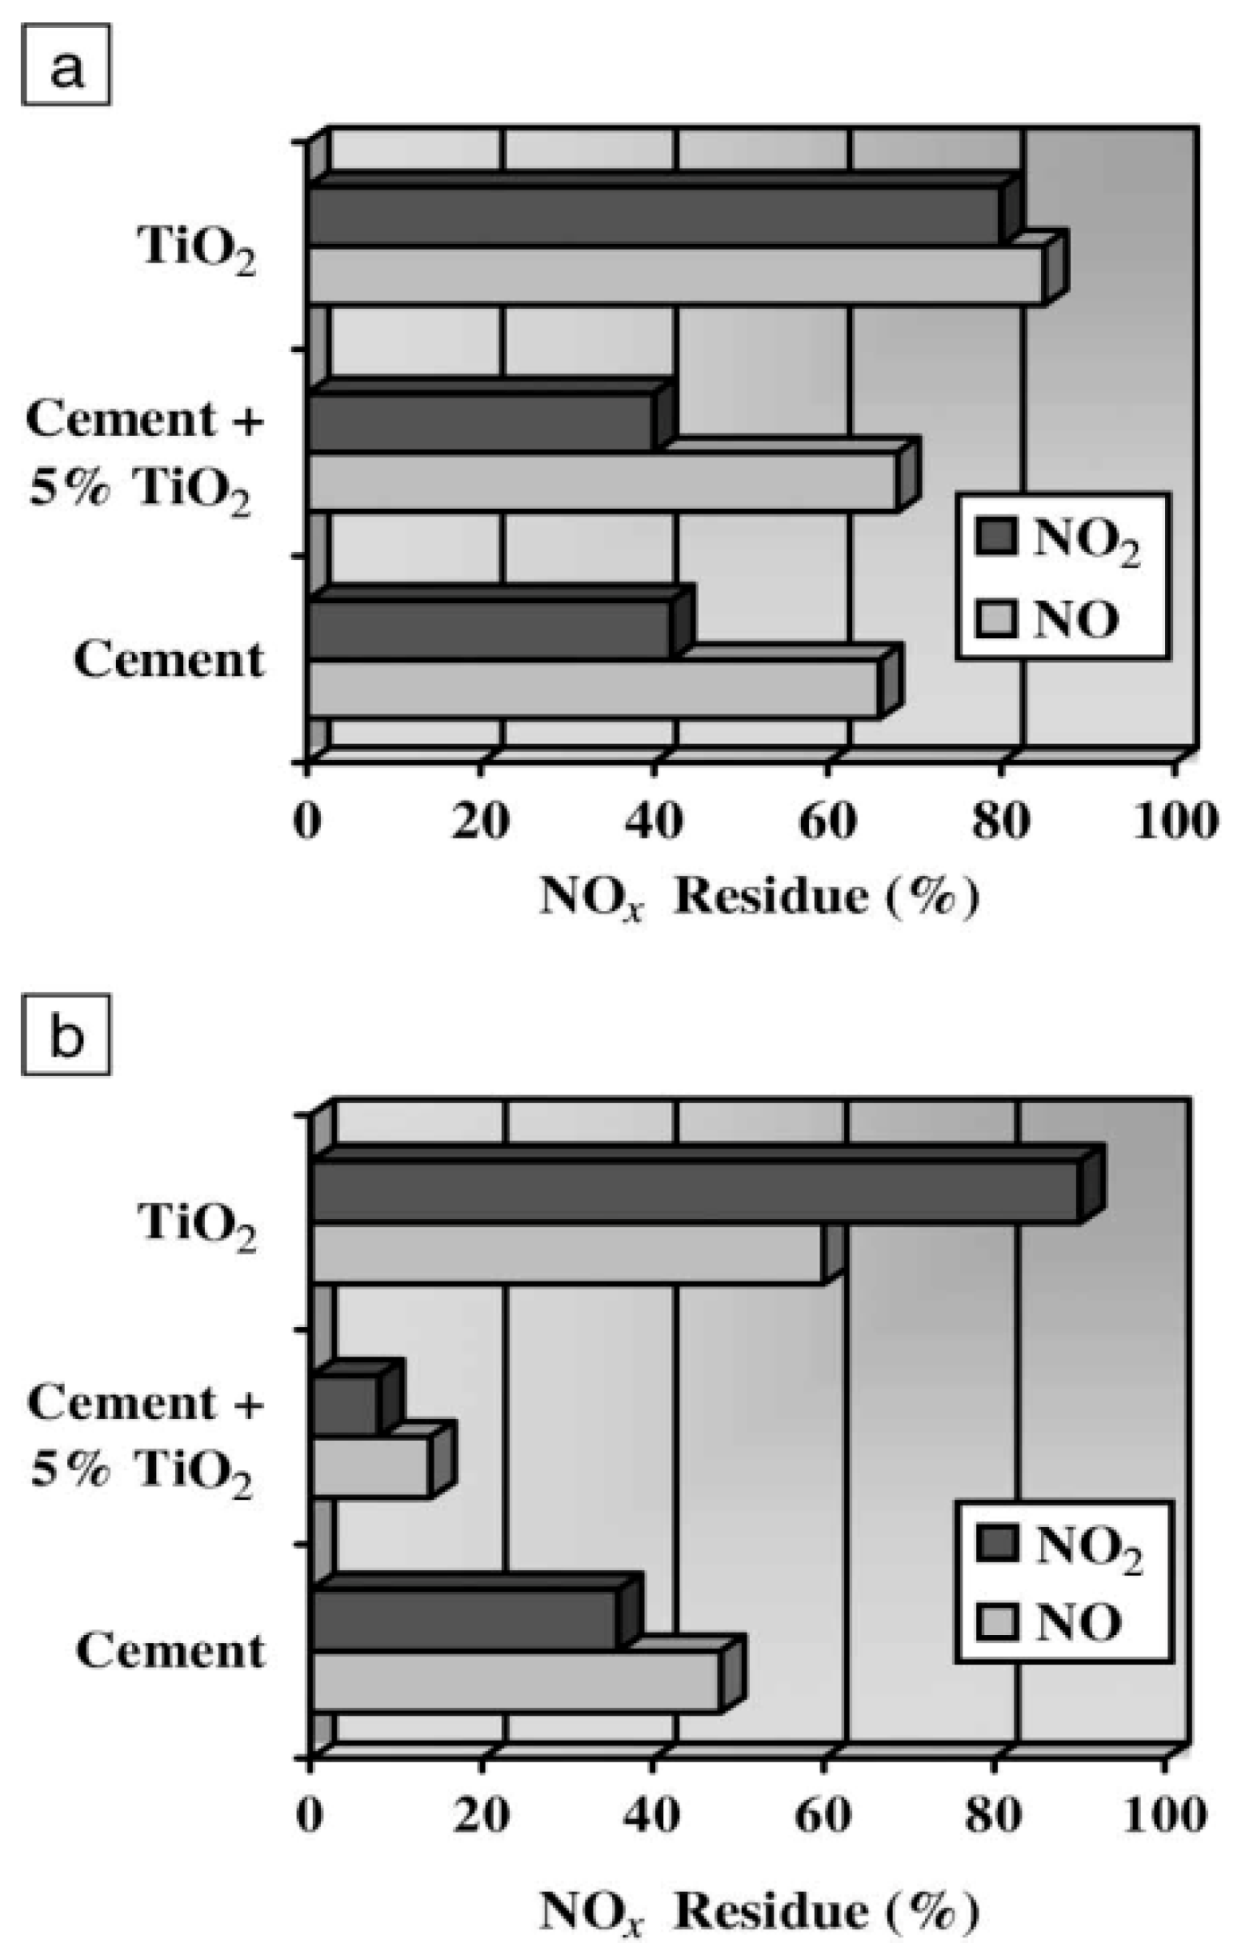
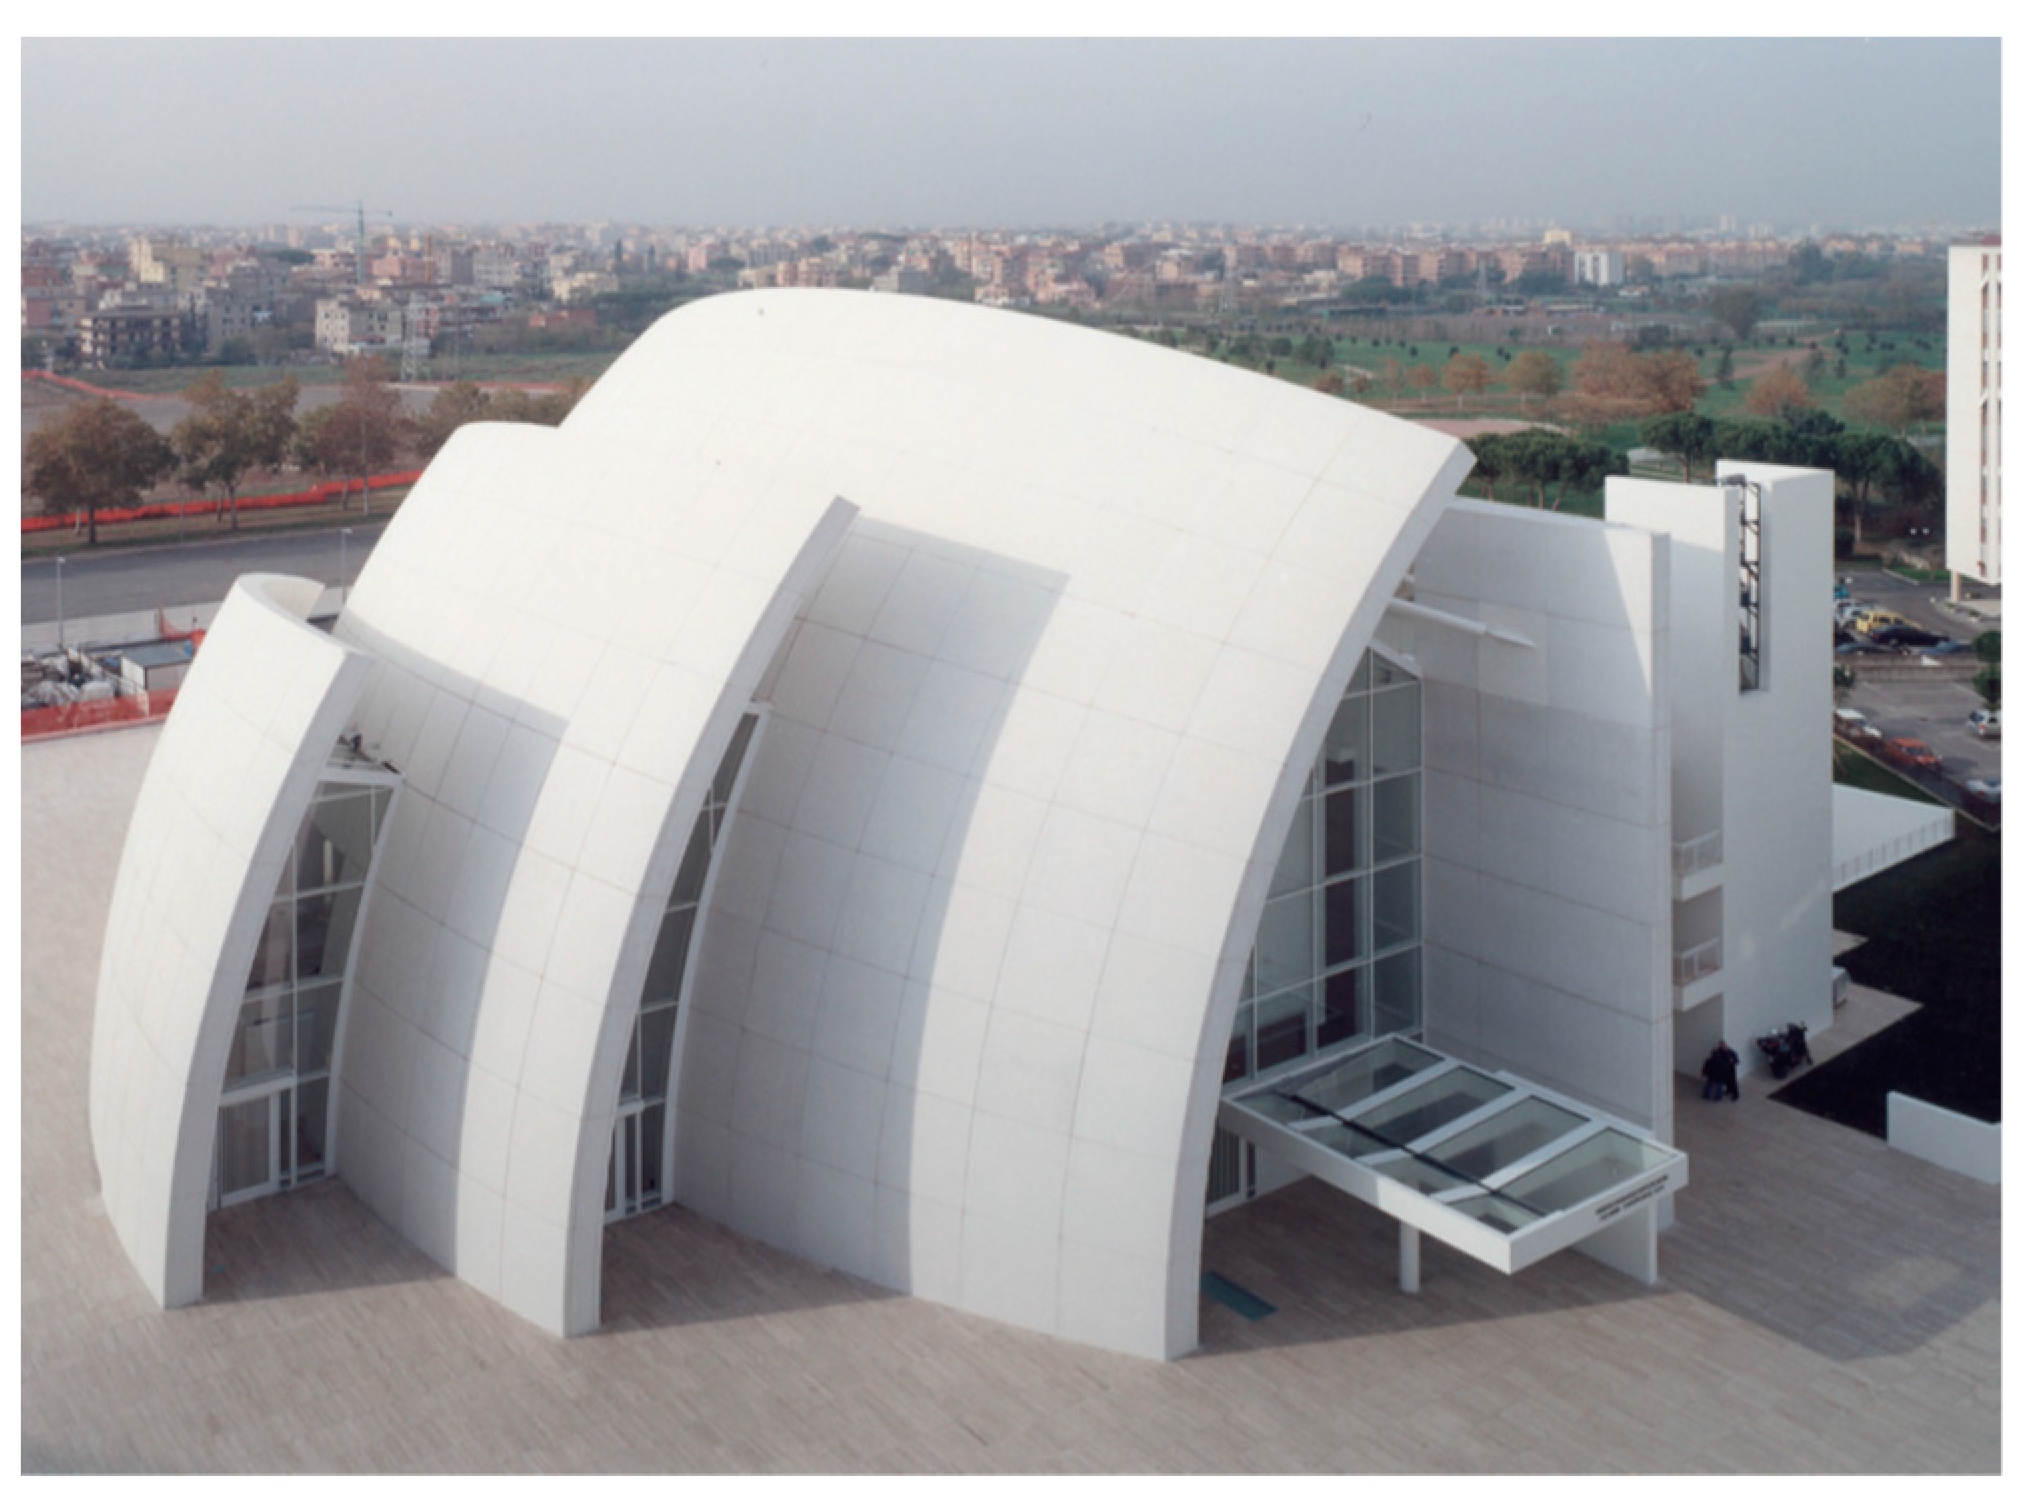
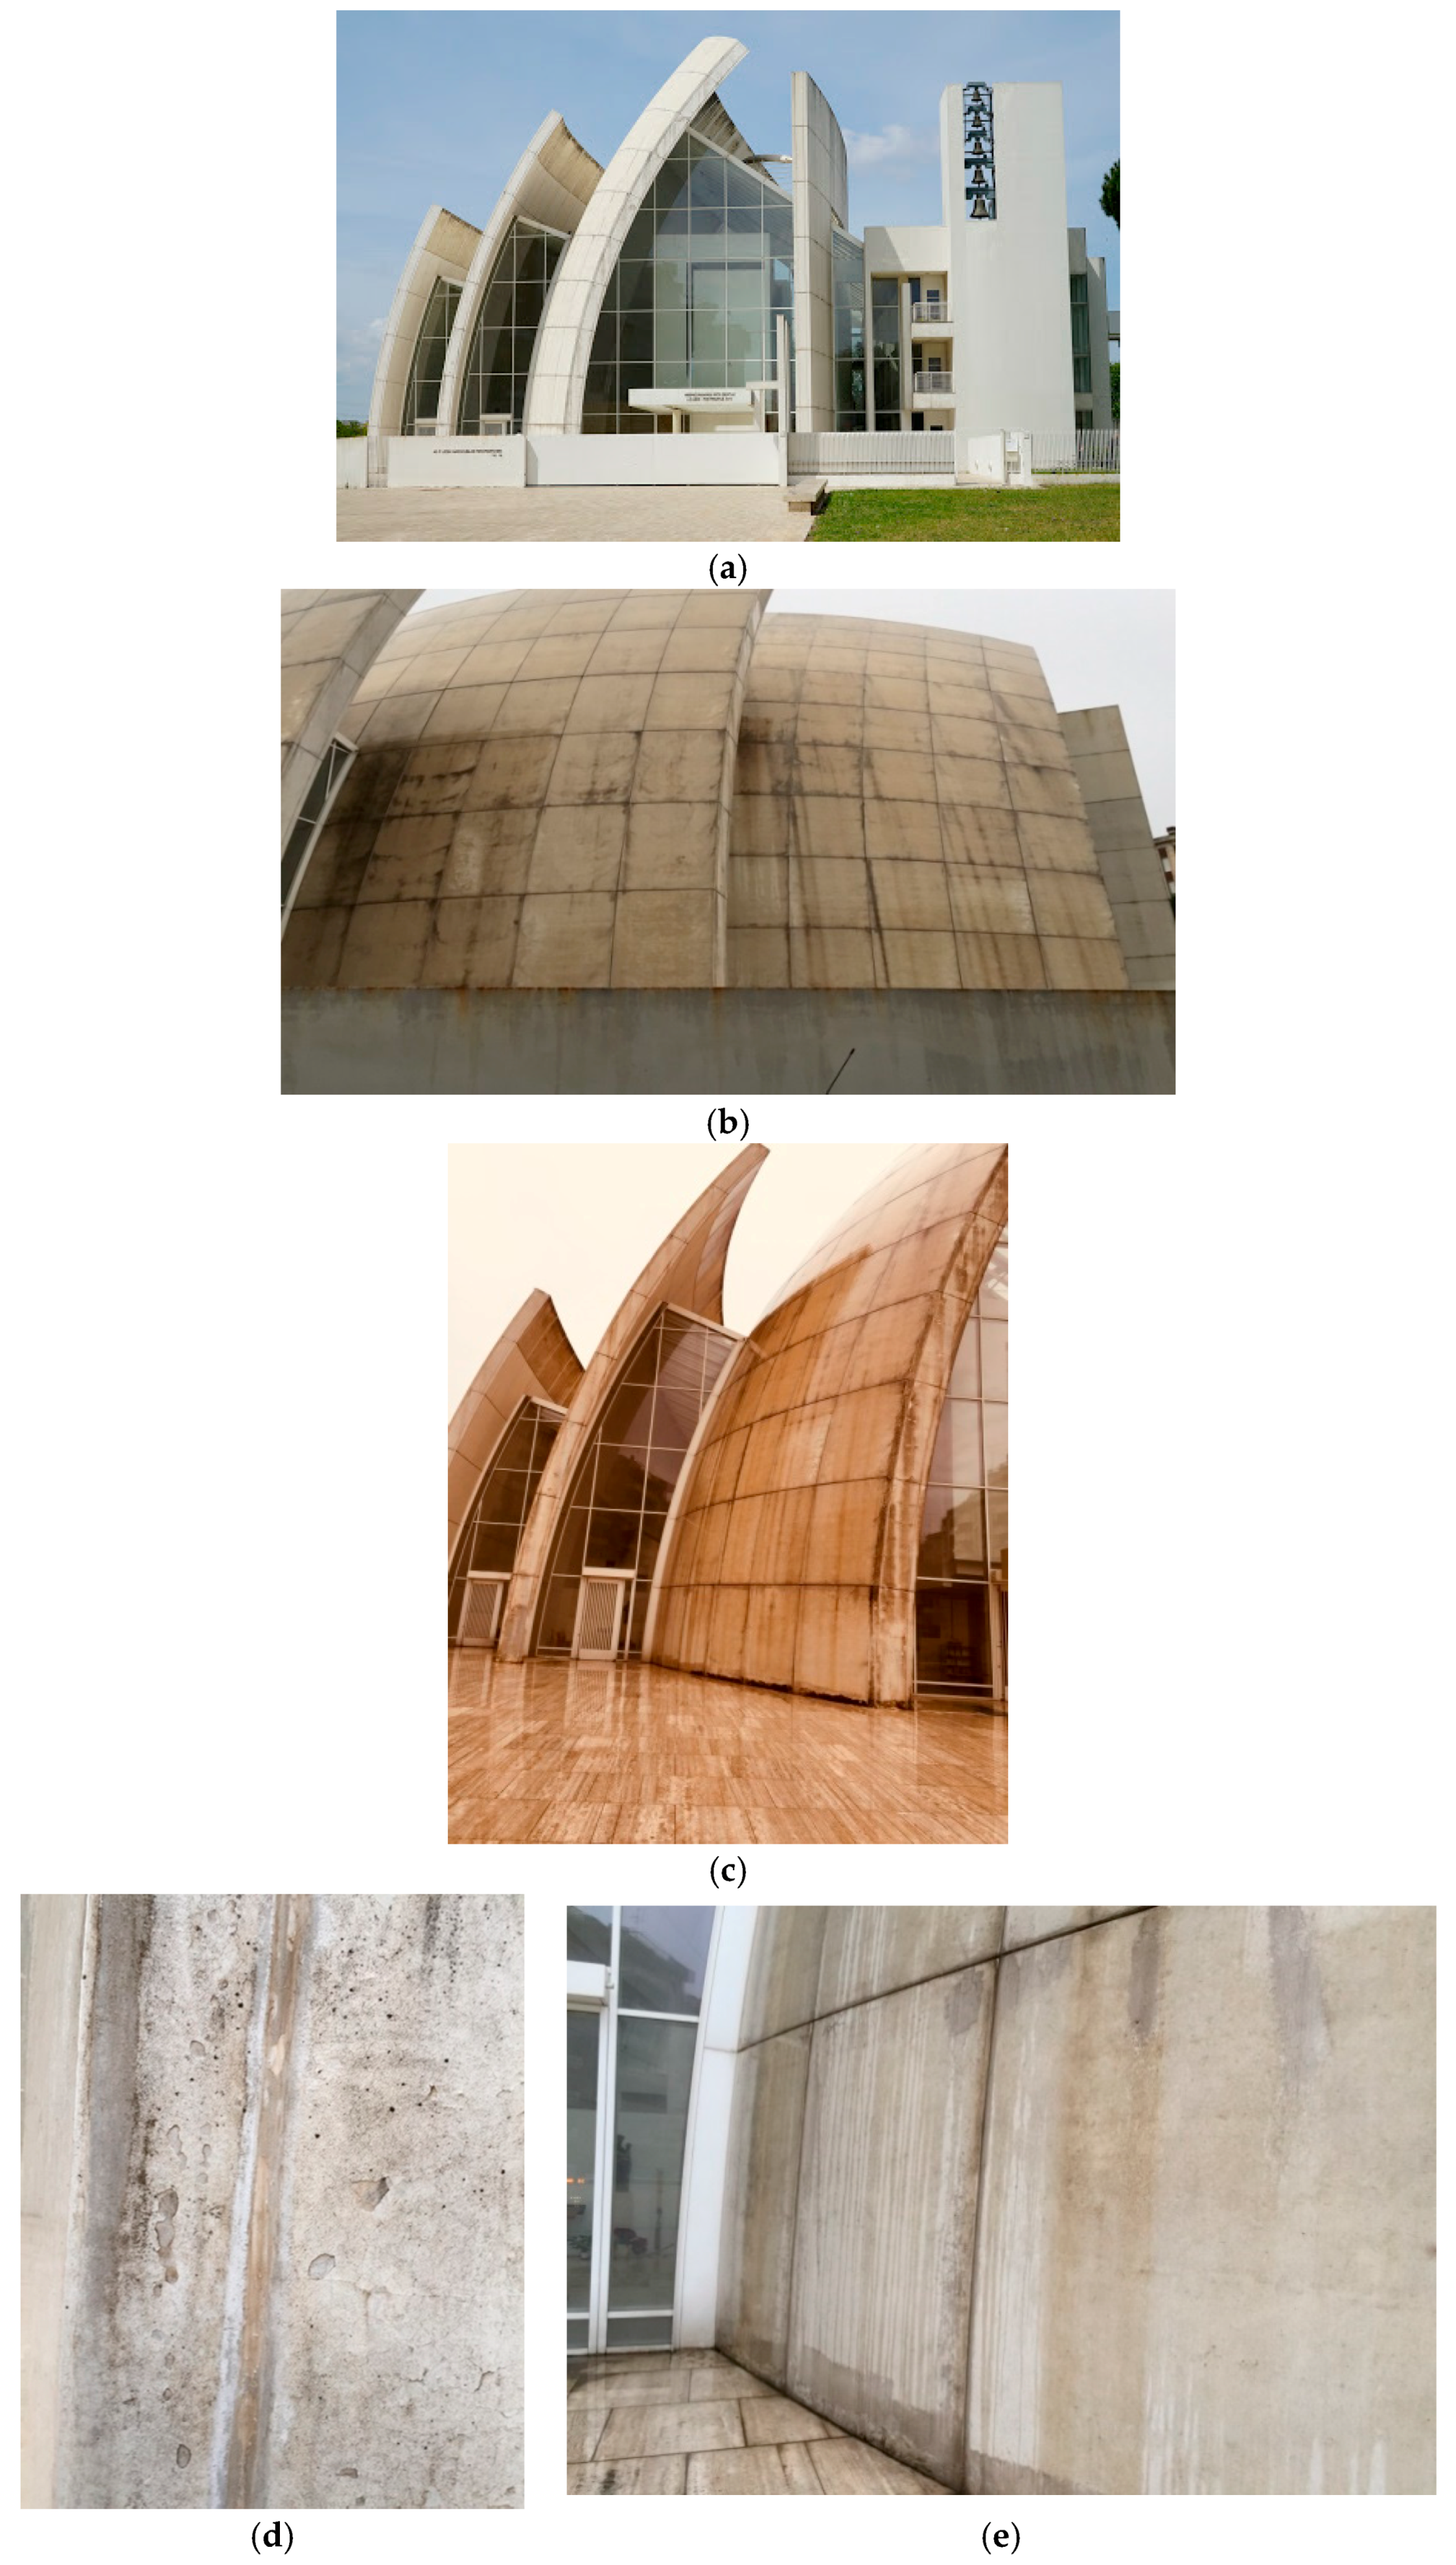
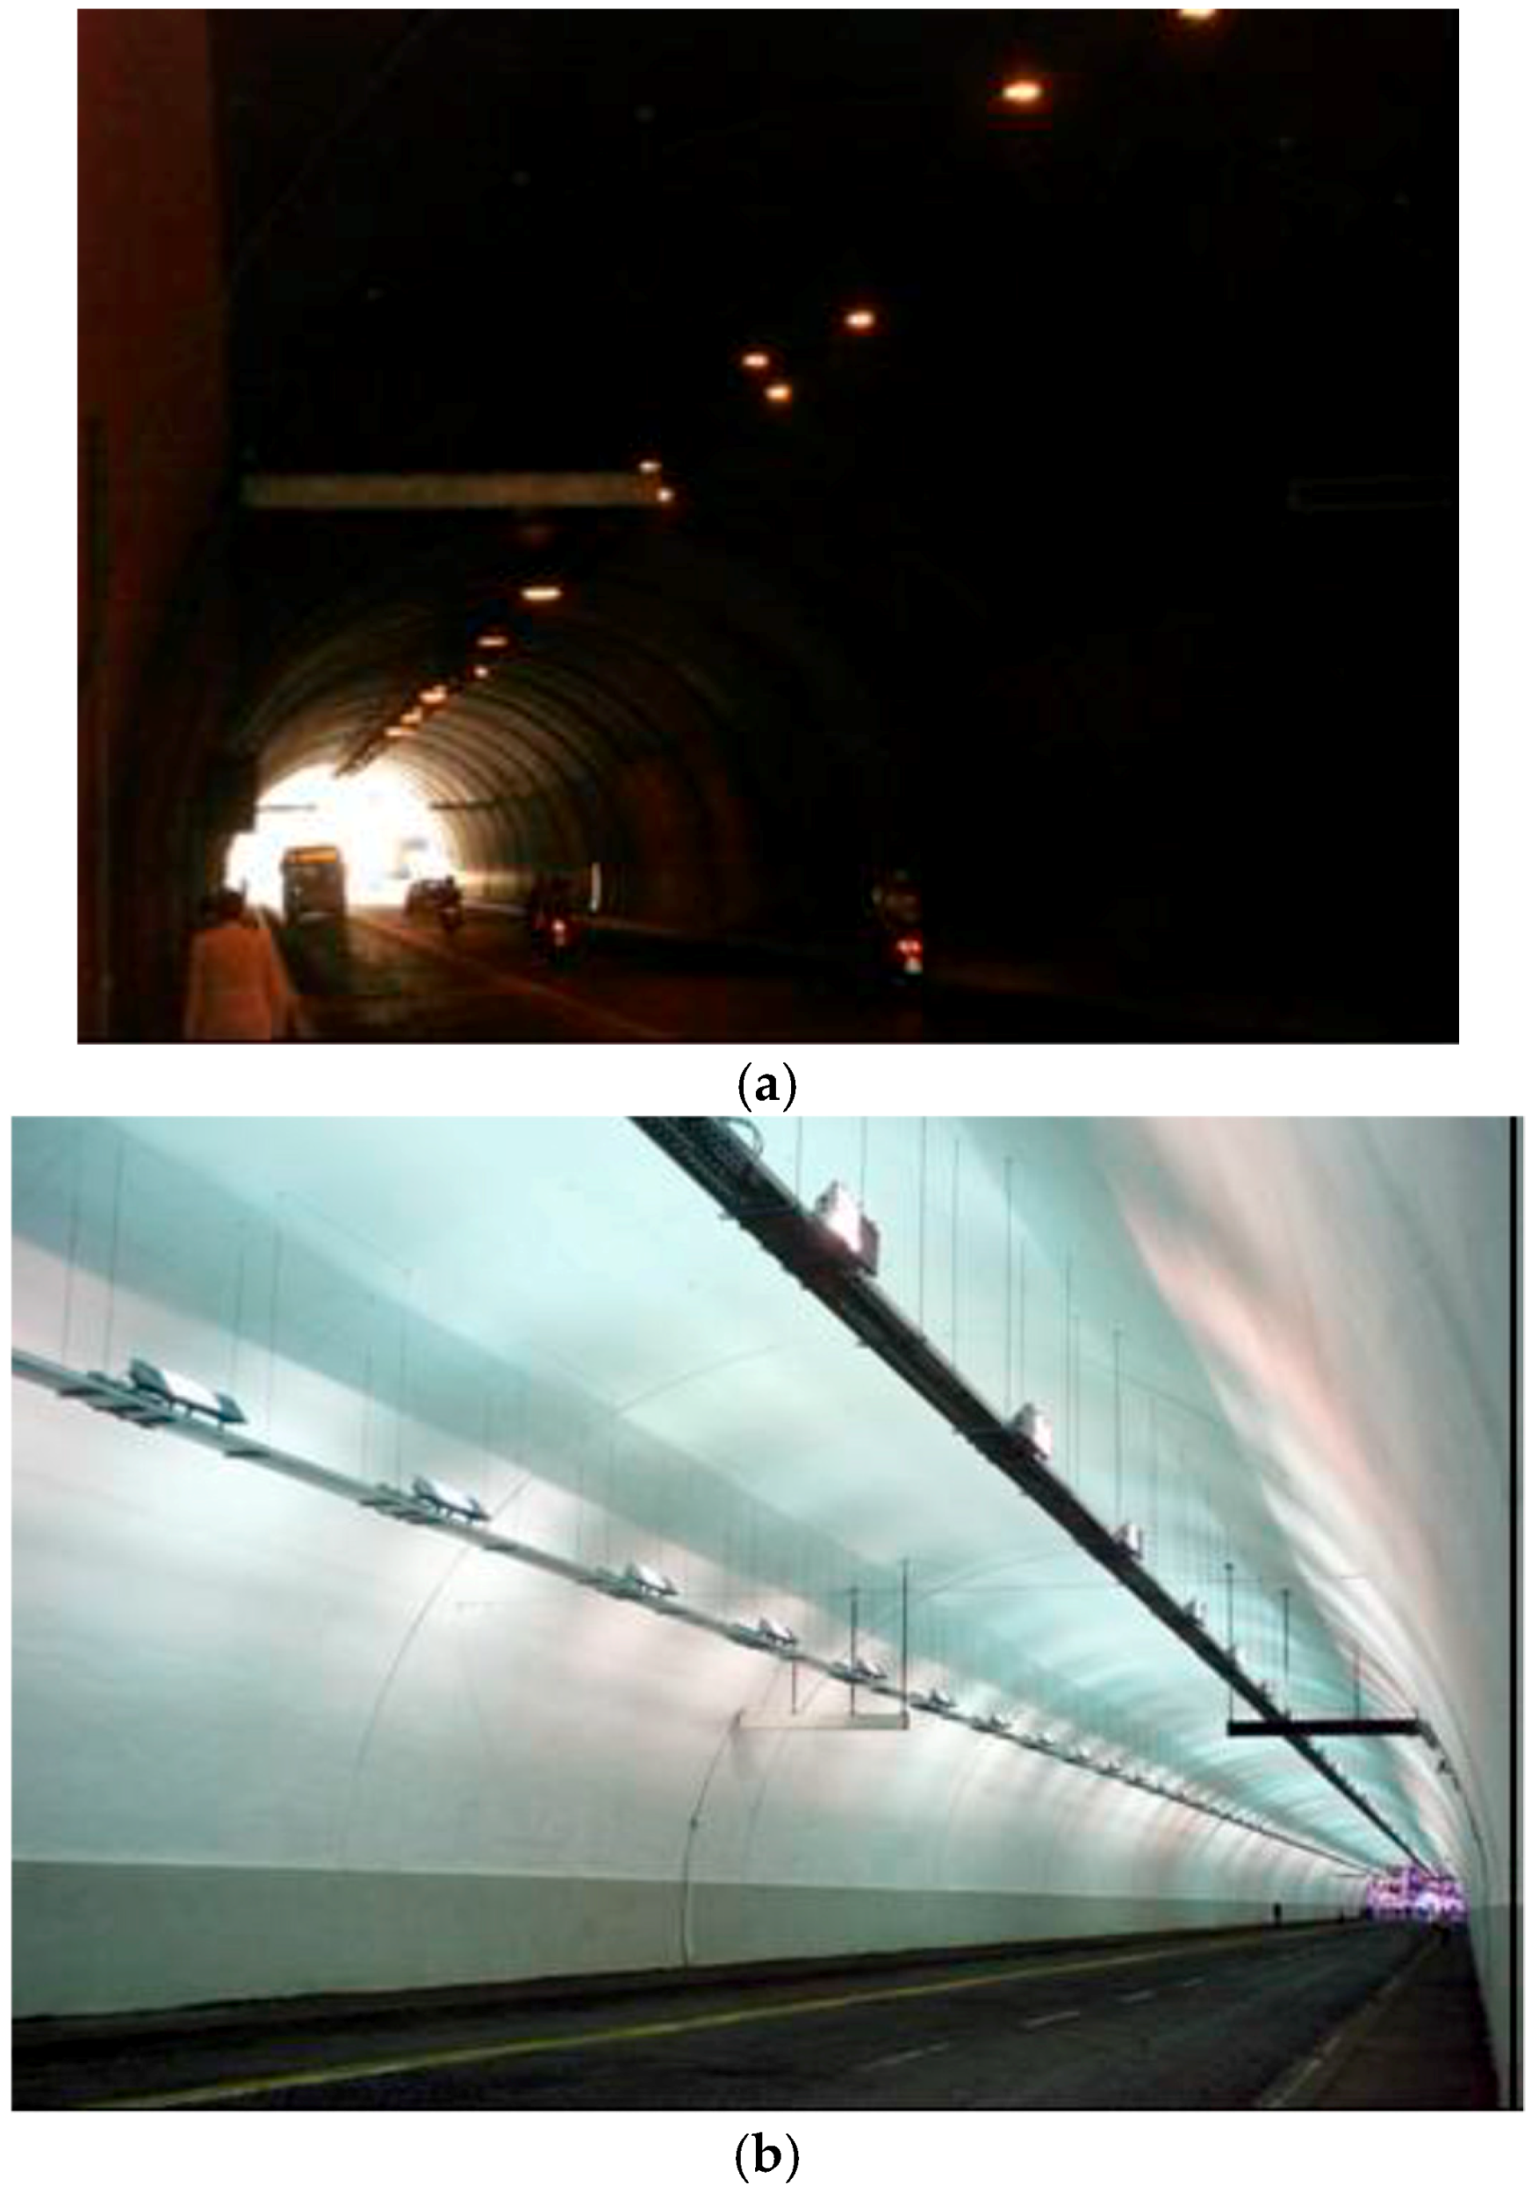
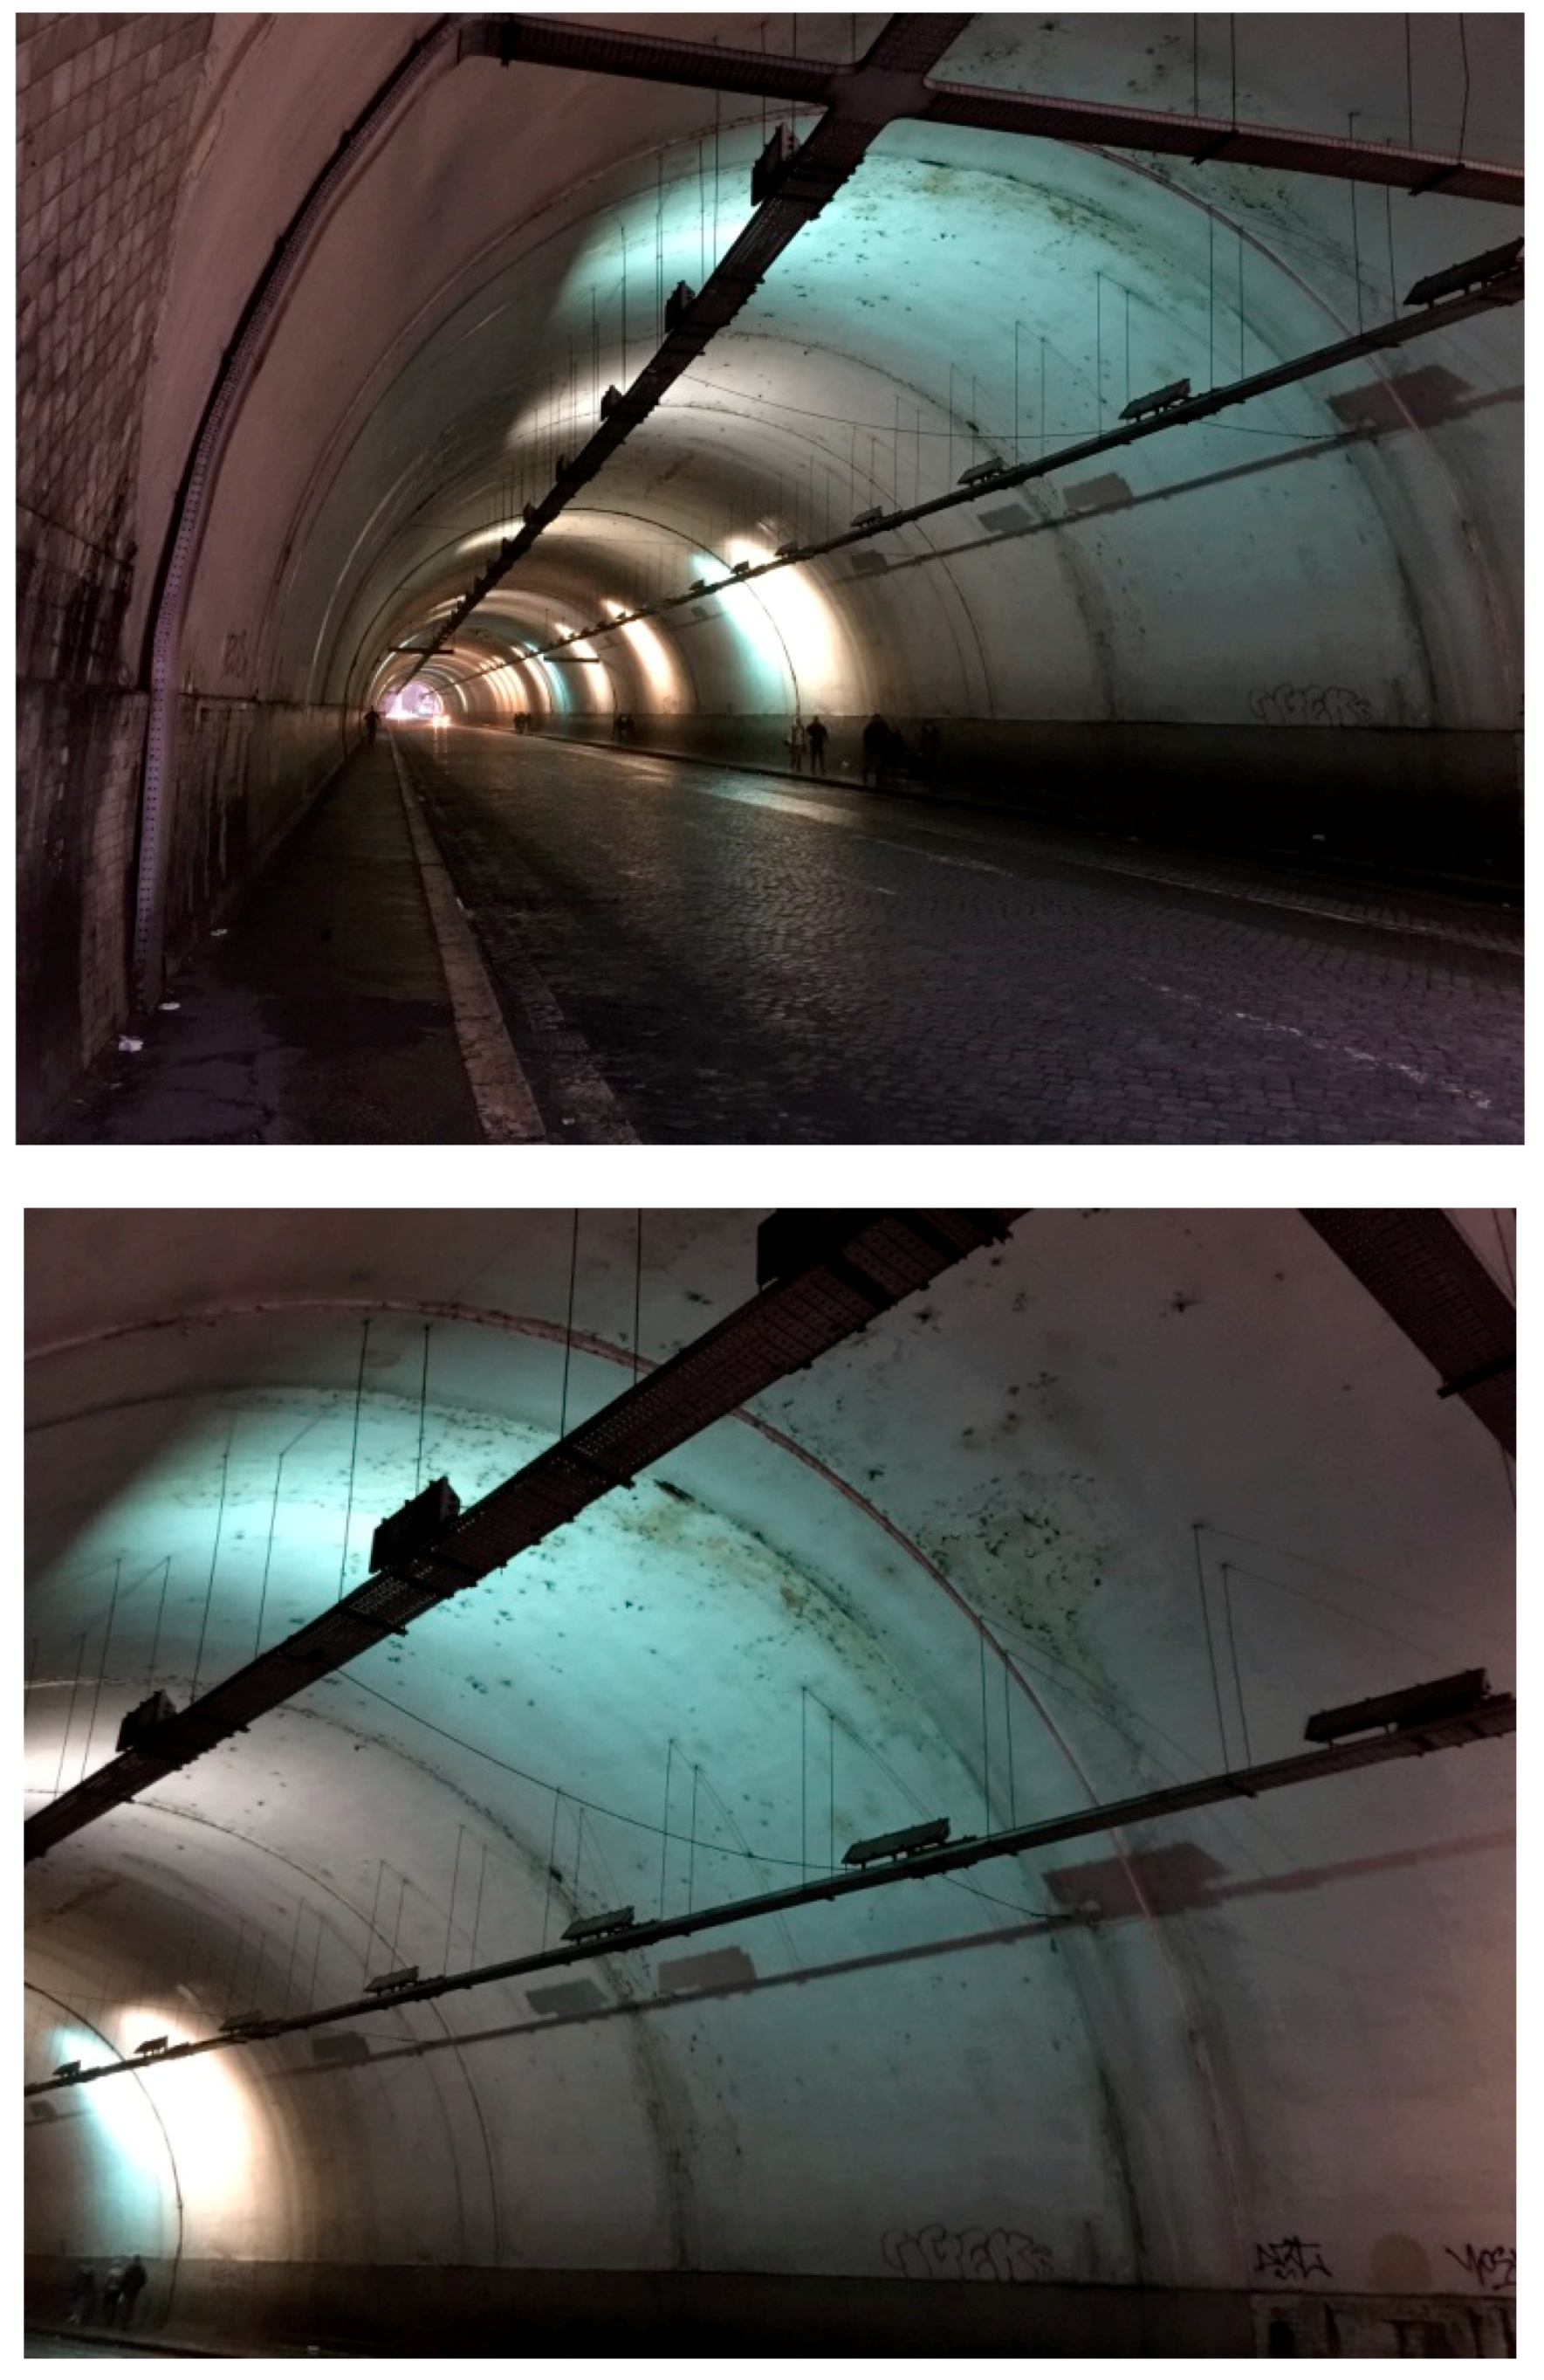
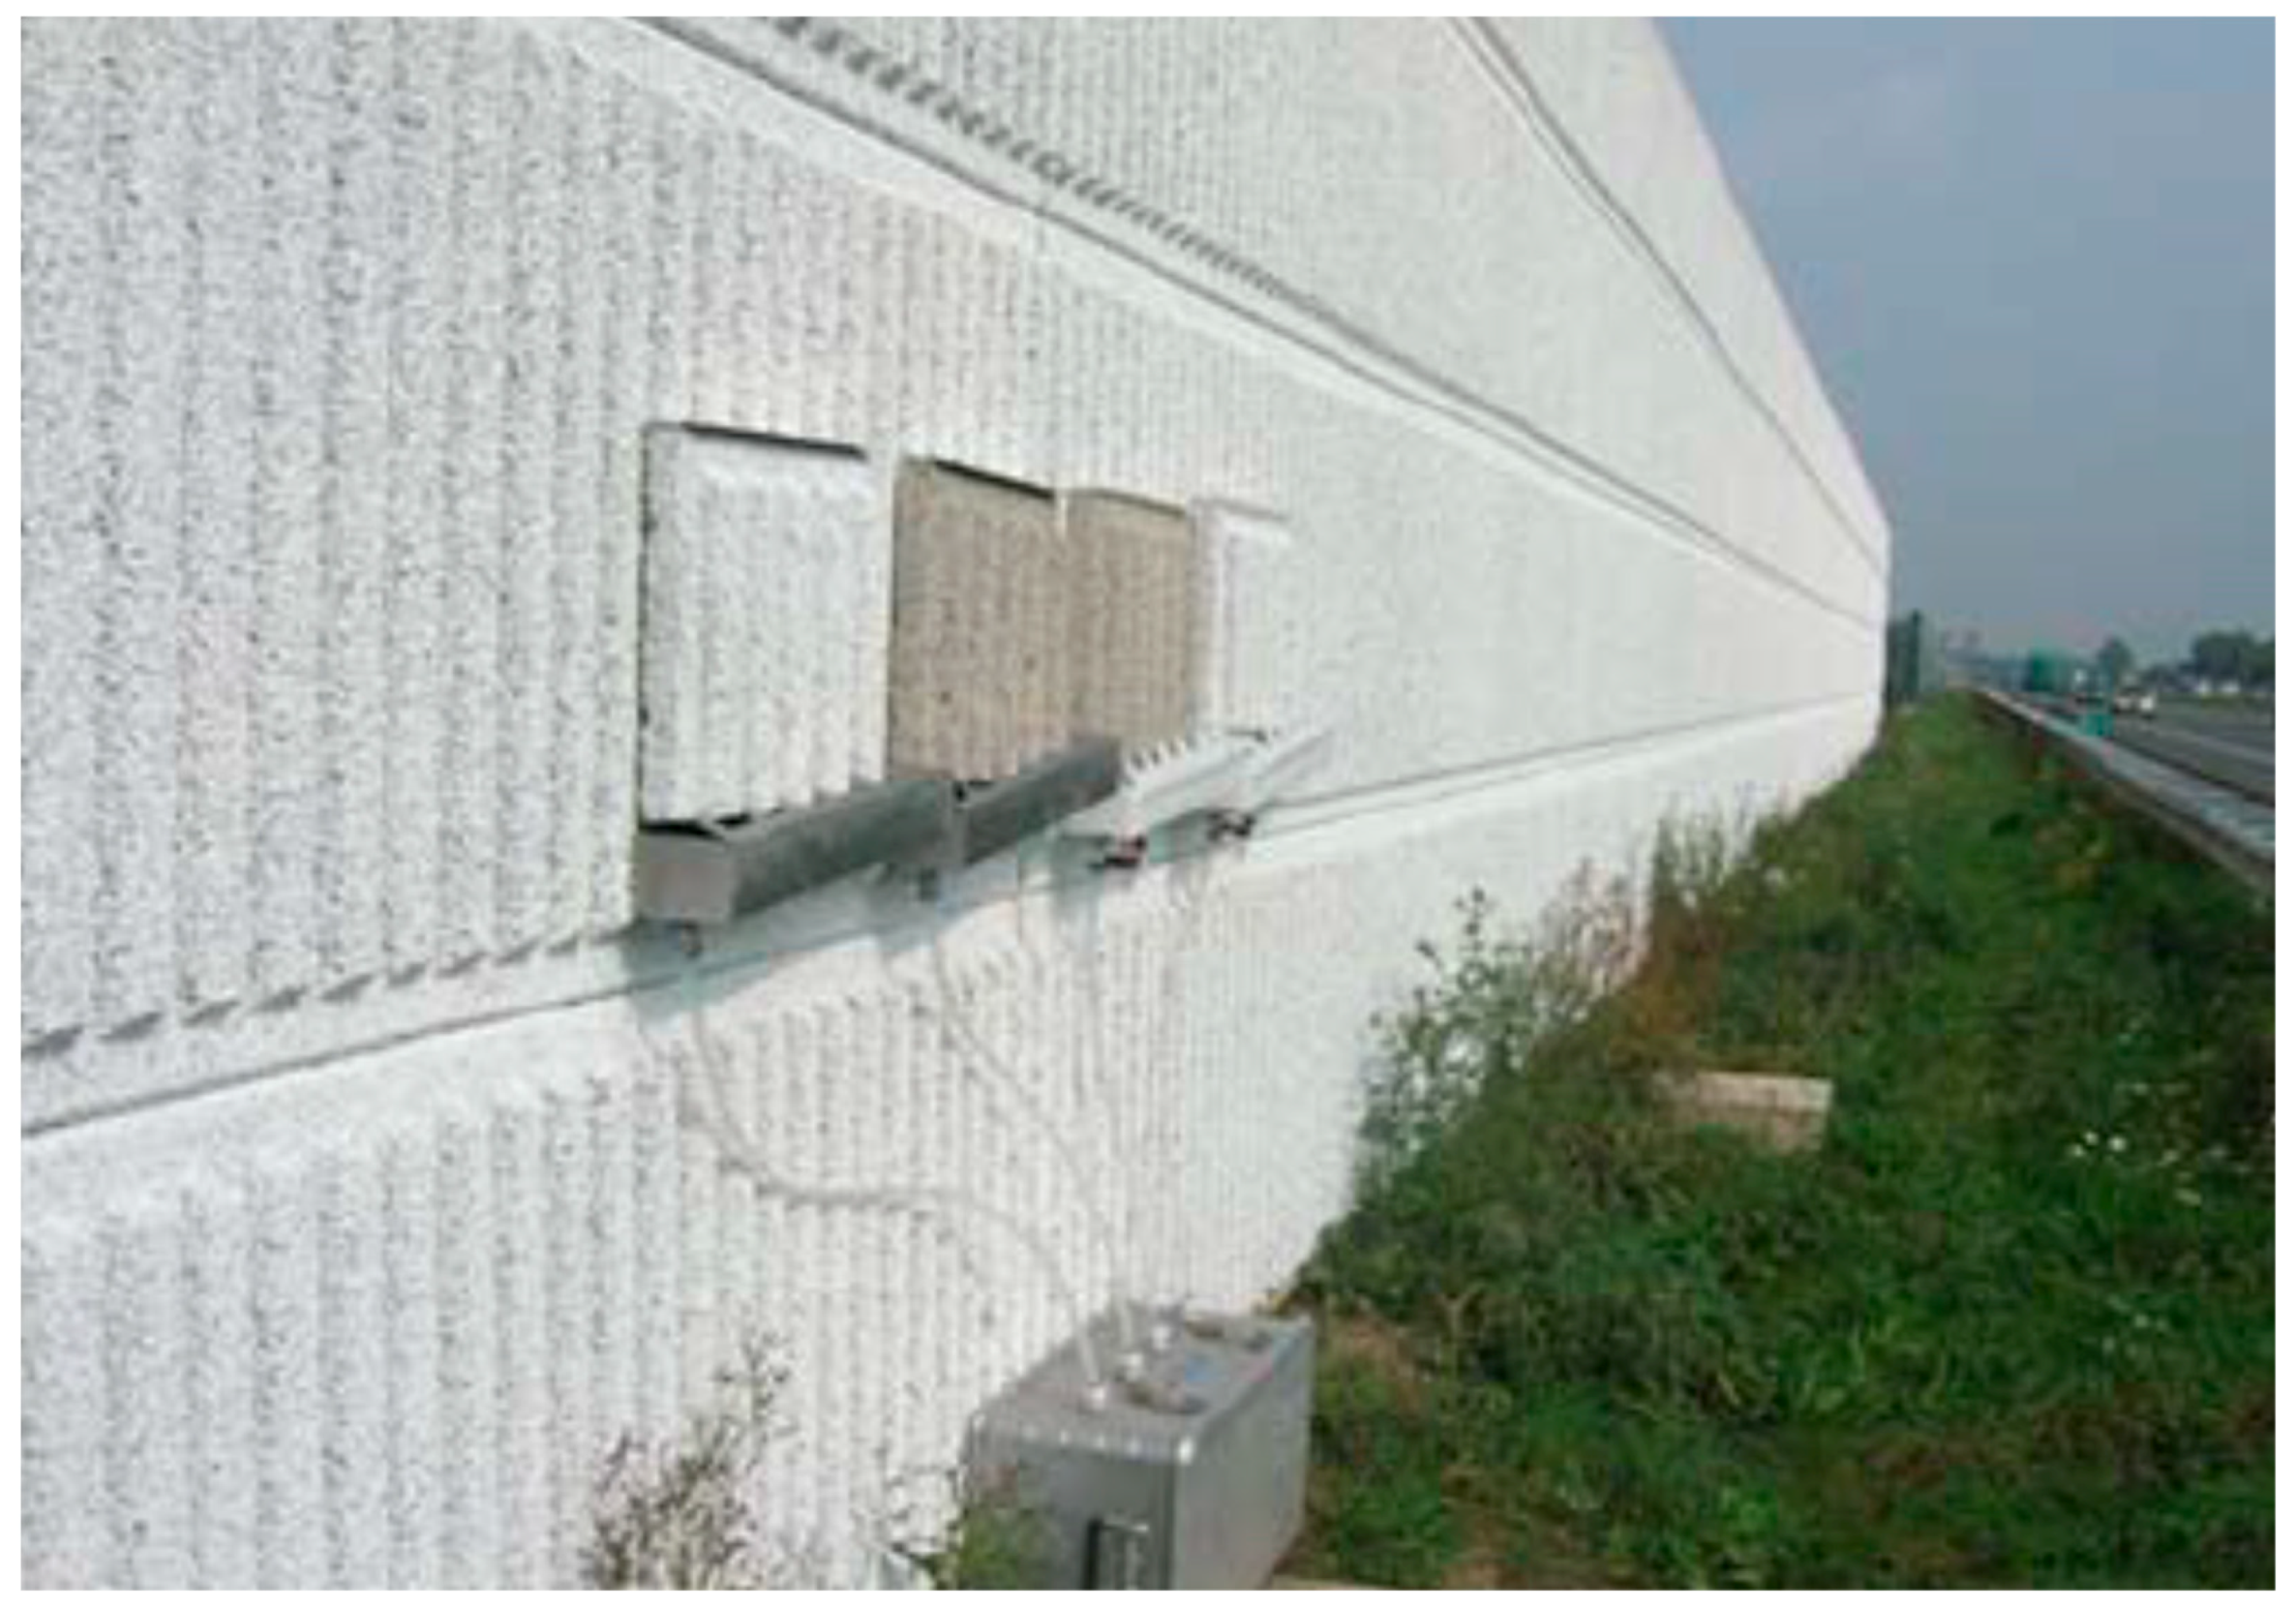
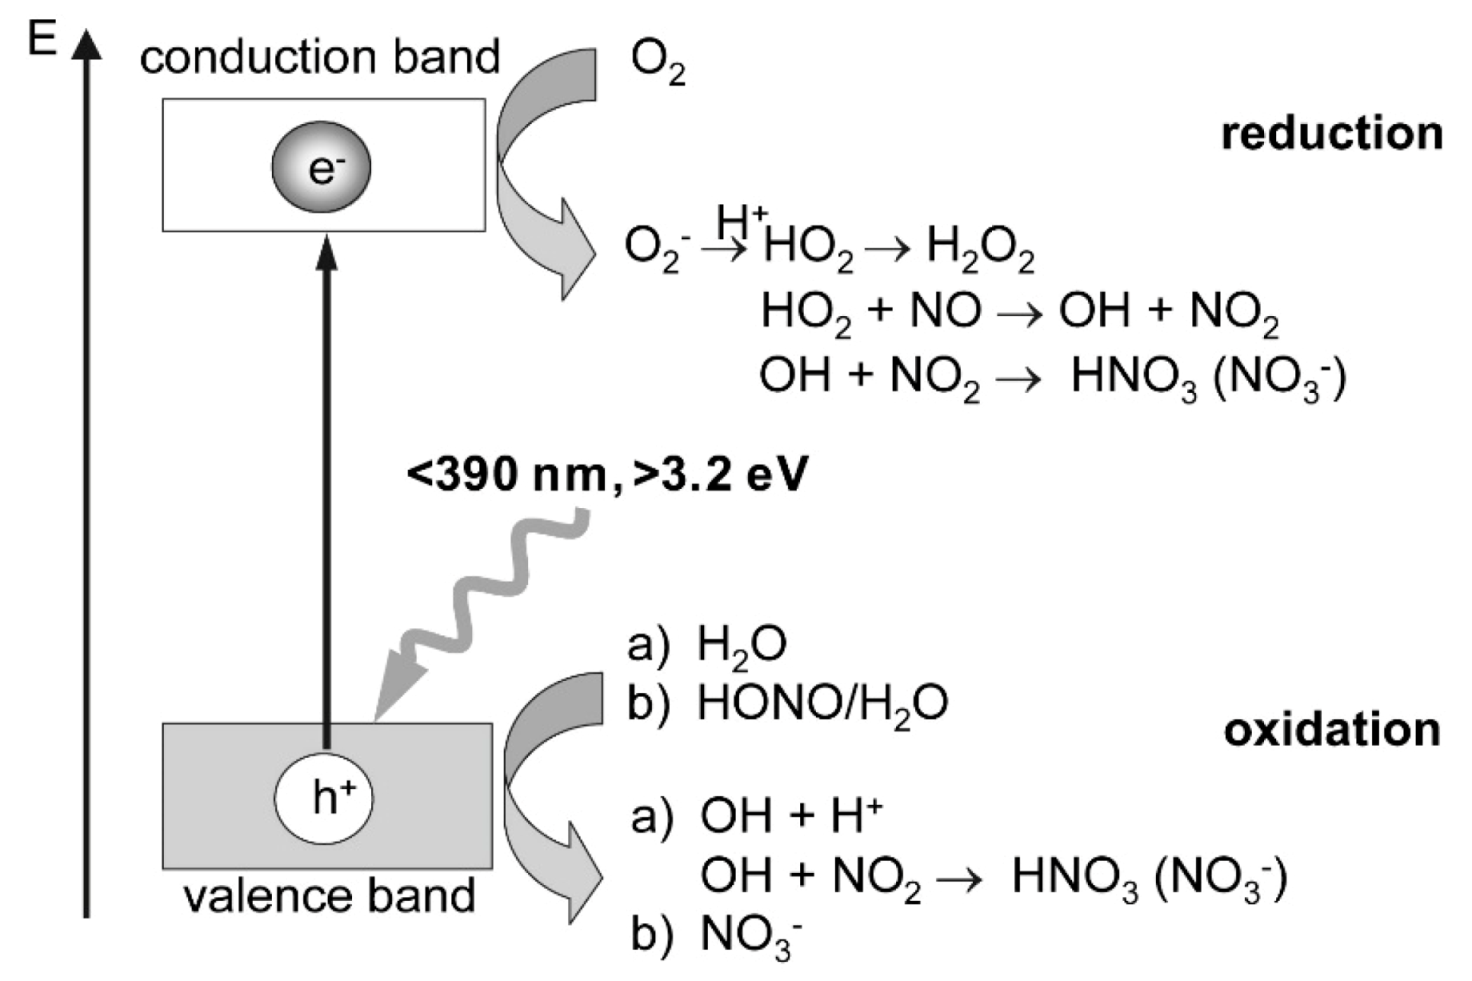
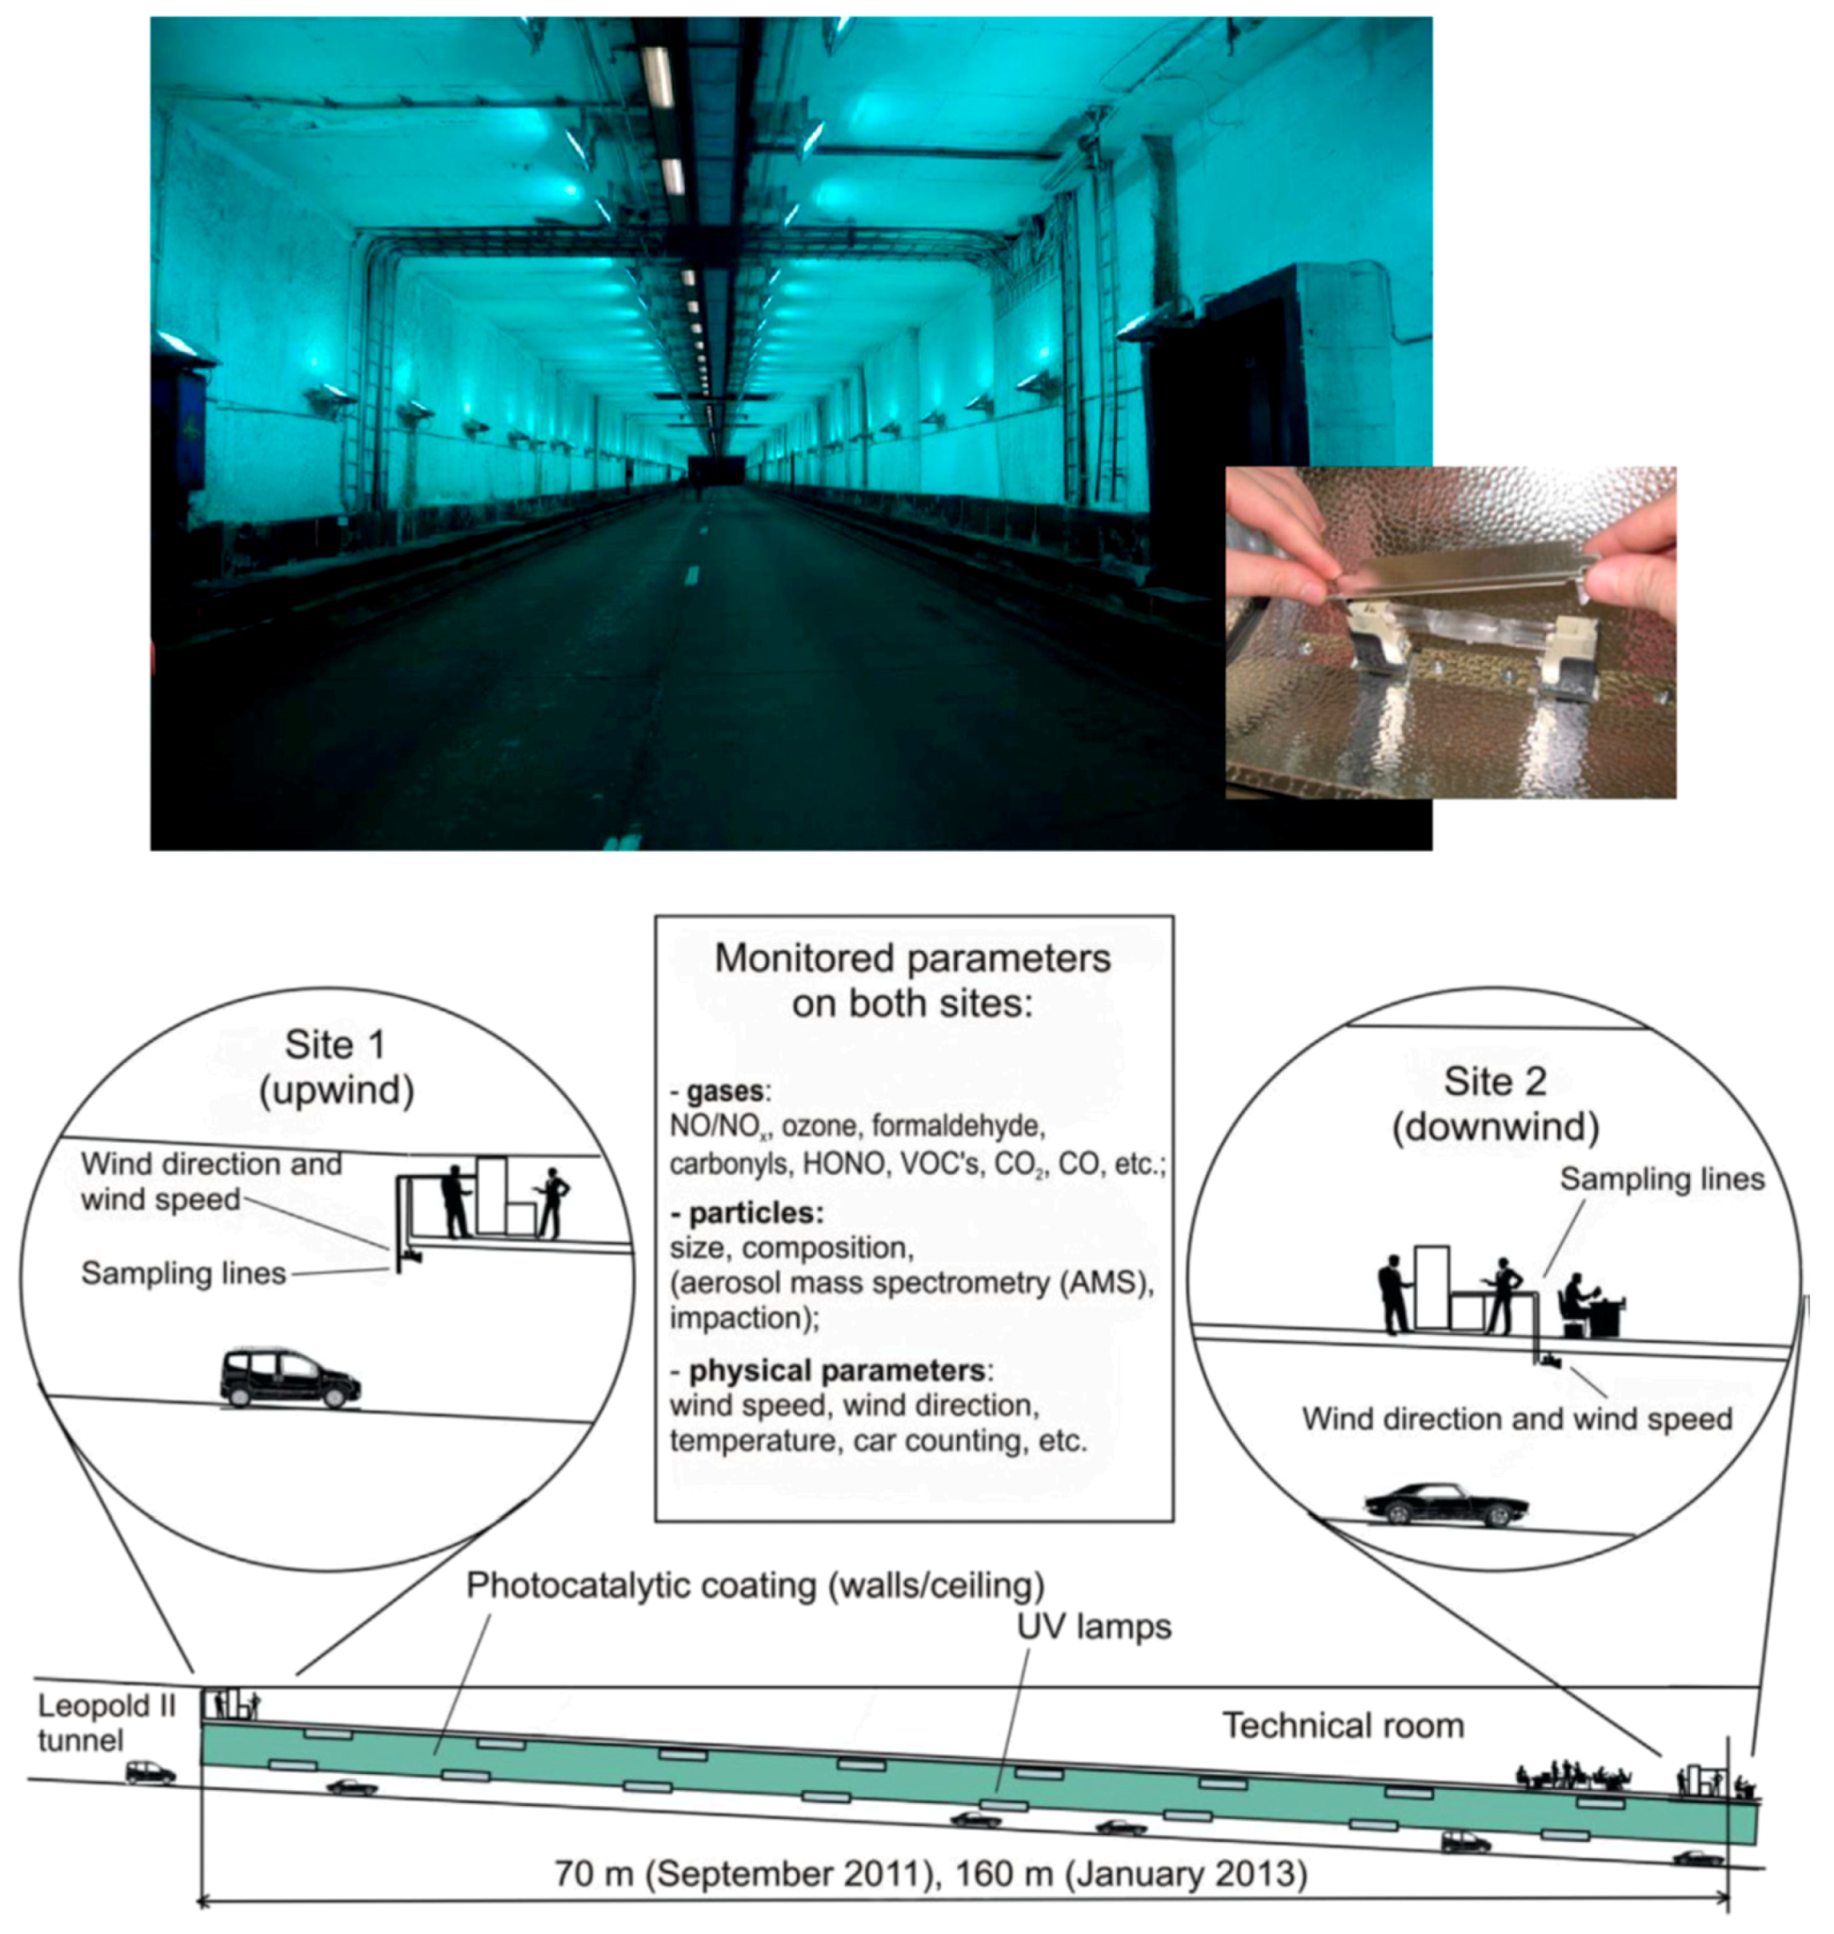
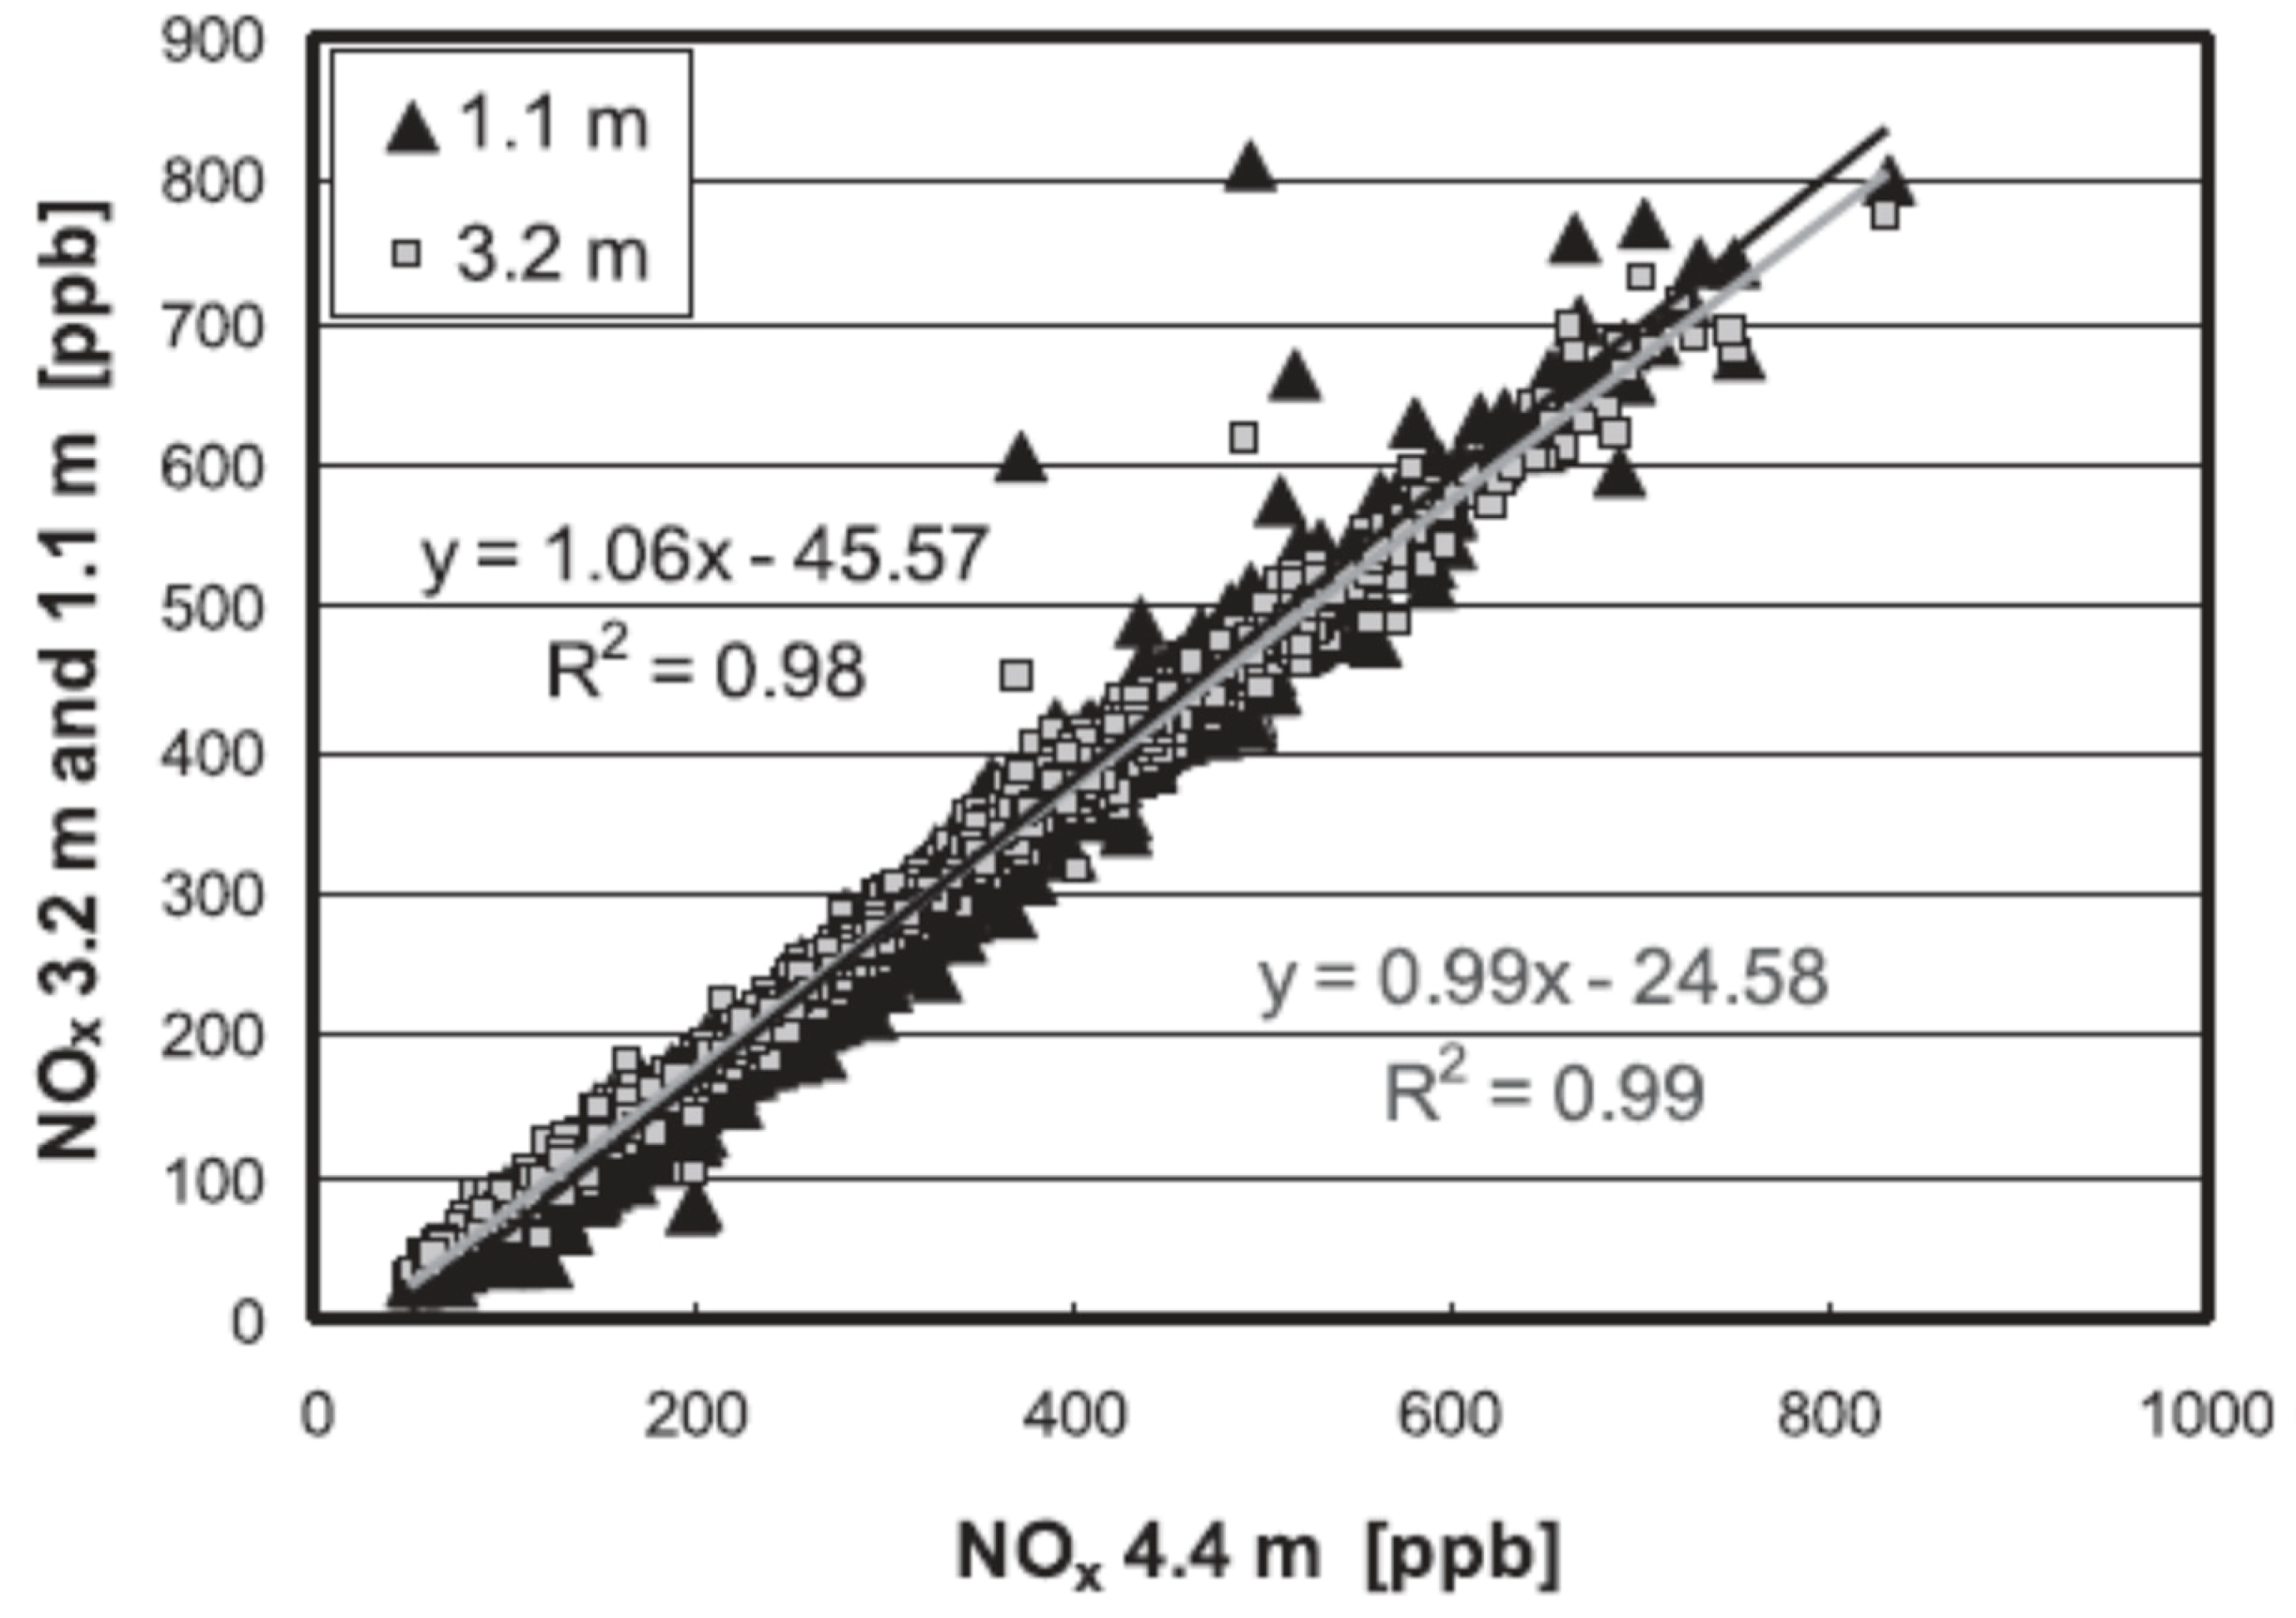
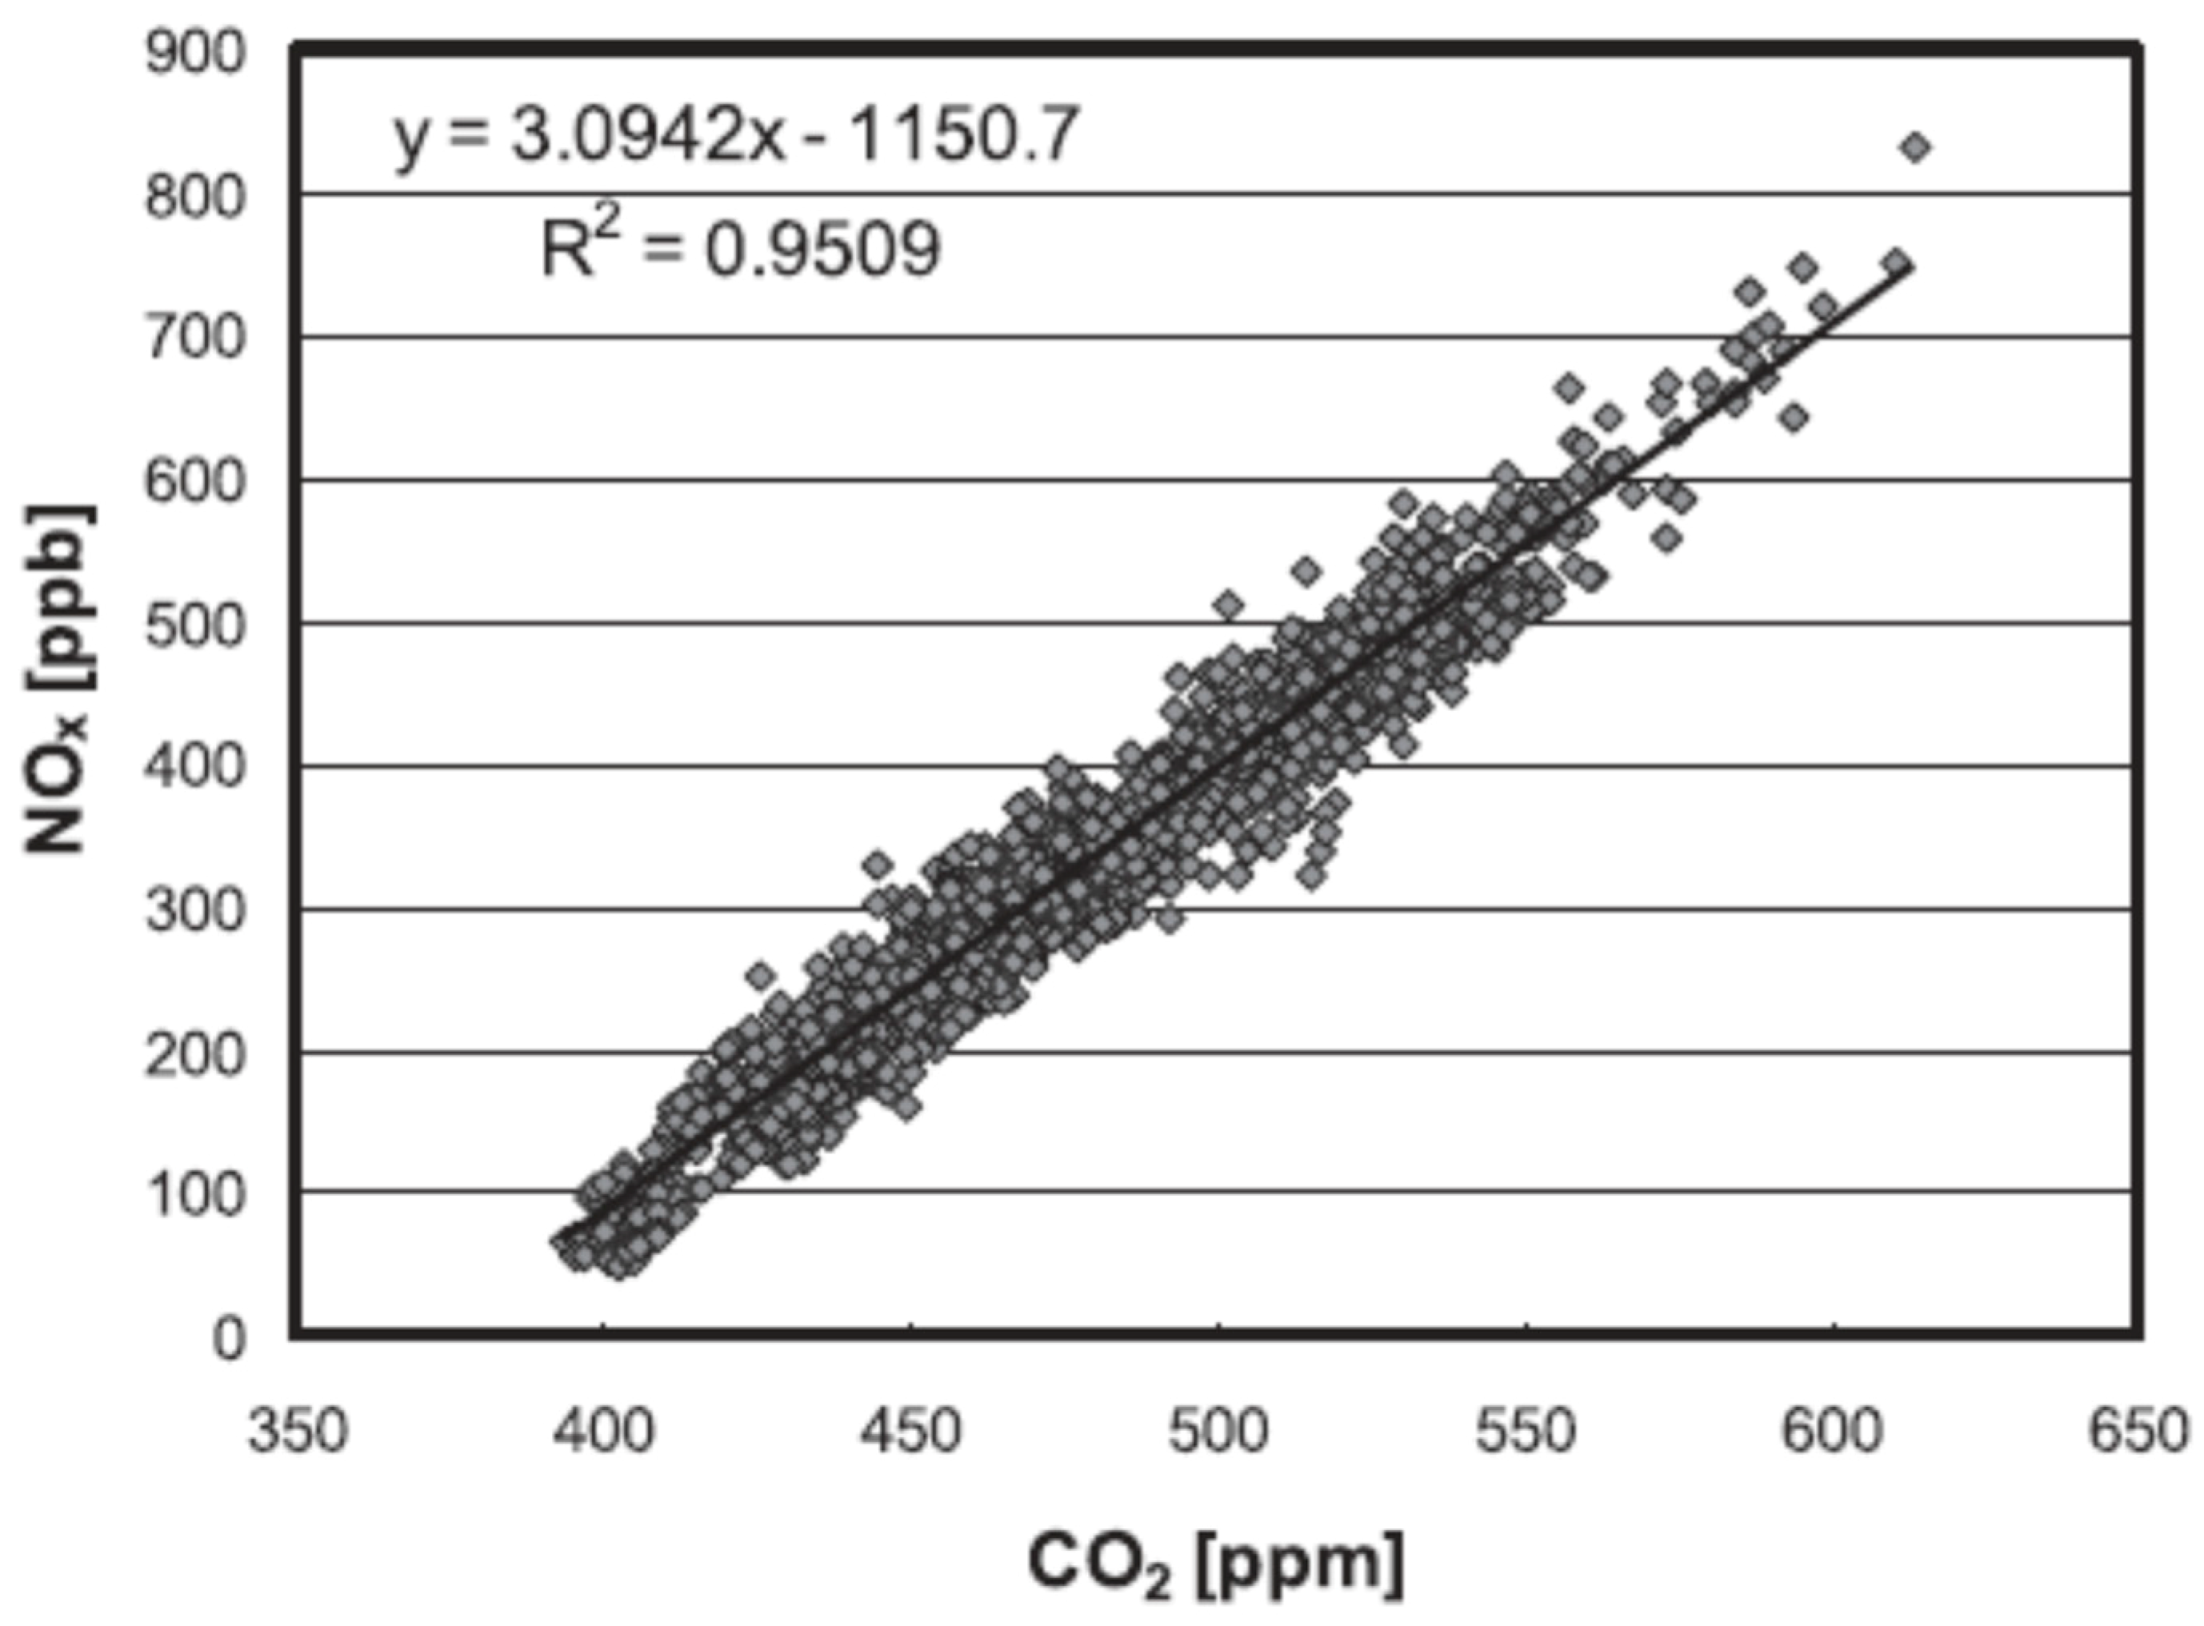
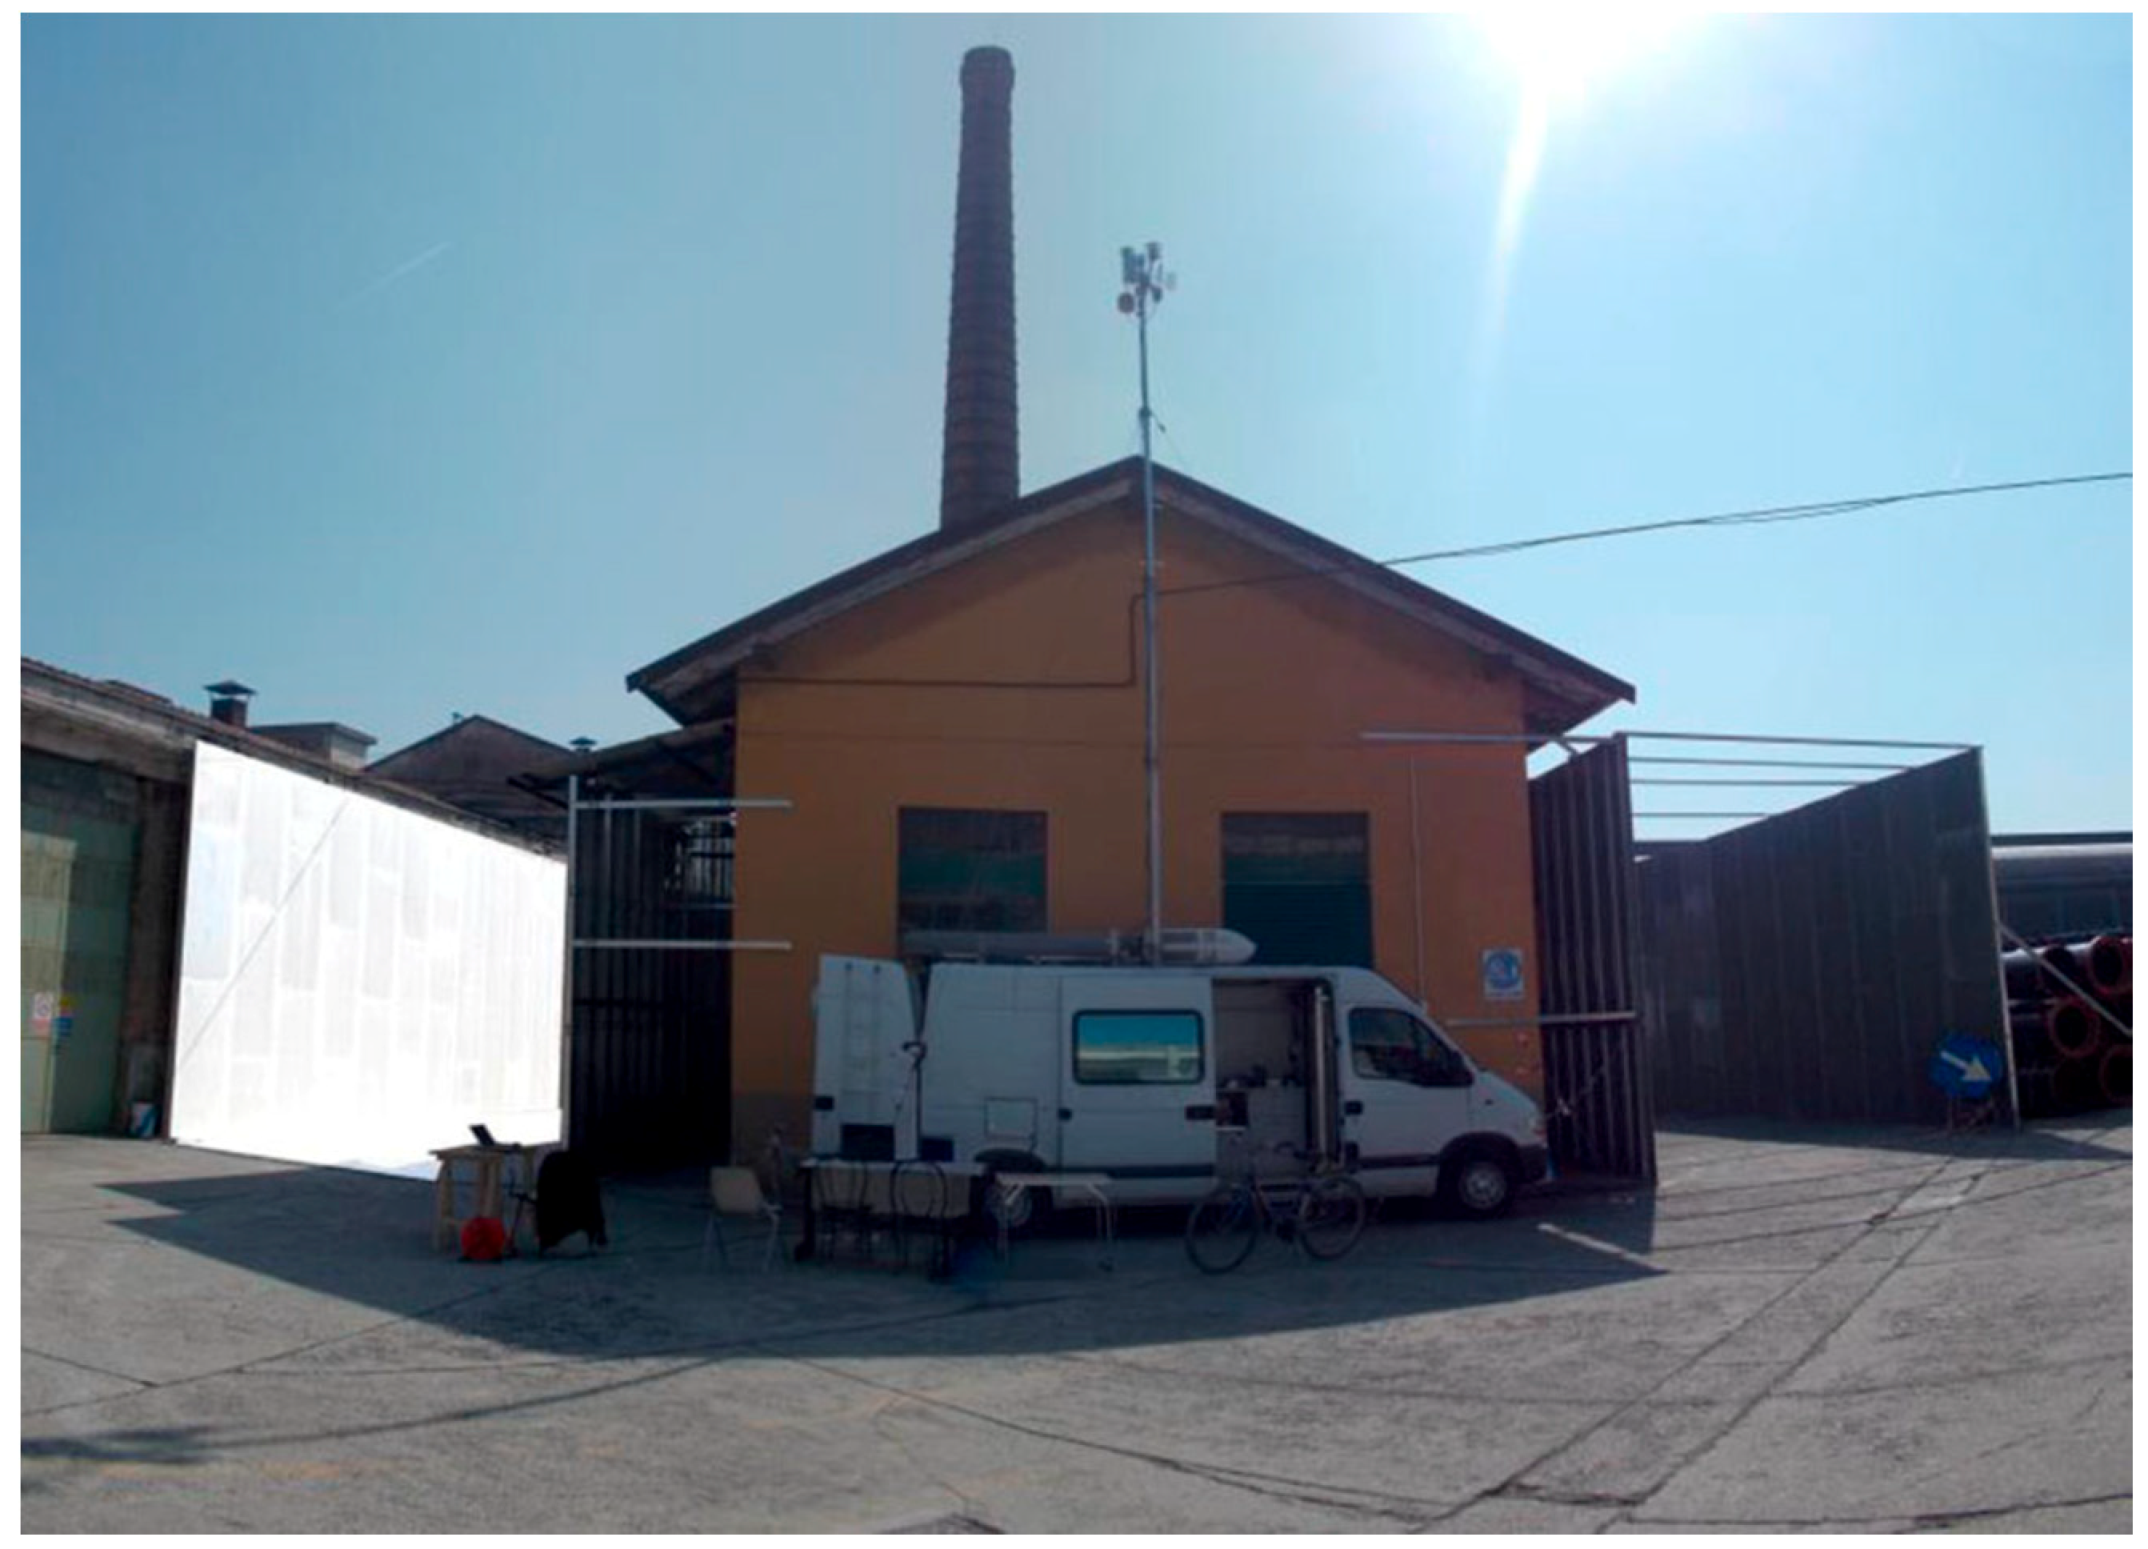
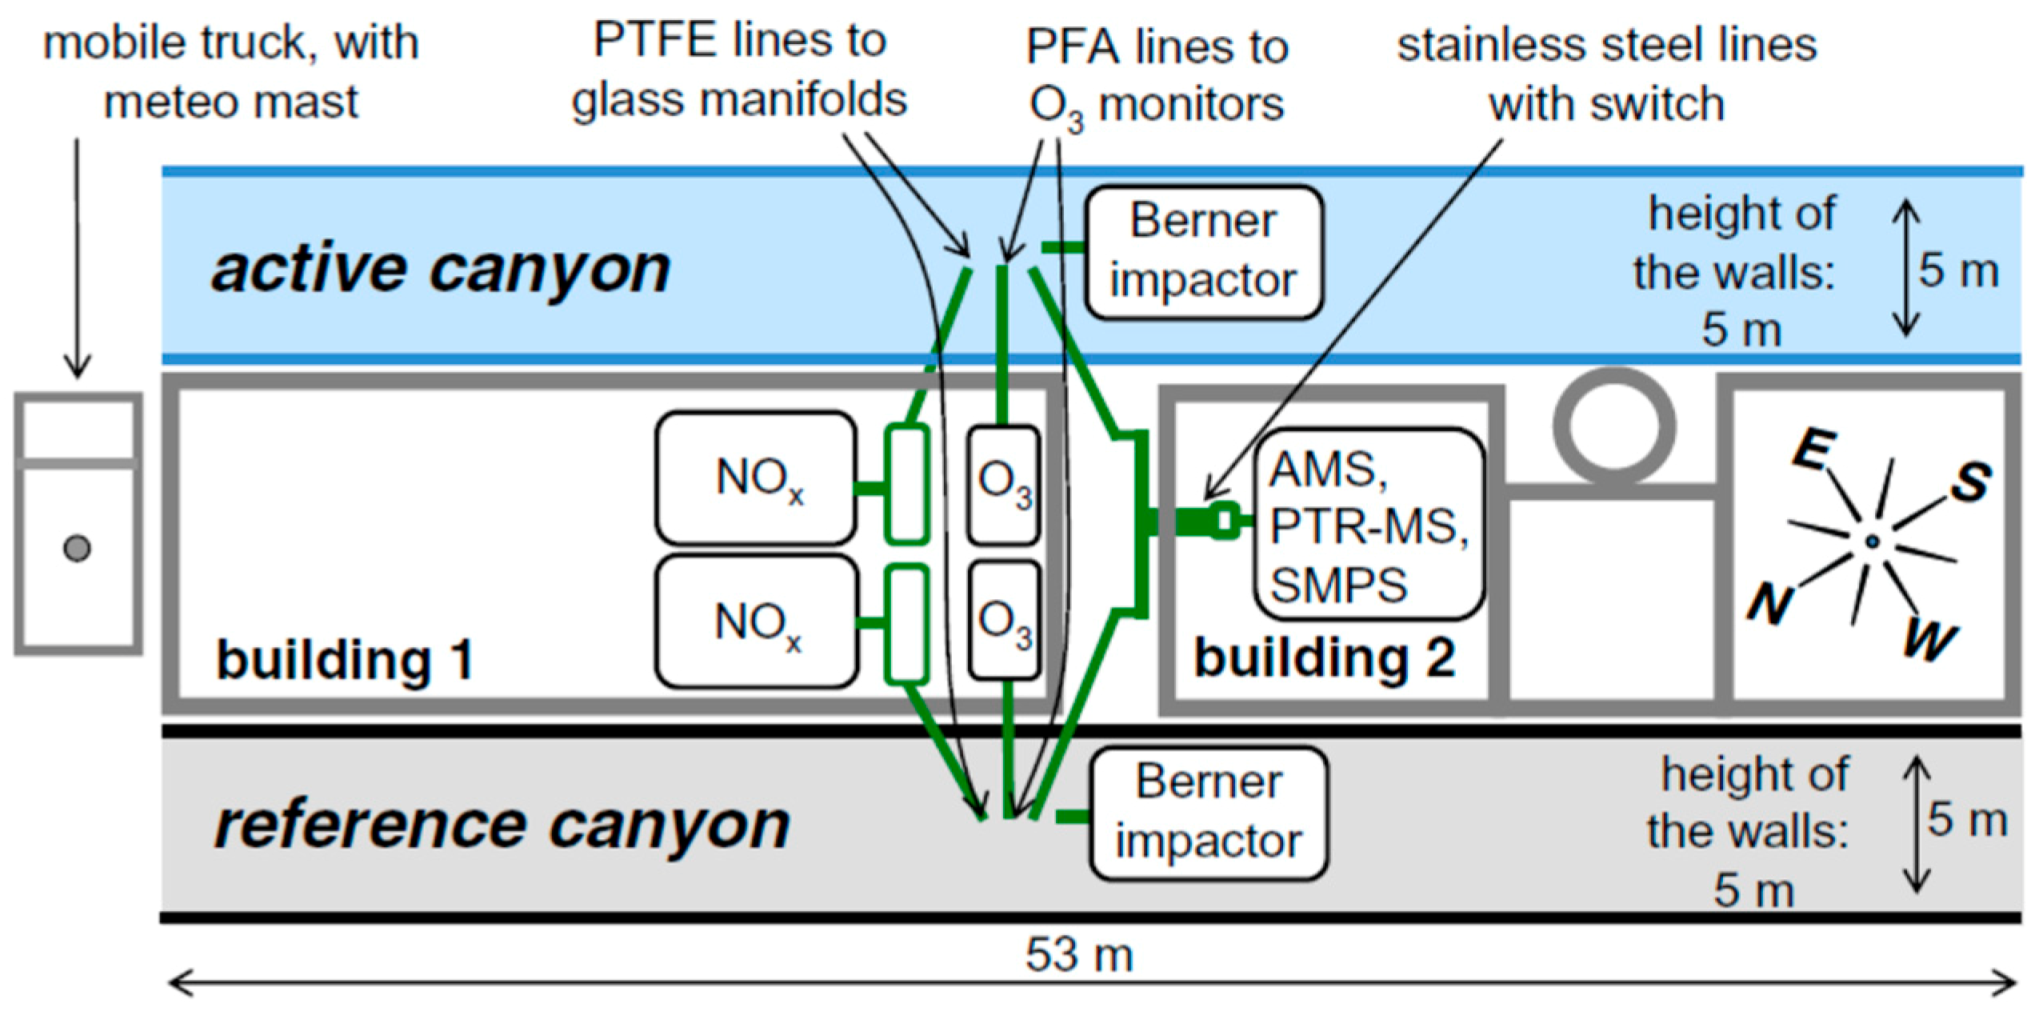
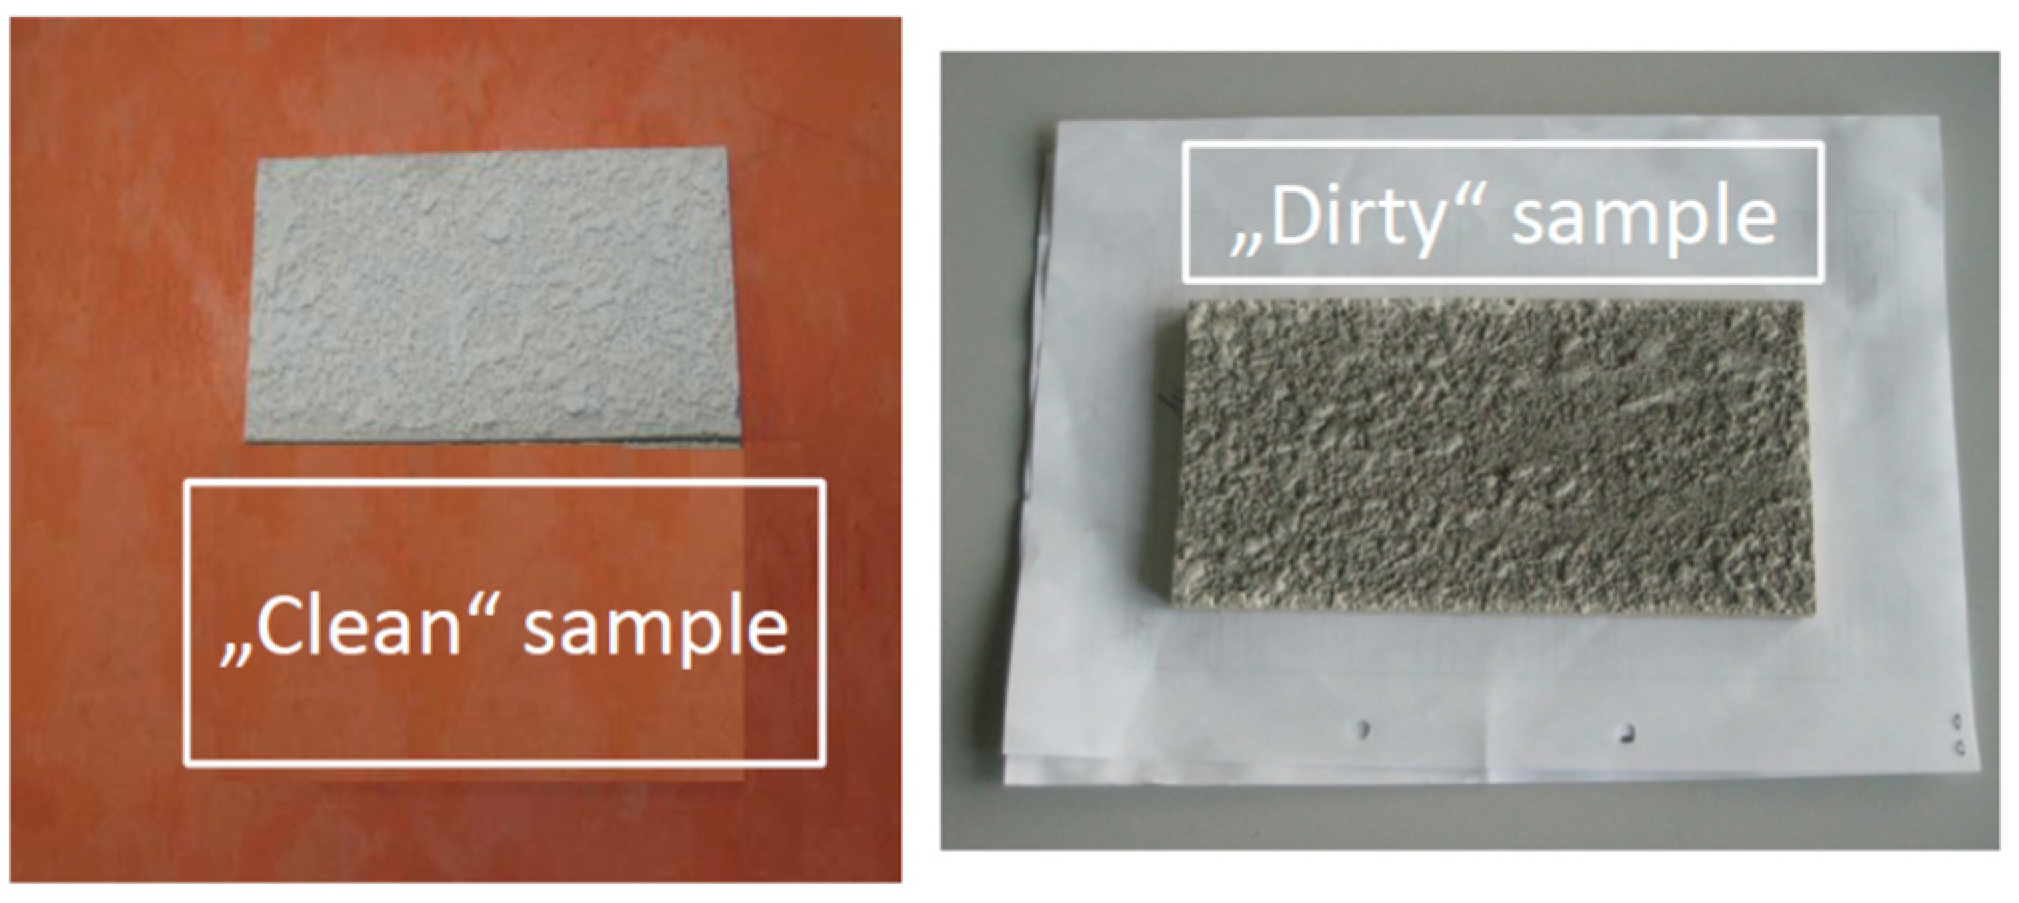
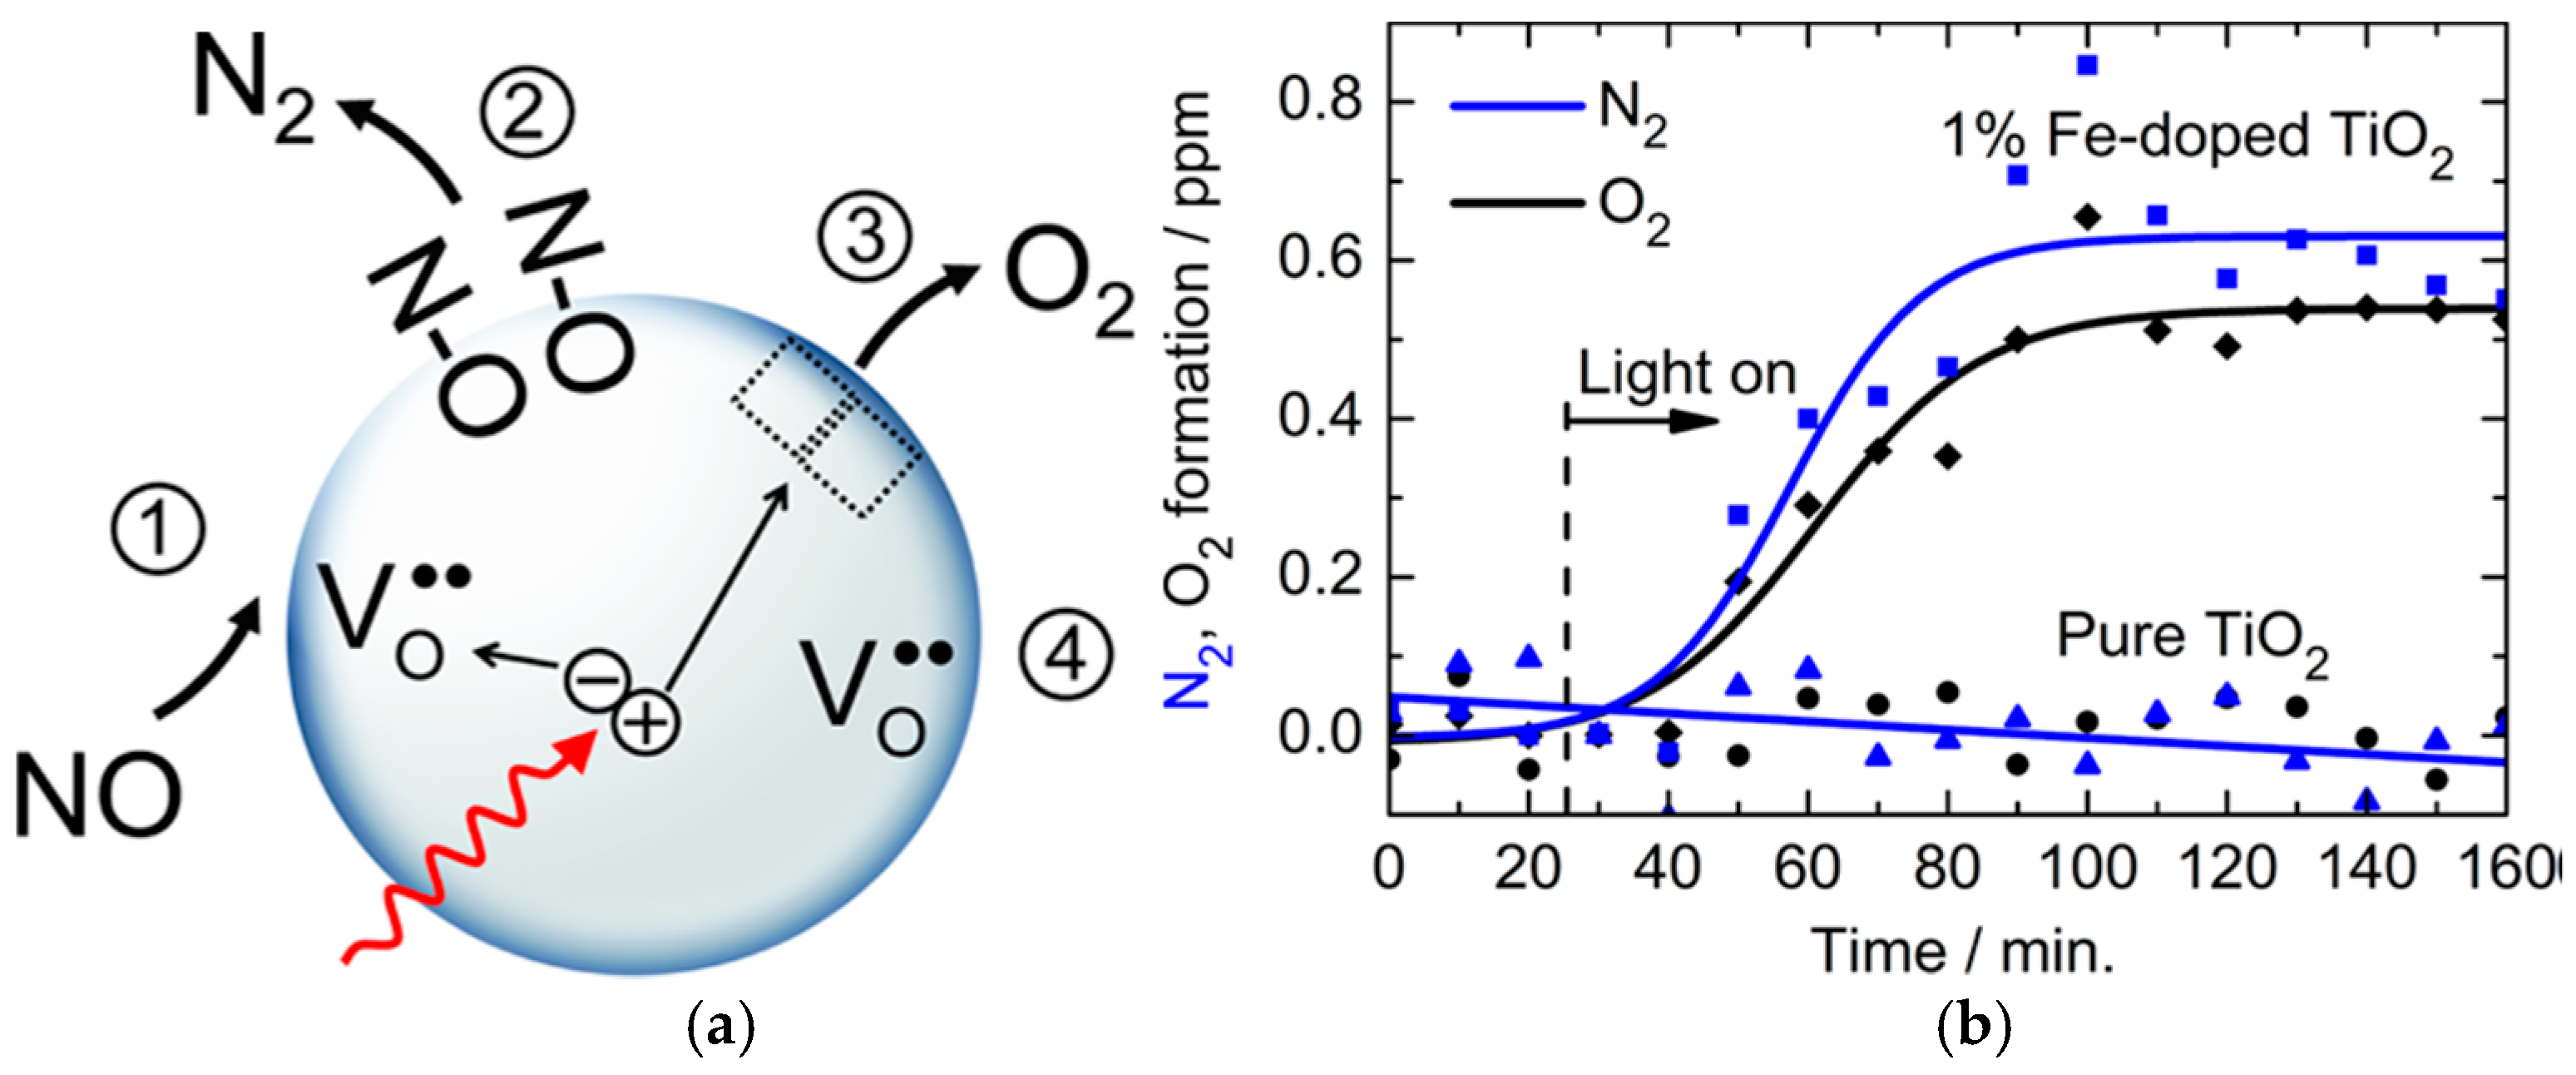
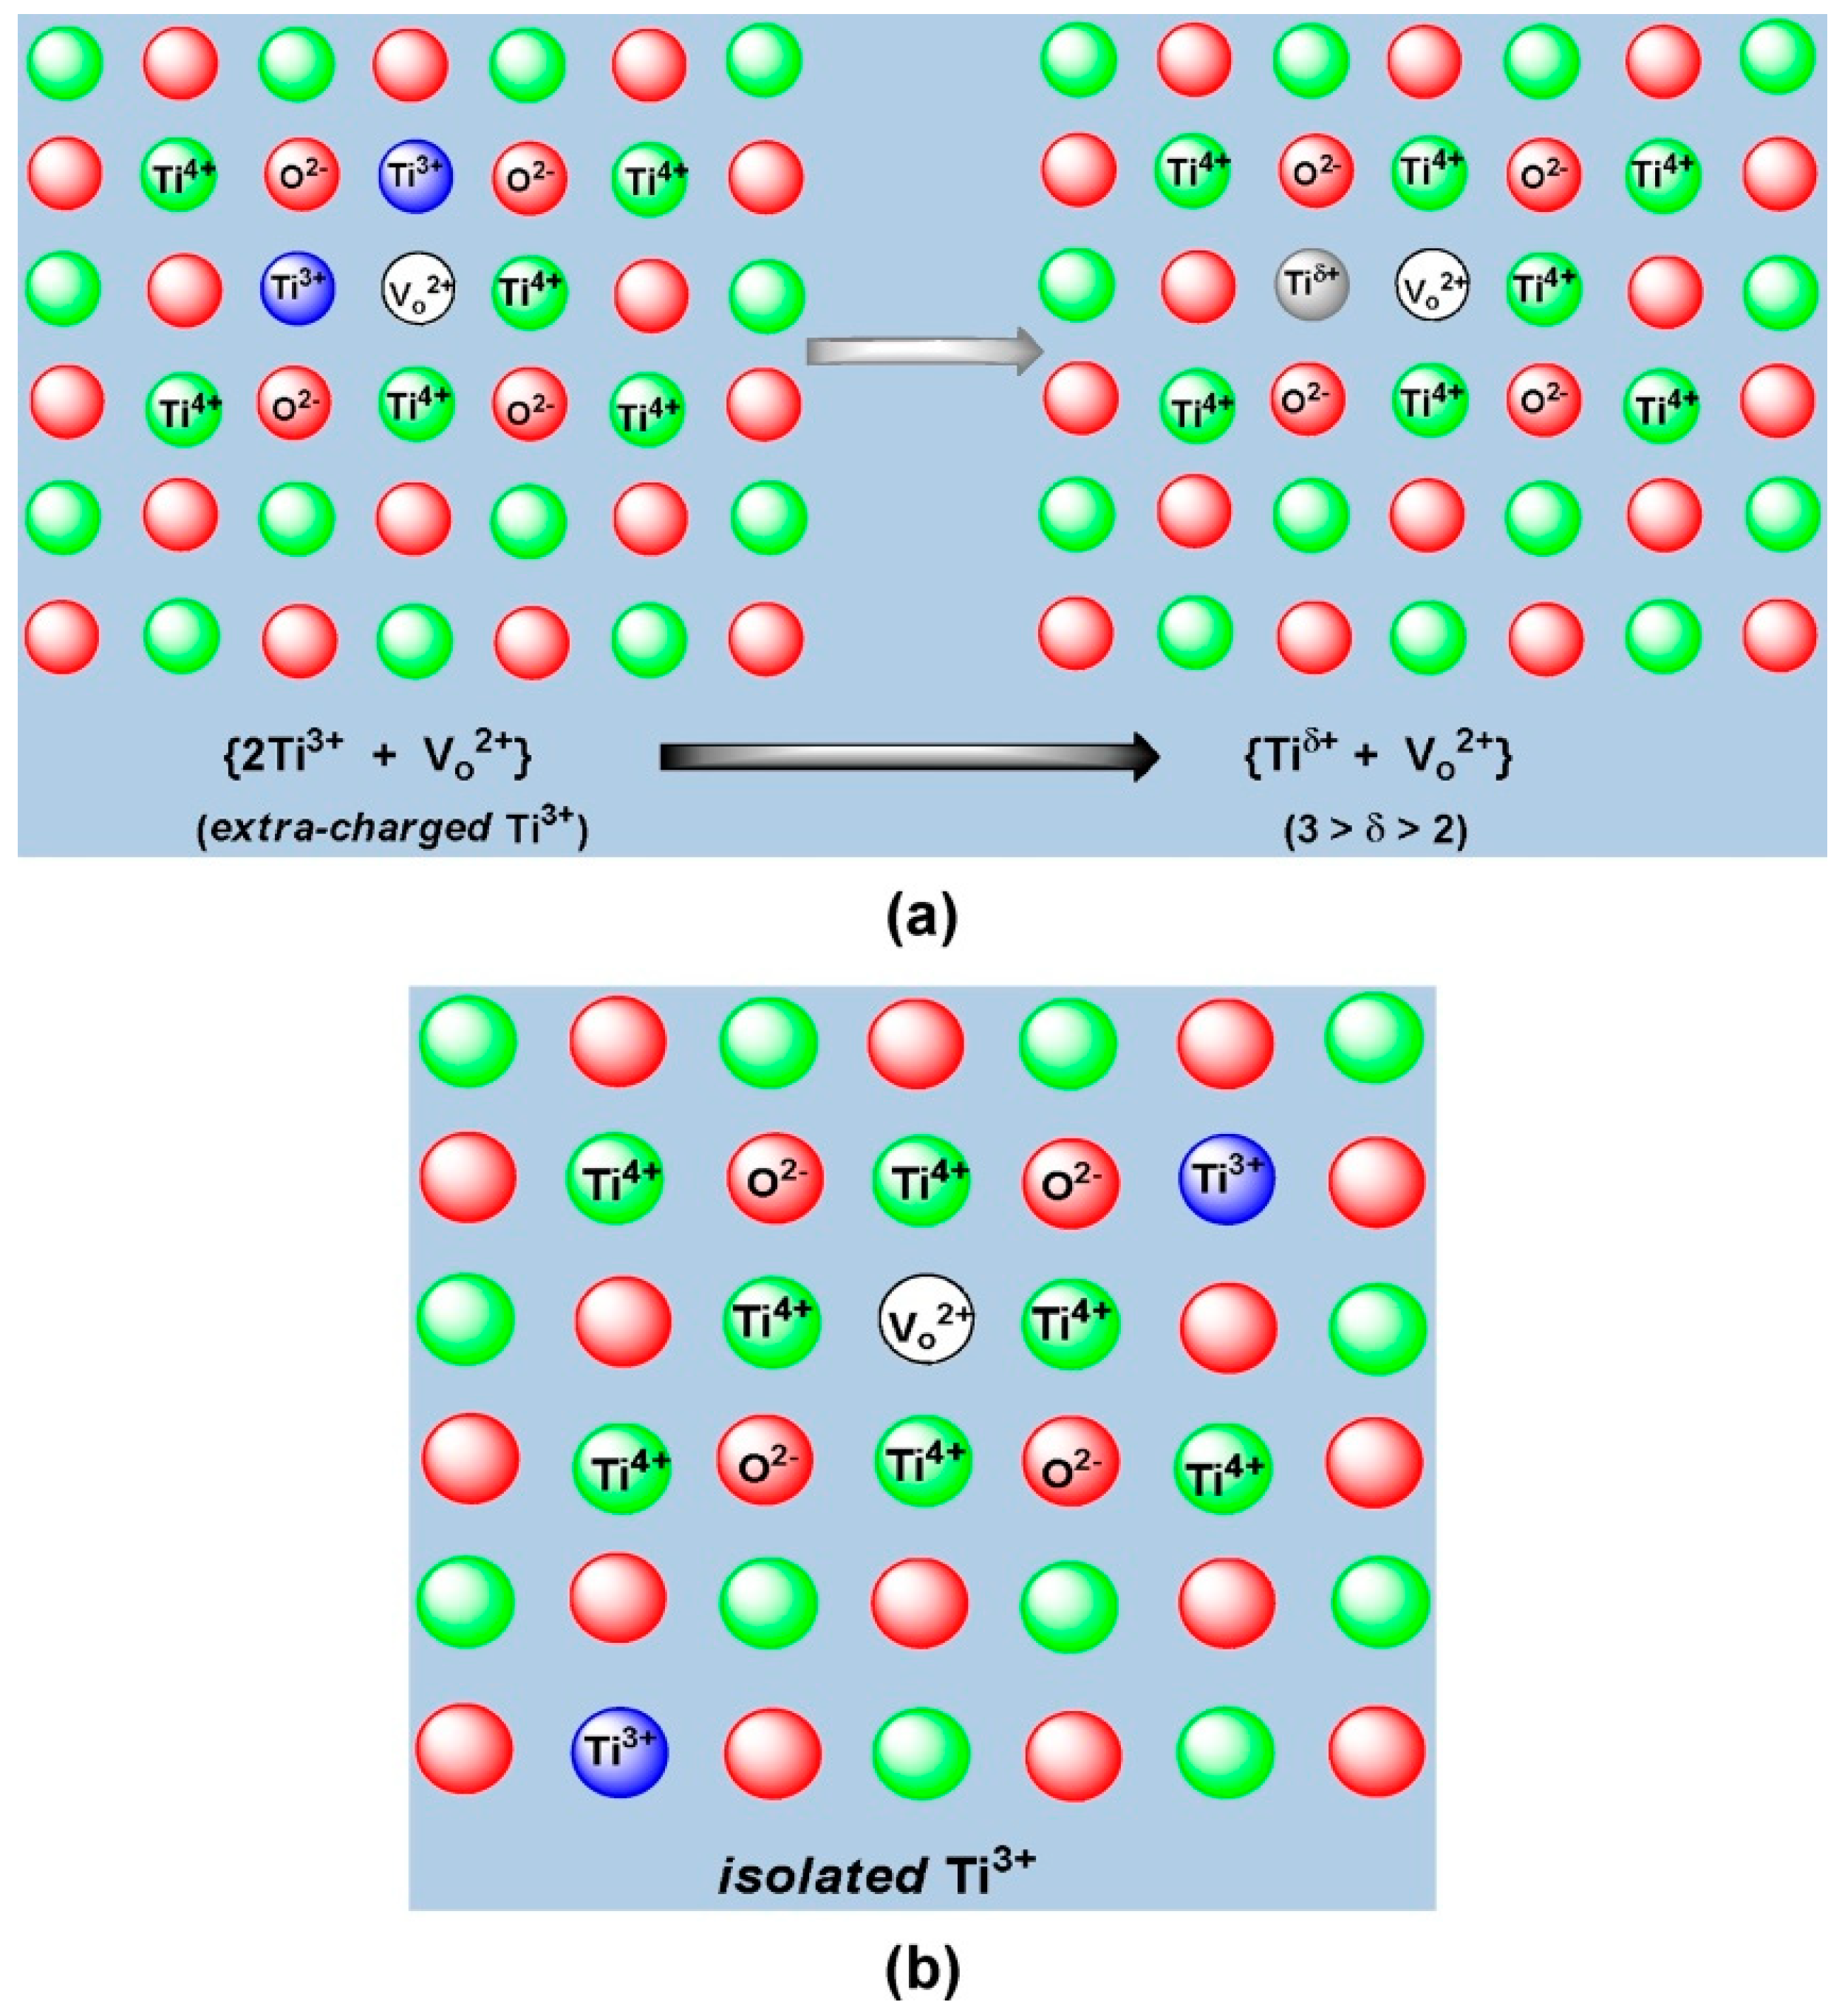
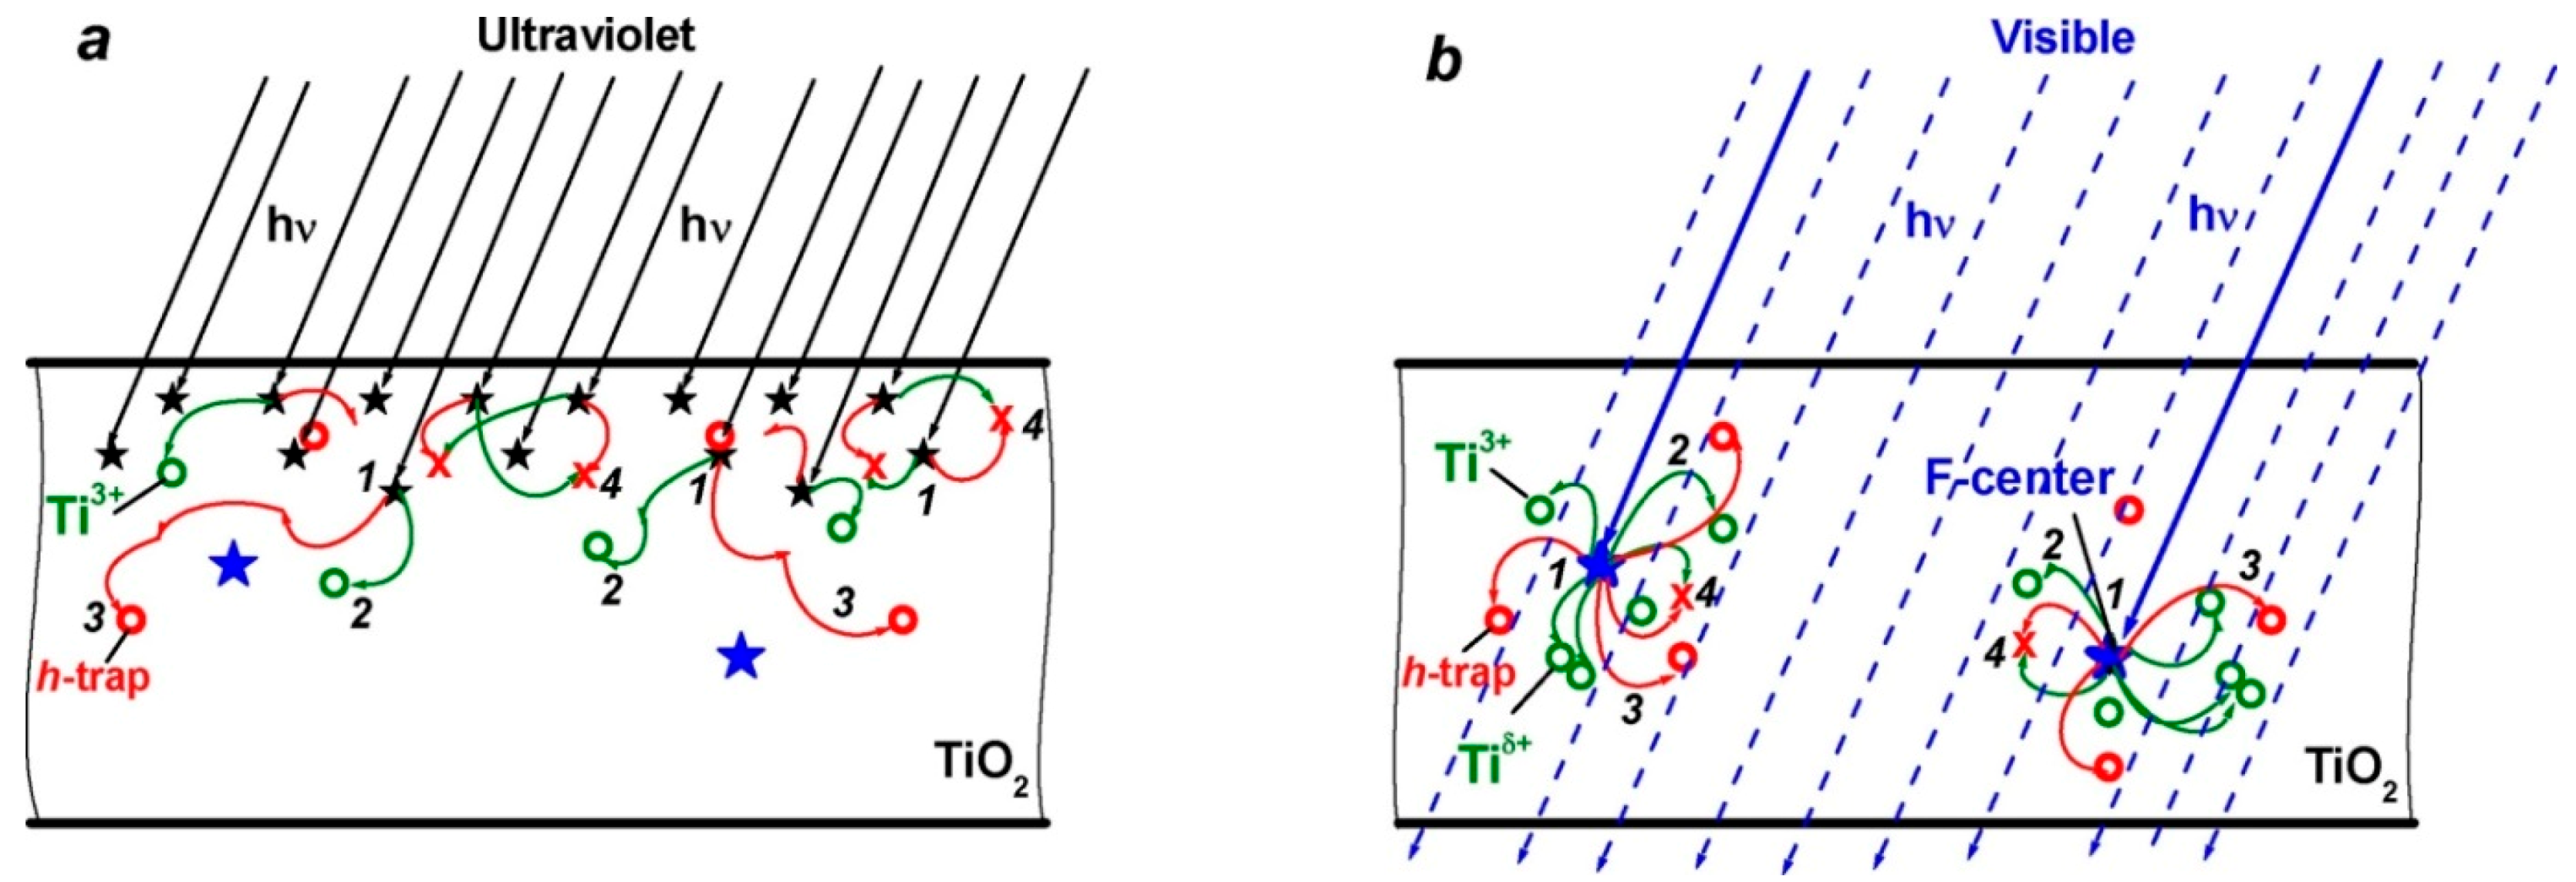
Table 1.
Extent of NO removal over 1.0 μm thick TiO2-PX thin films irradiated at 365 nm (illuminated area, 100 cm2; light irradiance, 0.38 mW cm−2) for 12 h in a flow-type reactor (flow rate, 1.5 L min−1; initial concentration of NO, 1.0 ppm; dry air).
Table 1.
Extent of NO removal over 1.0 μm thick TiO2-PX thin films irradiated at 365 nm (illuminated area, 100 cm2; light irradiance, 0.38 mW cm−2) for 12 h in a flow-type reactor (flow rate, 1.5 L min−1; initial concentration of NO, 1.0 ppm; dry air).
| Photocatalytic Thin Film | BET Surface Area (m2 g−1) | Average NO Removal (%) |
|---|---|---|
| TiO2-P0 | 112 | 71 |
| TiO2-P300 | 104 | 65 |
| TiO2-P600 | 118 | 70 |
| TiO2-P1000 | 141 | 81 |
Table 2.
Crystal size and surface area of the titania photocatalysts together with the rate of formation and the quantities of the O2−• radical anions **.
Table 2.
Crystal size and surface area of the titania photocatalysts together with the rate of formation and the quantities of the O2−• radical anions **.
| Photocatalyst | Calcination T (°C) | Crystal Type | Crystal Size (nm) | BET Surface Area (m2 g−1) | Rate of O2−• Formation (μmol min−1) | [O2−•] (μmol g−1) |
|---|---|---|---|---|---|---|
| TiO2 | 300 | Anatase | 10 | 133 | 2.9 | 7.2 |
| TiO2 | 550 | Anatase | 18 | 78 | 0.80 | 3.7 |
| TiO2 | 700 | Anatase | 26 | 34 | 0.06 | 0.25 |
| TiO2 | 800 | Anatase + Rutile | 47 | 8 | 0.01 | 0.07 |
** Adapted with permission from Hashimoto et al. [101]. Copyright 2000 by Elsevier Science S.A. (License No.: 4453260419845).
Table 3.
Physicochemical properties of the standard reference TiO2 photocatalysts (JRC-TiO-2, -3, -4, and -5) supplied by the catalysis Society of Japan **.
Table 3.
Physicochemical properties of the standard reference TiO2 photocatalysts (JRC-TiO-2, -3, -4, and -5) supplied by the catalysis Society of Japan **.
| Catalysts (JRC-TiO-) | Surface Area (m2 g−1) | Acid Concentration (μmol g−1) | Relative –OH Concentration | Bandgap (eV) |
|---|---|---|---|---|
| 2 (anatase) | 16 | 6 | 1.0 | 3.47 |
| 3 (anatase) | 51 | 22 | 1.6 | 3.32 |
| 4 (anatase) | 49 | 5 | 3.0 | 3.50 |
| 5 (rutile) | 3 | 7 | 3.1 | 3.09 |
** Reproduced with permission from Zhang et al. [104]. Copyright 2001 by Academic Press (License No.: 4453251363124).
Table 4.
Effect of calcination temperatures on the composition and crystallite sizes of P-25 photocatalysts, and of the pretreatment temperature on the rate of NO conversion and selectivity for N2 formation for NO decomposition and reduction reactions **.
Table 4.
Effect of calcination temperatures on the composition and crystallite sizes of P-25 photocatalysts, and of the pretreatment temperature on the rate of NO conversion and selectivity for N2 formation for NO decomposition and reduction reactions **.
| Calcination T (°C) | Rutile (vol. %) | Crystallite Size (nm) | BET Surface Area (m2 g−1) | Rate of NO Conversion (μmol h−1 gcat−1) | Selectivity for N2 Formation (%) | |||
|---|---|---|---|---|---|---|---|---|
| Anatase | Rutile | Dec. | Red. | Dec. | Red. | |||
| 70 | 23.0 | 28.0 | 66.3 | 51.92 | 1210 | 657 | 21 | 46 |
| 120 | 23.2 | 28.8 | 64.8 | 50.69 | 1107 | 560 | 25 | 49 |
| 200 | 23.0 | 28.2 | 62.7 | 49.87 | 983 | 467 | 21 | 48 |
| 450 | 23.0 | 28.3 | 59.6 | 49.54 | 550 | 243 | 26 | 26 |
| 600 | 28.0 | 30.5 | 69.6 | 48.24 | 430 | 240 | 30 | 25 |
** Adapted with permission from Bowering et al. [109]; Copyright 2005 by Elsevier B.V. (License No.: 4452670211528).
Table 5.
Effect of catalysts on the performance of the PCR system at 150 °C. Feed gas composition: 200 ppm NO, 134 ppm C12H26, 6% O2, 10% H2O, and N2 balance. Total flow rate = 500 mL min−1; TiO2 (anatase nanopowder) **.
Table 5.
Effect of catalysts on the performance of the PCR system at 150 °C. Feed gas composition: 200 ppm NO, 134 ppm C12H26, 6% O2, 10% H2O, and N2 balance. Total flow rate = 500 mL min−1; TiO2 (anatase nanopowder) **.
| Catalyst | Yield of Reductants (%) | NOx Conversion (%) | ||
| 2 BaY + | Total OHCs | NH3 | ||
| TiO2 | 35 (84 a) | - | 43 | |
| V2O5/TiO2 | 60 | - | 29 | |
| Au/TiO2 | 24 | - | 43 | |
| Ag/TiO2 | 18 | - | 55 | |
| Pt/TiO2 | 2 | - | 22 | |
| CuCoY | 19 | - | 37 | |
| BaY | 10 | - | 55 | |
| Ag/Al2O3 | 16 | 6 | 54 | |
| Blank PCR (no catalyst) | 45 | - | - | |
a Yield of OHCs in the absence of NO. ** Reproduced with permission from Heo et al. [114]. Copyright 2013 by the American Chemical Society.
Table 6.
Conversion of NO and yields of NO2, N2O, and NH3 during the reduction of NO over the PCR + HC/SCR system. Feed gas composition: 200 ppm NO, 134 ppm C12H26, 6% O2, 10% H2O, and N2 balance. Gas hourly space velocity of the HC/SCR monolith reactor = 16,500 h−1 **.
Table 6.
Conversion of NO and yields of NO2, N2O, and NH3 during the reduction of NO over the PCR + HC/SCR system. Feed gas composition: 200 ppm NO, 134 ppm C12H26, 6% O2, 10% H2O, and N2 balance. Gas hourly space velocity of the HC/SCR monolith reactor = 16,500 h−1 **.
| System | Temperature (°C) | NO (%) | NO2 (%) | N2O (%) | NH3 (%) | Total NO (%) | Estimated N2 (%) |
|---|---|---|---|---|---|---|---|
| HC/SCR only | 256 | 13 | 0 | 1 | 0 | 13 | 13 |
| 303 | 62 | 0 | 1 | 1 | 62 | 60 | |
| 400 | 100 | 0 | 3 | 2 | 100 | 96 | |
| 500 | 53 | 7 | 1 | 1 | 46 | 44 | |
| Ag/Al2O3 PCR + HC/SCR | 200 | 63 | 0 | 4 | 0 | 63 | 59 |
| 250 | 99 | 0 | 5 | 4 | 99 | 91 | |
| 300 | 100 | 0 | 5 | 13 | 100 | 82 | |
| V2O5/TiO2 PCR + HC/SCR | 200 | 42 | 0 | 4 | 1 | 42 | 38 |
| 250 | 95 | 0 | 5 | 0 | 95 | 91 |
** Reproduced with permission from Heo et al. [114]. Copyright 2013 by the American Chemical Society.
Table 7.
Percent removal of NOx gases carried out with TiO2-based photocatalytic protocols in an indoor laboratory setting using small flow-through reactors under a variety of conditions.
Table 7.
Percent removal of NOx gases carried out with TiO2-based photocatalytic protocols in an indoor laboratory setting using small flow-through reactors under a variety of conditions.
| Study | Gas | TiO2-Based Photocatalytic Removal of NOx Gases | Year Study Was Carried Out | Refs |
|---|---|---|---|---|
| 1 | NOx | 60–90% | 1994 | [97] |
| 2 | NO | 52–88% | 2000 | [122] |
| 45–90% | ||||
| 3 | NOx | 88–90% | 2009, 2011 | [121,124] |
| 4 | NO | 25% | 2011 | [125] |
| 5 | NOx | 50% | 2012 | [126] |
| 6 | NOx | 40–60% | 2017 | [128] |
| 7 | NOx | 35%; 66% | 2016 | [25] |
| 8 | NO | 44% | 2018 | [132] |
| NOx | 16% | |||
| 9 | NO | 80% | 2006 | [134] |
Table 8.
Preparations and properties of the range of water-based products developed within the PICADA Project.
Table 8.
Preparations and properties of the range of water-based products developed within the PICADA Project.
| Products | Notation | Precursor Materials | Properties | Applications |
|---|---|---|---|---|
| Dry mix (water added on site) | B1 | Sand; White ordinary Portland cement; lime; TiO2; mineral binder | 10 mm thick decorative mortar | Façade coatings; Interior applications |
| B2 | Filler; White ordinary Portland cement; TiO2; mineral binder | 1 mm mineral rendering; 100 μm thick paint | Thin decorative mineral façade coating; paint; Interior applications | |
| Ready-to-use | C1 | Siloxane binder; TiO2; CaCO3 filler | Translucent; resistant to photocatalytic effect of TiO2 | Coating |
| C2 | Siloxane binder, TiO2 | Opaque coating | Paints | |
| C3 | Acrylic binder; TiO2 | Opaque coating | Paints; Indoor applications | |
| C4 | Silicate binder; TiO2 | Opaque coating | Paints |
Table 9.
Average NOx/CO2 ratios obtained from experimental results in the photocatalytic remediation of NOx in the Leopold II tunnel in Brussels; standard errors represent 2σ **.
Table 9.
Average NOx/CO2 ratios obtained from experimental results in the photocatalytic remediation of NOx in the Leopold II tunnel in Brussels; standard errors represent 2σ **.
| Average NOx/CO2 Ratios from Site 1 and Site 2 in the Second and Third Campaigns with Photocatalytically-Active Surfaces and with Lights ON | |||
| Campaign | Photocatalytic Material (TiO2) | Site 1—upwind (×10−3) | Site 2—downwind (×10−3) |
| Second; 09/2011 | TX-Active | 3.03 ± 0.06 | 3.14 ± 0.07 |
| Third; 01/2013 | TX-Active Boosted | 3.18 ± 0.08 | 3.10 ± 0.05 |
| Average NOx/CO2 Ratios for High and Low Wind Speeds with Lights ON in the Third Campaign | |||
| Wind speed | Site 1—upwind (×10−3) | Site 2—downwind (×10−3) | |
| Low | <2 m s−1 | 3.24 ± 0.13 | 3.23 ± 0.12 |
| High | >2 m s−1 | 2.93 ± 0.20 | 2.95 ± 0.10 |
| Average NOx/CO2 Ratios at Downwind Site 2 with Lights ON or OFF in the Third Campaign | |||
| Data used | Lights OFF | Lights ON | |
| All | 3.09 ± 0.06 | 3.10 ± 0.05 | |
| Low wind speed | <2 m s−1 | 3.25 ± 0.10 | 3.23 ± 0.12 |
| High wind speed | >2 m s−1 | 2.99 ± 0.11 | 2.95 ± 0.10 |
** Adapted from Gallus et al. [14]. Copyright Elsevier Ltd. (License No.: 4453120115447).
Table 10.
Percent removal of NOx gases in field trials carried out with TiO2-based photocatalytic protocols in an open outdoor environment and under a variety of conditions.
Table 10.
Percent removal of NOx gases in field trials carried out with TiO2-based photocatalytic protocols in an open outdoor environment and under a variety of conditions.
| Field Trial | Gas | Extent of Photocatalytic Removal | Structures | Year | Ref. |
|---|---|---|---|---|---|
| 1 | NOx | 37–82% | Model street canyon | 2008 | [136] |
| 2 | NOx | 30–40% | Local street | 2007 | [137] |
| 3 | NOx | 20–50% | Street | 2012 | [138] |
| 4 | NOx | 45–57% | Street | 2007 | [137] |
| 5 | NOx | ≤2% | Model street canyon, Tunnel | 2015, 2015 | [14,15] |
| 6 | NOx | > 20% | Tunnel | 2012 | [138] |
| 7 (a) | NO | 55% | Church external wall | 2004 | [139] |
| NO2 | 32% | Church external wall | |||
| 8 | NOx | 20–25% | Tunnel | 2012 | [138] |
| NOx | 51–64% | Tunnel | |||
| 9 | NOx | 40–80% | Model street canyon | 2006, 2008 | [134,136,149] |
| 10 | NOx | Not-measurable | Highways’ noise barriers | 2010, 2009 | [152,160] |
| 11 | NO2 | 0–17% | Sidewalks/street | 2012 | [153] |
| 12 | NOx | 20% | Street | 2006 | [154] |
| 13 | NO | 60% | Building external wall | 2006, 2012 | [154,155] |
| NOx | 20% | Building external wall | |||
| 14 | NOx | 53–99% | Car park | 2006 | [154] |
| 15 | NOx | 35–65% | Building external wall | 2006 | [154] |
| 16 | NOx | 1–37% | Street | 2013 | [157] |
| NOx | 8–48% | Street | |||
| 17 | NOx | 26–66% | Real urban street canyon | 2007 | [137] |
| 18 | NOx | 25–30% | Model street canyon | 2010 | [159] |
| 19 | NOx | 40–80% | Model street canyon | 2006, 2008 | [136,149] |
| 20 | NOx | 19% | Real urban street canyon | 2013 | [157] |
| 21 | NOx | Not-measurable | Street | 2012 | [153] |
(a) Photocatalytic material (TX-Active) tested in a laboratory setting.
Table 11.
Slopes from the plots of daytime and nighttime results for NO, NO2 and NOx gases from the active canyon versus the reference canyon; a negative value implies a photocatalytic remediation of that pollutant **.
Table 11.
Slopes from the plots of daytime and nighttime results for NO, NO2 and NOx gases from the active canyon versus the reference canyon; a negative value implies a photocatalytic remediation of that pollutant **.
| Gaseous Pollutant | Daytime Results | Nighttime Results | (Day—Night) × 100 (% ± 2σ) |
|---|---|---|---|
| NO | 0.953 ± 0.016 | 0.988 ± 0.029 | −3.5 ± 3.3 |
| NO2 | 0.982 ± 0.013 | 0.966 ± 0.014 | +1.6 ± 1.9 |
| NOx | 0.984 ± 0.011 | 0.970 ± 0.014 | +1.4 ± 1.8 |
** Reproduced with permission from Gallus et al. [15]. Copyright 2015 by Springer-Verlag Berlin Heidelberg (License No.: 4453121427505).
Table 12.
Average concentrations of NO, NO2, and NOx in both canyons for daytime (06:00–20:30) and nighttime (20:30–06:00) and relative concentration differences; negative values imply a photocatalytic effect in the active canyon **.
Table 12.
Average concentrations of NO, NO2, and NOx in both canyons for daytime (06:00–20:30) and nighttime (20:30–06:00) and relative concentration differences; negative values imply a photocatalytic effect in the active canyon **.
| Concentrations (ppb ± 2σ) | ||||
|---|---|---|---|---|
| NO | NO2 | NOx | ||
| All data | (1 − (Ref./Act.) × 100 [%] | 2 ± 17 | −0.7 ± 6.1 | −0.4 ± 6.0 |
| Daytime | (1 − (Ref./Act.) × 100 [%] | 0.6 ± 11.5 | 0.2 ± 6.1 | 0.3 ± 6.0 |
| Nighttime | (1 − (Ref./Act.) × 100 [%] | 23 ± 150 | −2.4 ± 5.9 | −2.0 ± 5.9 |
** Adapted with permission from Gallus et al. [15]. Copyright 2015 by Springer-Verlag Berlin Heidelberg (License No.: 4453121427505).
Table 13.
Slopes from correlation plots of NO data (ppb ± 1σ) from three sampling sites (two active, one inactive) against inactive Site 1 for NO concentrations before and after implementation of the photocatalytic coating.
Table 13.
Slopes from correlation plots of NO data (ppb ± 1σ) from three sampling sites (two active, one inactive) against inactive Site 1 for NO concentrations before and after implementation of the photocatalytic coating.
| Diurnal | Nocturnal | |||
|---|---|---|---|---|
| Sampling Site | Before Applying TiO2-Based Coating | After Applying TiO2-Based Coating | Before Applying TiO2-Based Coating | After Applying TiO2-Based Coating |
| 2 (active) | 1.05 ± 0.08 | 1.07 ± 0.08 | 1.014 ± 0.005 | 0.983 ± 0.004 |
| 3 (active) | 1.41 ± 0.17 | 1.03 ± 0.06 | 0.977 ± 0.008 | 0.915 ± 0.004 |
| 4 (inactive) | 0.89 ± 0.06 | 0.90 ± 0.07 | 0.985 ± 0.005 | 0.946 ± 0.025 |
Table 14.
Parameters and results of NO removal in a medium-scale tunnel reactor (UVA irradiance, >40 W m−2; relative humidity, <30%; dimensions, 0.4 × 0.4 × 10 m; photoactive surface, 0.4 × 10 m) compared to a real-scale tunnel and a small laboratory flow-through reactor.
Table 14.
Parameters and results of NO removal in a medium-scale tunnel reactor (UVA irradiance, >40 W m−2; relative humidity, <30%; dimensions, 0.4 × 0.4 × 10 m; photoactive surface, 0.4 × 10 m) compared to a real-scale tunnel and a small laboratory flow-through reactor.
| Parameters | Outdoor Real-Scale Tunnel Reactor | Outdoor Medium-Scale Tunnel Reactor | Laboratory Flow-through Reactor |
|---|---|---|---|
| Deposition velocity (m s−1) | 5.25 × 10⁻³ | 2.05 × 10⁻³ | 5.25 × 10⁻³ |
| Length (m) | 60 | 100 | 0.1 |
| Air velocity (m s−1) | 1 | 0.33 | 0.20 |
| Photoactive surface (m2) | 1000 | 4 | 0.005 |
| Sactive/V (m−1) | 0.067 | 2.5 | 200 |
| Residence time (s−1) | 60 | 30.3 | 0.5 |
| First order rate coefficient (s−1) | 3.4 × 10⁻⁴ | 5.07 × 10⁻³ | 1.1 |
| Average yield of NO removed (%) | ~2 | 15 ± 4 | 41 |
© 2018 by the author. Licensee MDPI, Basel, Switzerland. This article is an open access article distributed under the terms and conditions of the Creative Commons Attribution (CC BY) license (http://creativecommons.org/licenses/by/4.0/).
Share and Cite
MDPI and ACS Style
Serpone, N. Heterogeneous Photocatalysis and Prospects of TiO2-Based Photocatalytic DeNOxing the Atmospheric Environment. Catalysts 2018, 8, 553. https://doi.org/10.3390/catal8110553
AMA Style
Serpone N. Heterogeneous Photocatalysis and Prospects of TiO2-Based Photocatalytic DeNOxing the Atmospheric Environment. Catalysts. 2018; 8(11):553. https://doi.org/10.3390/catal8110553
Chicago/Turabian StyleSerpone, Nick. 2018. "Heterogeneous Photocatalysis and Prospects of TiO2-Based Photocatalytic DeNOxing the Atmospheric Environment" Catalysts 8, no. 11: 553. https://doi.org/10.3390/catal8110553
Note that from the first issue of 2016, this journal uses article numbers instead of page numbers. See further details here.