Article

The Relationship between Reaction Temperature and Carbon Deposition on Nickel Catalysts Based on Al2O3, ZrO2 or SiO2 Supports during the Biogas Dry Reforming Reaction

by
Nikolaos D. Charisiou
1,*,
Savvas L. Douvartzides
2,
Georgios I. Siakavelas
1,
Lazaros Tzounis
3,
Victor Sebastian
4,5,
Vlad Stolojan
6,
Steven J. Hinder
7,
Mark A. Baker
7,
Kyriaki Polychronopoulou
8,9 and
Maria A. Goula
1,*
1
Laboratory of Alternative Fuels and Environmental Catalysis (LAFEC), Department of Chemical Engineering, University of Western Macedonia, GR-50100 Kozani, Greece
2
Department of Mechanical Engineering, University of Western Macedonia, GR-50100 Kozani, Greece
3
Composite and Smart Materials Laboratory (CSML), Department of Materials Science & Engineering, University of Ioannina, GR-45110 Ioannina, Greece
4
Chemical and Environmental Engineering Department, Instituto de Nanociencia de Aragón (INA) and Instituto de Ciencia de Materiales de Aragón (ICMA), Universidad de Zaragoza-CSIC, 50018 Zaragoza, Spain
5
Networking Research Center on Bioengineering, Biomaterials and Nanomedicine, CIBERBBN, 28029 Madrid, Spain
6
Advanced Technology Institute, Department of Electrical and Electronic Engineering, University of Surrey, Guildford GU2 4DL , UK
7
The Surface Analysis Laboratory, Faculty of Engineering and Physical Sciences, University of Surrey, Guildford GU2 4DL, UK
8
Department of Mechanical Engineering, Khalifa University of Science and Technology, Abu Dhabi P.O. Box 127788, UAE
9
Center for Catalysis and Separations, Khalifa University of Science and Technology, Abu Dhabi P.O. Box 127788, UAE
*
Authors to whom correspondence should be addressed.
Catalysts 2019, 9(8), 676; https://doi.org/10.3390/catal9080676
Submission received: 23 July 2019 / Revised: 6 August 2019 / Accepted: 8 August 2019 / Published: 9 August 2019
(This article belongs to the Special Issue Catalyst Deactivation in Hydrocarbon Processing)

Abstract

:
The tackling of carbon deposition during the dry reforming of biogas (BDR) necessitates research of the surface of spent catalysts in an effort to obtain a better understanding of the effect that different carbon allotropes have on the deactivation mechanism and correlation of their formation with catalytic properties. The work presented herein provides a comparative assessment of catalytic stability in relation to carbon deposition and metal particle sintering on un-promoted Ni/Al2O3, Ni/ZrO2 and Ni/SiO2 catalysts for different reaction temperatures. The spent catalysts were examined using thermogravimetric analysis (TGA), Raman spectroscopy, high angle annular dark field scanning transmission electron microscopy (STEM-HAADF) and X-ray photoelectron spectroscopy (XPS). The results show that the formation and nature of carbonaceous deposits on catalytic surfaces (and thus catalytic stability) depend on the interplay of a number of crucial parameters such as metal support interaction, acidity/basicity characteristics, O2– lability and active phase particle size. When a catalytic system possesses only some of these beneficial characteristics, then competition with adverse effects may overshadow any potential benefits.

1. Introduction

During the last decades, renewable power sources have entered dynamically into the world’s energy markets promising sustainable development, improved domestic energy supply and a better future without the threats of climate change and environmental pollution. In this context, biogas is widely considered as a renewable, environmentally sustainable and abundant gaseous biofuel, readily usable for the generation of heat or the cogeneration of heat and power. It is produced by the bacterial degradation of biomass under anaerobic conditions and has a typical composition of 50–75% CH4, 25–50% CO2 and 2–8% other gases such as H2O(g), N2, O2, S2 and H2S [1,2]. After simple desulfurization and drying, which typically precede most of the final applications, biogas is basically a mixture of CH4 and CO2 that is favourably suitable for direct conversion into hydrogen rich syngas (a mixture of H2 and CO) via the catalytic reaction of dry reforming (BDR) [3,4]. Through dry reforming, biogas becomes the intermediate of a renewable biomass-to-hydrogen/syngas conversion scheme that can find use to power fuel cells or produce useful chemicals and liquid fuels through the Fischer-Tropsch synthesis. Moreover, biogas dry reforming could make a sizable contribution to the future production of renewable hydrogen, which is envisioned as the best fuel for highly efficient generation of electricity in fuel cell plants and vehicles with zero carbon and greenhouse gas emissions [5,6].
BDR Equation (1) is a highly endothermic reaction, as both reactants have high bond-dissociation energies (435 and 526 kJ mol−1 for CH4 and CO2, respectively). Moreover, it proceeds in parallel with a number of simultaneous side reactions which affect both the overall observed reaction mechanism and the performance of the catalyst. The reverse water gas shift reaction (RWGS, Equation (2)) consumes part of the hydrogen produced by BDR and leads in a lower syngas H2/CO molar ratio. The methane decomposition Equation (3) and Boudouard reactions Equation (4) induce carbon deposition on the catalyst surface encapsulating its active sites and leading to partial or total deactivation. Part of the deposited carbon is removed through gasification or partial oxidation as CO Equations (5) and (6) or through complete oxidation as CO2 Equation (8). Finally, syngas formation may also be impeded by the reaction of CO methanation Equation (8) [7,8].
CH4 + CO2 ↔ 2CO + 2H2    ΔHo298K = +247 kJ/mol
CO2 + H2 ↔ CO + H2O    ΔHo298K = +41.1 kJ/mol
CH4 ↔ 2H2 + C    ΔHo298K = +74.5 kJ/mol
2CO ↔ CO2 + C    ΔHo298K = −172.4 kJ/mol
C + H2O ↔ CO + H2    ΔHo298K = −131.2 kJ/mol
C + ½ O2 ↔ CO    ΔHo298K = −110.5 kJ/mol
C + O2 ↔ CO2    ΔHo298K = −393.4 kJ/mol
CO + 3H2 ↔ CH4 + H2O    ΔHo298K = −205.8 kJ/mol
The extent of each of the above reactions depends on a variety of parameters such as the temperature and pressure of the reactor, the initial CO2/CH4 molar ratio and the individual chemical kinetics of the selected catalyst and catalyst support. Thermodynamically, an increase in the temperature favours the endothermic BDR and methane decomposition reactions and decelerates the rates of the RWGS and Boudouard reactions. An optimum range of reaction temperatures thus exists above 650 °C where the rate of the desired BDR is high [8,9]. The overall syngas production also maximizes at lower pressures and at CO2/CH4 molar ratios of the reactants close to unity. At atmospheric pressure with molar CO2/CH4 ratio equal to unity carbon formation is thermodynamically possible up to 870 °C [10].
The rate determining step in the BDR is thought to be the dissociative adsorption of CH4, which occurs over the active metallic particles, with CH2 adsorbing between two metal atoms (bridged adsorption) and CH3 adsorbing on single metal atoms, i.e., CHx adsorbs on the sites that complete its tetravalency. CO2 dissociative adsorption is thought to occur on the metal-support interface and can take place in C-only coordination, O-only coordination or C-O coordination. During the latter, coke and an oxygen atom adsorb on the catalyst surface leaving an exposed oxygen atom [11]. Hydroxyl groups may also form during BDR, due to the WGS reaction, through the migration of hydrogen atoms from the active metal particles to the support. Finally, intermediate oxidation and desorption are also likely, as surface oxygen from the metal active particles can react with surface CHx groups to form surface CHxO or surface CO [11,12]. However, the scheme described is heavily dependent on the surface structure and its defects and also, on the catalyst nature and the operating conditions [13].
The selective promotion of the BDR reaction requires the development of appropriate catalysts that will not only exhibit desirable intrinsic behaviour, but also resistance to carbon formation and metal particle sintering, the two main causes of catalyst deactivation. Obviously, the support is a critical component of any catalyst system, and a number of physicochemical properties are thought to play a crucial role. To start with, as the BDR takes place at high temperatures, thermal stability is a prerequisite. Moreover, the supports with high surface area aid the dispersion of the active phase, but the drawback is that their small pore size distribution inhibits intra-particle diffusion of reactants and products [14]. Dispersion is also favoured by the existence of strong metal support interactions (SMSI) and SMSI in turn, help to maintain the particle size of the active species (thus, providing resistance to sintering) [15]. Li and van Veen [16] used Ni/CeO2 catalysts in the BDR and showed that achieving a strong bonding between Ni and CeO2 inhibited Ni particle sintering. Wei and Inglesia [17,18] demonstrated that increased dispersion led to an increase in the turnover rate of CH4 over the active metal. However, it is also understood that a very strong interaction between the active metal and the support can have a negative influence on the degree of the reducibility of the active metal and thus, lower the number of available active sites [19]. Another key property of the supporting materials is basicity, as the formation of carbon from methane decomposition Equation (3) is known to occur over the acid sites of the support [20]. Increased basicity also leads to the activation of CO2, which helps to oxidize the deposited carbon Equation (8) [21]. Moreover, CO2 activation and the oxidation of carbon to CO Equation (6) depend on the oxygen storage capacity (OSC) of a support [22]. Lercher et al. [23] concluded that the improved activity of a Pt/ZrO2 catalyst, in comparison with a Pt/Al2O3 catalyst was mainly due to the former’s ability to activate CO2 on the O2 defects of the zirconia support.
The discussion above makes clear that although the supports are not catalytically active, their interaction with the active metallic component plays a crucial role in determining the activity and stability of a catalytic system. Thus, the effort to induce the support-mediated promotional effects on the catalytic system has led to extensive testing of several oxides in the BDR, including Al2O3, ZrO2, SiO2, TiO2, La2O3, CeO2, Sm2O3, MgO and CaO. Alumina is often used as a catalytic carrier because it has a high surface area, and a property that facilitates the dispersion of metallic particles onto the support. It is also considered mechanically and chemically stable, but as it is mildly acidic, it tends to promote carbon deposition during a reaction [24,25]. Bychkov et al. [26] prepared Ni based catalysts that were supported on different crystal structures of alumina (i.e., α-, γ-, θ-), and showed that γ-Al2O3 helped to promote catalytic activity and suppressed carbon deposition. Silica also has a high surface area, and it is generally considered as an inert, low cost material [27,28]. Cai et al. [29] were able to show that SiO2 can help anchor Ni species in its matrix and lead to the formation of well dispersed Ni particles, providing a catalyst with good activity characteristics. Although zirconia has a much lower surface area than the aforementioned metal oxides (i.e., γ-Al2O3 and SiO2), it possesses higher strength and thermal stability. Moreover, it is thought to have both acidic and alkaline surface properties and behaves as a bi-functional oxide with redox functions [30,31]. Sokolov et al. [32] carried out low temperature (400 °C) dry reforming tests using CH4/CO2 = 1, comparing the performance of Ni catalysts based on a number of different carriers, and showed that after 10 h of time-on-stream, H2 yield followed the order Ni/ZrO2 > Ni/MgO > Ni/TiO2 > Ni/Al2O3 > Ni/SiO2.
Both noble (e.g., Pd, Ru, Rh, Ir and Pt) and transition (e.g., Fe, Co, Cu and Ni) metal catalysts have been tested in the dry reforming of biogas. In general, noble metal-based systems demonstrate high activity and stability and it is accepted that they have the capacity to disperse widely onto the support and retain small particle sizes during a reaction. They also have the ability to reduce coke deposition and affect its characteristics [33]. For example, Rh perovskite type catalysts La0.4Rh0.6Al0.2Ni0.8O3 showed excellent activity, reaching values close to the thermodynamic equilibrium at relatively short contact times [34]. Noble metals, however, are unattractive for commercial and industrial applications due to their natural scarcity and high cost. This impediment has forced research to develop BDR catalysts based on cheap and abundant transition metals and numerous studies have been performed over various un-promoted or promoted oxide supports [35,36,37]. Ni based systems have shown excellent intrinsic activity, especially when the active metal particles are widely dispersed over the support [38,39]. A number of reports suggest that a higher initial conversion rate than noble metal-based systems can be achieved, with the exception of Rh [40]. However, the major challenge that needs to be overcome for the industrial application of Ni catalysts is deactivation due to carbon deposition and metal particle sintering [41,42].
Sintering is basically the process where the metallic particles constituting the active phase grow in size during the reaction and it is widely accepted that there are two fundamental mechanisms through which sintering may occur. The first is the migration of entire particles over the support and their coalescence with other particles located nearby. The second takes place through Ostwald ripening, i.e., it is caused by the migration of atoms over the support from one crystallite to a neighbouring crystallite [43]. The negative influence of sintering on catalytic activity is twofold: Firstly, the number of active sites is reduced (lowering the activity); secondly, larger metallic particles stimulate the formation of carbon. Coke deposition is the result of the high temperatures that are necessary in order to raise the molecular energy so as to cleave the C-H and C-O bonds in CH4 and CO2, respectively. Although there is a lack of a clear description of the carbon species that are formed onto a catalyst in the literature, there is consensus that filamentous carbon (otherwise reported as whisker carbon) is mainly responsible for catalytic deactivation. Rostrup-Nielsen and Norskov [44] proposed a widely accepted mechanism that describes the formation of filamentous carbon. According to that study, there is an initial step where CO is adsorbed onto the catalytic surface, which is followed by the dissociation that produces the adsorbed carbon. This is, in turn, is followed by diffusion to the metal particles up to the point where the carbon reaches the rear interface. The final step is nucleation and the formation of the carbon filament. It is also widely accepted that as the filament grows, it pushes the active metal particle causing it to disconnect from the support. If the metal particle is encapsulated within the filament, then a total loss in activity is to be expected. However, even if this is not the case—as the catalytic particle may be located at the tip of the filament growth and still be available to the reactants—filament formation is thought to have catastrophic consequences, as it can lead to the plugging of the reactor (due to the expansion of the catalyst bed), the breakage of the catalytic particles (due to the blockage of the porosity), an increased pressure drop, and even to the creation of hot spots that can cause the failure of the reactor [25,41,42,43]. Filament formation also causes difficulties to the regeneration of the catalytic system, as the contact between the metal and the support is lost [42].
Although coke deposition during the BDR cannot be fully eliminated, the development of catalytic systems that favours the formation of easier to oxidize carbonaceous species seems a promising way forward. This necessitates targeted research and analysis of the surface of spent catalysts in an effort to obtain a better understanding of the effect that different carbon allotropes have on the deactivation mechanism. In previous BDR related works carried out by our group, the use of promoters on Ni/Al (La2O3 [45]) and Ni/Zr (La2O3 and CeO2 [42]) systems, and their effect on carbon deposition and metal particle sintering, as a function of the reaction temperature and/or weight hour space velocity (WHSV) was investigated. For the work presented herein, the authors decided to provide a comparative examination of the carbonaceous deposits on un-promoted nickel catalysts based on some of the most widely used supporting materials, i.e., Al2O3, ZrO2 and SiO2. For this purpose, a series of short (10 h) time on-stream experiments at 600, 650, 700, 750 and 800 °C were carried out, using a fresh catalytic sample for each test, and used a CH4/CO2 mixture with a high C content (CH4/CO2 molar ratio equal to 1.56) and minimal dilution (10% Ar), in order to further induce carbon formation. The coke deposits on the spent catalytic systems have been analyzed in detail using thermogravimetric analysis (TGA), Raman spectroscopy, high angle annular dark field scanning transmission electron microscopy (STEM-HAADF) and X-ray photoelectron spectroscopy (XPS).

2. Results and Discussion

2.1. Characterization Results for Fresh Catalysts

The calcined and/or reduced catalytic materials used herein have been characterized using inductively coupled plasma atomic emission spectroscopy (ICP-AES), X-ray diffraction (XRD), CO2 and NH3-temperature programmed desorption (TPD), temperature programmed reduction (H2-TPR), transmission electron microscopy (TEM) and XPS. As these results have been reported in detail previously in Ref. [46], only a brief summary of the main findings is provided in this section, as they have been used when discussing catalytic performance and its relation to carbon deposition and metal particle sintering.
To start with, all catalysts had similar metal loadings, as confirmed by the ICP measurements, which stood at 7.14, 7.65 and 7.95 wt %, for the Ni/Al, Ni/Zr and Ni/Si, respectively. Ni impregnation and the calcination process led to a substantial lowering of the specific surface area (SSA) of the calcined catalysts (in relation to the untreated carriers), but no significant change to the SSA was observed after the reduction step. The isotherms of the catalysts showed that all were mainly mesoporous materials. For the calcined/ reduced Ni/Al2O3 catalyst, XRD analysis revealed the characteristic peaks of γ-Al2O3 and of the spinel NiAl2O4 phase while the absence of NiO was thought to be an indication of an amorphous structure. The zirconia on the Ni/ZrO2 catalyst exhibited tetragonal polymorphs, independently of the calcined or reduced conditioning. The SiO2 found in the calcined and reduced Ni/SiO2 catalyst was amorphous, with a low degree of crystallinity. For all three catalysts, metallic nickel (Νi0) was observed after the reduction process. The Ni species mean particle size, for both the calcined and reduced samples, was determined using the Scherrer equation. However, for the paper presented herein, the Ni species mean particle size of the reduced catalysts was calculated again, this time using STEM-HAADF analysis. Accordingly, it was calculated at 5.3 nm (± 1.3 nm), 48.2 nm (± 16.6 nm) and 56.2 nm (± 21.1 nm) for the Ni/Al, Ni/Zr and Ni/Si, respectively. Thus, Ni dispersion on the reduced catalysts followed the order NiAl > Ni/Zr > Ni/Si. The NH3-TPD profiles showed that all catalysts were dominated by two desorption regions associated with weak and medium/strong acid sites. However, the Ni/Zr catalyst presented a higher population of weak acid sites compared to the Ni/Si, indicating an enhancement of its weak acid strength. From the CO2-TPD profiles, it was observed that CO2 was weakly adsorbed on the Ni/Zr catalyst, while the Ni/Al and Ni/Si catalysts showed the presence of both weak and medium strength basic sites. The TPR profiles showed that the interaction strength between the active metal and the support was lower for the Ni/Si catalyst in comparison with the Ni/Al and Ni/Zr catalysts. XPS high-resolution spectra showed that the surface coverage of Ni0 followed the order 1.4, 2.3 and 5.1 for the Ni/Al, Ni/Zr and Ni/Si reduced catalysts. Moreover, XPS results showed that the formation of the spinel NiAl2O4 phase was favoured on the Ni/Al catalyst.

2.2. Characterization Results for Spent Catalysts

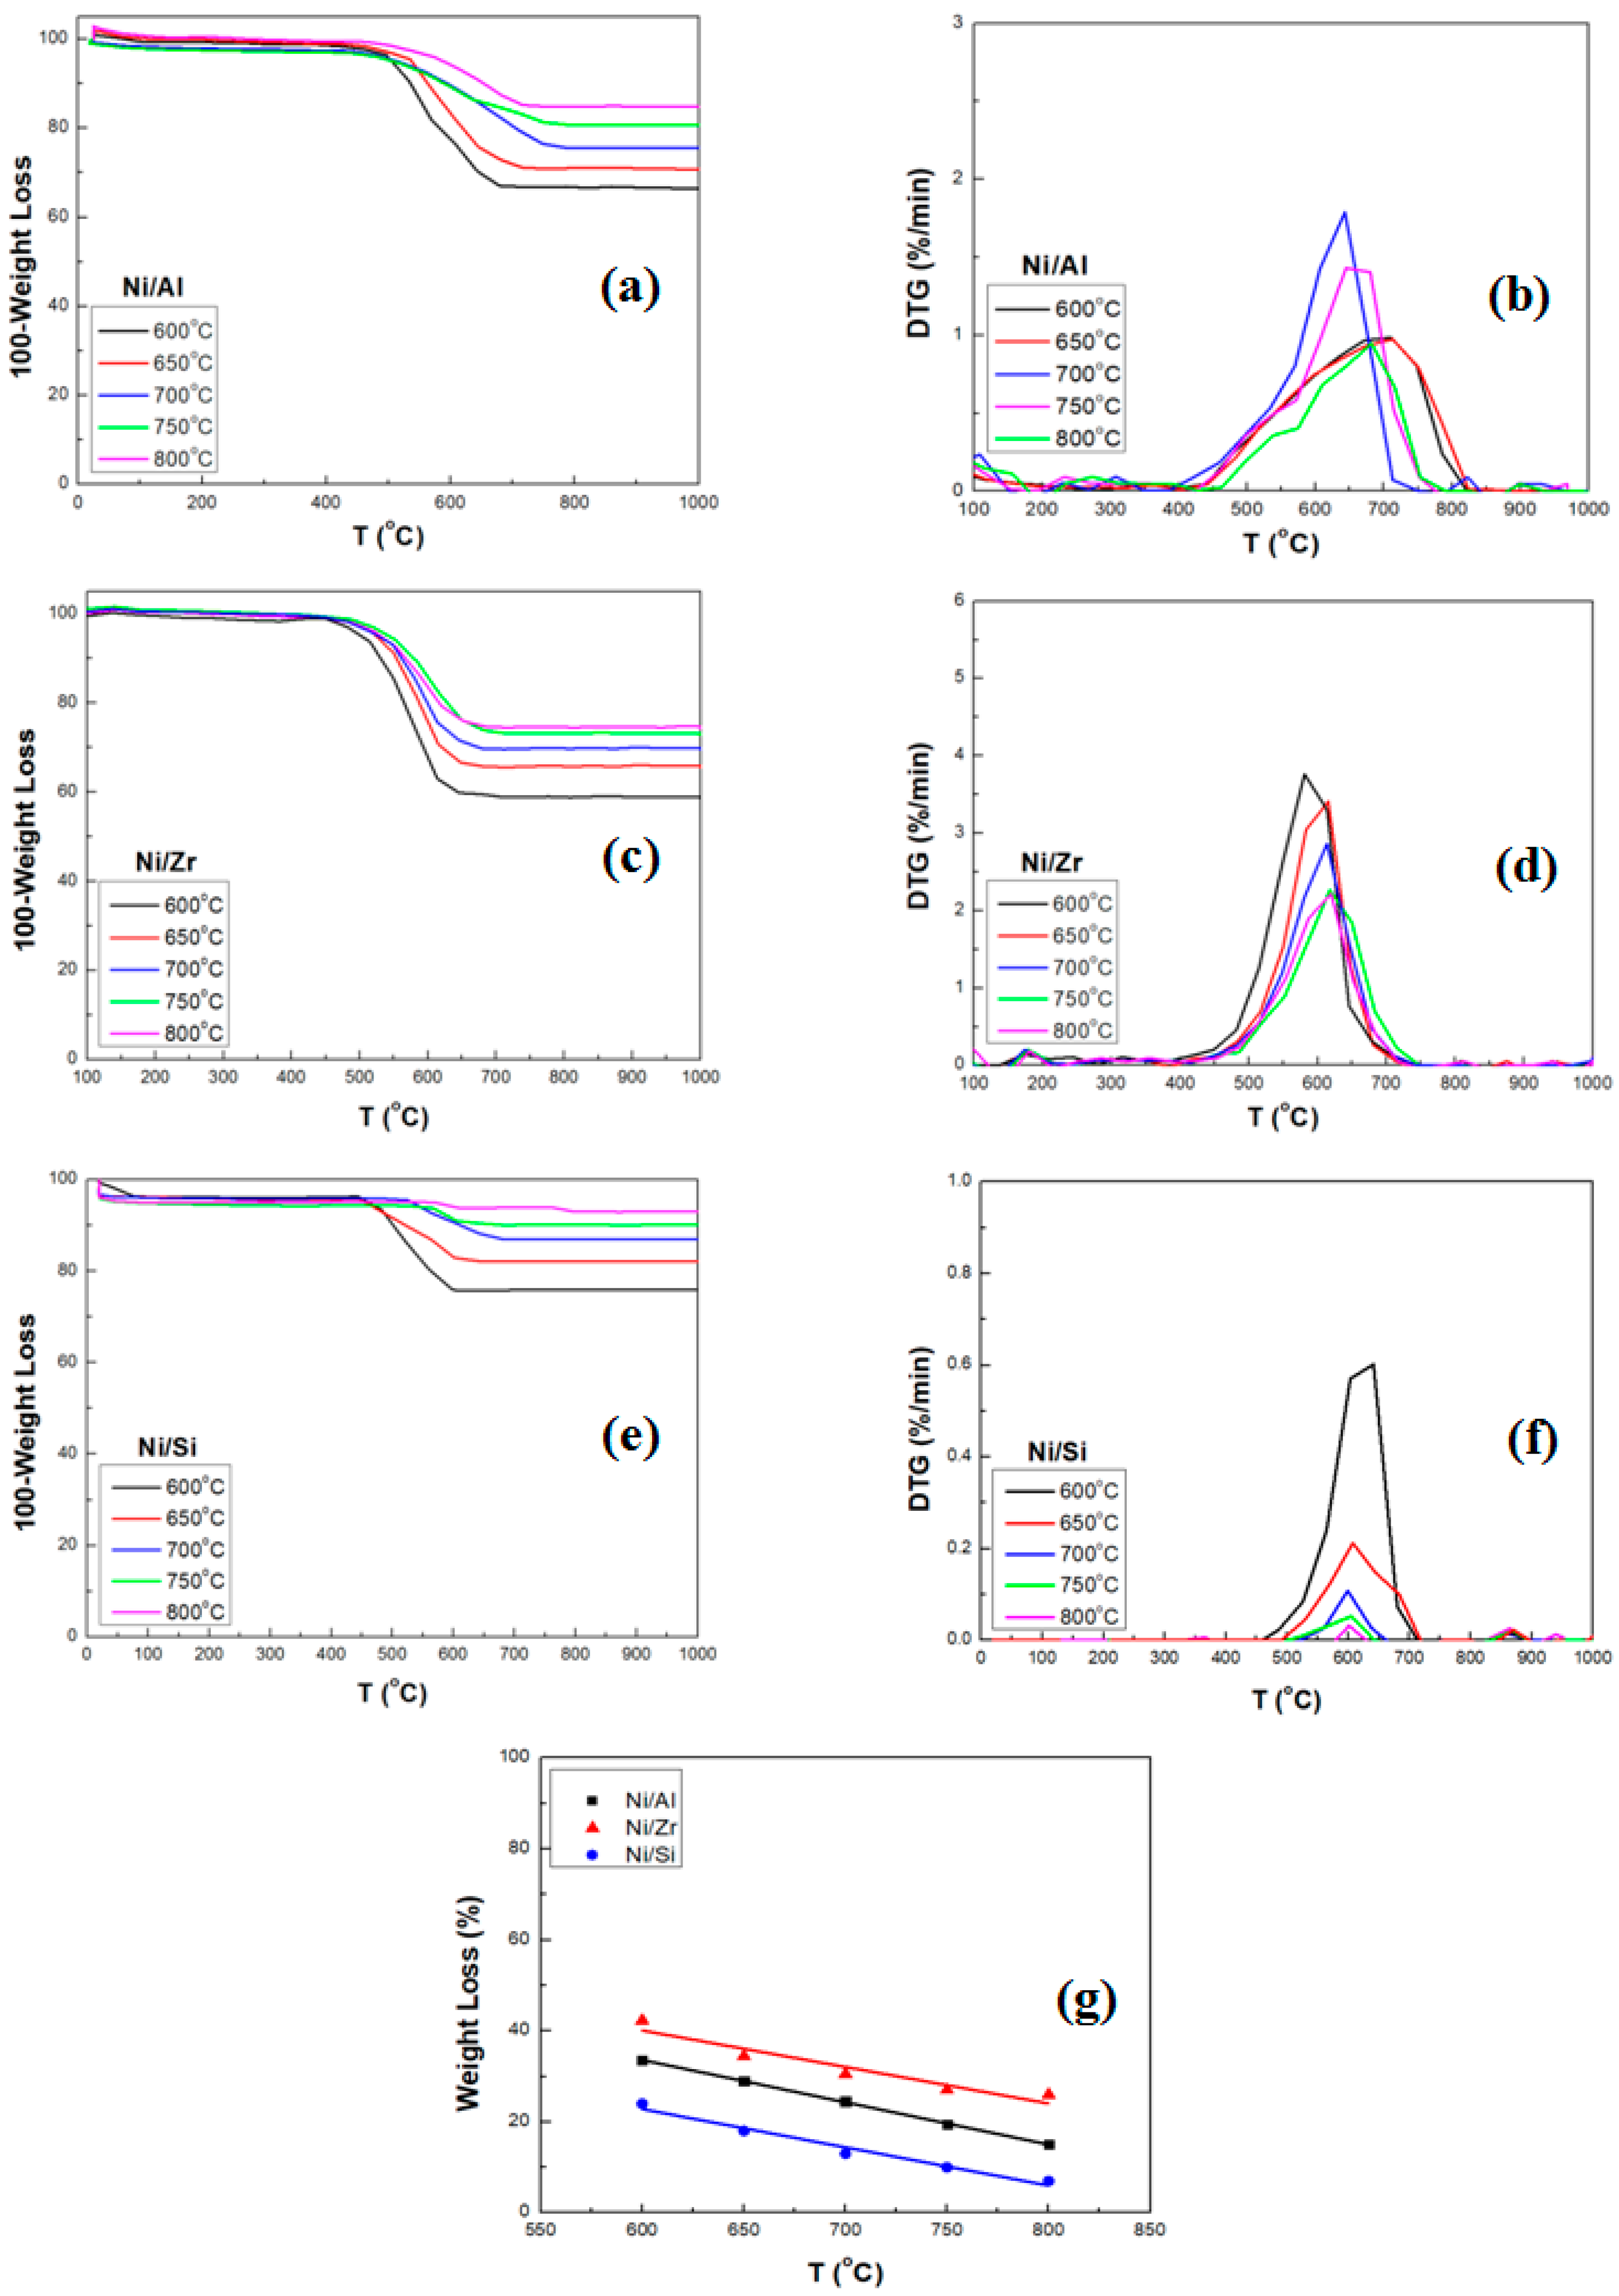
2.2.1. TGA/DTG Analysis

As mentioned above, the biogas dry reforming reaction has an inherent tendency towards coke deposition due to the high temperatures needed for the reaction to proceed in a forward direction, and the methane decomposition Equation (3) and Boudouard reactions Equation (4) that occur in parallel with the main reaction. Thermodynamic studies show that CH4 decomposition takes place over ≈ 550 °C and Boudouard at temperatures lower than 700 °C [7,9], which means that most of the coke deposition is to be expected in between these temperatures. However, theoretical calculations of the likely coke deposition cannot be easily performed, as the surface phenomena taking place on the Ni crystals cause important deviations from the thermodynamics of graphitic carbon [47]. Moreover, carbon formation is also influenced by the O/C and H/C ratios of the feed composition, with lower ratios indicative of a higher tendency towards coke development [25,35]. In this respect, carbon deposition is more likely to occur during methane dry reforming (CH4/CO2 = 1, O/C = 1, H/C = 2) in comparison to, for example, methane partial oxidation (CH4/0.5O2, O/C = 1, H/C = 4) or methane steam reforming (CH4/H2O = 1/1, O/C = 1, H/C = 6). As the ratio of CH4/CO2 chosen for the work presented herein (1.56) aimed at simulating an ideal biogas mixture, and the reactants mixture was used with minimal dilution (only 10% Ar), a heavy carbon deposition was expected.
The TGA results presented in Figure 1a,c,e, show that the coke accumulation was substantial for all systems tested herein, as it stood at ≈ 42, 34 and 25 wt %, at 600 °C, for the Ni/Zr, Ni/Al and Ni/Si catalysts, respectively. It is also clear that the amount of coke decreased with an increase of the reaction temperature for all the samples (Figure 1g); at 800 °C, the values obtained were ≈ 26, 16 and 7 wt % for the Ni/Zr, Ni/Al and Ni/Si catalysts, respectively. Moreover, for all temperatures under investigation the amount of coke deposited onto the catalytic samples followed the same order, i.e., Ni/Zr > Ni/Al > Ni/Si (Figure 1g).
The derivative thermo-gravimetric (DTG) graphs presented in Figure 1b,d,f show that the oxidation process is different for each catalyst. In particular, for the Ni/Al spent sample (Figure 1b), the main thermal event is confined between 450–700 °C for the samples tested at 600 and 650 °C and expands up to 800 °C for the samples tested at higher temperatures. For the Ni/Zr catalyst (Figure 1d), the main thermal event is found between 450–700 °C irrespective of the reaction temperature. Finally, for the Ni/Si catalyst (Figure 1f), the main thermal event is located between 500–700 °C, however, tiny peaks at 850 °C for the spent catalysts tested at the reaction temperatures higher than 700 °C can also be seen. Another observation derived from the DTG graphs is that for all catalysts tested herein, the rate of carbon oxidation decreases with increasing temperature, however important differences exist between the different catalytic systems. Specifically, the coke oxidation (%/min) follows the order Ni/Zr > Ni/Al > Ni/Si, indicating that the coke formed onto the Ni/Si system is harder to oxidise irrespective of the reaction temperature.
According to the literature, functional groups physically or chemically adsorbed onto carbon nanomaterials decompose below 200 °C, while amorphous carbon species combust at temperatures between 200–500 °C in air rich environments. Carbon allotropes, such as carbon nanofibers (CNFs), carbon nanotubes (CNTs) or fullerenes with different structural arrangements and defects inserted in their graphitic lattice, combust between 500 and 600 °C. More graphitic structures, such as graphite, graphene and highly graphitized CNTs, with almost perfect graphene sheet arrangements, are burnt between 600 and 800 °C [48,49,50]. In the case of CNTs, the oxidation temperature depends also on the number of walls, the presence of the catalyst, and their inner and outer diameters that can influence the graphene sheets curvature [51]. The carbon formed onto the catalytic systems during reforming reactions is often described in the literature as gum coke (or soft coke), pyrolytic coke and filamentous coke [25,43]. There is also agreement that gum coke is formed at lower temperatures, pyrolytic coke is formed in the presence of heavy hydrocarbons and that both pyrolytic and filamentous carbon are formed at high reaction temperatures. Attempts have also been made to classify the surface coke species using temperature programmed hydrogenation (TPH) denoting them as α-C, β-C and γ-C. The former carbon type refers to surface carbide and is thought to serve as a reaction intermediate, assisting in the formation of CO. Further, β-C can be hydrogenated at approximately 550–650 °C and γ-C above 650 °C. Both of these types of surface carbon are thought to be difficult to oxidize and subsequently, lead to catalyst deactivation [52,53].
In light of the discussion above, it is obvious that the type of carbon formed onto the spent catalysts tested herein was strongly influenced by the type of support used and the reaction temperature under which the time-on-stream experiments were undertaken. For the Ni/Al catalyst, amorphous, CNFs and CNTs were deposited on the catalyst surface at low reaction temperatures i.e., 600 and 650 °C, during the time-on-stream experiments, but as the reaction temperature under investigation increased, there was a clear shift and it became harder to oxidise, graphene-like structures. Importantly, although the Ni/Si catalyst experienced the lowest coke deposition in comparison to the other samples, there was an absence of amorphous carbon deposits on its surface, as the main thermal event was confined to 500–700 °C, even at low reaction temperatures. Moreover, the DTG graphs show that the formed carbon had a very high degree of graphitisation, as it did not oxidise easily. In contrast, although the Ni/Zr catalyst had the highest amount of carbon deposited onto its surface, at all reaction temperatures under consideration, it also seemed to contain higher percentages of carbon that was easier to oxidise, as evidenced by its DTG graphs. As mentioned above, hard to oxidise, filamentous coke is the carbon form that has the most adverse effect on catalytic performance acting like a shell on the catalyst, covering layer by layer the nickel active sites.

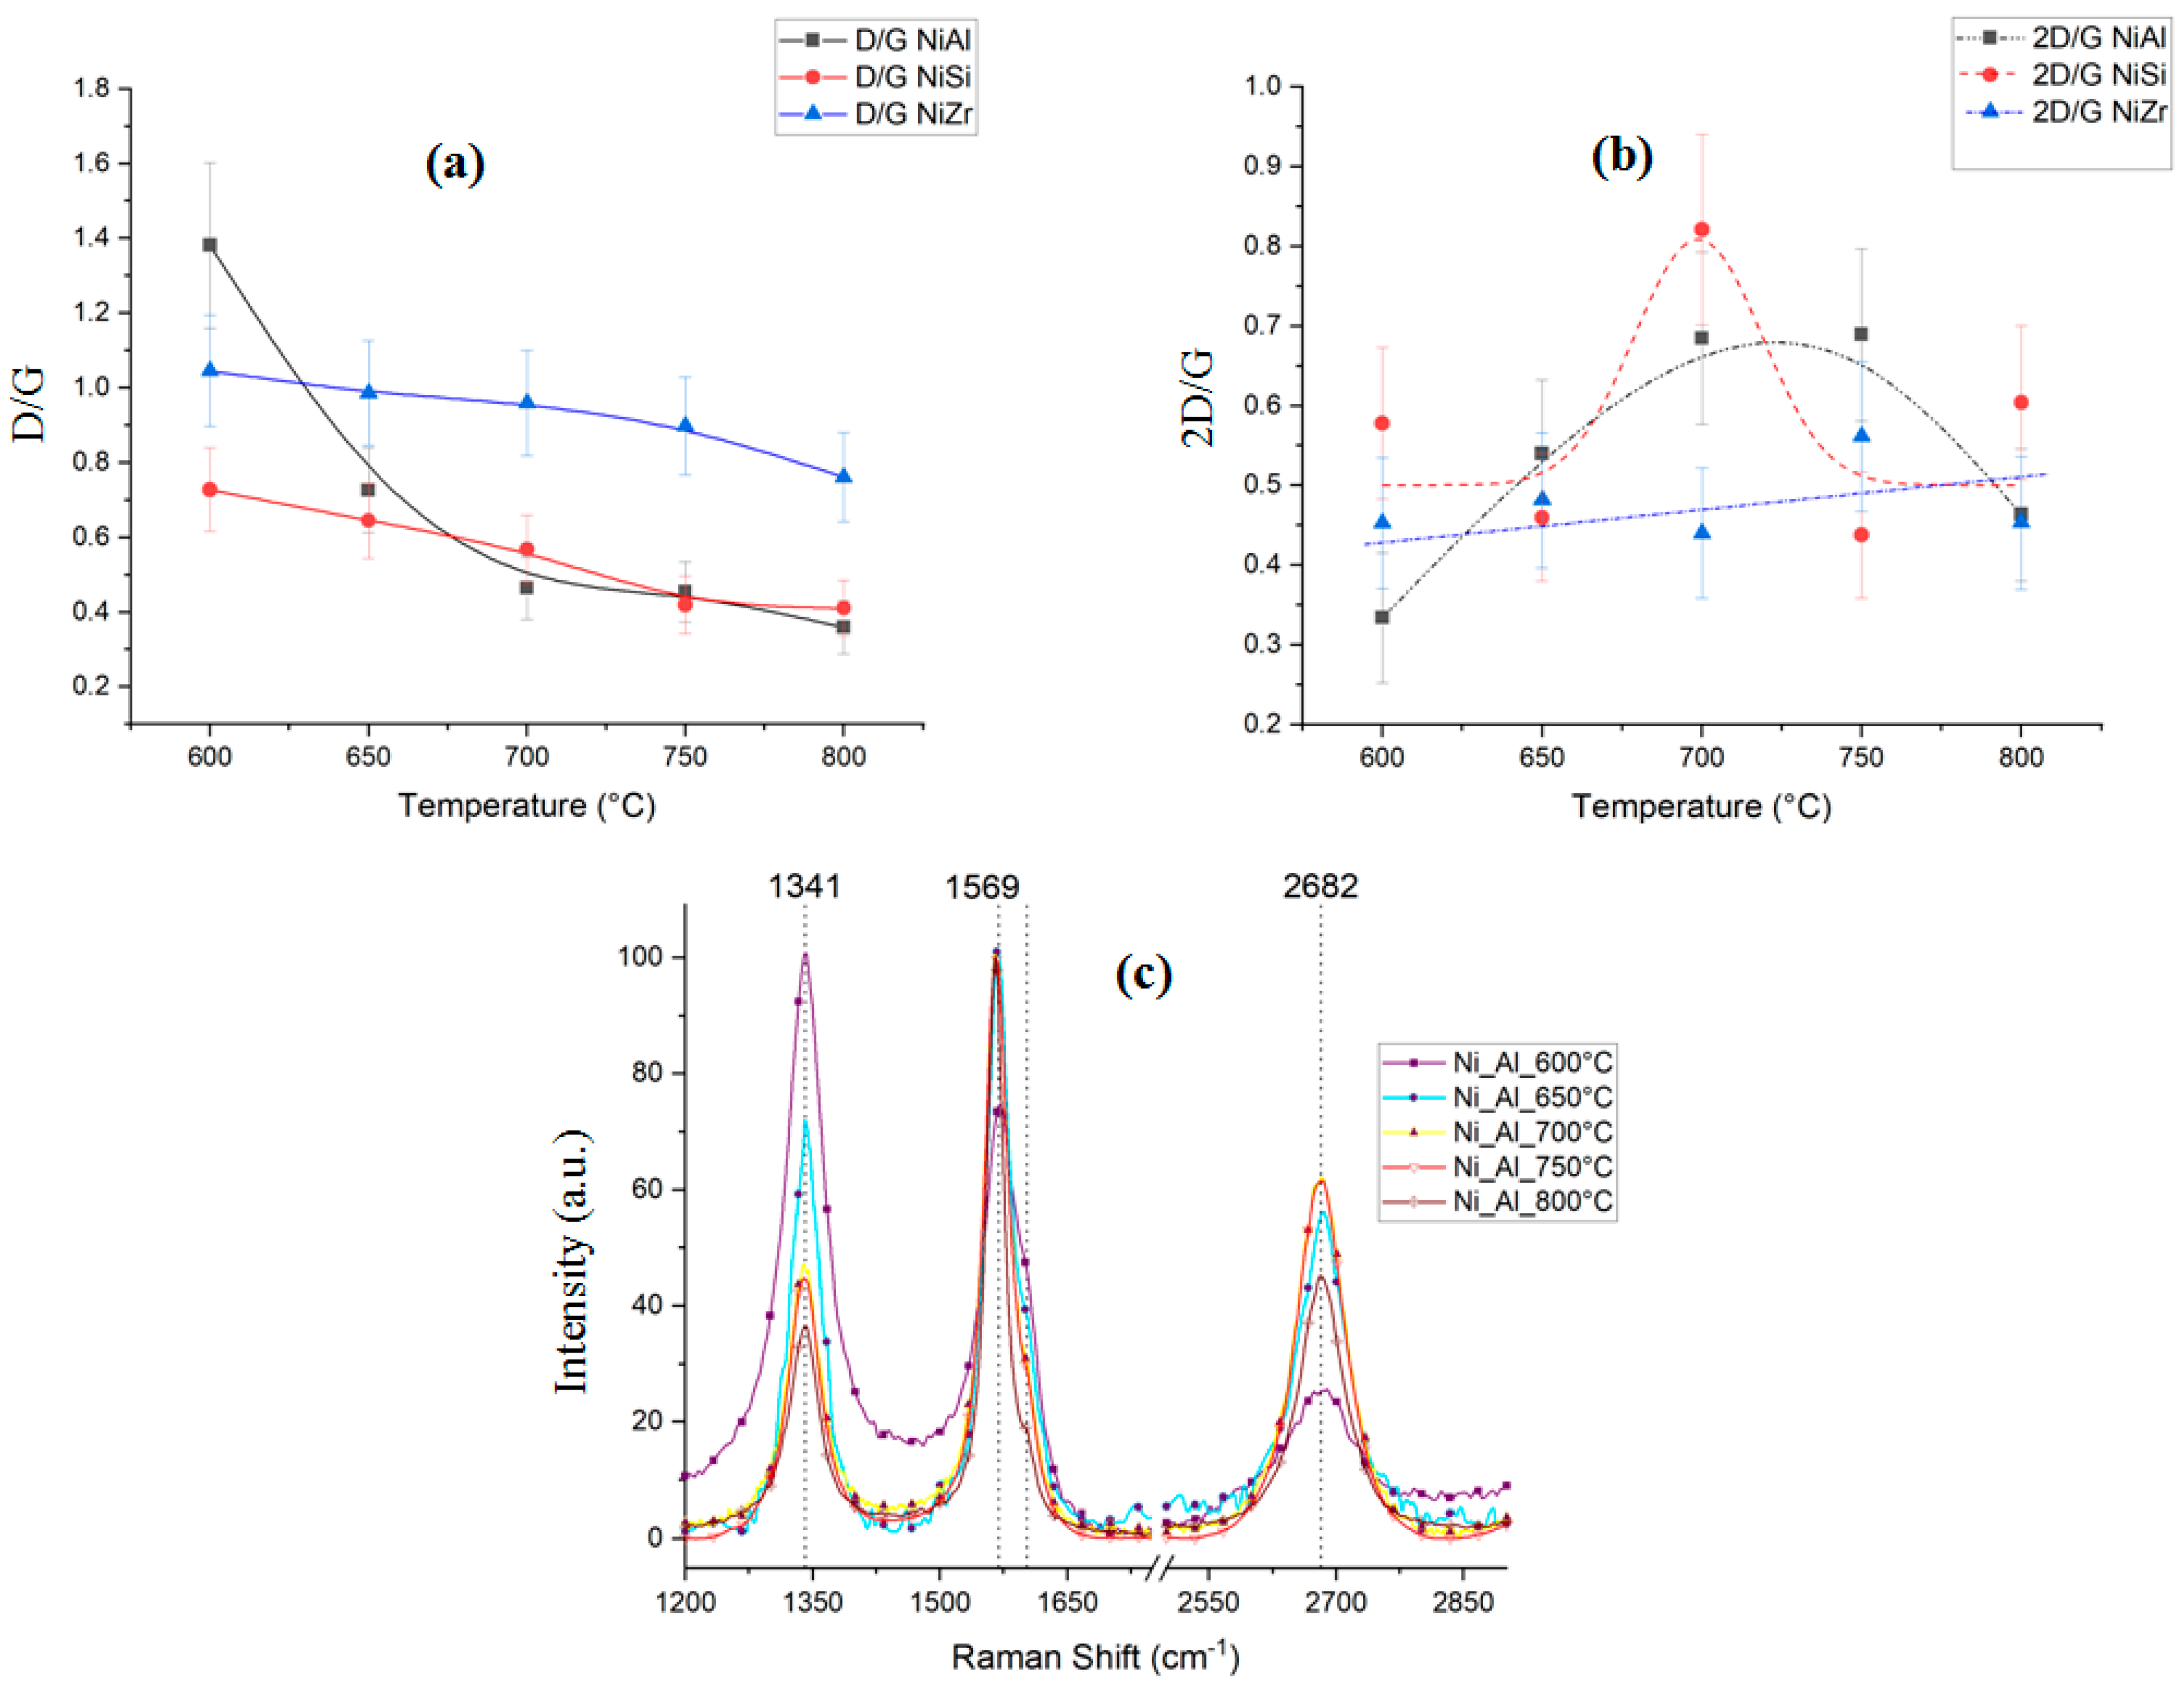
2.2.2. Raman Spectroscopy Analysis

Raman spectra from carbon show 3 major features: The G peak, at approximately 1580 cm−1, the D band at approximately 1350 cm−1 and the overtone of the D band at approximately 2700 cm−1. The fundamental difference between the D peak and its overtone is that the former is a forbidden transition in Raman spectroscopy, where symmetry rules are broken only in the presence of a defect, whilst the overtone is an allowed transition and is a measure of the long-range crystalline order [54,55]. The G peak is a vibration mode associated to the bond stretching of sp2 bonds. It follows that the ratio of the D peak to the G peak is a measure of the number of defects in the material, whilst the ratio of the 2D peak to the G peak is a measure of the long-range order—the lower the D/G ratio, the lower the number of defects, the higher the 2D/G ratio, the higher the crystalline long range order.
Figure 2a shows a general D/G ratio decrease with the temperature for all three catalysts, related to a decrease in the ratio of defects. Ni/Al-catalysed carbon shows a significant improvement in the quality (low defect density) from 600 °C to 650 °C, indicating a possible activation of different catalysis pathways [56].
Figure 2b shows a more differentiated behavior in the resulting graphitic carbon long range order, where Ni/Zr shows virtually no change, Ni/Al shows gradual improvement up to 700–750 °C followed by degradation, whilst Ni/Si shows a significant increase in crystallinity at 700 °C. In the framework of activation energies of various diffusion pathways for carbon to form carbon nanostructures, it shows that Ni/Al-catalysed carbon improves in terms of lower defect density and crystalline ordering up to 750 °C, after which there is an increase in sp2 bonding but a loss of long-range order, probably due to an increased rate of carbon growth. In the case of Ni/Si, the long-range order is achieved only at 700 °C, where the rate of C arrival and C excretion from the catalysts are likely to match, such that optimum growth is achieved. Ni/Zr shows virtually no change in crystallinity and a relatively small lowering of the graphitic carbon defect density with increased reaction temperature, indicating that the carbon diffusion pathway types do not change significantly.
In the case of Ni/Al, a small shoulder also appears on the higher energy side of the G peak (Figure 2c). This is the D peak that also originates from a double-resonance process and generally follows the evolution of the D peak [54].

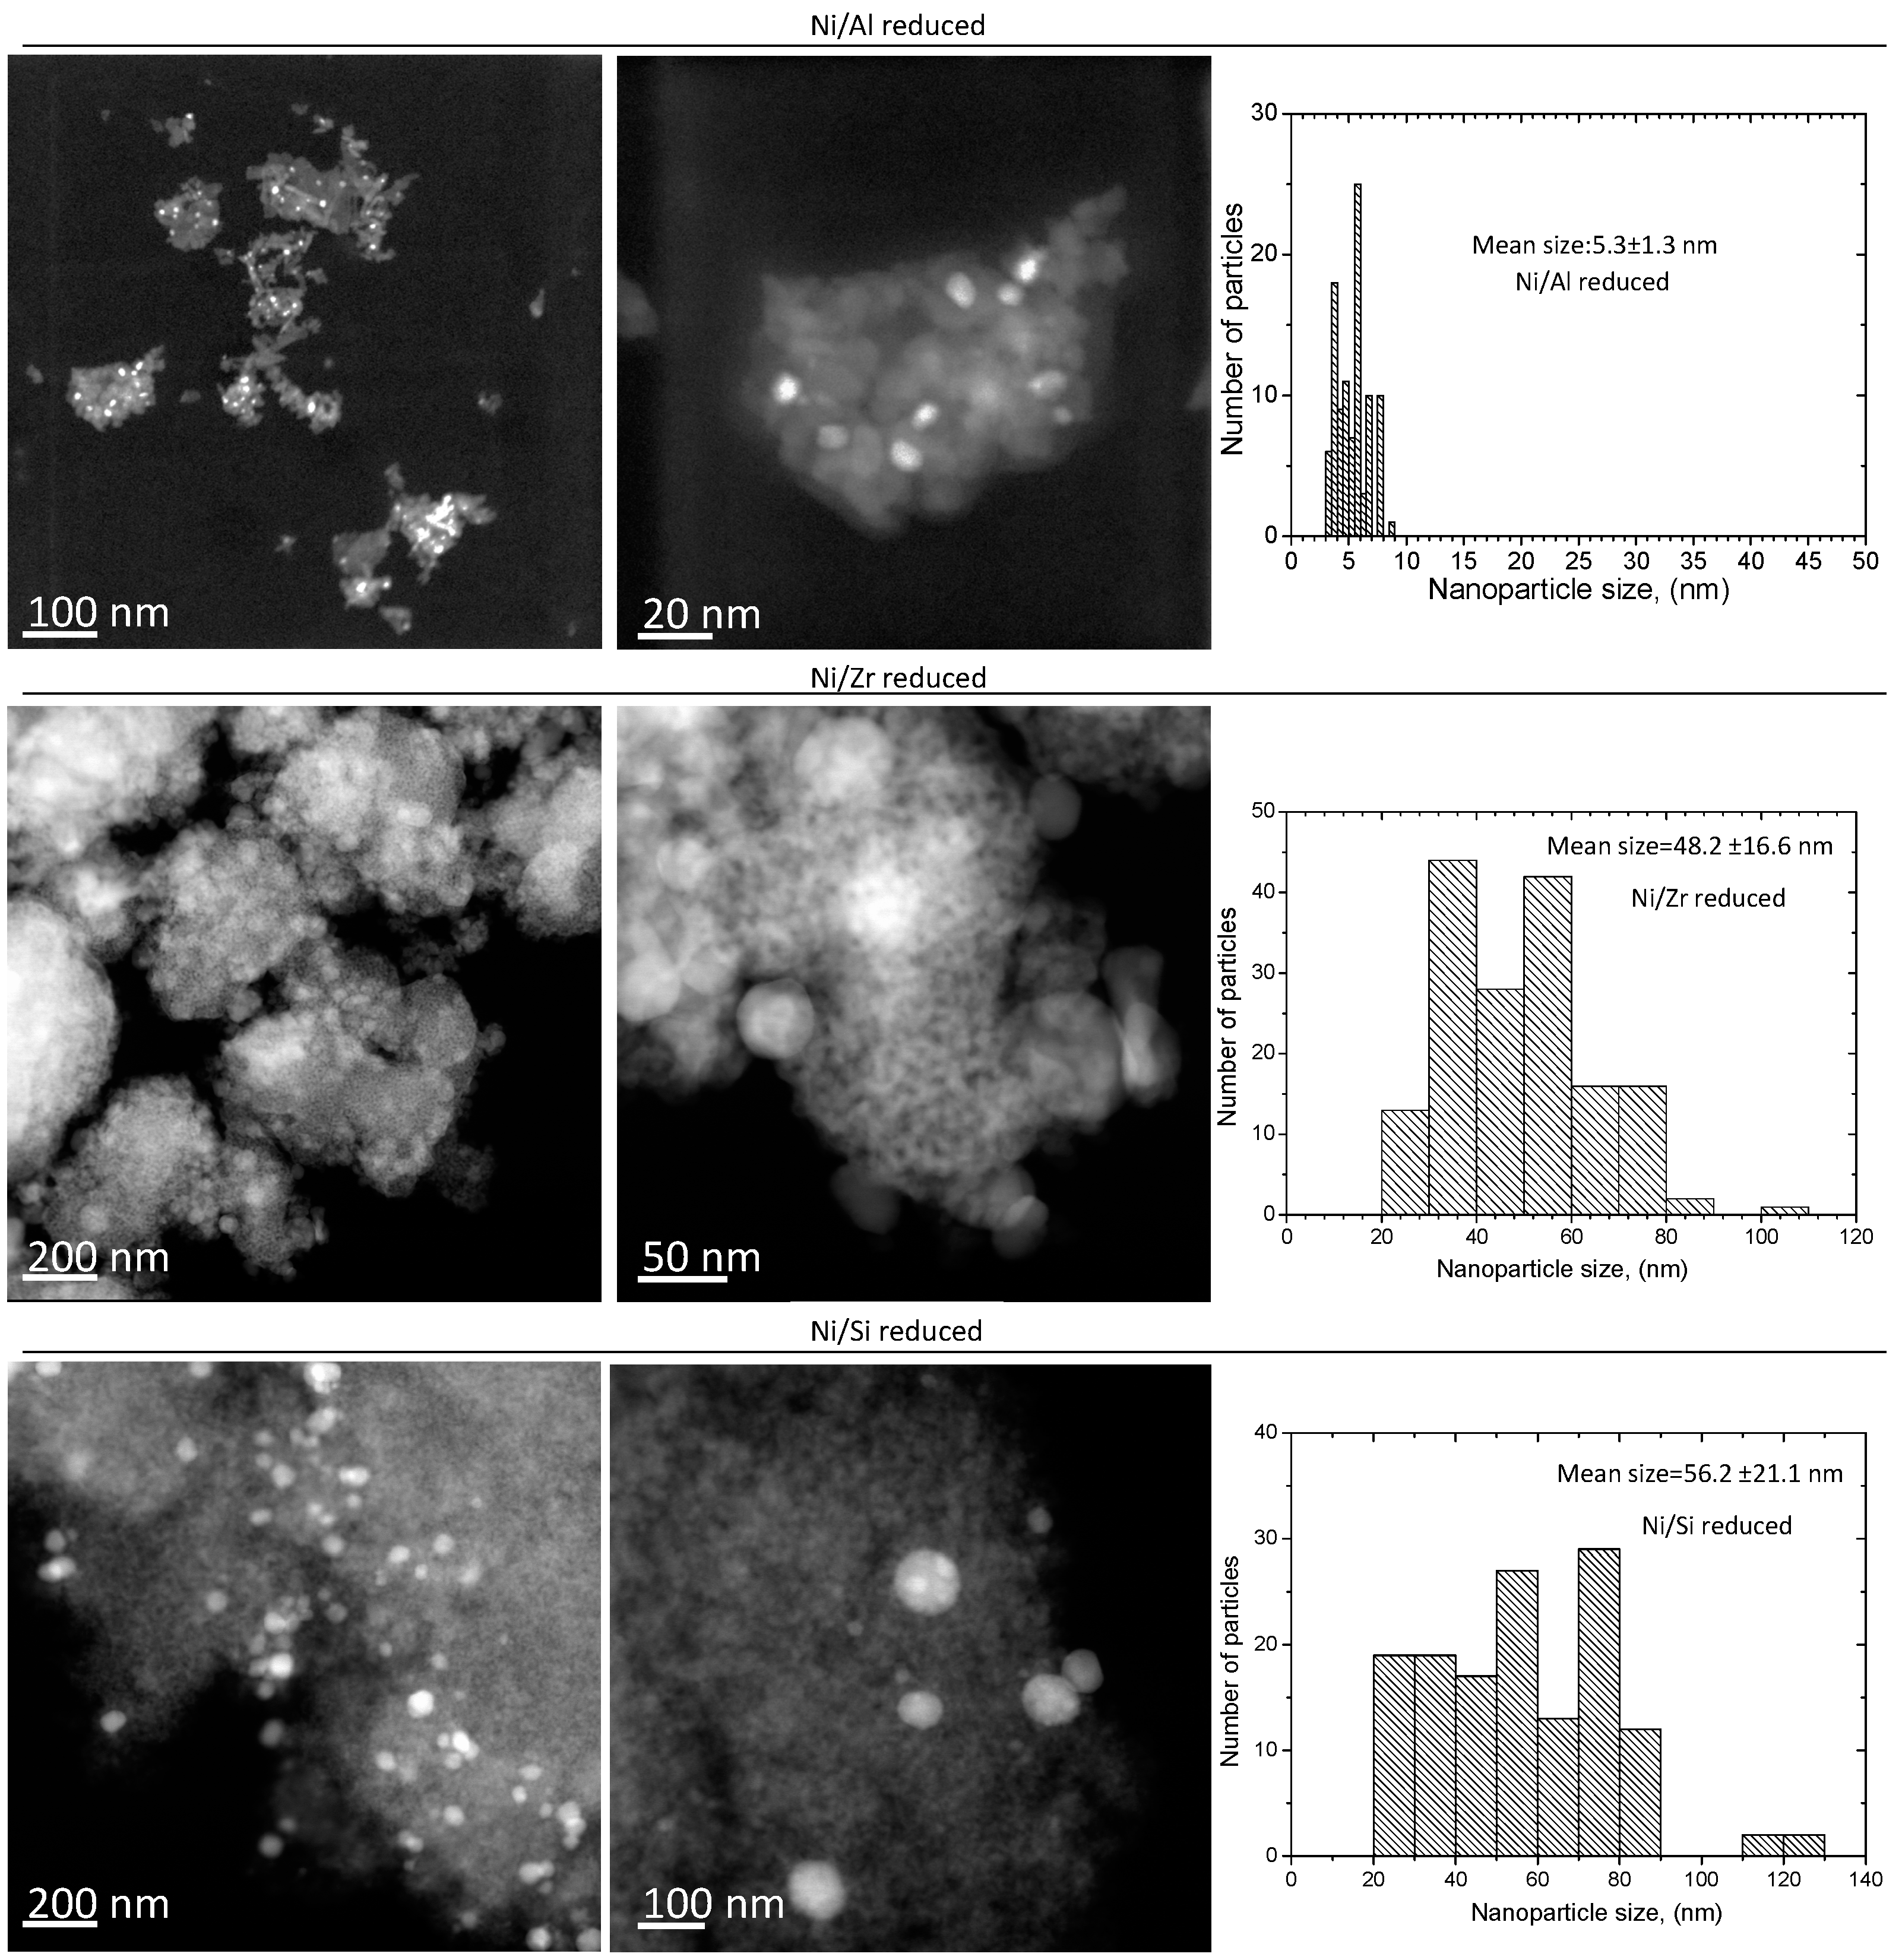
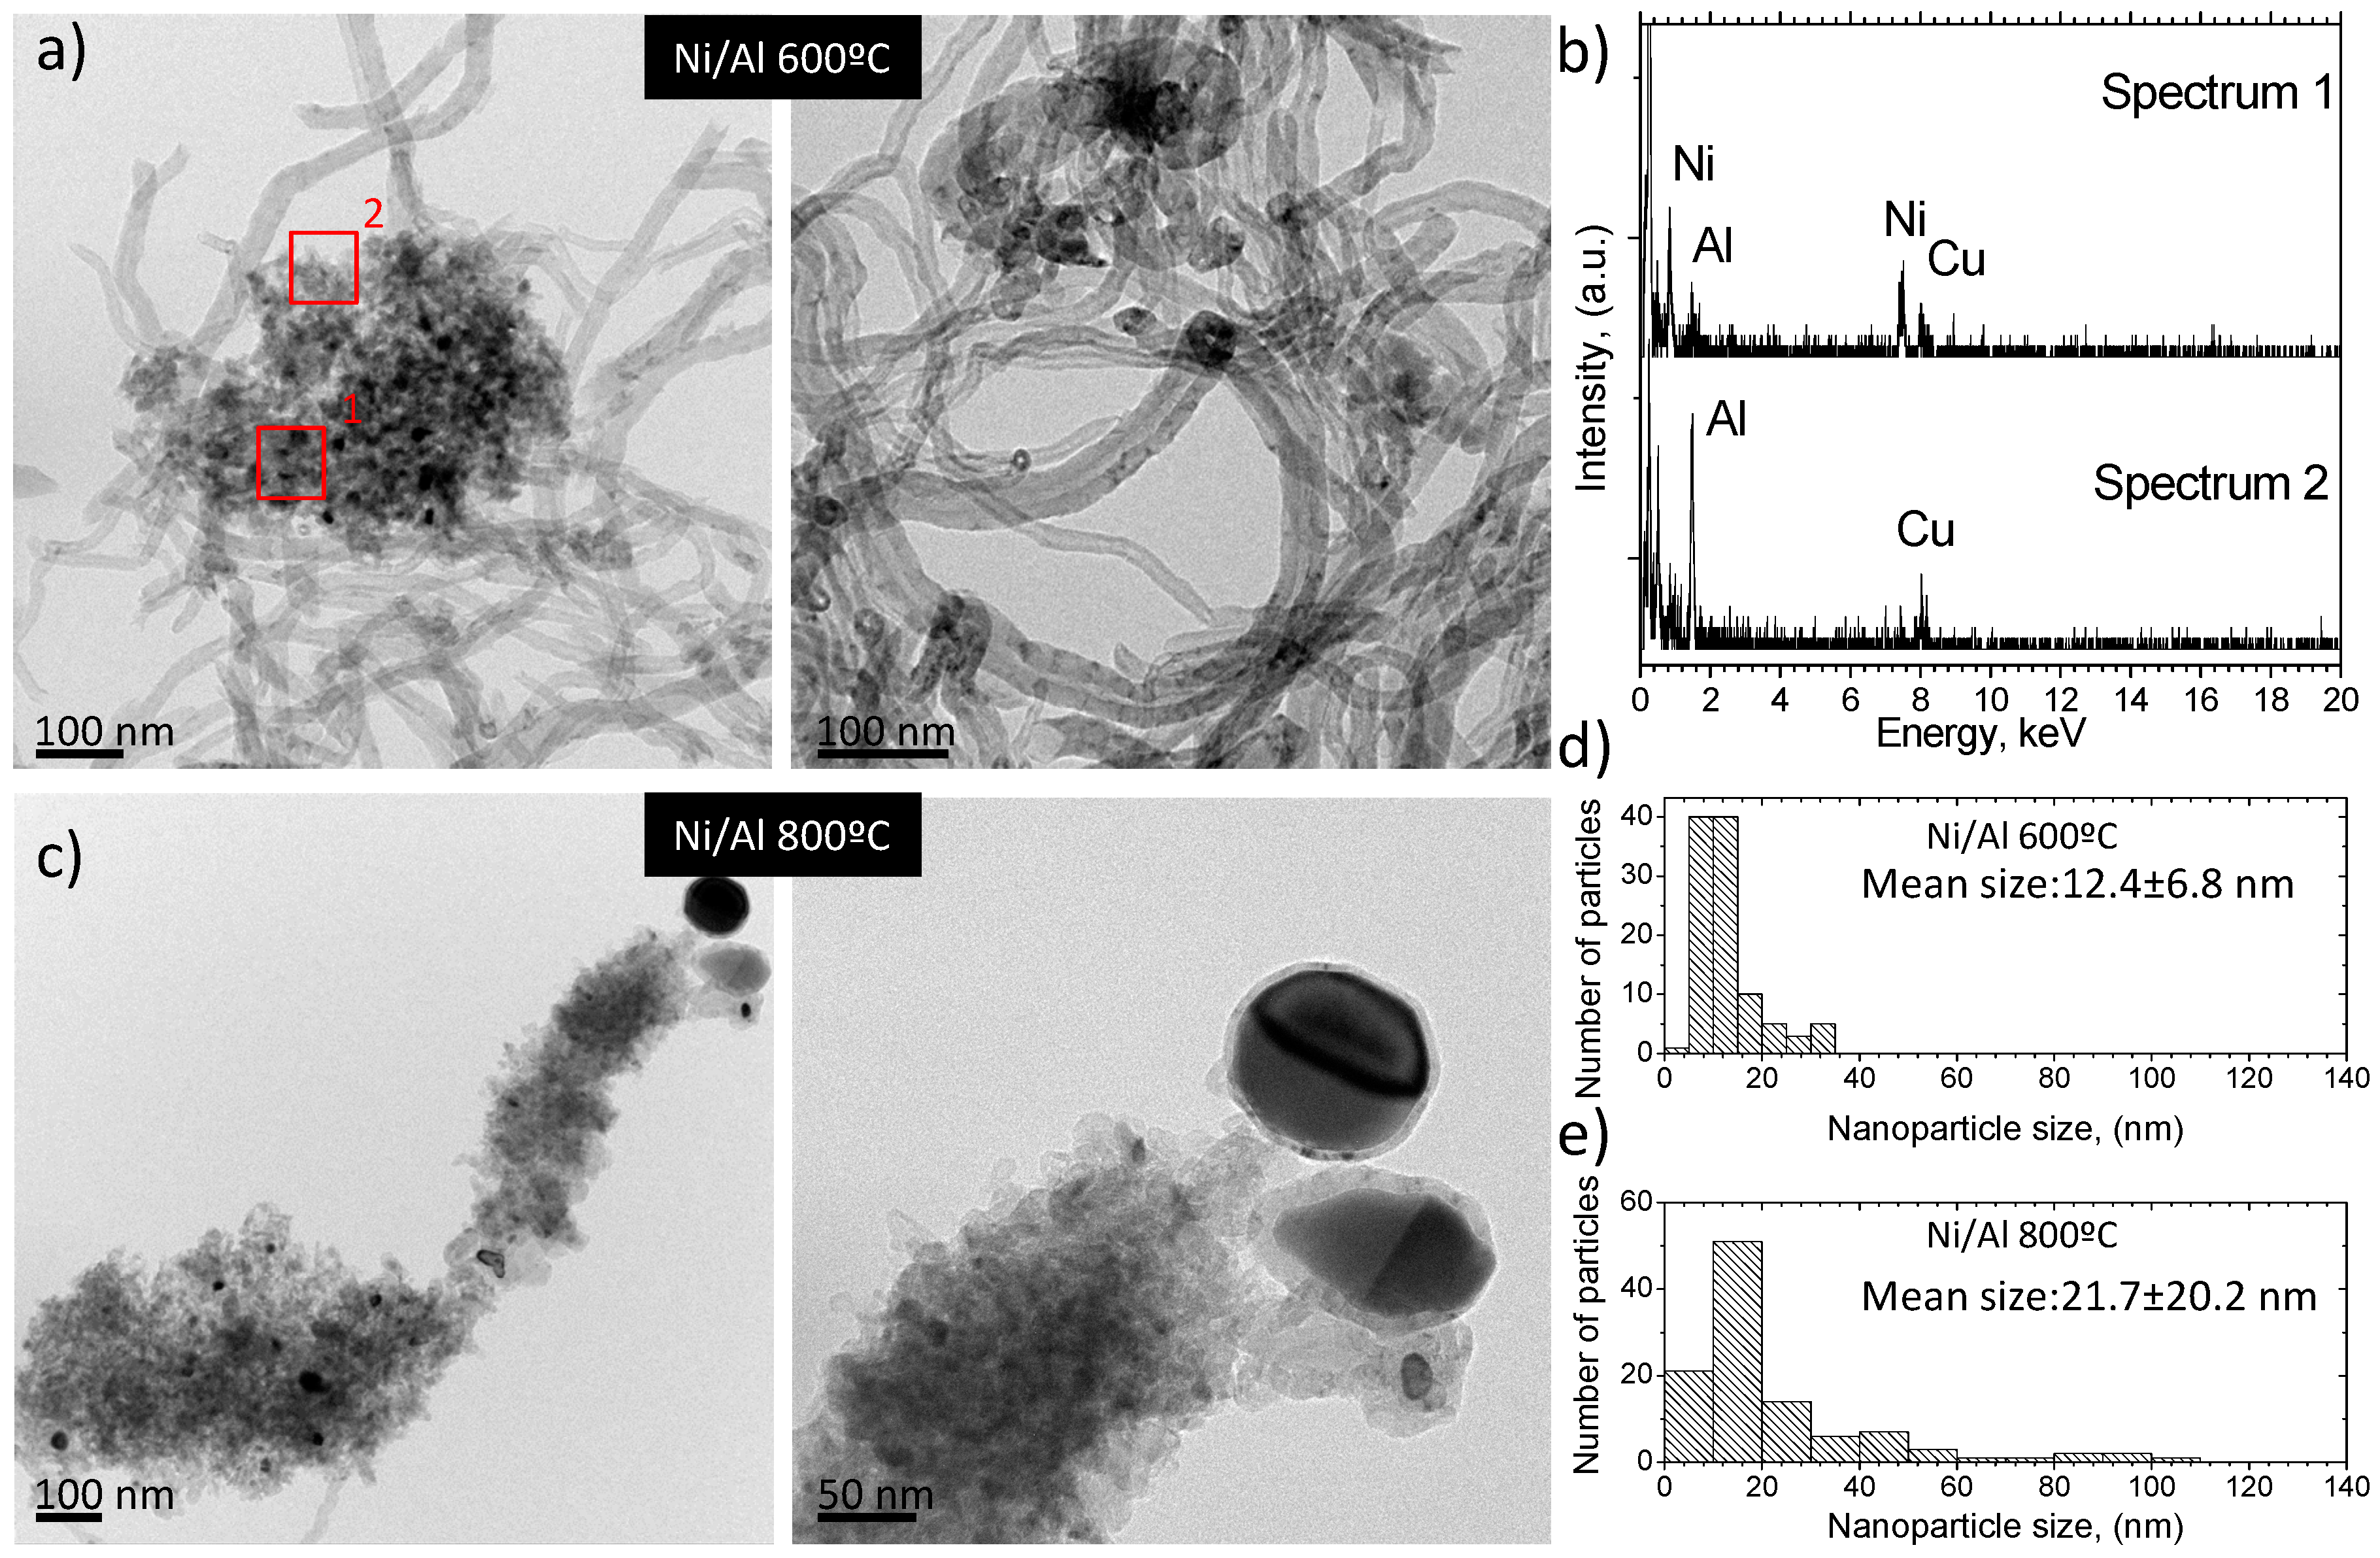
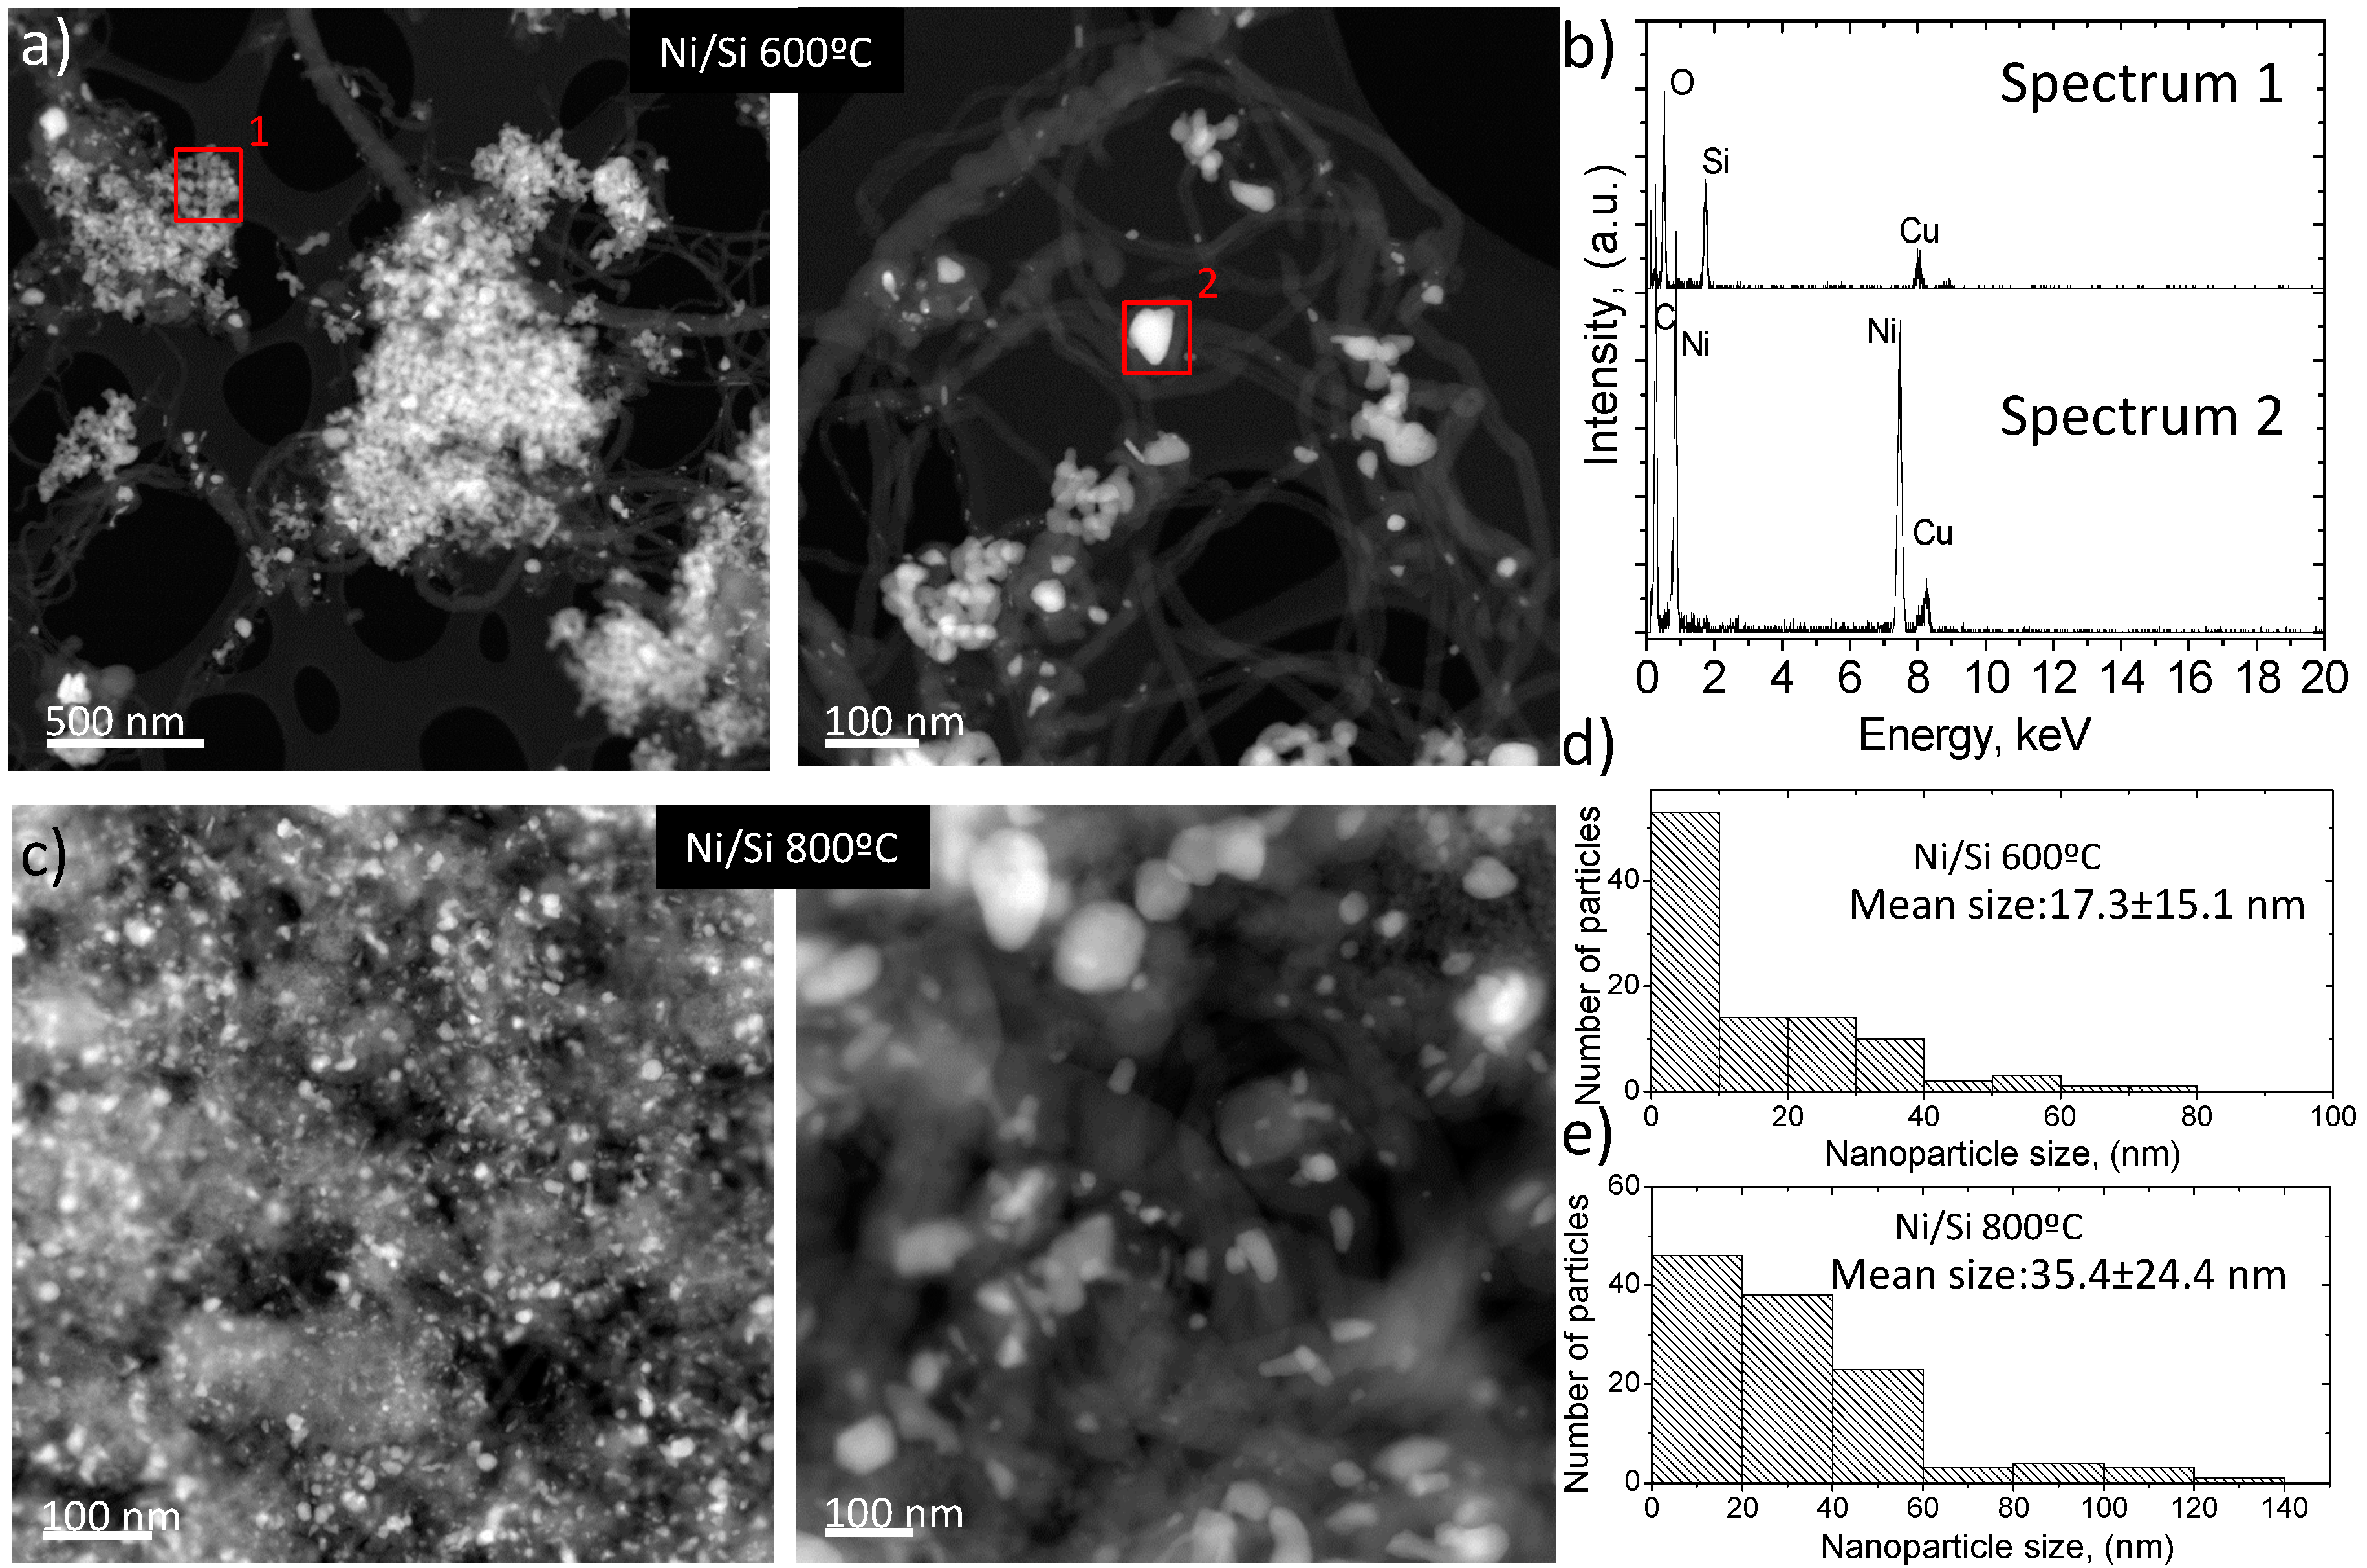
2.2.3. Electron Microscopy Analysis
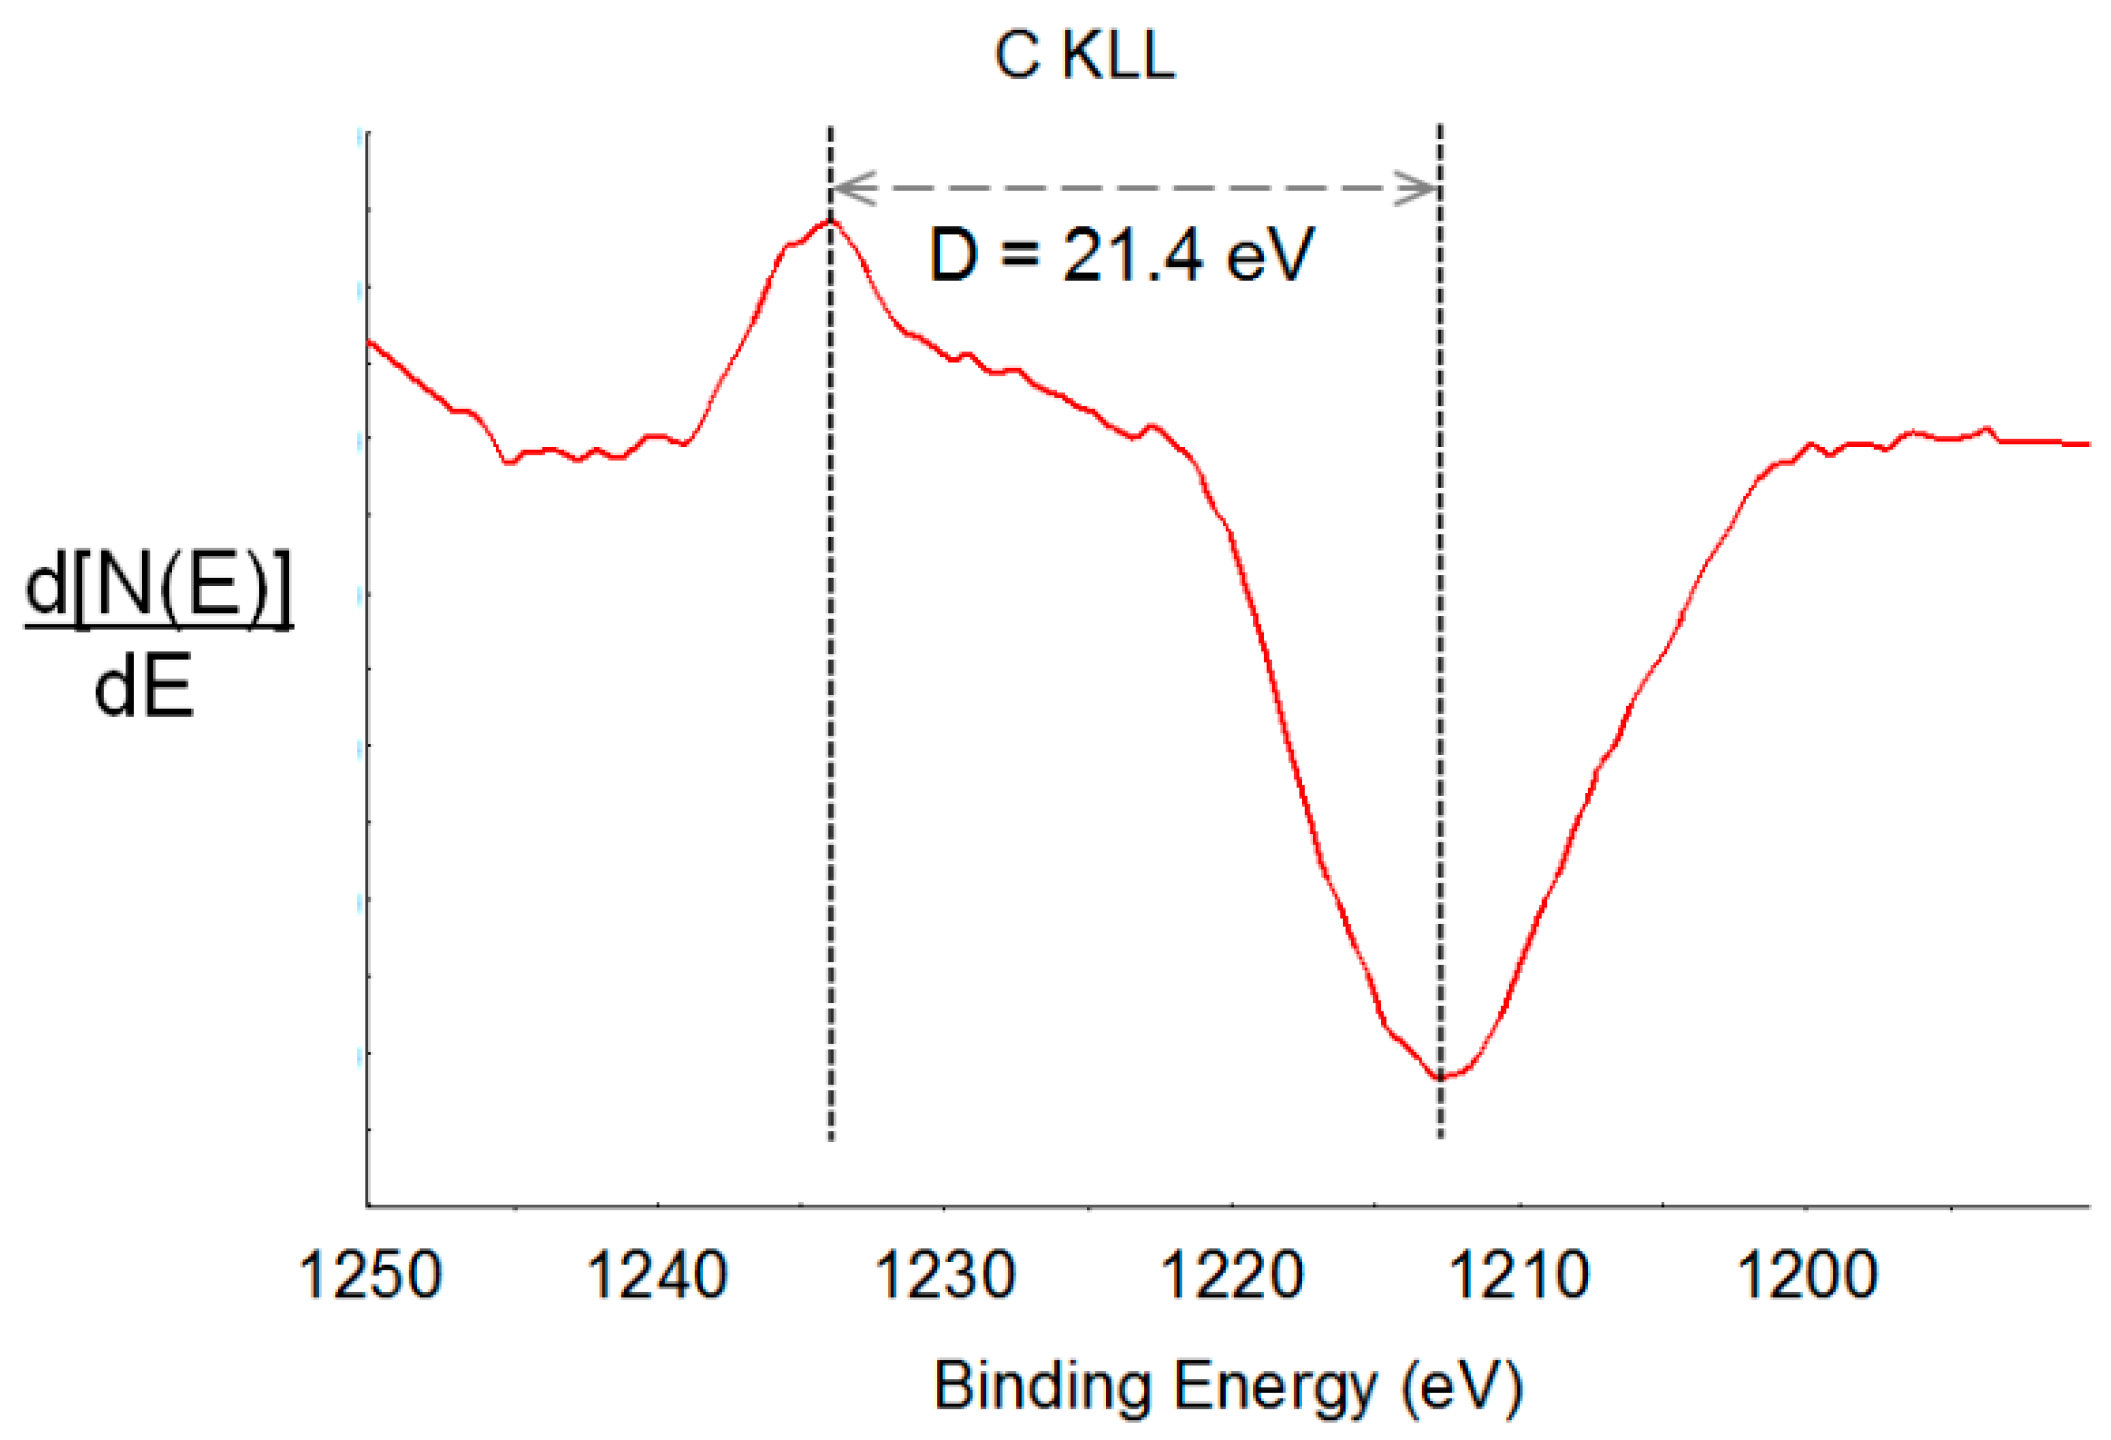
Figure 3 presents the STEM-HAADF images of the Ni/Al, Ni/Zr, and Ni/Si reduced catalysts, as well as, the corresponding particle size distribution histograms. For all three systems, the Ni nanoparticles show a pseudo-spherical morphology and a near uniform distribution on the respective supports. Moreover, it is clear that much smaller Ni particles formed on the Ni/Al system in comparison to the other two catalysts. As mentioned previously, the mean particle size of the reduced catalysts was calculated at 5.3 nm (± 1.3 nm), 48.2 nm (± 16.6 nm) and 56.2 nm (± 21.1 nm) for the Ni/Al, Ni/Zr and Ni/Si, respectively. The relatively large particle size of the latter catalysts can be attributed to the high Ni surface loading observed for these samples (XPS measurements) and the ease of Ni sintering during the calcination and reduction steps [57].
Figure 4, Figure 5 and Figure 6 show electron microscopy images at different magnifications after a reaction at 600 and 800 °C, the corresponding EDS spectra, as well as the particle size distribution histograms for the Ni/Al (Figure 4), Ni/Zr (Figure 5) and Ni/Si (Figure 6). From the images, it is clear that crystalline carbon allotropes in the shape of carbon nanotubes have formed on all samples (for both temperatures that were investigated using electron microscopy). Moreover, Ni particles encapsulated within the CNTs can also be observed. For the Ni/Al catalyst, the mean Ni particle size following a reaction at 600 °C, increased to 12.4 nm (± 6.8 nm), which means that the Ni particles sintered quite substantially. Sintering was more severe following a reaction at 800 °C with the mean Ni particle size calculated at 21.7 nm (± 20.2 nm). However, although the Ni particles for the Ni/Al seem to retain their pseudo-spherical shape, a mixture of pseudo-spherical and rod-shaped particles can be observed for the Ni/Zr and Ni/Si catalysts. Surprisingly, for both Ni/Si and Ni/Zr, the mean Ni particle size of the spent catalysts is smaller than the reduced ones. A possible explanation is the melting and confining of Ni particles inside the carbon fibers, which then acts as a protective coating preventing them from sintering [57].

2.2.4. XPS Analysis

The XPS results for the Ni/Al, Ni/Si and Ni/Zr catalysts prior to the reaction have been reported previously [46]. For the Ni/Al spent catalyst, there are some clear trends as a function of the BDR reaction carried out at different reaction temperatures. Firstly, the C concentration at the surface progressively decreases from 93 at % (atomic %) at 600 °C to 66 at % at 750 °C (with no significant change between 750 and 800 °C). This drop in C concentration is accompanied by progressive increases in the Al, O and Ni concentrations from 600 to 750 °C, with the Al increasing from 1 at % to 12 at %, O increasing from 6 at % to 21 at % and Ni increasing from < 0.1 at % to 0.3 at % respectively. Furthermore, there is a progressive increase in the intensity of the Ni metal peak (at 852.9 eV) compared to the Ni oxide peak (856.5–857.1 eV) in the Ni 2p spectra with increasing temperature and a progressive shift of the Ni oxide peak to higher binding energies, associated with an increase in the oxidation state of Ni in the oxide.
The behavior for the Ni/Si and Ni/Zr spent catalysts is generally different as the temperature increased from 600–800 °C. For both catalysts, the C concentration increases with temperature, there being a substantial change in the C concentration at 600 °C compared to that at 700 and 800 °C. For Ni/Si, the C concentration increases from 8 at % at 600 °C to 35–40 at % at 700/800 °C. For Ni/Zr, the C concentration increases from 30 at % at. 600 °C to 73–77 at % at 700/800 °C. There were corresponding drops in the O concentration for both catalysts with increasing temperature. For the Ni/Si catalyst, the O/Si ratio remained between 2.0 and 2.1 for over the 600–800 °C temperature range. The Ni/Zr catalyst however showed an increase in the O/Zr with the increasing temperature. For the Ni/Si catalyst, there was no significant change in the Ni concentration with the temperature, being 0.1–0.3 at % over the temperature range. At all temperatures, the Ni metal peak showed a higher intensity than the Ni oxide peak. For the Ni/Zr catalyst, the Ni concentration decreased with increasing temperature from 2 at % at 600 °C to 0.6–0.7 at % at 700/800 °C. The Ni metal peak was evident at all temperatures and the Ni metal/Ni oxide peak intensity ratio remained similar over the temperature range, but there was a slight decrease in this ratio with the increasing temperature.
With regard to the form of the carbon deposited at the surface, the use of the D-parameter from the differentiated X-ray excited C Auger KLL peak has been shown to be a reliable measure of the sp2/sp3 ratio [58]. In this method, the binding energy difference between the most positive maximum and most negative minimum of the first derivative of the X-ray excited C Auger KLL spectrum is measured [58,59]. Figure 7 shows the D-parameter measured on the C KLL peak for the Ni/Al catalyst at a reaction temperature of 700 °C. The D-parameter values as a function of the reaction temperature of the Ni/Al catalyst are given in Table 1. There is a progressive increase in the D-parameter as the reaction temperature is raised. The higher the D-parameter value, the greater the sp2 content [58]. Consequently, as the reaction temperature increased, the deposited carbon exhibited a progressively higher sp2 content.

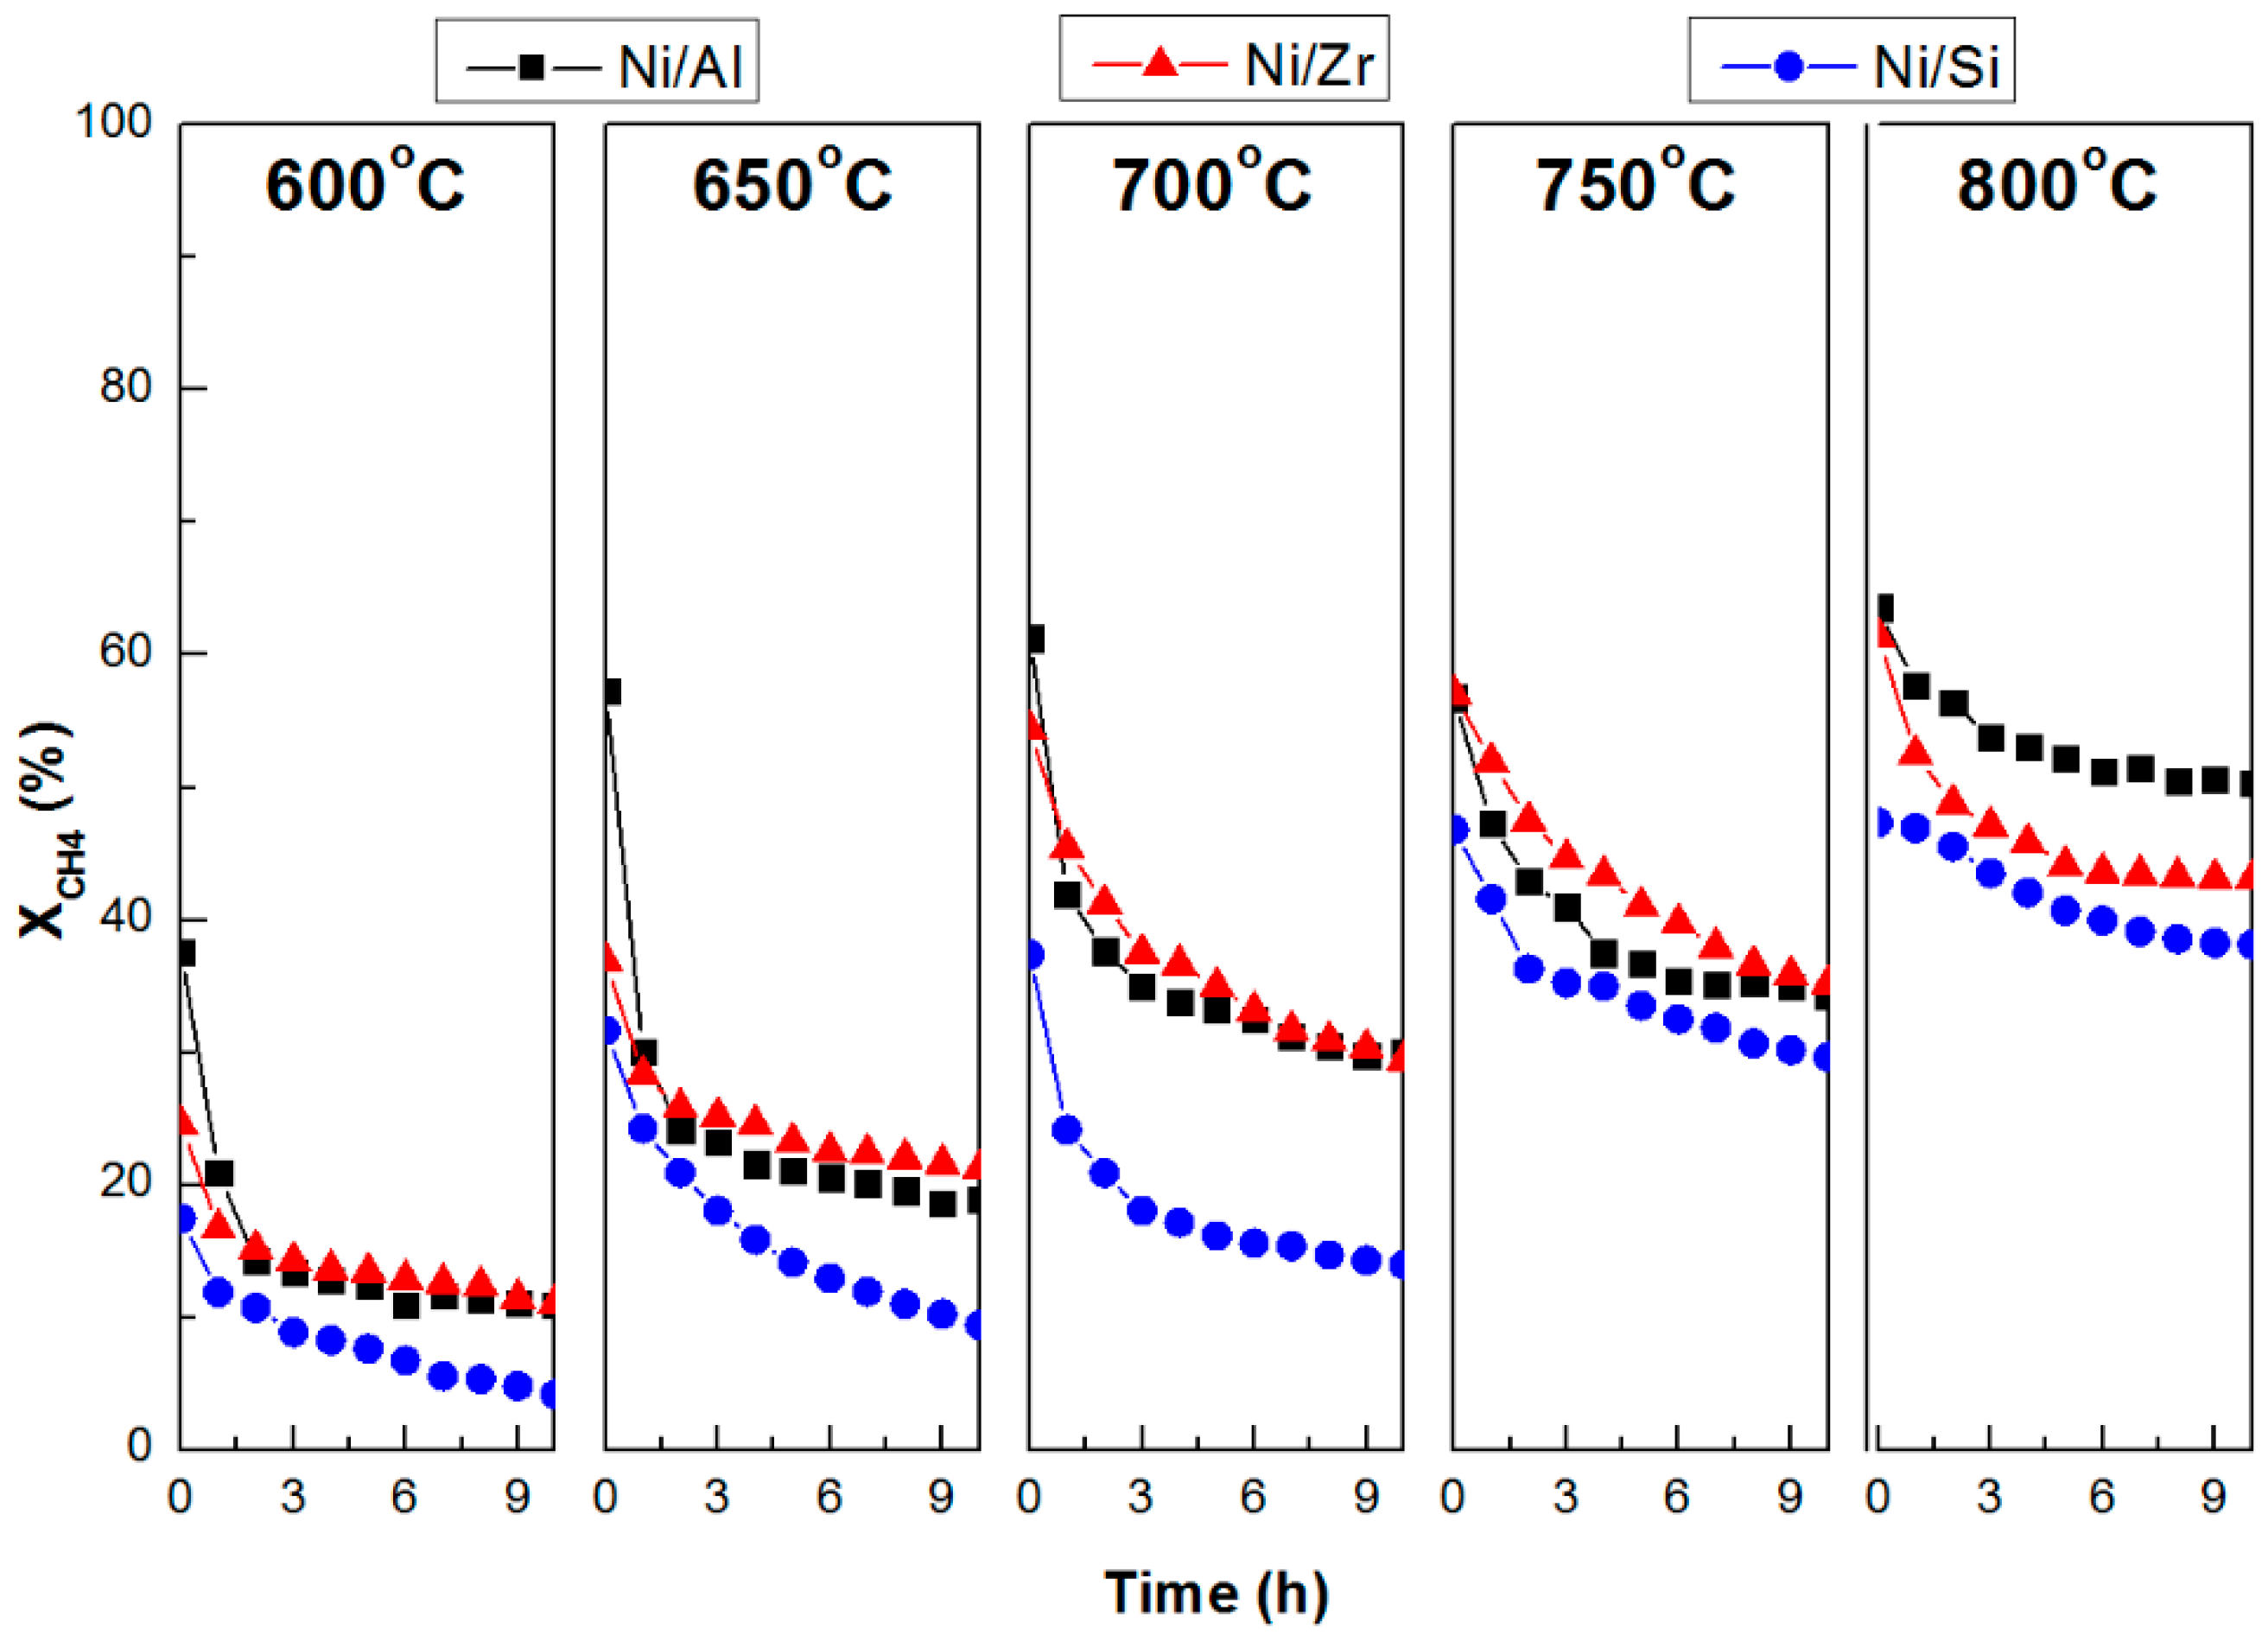
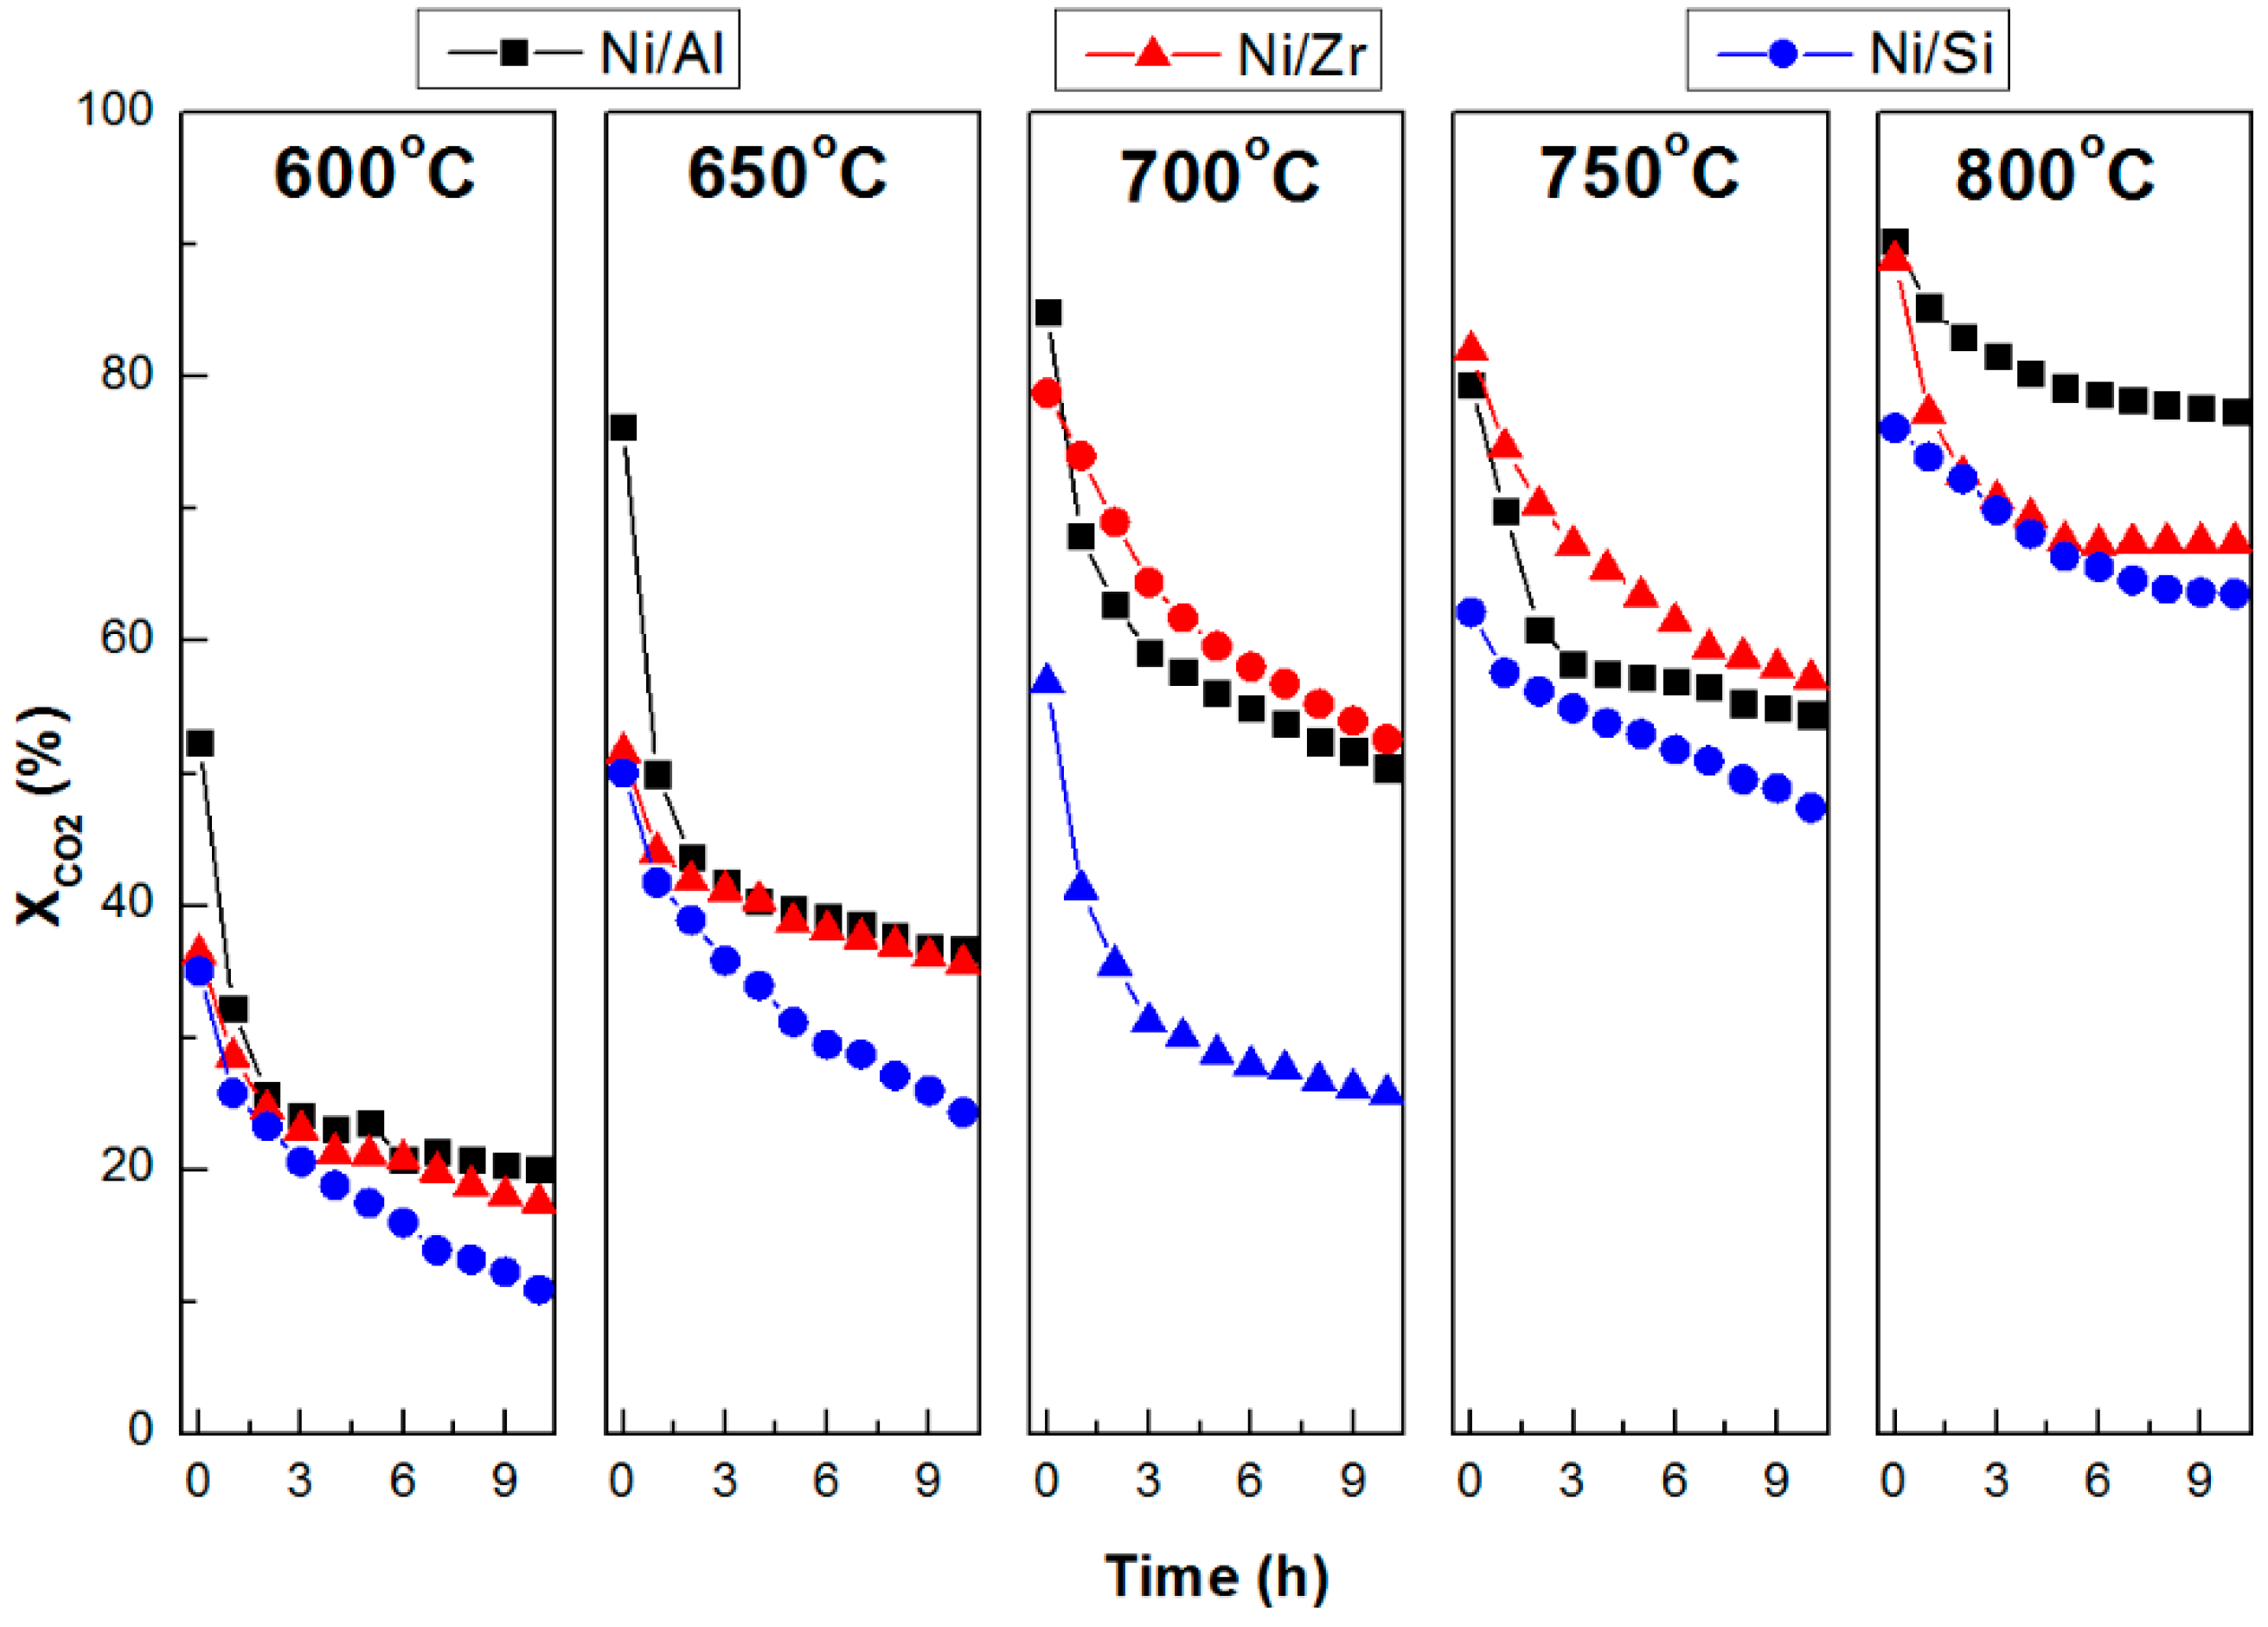
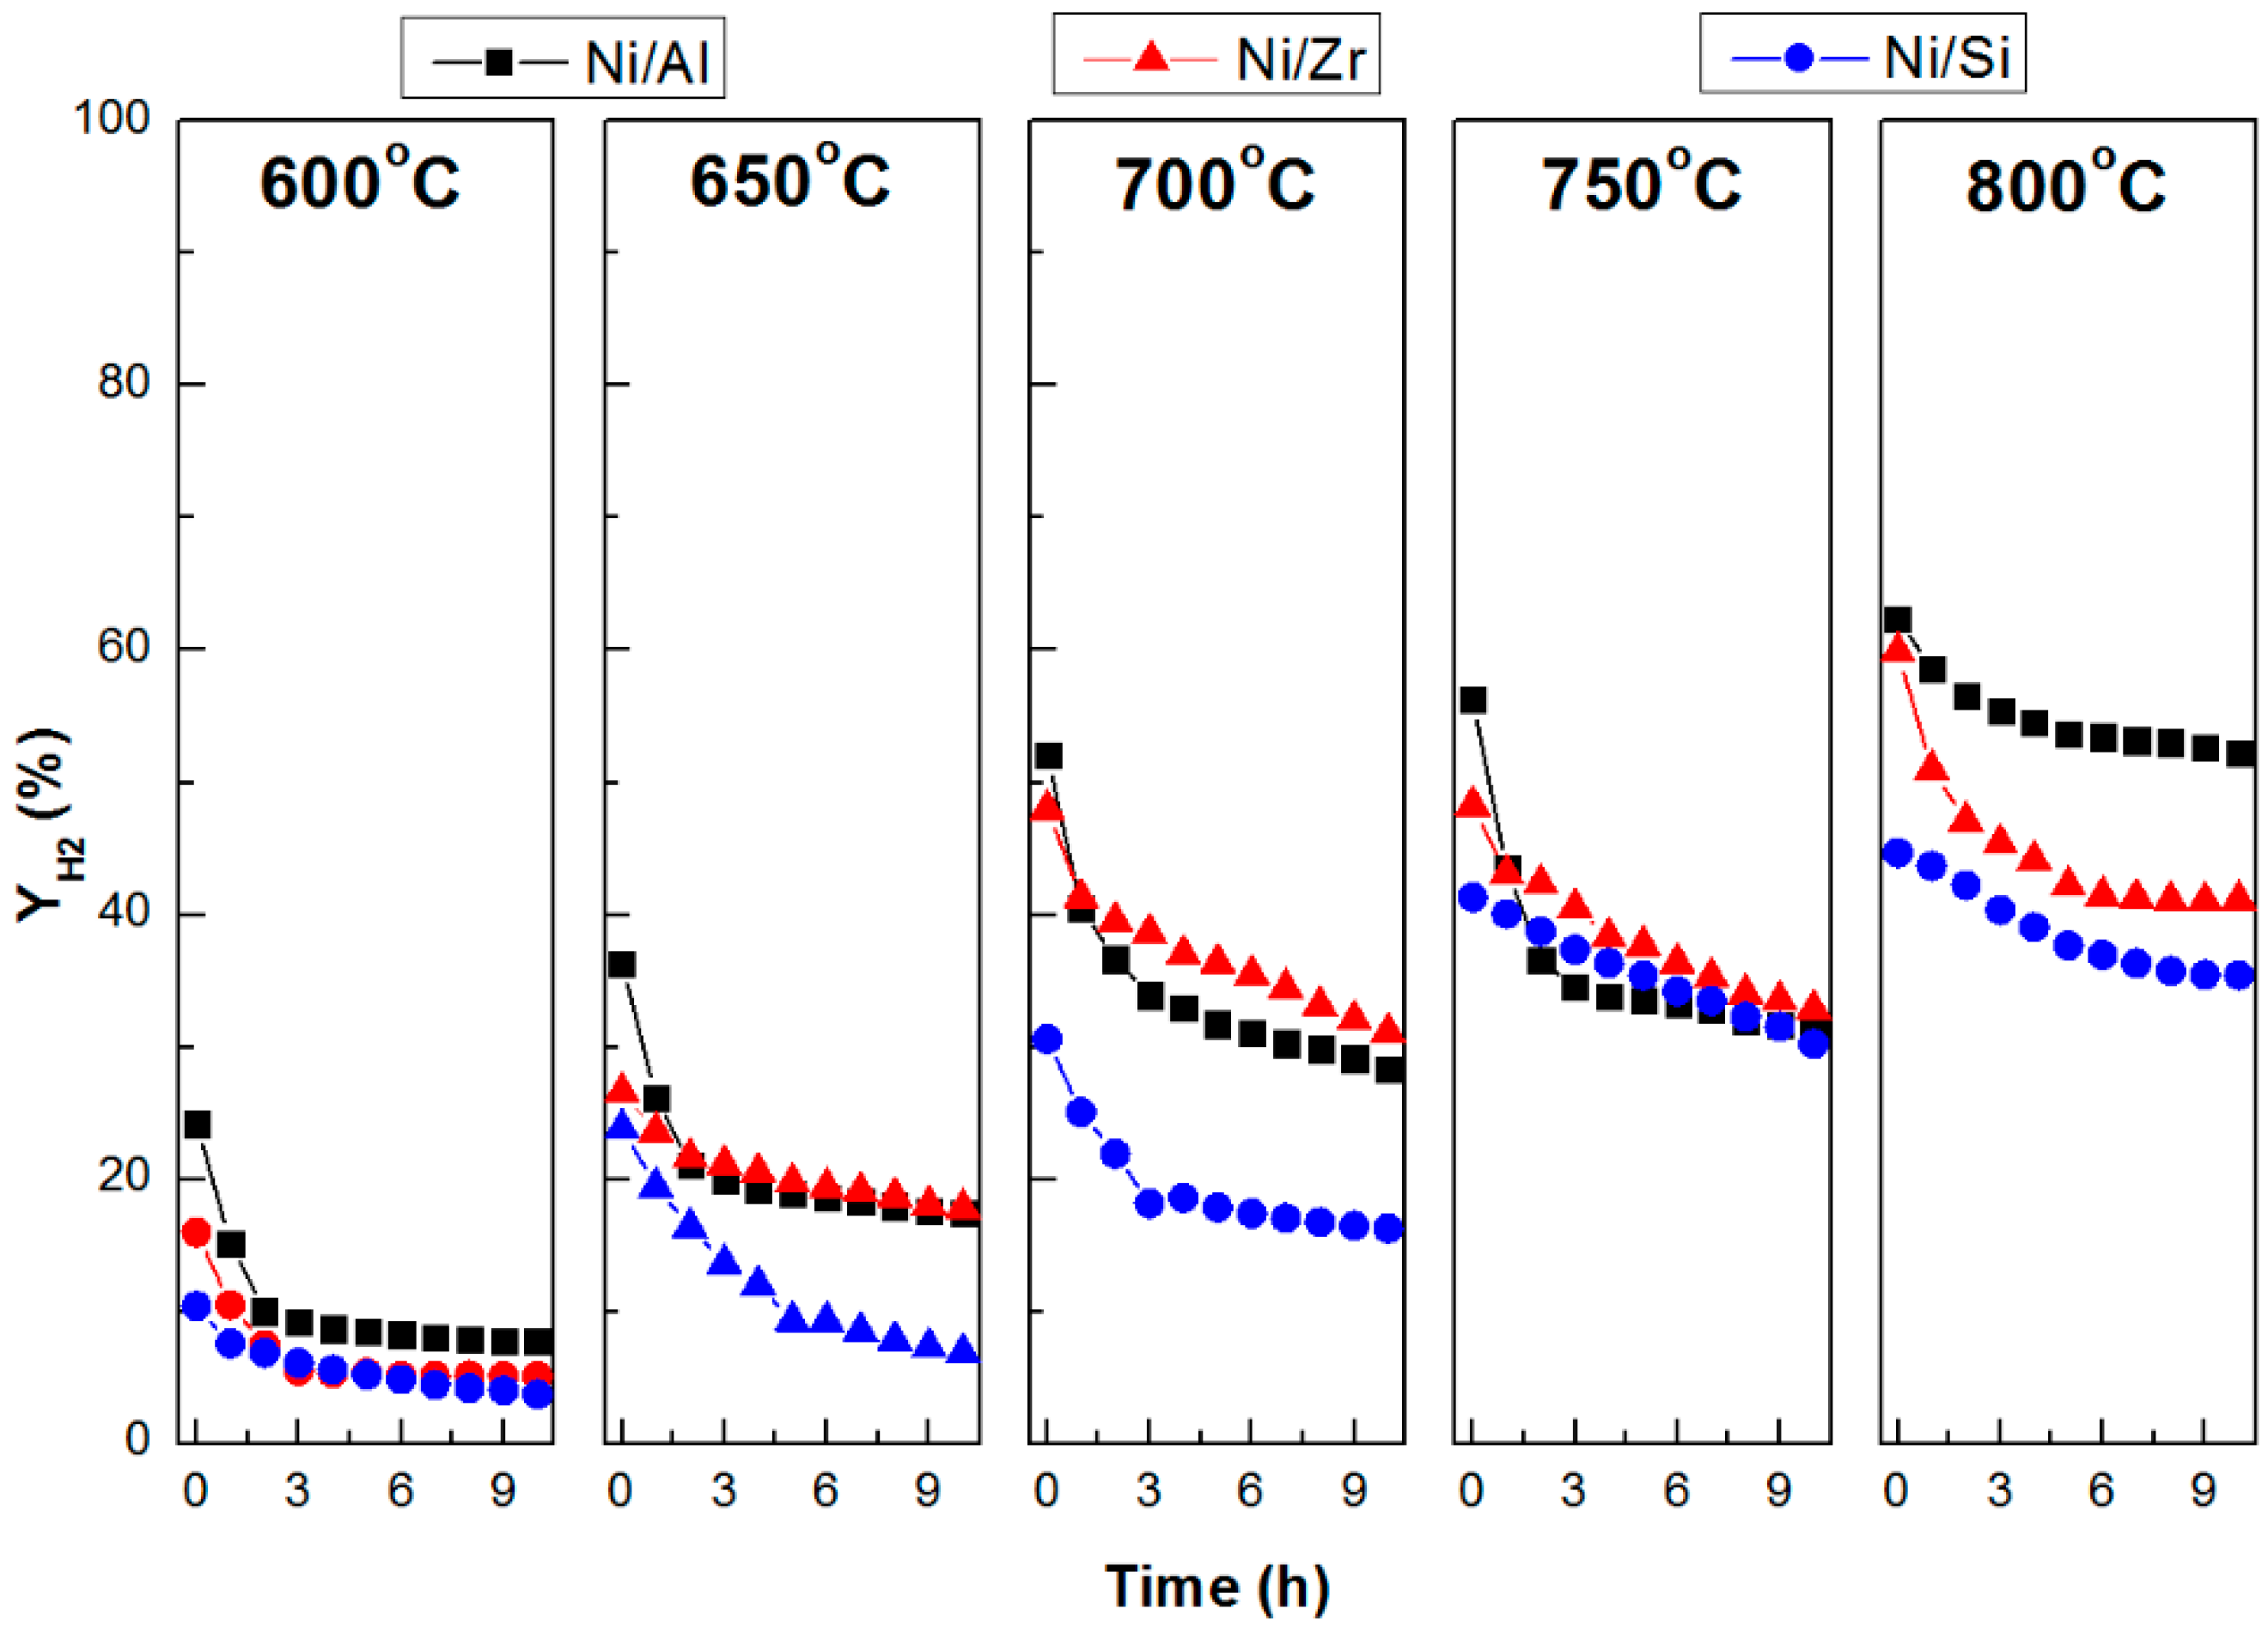
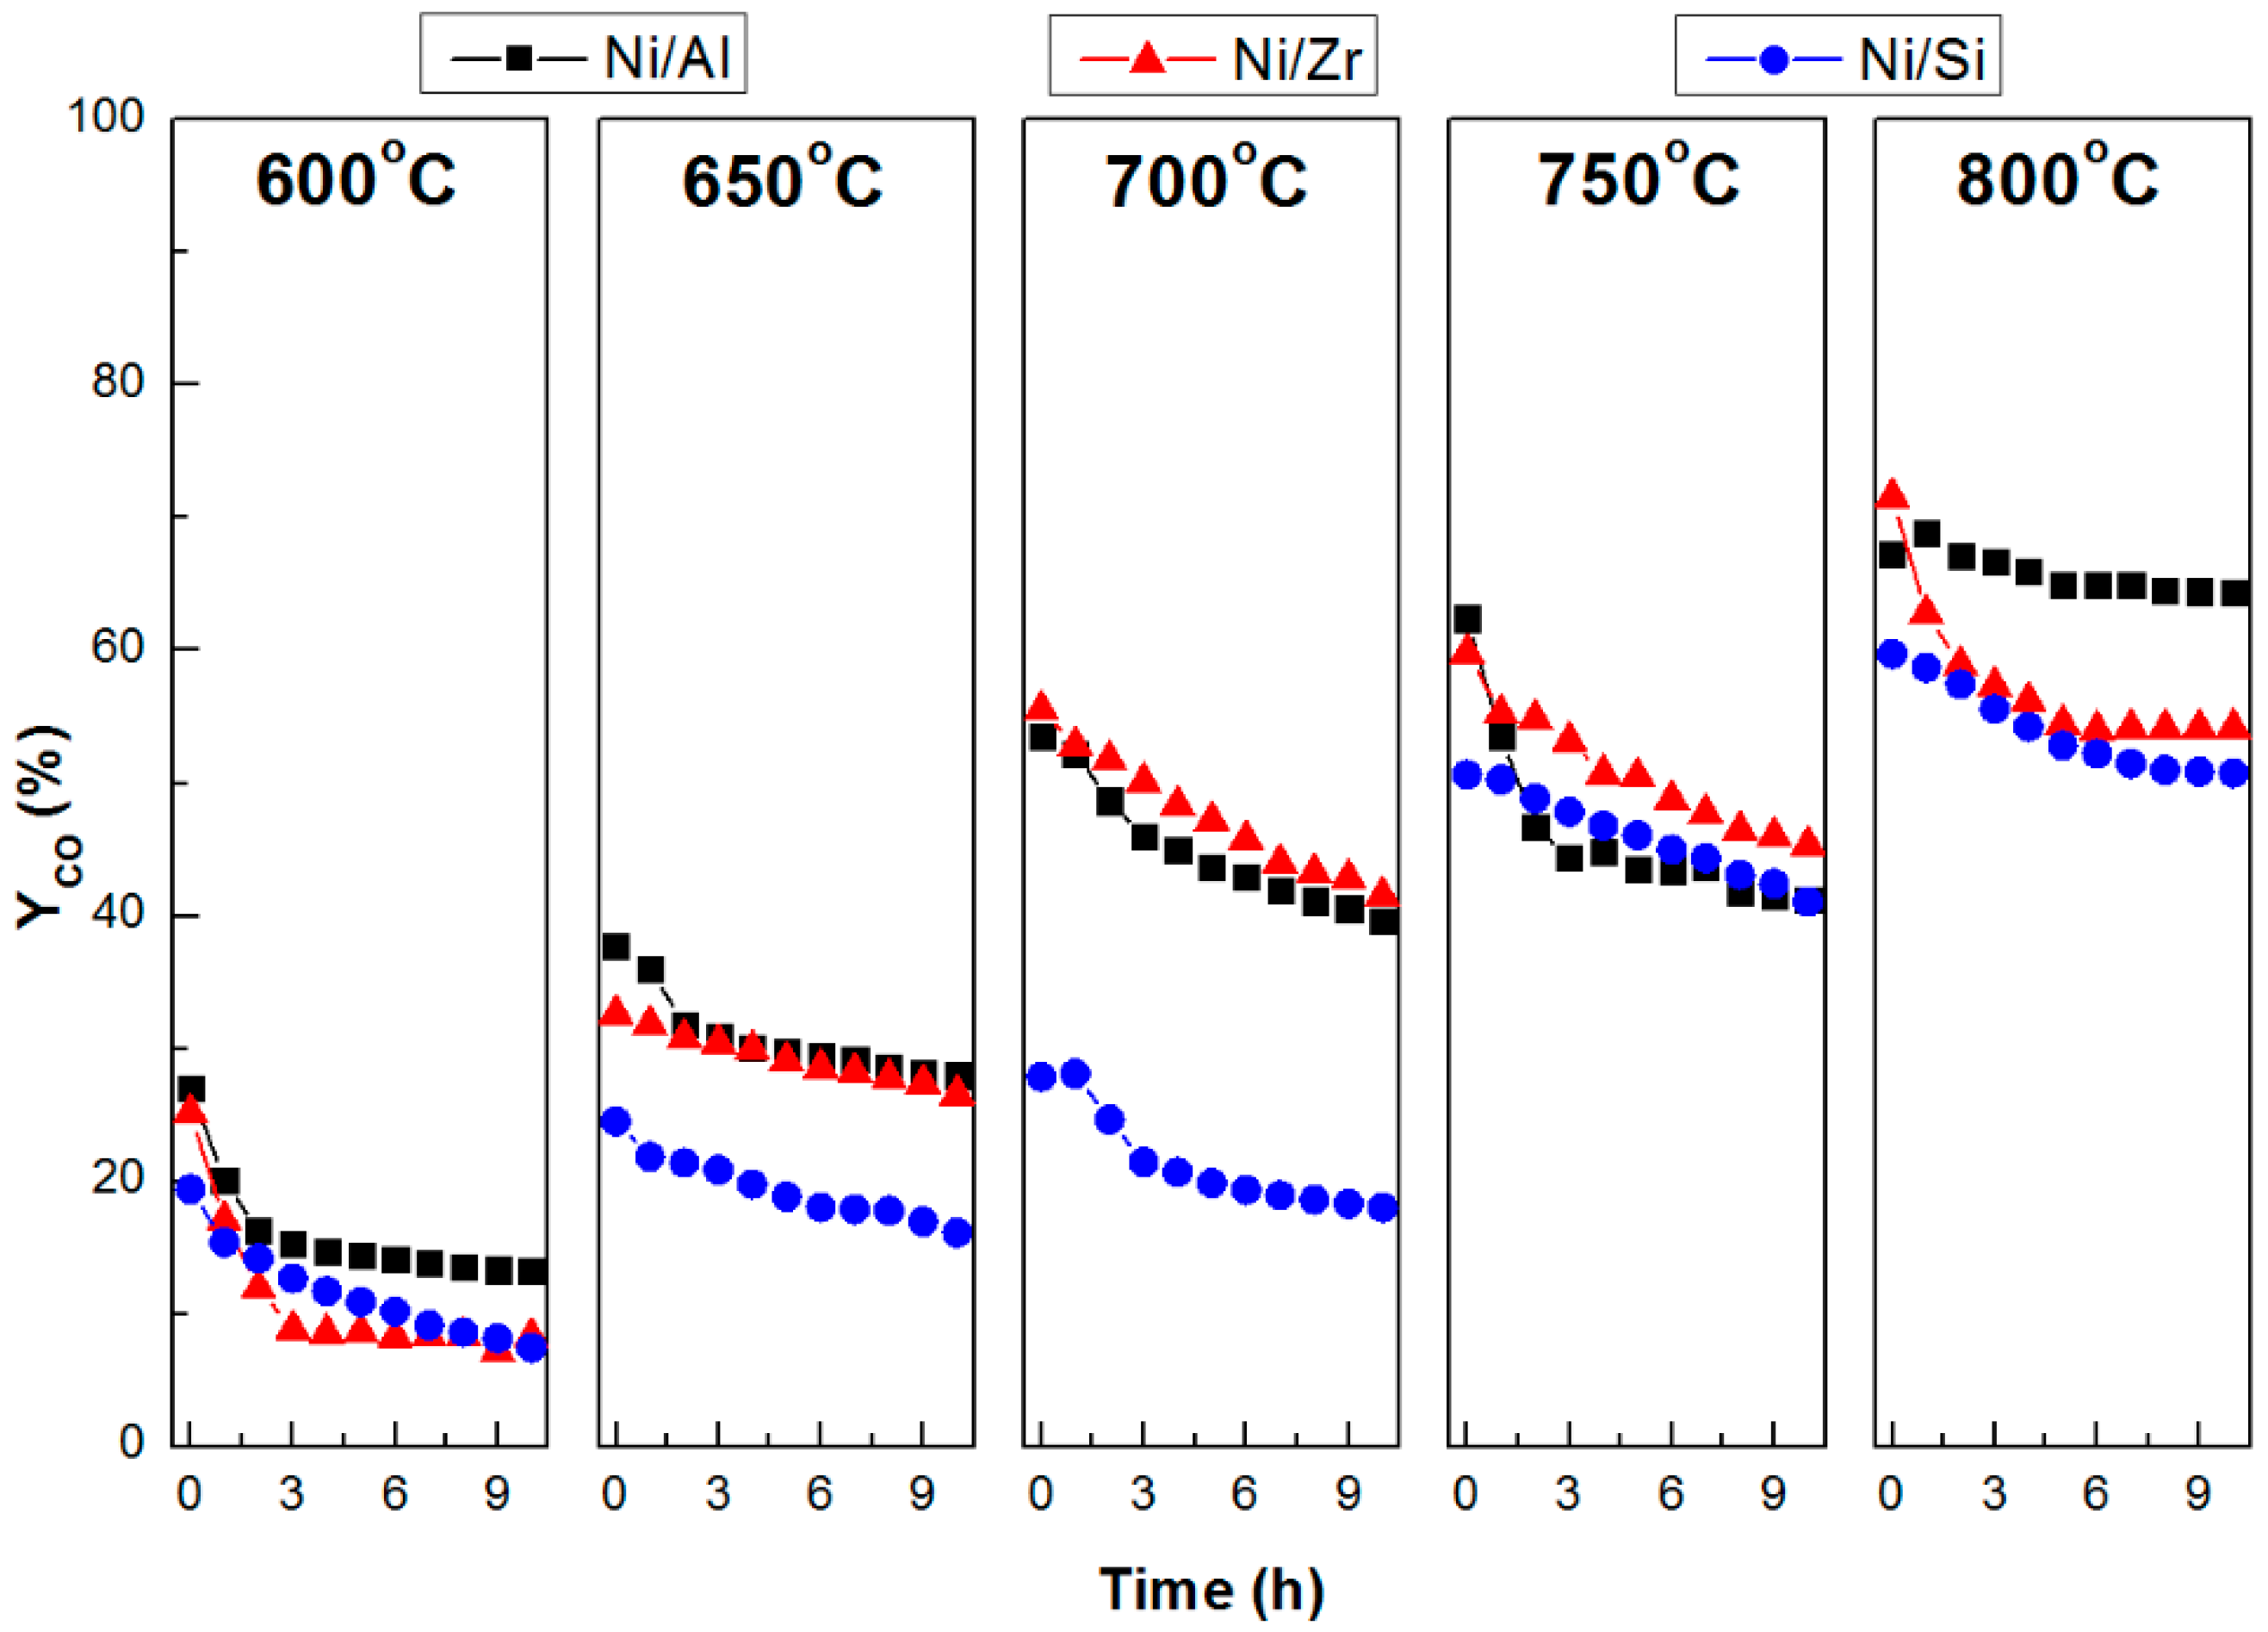
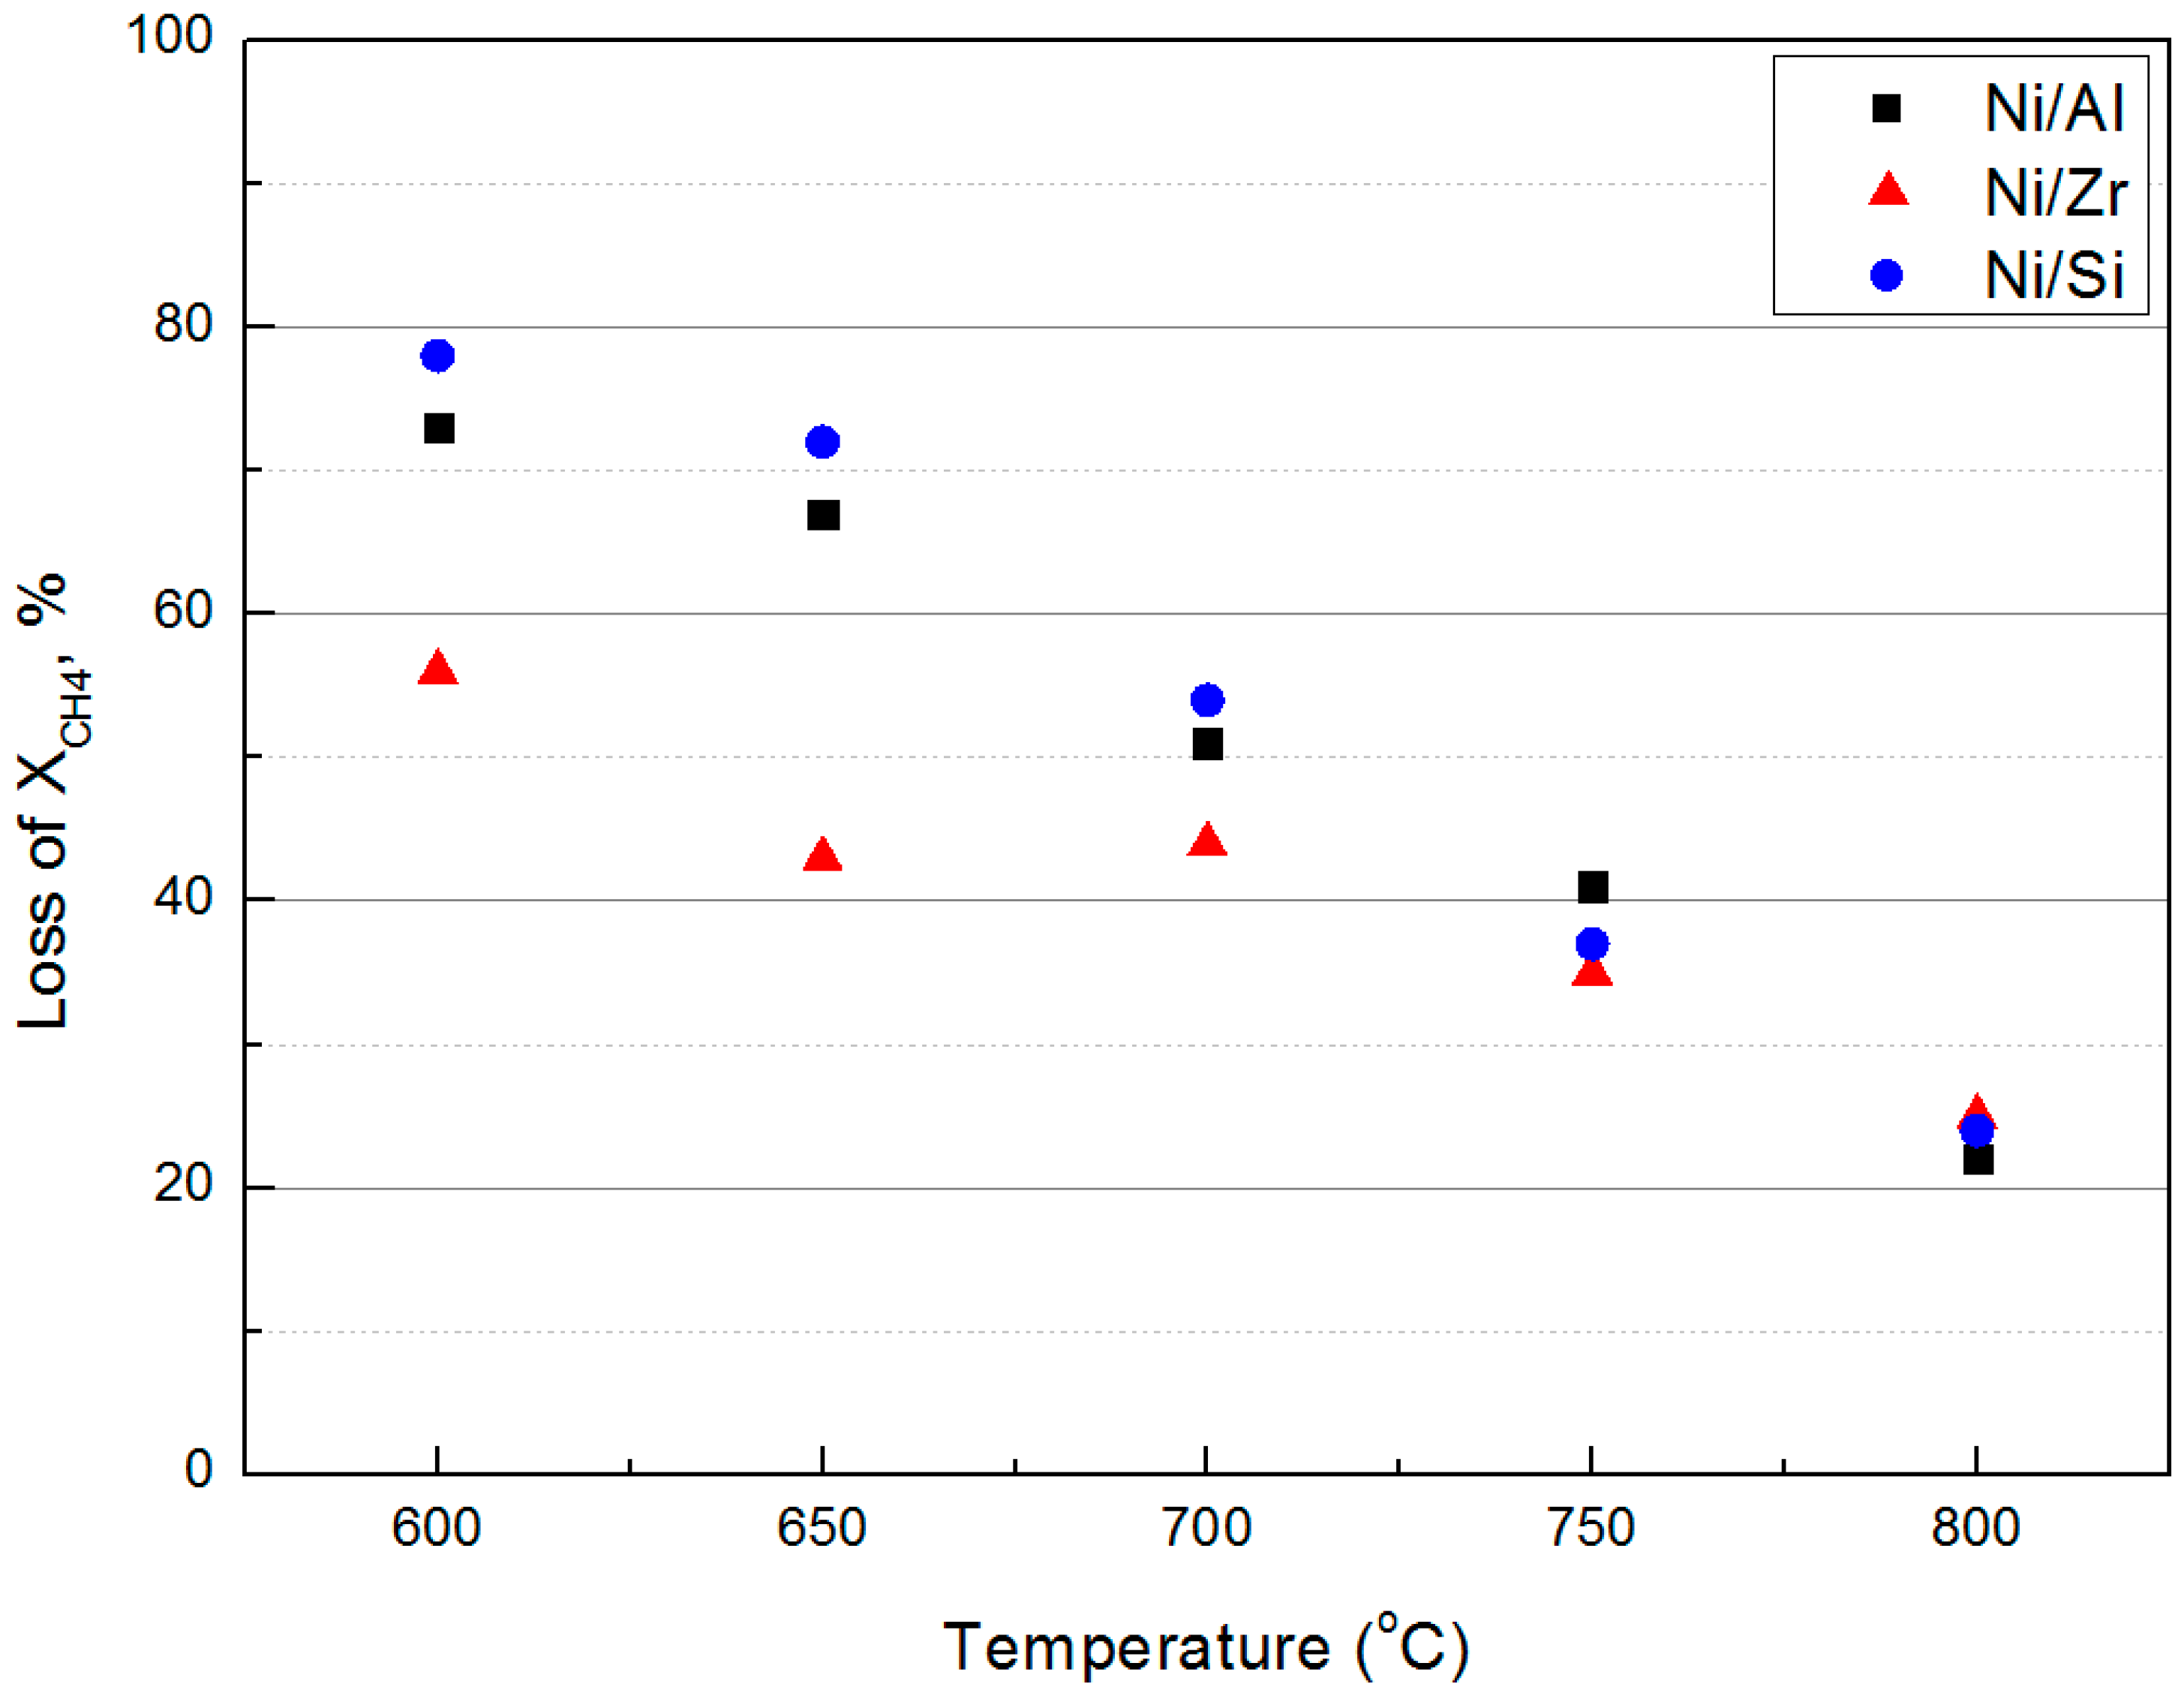
2.3. Catalytic Stability

As briefly stated above, catalytic stability during the BDR was investigated by carrying out a series of short (10 h) time-on-stream experiments at different reaction temperatures (600, 650, 700, 750 and 800 °C) using a fresh catalytic sample for each test. The weight hourly space velocity (WHSV) was kept constant at 40,000 mL g−1 h−1 and catalyst activation was carried out in situ, under a pure H2 flow, prior to the commencement of each new experiment. The results obtained are presented in Figure 8, Figure 9, Figure 10, Figure 11 and Figure 12. Specifically, Figure 8 presents the variation to the conversion of methane (XCH4, %), Figure 9 the variation to the conversion of carbon dioxide (XCO2, %), Figure 10 the variation to the hydrogen yield (YH2, %), Figure 11 the variation to the yield of carbon monoxide (YCO, %) and Figure 12 the percentage loss of activity in terms of CH4 conversion ((Xinitial − Xfinal/Xinitial) × 100).
As a first observation, the endothermic nature of the BDR reaction means that a rise in the reaction temperature results at increased conversion and yield values for all catalytic systems (Figure 8, Figure 9, Figure 10 and Figure 11). Moreover, for all metrics under investigation, the drop in the recorded values is very sharp within the 2–3 h of time-on-stream. Following that, the recorded values drop at a much slower pace. This is particularly true for the lower reaction temperatures, as this initial drop at 750 and 800 °C is not as steep as between 600–700 °C. As mentioned above, catalyst deactivation is caused by two main factors, i.e., carbon deposition and metal particle sintering (although re-oxidation and hydroxylation of the active species can also affect catalytic stability [60,61]). The main reactions responsible for the formation of coke are the decomposition of methane Equation (3) and the decomposition of carbon monoxide (Boudouard, Equation 4). The former reaction (endothermic) is thermodynamically possible up to 870 °C [10], while the latter may take place only up to 675 °C [7]. Thus, the temperature window where extensive coke deposition was to be expected was between 600–675 °C. This was confirmed by the TGA results presented above, which showed that the amounts of carbon deposited on all catalytic systems tested herein decreased with an increase of the reaction temperature. It is also noted that the Raman measurements showed that increased reaction temperatures resulted in a decrease of the D/G ratio for all three catalysts. This conclusion was further corroborated by the XPS results, which showed that the deposited carbon exhibited a progressively higher sp2 content as the reaction temperature increased.
In terms of initial activity, the three catalytic systems tested herein, appear to follow the order Ni/Al = Ni/Zr > Ni/Si. For the Ni/Al, this can be understood on the basis of the much smaller Ni particles formed (higher population of Ni active sites per mass of catalyst), as evidenced by the TEM measurements, and the associated direct and indirect effects. The loss in activity during the time on stream can be related to both sintering (TEM results), but also to the high degree of graphitization observed for the carbon deposited on its surface (Raman). It can also be related to the increased acidity of the Ni/Al, which probably inhibits the activation of CO2 on the support sites, overshadowing the beneficial effects of the smaller Ni particle size.
Although the mean Ni particle size on the reduced Ni/Zr catalyst was considerably larger than on the Ni/Al (48.2 ± 16.6 nm in comparison to 5.3 ± 1.3 nm), the investigation of the spent catalysts using TEM revealed the interesting find that Ni size was reduced during a reaction. This can be probably attributed to the melting of Ni particles during reaction and their subsequent confinement inside the carbon fibers formed. This conclusion (melting) is also supported by a change in the shape of the Ni particles, from mainly pseudo-spherical to a mixture of pseudo-spherical and rod shaped (Figure 5). Das et al. [57] has suggested that the carbon coating the nanoparticles has the ability to then prevent further sintering from taking place. Moreover, the carbon formed on to the Ni/Zr surface is less graphitic and more defective in comparison to the Ni/Al, possibly due to the increased bacisity of this material. Indeed, it is accepted that catalysts with increased basicity enhance the adsorption of CO2 in the BDR reaction, providing additional oxygen surface species on the catalyst surface. These oxygen species then enable the oxidation (gasification) of intermediate carbonaceous species that originate from CH4 decomposition [62,63]. The gasification of intermediate carbonaceous species on the Ni/Zr catalyst is also enhanced by the existence of lattice defects (oxygen vacancies) offering enhanced O2− lability, as evidenced by the TPR measurements presented in ref. [46]. Mechanistic studies using isotopic labelled reactants demonstrated that in the case of reforming reactions, oxygen species mobility and their back spillover from the support to the metal particles play a major role in the ‘self-cleaning’ of catalytic surface from coke [64,65]. In addition, the unpaired electrons (left upon the formation of the oxygen vacant sites) can participate in Electronic Metal Support Interaction (EMSI) phenomena, the latter elegantly described by Campbell [66].
The size of the active metal on the reduced Ni/Si was larger in comparison to the other catalysts, probably due to the lower interaction strength between the active metal and the support. Similar to the Ni/Zr, the active phase particles on the reduced Ni/Si catalyst decreased in size and changed shape during the reaction however, as with the Ni/Al, the carbon deposits showed a high degree of graphitization. The nature of the coke deposits may be related to the lower population of weak acid sites evidenced for the Ni/Si, in comparison with the Ni/Zr catalyst. The combination of larger Ni particles and the highly graphitic nature of the carbon formed onto the surface (low D/G for all temperatures under investigation) probably explained the poorer performance of this catalyst in comparison to the other samples.
Figure 12 presents the percentage loss of the activity in terms of CH4 conversion (ΔXCH4), as the truest measure of the BDR activity (as the values of CO2 conversion and H2 and CO yield may be influenced by the RWGS reaction). It is clear that in the temperature range of extensive carbon deposition, the Ni/Al and Ni/Si catalysts experienced enormous loses in activity that were close to 70%. In contrast, the activity loss for the Ni/Zr catalyst, although substantial, was approximately 50% which, as mentioned above, is probably related to the oxidation of intermediate carbonaceous species originating from CH4 decomposition due to the enhanced basicity and O2− lability characteristics of this sample. As the reaction temperature increased (thereby, favouring the BDR reaction and carbon oxidation), the activity loss for all three catalytic systems progressively diminished, reaching a value of approximately 20% at 800 °C.
In summary, the results presented herein show that the formation and nature of carbonaceous deposits on catalytic surfaces (and thus catalytic stability) depend on the interplay of a number of crucial parameters such as metal support interaction, acidity/basicity characteristics, O2– lability and the active phase particle size. When a catalytic system possesses only some of these beneficial characteristics, then the competition with adverse effects may overshadow any potential benefits.

3. Materials and Methods

3.1. Catalyst Preparation

The information over the untreated catalytic carriers, the preparation method employed for catalyst development, as well as the characterization techniques used for the investigation of the properties of the calcined supports, and calcined and reduced catalysts, have been previously reported in Ref. [46]. Succinctly, the supports used were commercial γ-Al2O3 (Akzo), ZrO2 and SiO2 (both from Saint Gobain NorPro) that were brought to 350–500 μm and calcined at 800 °C for 4 h. The catalysts were prepared by the wet impregnation technique for a nominal Ni loading of 8 wt % and calcination was also carried out at 800 °C over 4 h. These samples are denoted throughout this manuscript as calcined catalysts. The catalytic activation was carried out in situ, for 1 h at 800 °C, using a flow of high purity H2, and these samples are denoted herein as reduced catalysts.

3.2. Catalyst Characterization

Transmission electron microscopy (TEM) was carried out using a 200 kV G2 20 S-Twin Tecnai microscope (Waltham, Massachusetts, USA) with a LaB6 electron source fitted with a SuperTwin® objective lens allowing a point-to-point resolution of 2.4 Å. The EDS analysis and high angle annular dark field scanning transmission electron microscopy (HAADF-STEM) were performed on a Tecnai G2-F30 Field Emission Gun microscope (Waltham, Massachusetts, USA) with a super-twin lens and 0.2 nm point-to-point resolution and 0.1 line resolution operated at 300 kV. XPS studies were carried out on a ThermoFisher Scientific Instruments (East Grinstead, UK) K-Alpha+ spectrometer using a monochromated Al Kα X-ray source (hν = 1486.6 eV). The thermogravimetric analysis was performed on a Leco TGA701 instrument (St. Joseph, Michigan, USA). In the procedure, ≈ 50 mg of the spent catalyst was subjected to a TGA scan from room temperature (RT) to 1000 °C at a heating rate of 10 °C min−1 under a flow of dry air (3.5 L min−1). The Curie point standards were utilized for the temperature calibration. A Raman analysis was carried out on a WITEC alpha 300R (Ulm, Germany) micro-Raman system with a 20 × long distance objective (0.35 numerical aperture) in the back-scattering geometry with an excitation wavelength of 532 nm from an Ar+ ion laser (laser power set at 2 mW. The detailed information on the instruments and methodology used can be found in Refs. [42,45,46].

3.3. Catalytic Tests

The catalytic experiments were carried out at atmospheric pressure in a continuous flow, fixed bed, and a stainless steel reactor. The feedstock in the reactor inlet consisted of a mixture of CH4/CO2, with a molar ratio equal to 1.56 diluted with 10% of Ar (55% CH4, 35% CO2, 10% Ar). The molar ratio chosen aimed at approximating an ideal biogas mixture, while the very low dilution of the gas mixture with Ar aimed at inducing carbon deposition. The catalytic deactivation was investigated using the temperature and time-one-stream as variables. Thus, the progress of the BDR process was studied during the short constant time-on-stream tests of 10 h at a constant weight hourly space velocity (WHSV) equal to 40,000 mL g−1 h−1. The temperatures when the reaction was undertaken were 600 °C, 650 °C, 700 °C, 750 °C and 800 °C, using a fresh catalytic sample at the beginning of each experiment. As mentioned above, the catalyst pre-conditioning (activation) was carried out in situ, under a pure H2 flow, prior to the commencement of each new experiment.
The identification and quantification of the gas products were performed by an on-line Agilent 7890A gas chromatographer (Santa Clara, California, US.A.) that had two columns in parallel, HP-Plot-Q (19095-Q04, 30 m length, 0.530 mm I.D.) and HP-Molesieve (19095P-MSO, 30 m length, 0.530 mm I.D.), and was equipped with TCD and FID detectors.
The CH4 or CO2 conversion as well as the H2 or CO yield were calculated using Equations (9)–(12):
XCH4 (%) = ((FCH4,in − FCH4,out) / FCH4,in)) × 100
XCO2 (%) = ((FCO2,in − FCO2,out) / FCO2,in) × 100
YH2 (%) = (FH2 / 2FCH4,in) × 100
YCO (%) = ((FCO / (FCH4,in + FCO2,in) ×100
where Fi,in or Fout are the flow rate of the component i in the feed or effluent gas mixture.

4. Conclusions

The use of transition metals is a prerequisite for the industrial application of the BDR. As carbon deposition is the main cause of deactivation for such catalysts, targeted research on the correlation of catalytic properties, the deactivation mechanism and the nature of carbonaceous deposits is necessary. The work presented herein provides a comparative assessment of catalytic stability in relation to carbon deposition and metal particle sintering on un-promoted Ni/Al2O3, Ni/ZrO2 and Ni/SiO2 catalysts for different reaction temperatures (600, 650, 700, 750 and 800 °C). The spent catalysts were examined using TGA, Raman spectroscopy, STEM-HAADF and XPS. The results presented herein show that the type of carbonaceous deposits formed on catalytic surfaces (and thus catalytic stability) depends on the interplay of a number of crucial parameters such as metal support interaction, the acidity/basicity characteristics, O2− lability and the active phase particle size. When a catalytic system possesses only some of these beneficial characteristics, then competition with adverse effects may overshadow any potential benefits.

Author Contributions

Data curation, N.D.C., G.I.S., L.T., V.S. (Victor Sebastian) and S.J.H.; formal analysis, N.D.C., L.T., V.S. (Victor Sebastian), V.S. (Vlad Stolojan), S.J.H., M.A.B. and K.P.; investigation, N.D.C.; methodology, N.D.C.; project administration, M.A.G.; supervision, N.D.C. and M.A.G.; writing—original draft, N.D.C., S.L.D., V.S. (Vlad Stolojan), M.A.B. and K.P.; writing—review & editing, N.D.C., M.A.B., K.P. and M.A.G.

Funding

This research received no external funding.

Conflicts of Interest

The authors declare no conflicts of interest.

References

  1. Dama, S.; Ghodke, S.R.; Bobade, R.; Gurav, H.R.; Chilukuri, S. Active and durable alkaline earth metal substituted perovskite catalysts for dry reforming of methane. Appl. Catal. B Environ. 2018, 224, 146–158. [Google Scholar] [CrossRef]
  2. Avraam, D.G.; Halkides, T.I.; Liguras, D.K.; Bereketidou, O.A.; Goula, M.A. An experimental and theoretical approach for the biogas steam reforming reaction. Int. J. Hydrog. Energy 2010, 35, 9818–9827. [Google Scholar] [CrossRef]
  3. Italiano, C.; Luchters, N.T.J.; Pino, L.; Fletcher, J.V.; Specchia, S.; Fletcher, J.C.Q.; Vita, A. High specific surface area supports for highly active Rh catalysts: Syngas production from methane at high space velocity. Int. J. Hydrog. Energy 2018, 43, 11755–11765. [Google Scholar] [CrossRef]
  4. Charisiou, N.D.; Baklavaridis, A.; Papadakis, V.G.; Goula, M.A. Synthesis gas production via the biogas reforming reaction over Ni/MgO-Al2O3 and Ni/CaO-Al2O3 catalysts. Waste Biomass Valoriz. 2016, 7, 725–736. [Google Scholar] [CrossRef]
  5. Zhou, W.J.; Zhou, B.; Li, W.Z.; Zhou, Z.H.; Song, S.Q.; Sun, G.Q.; Xin, Q.; Douvartzides, S.; Goula, M.; Tsiakaras, P. Performance comparison of low-temperature direct alcohol fuel cells with different anode catalysts. J. Power Sources 2004, 126, 16–22. [Google Scholar] [CrossRef]
  6. Weger, L.; Abanades, A.; Butler, T. Methane cracking as a bridge technology to the hydrogen economy. Int. J. Hydrog. Energy 2017, 42, 720–731. [Google Scholar] [CrossRef] [Green Version]
  7. Nikoo, M.K.; Amin, N.A.S. Thermodynamic analysis of carbon dioxide reforming of methane in view of solid carbon formation. Fuel Process. Technol. 2011, 92, 678–691. [Google Scholar] [CrossRef] [Green Version]
  8. Abdullah, B.; Ghani, N.A.A.; Vo, D.-V.N. Recent advances in dry reforming of methane over Ni-based catalysts. J. Clean. Prod. 2017, 162, 170–185. [Google Scholar] [CrossRef] [Green Version]
  9. Aramouni, N.A.K.; Zeaiter, J.; Kwapinski, W.; Ahmad, M.N. Thermodynamic analysis of methane dry reforming: Effect of the catalyst particle size on carbon formation. Energy Convers. Manag. 2017, 150, 614–622. [Google Scholar] [CrossRef]
  10. Jang, W.J.; Shim, J.O.; Kim, H.M.; Yoo, S.Y.; Roh, H.S. A review on dry reforming of methane in aspect of catalytic properties. Catal. Today 2019, 324, 15–26. [Google Scholar] [CrossRef]
  11. Verykios, X.E. Catalytic dry reforming of natural gas for the production of chemicals and hydrogen. Int. J. Hydrog. Energy 2003, 28, 1045–1063. [Google Scholar] [CrossRef]
  12. Yao, Z.; Jiang, J.; Zhao, Y.; Luan, F.; Zhu, J.; Shi, Y. Insights into the deactivation mechanism of metal carbide catalysts for dry reforming of methane via comparison of nickel-modified molybdenum and tungsten carbides. RSC Adv. 2016, 6, 19944–19951. [Google Scholar] [CrossRef]
  13. Froment, G.F. Production of synthesis gas by steam- and CO2-reforming of natural gas. J. Mol. Catal. A Chem. 2000, 163, 147–156. [Google Scholar] [CrossRef]
  14. Horlyck, J.; Lawrey, C.; Lovell, E.C.; Amal, R.; Scott, J. Elucidating the impact of Ni and Co loading on the selectivity of bimetallic NiCo catalysts for dry reforming of methane. Chem. Eng. J. 2018, 352, 572–580. [Google Scholar] [CrossRef]
  15. Goula, M.A.; Charisiou, N.D.; Papageridis, K.N.; Delimitis, A.; Pachatouridou, E.; Iliopoulou, E.F. Nickel on alumina catalysts for the production of hydrogen rich mixtures via the biogas dry reforming reaction: Influence of the synthesis method. Int. J. Hydrog. Energy 2015, 40, 9183–9200. [Google Scholar] [CrossRef]
  16. Li, M.; van Veen, A.C. Tuning the catalytic performance of Ni-catalysed dry reforming of methane and carbon deposition via Ni-CeO2-x interaction. Appl. Catal. B Environ. 2018, 237, 641–648. [Google Scholar] [CrossRef]
  17. Wei, J.; Iglesia, E. Isotopic and kinetic assessment of the mechanism of reactions of CH4 with CO2 or H2O to form synthesis gas and carbon on nickel catalysts. J. Catal. 2004, 224, 370–383. [Google Scholar] [CrossRef]
  18. Wei, J.; Iglesia, E. Structural and mechanistic requirements for methane activation and chemical conversion on supported iridium clusters. Angew. Chem. Int. Edit. 2004, 43, 3685–3688. [Google Scholar] [CrossRef]
  19. Kim, W.Y.; Jang, J.S.; Ra, E.C.; Kim, K.Y.; Kim, E.H.; Lee, J.S. Reduced perovskite LaNiO3 catalysts modified with Co and Mn for low coke formation in dry reforming of methane. Appl. Catal. A Gen. 2019, 575, 198–203. [Google Scholar] [CrossRef]
  20. Charisiou, N.D.; Siakavelas, G.; Papageridis, K.N.; Baklavaridis, A.; Tzounis, L.; Avraam, D.G.; Goula, M.A. Syngas production via the biogas dry reforming reaction over nickel supported on modified with CeO2 and/or La2O3 alumina catalysts. J. Nat. Gas Sci. Eng. 2016, 31, 164–183. [Google Scholar] [CrossRef]
  21. Charisiou, N.D.; Siakavelas, G.; Papageridis, K.; Baklavaridis, A.; Tzounis, L.; Goula, G.; Yentekakis, I.V.; Goula, M.A. The effect of WO3 modification of ZrO2 support on the Ni-catalyzed dry reforming of biogas reaction for syngas production. Front. Environ. Sci. 2017, 5, 66. [Google Scholar] [CrossRef]
  22. Carrara, C.; Munera, J.; Lombardo, E.A.; Cornaglia, L.M. Kinetic and stability studies of Ru/La2O3 used in the dry reforming of methane. Top. Catal. 2008, 51, 98–106. [Google Scholar] [CrossRef]
  23. Nagaoka, K.; Aika, K.; Seshan, K.; Lercher, J.A. Mechanism of carbon deposit/removal in methane dry reforming on supported metal catalysts. Stud. Surf. Sci. Catal. 2001, 136, 129–136. [Google Scholar] [CrossRef]
  24. Charisiou, N.D.; Iordanidis, A.; Polychronopoulou, K.; Yentekakis, I.V.; Goula, M.A. Studying the stability of Ni supported on modified with CeO2 alumina catalysts for the biogas dry reforming reaction. Mater. Today Proc. 2018, 5, 27607–27616. [Google Scholar] [CrossRef]
  25. Usman, M.; Wan Daud, W.M.A.; Abbas, H.F. Dry reforming of methane: Influence of process parameters—A review. Renew. Sustain. Energy Rev. 2015, 45, 710–744. [Google Scholar] [CrossRef]
  26. Byckkov, V.Y.; Tyulenin, Y.P.; Firsova, A.A.; Shafranovsky, E.A.; Gorenberg, A.Y.; Korchak, V.N. Carbonization of nickel catalysts and its effect on methane dry reforming. Appl. Catal. A Gen. 2013, 453, 71–79. [Google Scholar] [CrossRef]
  27. Charisiou, N.D.; Papageridis, K.N.; Siakavelas, G.; Tzounis, L.; Goula, M.A. Effect of active metal supported on SiO2 for selective hydrogen production from the glycerol steam reforming reaction. Bioresources 2016, 11, 10173–10189. [Google Scholar] [CrossRef]
  28. Xu, Y.; Du, X.-H.; Li, J.; Wang, P.; Zhu, J.; GE, F.-J.; Zhou, J.; Song, M.; Zhu, W.-Y. A comparison of Al2O3 and SiO2 supported Ni-based catalysts in their performance for the dry reforming of methane. J. Fuel Chem. Technol. 2019, 47, 199–208. [Google Scholar] [CrossRef]
  29. Cai, W.; Ye, L.; Zhang, L.; Ren, Y.; Yue, B.; Chen, X.; He, H. Highly dispersed nickel-containing mesoporous silica with superior stability in carbon dioxide reforming of methane: The effect of anchoring. Materials 2014, 7, 2340–2355. [Google Scholar] [CrossRef]
  30. Anchieta, C.G.; Assaf, E.M.; Assaf, J.M. Effect of ionic liquid in Ni/ZrO2 catalysts applied to syngas production by methane tri-reforming. Int. J. Hydrog. Energy 2019, 44, 9316–9327. [Google Scholar] [CrossRef]
  31. Charisiou, N.D.; Papageridis, K.N.; Siakavelas, G.; Sebastian, V.; Hinder, S.J.; Baker, M.A.; Polychronopoulou, K.; Goula, M.A. The influence of SiO2 doping on the Ni/ZrO2 supported catalyst for hydrogen production through the glycerol steam reforming reaction. Catal. Today 2019, 319, 206–219. [Google Scholar] [CrossRef]
  32. Sokolov, S.; Kondratenk, E.V.; Pohl, M.M.; Barkschat, A.; Rodemerck, U. Stable low-temperature dry reforming of methane over mesoporous La2O3-ZrO2 supported Ni catalysts. Appl. Catal. B Environ. 2012, 113–114, 19–30. [Google Scholar] [CrossRef]
  33. Hou, Z.; Chen, P.; Fang, H.; Zheng, X.; Yashima, T. Production of synthesis gas via methane reforming with CO2 on noble metals and small amount of noble-(Rh-) promoted Ni catalysts. Int. J. Hydrog. Energy 2006, 31, 555–561. [Google Scholar] [CrossRef]
  34. Arandiyan, H.; Peng, Y.; Liu, C.; Chang, H.; Li, J. Effects of noble metals doped on mesoporous LaAlNi mixed oxide catalyst and identification of carbon deposit for reforming CH4 with CO2. J. Chem. Technol. Biot. 2013, 89, 372–381. [Google Scholar] [CrossRef]
  35. Gao, Y.; Jiang, J.; Meng, Y.; Yan, F.; Aihemaiti, A. A review of recent developments in hydrogen production via biogas dry reforming. Energy Convers. Manag. 2018, 171, 133–155. [Google Scholar] [CrossRef]
  36. Bereketidou, O.A.; Goula, M.A. Biogas reforming for syngas production over nickel supported on ceria-alumina catalysts. Catal. Today 2012, 195, 93–100. [Google Scholar] [CrossRef]
  37. Shen, J.; Reule, A.A.C.; Semagina, N. Ni/MgAl2O4 catalyst for low-temperature oxidative dry methane reforming with CO2. Int. J. Hydrog. Energy 2019, 44, 4616–4629. [Google Scholar] [CrossRef]
  38. Rosha, P.; Mohapatra, S.K.; Mahla, S.K.; Dhir, A. Catalytic reforming of synthetic biogas for hydrogen enrichment over Ni supported on ZnO–CeO2 mixed catalyst. Biomass Bioenerg. 2019, 125, 70–78. [Google Scholar] [CrossRef]
  39. Goula, M.A.; Charisiou, N.D.; Siakavelas, G.; Tzounis, L.; Tsiaoussis, I.; Panagiotopoulou, P.; Goula, G.; Yentekakis, I.V. Syngas production via the biogas dry reforming reaction over Ni supported on zirconia modified with CeO2 or La2O3 catalysts. Int. J. Hydrog. Energy 2017, 42, 13724–13740. [Google Scholar] [CrossRef]
  40. Ghelamallah, M.; Granger, P. Supported-induced effect on the catalytic properties of Rh and Pt-Rh particles deposited on La2O3 and mixed α-Al2O3-La2O3 in the dry reforming of methane. Appl. Catal. A Gen. 2014, 485, 172–180. [Google Scholar] [CrossRef]
  41. Aramouni, N.A.K.; Touma, J.G.; Tarboush, B.A.; Zeaiter, J.; Ahmad, M.N. Catalyst design for dry reforming of methane: Analysis review. Renew. Sustain. Energy Rev. 2018, 82, 2570–2585. [Google Scholar] [CrossRef]
  42. Charisiou, N.D.; Siakavelas, G.; Tzounis, L.; Sebastian, V.; Monzon, A.; Baker, M.A.; Hinder, S.J.; Polychronopoulou, K.; Yentekakis, I.V.; Goula, M.A. An in depth investigation of deactivation through carbon formation during the biogas dry reforming reaction for Ni supported on modified with CeO2 and La2O3 zirconia catalysts. Int. J. Hydrog. Energy 2018, 43, 18955–18976. [Google Scholar] [CrossRef]
  43. Sehested, J. Four challenges for nickel steam-reforming catalysts. Catal. Today 2006, 111, 103–110. [Google Scholar] [CrossRef]
  44. Rostrup-Nielsen, J.R.S.; Norskov, J.K. Hydrogen and synthesis gas by steam- and CO2 reforming. Adv. Catal. 2002, 47, 65–139. [Google Scholar] [CrossRef]
  45. Charisiou, N.D.; Tzounis, L.; Sebastian, V.; Hinder, S.J.; Baker, M.A.; Polychronopoulou, K.; Goula, M.A. Investigating the correlation between deactivation and the carbon deposited on the surface of Ni/Al2O3 and Ni/La2O3 -Al2O3 catalysts during the biogas reforming reaction. Appl. Surf. Sci. 2019, 474, 42–56. [Google Scholar] [CrossRef]
  46. Charisiou, N.D.; Papageridis, K.N.; Siakavelas, G.; Tzounis, L.; Kousi, K.; Baker, M.A.; Hinder, S.J.; Sebastian, V.; Polychronopoulou, K.; Goula, M.A. Glycerol steam reforming for hydrogen production over Nickel supported on alumina, zirconia and silica catalysts. Top. Catal. 2017, 60, 1226–1250. [Google Scholar] [CrossRef]
  47. Bartholomew, C.H. Mechanisms of catalyst deactivation. Appl. Catal. A Gen. 2001, 212, 17–60. [Google Scholar] [CrossRef]
  48. Tzounis, L.; Kirsten, M.; Simon, F.; Mäder, E.; Stamm, M. The interphase microstructure and electrical properties of glass fibers covalently and non-covalently bonded with multiwall carbon nanotubes. Carbon 2014, 73, 310–324. [Google Scholar] [CrossRef]
  49. Charisiou, N.D.; Papageridis, K.N.; Tzounis, L.; Sebastian, V.; Hinder, S.J.; Baker, M.A.; Polychronopoulou, K.; Goula, M.A. Ni supported on CaO-MgO-Al2O3 as a highly selective and stable catalyst for H2 production via the glycerol steam reforming reaction. Int. J. Hydrog. Energy 2018, 44, 256–273. [Google Scholar] [CrossRef]
  50. Velasquez, M.; Batiot-Dupeyrat, C.B.; Gallego, J.; Fernandez, J.J.; Santamaria, A. Synthesis of carbon nano-chains from glycerol-ethanol decomposition over Ni-Fe alloy catalyst. Diam. Relat. Mater. 2016, 70, 105–113. [Google Scholar] [CrossRef]
  51. Velasquez, M.; Batiot-Dupeyrat, C.B.; Gallego, J.; Santamaria, A. Chemical and morphological characterization of multi-walled-carbon nanotubes synthesized by carbon deposition from an ethanol–glycerol blend. Diam. Relat. Mater. 2014, 50, 38–48. [Google Scholar] [CrossRef]
  52. Zhang, Z.L.; Verykios, X.E. Carbon dioxide reforming of methane to synthesis gas over supported Ni catalysts. Catal. Today 1994, 21, 581–595. [Google Scholar] [CrossRef]
  53. Goula, M.A.; Lemonidou, A.A.; Efstathiou, A.M. Characterization of carbonaceous species formed during reforming of CH4 with CO2 over Ni/CaO-Al2O3 catalysts studied by various transient techniques. J. Catal. 1996, 161, 626–640. [Google Scholar] [CrossRef]
  54. Barros, E.B.; Demir, N.S.; Souza Filho, A.G.; Mendes Filho, J.; Jorio, A.; Dresselhaus, G.; Dresselhaus, M.S. Raman spectroscopy of graphitic foams. Phys. Rev. B 2005, 71, 165422. [Google Scholar] [CrossRef]
  55. Dresselhaus, M.A.; Dresselhaus, G.; Saito, R.; Jorio, A. Raman spectroscopy of carbon nanotubes. Phys. Rep. 2005, 409, 47–99. [Google Scholar] [CrossRef]
  56. Helveg, S.; López-Cartes, C.; Sehested, J.; Hansen, P.L.; Clausen, B.S.; Rostrup-Nielsen, J.R.; Abild-Pedersen, F.; Nørskov, J.K. Atomic-scale imaging of carbon nanofibre growth. Nature 2004, 427, 426–429. [Google Scholar] [CrossRef]
  57. Das, S.; Jangam, A.; Du, Y.; Hidajat, K.; Kawi, S. Highly dispersed nickel catalysts via a facile pyrolysis generated protective carbon layer. Chem. Commun. 2019, 55, 6074–6077. [Google Scholar] [CrossRef] [Green Version]
  58. Mezzi, A.; Kaciulis, S. Surface investigation of carbon films: From diamond to graphite. Surf. Interface Anal. 2010, 42, 1082–1084. [Google Scholar] [CrossRef]
  59. Mizokawa, Y.; Miyasato, T.; Nakamura, S.; Geib, K.M.; Wilmsen, C.W. Comparison of the CKLL first-derivative auger spectra from XPS and AES using diamond, graphite, SiC and diamond-like-carbon films. Surf. Sci. 1987, 182, 431–438. [Google Scholar] [CrossRef]
  60. Cao, A.; Lu, R.; Veser, G. Stabilizing metal nanoparticles for heterogeneous catalysts. Phys. Chem. Chem. Phys. 2010, 12, 13499–13510. [Google Scholar] [CrossRef]
  61. Meshkani, F.; Rezaei, M. Ni catalysts supported on nanocrystalline magnesium oxide for syngas production by CO2 reforming of CH4. J. Nat. Gas Chem. 2011, 20, 198–203. [Google Scholar] [CrossRef]
  62. Pakhare, D.; Spivey, J. A review of dry (CO2) reforming of methane over noble metal catalysts. Chem. Soc. Rev. 2014, 43, 7813–7837. [Google Scholar] [CrossRef] [PubMed]
  63. Naeem, M.A.; Al-Fatesh, A.S.; Khan, W.U.; Abaseeed, A.E.; Fakeeha, A.H. Syngas production from dry reforming of methane over nano Ni polyol catalysts. Int. J. Chem. Eng. Appl. 2013, 4, 315–320. [Google Scholar] [CrossRef]
  64. Polychronopoulou, Κ.; Costa, C.N.; Efstathiou, A.M. The role of oxygen and hydroxyl support species on the mechanism of H2 production in the steam reforming of phenol over metal oxide-supported-Rh and -Fe catalysts. Catal. Today 2006, 112, 89–93. [Google Scholar] [CrossRef]
  65. Polychronopoulou, K.; Efstathiou, A.M. Spillover of labile OH, H, and O species in the H2 production by steam reforming of phenol over supported-Rh catalysts. Catal. Today 2006, 116, 341–347. [Google Scholar] [CrossRef]
  66. Campbell, C.T. Catalyst-support interactions: Electronic perturbations. Nat. Chem. 2012, 4, 597–598. [Google Scholar] [CrossRef]
Figure 1. Thermogravimetric analysis (TGA) (a,c,e) and the corresponding derivative thermo-gravimetric (DTG) graphs (b,d,f) of the spent catalysts tested herein; (g) summary of the weight loss (%) measured at 1000 °C for all catalysts tested at different reaction temperatures.
Catalysts 09 00676 g001
Figure 2. (a) Raman spectroscopy indicates that the graphitisation of the carbon coke increases with increasing temperature for all cases, with the highest graphitisation achieved for Ni/Al and Ni/Si above 650 °C. The lines are a guide to the eye; (b) The evolution of the long range order as a function of the reactor temperature shows: An increase, followed by final degradation for Ni/Al, virtually no improvement for Ni/Zr and a hot-spot at 700°C for Ni/Si; (c) The D, G and 2D Raman peaks for the Ni/Al-catalysed carbon. A small shoulder is observed at ~1600 cm−1; this is the D’ peak, a double resonance event involving phonons close to the Brillouin zone centre.
Catalysts 09 00676 g002
Figure 3. High angle annular dark field scanning transmission electron microscopy (STEM-HAADF) images with Z-contrast (heavy atoms have high brightness) and particle size distribution histogram (n > 100) of Ni/Al, Ni/Zr and Ni/Si reduced catalysts.
Catalysts 09 00676 g003
Figure 4. (a) TEM images at different magnifications for the Ni/Al catalyst after the reaction at 600 °C, (b) EDS spectrum of area marked in a), (c) TEM images at different magnifications for the Ni/Al catalyst after the reaction at 800 °C (de) Particle size distribution histograms after reaction at 600 °C and 800 °C. The presence of Cu in the spectra is from the grid used.
Catalysts 09 00676 g004
Figure 5. (a) STEM-HAADF images at different magnifications for the Ni/Zr catalyst after the reaction at 600 °C, (b) EDS spectrum of area marked in a), (c) TEM images at different magnifications for the Ni/Zr catalyst after the reaction at 800 °C (de) Particle size distribution histograms after the reaction at 600 °C and 800 °C. The presence of Cu in the spectra is from the grid used.
Catalysts 09 00676 g005
Figure 6. (a) STEM-HAADF images at different magnifications for the Ni/Si catalyst after a reaction at 600 °C, (b) EDS spectrum of area marked in a), (c) TEM images at different magnifications for the Ni/Si catalyst after a reaction at 800 °C (de) Particle size distribution histograms after a reaction at 600 °C and 800 °C. The presence of Cu in the spectra is from the grid used.
Catalysts 09 00676 g006
Figure 7. The D-parameter measured from the X-ray excited carbon Auger KLL region for the Ni/Al2O3 catalyst at a reaction temperature of 700 °C.
Catalysts 09 00676 g007
Figure 8. CH4 conversion (XCH4, %) at different reaction temperatures for all catalytic systems tested herein.
Catalysts 09 00676 g008
Figure 9. CO2 conversion (XCO2, %) at different reaction temperatures for all catalytic systems tested herein.
Catalysts 09 00676 g009
Figure 10. H2 yield (YH2, %) at different reaction temperatures for all catalytic systems tested herein.
Catalysts 09 00676 g010
Figure 11. CO yield (YCO, %) at different reaction temperatures for all catalytic systems tested herein.
Catalysts 09 00676 g011
Figure 12. ΔΧCH4 at different reaction temperatures for all catalytic systems tested herein.
Catalysts 09 00676 g012
Table 1. The X-ray excited C Auger KLL peak determined D-parameter as a function of the reaction temperature for the Ni/Al2O3 catalyst.
Temperature (°C)600650700750800
D-parameter (eV)20.821.421.421.821.8

