
Circulating P2X7 Receptor Signaling Components as Diagnostic Biomarkers for Temporal Lobe Epilepsy

 ,
,  , , and
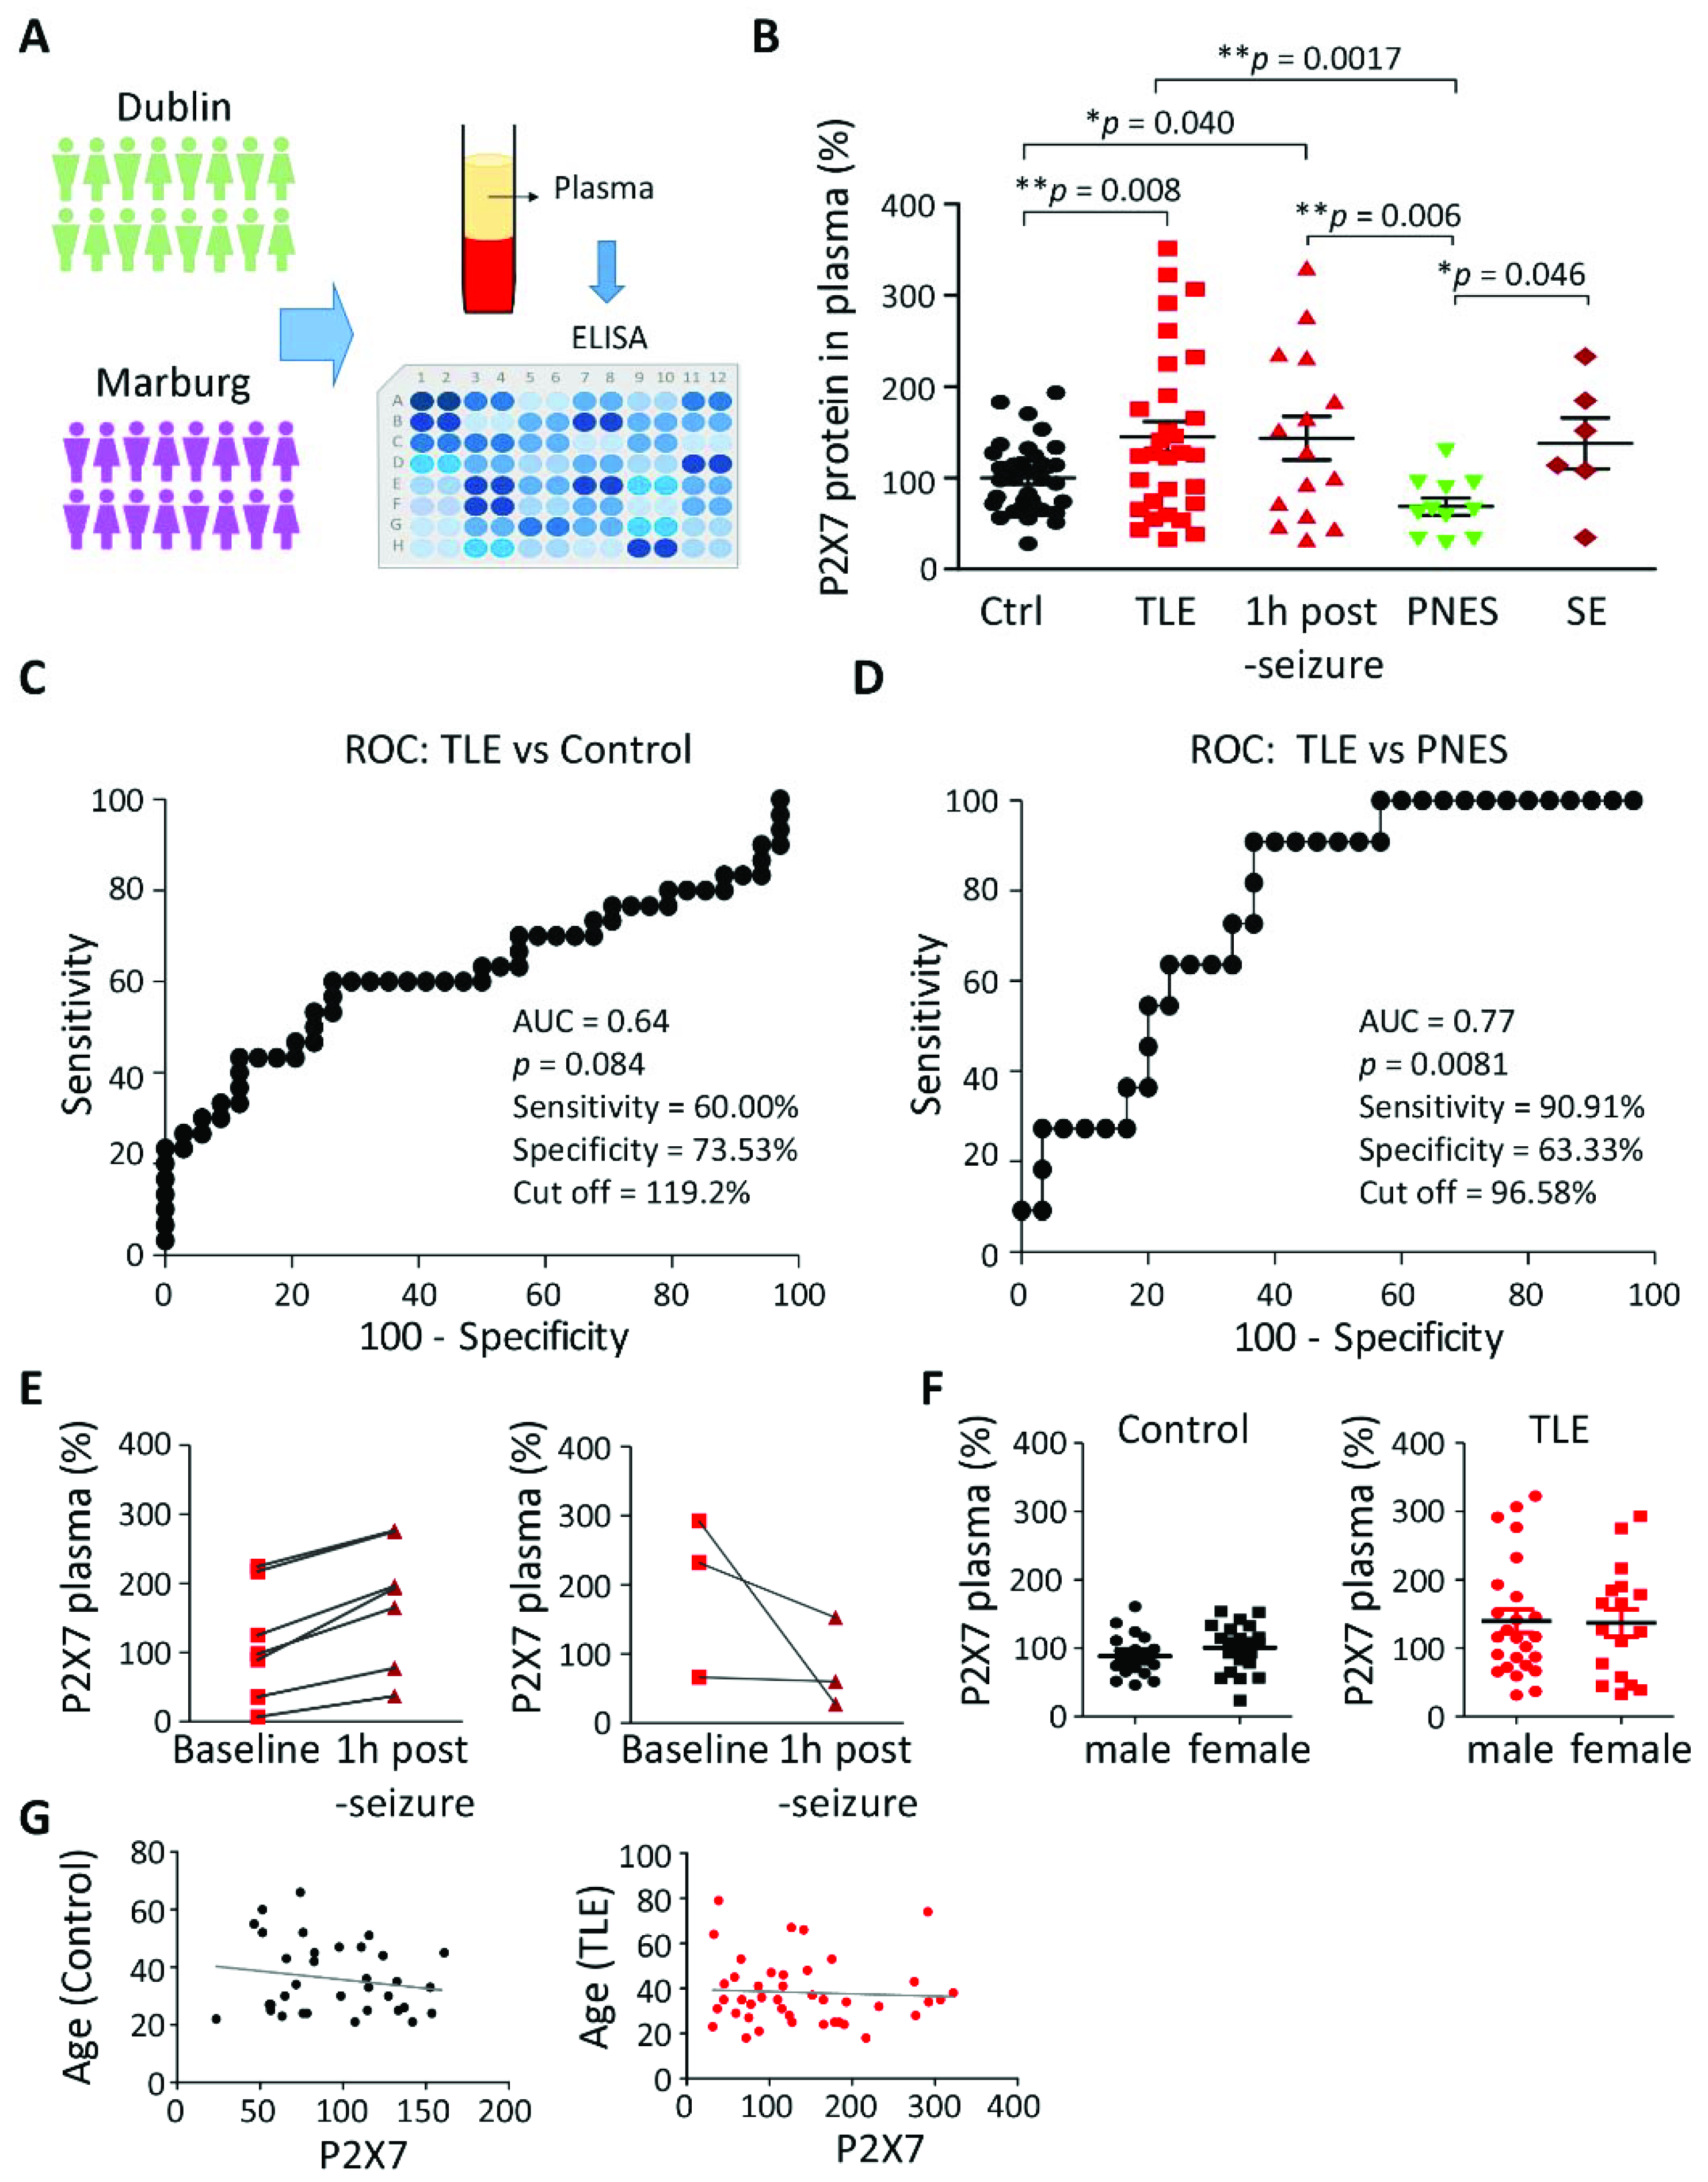
Abstract
:1. Introduction
2. Materials and Methods
2.1. Patient Samples
2.2. Human Plasma Preparation
2.3. ELISA for the Human P2X7 Receptor
2.4. Animals
2.5. Mouse Model of Status Epilepticus
2.6. Cytokine Array (Hippocampus and Plasma)
2.7. ELISA for Cytokine and CRP Analysis
2.8. Fluorescence-Activated Cell Sorting (FACS)
2.9. Statistical Analysis
3. Results
3.1. Increased P2X7R Plasma Levels in Patients with TLE
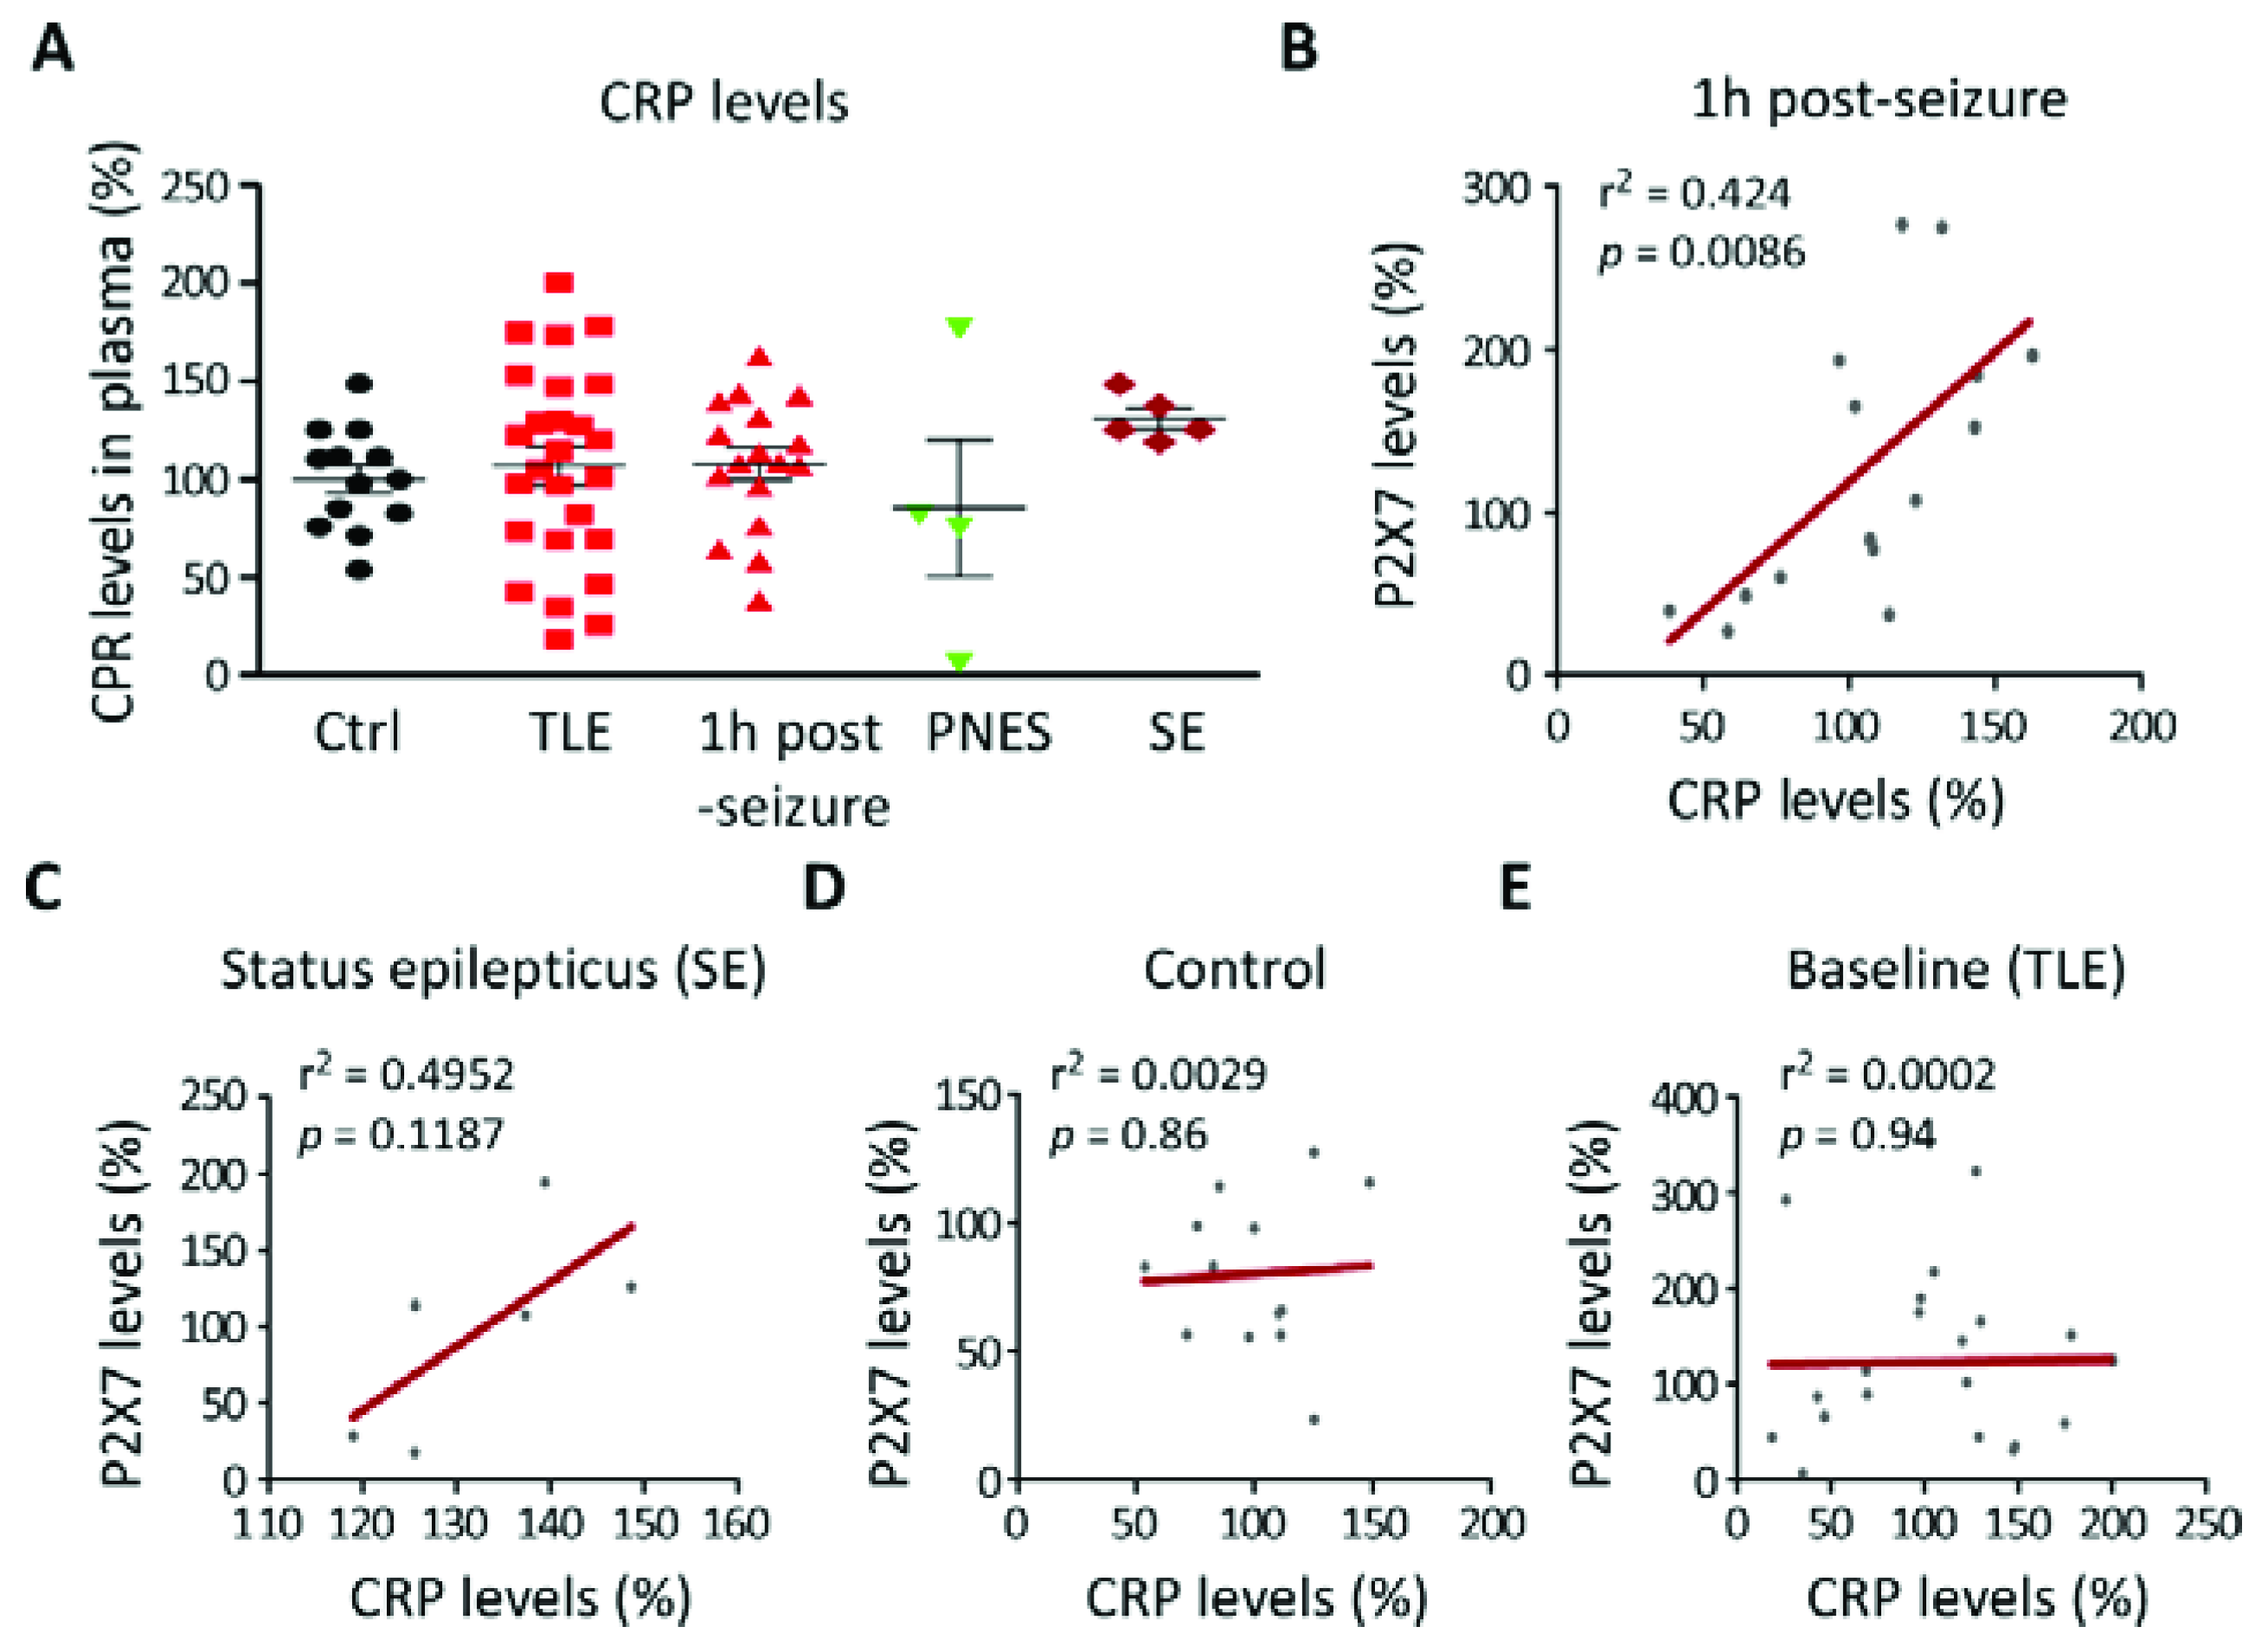
3.2. Correlation between P2X7R Plasma Levels and the Inflammation Marker CRP in TLE Patients
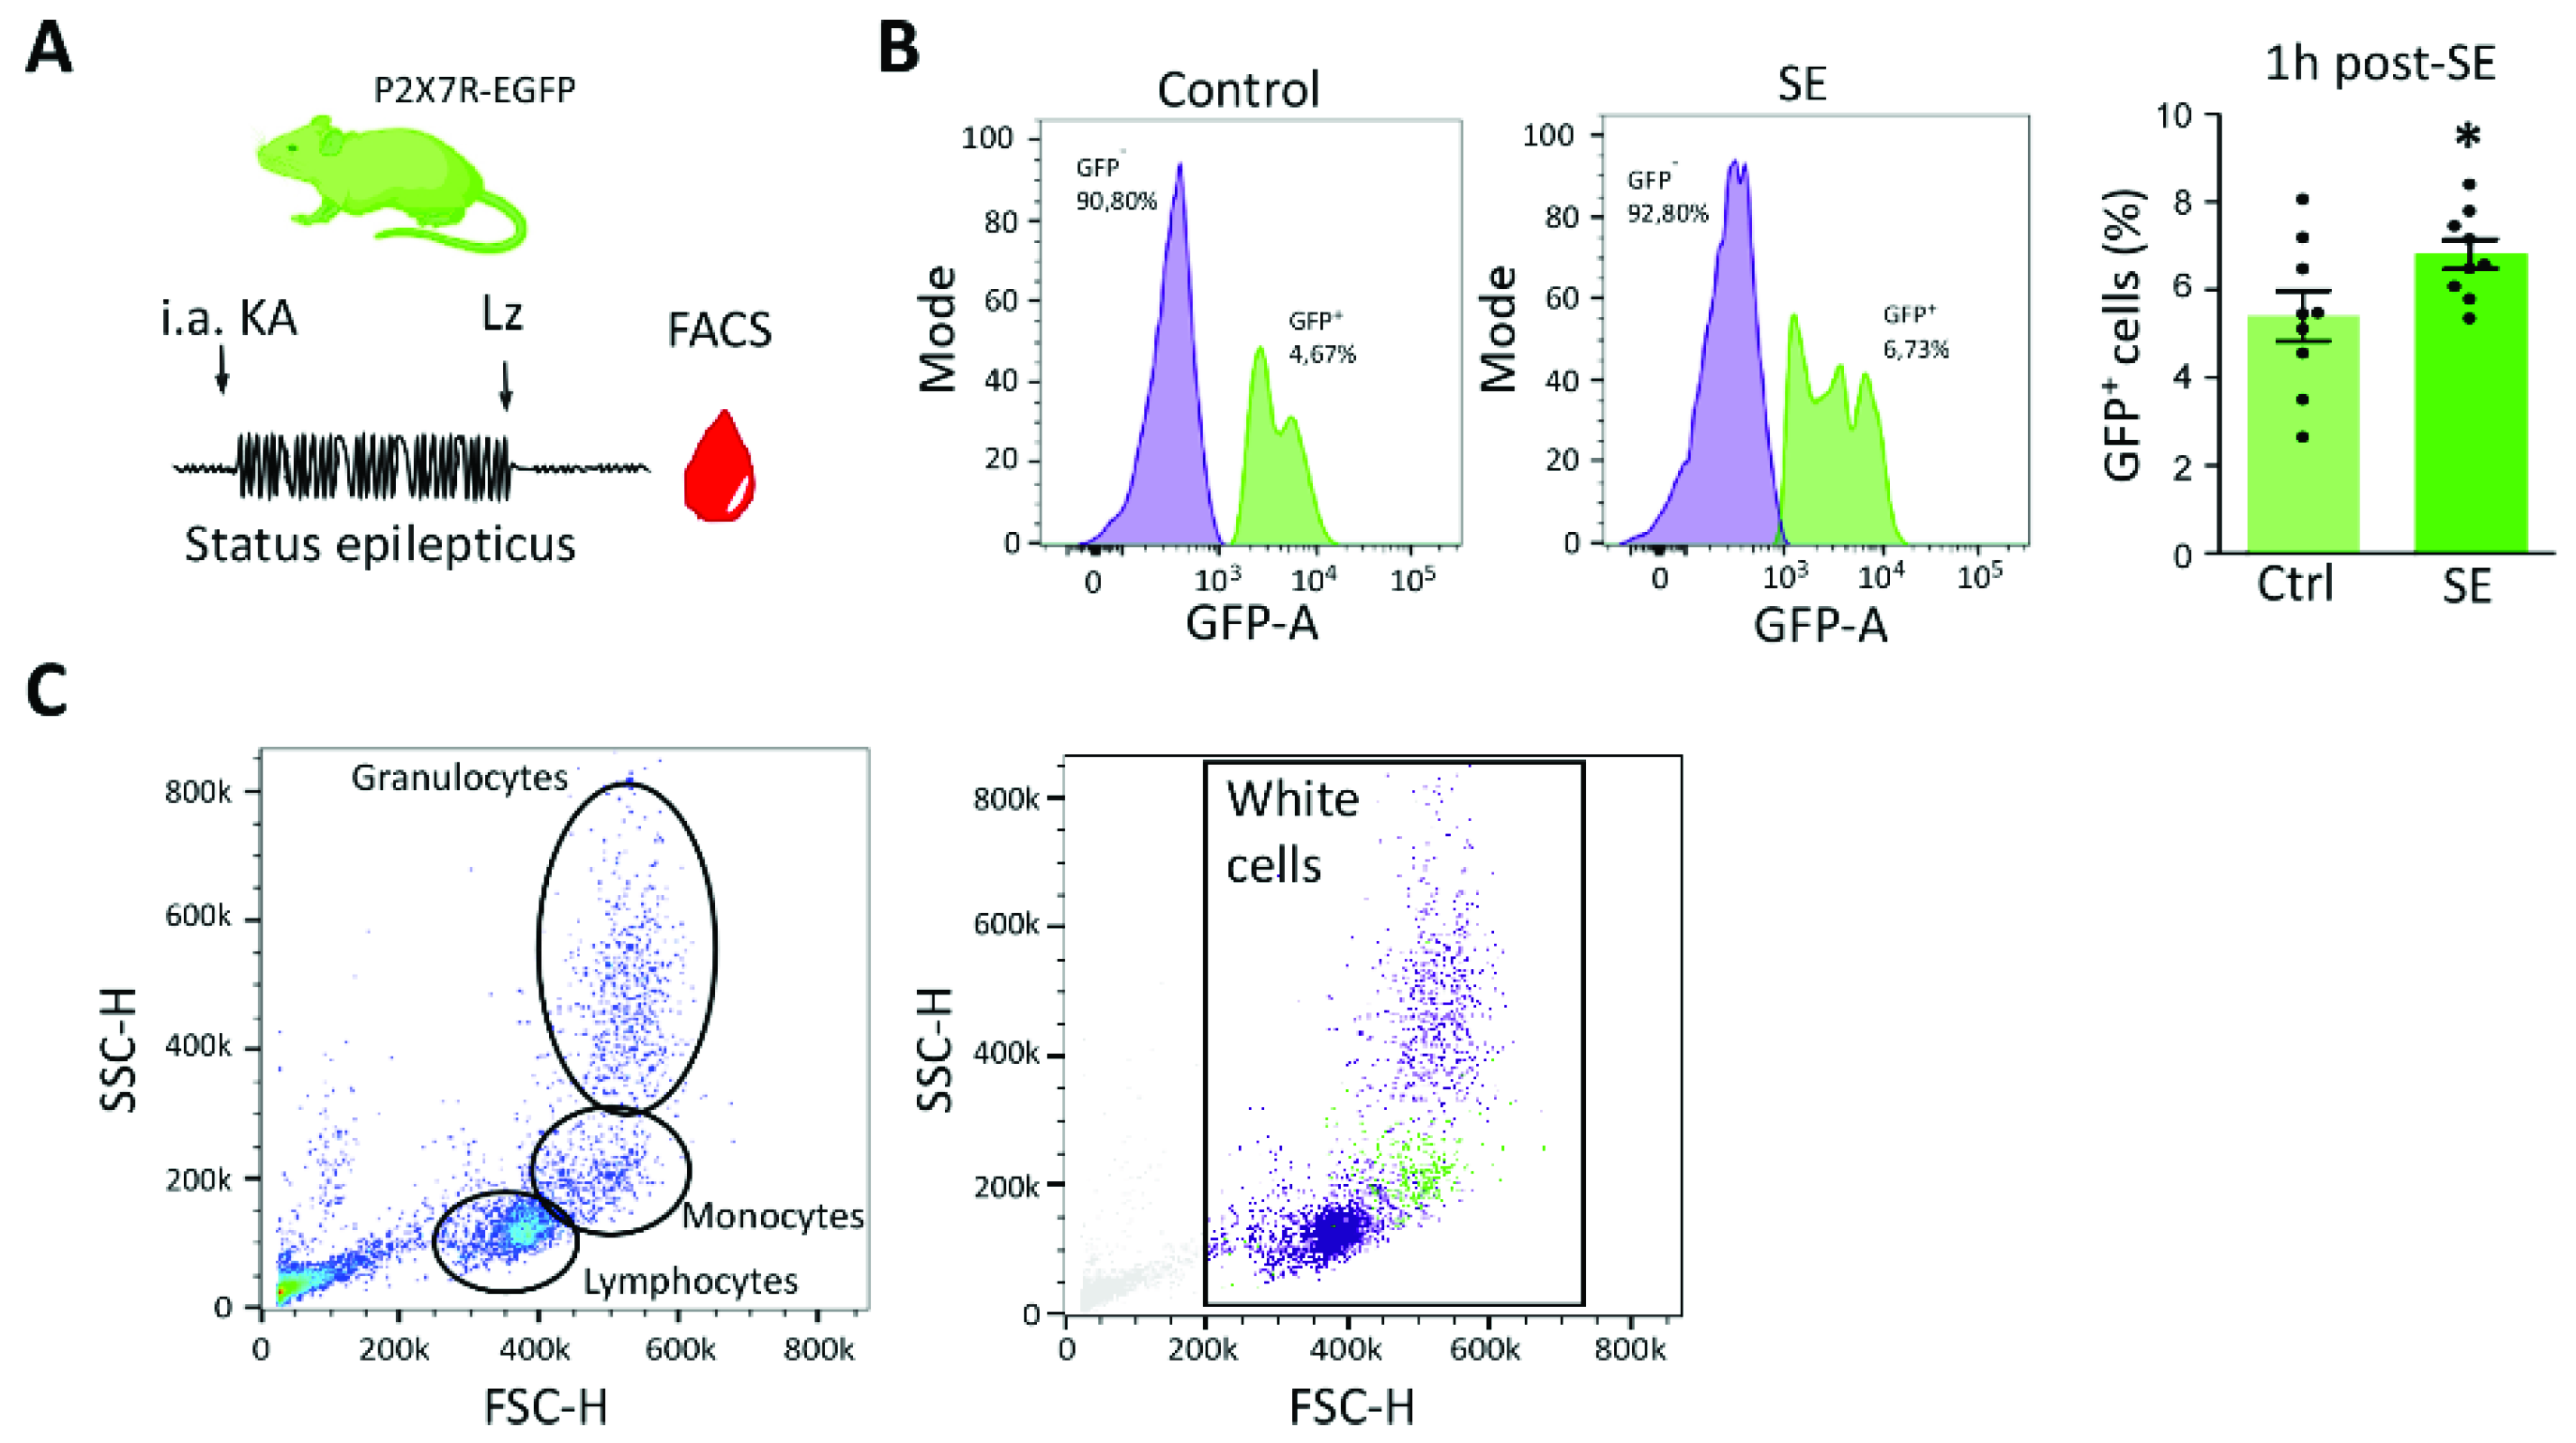
3.3. P2X7 Receptor Expression Increases in Blood Cells following Status Epilepticus in Mice
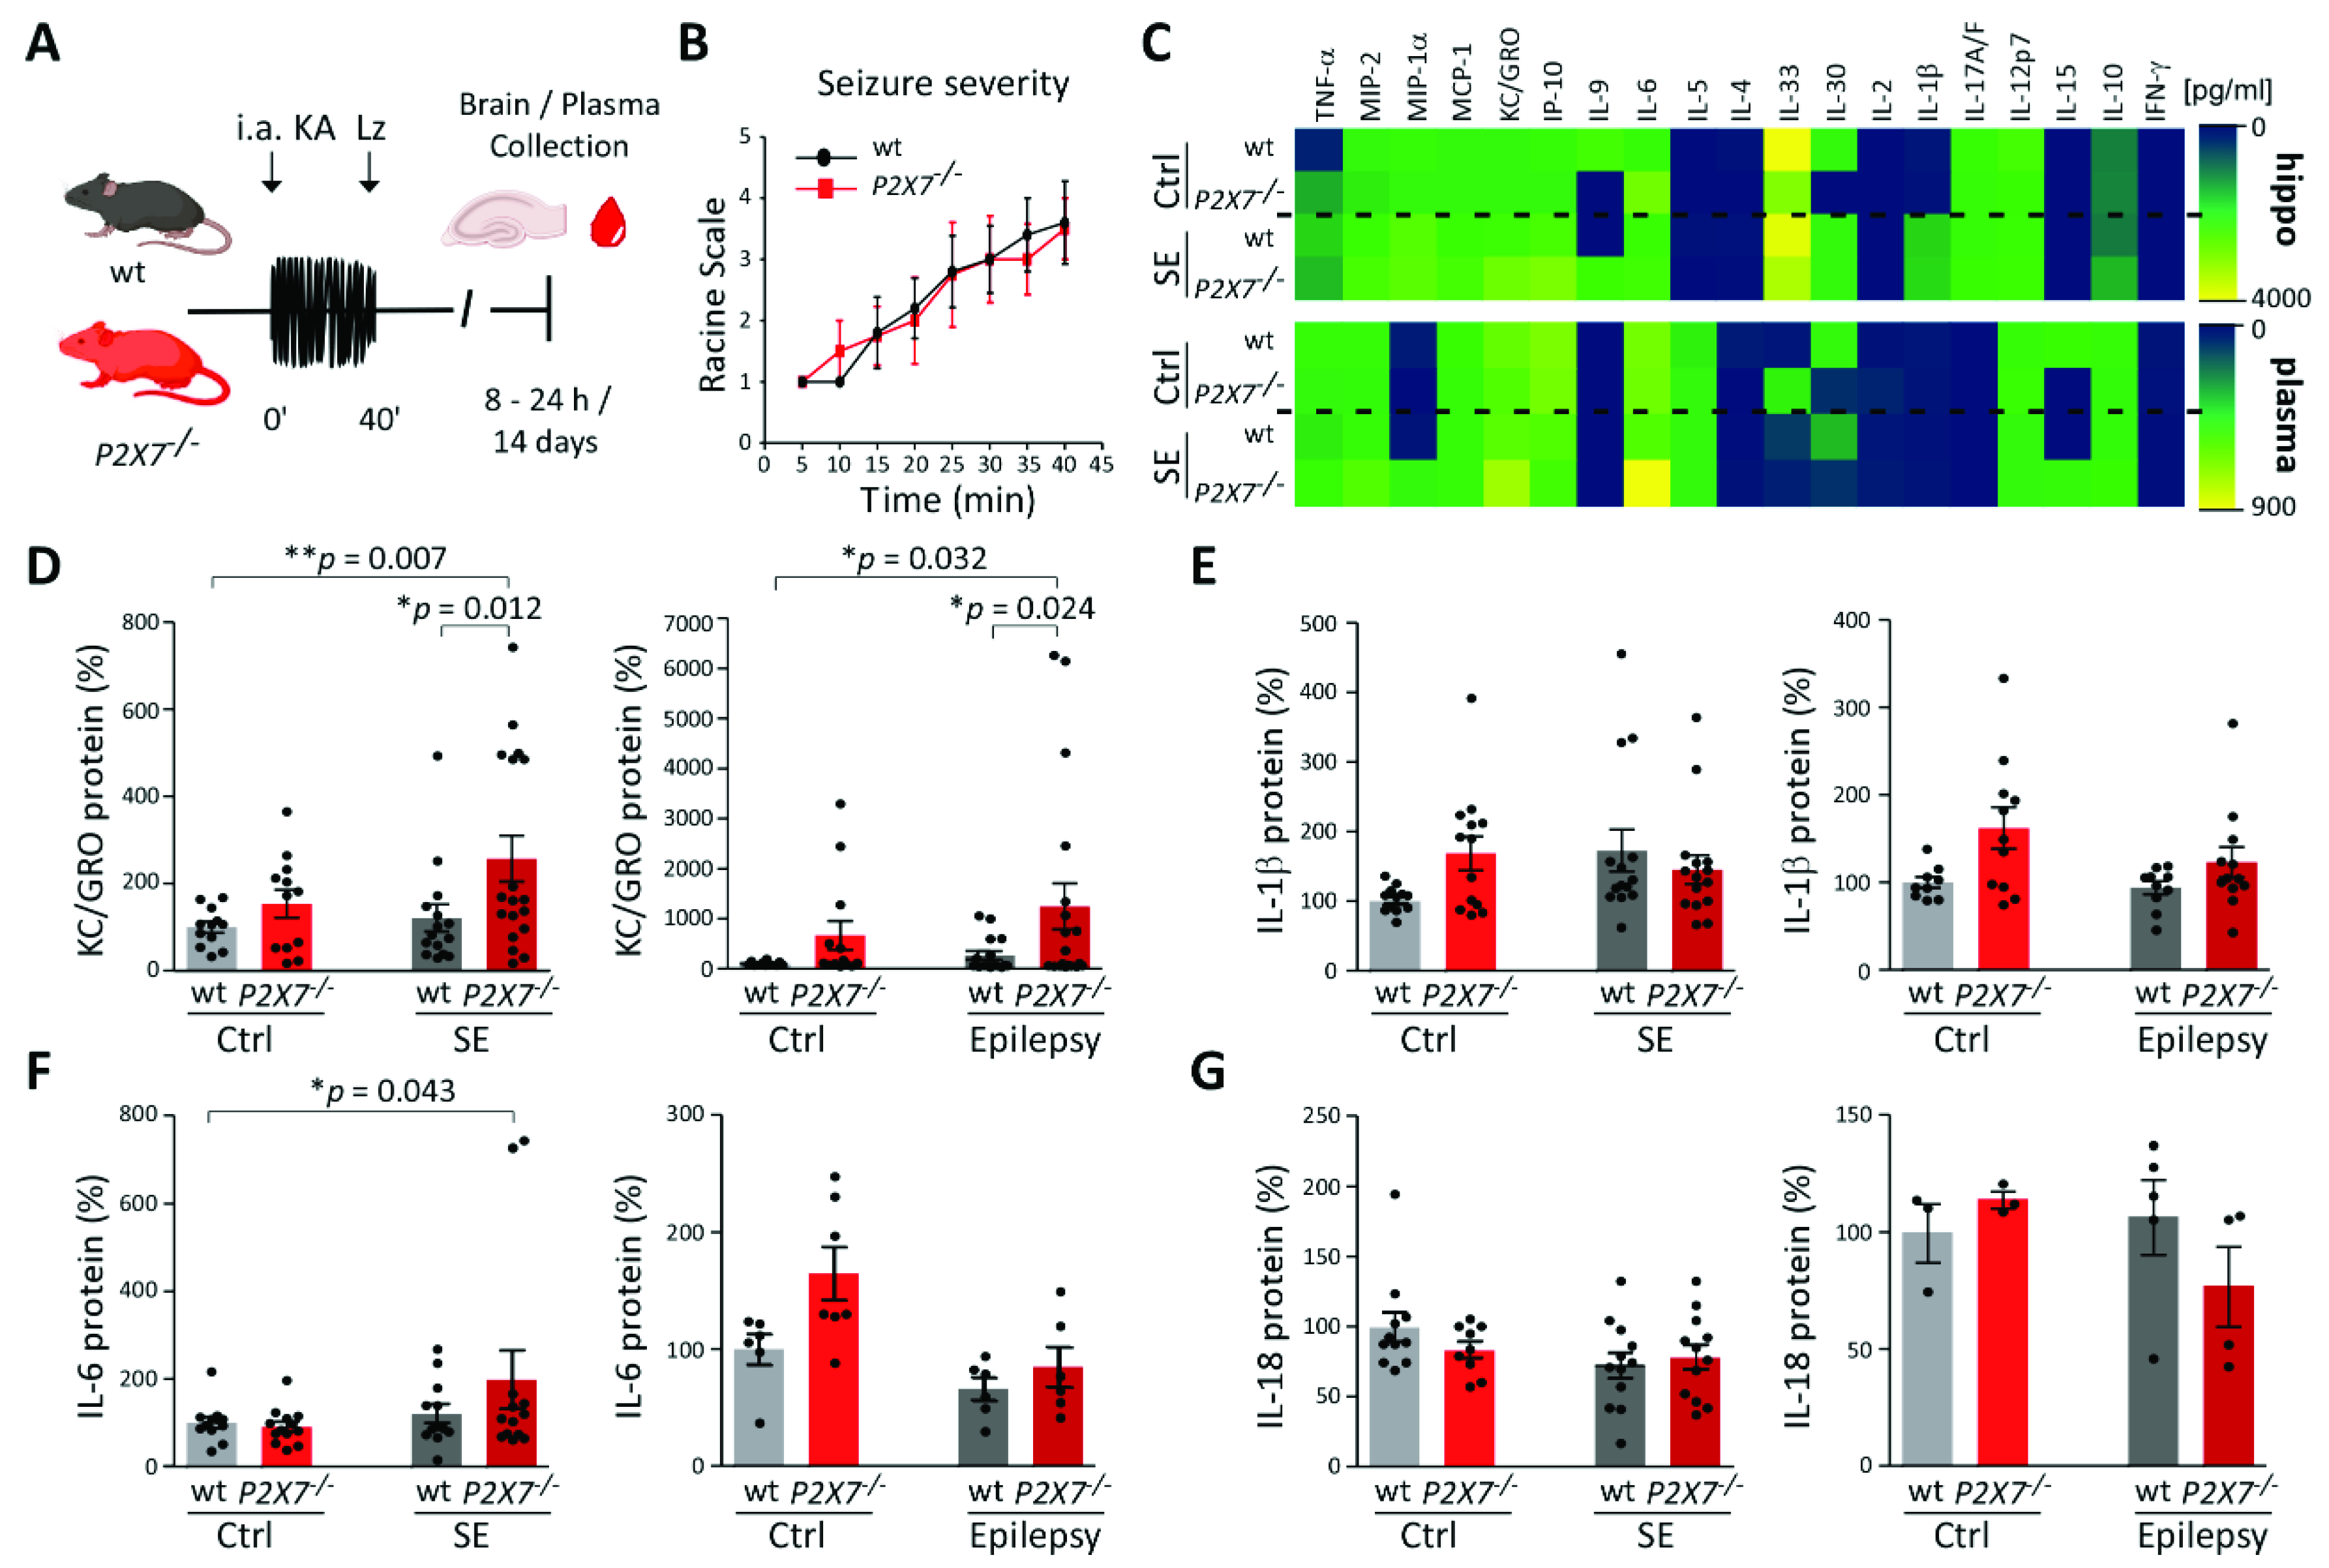
3.4. Increased KC/GRO Plasma Levels in P2X7−/− Mice Post-Status Epilepticus
4. Discussion
5. Conclusions
Supplementary Materials
Author Contributions
Funding
Institutional Review Board Statement
Informed Consent Statement
Conflicts of Interest
References
- Thijs, R.D.; Surges, R.; O’Brien, T.J.; Sander, J.W. Epilepsy in adults. Lancet 2019, 393, 689–701. [Google Scholar] [CrossRef]
- Moshe, S.; Perucca, E.; Ryvlin, P.; Tomson, T. Epilepsy: New advances. Lancet 2015, 385, 884–898. [Google Scholar] [CrossRef]
- Engel, J.; Pitkänen, A. Biomarkers for epileptogenesis and its treatment. Neuropharmacology 2019, 167, 107735. [Google Scholar] [CrossRef]
- Dickson, J.M.; Peacock, M.; Grünewald, R.A.; Howlett, S.; Bissell, P.; Reuber, M. Non-epileptic attack disorder: The importance of diagnosis and treatment. BMJ Case Rep. 2017, 2017. [Google Scholar] [CrossRef]
- Engel, J., Jr.; Pitkänen, A.; Loeb, J.A.; Dudek, F.E.; Bertramn, E.H., III; Cole, A.J.; Moshé, S.L.; Wiebe, S.; Jensen, F.E.; Mody, I.; et al. Epilepsy biomarkers. Epilepsia 2013, 54, 61–69. [Google Scholar] [CrossRef]
- Vezzani, A.; Balosso, S.; Ravizza, T. Neuroinflammatory pathways as treatment targets and biomarkers in epilepsy. Nat. Rev. Neurol. 2019, 15, 459–472. [Google Scholar] [CrossRef] [PubMed]
- Vezzani, A.; Aronica, E.; Mazarati, A.; Pittman, Q. Epilepsy and brain inflammation. Exp. Neurol. 2011, 244, 11–21. [Google Scholar] [CrossRef] [PubMed]
- Maroso, M.; Balosso, S.; Ravizza, T.; Liu, J.; Aronica, E.; Iyer, A.M.; Rossetti, C.; Molteni, M.; Casalgrandi, M.; A Manfredi, A.; et al. Toll-like receptor 4 and high-mobility group box-1 are involved in ictogenesis and can be targeted to reduce seizures. Nat. Med. 2010, 16, 413–419. [Google Scholar] [CrossRef] [Green Version]
- Iori, V.; Iyer, A.; Ravizza, T.; Beltrame, L.; Paracchini, L.; Marchini, S.; Cerovic, M.; Hill, C.; Ferrari, M.; Zucchetti, M.; et al. Blockade of the IL-1R1/TLR4 pathway mediates disease-modification therapeutic effects in a model of acquired epilepsy. Neurobiol. Dis. 2016, 99, 12–23. [Google Scholar] [CrossRef]
- Noe, F.M.; Polasheck, N.; Frigerio, F.; Bankstahl, M.; Ravizza, T.; Marchini, S.; Beltrame, L.; Reschke, B.; Löscher, W.; Vezzani, A. Pharmacological blockade of IL-1beta/IL-1 receptor type 1 axis during epileptogenesis provides neuroprotection in two rat models of temporal lobe epilepsy. Neurobiol. Dis. 2013, 59, 183–193. [Google Scholar] [CrossRef] [PubMed]
- Kobylarek, D.; Iwanowski, P.; Lewandowska, Z.; Limphaibool, N.; Szafranek, S.; Labrzycka, A.; Kozubski, W. Advances in the Potential Biomarkers of Epilepsy. Front. Neurol. 2019, 10, 685. [Google Scholar] [CrossRef]
- Yu, N.; Di, Q.; Hu, Y.; Zhang, Y.-F.; Su, L.-Y.; Liu, X.-H.; Li, L.-C. A meta-analysis of pro-inflammatory cytokines in the plasma of epileptic patients with recent seizure. Neurosci. Lett. 2012, 514, 110–115. [Google Scholar] [CrossRef] [PubMed]
- Uludag, I.F.; Bilgin, S.; Zorlu, Y.; Tuna, G.; Kirkali, G. Interleukin-6, interleukin-1 beta and interleukin-1 receptor antagonist levels in epileptic seizures. Seizure 2013, 22, 457–461. [Google Scholar] [CrossRef] [Green Version]
- Uludag, I.F.; Duksal, T.; Tiftikcioglu, B.I.; Zorlu, Y.; Ozkaya, F.; Kirkali, G. IL-1β, IL-6 and IL1Ra levels in temporal lobe epilepsy. Seizure 2015, 26, 22–25. [Google Scholar] [CrossRef] [PubMed] [Green Version]
- Kamasak, T.; Dilber, B.; Yaman, S.Ö.; Durgut, B.D.; Kurt, T.; Çoban, E.; Arslan, E.A.; Șahin, S.; Karhan, S.C.; Cansu, A. HMGB-1, TLR4, IL-1R1, TNF-alpha, and IL-1beta: Novel epilepsy markers? Epileptic Disord. 2020, 22, 183–193. [Google Scholar] [PubMed]
- Zhu, M.; Chen, J.; Guo, H.; Ding, L.; Zhang, Y.; Xu, Y. High Mobility Group Protein B1 (HMGB1) and Interleukin-1beta as Prognostic Biomarkers of Epilepsy in Children. J. Child Neurol. 2018, 33, 909–917. [Google Scholar] [CrossRef]
- Zhong, R.; Chen, Q.; Li, M.; Zhang, X.; Lin, W. Elevated Blood C-Reactive Protein Levels in Patients with Epilepsy: A Systematic Review and Meta-Analysis. Front. Neurol. 2019, 10. [Google Scholar] [CrossRef]
- Kopp, R.; Krautloher, A.; Ramírez-Fernández, A.; Nicke, A. P2X7 Interactions and Signaling–Making Head or Tail of It. Front. Mol. Neurosci. 2019, 12, 183. [Google Scholar] [CrossRef]
- Jimenez-Mateos, E.M.; Smith, J.; Nicke, A.; Engel, T. Regulation of P2X7 receptor expression and function in the brain. Brain Res. Bull. 2018, 151, 153–163. [Google Scholar] [CrossRef]
- Di Virgilio, F.; Ben, D.D.; Sarti, A.C.; Giuliani, A.L.; Falzoni, S. The P2X7 Receptor in Infection and Inflammation. Immunity 2017, 47, 15–31. [Google Scholar] [CrossRef] [Green Version]
- Kaczmarek-Hajek, K.; Zhang, J.; Kopp, R.; Grosche, A.; Rissiek, B.; Saul, A.; Bruzzone, S.; Engel, T.; Jooss, T.; Krautloher, A.; et al. Re-evaluation of neuronal P2X7 expression using novel mouse models and a P2X7-specific nanobody. eLife 2018, 7. [Google Scholar] [CrossRef]
- Savio, L.E.B.; de Andrade Mello, P.; da Silva, C.G.; Coutinho-Silva, R. The P2X7 Receptor in Inflammatory Diseases: Angel or Demon? Front. Pharmacol. 2018, 9, 52. [Google Scholar] [CrossRef] [PubMed] [Green Version]
- Beamer, E.; Fischer, W.; Engel, T. The ATP-Gated P2X7 Receptor as a Target for the Treatment of Drug-Resistant Epilepsy. Front. Neurosci. 2017, 11, 21. [Google Scholar] [CrossRef] [Green Version]
- Doná, F.; Ulrich, H.; Persike, D.S.; Conceição, I.M.; Blini, J.P.; Cavalheiro, E.A.; Fernandes, M.J.S. Alteration of purinergic P2X4 and P2X7 receptor expression in rats with temporal-lobe epilepsy induced by pilocarpine. Epilepsy Res. 2009, 83, 157–167. [Google Scholar] [CrossRef] [PubMed]
- Engel, T.; Gomez-Villafuertes, R.; Tanaka, K.; Mesuret, G.; Sanz-Rodriguez, A.; Garcia-Huerta, P.; Miras-Portugal, M.T.; Henshall, D.C.; Diaz-Hernandez, M. Seizure suppression and neuroprotection by targeting the purinergic P2X7 receptor during status epilepticus in mice. FASEB J. 2011, 26, 1616–1628. [Google Scholar] [CrossRef] [PubMed]
- Jimenez-Pacheco, A.; Mesuret, G.; Sanz-Rodriguez, A.; Tanaka, K.; Mooney, C.; Conroy, R.; Miras-Portugal, M.T.; Diaz-Hernandez, M.; Henshall, D.C.; Engel, T. Increased neocortical expression of the P2X7 receptor after status epilepticus and anticonvulsant effect of P2X7 receptor antagonist A. Epilepsia 2013, 54, 1551–1561. [Google Scholar] [CrossRef]
- Jimenez-Pacheco, A.; Diaz-Hernandez, M.; Arribas-Blázquez, M.; Sanz-Rodriguez, A.; Olivos-Oré, L.A.; Artalejo, A.R.; Alves, M.; Letavic, M.; Miras-Portugal, M.T.; Conroy, R.M.; et al. Transient P2X7 Receptor Antagonism Produces Lasting Reductions in Spontaneous Seizures and Gliosis in Experimental Temporal Lobe Epilepsy. J. Neurosci. 2016, 36, 5920–5932. [Google Scholar] [CrossRef]
- Morgan, J.; Alves, M.; Conte, G.; Menéndez-Méndez, A.; De Diego-Garcia, L.; De Leo, G.; Beamer, E.; Smith, J.; Nicke, A.; Engel, T. Characterization of the Expression of the ATP-Gated P2X7 Receptor Following Status Epilepticus and during Epilepsy Using a P2X7-EGFP Reporter Mouse. Neurosci. Bull. 2020, 36, 1242–1258. [Google Scholar] [CrossRef]
- Amhaoul, H.; Ali, I.; Mola, M.; Van Eetveldt, A.; Szewczyk, K.; Missault, S.; Bielen, K.; Kumar-Singh, S.; Rech, J.; Lord, B.; et al. P2X7 receptor antagonism reduces the severity of spontaneous seizures in a chronic model of temporal lobe epilepsy. Neuropharmacology 2016, 105, 175–185. [Google Scholar] [CrossRef]
- Giuliani, A.L.; Berchan, M.; Sanz, J.M.; Passaro, A.; Pizzicotti, S.; Vultaggio-Poma, V.; Sarti, A.C.; Di Virgilio, F. The P2X7 Receptor Is Shed into Circulation: Correlation With C-Reactive Protein Levels. Front. Immunol. 2019, 10. [Google Scholar] [CrossRef] [PubMed]
- Martinez-García, J.J.; Banaclocha, H.M.; Angosto, D.; De Torre-Minguela, C.; Baroja-Mazo, A.; Alarcón-Vila, C.; Martinez-Alarcon, L.; Amores-Iniesta, J.; Martín-Sánchez, F.; Ercole, G.A.; et al. P2X7 receptor induces mitochondrial failure in monocytes and compromises NLRP3 inflammasome activation during sepsis. Nat. Commun. 2019, 10, 2711. [Google Scholar] [CrossRef] [Green Version]
- Mochol, M.; Taubøll, E.; Aukrust, P.; Ueland, T.; Andreassen, O.A.; Svalheim, S. Interleukin 18 (IL-18) and its binding protein (IL-18BP) are increased in patients with epilepsy suggesting low-grade systemic inflammation. Seizure 2020, 80, 221–225. [Google Scholar] [CrossRef]
- Raoof, R.; Bauer, S.; El Naggar, H.; Connolly, N.M.; Brennan, G.P.; Brindley, E.; Hill, T.; McArdle, H.; Spain, E.; Forster, R.J.; et al. Dual-center, dual-platform microRNA profiling identifies potential plasma biomarkers of adult temporal lobe epilepsy. EBioMedicine 2018, 38, 127–141. [Google Scholar] [CrossRef] [PubMed] [Green Version]
- Conte, G.; Nguyen, N.T.; Alves, M.; De Diego-Garcia, L.; Kenny, A.; Nicke, A.; Henshall, D.C.; Jimenez-Mateos, E.M.; Engel, T. P2X7 Receptor-Dependent microRNA Expression Profile in the Brain Following Status Epilepticus in Mice. Front. Mol. Neurosci. 2020, 13. [Google Scholar] [CrossRef]
- Farley, F.W.; Soriano, P.; Steffen, L.S.; Dymecki, S.M. Widespread recombinase expression using FLPeR (flipper) mice. Genesis 2000, 28, 106–110. [Google Scholar] [CrossRef]
- Lakso, M.; Pichel, J.; Gorman, J.R.; Sauer, B.; Okamoto, Y.; Lee, E.; Alt, F.W.; Westphal, H. Efficient in vivo manipulation of mouse genomic sequences at the zygote stage. Proc. Natl. Acad. Sci. USA 1996, 93, 5860–5865. [Google Scholar] [CrossRef] [PubMed] [Green Version]
- Illes, P.; Müller, C.E.; Jacobson, K.A.; Grutter, T.; Nicke, A.; Fountain, S.J.; Di Virgilio, F. Update of P2X receptor properties and their pharmacology: IUPHAR Review 30. Br. J. Pharmacol. 2021, 178, 489–514. [Google Scholar] [CrossRef] [PubMed]
- Mouri, G.; Jiménez-Mateos, E.; Engel, T.; Dunleavy, M.; Hatazaki, S.; Paucard, A.; Matsushima, S.; Taki, W.; Henshall, D.C. Unilateral hippocampal CA3-predominant damage and short latency epileptogenesis after intra-amygdala microinjection of kainic acid in mice. Brain Res. 2008, 1213, 140–151. [Google Scholar] [CrossRef]
- Jimenez-Mateos, E.M.; Engel, T.; Merino-Serrais, P.; McKiernan, R.C.; Tanaka, K.; Mouri, G.; Henshall, D.C. Silencing microRNA-134 produces neuroprotective and prolonged seizure-suppressive effects. Nat. Med. 2012, 18, 1087–1094. [Google Scholar] [CrossRef] [Green Version]
- Engel, T.; Sanz-Rodgriguez, A.; Jiménez-Mateos, E.; Concannon, C.G.; Jimenez-Pacheco, A.; Moran, C.; Mesuret, G.; Petit, E.; Delaney, N.; Farrell, M.A.; et al. CHOP regulates the p53–MDM2 axis and is required for neuronal survival after seizures. Brain 2013, 136, 577–592. [Google Scholar] [CrossRef] [Green Version]
- Fleisher, T.A.; Oliveira, J.B. 92—Flow Cytometry. In Clinical Immunology, 5th ed.; Rich, R.R.R., Fleisher, T.A., Shearer, W.T., Schroeder, H.W., Jr., Frew, A.J., Weyand, C.M., Eds.; Elsevier: Amsterdam, The Netherlands, 2019. [Google Scholar]
- Lommen, J.; Stahr, A.; Ingenwerth, M.; Ali, A.A.H.; Von Gall, C. Time-of-day-dependent expression of purinergic receptors in mouse suprachiasmatic nucleus. Cell Tissue Res. 2017, 369, 579–590. [Google Scholar] [CrossRef] [PubMed] [Green Version]
- Rana, A.; Musto, A.E. The role of inflammation in the development of epilepsy. J. Neuroinflamm. 2018, 15, 144. [Google Scholar] [CrossRef] [PubMed]
- Matić, I.Z.; Kolundžija, B.; Damjanović, A.; Spasić, J.; Radosavljević, D.; Crnogorac, M.D.; Grozdanić, N.; Juranić, Z.D. Peripheral White Blood Cell Subsets in Metastatic Colorectal Cancer Patients Treated with Cetuximab: The Potential Clinical Relevance. Front. Immunol. 2018, 8. [Google Scholar] [CrossRef] [PubMed]
- Beamer, E.; Gölöncsér, F.; Horváth, G.; Bekő, K.; Otrokocsi, L.; Koványi, B.; Sperlágh, B. Purinergic mechanisms in neuroinflammation: An update from molecules to behavior. Neuropharmacology 2015, 104, 94–104. [Google Scholar] [CrossRef] [Green Version]
- Vezzani, A.; Friedman, A. Brain inflammation as a biomarker in epilepsy. Biomark. Med. 2011, 5, 607–614. [Google Scholar] [CrossRef] [Green Version]
- Hung, Y.-W.; Lai, M.-T.; Tseng, Y.-J.; Chou, C.-C.; Lin, Y.-Y. Monocyte chemoattractant protein-1 affects migration of hippocampal neural progenitors following status epilepticus in rats. J. Neuroinflamm. 2013, 10, 11. [Google Scholar] [CrossRef] [Green Version]
- Beamer, E.; Kuchukulla, M.; Boison, D.; Engel, T. ATP and adenosine—Two players in the control of seizures and epilepsy development. Prog. Neurobiol. 2021, 204, 102105. [Google Scholar] [CrossRef]
- Hogg, M.C.; Raoof, R.; El Naggar, H.; Monsefi, N.; Delanty, N.; O’Brien, D.F.; Bauer, S.; Rosenow, F.; Henshall, D.C.; Prehn, J.H. Elevation of plasma tRNA fragments precedes seizures in human epilepsy. J. Clin. Investig. 2019, 129, 2946–2951. [Google Scholar] [CrossRef] [Green Version]
- Hanin, A.; Lambrecq, V.; Denis, J.A.; Imbert-Bismut, F.; Rucheton, B.; Lamari, F.; Bonnefont-Rousselot, D.; Demeret, S.; Navarro, V. Cerebrospinal fluid and blood biomarkers of status epilepticus. Epilepsia 2019, 61, 6–18. [Google Scholar] [CrossRef]
- Ravizza, T.; Terrone, G.; Salamone, A.; Frigerio, F.; Balosso, S.; Antoine, D.J.; Vezzani, A. High Mobility Group Box 1 is a novel pathogenic factor and a mechanistic biomarker for epilepsy. Brain Behav. Immun. 2018, 72, 14–21. [Google Scholar] [CrossRef]
- Mathias, S.V.; Bensalem-Owen, M. Artifacts That Can Be Misinterpreted as Interictal Discharges. J. Clin. Neurophysiol. 2019, 36, 264–274. [Google Scholar] [CrossRef]
- Wu, H.; Nie, Y.; Xiong, H.; Liu, S.; Li, G.; Huang, A.; Guo, L.; Wang, S.; Xue, Y.; Wu, B.; et al. P2X7 Receptor Expression in Peripheral Blood Monocytes Is Correlated with Plasma C-Reactive Protein and Cytokine Levels in Patients With Type 2 Diabetes Mellitus: A Preliminary Report. Inflammation 2015, 38, 2076–2081. [Google Scholar] [CrossRef] [PubMed]
- Alapirtti, T.; Waris, M.; Fallah, M.; Soilu-Hänninen, M.; Mäkinen, R.; Kharazmi, E.; Peltola, J. C-reactive protein and seizures in focal epilepsy: A video-electroencephalographic study. Epilepsia 2012, 53, 790–796. [Google Scholar] [CrossRef] [PubMed]
- Ishikawa, N.; Kobayashi, Y.; Fujii, Y.; Kobayashi, M. Increased interleukin-6 and high-sensitivity C-reactive protein levels in pediatric epilepsy patients with frequent, refractory generalized motor seizures. Seizure 2015, 25, 136–140. [Google Scholar] [CrossRef] [Green Version]
- Kopczynska, M.; Zelek, W.M.; Vespa, S.; Touchard, S.; Wardle, M.; Loveless, S.; Thomas, R.H.; Hamandi, K.; Morgan, B.P. Complement system biomarkers in epilepsy. Seizure 2018, 60, 1–7. [Google Scholar] [CrossRef] [Green Version]
- Rizzo, R.; Ferrari, D.; Melchiorri, L.; Stignani, M.; Gulinelli, S.; Baricordi, O.R.; Di Virgilio, F. Extracellular ATP Acting at the P2X7Receptor Inhibits Secretion of Soluble HLA-G from Human Monocytes. J. Immunol. 2009, 183, 4302–4311. [Google Scholar] [CrossRef] [Green Version]
- Lioi, A.B.; Ferrari, B.M.; Dubyak, G.R.; Weinberg, A.; Sieg, S.F. Human beta Defensin-3 Increases CD86 Expression on Monocytes by Activating the ATP-Gated Channel P2X7. J. Immunol. 2015, 195, 4438–4445. [Google Scholar] [CrossRef] [PubMed] [Green Version]
- Davalos, D.; Grutzendler, J.; Yang, G.; Kim, J.V.; Zuo, Y.; Jung, S.; Littman, D.R.; Dustin, M.; Gan, W.-B. ATP mediates rapid microglial response to local brain injury in vivo. Nat. Neurosci. 2005, 8, 752–758. [Google Scholar] [CrossRef] [PubMed]
- Zhang, Y.; Zhang, Y.; Li, H.; Jia, X.; Zhang, X.; Xia, Y.; Geng, D. Increased expression of P2X7 receptor in peripheral blood mononuclear cells correlates with clinical severity and serum levels of Th17-related cytokines in patients with myasthenia gravis. Clin. Neurol. Neurosurg. 2017, 157, 88–94. [Google Scholar] [CrossRef]
- Surprenant, A.; Rassendren, F.; Kawashima, E.; North, R.A.; Buell, G. The Cytolytic P2Z Receptor for Extracellular ATP Identified as a P2X Receptor (P2X7). Science 1996, 272, 735–738. [Google Scholar] [CrossRef]
- Johnson, A.E.; Dao, T.L.; Guignet, M.; Geddes, E.C.; I Koemeter-Cox, A.; Kan, R.K. Increased expression of the chemokines CXCL1 and MIP-1α by resident brain cells precedes neutrophil infiltration in the brain following prolonged soman-induced status epilepticus in rats. J. Neuroinflamm. 2011, 8, 41. [Google Scholar] [CrossRef] [PubMed] [Green Version]
- Avdic, U.; Ahl, M.; Öberg, M.; Ekdahl, C.T. Immune Profile in Blood Following Non-convulsive Epileptic Seizures in Rats. Front. Neurol. 2019, 10. [Google Scholar] [CrossRef] [PubMed]
- Kothur, K.; Bandodkar, S.; Wienholt, L.; Chu, S.; Pope, A.; Gill, D.; Dale, R.C. Etiology is the key determinant of neuroinflammation in epilepsy: Elevation of cerebrospinal fluid cytokines and chemokines in febrile infection-related epilepsy syndrome and febrile status epilepticus. Epilepsia 2019, 60, 1678–1688. [Google Scholar] [CrossRef]
- Lee, J.; Cacalano, G.; Camerato, T.; Toy, K.; Moore, M.W.; I Wood, W. Chemokine binding and activities mediated by the mouse IL-8 receptor. J. Immunol. 1995, 155. [Google Scholar]
- Kim, J.-E.; Ryu, H.J.; Yeo, S.-I.; Kang, T.-C. P2X7 receptor regulates leukocyte infiltrations in rat frontoparietal cortex following status epilepticus. J. Neuroinflamm. 2010, 7, 65. [Google Scholar] [CrossRef] [Green Version]
- Boro, M.; Balaji, K.N. CXCL1 and CXCL2 Regulate NLRP3 Inflammasome Activation via G-Protein–Coupled Receptor CXCRJ. Immunol. 2017, 199, 1660–1671. [Google Scholar] [CrossRef]
- Shieh, C.-H.; Heinrich, A.; Serchov, T.; Van Calker, D.; Biber, K. P2X7-dependent, but differentially regulated release of IL-6, CCL2, and TNF-α in cultured mouse microglia. Glia 2014, 62, 592–607. [Google Scholar] [CrossRef]
- Chessell, I.P.; Hatcher, J.P.; Bountra, C.; Michel, A.D.; Hughes, J.P.; Green, P.; Egerton, J.; Murfin, M.; Richardson, J.; Peck, W.L.; et al. Disruption of the P2X7 purinoceptor gene abolishes chronic inflammatory and neuropathic pain. Pain 2005, 114, 386–396. [Google Scholar] [CrossRef] [PubMed]
- Bianchi, G.; Vuerich, M.; Pellegatti, P.; Marimpietri, D.; Emionite, L.; Marigo, I.; Bronte, V.; Di Virgilio, F.; Pistoia, V.; Raffaghello, L. ATP/P2X7 axis modulates myeloid-derived suppressor cell functions in neuroblastoma microenvironment. Cell Death Dis. 2014, 5, e1135. [Google Scholar] [CrossRef] [Green Version]
- Shiratori, M.; Tozaki-Saitoh, H.; Yoshitake, M.; Tsuda, M.; Inoue, K. P2X7 receptor activation induces CXCL2 production in microglia through NFAT and PKC/MAPK pathways. J. Neurochem. 2010, 114, 810–819. [Google Scholar] [CrossRef] [PubMed]
- Kurashima, Y.; Amiya, T.; Nochi, T.; Fujisawa, K.; Haraguchi, T.; Iba, H.; Tsutsui, H.; Sato, S.; Nakajima, S.; Iijima, H.; et al. Extracellular ATP mediates mast cell-dependent intestinal inflammation through P2X7 purinoceptors. Nat. Commun. 2012, 3, 1034. [Google Scholar] [CrossRef]
- Solle, M.; Labasi, J.; Perregaux, D.G.; Stam, E.; Petrushova, N.; Koller, B.H.; Griffiths, R.J.; Gabel, C.A. Altered Cytokine Production in Mice Lacking P2X7Receptors. J. Biol. Chem. 2001, 276, 125–132. [Google Scholar] [CrossRef] [PubMed] [Green Version]
- Masin, M.; Young, C.; Lim, K.; Barnes, S.J.; Xu, X.J.; Marschall, V.; Brutkowski, W.; Mooney, E.R.; Gorecki, D.; Murrell-Lagnado, R. Expression, assembly and function of novel C-terminal truncated variants of the mouse P2X7 receptor: Re-evaluation of P2X7 knockouts. Br. J. Pharmacol. 2012, 165, 978–993. [Google Scholar] [CrossRef] [Green Version]
- Gabel, C.A. P2 purinergic receptor modulation of cytokine production. Purinergic Signal. 2007, 3, 27–38. [Google Scholar] [CrossRef] [Green Version]
- Burnstock, G. P2X ion channel receptors and inflammation. Purinergic Signal. 2016, 12, 59–67. [Google Scholar] [CrossRef] [PubMed] [Green Version]
- Bauer, S.; Cepok, S.; Todorova-Rudolph, A.; Nowak, M.; Köller, M.; Lorenz, R.; Oertel, W.H.; Rosenow, F.; Hemmer, B.; Hamer, H.M. Etiology and site of temporal lobe epilepsy influence postictal cytokine release. Epilepsy Res. 2009, 86, 82–88. [Google Scholar] [CrossRef] [PubMed]
- Ulusoy, C.; Vanlı-Yavuz, E.N.; Şanlı, E.; Timirci-Kahraman, Ö.; Yılmaz, V.; Bebek, N.; Küçükali, C.I.; Baykan, B.; Tüzün, E. Peripheral blood expression levels of inflammasome complex components in two different focal epilepsy syndromes. J. Neuroimmunol. 2020, 347, 577343. [Google Scholar] [CrossRef]


Publisher’s Note: MDPI stays neutral with regard to jurisdictional claims in published maps and institutional affiliations. |
© 2021 by the authors. Licensee MDPI, Basel, Switzerland. This article is an open access article distributed under the terms and conditions of the Creative Commons Attribution (CC BY) license (https://creativecommons.org/licenses/by/4.0/).
Share and Cite
Conte, G.; Menéndez-Méndez, A.; Bauer, S.; El-Naggar, H.; Alves, M.; Nicke, A.; Delanty, N.; Rosenow, F.; Henshall, D.C.; Engel, T. Circulating P2X7 Receptor Signaling Components as Diagnostic Biomarkers for Temporal Lobe Epilepsy. Cells 2021, 10, 2444. https://doi.org/10.3390/cells10092444
Conte G, Menéndez-Méndez A, Bauer S, El-Naggar H, Alves M, Nicke A, Delanty N, Rosenow F, Henshall DC, Engel T. Circulating P2X7 Receptor Signaling Components as Diagnostic Biomarkers for Temporal Lobe Epilepsy. Cells. 2021; 10(9):2444. https://doi.org/10.3390/cells10092444
Chicago/Turabian StyleConte, Giorgia, Aida Menéndez-Méndez, Sebastian Bauer, Hany El-Naggar, Mariana Alves, Annette Nicke, Norman Delanty, Felix Rosenow, David C. Henshall, and Tobias Engel. 2021. "Circulating P2X7 Receptor Signaling Components as Diagnostic Biomarkers for Temporal Lobe Epilepsy" Cells 10, no. 9: 2444. https://doi.org/10.3390/cells10092444