
Functional Profiling of In Vitro Reactivated Memory B Cells Following Natural SARS-CoV-2 Infection and Gam-COVID-Vac Vaccination

 , , , , and
Abstract
:1. Introduction
2. Materials and Methods
2.1. Study Volunteers
2.2. Blood Sample Collection and Processing
2.3. ELISA Quantification of RBD-Specific IgG, IgA, and IgM Antibodies
2.4. Flow Cytometry
2.5. B-Cell Stimulation and ELISpot Assay
2.6. Pseudotyped Virus Neutralization Assay (pVNA)
2.7. Statistical Analysis
3. Results
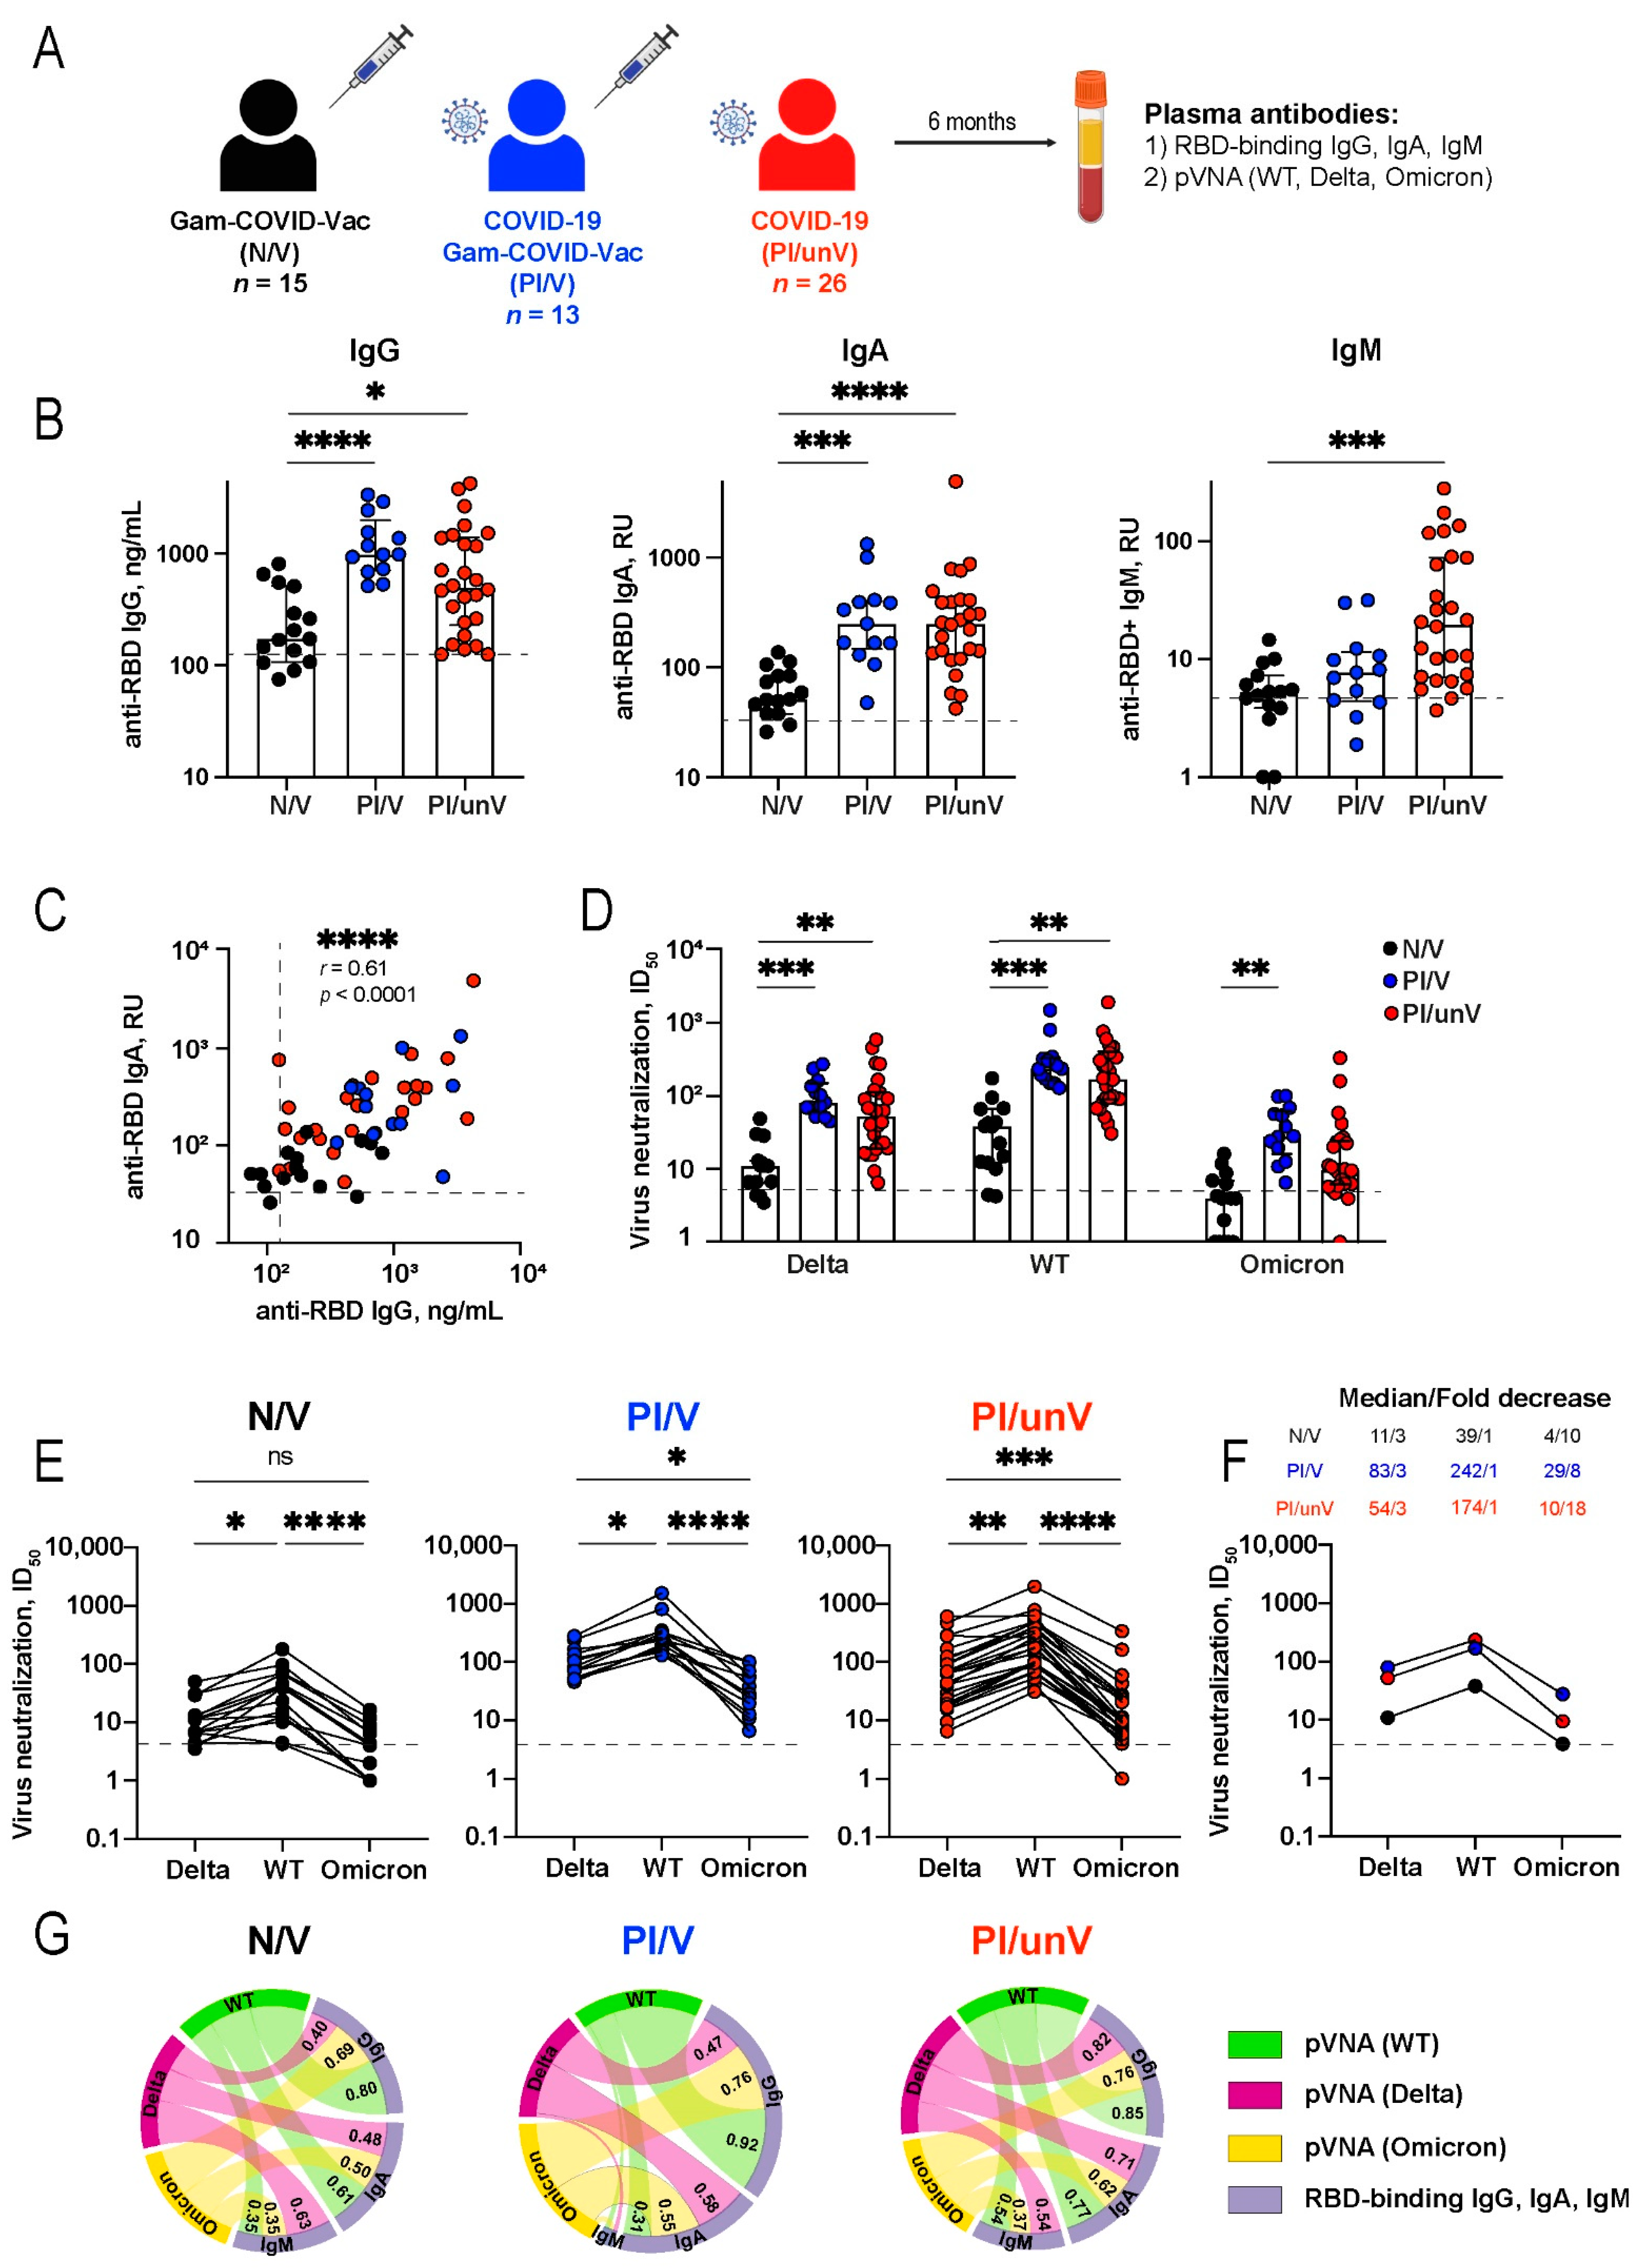
3.1. Study Design
3.2. Serum Antibody Responses to SARS-CoV-2 Antigens from COVID-19 Convalescent Patients and Gam-COVID-Vac Vaccinees
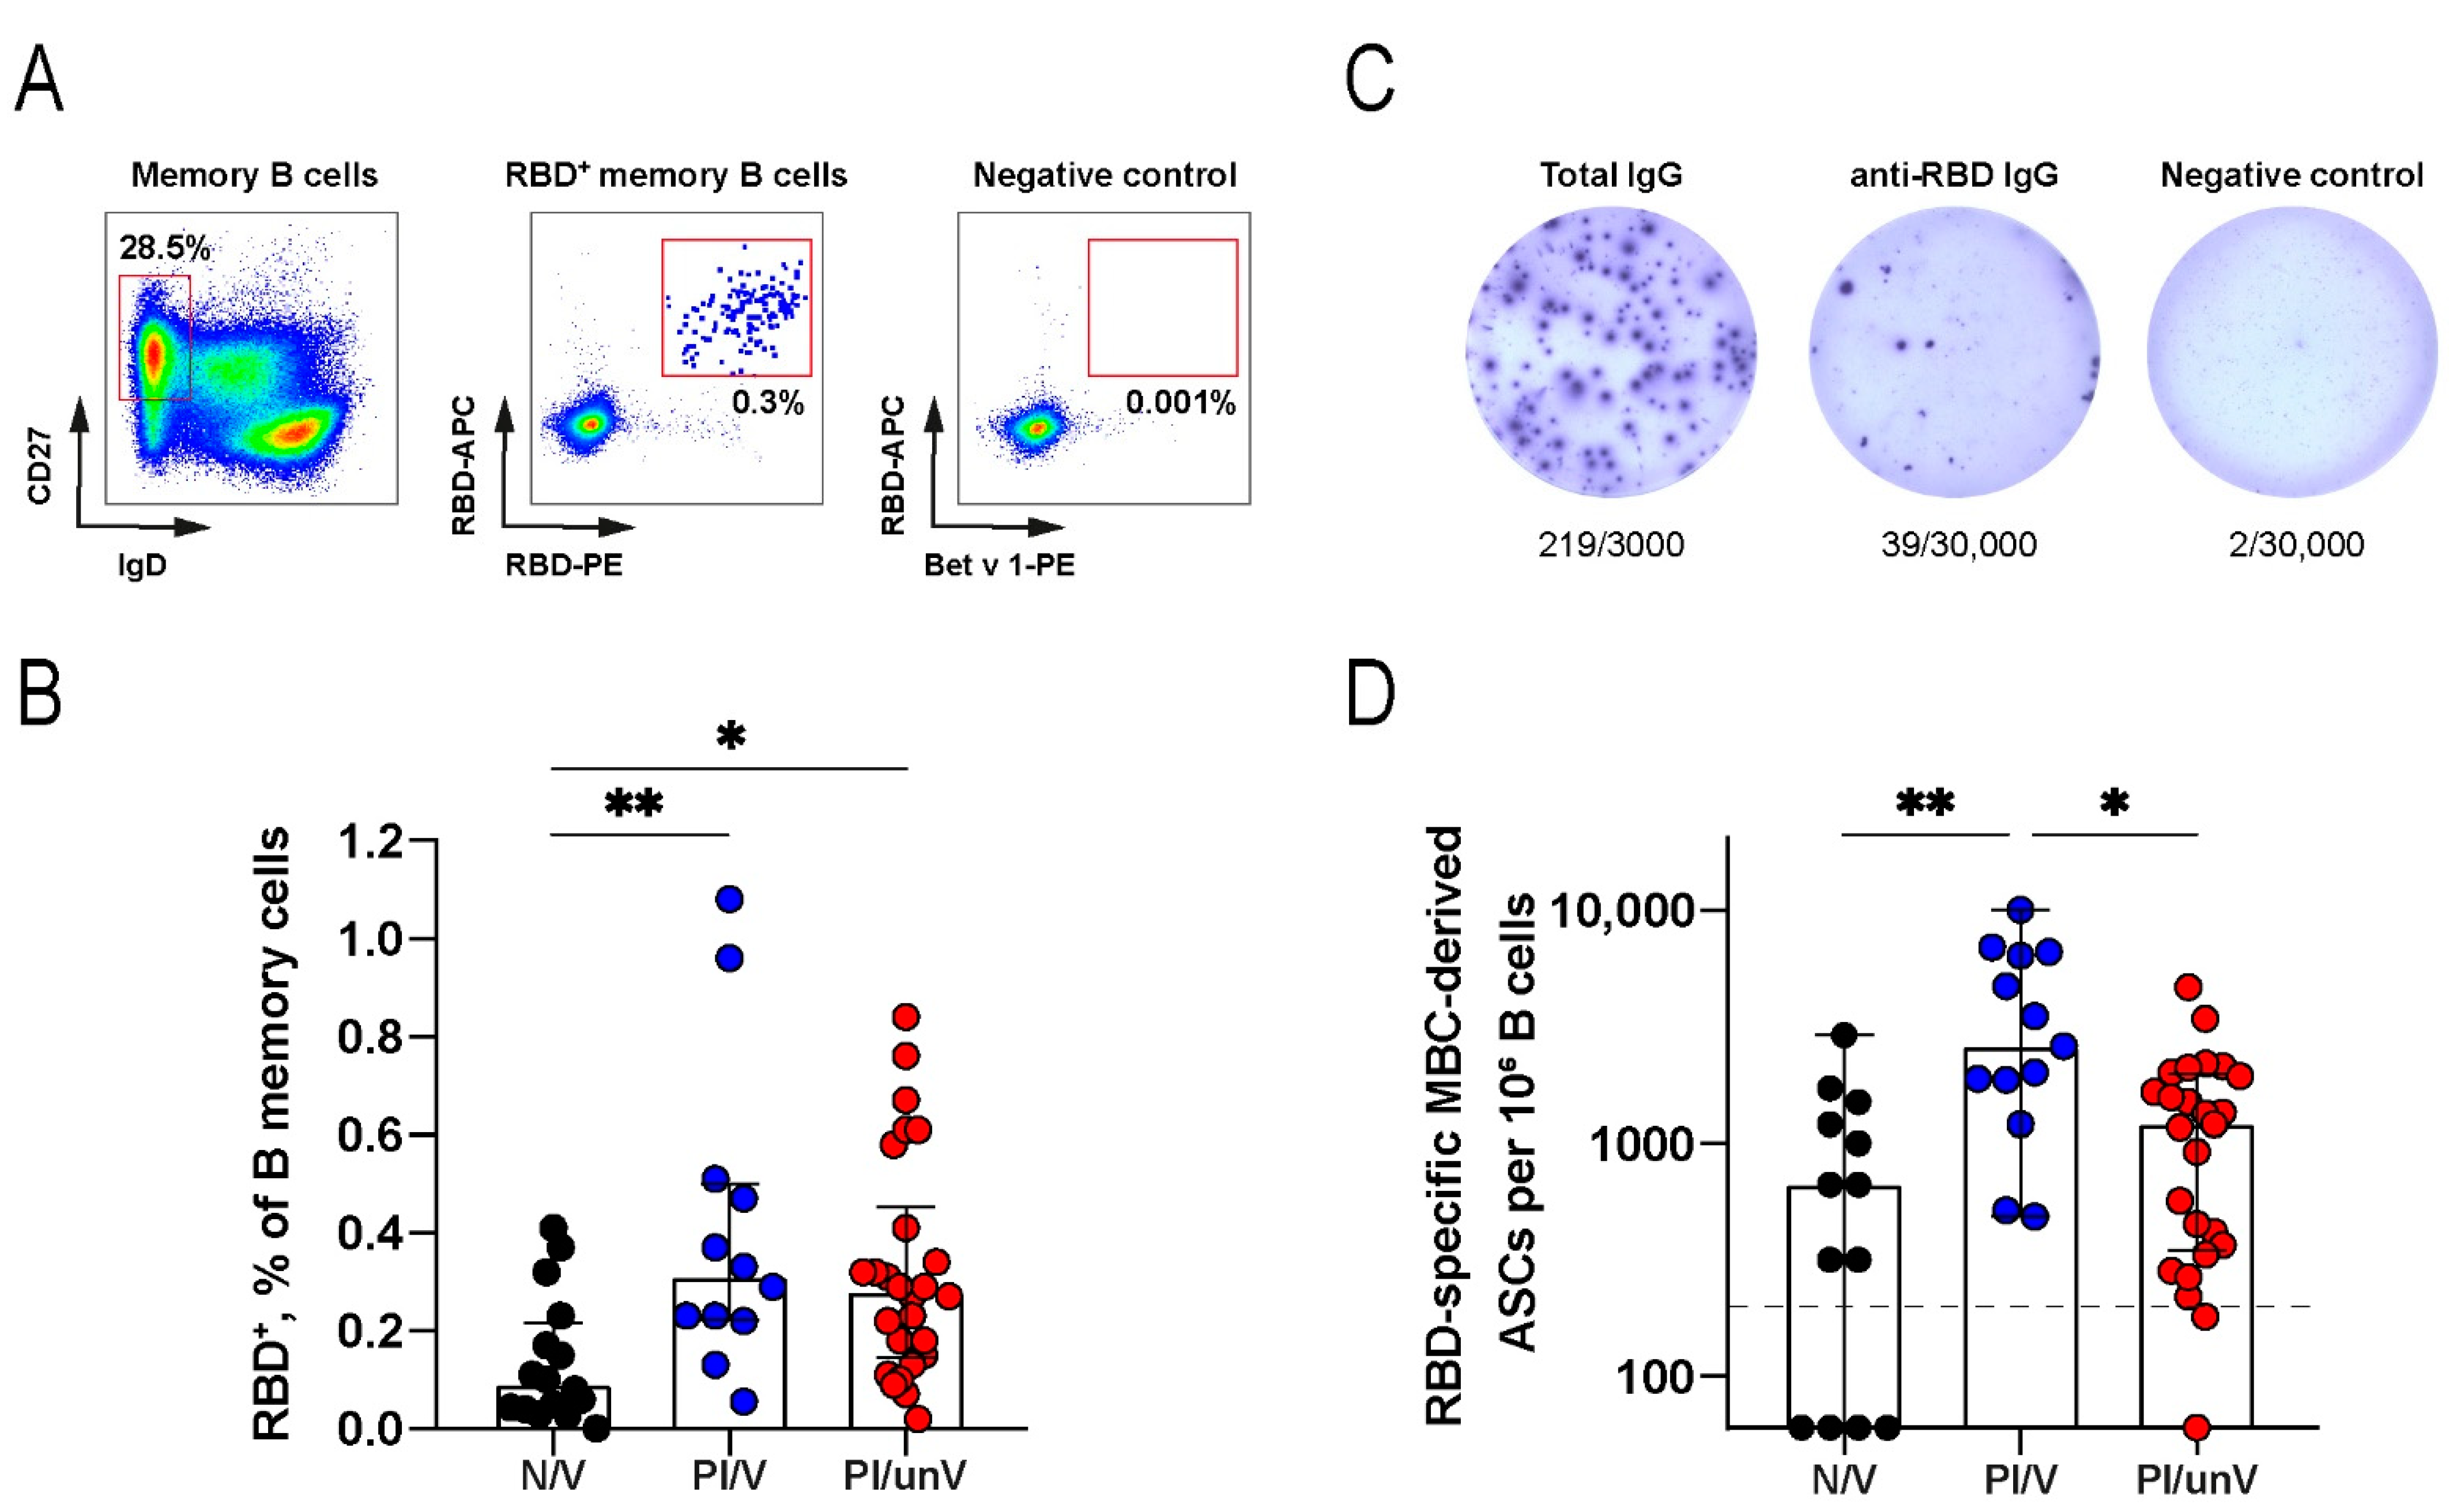
3.3. Memory B-Cell Response
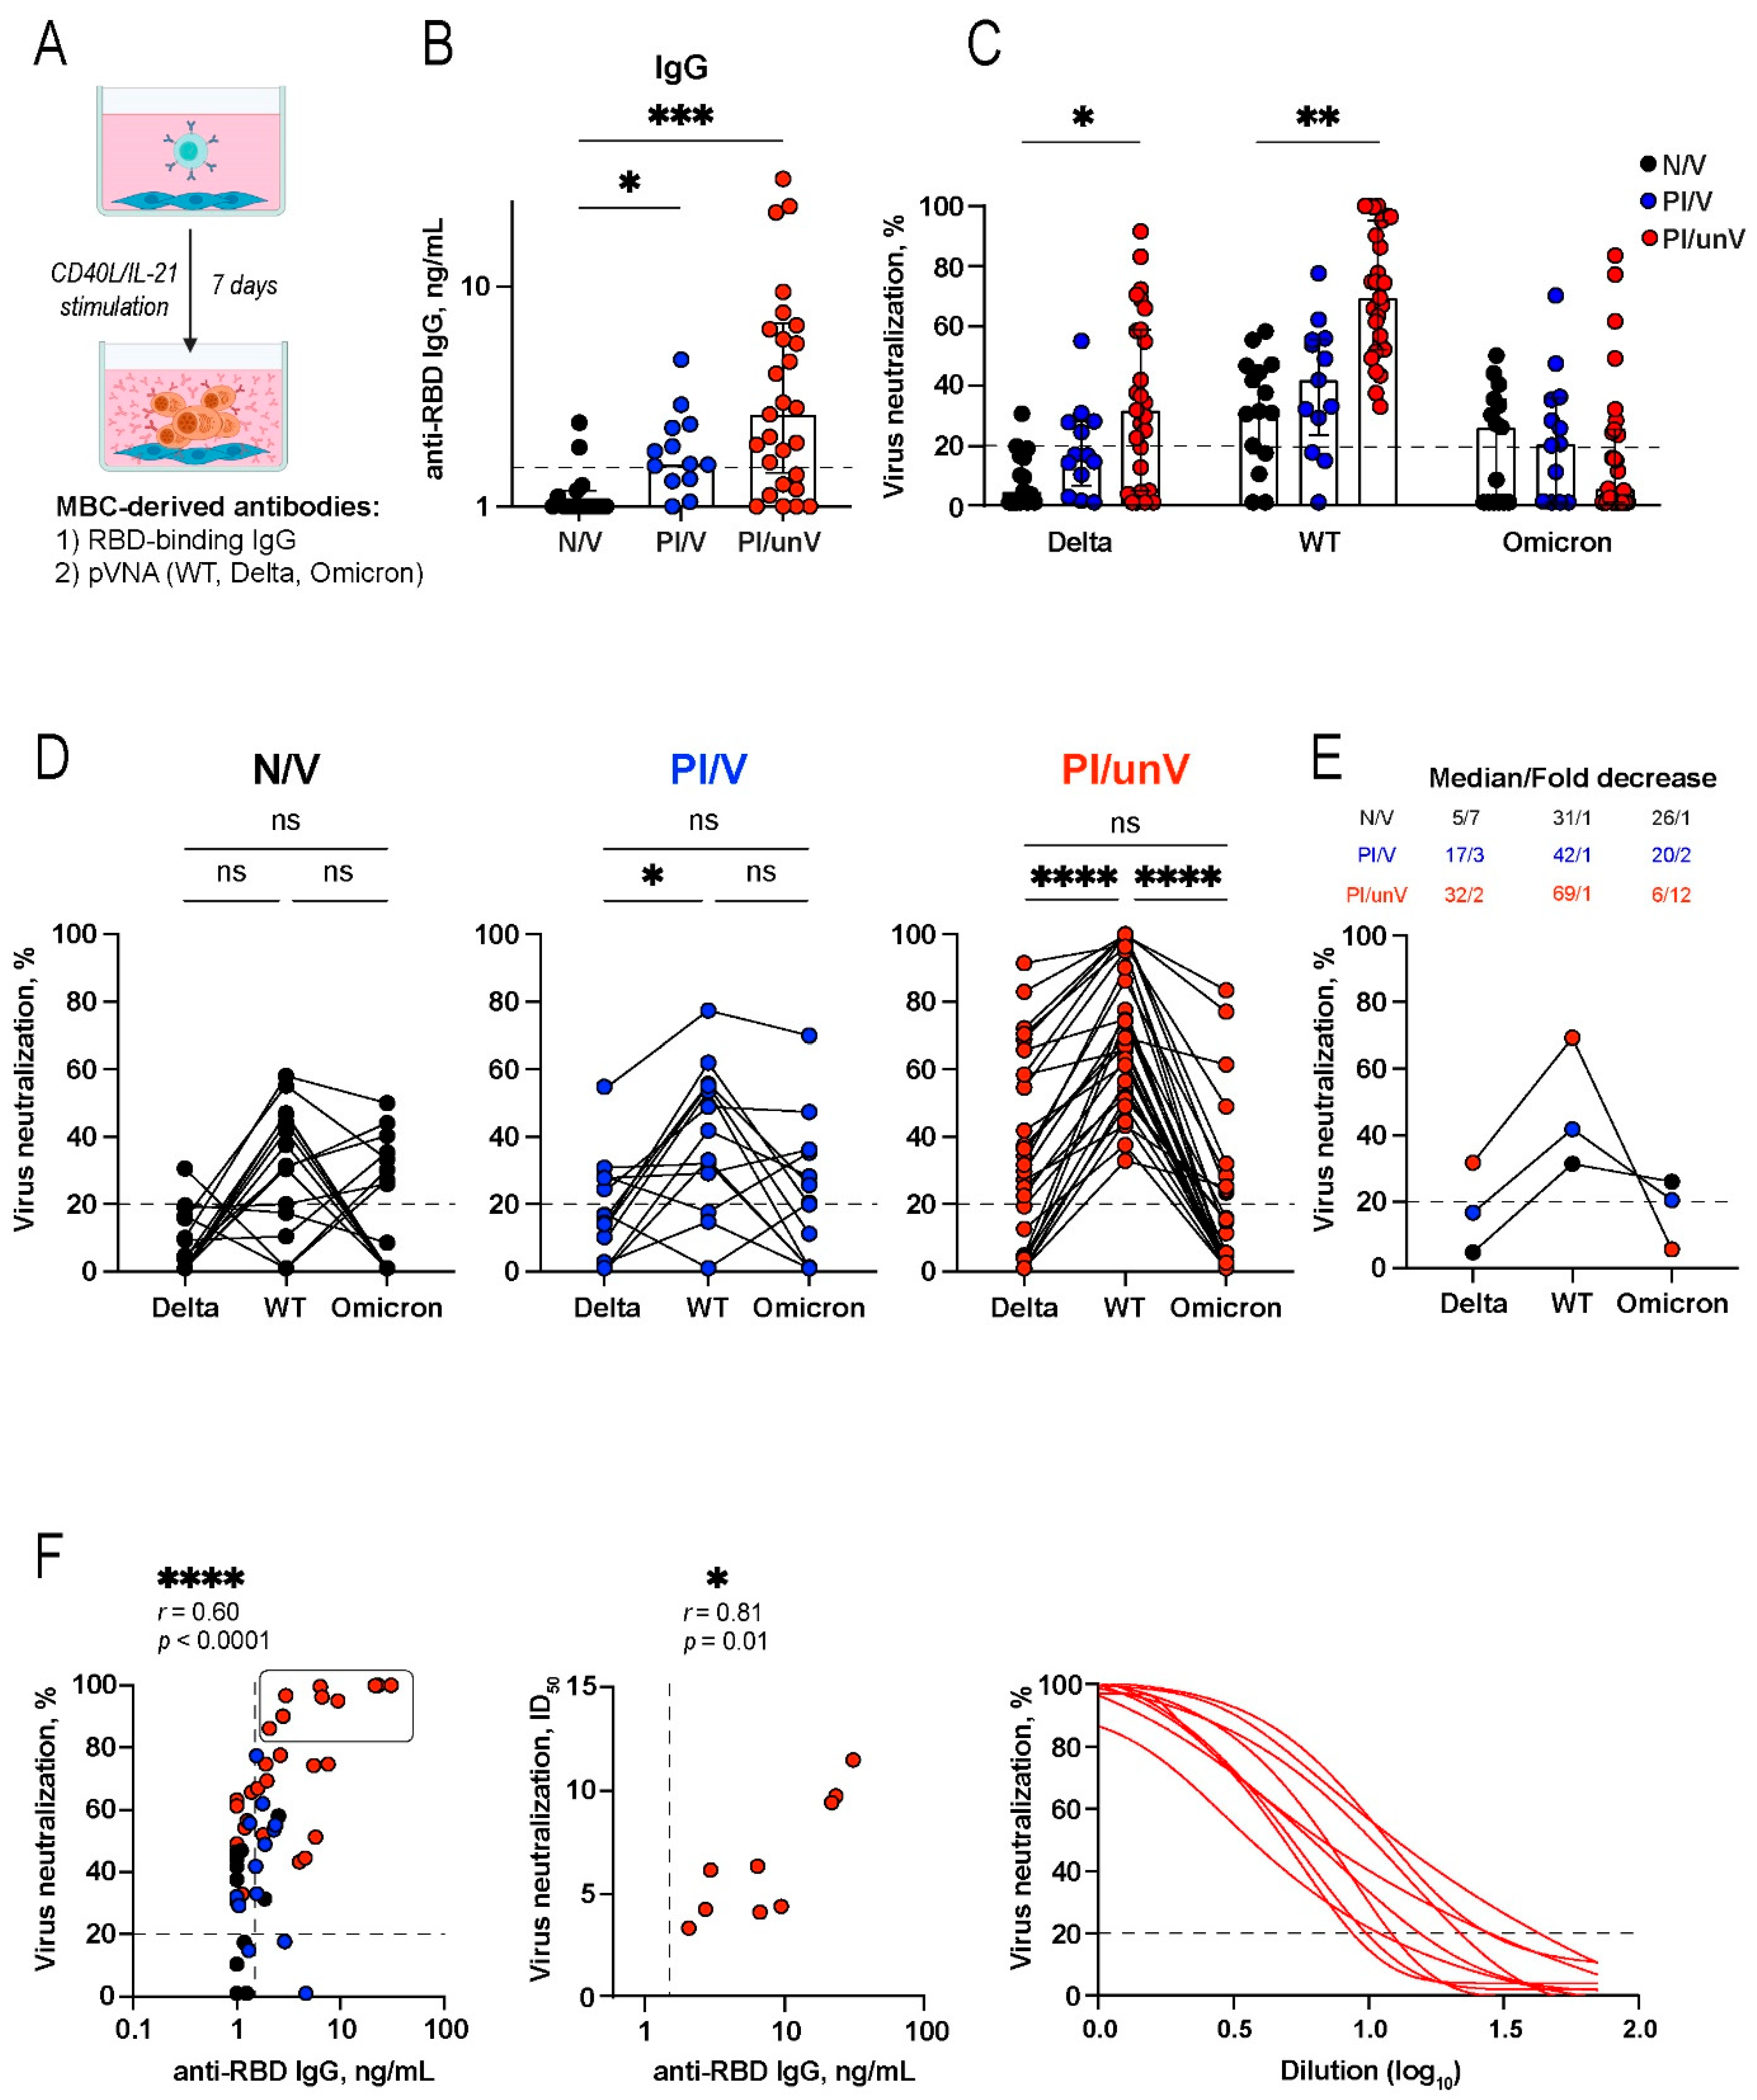
3.4. The Functionality of MBC-Derived SARS-CoV-2 Antigen-Specific Antibodies
4. Discussion
5. Conclusions
Supplementary Materials
Author Contributions
Funding
Institutional Review Board Statement
Informed Consent Statement
Data Availability Statement
Acknowledgments
Conflicts of Interest
References
- Kim, P.; Gordon, S.M.; Sheehan, M.M.; Rothberg, M.B. Duration of SARS-CoV-2 natural immunity and protection against the Delta variant: A retrospective cohort study. Clin. Infect. Dis. 2021, ciab999. [Google Scholar] [CrossRef] [PubMed]
- Castro Dopico, X.; Ols, S.; Loré, K.; Karlsson Hedestam, G.B. Immunity to SARS-CoV-2 induced by infection or vaccination. J. Intern. Med. 2022, 291, 32–50. [Google Scholar] [CrossRef] [PubMed]
- Heinz, F.X.; Stiasny, K. Distinguishing features of current COVID-19 vaccines: Knowns and unknowns of antigen presentation and modes of action. npj Vaccines 2021, 6, 104. [Google Scholar] [CrossRef] [PubMed]
- Kojima, N.; Klausner, J.D. Protective immunity after recovery from SARS-CoV-2 infection. Lancet Infect. Dis. 2022, 22, 12–14. [Google Scholar] [CrossRef]
- Shenai, M.B.; Rahme, R.; Noorchashm, H. Equivalency of protection from natural immunity in COVID-19 recovered versus fully vaccinated persons: A systematic review and pooled analysis. Cureus 2021, 13, e19102. [Google Scholar] [CrossRef]
- Gazit, S.; Shlezinger, R.; Perez, G.; Lotan, R.; Peretz, A.; Ben-Tov, A.; Cohen, D.; Muhsen, K.; Chodick, G.; Patalon, T. Comparing SARS-CoV-2 natural immunity to vaccine-induced immunity: Reinfections versus breakthrough infections. medRxiv 2021. [Google Scholar] [CrossRef]
- Pilz, S.; Theiler-Schwetz, V.; Trummer, C.; Krause, R.; Ioannidis, J.P.A. SARS-CoV-2 reinfections: Overview of efficacy and duration of natural and hybrid immunity. Environ. Res. 2022, 209, 112911. [Google Scholar] [CrossRef]
- Dan, J.M.; Mateus, J.; Kato, Y.; Hastie, K.M.; Yu, E.D.; Faliti, C.E.; Grifoni, A.; Ramirez, S.I.; Haupt, S.; Frazier, A.; et al. Immunological memory to SARS-CoV-2 assessed for up to 8 months after infection. Science 2021, 371, eabf4063. [Google Scholar] [CrossRef]
- Goel, R.R.; Apostolidis, S.A.; Painter, M.M.; Mathew, D.; Pattekar, A.; Kuthuru, O.; Gouma, S.; Hicks, P.; Meng, W.; Rosenfeld, A.M.; et al. Distinct antibody and memory b cell responses in SARS-CoV-2 naïve and recovered individuals following mRNA vaccination. Sci. Immunol. 2021, 6, eabi6950. [Google Scholar] [CrossRef]
- De Giorgi, V.; West, K.A.; Henning, A.N.; Chen, L.N.; Holbrook, M.R.; Gross, R.; Liang, J.; Postnikova, E.; Trenbeath, J.; Pogue, S.; et al. Naturally acquired SARS-CoV-2 immunity persists for up to 11 months following infection. J. Infect. Dis. 2021, 224, 1294–1304. [Google Scholar] [CrossRef]
- Assis, R.; Jain, A.; Nakajima, R.; Jasinskas, A.; Khan, S.; Palma, A.; Parker, D.M.; Chau, A.; Specimen Collection Group; Hosseinian, S.; et al. Distinct SARS-CoV-2 antibody reactivity patterns elicited by natural infection and mRNA vaccination. npj Vaccines 2021, 6, 132. [Google Scholar] [CrossRef] [PubMed]
- Yu, Y.; Esposito, D.; Kang, Z.; Lu, J.; Remaley, A.T.; De Giorgi, V.; Chen, L.N.; West, K.; Cao, L. mRNA vaccine-induced antibodies more effective than natural immunity in neutralizing SARS-CoV-2 and its high affinity variants. Sci. Rep. 2022, 12, 2628. [Google Scholar] [CrossRef] [PubMed]
- Petrović, V.; Vuković, V.; Patić, A.; Marković, M.; Ristić, M. Immunogenicity of BNT162b2, BBIBP-CorV and Gam-COVID-Vac vaccines and immunity after natural SARS-CoV-2 infection—A comparative study from Novi Sad, Serbia. PLoS ONE 2022, 17, e0263468. [Google Scholar] [CrossRef] [PubMed]
- Naranbhai, V.; Nathan, A.; Kaseke, C.; Berrios, C.; Khatri, A.; Choi, S.; Getz, M.A.; Tano-Menka, R.; Ofoman, O.; Gayton, A.; et al. T-Cell Reactivity to the SARS-CoV-2 Omicron variant is preserved in most but not all individuals. Cell 2022, 185, 1041–1051.e6. [Google Scholar] [CrossRef] [PubMed]
- Pape, K.A.; Dileepan, T.; Kabage, A.J.; Kozysa, D.; Batres, R.; Evert, C.; Matson, M.; Lopez, S.; Krueger, P.D.; Graiziger, C.; et al. High-affinity memory B cells induced by SARS-CoV-2 infection produce more plasmablasts and atypical memory B cells than those primed by mRNA vaccines. Cell Rep. 2021, 37, 109823. [Google Scholar] [CrossRef]
- Amanat, F.; Thapa, M.; Lei, T.; Ahmed, S.M.S.; Adelsberg, D.C.; Carreño, J.M.; Strohmeier, S.; Schmitz, A.J.; Zafar, S.; Zhou, J.Q.; et al. SARS-CoV-2 mRNA vaccination induces functionally diverse antibodies to NTD, RBD, and S2. Cell 2021, 184, 3936–3948.e10. [Google Scholar] [CrossRef]
- Ciabattini, A.; Pastore, G.; Fiorino, F.; Polvere, J.; Lucchesi, S.; Pettini, E.; Auddino, S.; Rancan, I.; Durante, M.; Miscia, M.; et al. Evidence of SARS-CoV-2-specific memory B cells six months after vaccination with the BNT162b2 mRNA vaccine. Front. Immunol. 2021, 12, 740708. [Google Scholar] [CrossRef]
- Logunov, D.Y.; Dolzhikova, I.V.; Shcheblyakov, D.V.; Tukhvatulin, A.I.; Zubkova, O.V.; Dzharullaeva, A.S.; Kovyrshina, A.V.; Lubenets, N.L.; Grousova, D.M.; Erokhova, A.S.; et al. Safety and efficacy of an rAd26 and rAd5 vector-based heterologous prime-boost COVID-19 vaccine: An interim analysis of a randomised controlled phase 3 trial in Russia. Lancet 2021, 397, 671–681. [Google Scholar] [CrossRef]
- Gushchin, V.A.; Dolzhikova, I.V.; Shchetinin, A.M.; Odintsova, A.S.; Siniavin, A.E.; Nikiforova, M.A.; Pochtovyi, A.A.; Shidlovskaya, E.V.; Kuznetsova, N.A.; Burgasova, O.A.; et al. Neutralizing activity of sera from Sputnik V-vaccinated people against variants of concern (VOC: B.1.1.7, B.1.351, P.1, B.1.617.2, B.1.617.3) and Moscow endemic SARS-CoV-2 variants. Vaccines 2021, 9, 779. [Google Scholar] [CrossRef] [PubMed]
- Barchuk, A.; Cherkashin, M.; Bulina, A.; Berezina, N.; Rakova, T.; Kuplevatskaya, D.; Stanevich, O.; Skougarevskiy, D.; Okhotin, A. Vaccine effectiveness against referral to hospital and severe lung injury associated with COVID-19: A case-control study in St. Petersburg, Russia. medRxiv 2021. [Google Scholar] [CrossRef]
- Nogrady, B. Mounting evidence suggests Sputnik COVID vaccine is safe and effective. Nature 2021, 595, 339–340. [Google Scholar] [CrossRef] [PubMed]
- Byazrova, M.G.; Kulemzin, S.V.; Astakhova, E.A.; Belovezhets, T.N.; Efimov, G.A.; Chikaev, A.N.; Kolotygin, I.O.; Gorchakov, A.A.; Taranin, A.V.; Filatov, A.V. Memory B cells induced by Sputnik V vaccination produce SARS-CoV-2 neutralizing antibodies upon ex vivo restimulation. Front. Immunol. 2022, 13, 840707. [Google Scholar] [CrossRef]
- Gorchakov, A.A.; Kulemzin, S.V.; Guselnikov, S.V.; Baranov, K.O.; Belovezhets, T.N.; Mechetina, L.V.; Volkova, O.Y.; Najakshin, A.M.; Chikaev, N.A.; Chikaev, A.N.; et al. Isolation of a panel of ultra-potent human antibodies neutralizing SARS-CoV-2 and viral variants of concern. Cell Discov. 2021, 7, 96. [Google Scholar] [CrossRef] [PubMed]
- Byazrova, M.; Yusubalieva, G.; Spiridonova, A.; Efimov, G.; Mazurov, D.; Baranov, K.; Baklaushev, V.; Filatov, A. Pattern of circulating SARS-CoV-2-specific antibody-secreting and memory B-cell generation in patients with acute COVID-19. Clin. Transl. Immunol. 2021, 10, e1245. [Google Scholar] [CrossRef] [PubMed]
- Cho, A.; Muecksch, F.; Schaefer-Babajew, D.; Wang, Z.; Finkin, S.; Gaebler, C.; Ramos, V.; Cipolla, M.; Mendoza, P.; Agudelo, M.; et al. Anti-SARS-CoV-2 receptor-binding domain antibody evolution after mRNA vaccination. Nature 2021, 600, 517–522. [Google Scholar] [CrossRef] [PubMed]
- Sokal, A.; Barba-Spaeth, G.; Fernández, I.; Broketa, M.; Azzaoui, I.; de La Selle, A.; Vandenberghe, A.; Fourati, S.; Roeser, A.; Meola, A.; et al. mRNA vaccination of naive and COVID-19-recovered individuals elicits potent memory B cells that recognize SARS-CoV-2 variants. Immunity 2021, 54, 2893–2907.e5. [Google Scholar] [CrossRef] [PubMed]
- Komissarov, A.B.; Safina, K.R.; Garushyants, S.K.; Fadeev, A.V.; Sergeeva, M.V.; Ivanova, A.A.; Danilenko, D.M.; Lioznov, D.; Shneider, O.V.; Shvyrev, N.; et al. Genomic epidemiology of the early stages of the SARS-CoV-2 outbreak in Russia. Nat. Commun. 2021, 12, 649. [Google Scholar] [CrossRef]
- Matsvay, A.; Klink, G.V.; Safina, K.R.; Nabieva, E.; Garushyants, S.K.; Biba, D.; Bazykin, G.A.; Mikhaylov, I.M.; Say, A.V.; Zakamornaya, A.I.; et al. Genomic epidemiology of SARS-CoV-2 in Russia reveals recurring cross-border transmission throughout 2020. medRxiv 2021, 1–25. [Google Scholar] [CrossRef]
- Wang, Z.; Muecksch, F.; Schaefer-Babajew, D.; Finkin, S.; Viant, C.; Gaebler, C.; Hoffmann, H.H.; Barnes, C.O.; Cipolla, M.; Ramos, V.; et al. Naturally enhanced neutralizing breadth against SARS-CoV-2 one year after infection. Nature 2021, 595, 426–431. [Google Scholar] [CrossRef]
- Kuri-Cervantes, L.; Pampena, M.B.; Meng, W.; Rosenfeld, A.M.; Ittner, C.A.G.; Weisman, A.R.; Agyekum, R.S.; Mathew, D.; Baxter, A.E.; Vella, L.A.; et al. Comprehensive mapping of immune perturbations associated with severe COVID-19. Sci. Immunol. 2020, 5, eabd7114. [Google Scholar] [CrossRef]
- Woodruff, M.C.; Ramonell, R.P.; Nguyen, D.C.; Cashman, K.S.; Saini, A.S.; Haddad, N.S.; Ley, A.M.; Kyu, S.; Howell, J.C.; Ozturk, T.; et al. Extrafollicular B cell responses correlate with neutralizing antibodies and morbidity in COVID-19. Nat. Immunol. 2020, 21, 1506–1516. [Google Scholar] [CrossRef] [PubMed]
- Trougakos, I.P.; Terpos, E.; Zirou, C.; Sklirou, A.D.; Apostolakou, F.; Gumeni, S.; Charitaki, I.; Papanagnou, E.-D.; Bagratuni, T.; Liacos, C.-I.; et al. Comparative kinetics of SARS-CoV-2 anti-Spike protein RBD IgGs and neutralizing antibodies in convalescent and naïve recipients of the BNT162b2 mRNA vaccine versus COVID-19 patients. BMC Med. 2021, 19, 208. [Google Scholar] [CrossRef] [PubMed]
- Röltgen, K.; Nielsen, S.C.A.; Arunachalam, P.S.; Yang, F.; Hoh, R.A.; Wirz, O.F.; Lee, A.S.; Gao, F.; Mallajosyula, V.; Li, C.; et al. mRNA vaccination compared to infection elicits an IgG-predominant response with greater SARS-CoV-2 specificity and similar decrease in variant spike recognition. medRxiv 2021. [Google Scholar] [CrossRef]
- Greaney, A.J.; Loes, A.N.; Gentles, L.E.; Crawford, K.H.D.; Starr, T.N.; Malone, K.D.; Chu, H.Y.; Bloom, J.D. Antibodies elicited by mRNA-1273 vaccination bind more broadly to the receptor binding domain than do those from SARS-CoV-2 infection. Sci. Transl. Med. 2021, 13, eabi9915. [Google Scholar] [CrossRef] [PubMed]
- Laidlaw, B.J.; Ellebedy, A.H. The germinal centre B cell response to SARS-CoV-2. Nat. Rev. Immunol. 2021, 22, 7–18. [Google Scholar] [CrossRef]
- Stamatatos, L.; Czartoski, J.; Wan, Y.-H.; Homad, L.J.; Rubin, V.; Glantz, H.; Neradilek, M.; Seydoux, E.; Jennewein, M.F.; MacCamy, A.J.; et al. mRNA vaccination boosts cross-variant neutralizing antibodies elicited by SARS-CoV-2 infection. Science 2021, 372, 1413–1418. [Google Scholar] [CrossRef]


| Study Group | SARS-CoV-2-Naïve, Gam-COVID-Vac (N/V) | SARS-CoV-2- Infected, Gam-COVID-Vac (PI/V) | SARS-CoV-2- Infected, Unvaccinated (PI/unV) |
|---|---|---|---|
| Number of participants | 15 | 13 | 26 |
| Age, years, median, (range) | 60 | 42 | 51 |
| (24–70) | (23–69) | (21–64) | |
| Female | 11 | 5 | 10 |
| Male | 4 | 8 | 16 |
| Days after first dose of vaccination, median (range) | 179 (166–197) | 175 (167–193) | - |
| Days after recovery median (range) | - | - | 185 (178–208) |
| Days between infection and vaccination days, median (range) | - | 102 (53–178) | - |
| PCR-confirmed COVID-19 | - | 13/13 | 26/26 |
| Anti-Nucleocapsid antibodies before vaccination | 0/15 | 13/13 | - |
| Infection period | - | August 2020–February 2021 | May 2020–January 2021 |
| COVID-19 severity | - | ||
| Mild | 13 | 11 | |
| Moderate | 0 | 13 | |
| Severe | 0 | 2 |
Publisher’s Note: MDPI stays neutral with regard to jurisdictional claims in published maps and institutional affiliations. |
© 2022 by the authors. Licensee MDPI, Basel, Switzerland. This article is an open access article distributed under the terms and conditions of the Creative Commons Attribution (CC BY) license (https://creativecommons.org/licenses/by/4.0/).
Share and Cite
Astakhova, E.A.; Byazrova, M.G.; Yusubalieva, G.M.; Kulemzin, S.V.; Kruglova, N.A.; Prilipov, A.G.; Baklaushev, V.P.; Gorchakov, A.A.; Taranin, A.V.; Filatov, A.V. Functional Profiling of In Vitro Reactivated Memory B Cells Following Natural SARS-CoV-2 Infection and Gam-COVID-Vac Vaccination. Cells 2022, 11, 1991. https://doi.org/10.3390/cells11131991
Astakhova EA, Byazrova MG, Yusubalieva GM, Kulemzin SV, Kruglova NA, Prilipov AG, Baklaushev VP, Gorchakov AA, Taranin AV, Filatov AV. Functional Profiling of In Vitro Reactivated Memory B Cells Following Natural SARS-CoV-2 Infection and Gam-COVID-Vac Vaccination. Cells. 2022; 11(13):1991. https://doi.org/10.3390/cells11131991
Chicago/Turabian StyleAstakhova, Ekaterina A., Maria G. Byazrova, Gaukhar M. Yusubalieva, Sergey V. Kulemzin, Natalia A. Kruglova, Alexey G. Prilipov, Vladimir P. Baklaushev, Andrey A. Gorchakov, Alexander V. Taranin, and Alexander V. Filatov. 2022. "Functional Profiling of In Vitro Reactivated Memory B Cells Following Natural SARS-CoV-2 Infection and Gam-COVID-Vac Vaccination" Cells 11, no. 13: 1991. https://doi.org/10.3390/cells11131991