Article

Deletion of Cd44 Inhibits Metastasis Formation of Liver Cancer in Nf2-Mutant Mice

1
Department of Medicine I, University Medical Center of the Johannes Gutenberg University, 55131 Mainz, Germany
2
Leibniz Institute on Aging-Fritz Lipmann Institute (FLI), 07745 Jena, Germany
3
Institute of Pathology, University Medical Center of the Johannes Gutenberg University, 55131 Mainz, Germany
4
Faculty of Biological Sciences, Friedrich-Schiller University, 07745 Jena, Germany
5
Cilia Cell Biology, Institute of Molecular Physiology, Johannes Gutenberg University, 55128 Mainz, Germany
6
Department of Medicine III, University Medical Center of the Johannes Gutenberg University, 55131 Mainz, Germany
7
Department of Medicine I, University Medical Center Schleswig-Holstein, Campus Lübeck, 23558 Lübeck, Germany
*
Author to whom correspondence should be addressed.
Cells 2023, 12(9), 1257; https://doi.org/10.3390/cells12091257
Submission received: 4 April 2023 / Revised: 20 April 2023 / Accepted: 21 April 2023 / Published: 26 April 2023

Abstract

:
Primary liver cancer is the third leading cause of cancer-related death worldwide. An increasing body of evidence suggests that the Hippo tumor suppressor pathway plays a critical role in restricting cell proliferation and determining cell fate during physiological and pathological processes in the liver. Merlin (Moesin-Ezrin-Radixin-like protein) encoded by the NF2 (neurofibromatosis type 2) gene is an upstream regulator of the Hippo signaling pathway. Targeting of Merlin to the plasma membrane seems to be crucial for its major tumor-suppressive functions; this is facilitated by interactions with membrane-associated proteins, including CD44 (cluster of differentiation 44). Mutations within the CD44-binding domain of Merlin have been reported in many human cancers. This study evaluated the relative contribution of CD44- and Merlin-dependent processes to the development and progression of liver tumors. To this end, mice with a liver-specific deletion of the Nf2 gene were crossed with Cd44-knockout mice and subjected to extensive histological, biochemical and molecular analyses. In addition, cells were isolated from mutant livers and analyzed by in vitro assays. Deletion of Nf2 in the liver led to substantial liver enlargement and generation of hepatocellular carcinomas (HCCs), intrahepatic cholangiocarcinomas (iCCAs), as well as mixed hepatocellular cholangiocarcinomas. Whilst deletion of Cd44 had no influence on liver size or primary liver tumor development, it significantly inhibited metastasis formation in Nf2-mutant mice. CD44 upregulates expression of integrin β2 and promotes transendothelial migration of liver cancer cells, which may facilitate metastatic spreading. Overall, our results suggest that CD44 may be a promising target for intervening with metastatic spreading of liver cancer.

1. Introduction

As the third leading cause of cancer-related mortality (830,000 deaths worldwide in 2020), primary liver cancer represents a major public health challenge [1]. The most common histologic type of primary liver cancer, hepatocellular carcinoma (HCC), constitutes approximately 75–85% of primary liver cancer worldwide [1]. Intrahepatic cholangiocarcinoma (iCCA) is the second most common, comprising 10–15% of primary liver cancer cases [1]. Mixed hepatocellular cholangiocarcinoma, presenting histologic features of both HCC and iCCA, can also be observed in some cases [2]. Despite several therapeutic improvements over the past decade [3], survival rates of liver cancer patients remain stubbornly low [4]. Most challenging is metastatic liver cancer, which is associated with a very short five-year survival rate (3.1%, NCI 2022) and limited treatment options [3,4]. Therefore, a better understanding of processes implicated in liver tumor development and progression is essential to develop effective treatment strategies.
The Hippo tumor suppressor pathway plays a critical role in restricting cell proliferation and determining cell fate during physiological and pathological processes in the liver [5,6,7,8,9,10,11,12,13,14,15,16]. The pathway consists of a cascade of kinases that inactivate its primary effector, Yes-associated protein (YAP), by promoting its phosphorylation and cytoplasmic localization with concomitant proteolytic degradation [10]. The core of the mammalian Hippo pathway involves a kinase cascade, including the mammalian STE20-like protein kinase 1 and 2 (MST1/2) and the large tumor suppressor kinase 1 and 2 (LATS1/2) [17]. MST1/2 binds to the Salvador homolog 1 (SAV1) adaptor protein and phosphorylates and activates LATS1/2, which is bound to an adapter protein MOB1A/1B (Mps one binder homolog A and B) [17]. Subsequently, active LATS1/2 phosphorylates YAP and its transcriptional co-activator with PDZ-binding motif (TAZ), leading to retention of YAP in the cytoplasm, upon activation of the Hippo pathway [15]. In contrast, repression of the Hippo pathway causes YAP/TAZ dephosphorylation and their translocation into the nucleus, wherein YAP/TAZ interact with other transcription factors—such as TEA domain (TEAD)—to induce the expression of genes involved in cell migration, proliferation and survival (reviewed in [17]). Interestingly, more than 50% of human liver tumors show increased expression and nuclear activation of YAP, implying that dysregulation of the Hippo signaling pathway might be a frequent event during malignant transformation of liver cells [15,18,19].
Dysregulation of the Hippo pathway signaling components prompts liver overgrowth and promotes development of metastatic liver tumors [5,6,7,8,9,10,11,12,13,14,15,16]. This demonstrates a need for precise regulation. One of the upstream regulators of the Hippo signaling pathway is Merlin (Moesin-Ezrin-Radixin-like protein), encoded by the NF2 (neurofibromatosis type 2) gene [17]. Germline mutations in this gene cause the hereditary tumor syndrome neurofibromatosis type 2 (NF2), which is primarily characterized by an enhanced predisposition to developing tumors of the central and peripheral nervous system [20]. Deactivating NF2 mutations have been identified in human liver cancers, including 1.9% of HCCs and 5.3% of iCCAs [21]. Additionally, suppression of Merlin function in the liver may occur on an epigenetic or post-transcriptional level [22]. Accordingly, it has been demonstrated that expression of Merlin is decreased in a high proportion of human liver tumors when compared to normal tissues [22]. Studies in mice emphasize the role of Merlin in the pathogenesis of liver tumors. A liver-specific deletion of the Nf2 gene leads to liver enlargement and promotes tumorigenesis [5,6].
The tumor suppressor function of Merlin is not restricted to the regulation of Hippo signaling. Merlin has been shown to restrict cell proliferation and migration by inhibiting expression and activation of receptor tyrosine kinases and downstream signaling pathways, including RAS/RAF/MEK/ERK, RAC/PAK/JNK, PI3K/AKT/JNK, FAK/SRC, mTORC1 and WNT/β-catenin [23,24]. It has also been shown to attenuate oncogenic gene expression via inhibition of the CRL4/DCAF1 (Cullin-RING ubiquitin ligase 4 / DDB1- and Cul4-associated factor 1) ubiquitin ligase complex [20,24,25]. Of interest, the majority of mutations, both in the germline of NF2 patients and in sporadically occurring human tumors, have been identified in the NF2 gene region encoding the so-called FERM (4.1 protein, ezrin, radixin, moesin) domain, which mediates interactions with membrane-bound proteins [26]. These observations suggest that the interactions mediated by the FERM domain might be critical to Merlin’s tumor suppressor function.
CD44 (cluster of differentiation 44) is a type I transmembrane glycoprotein and an important interaction partner of Merlin, binding to its FERM domain [20,27,28,29]. Expression of CD44 is upregulated in numerous human cancers, positing a pro-tumorigenic role [30,31]. CD44 is consistently identified as an important diagnostic and prognostic marker in primary liver tumors, correlating with TNM classification and poor prognosis in HCC and CCA patients [32,33,34,35,36]. CD44 exerts multiple molecular functions and may influence tumor cell behavior in several ways. First, it modulates cell adhesion by interacting with hyaluronic acid (HA) and other components of the extracellular matrix [30,37]. Second, certain CD44 isoforms containing amino acid sequences that are encoded by the variant exon v3 or v6 regulate activation of several receptor tyrosine kinases (RTKs) and downstream signaling [27,37,38]. In particular, the CD44v6-bearing isoforms were shown to be required for activation of receptor tyrosine kinase MET [39]. This coreceptor function is twofold; on one hand, the extracellular region of CD44v6 binds hepatocyte growth factor (HGF) and is necessary for MET activation. On the other hand, the cytoplasmic domain of CD44 promotes downstream signaling [38,39]. Lastly, CD44 undergoes sequential proteolytic cleavages and the intracellular domain of CD44, which is cleaved by γ-secretase, plays a role in transcriptional regulation [40].
The aim of the current study was to evaluate in detail the collaboration between CD44 and Merlin in primary liver tumor development and progression, as well as to investigate molecular mechanisms underlying CD44 and Merlin function in the pathogenesis of liver tumors. Several studies indicate that Merlin exerts its tumor suppressor activity in part by negatively regulating CD44 function [20,27,28,29]. Binding of Merlin to CD44 occurs in growth inhibitory conditions [27]. In growth promoting conditions, CD44 is released from the inhibitory interaction with Merlin to promote oncogenic signaling [27]. This led us to hypothesize that disruption of the Merlin-CD44 complex, through loss of Merlin, releases putative tumor- or metastasis-promoting functions of CD44. To evaluate the relevance of this interaction in vivo, mice with a liver-specific deletion of the Nf2 gene were crossed to Cd44-knockout mice. Our results suggest that CD44 promotes transendothelial migration of Nf2-deficient liver tumor cells, thus facilitating metastasis formation. We also suggest that intercellular adhesion molecule 1 (ICAM-1)—and potentially other molecules—may compensate for loss of CD44 in other tumor relevant processes.

2. Materials and Methods

2.1. Experiments Involving Animals

In total, 122 mice aged between 2 and 48 weeks were analyzed to investigate the influence of NF2 and CD44 on different stages of liver tumor development and progression. All animals used in this study were housed under constant temperature and humidity conditions, followed a 12-h light/dark cycle, and had ad libitum access to food and water. All experiments involving mice were approved by the local authorities (AZ: 23 177-07/G 16-1-028). Alb-Cre (B6.Cg-Tg(Alb-cre)21Mgn/J) mice were from The Jackson Laboratory (Sacramento, CA, USA). Generation and genotyping of Nf2flox/flox transgenic mice (with targeted exon 2) was described by Giovannini et al. [41]. Generation of Cd44flox/flox mice (with targeted exon 3) was described by Dhar et al. (2018) [42]. Generation and genotyping of Cd44−/− mice was described by Ma et al. (2020) [43]. All mice were inbred onto C57BL/6 genetic background. Nf2flox/flox;Alb-Cre; and Cd44-deficient mice were crossed to obtain the desired phenotypes. Nf2flox/flox;Alb-Cre; mice were monitored weekly for occurrence of tumors or decline of health, then euthanized after two years at the latest and analyzed.

2.2. Detection of α-Fetoprotein (AFP), Alanine Aminotransferase (ALT), and Bilirubin in Mouse Serum

Serum was isolated using Microvette 500 Z-GEL Gel/clotting activator tubes (Sarstedt AG & Co. KG, Nümbrecht, Germany) per manufacturer’s instructions. Levels of α-fetoprotein (AFP), alanine aminotransferase (ALT), and bilirubin were detected in serum of 32- and 48-week-old mice using commercially available kits (AFP, catalog number MAFP00, R&D Systems, Inc., Minneapolis, Minnesota, USA; ALT, catalog number ab282882, Abcam, Berlin, Germany; bilirubin, catalog number NBP2-69939, Bio-Techne GmbH, Wiesbaden Nordenstadt, Germany) per manufacturer’s protocols.

2.3. Histochemistry and Immunohistochemistry
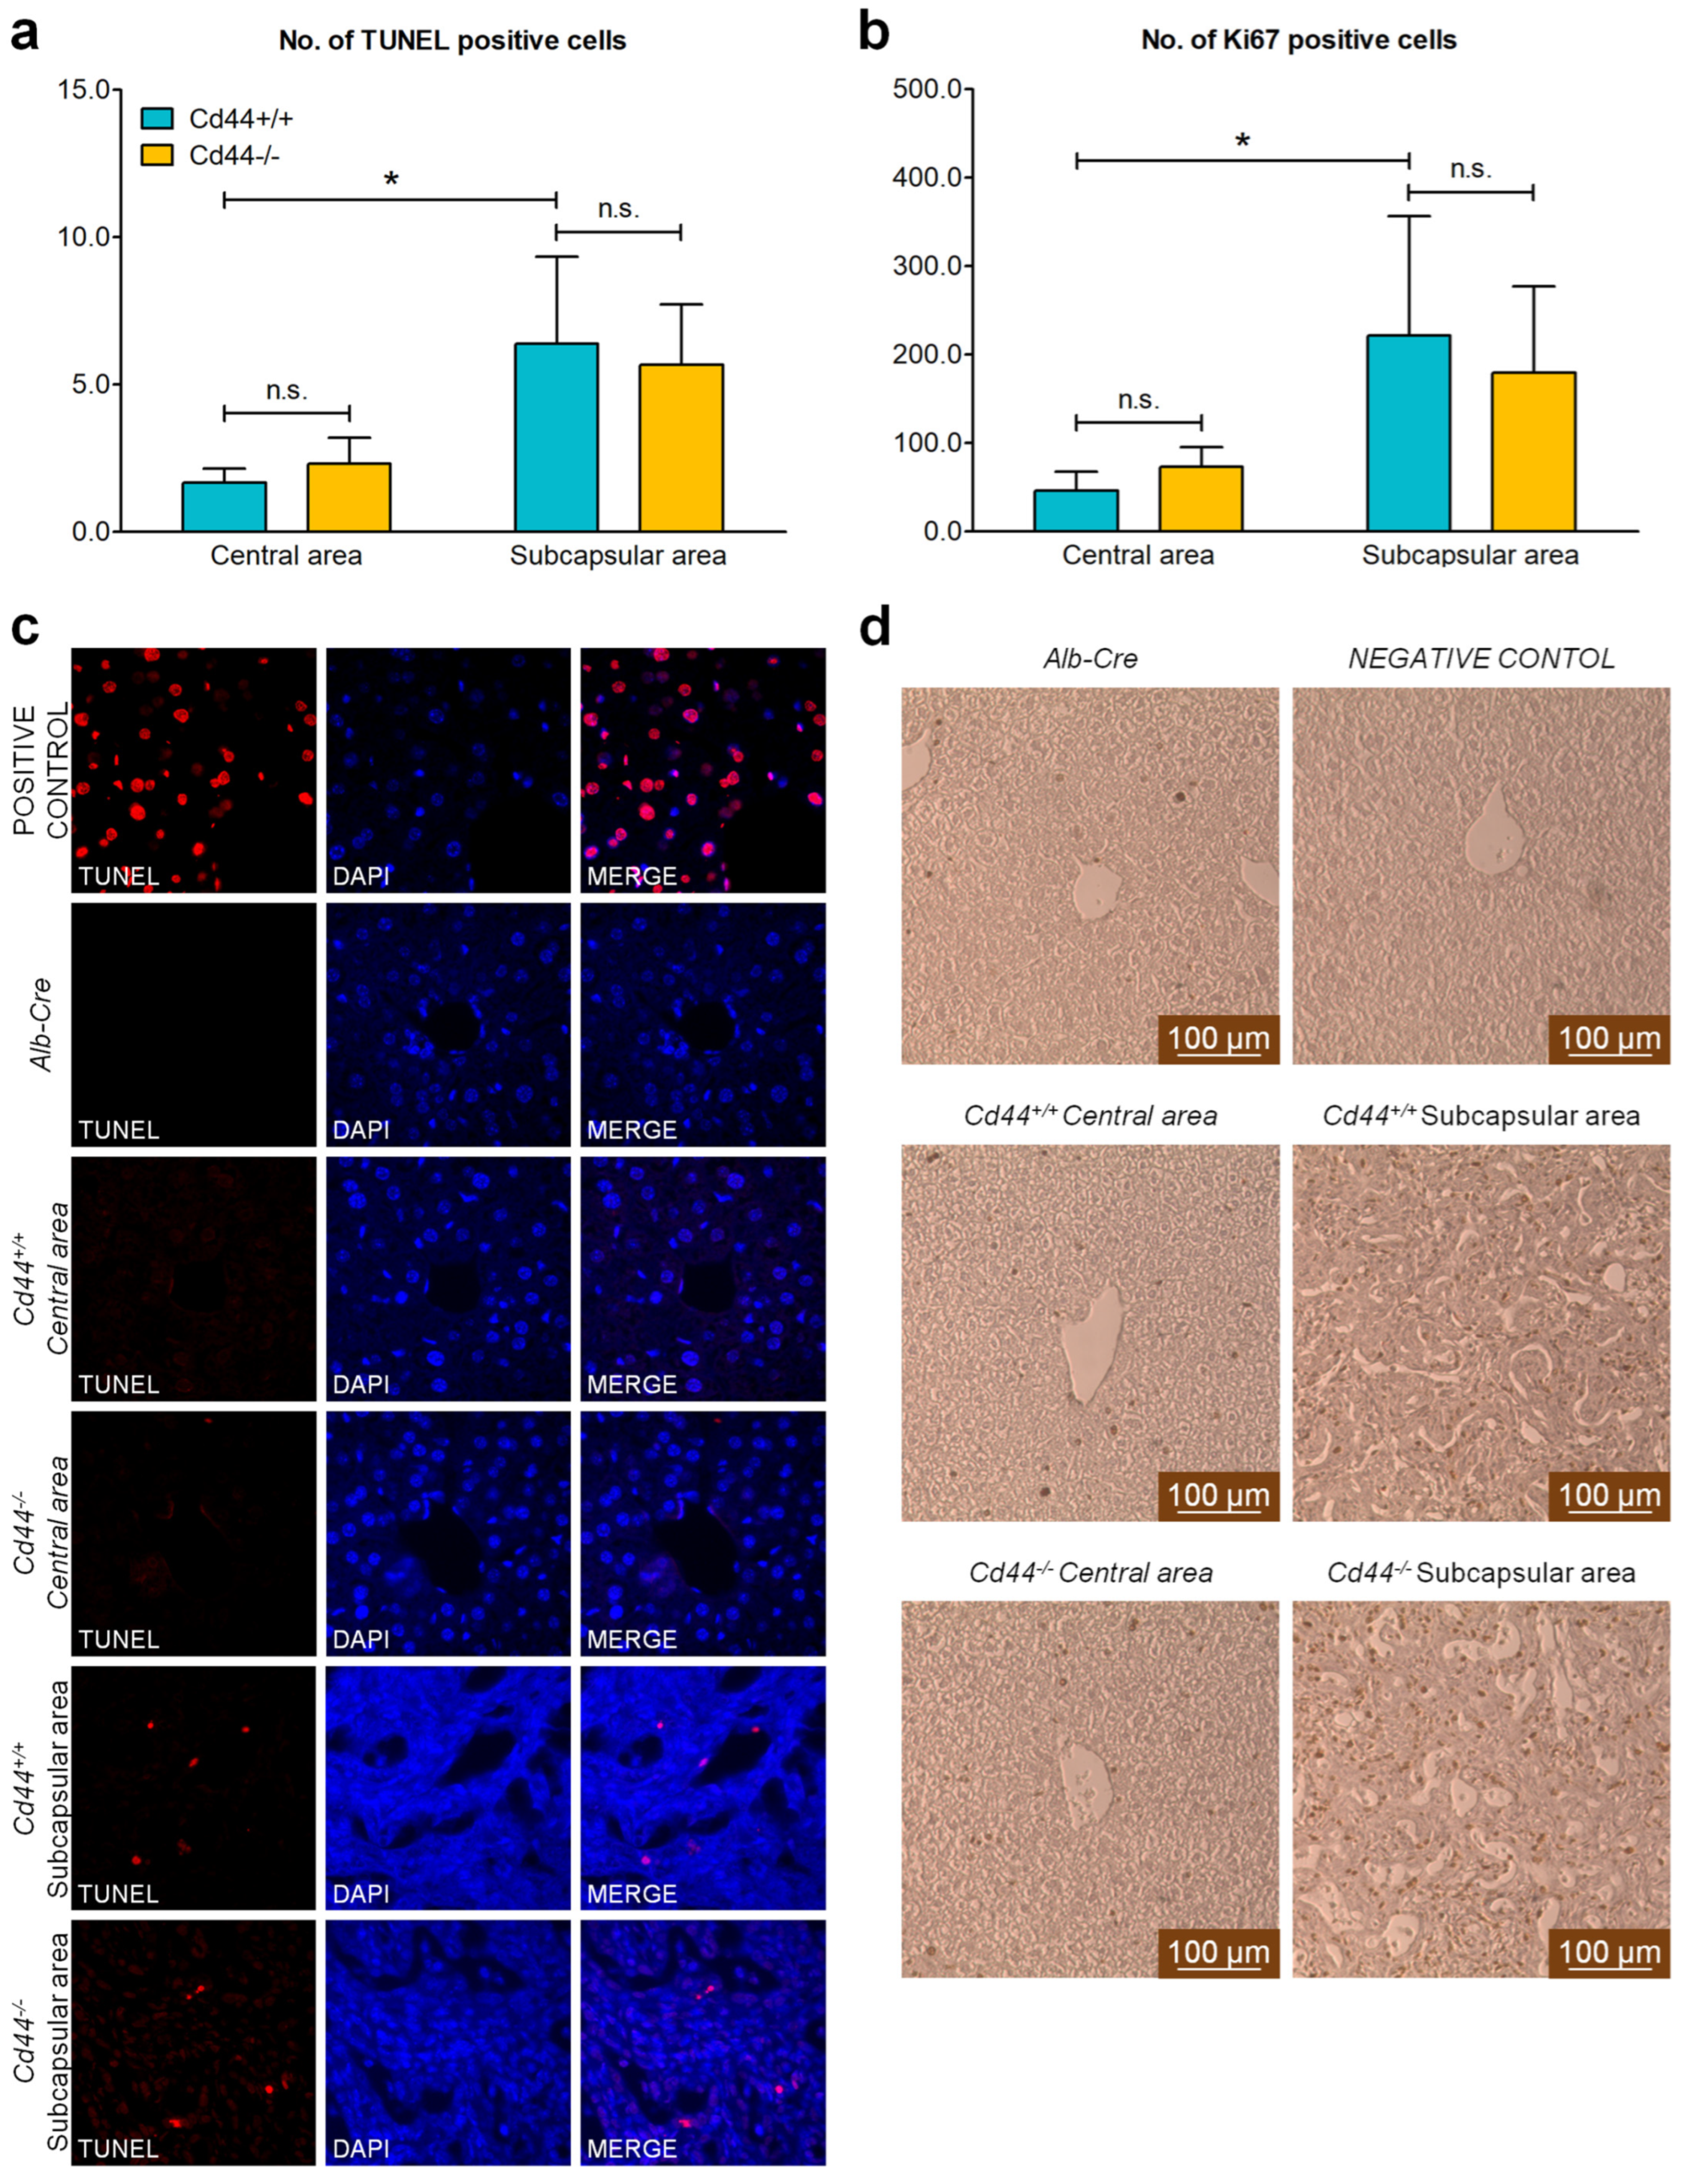
Tissue samples were fixed in 4% paraformaldehyde (PFA) and embedded in paraffin. Next, 4 µm thick sections were deparaffinized, re-hydrated, and stained by hematoxylin and eosin (H&E) or were used for antigen detection by immunohistochemistry or immunofluorescence microscopy. Conventional H&E and Gomori silver staining were performed, following standard procedures, at the Institute of Pathology, Mainz. Detection of antigens was conducted on tissue sections after antigen-retrieval in the target retrieval solution, citrate pH 6 (DakoCytomation GmbH, Hamburg, Germany). Tissue sections were permeabilized in 0.1% Triton X-100 (Carl Roth GmbH, Karlsruhe, Germany) in phosphate-buffered saline (PBS, Life Technologies GmbH, Darmstadt, Germany) at room temperature for 7 min. Afterwards, tissue sections were washed with PBS. Endogenous peroxidases were quenched using 3% H2O2 (Carl Roth GmbH, Karlsruhe, Germany) in methanol at room temperature for 10 min (this step was performed only for subsequent chemiluminescent detection). Tissue sections were again washed with PBS. Unspecific binding was blocked by pre-incubation with blocking solution consisting of 2% normal horse serum (Vector Laboratories, Newark, CA, USA), 1% bovine serum albumin (BSA, Sigma-Aldrich, Taufkirchen, Germany), and 0.01% Triton X-100 in PBS. Primary antibodies were diluted in blocking solution and applied on sections at 4 °C overnight. Primary antibodies used for immunohistochemistry are listed in Table 1. After vigorous washings with 0.01% Triton X-100 and 0.01% Tween20 in PBS, sections were incubated either with the fluorophore-conjugated secondary antibody diluted in blocking solution for 1 h, or with ZytoChem HRP One-Step Polymer anti-Mouse/Rabbit/Rat solution (Zytomed Systems GmbH, Berlin, Germany) at room temperature for 30 min. Afterwards, sections were again washed with 0.01% Triton X-100 and 0.01% Tween20 in PBS. For fluorescent detection, the sections were embedded in ProLong Diamond Antifade Mountant with DAPI (Thermo Fisher Scientific GmbH, Darmstadt, Germany). Alternatively, chemiluminescent detection was performed using Liquid DAB+Substrate Chromogen System (DakoCytomation GmbH, Hamburg, Germany), following manufacturer’s instructions. Afterwards, the nuclei were counterstained with hematoxylin (Merck KGaA, Darmstadt, Germany) for 20 sec, and the samples were then dehydrated and embedded in xylene-based mounting medium (Kindler GmbH & Co., Freiburg, Germany). Paraffin-embedded lung, liver, and tumor sections were evaluated by an expert pathologist (B.K.S).

2.4. TUNEL Assay

Click-iT® Plus TUNEL Assay (catalog number C10618, Life Technologies GmbH, Darmstadt, Germany) was applied for in situ apoptosis detection, per manufacturer’s protocol. To induce DNA strand breaks for positive control, fixed and permeabilized Alb-Cre liver sections were incubated with 1 unit of Dnase I (Qiagen, Hilden, Germany) diluted in 1xDNase I Reaction Buffer (20 mM Tris-HCl, pH 8.4, 2 mM MgCl2, 50 mM KCl), at room temperature for 30 min.

2.5. Isolation of Primary Liver Cells

Primary liver tumors were isolated from Cd44+/+,Nf2flox/flox;Alb-Cre and Cd44-/-,Nf2flox/flox;Alb-Cre mice, washed with PBS, and minced into 1–3 mm3 pieces in PBS with use of a scalpel. Tissue fragments were dissociated in 1 mg/mL of Collagenase IV (Life Technologies GmbH, Darmstadt, Germany) in Dulbecco’s Modified Eagle’s Medium (DMEM, Life Technologies GmbH, Darmstadt, Germany) at 37 °C for 60 min. Cell aggregates and larger particles were removed by filtering the suspension through 70 µm MACS Smart cell strainer (Miltenyi Biotec B.V. & Co. KG, Bergisch Gladbach, Germany). Afterwards, dissociated cells were recovered by centrifugation at 350–400× g for 5 min. Cells were cultured in DMEM/F12 (Thermo Fisher Scientific GmbH, Darmstadt, Germany) supplemented with 10% fetal bovine serum (FBS, PAN-Biotech GmbH, Aidenbach, Germany), 1% penicillin-streptomycin (Sigma-Aldrich, Taufkirchen, Germany) and 1% HEPES (Life Technologies GmbH, Darmstadt, Germany). Outgrowing cells were replated on fresh plates. After approximately 10 passages, the cultures presented a macroscopically homogenous population of liver cells and were subsequently cultured in DMEM (Life Technologies GmbH, Darmstadt, Germany) supplemented with 10% FBS and 1% penicillin-streptomycin.

2.6. Sources of Other Cells and Cell Culture Conditions

NIH3T3 cells (immortalized Swiss mouse embryonic fibroblasts) were from the European Collection of Animal Cell Cultures (Salisbury, UK). Hepa1-6 mouse hepatoma cell line was from Sigma-Aldrich (Taufkirchen, Germany). C57BL/6 mouse primary lung microvascular endothelial cells were from Biotrend Chemikalien GmbH (Köln, Germany). The latter were cultured in complete mouse endothelial cell medium (Biotrend Chemikalien GmbH, Köln, Germany) on plates coated with gelatin (Sigma-Aldrich, Taufkirchen, Germany). Established liver cell lines, NIH3T3 and Hepa1-6 cells were cultured in DMEM supplemented with 10% FBS and 1% penicillin-streptomycin. All cells were maintained in a humidified atmosphere with 5% CO2 at 37 °C. All experiments were performed with mycoplasma-free cells.

2.7. Clonogenic Assay under Cell Attachment Conditions

Liver cells were seeded in triplicates at a density of 100 and 1,000 cells per well in a 6-well plate, in DMEM supplemented with 10% FBS. Medium was changed every 3 days. After 1 week, the colonies were fixed in 4% PFA for 5 min and stained with 0.05% crystal violet in PBS for 30 min. Photographs of colonies were taken on a ChemiDoc MP Imaging System (Bio-Rad Laboratories GmbH, Feldkirchen, Germany), and the number of colonies was counted using Cell Counter software v0.2.1 (by Nghia Ho).

2.8. Colony Growth under Nonadherent Conditions/Anoikis Assay

First, 96-well plates were made anchorage-resistant by coating them with a 1% agar layer. Liver cells were seeded in triplicates at a density of 0.2 × 10⁵ cells per well on an anchorage-resistant 96-well plate in DMEM supplemented either with 10% FBS or without FBS. After 7 days of culture, the colonies were photographed using a Leica DFC290 microscope, and the colony surface area was measured using ImageJ software (National Institutes of Health (NIH), Bethesda, MD, USA).

2.9. Scratch Migration Assay

Liver cell lines were grown on 6-well plates in DMEM, supplemented with 10% FBS. Scratches were generated in confluent cell monolayers with a 200 µL pipette tip, and cell debris was removed by washing with PBS. Afterwards, the cells were allowed to migrate into the generated gap in serum-free medium for 72 h. To inhibit proliferation, cytosine b-D-arabinofuranoside (AraC, Sigma-Aldrich, Taufkirchen, Germany) was added at a concentration of 10 µM prior to migration assay. The cells were photographed using a Leica DFC290 microscope (Leica Microsystems CMS GmbH, Mannheim, Germany), and the cell-free gap was measured using ImageJ software.

2.10. Tumor Cell Transendothelial Migration Assay

The ability of tumor cells to migrate through a confluent monolayer of endothelial cells towards a chemoattractant was tested using commercially available QCM tumor cell transendothelial migration assay (catalog number ECM558, Merck KGaA, Darmstadt, Germany), per manufacturer’s protocol. Briefly, tumor cells were allowed to migrate at 37 °C for 23 h through a confluent monolayer of tumor necrosis factor-α (TNFα, Thermo Fisher Scientific GmbH, Darmstadt, Germany) -stimulated C57BL/6 mouse primary lung microvascular endothelial cells, from medium without serum towards medium supplemented with 10% FBS.

2.11. Western Blot

Cells and liver tissues were harvested in RIPA (50 mM Tris HCl pH 8.0; 150 mM NaCl; 1% NP40; 0.1% SDS; 1 mM EDTA) and M-PER (Thermo Fisher Scientific GmbH, Darmstadt, Germany) lysis buffers, respectively, containing a halt protease and phosphatase inhibitor cocktail. Protein concentration was determined using the bicinchoninic acid (BCA) protein assay kit (Thermo Fisher Scientific GmbH, Darmstadt, Germany). Lysates were mixed with SDS-PAGE sample buffer (final concentration: 50 mM Tris HCl, pH 6.8; 2% SDS; 10% glycerol; 0.1% bromphenol; 100mM dithiotreitol) and denatured by boiling at 97 °C for 7 min. Proteins were separated on 8% acrylamide gels using SDS-PAGE and transferred to nitrocellulose membranes. Blocking was performed at room temperature for 1 h, using 5% low-fat milk powder in Tris-buffered saline (TBS) containing 0.1% Tween20 solution (TBS-T). Membranes were incubated with primary antibody at 4 °C overnight, followed by HRP-labeled secondary antibody at room temperature for 1 h. Primary and secondary antibodies used for immunoblot analysis are listed in Table 1 and Table 2. A total of 5% BSA in TBS-T was used as diluent for CD44 antibody, clone E7K2Y. All other primary and secondary antibodies were diluted in 5% low-fat milk powder in TBS-T. Blots were developed using Clarity Western ECL Substrate (Bio-Rad Laboratories GmbH, Feldkirchen, Germany) and visualized with Chemi-Doc MP Imaging System (Bio-Rad Laboratories GmbH, Feldkirchen, Germany). The intensity of immunoblot bands was quantified with ImageJ software.

2.12. Immunocytochemistry

Liver cells grown on coverslips were fixed with 4% PFA in PBS for 20 min, washed in PBS, and permeabilized with 0.1% Triton X-100 in PBS for 7 min. Non-specific epitopes were blocked with blocking solution (1% BSA in PBS) for 45 min. Cells were probed in primary antibody solution at room temperature for 1 h, washed extensively with PBS, and incubated with fluorophore-conjugated secondary antibody solution at room temperature for 1 h. After additional washing with PBS, the cells were mounted on cover slides with a ProLong™ Diamond Antifade Mountant with DAPI (Thermo Fisher Scientific GmbH, Darmstadt, Germany). Primary and secondary antibodies used for immunofluorescence (IF) detection are listed in Table 1. A total of 1% BSA in PBS was used as diluent for all primary and secondary antibodies. For negative controls, primary antibody was omitted.

2.13. Antibodies

Table 1 and Table 2 list antibodies used in the study.

2.14. RNA Sequencing and Gene Expression Analysis

Liver tissues were derived from Cd44+/+;Nf2Δ2/+ and Cd44-/-;Nf2Δ2/+ mice described previously [43]. Three samples of each group were analyzed. Total RNA was isolated using RNeasy mini kit (Qiagen), per manufacturer’s instructions. Sequencing of RNA samples was achieved using Illumina’s next-generation sequencing methodology [44]. The quality check and quantification of total RNA was completed using the Agilent Bioanalyzer 2100 in combination with the RNA 6000 nano kit (Agilent Technologies). Library preparation required Illumina’s TruSeq stranded mRNA library preparation kit, per manufacturer’s description. Agilent Bioanalyzer 2100 in combination with the DNA 7500 kit enabled quantification and quality check of libraries. Said libraries were sequenced in two lanes on a HiSeq2500 running in 51 cycle/single-end/high-output mode. Sequence information was extracted in FastQ format using Illumina’s bcl2fastq v.1.8.4 and resulted in an average of around 24 million reads per sample. Reads were aligned to the mouse reference genome sequence (ENSEMBL Mus musculus GRCm38.84) using HISAT2 (hisat2-2.0.2-beta), with read counts determined by read summarization with feature Counts (subread-2.0.0). R programming language and related packages were engaged to further analyze RNA sequencing data. Differentially regulated genes were determined using the rlog function of the DESeq2 package. All genes with Benjamin Hochberg adjusted p-value (padj) < 0.05 were considered significant.

2.15. Real-Time Quantitative Reverse Transcription PCR (Real-Time qRT-PCR)

Total RNA was isolated from mouse tissues or cell lines using PeqGOLD total RNA kit (VWR International GmbH, Darmstadt, Germany), per manufacturer’s instructions. cDNA was prepared from 1 µg of total RNA using iScript cDNA synthesis kit (Bio-Rad Laboratories GmbH, Feldkirchen, Germany) and used for qRT-PCR reaction at a final dilution of 1:75. We used iQTMSYBR green supermix (Bio-Rad Laboratories GmbH, Feldkirchen, Germany) on CFX Connect™ real-time PCR detection system (Bio-Rad Laboratories GmbH, Feldkirchen, Germany) for PCR amplification. Oligonucleotides were used at a final concentration of 157 nM. Tbp housekeeping gene was used as the reference for testing efficiency of Icam1 knockdown, with Hprt1 and Actin housekeeping genes used as references for all other real-time qRT-PCRs. Total Cd44 was detected using primers that recognized constant regions of all isoforms (Cd44all Fwd1 and Cd44all Rev1). CD44 isoforms containing variant exon sequences were amplified using forward oligonucleotides specific for stable exon 5 (stable Ex5 Fwd 1) and reverse oligonucleotides specific for appropriate variant exon. Oligonucleotides used for real-time qRT-PCR are listed in Table 3. Relative expression values were calculated using REST-MCS software [45].

2.16. Small Interfering RNA (siRNA) Transfections

siRNAs targeting mouse Icam1 (ID:s67995 and s67994), mouse Cd44 (ID:s63660 and s63661), and negative control siRNA No.1 were acquired from Thermo Fisher Scientific GmbH (Darmstadt, Germany). All siRNA transfections were performed in 6-well plates using the liposomal transfection reagent Lipofectamine 2000 (Thermo Fisher Scientific GmbH, Darmstadt, Germany), per manufacturer’s instructions.

2.17. Statistical Analysis

The Chi-Square test of independence determined whether there is a significant association between the presence or absence of metastases in Cd44-positive and Cd44-negative livers; and presence or absence of variant Cd44 isoforms in liver tumors and control livers. For all quantitative analyses, comparisons between groups were made with unpaired Student’s t-test unless otherwise stated. Two-tailed p-value ≤ 0.05 was considered as significant (ns: p > 0.05, *: p ≤ 0.05, **: p ≤ 0.01, ***: p ≤ 0.001, ****: p ≤ 0.0001).

3. Results

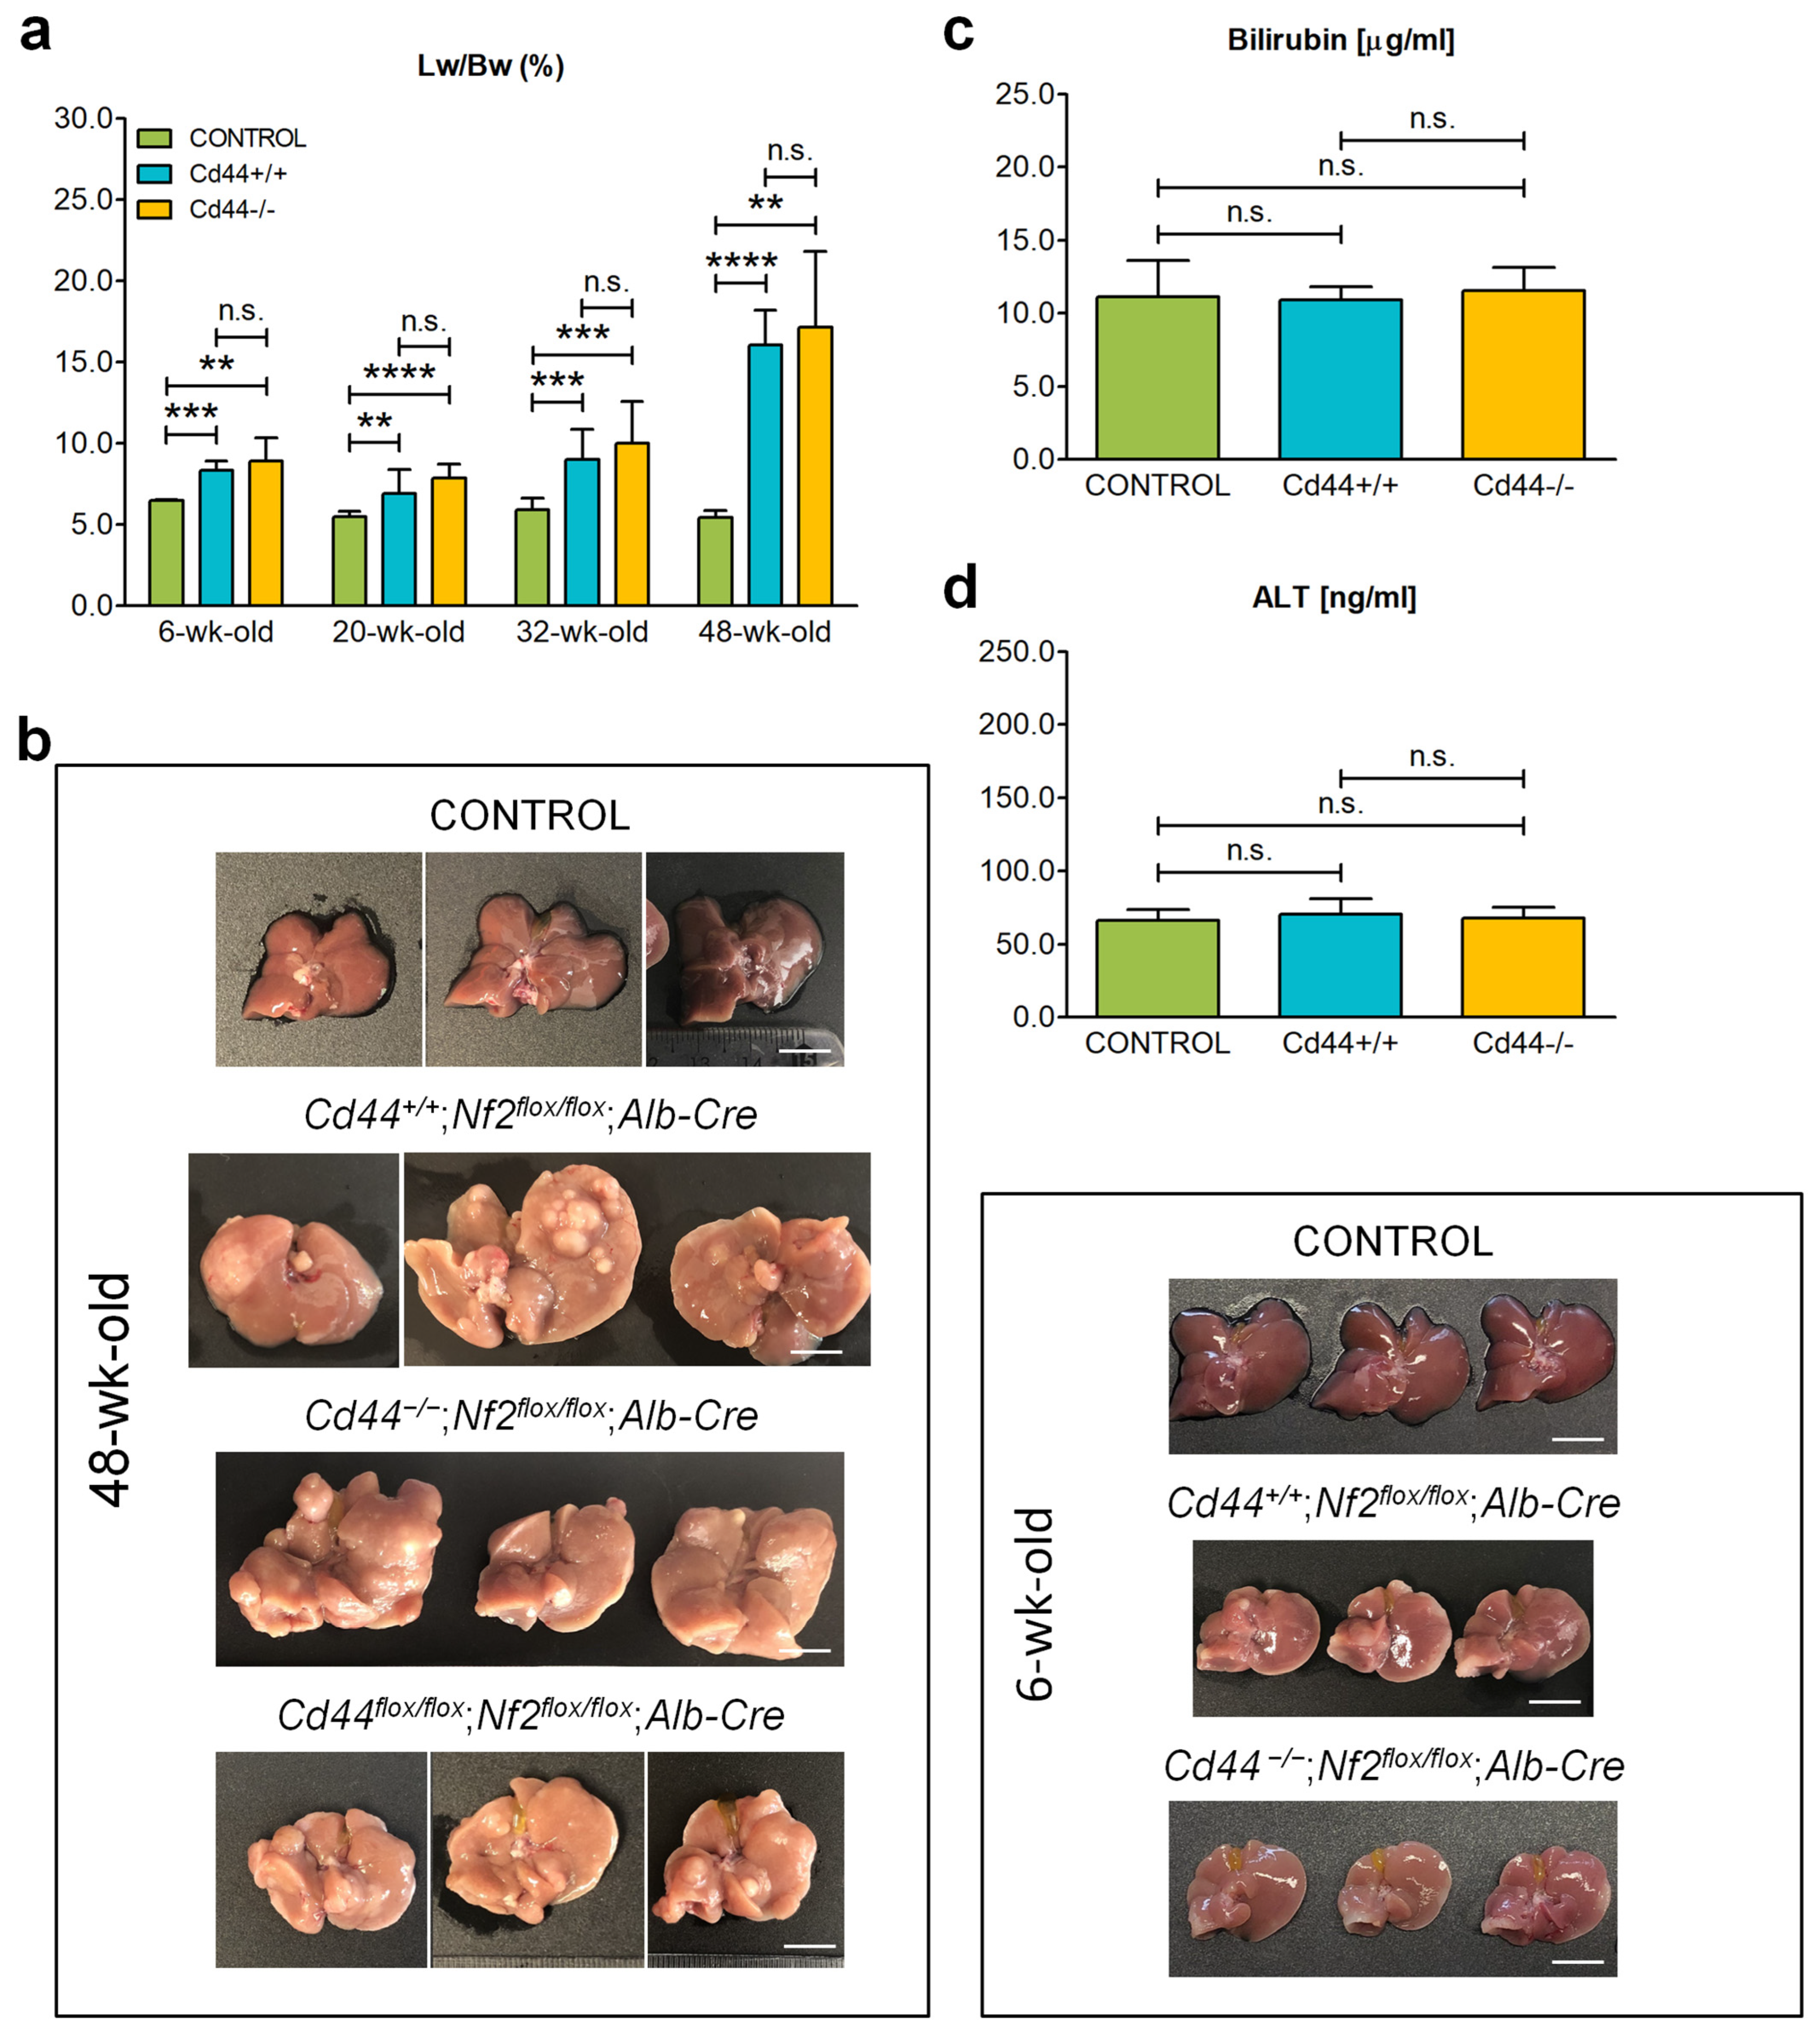
3.1. Deletion of Cd44 Does Not Influence Progressive Liver Enlargement in Nf2flox/flox;Alb-Cre Mice

We used Nf2-mutant mice to model liver tumor development and progression. Deficiency of Nf2 was confined to the liver by crossing conditional Nf2-mutant (Nf2flox/flox) mice with albumin-Cre (Alb-Cre) transgenic mice. To investigate the role of CD44 in liver tumor development and progression, Nf2flox/flox;Alb-Cre mice were crossed with Cd44-mutant mice, either Cd44flox/flox, to obtain deletion of Cd44 exclusively in the liver, or Cd44−/−, resulting in deletion of Cd44 in the entire body. A total of 122 mice aged between 2 and 48 weeks were analyzed to investigate the influence of NF2 and CD44 on different stages of liver tumor development and progression. Alb-Cre mice were the control group. Table 4 lists the number of mice analyzed at different ages.
The presence of the desired genetic modification was confirmed by PCR-based genotyping (Figure S1). As expected, recombinant deleted alleles of Cd44 and Nf2 were only detected in livers of conditional knockout mice (Figure S1). In contrast, Cd44−/− mice exhibited allele deletion in all analyzed tissues (Figure S1). Presence of a faint floxed band of Cd44 and Nf2 gene in the liver of conditional knockout mice may indicate non-complete recombination of floxed alleles or infiltration by non-hepatic cells, which is consistent with previous reports on Alb-Cre-mediated excision [6,46,47]. The Nf2flox/flox;Alb-Cre mice were born at expected Mendelian rations and appeared healthy. The most prominent difference from control animals was progressive liver enlargement observed in all analyzed Nf2flox/flox;Alb-Cre mice, independent of the Cd44 gene status (Figure 1a,b). It should be mentioned that deletion of the Cd44 gene alone has no influence on normal liver phenotype [43,48,49]. The liver weight/body weight ratio of Cd44+/+;Nf2flox/flox;Alb-Cre animals increased from 6.94% at 20 weeks to 16.06% at 48 weeks, whereas the percent ratio of liver weight/body weight of control animals remained relatively constant (5.52% at 20 weeks and 5.46% at 48 weeks) during the analysis period. In addition, livers isolated from Cd44+/+;Nf2flox/flox;Alb-Cre, Cd44−/−;Nf2flox/flox;Alb-Cre and Cd44flox/flox;Nf2flox/flox;Alb-Cre mice appeared paler and more solid than control livers and harbored tumors at later ages (32- and 48-weeks) (Figure 1b).
We tested liver biomarkers in the serum to analyze the function of enlarged livers (Figure 1c,d), but found no significant difference in serum levels of bilirubin (Figure 1c) or alanine aminotransferase (ALT, Figure 1d) between control and Nf2flox/flox;Alb-Cre mice, which indicates normal function of biliary system and no significant hepatocyte injury, respectively. Thus, deletion of the Nf2 gene in the liver and concomitant liver enlargement is not associated with impairment of liver function. Consistently, during this analysis (maximally 48 weeks) we observed no increased mortality in Nf2flox/flox;Alb-Cre mice compared to control group. Nor did we observe any significant differences in the appearance or size of the liver between Cd44-positive and Cd44-negative Nf2flox/flox;Alb-Cre mice. Thus, loss of the Cd44 gene does not influence the liver overgrowth observed in Nf2-mutant mice.

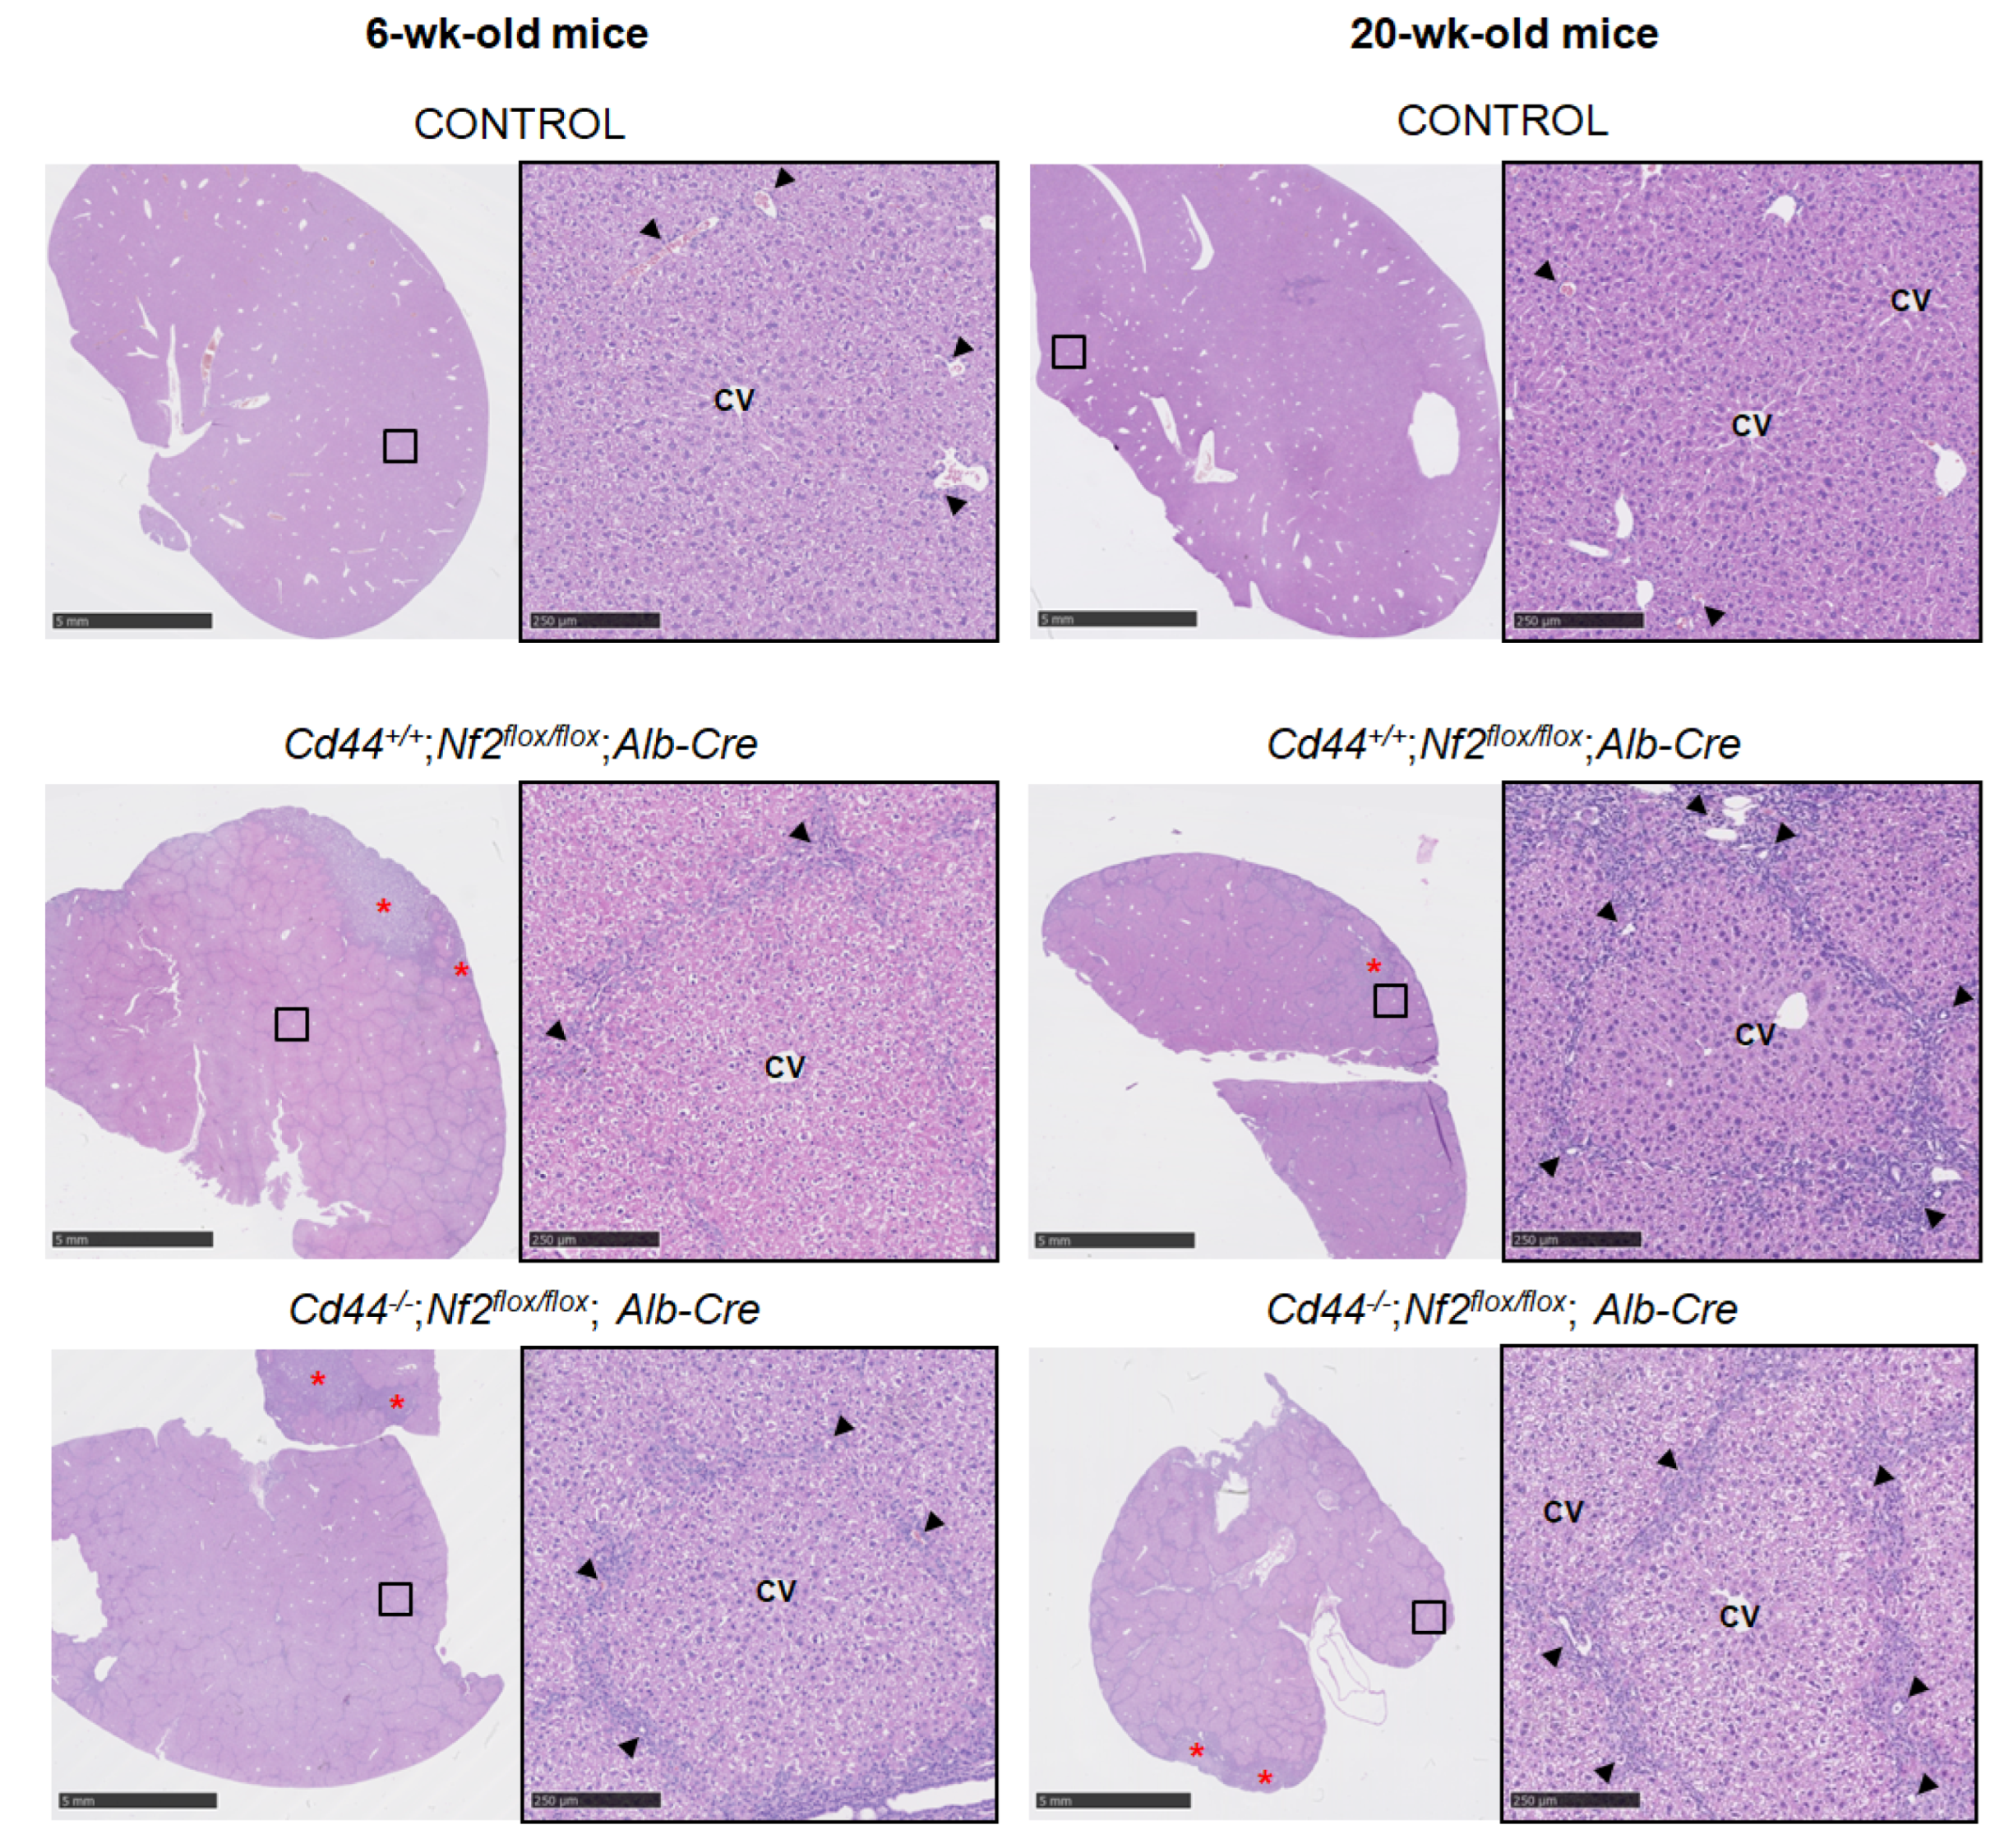
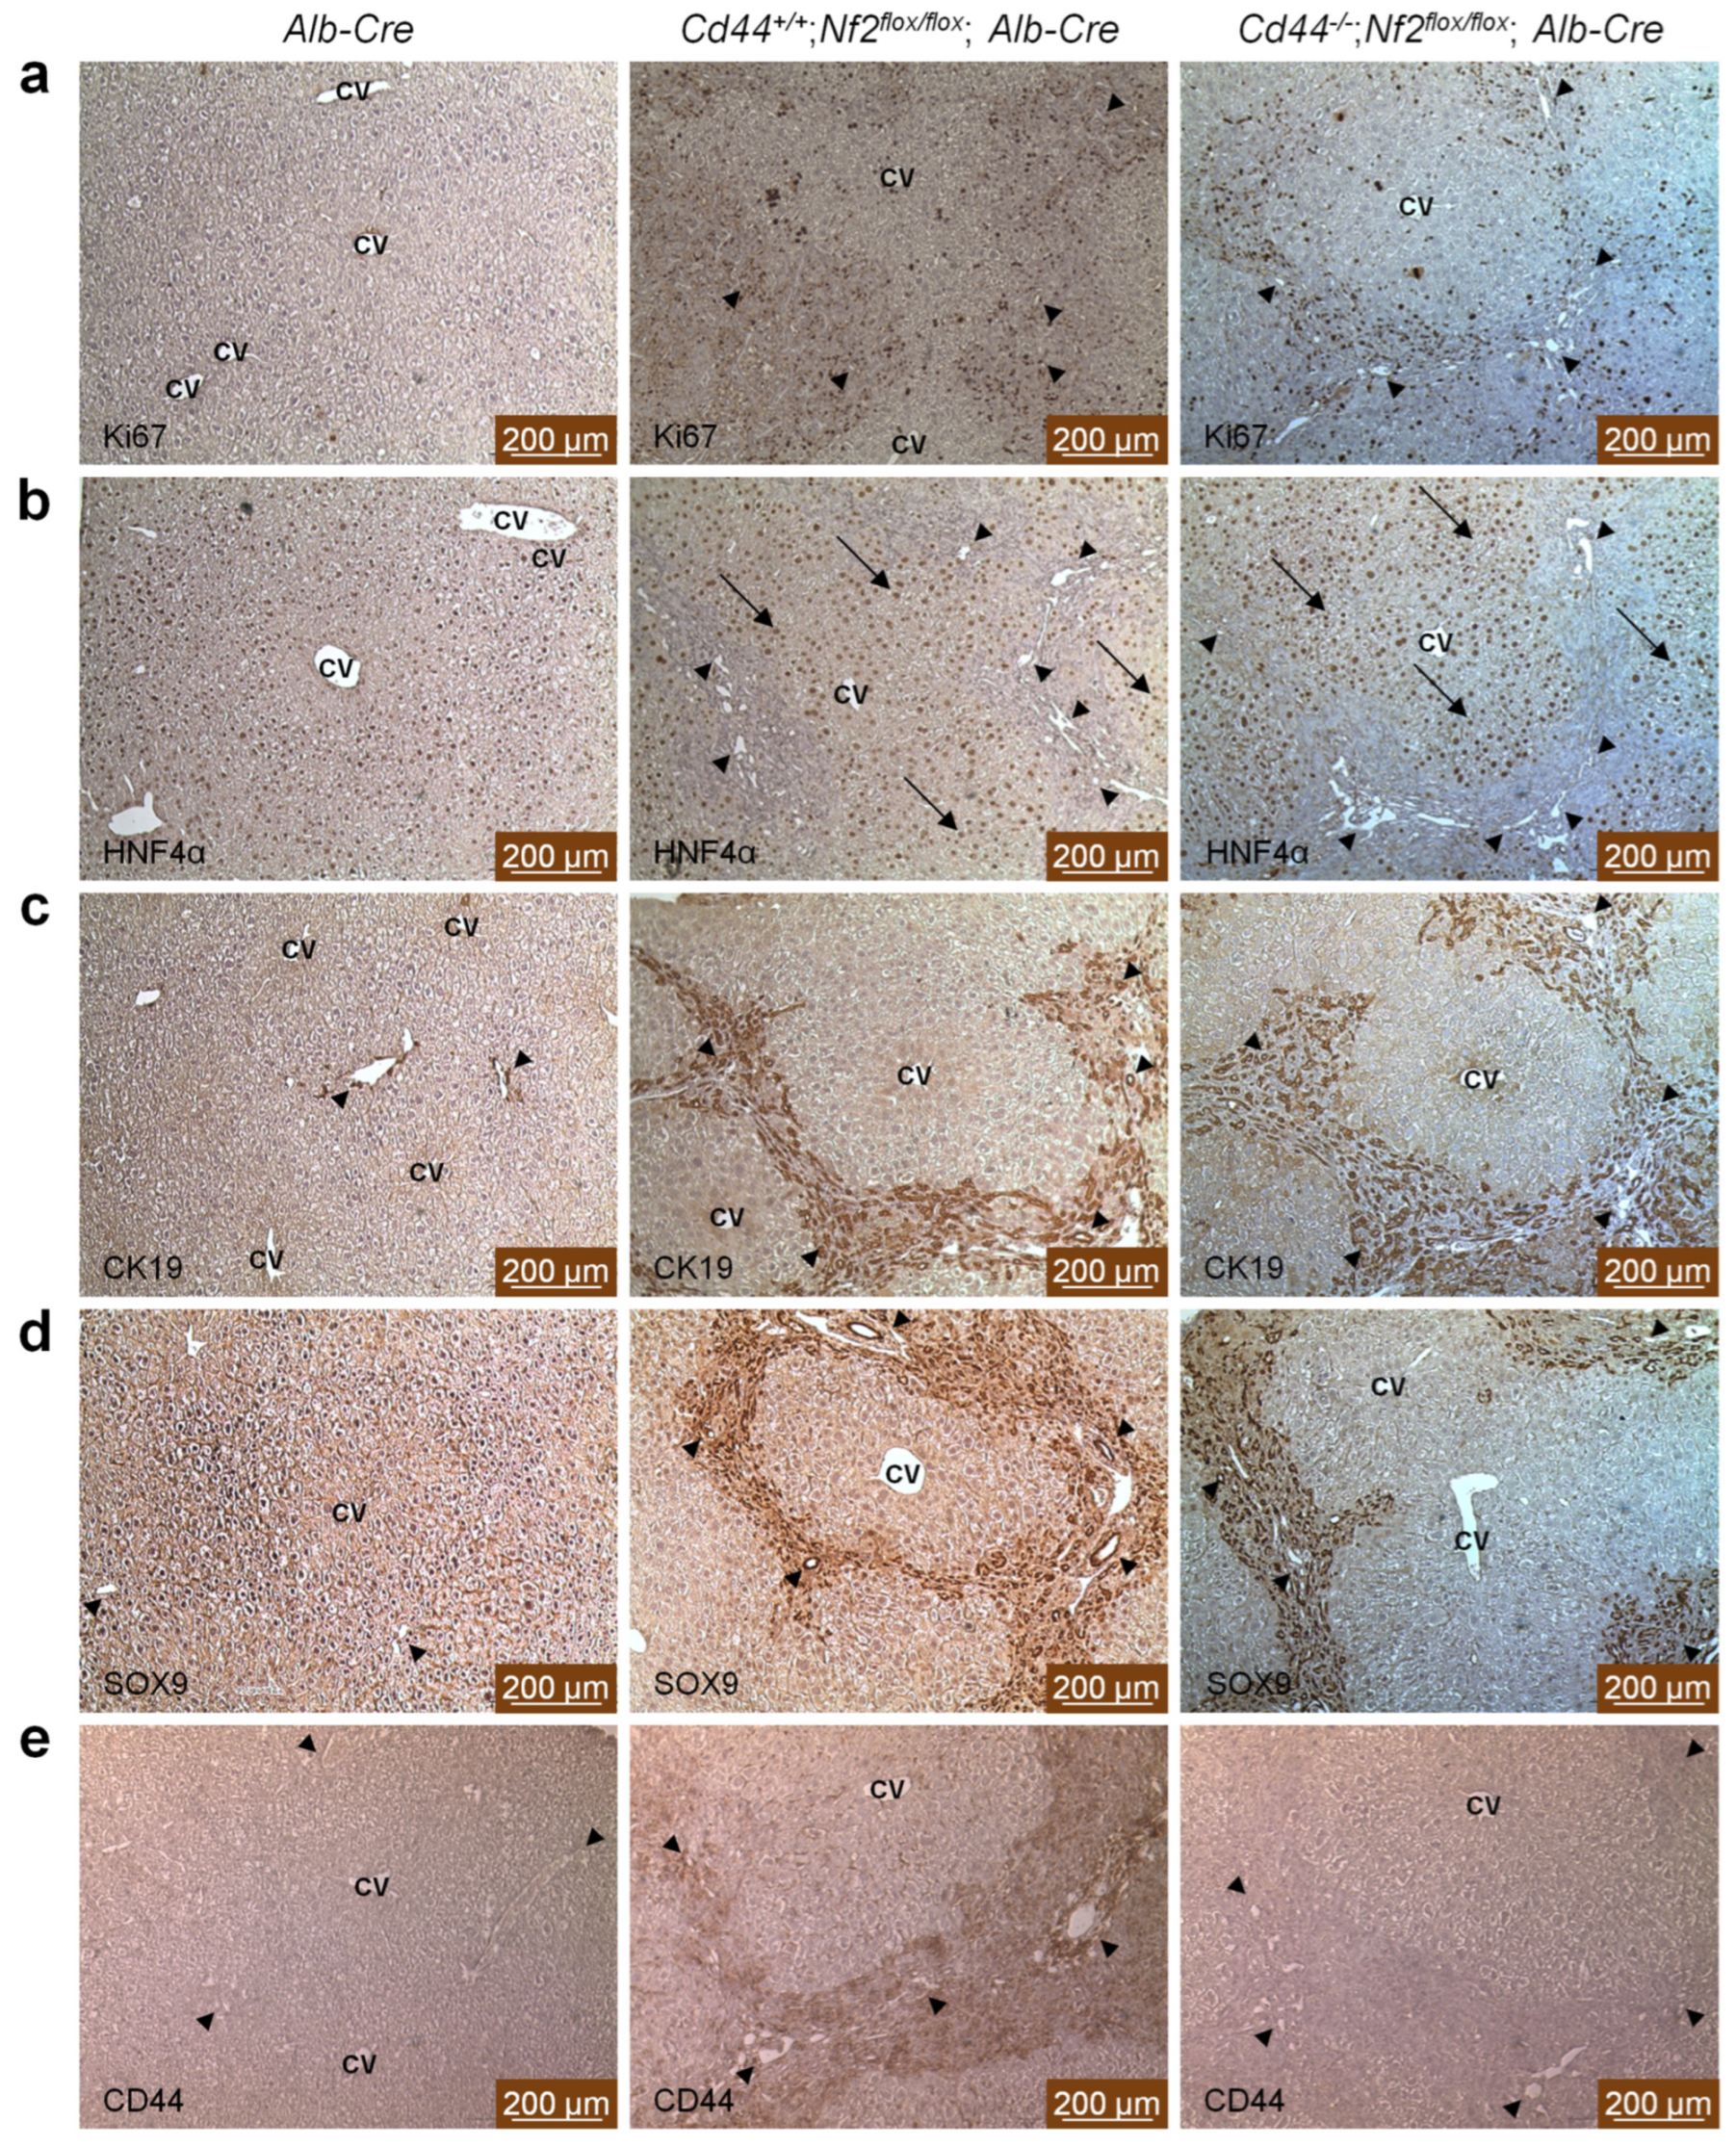
3.2. Ductular Proliferation Observed in Nf2flox/flox;Alb-Cre Mice Is Not Influenced by Loss of Cd44

To investigate the Nf2-dependent histopathological changes, livers isolated from Nf2flox/flox;Alb-Cre and control animals were subjected to conventional histology as well as immunohistochemistry. The histopathological analyses revealed extensive ductular proliferation of bile ducts in the portal tracts of Nf2flox/flox;Alb-Cre animals, possibly due to proliferation of the putative liver progenitor cells, so-called oval cells (Figure 2, Figures S2 and S3). Morphology of hepatocytes remained unchanged (Figure 2, Figures S2 and S3).
Moderate ductular reaction in the portal tract areas was already found in 2- and 6-week-old Nf2-mutant mice and progressed in the 20- to 32-week-old cohort, ultimately leading to a massive tumor-like ductular process radiating from and bridging portal areas in livers of 48-week-old Nf2-mutant mice (Figure 2 and Figure S2). As revealed by Gomori silver staining, livers of 48-week-old mice exhibited progressive fibrosis, visible as bridges of collagen that connected individual portal tracts and entrapped islands of hepatocytes, with pseudolobule formation and distortion of liver architecture, indicative of cirrhosis (Figure S3). Comparable pathological changes were observed in livers isolated from Cd44+/+;Nf2flox/flox;Alb-Cre, Cd44−/−;Nf2flox/flox;Alb-Cre, and Cd44flox/flox;Nf2flox/flox;Alb-Cre mice (Figure 2, Figures S2 and S3), suggesting that the status of the Cd44 gene has no influence on ductular proliferation or liver fibrosis.
In younger mice, ductular reaction and fibrosis were most pronounced in subcapsular areas (Figure 2 and Figure S2, asterisks). These regions showed increased cell turnover when compared to central regions containing hepatocytes (Figure 3). Both the rate of cell death (Figure 3a,c, measured by TUNEL assay) and cell proliferation (Figure 3b,d, indicated by positive Ki67 staining) were increased three- to four-fold in subcapsular areas when compared to central areas.
There were no significant differences in cell proliferation or apoptosis between Cd44-positive and Cd44-negative Nf2-mutant livers (Figure 3).

3.3. CD44 Exhibits Similar Expression Pattern to Ductular/Liver Progenitor Cell Markers, but Is Not Required for Ductular Process in Nf2flox/flox;Alb-Cre Mice

To further characterize ductular proliferations observed in Nf2-mutant mice, ductular/liver progenitor cell markers cytokeratin 19 (CK19) and transcription factor SOX9 were analyzed. In addition, hepatocyte nuclear factor 4 alpha (HNF4α) was detected to distinguish hepatocytes, and Ki67 staining was performed to identify proliferating cells. At later ages, the ductular process was distributed throughout the portal and periportal areas of Nf2-mutant livers. Ki67-staining highlighted an increased rate of proliferation in ductular reactions from Cd44+/+;Nf2flox/flox;Alb-Cre and Cd44−/−;Nf2flox/flox;Alb-Cre livers (Figure 4a and Figure S4a). Patches of proliferating ductular reactions radiated from portal tracts, whereas hepatocytes were largely Ki67-negative (Figure 4a and Figure S4a). HNF4α showed positive nuclear staining in hepatocytes but was absent in ductular reactions (Figure 4b and Figure S4b). Instead, tumor-like ductular proliferations were positive for CK19 and SOX9 staining (Figure 4c,d and Figure S4c,d). Figure 4c,d and Figure S4c,d demonstrate the comparably marked CK19 and SOX9 staining of cholangiocytes of ductular reaction/oval cell proliferation highlighting fibrotic septae between portal tracts and the formation of pseudolobuli in Nf2-mutant livers; in the Alb-Cre control livers, only the originary bile ducts expressed CK19 and SOX9 antigens and no ductular proliferation was noted. Despite some regional differences in intensity and thickness of CK19 and SOX9 -positive cell layer, we did not observe any significant differences between Cd44+/+;Nf2flox/flox;Alb-Cre and Cd44−/−;Nf2flox/flox;Alb-Cre livers (Figure 4c,d and Figure S4c,d).
Furthermore, we investigated localization of CD44 in mutant livers. Immunohistochemical analysis (Figure 4e and Figure S4e) and immunofluorescent staining (Figure S5) revealed that CD44 is expressed in bile ducts and ductular proliferations, but not in hepatocytes (Figure 4e). As expected, Cd44−/−-livers were negative for CD44 staining (Figure 4e, Figures S4e and S5). Together, our results suggest that despite a similar expression pattern to ductular/liver progenitor cell markers, Cd44 is not required for ductular proliferation in Nf2flox/flox;Alb-Cre mice.

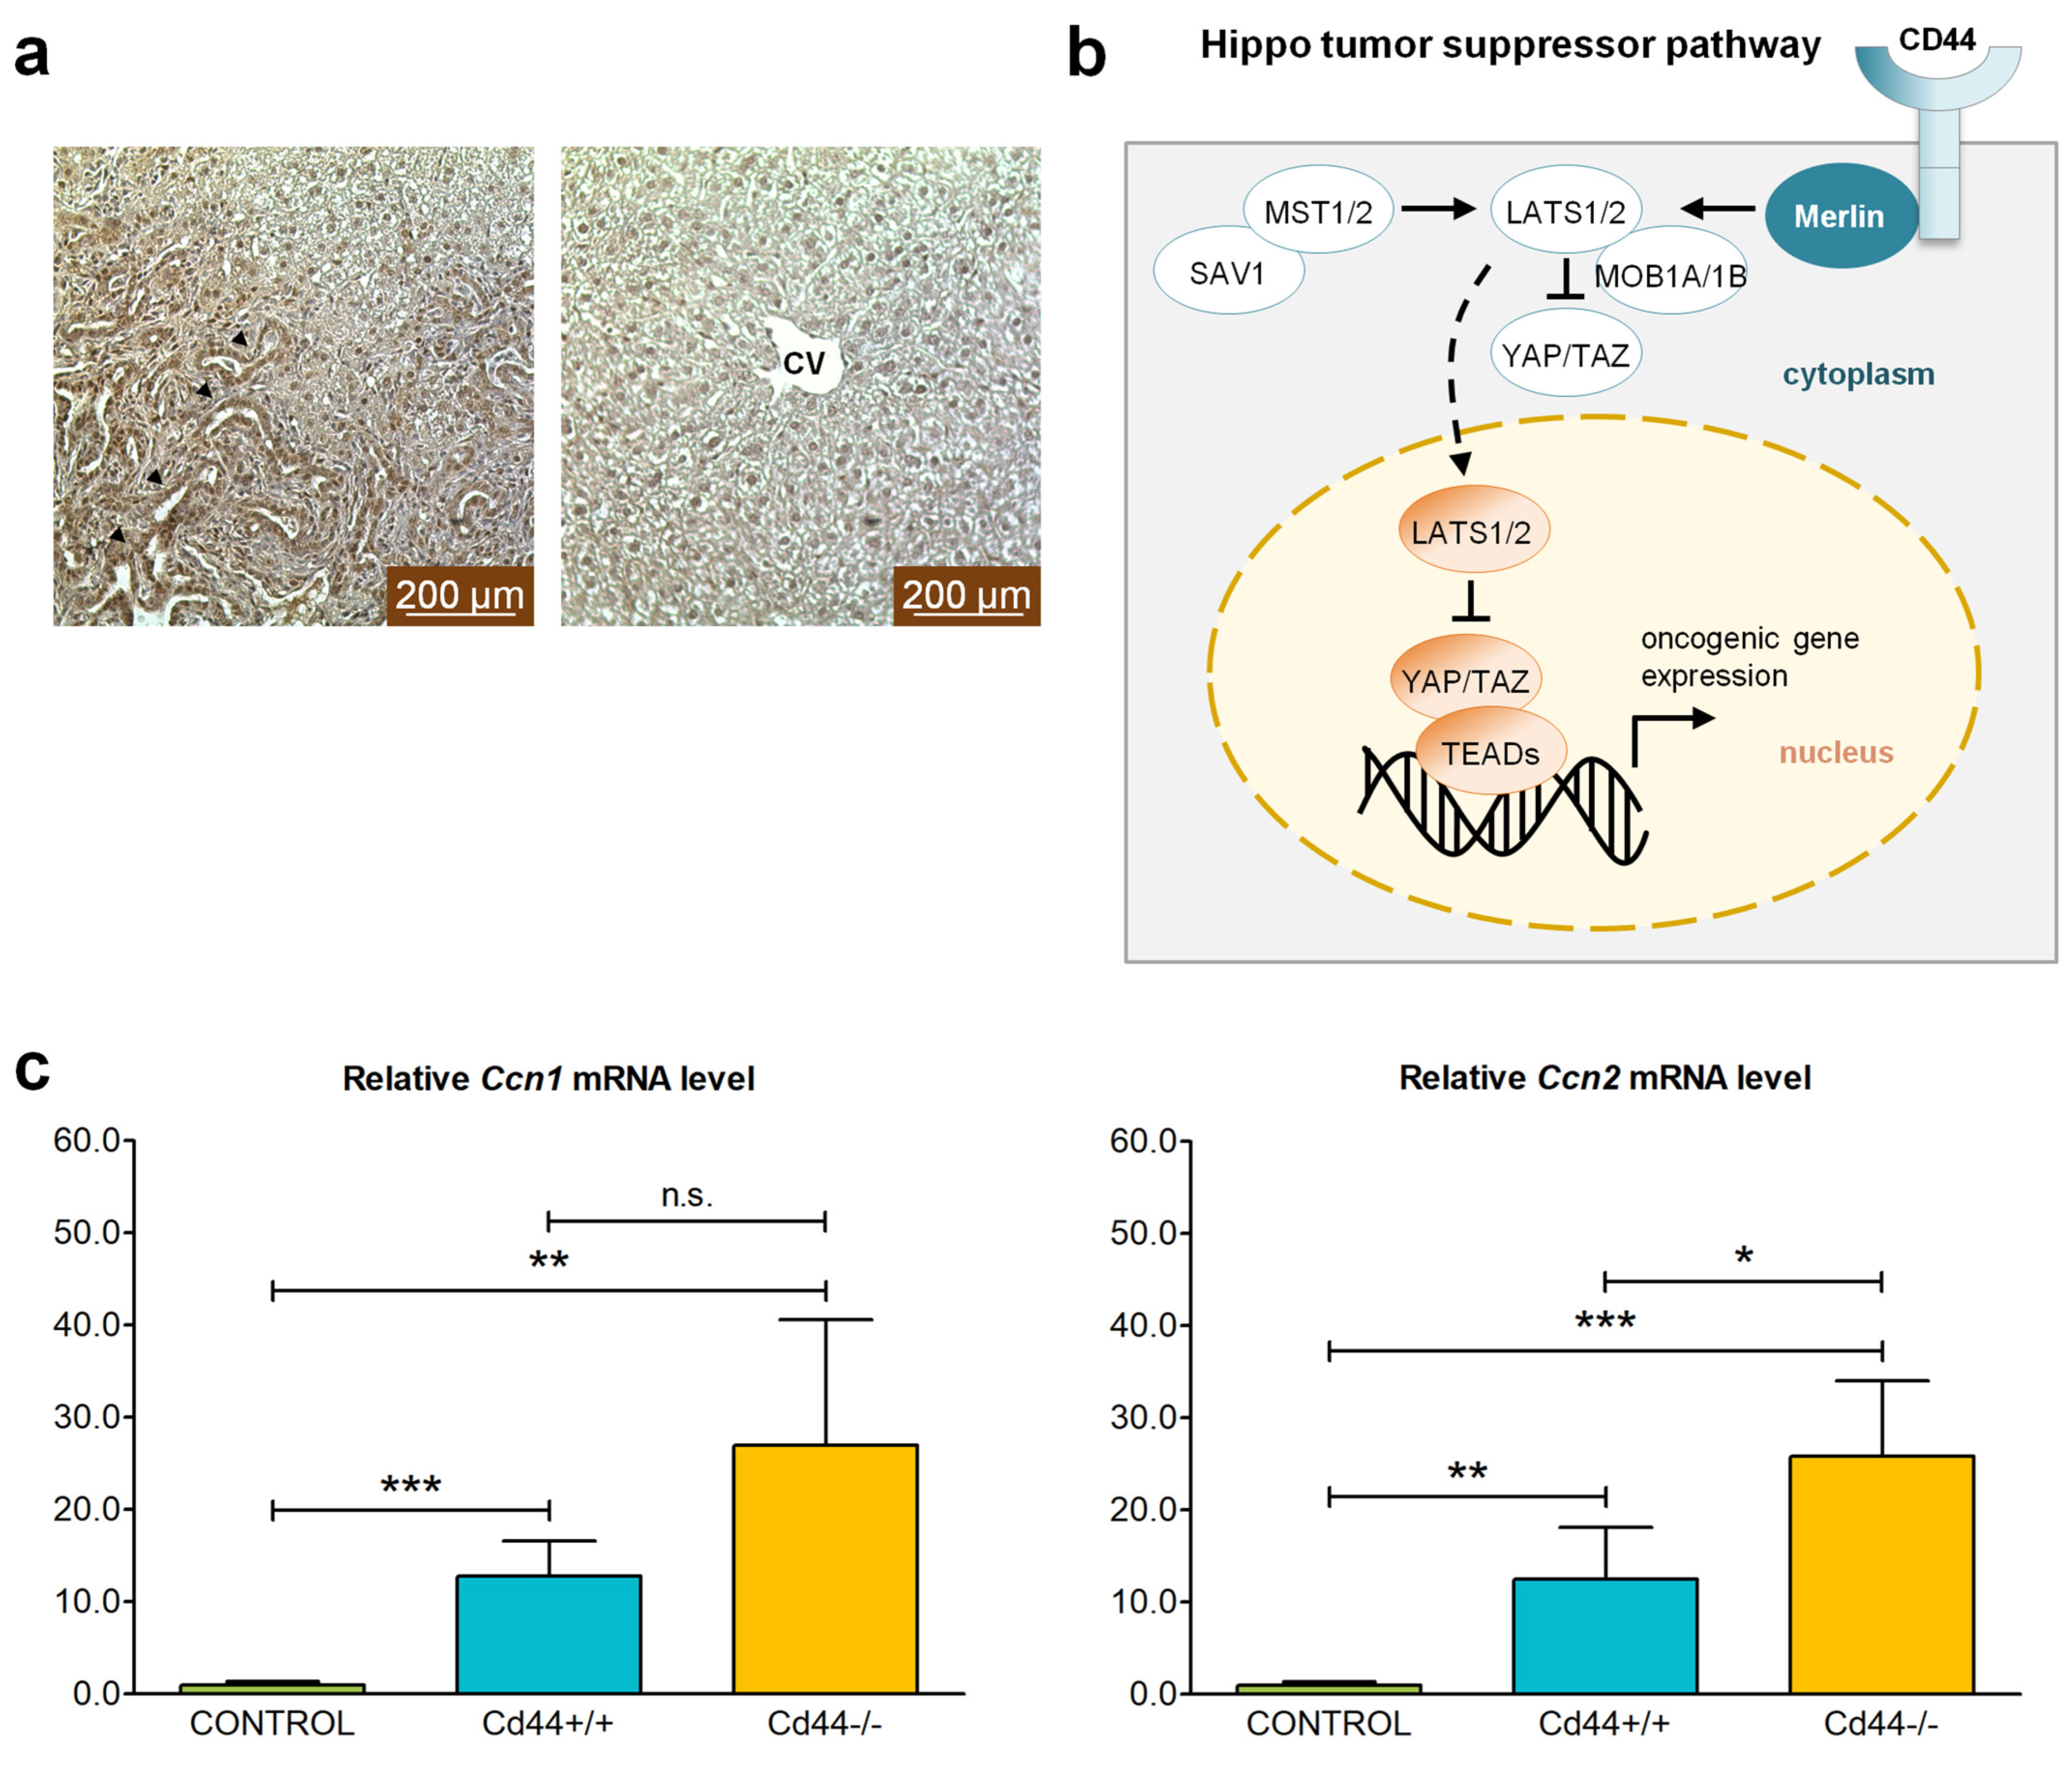
3.4. YAP Signaling Is Elevated in Nf2-Deficient Livers

NF2/Merlin acts as an upstream regulator of the Hippo signaling tumor suppressor pathway that inhibits oncogenic YAP activity (Figure 5b). Accordingly, Nf2-deficient livers exhibited enhanced staining of YAP and increased transcriptional activity of YAP target genes when compared to control mice (Figure 5). YAP was predominantly localized in the ductular reactions of Nf2flox/flox;Alb-Cre mice, whereas hepatocytes were largely negative for YAP staining (Figure 5a). Expression of YAP target genes Ccn1 and Ccn2 increased more than tenfold in livers isolated from Cd44+/+;Nf2flox/flox;Alb-Cre mice compared to those isolated from Alb-Cre mice (Figure 5c). Transcriptional activity of YAP was even higher in Cd44-negative Nf2-mutant livers compared to Cd44-positive livers. However, these effects were only significant for the Ccn2 gene. Increased activity of YAP oncogene is compatible with its role in mediating tumorigenic progression in Nf2-mutant livers. The effects of Cd44 deletion on expression of YAP target genes are difficult to interpret given the high variations in Ccn1 and Ccn2 mRNA levels between single Cd44-individuals.

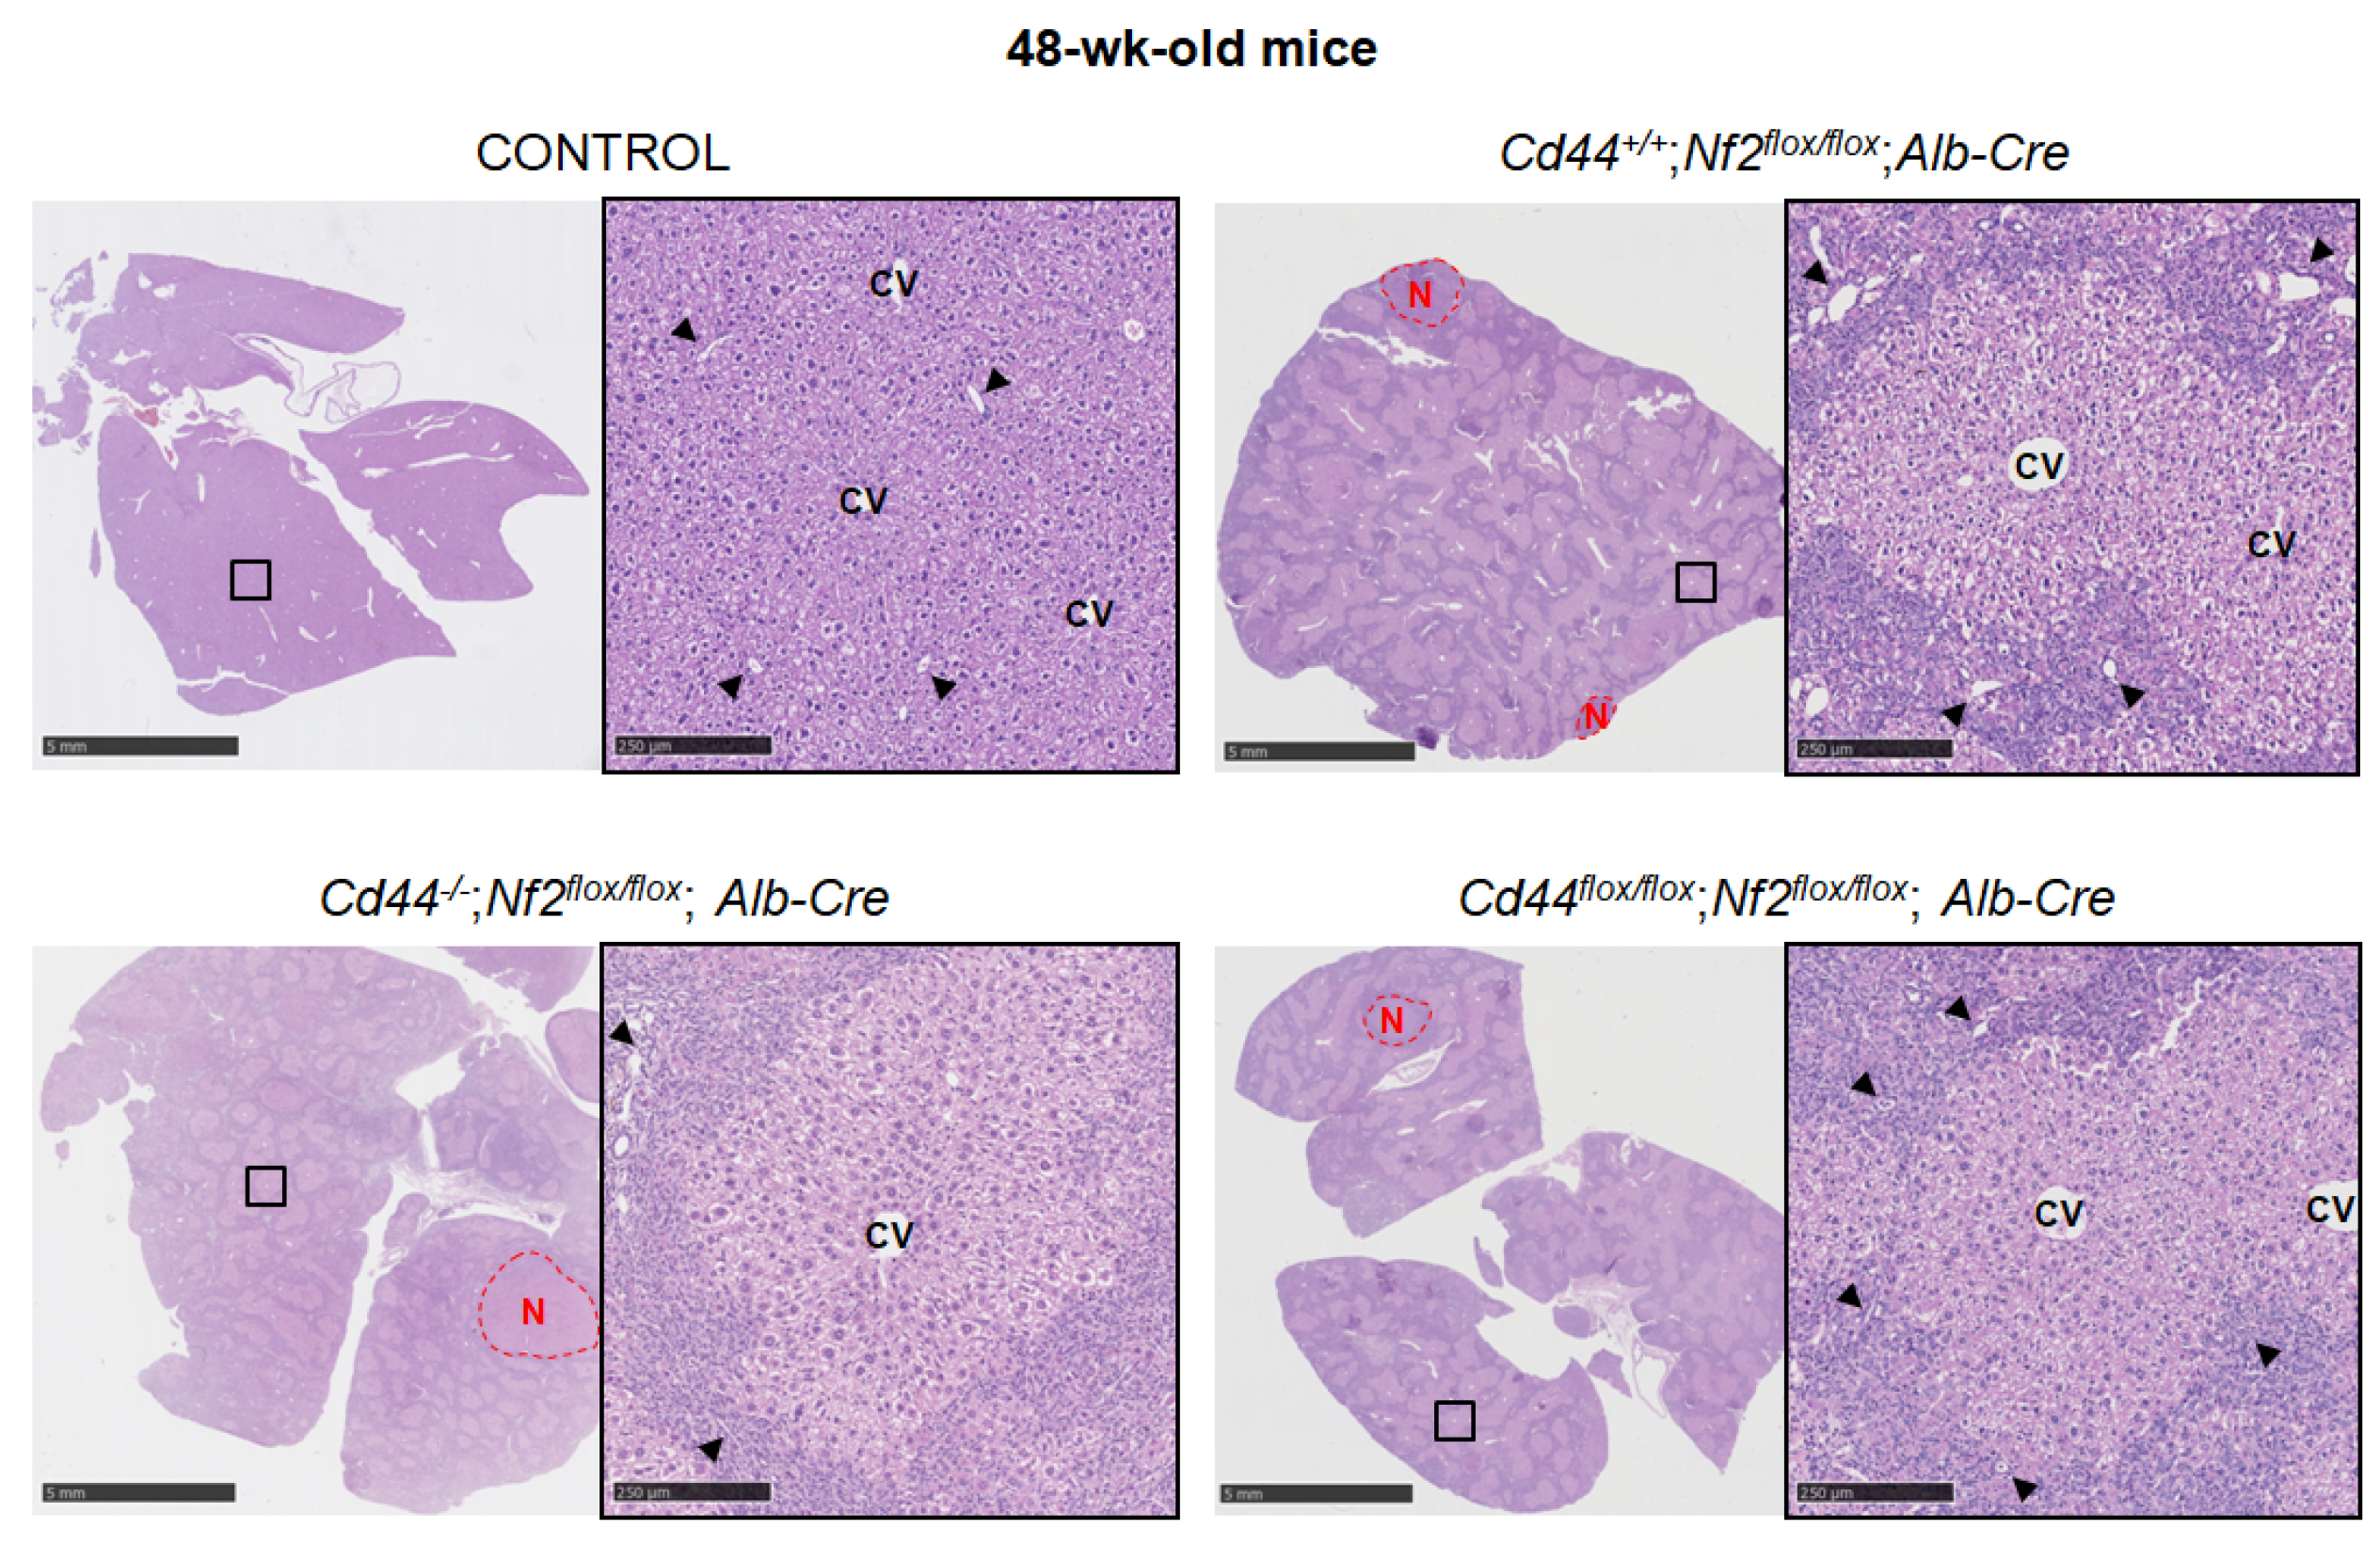
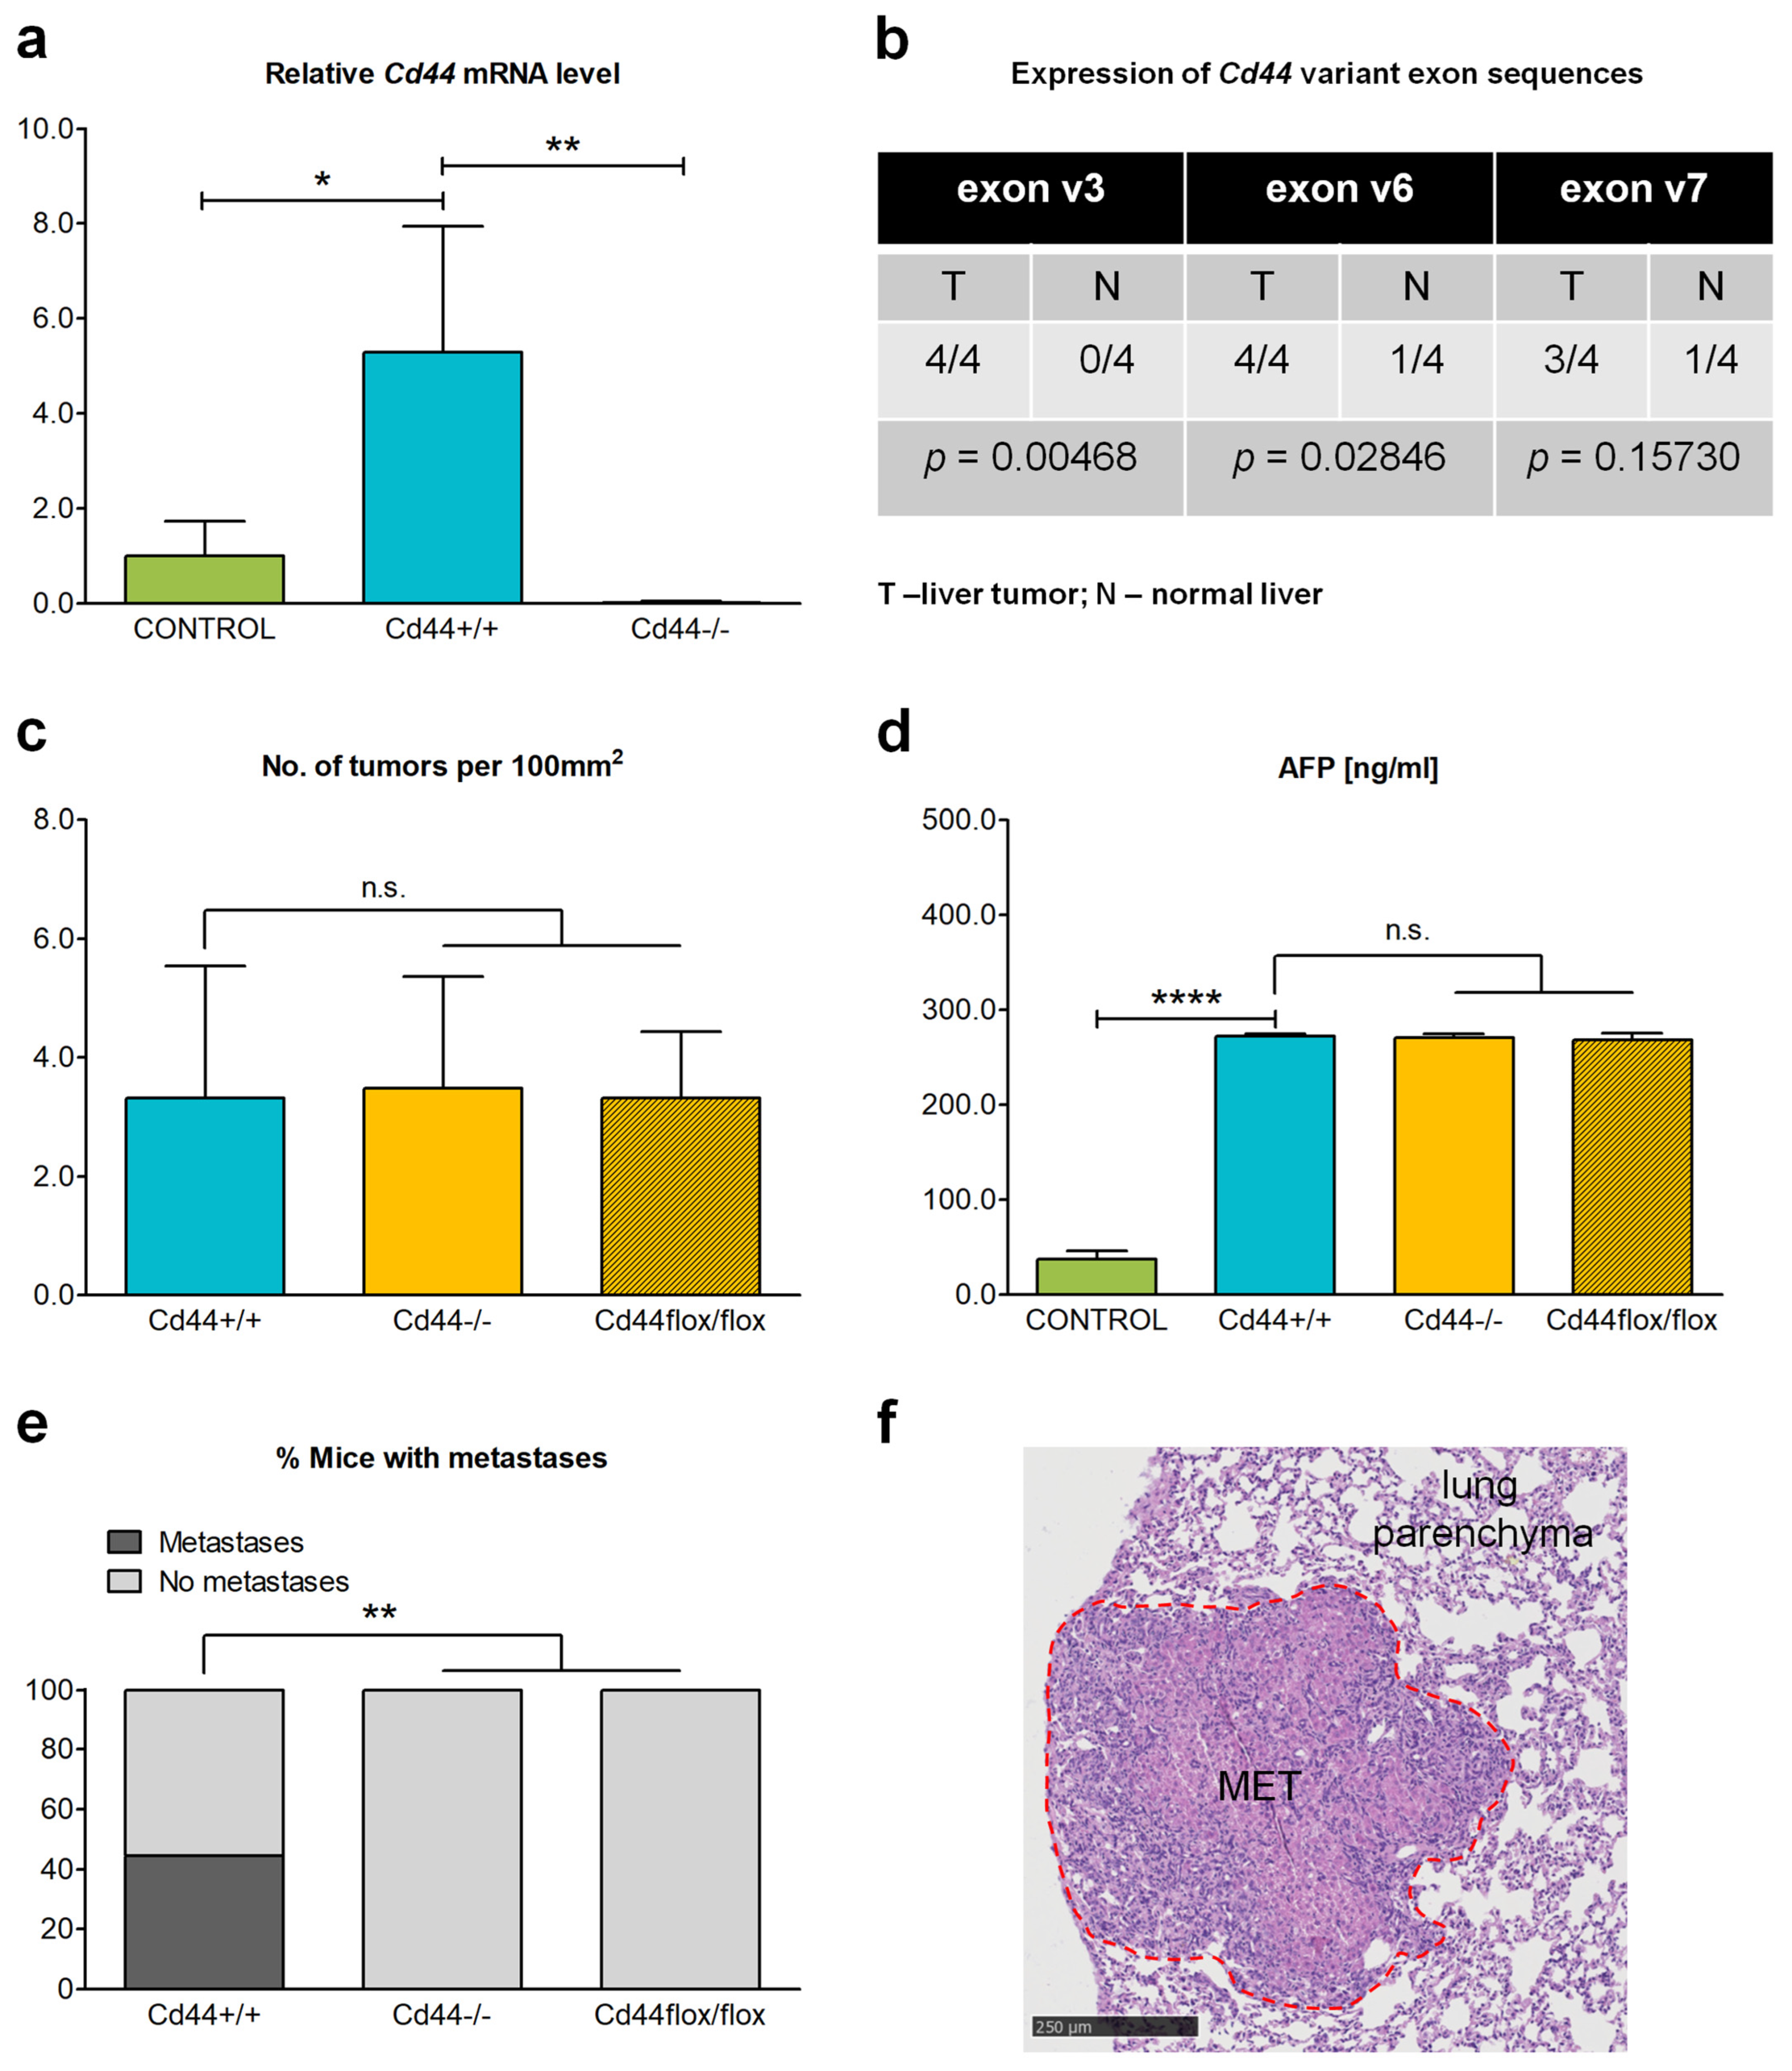
3.5. Deletion of Cd44 Does Not Influence Primary Liver Tumor Generation but Virtually Aborts Metastasis Formation in Nf2flox/flox;Alb-Cre Mice

Furthermore, we investigated the influence of CD44 on liver tumor development and progression in Nf2-mutant mice. We observed that nearly all Nf2flox/flox;Alb-Cre mice older than 32 weeks, whether Cd44-positive or Cd44-negative, developed frank liver tumors, and primarily HCCs. However, transitional cellular and histological features that were intermediate between HCCs and iCCAs were also frequently observed. The former exhibited a striking variety of histopathological types, including macrotrabecular and pseudoglandular morphologies (Figure S6). However, we did not observe any significant differences in the spectrum of tumors detected in Cd44+/+;Nf2flox/flox;Alb-Cre, Cd44−/−;Nf2flox/flox;Alb-Cre, and Cd44flox/flox;Nf2flox/flox;Alb-Cre mice.
The level of total Cd44 mRNA was significantly increased in liver tumors isolated from 48-week-old Cd44+/+;Nf2flox/flox;Alb-Cre mice compared to age-matched control livers isolated from Alb-Cre mice (Figure 6a). As expected, Cd44−/− tumors did not express relevant Cd44 mRNA levels (Figure 6a). Moreover, nearly all livers isolated from 48-week-old Cd44+/+;Nf2flox/flox;Alb-Cre mice were positive for expression of exon v3-, v6-, and v7-bearing CD44 variant isoforms that have previously been implicated in cancer (Figure 6b). Livers isolated from Alb-Cre mice were applied as controls, as it was not possible to identify normal liver areas in 48-week-old Nf2flox/flox;Alb-Cre animals given the extensive tumor-like ductular process. The increased expression of total Cd44 mRNA and presence of Cd44 variant isoforms, including exon v3, v6, and v7 sequences in liver tumors from Cd44+/+;Nf2flox/flox;Alb-Cre mice, is compatible with the function of CD44 and its isoforms in the formation of primary liver tumors and/or metastases. However, the Cd44 gene status had no influence on either the number of primary liver tumors detected or on the level of the hepatocellular carcinoma biomarker AFP (α-fetoprotein) in the serum of Nf2-mutant mice (Figure 6c,d). In sum, our results suggest that CD44 does not influence primary liver tumor generation in Nf2-mutant mice.
Next, we were interested in the role of CD44 in liver tumor progression. Liver metastases were detected in the lungs of four of the nine analyzed 48-week-old Cd44+/+;Nf2flox/flox;Alb-Cre mice (Figure 6e). These included two HCCs, one iCCA, and one mixed HCC-iCCA metastasis. In contrast, no metastases were found in nine of the analyzed Cd44−/−;Nf2flox/flox;Alb-Cre or five of the analyzed Cd44flox/flox;Nf2flox/flox;Alb-Cre mice. No extrahepatic lesions other than lung metastases were detected. Together, our results indicate that CD44 is not required either for ductular proliferation or for generation of HCCs or the other primary liver tumors observed in Nf2flox/flox;Alb-Cre mice. Instead, we identified a critical role of CD44 in the generation of liver tumor metastases in the lung.

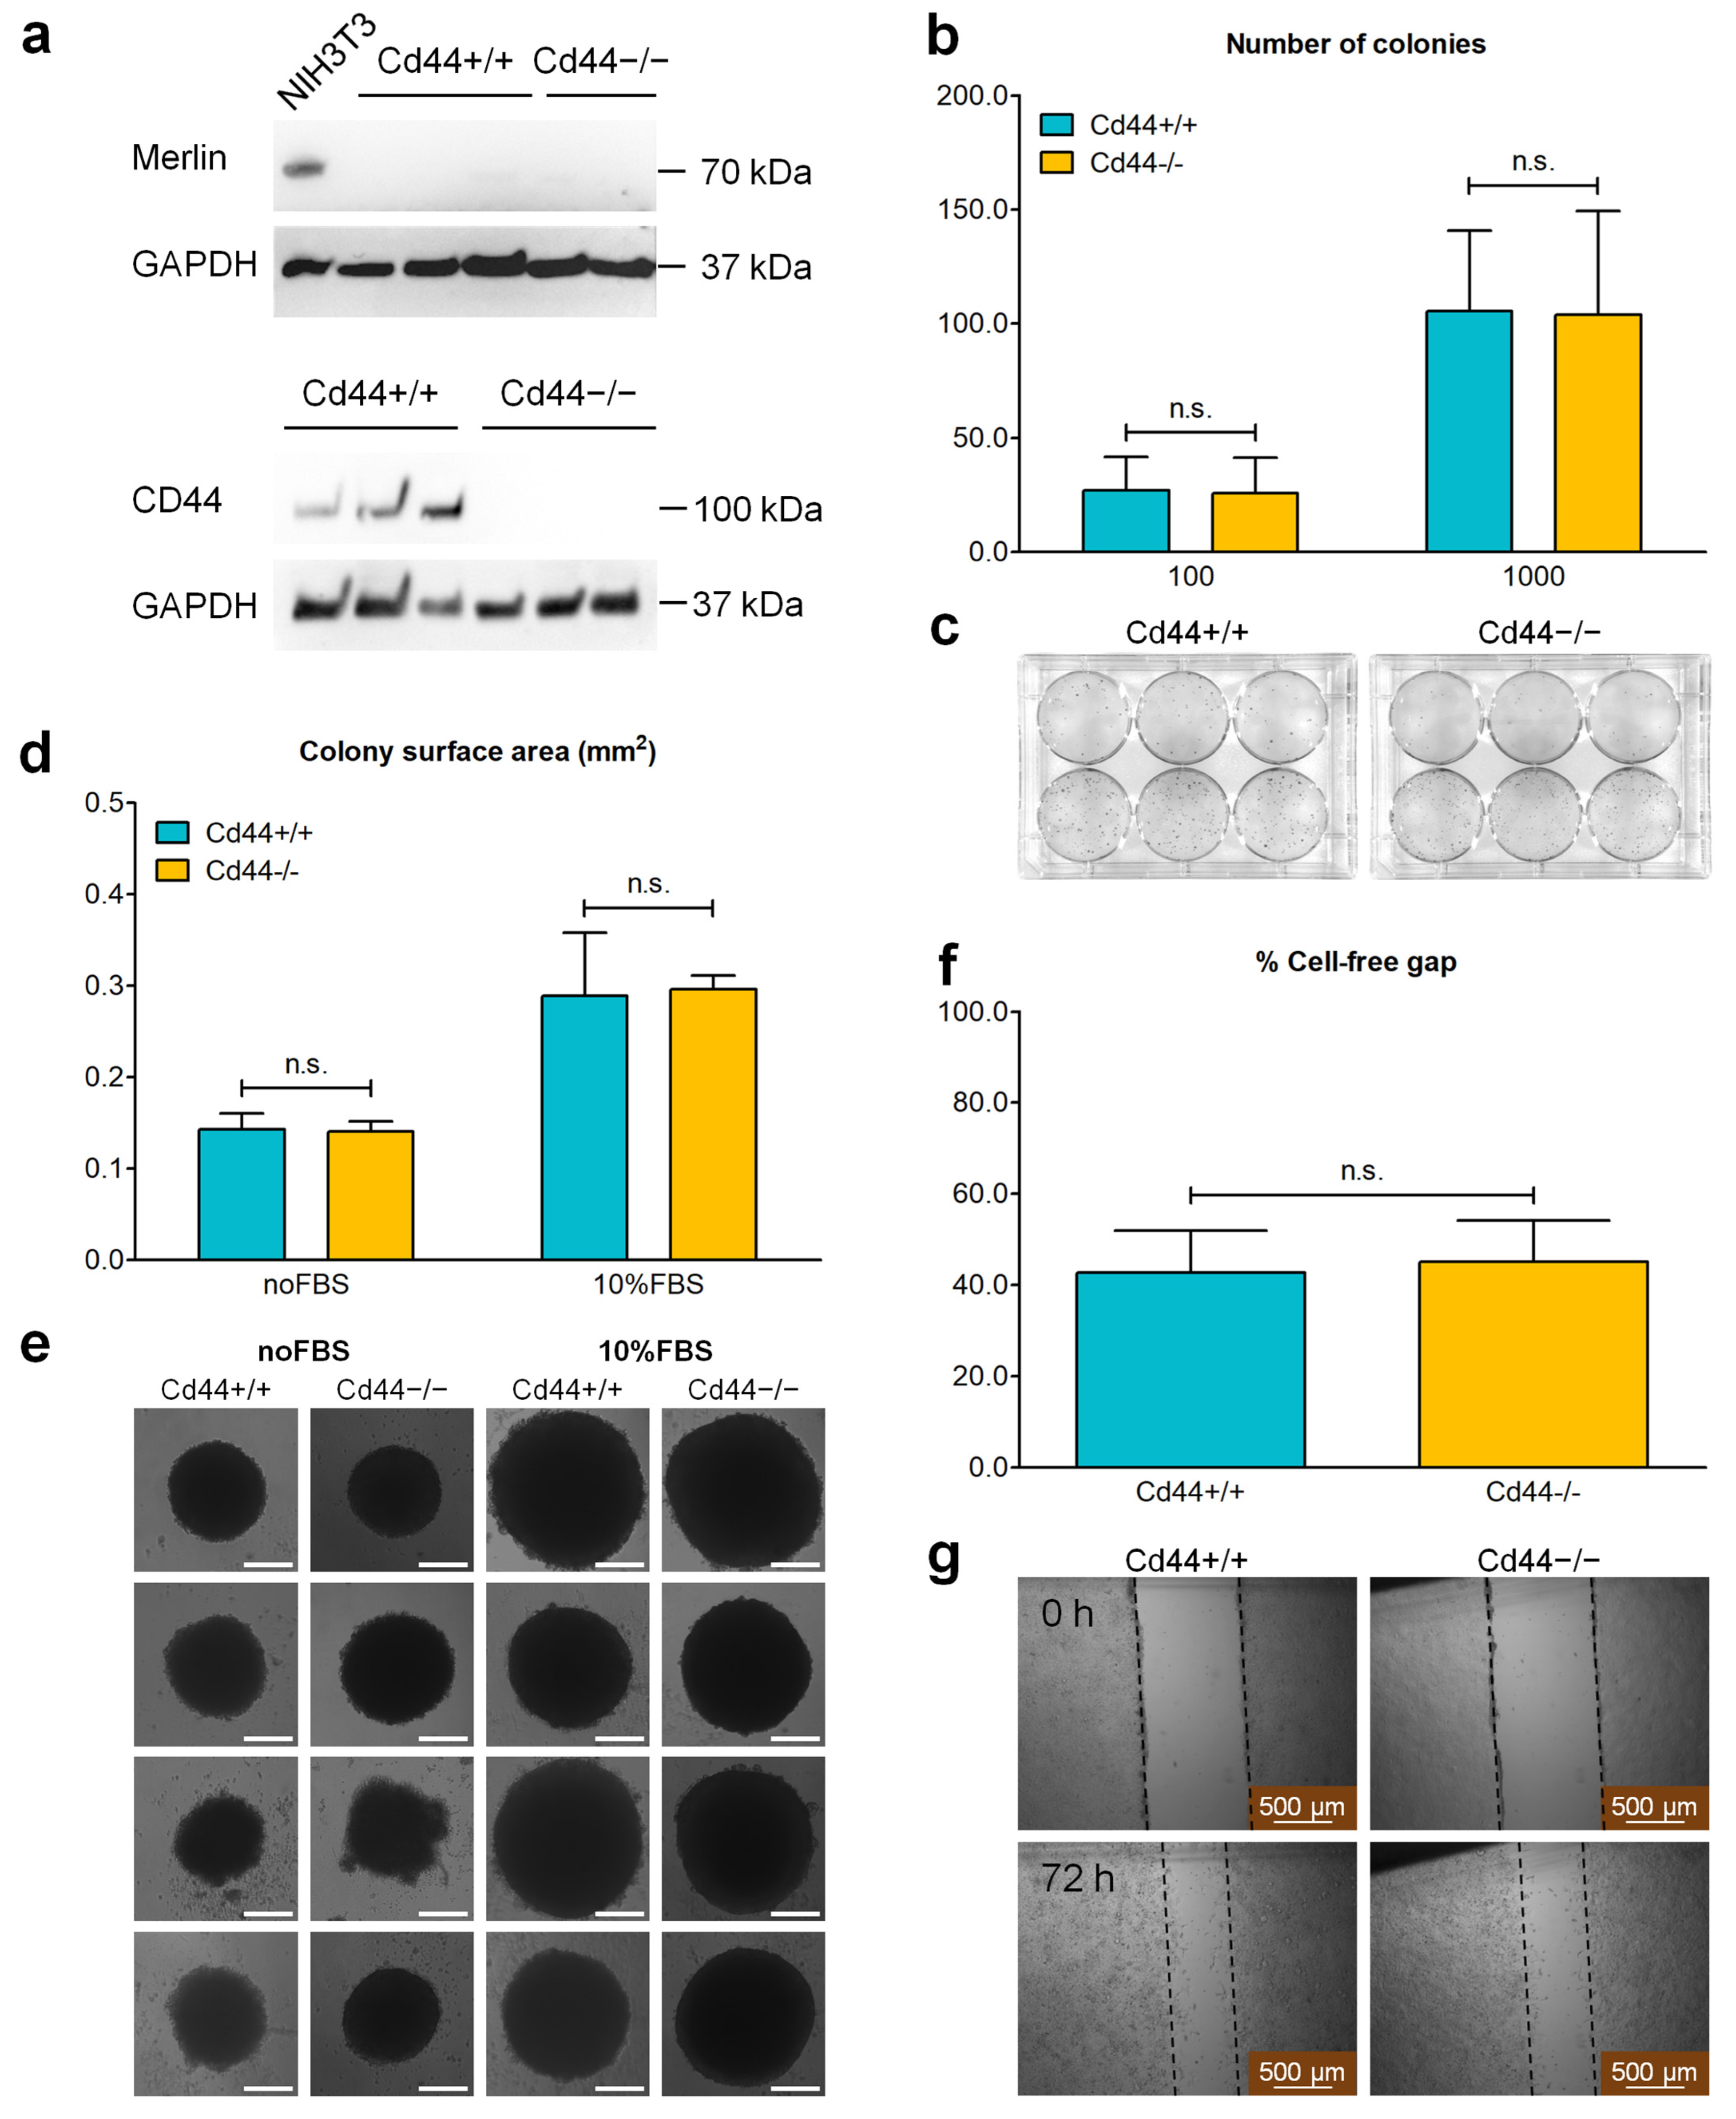
3.6. Deletion of the Cd44 Gene Does Not Influence Colony-Forming Ability or Migration into Cell-Free Gap of Nf2-Negative Liver Cells

Liver tumor cells were isolated from Nf2-mutant mice to further investigate the role of CD44 in liver tumor development and progression. Subsequently, the cells isolated from Cd44+/+;Nf2flox/flox;Alb-Cre, and Cd44−/−;Nf2flox/flox;Alb-Cre livers will be identified as Cd44+/+ and Cd44−/−, respectively. As expected, all cell lines generated from Nf2flox/flox;Alb-Cre livers were negative for NF2/Merlin expression (Figure 7a). Because Alb-Cre-dependent recombination of Nf2 flox alleles is restricted to liver cells, these results indicate a lack of contamination from other cell types. Through immunoblot analysis, we also confirmed that only Cd44+/+ cells, and not Cd44−/− cells, were positive for CD44 (Figure 7a). The isolated cells also did not express hepatocyte marker HNF4α, but they were positive for ductular/liver progenitor cell markers CK19 and SOX9 (Figure S7). Although there were cell line-dependent variations in CK19 and SOX9 expression levels, we observed no significant differences in the expression and subcellular localization of CK19 and SOX9 between Cd44-positive and Cd44-negative cell lines (Figure S7b–d). Similarly, levels of phosphorylated LATS and YAP were highly variable between analyzed cell lines; however, these differences were independent of the Cd44 gene status, suggesting that, in the absence of Merlin, CD44 has no influence on Hippo signaling (Figure S8).
After confirming that the isolated cells exhibit expected expression pattern of Nf2, Cd44, and characteristic liver markers, further functional assays were conducted. At first, the self-renewing capability of Cd44-positive and Cd44-negative cells derived from Nf2flox/flox;Alb-Cre livers was compared in a clonogenic assay. Deletion of the Cd44 gene did not influence the capability of Nf2-negative liver cells to form colonies under adherent (Figure 7b,c) or nonadherent conditions (Figure 7d,e). Liver cells grown on attachment-resistant plates formed one single spherical colony per well of a 96-well plate (Figure 7d,e). The size of generated spherical colonies grown in medium enriched with 10% FBS was larger compared to those generated in serum-deprived medium (Figure 7d,e). However, we did not observe any significant differences between Cd44-positive and Cd44-negative colonies (Figure 7d,e). Colony-forming assays are indicative of tumor-initiating potential of investigated cells [51]. Thus, our in vitro results suggest that Cd44+/+ and Cd44−/− cells do not differ in their tumor-initiating capability. This observation is compatible with our in vivo results demonstrating no difference in tumor development or growth between Cd44+/+;Nf2flox/flox;Alb-Cre and Cd44−/−;Nf2flox/flox;Alb-Cre mice (Figure 6c,d).
Attachment-independent growth is also a prerequisite for metastatic spread of tumor cells. A large percentage of tumor cells that enter the bloodstream or the lymph during metastatic dissemination die due to loss of cell–cell and cell–matrix contacts, undergoing a specific type of apoptosis known as “anoikis” [52]. Our results suggest that CD44 does not influence the ability of liver cells to evade anoikis (Figure 7d,e). Migration is another prerequisite for metastasis formation. To test the influence of CD44 on cell migration in vitro, a conventional scratch migration assay was conducted. CD44 had no influence on the ability of isolated liver cells on migration into an introduced cell-free gap (Figure 7f,g). Thus, the inhibitory effect of the Cd44 gene deletion on metastasis formation in vivo (Figure 6e,f) cannot be explained by the influence on anoikis or simple migration.

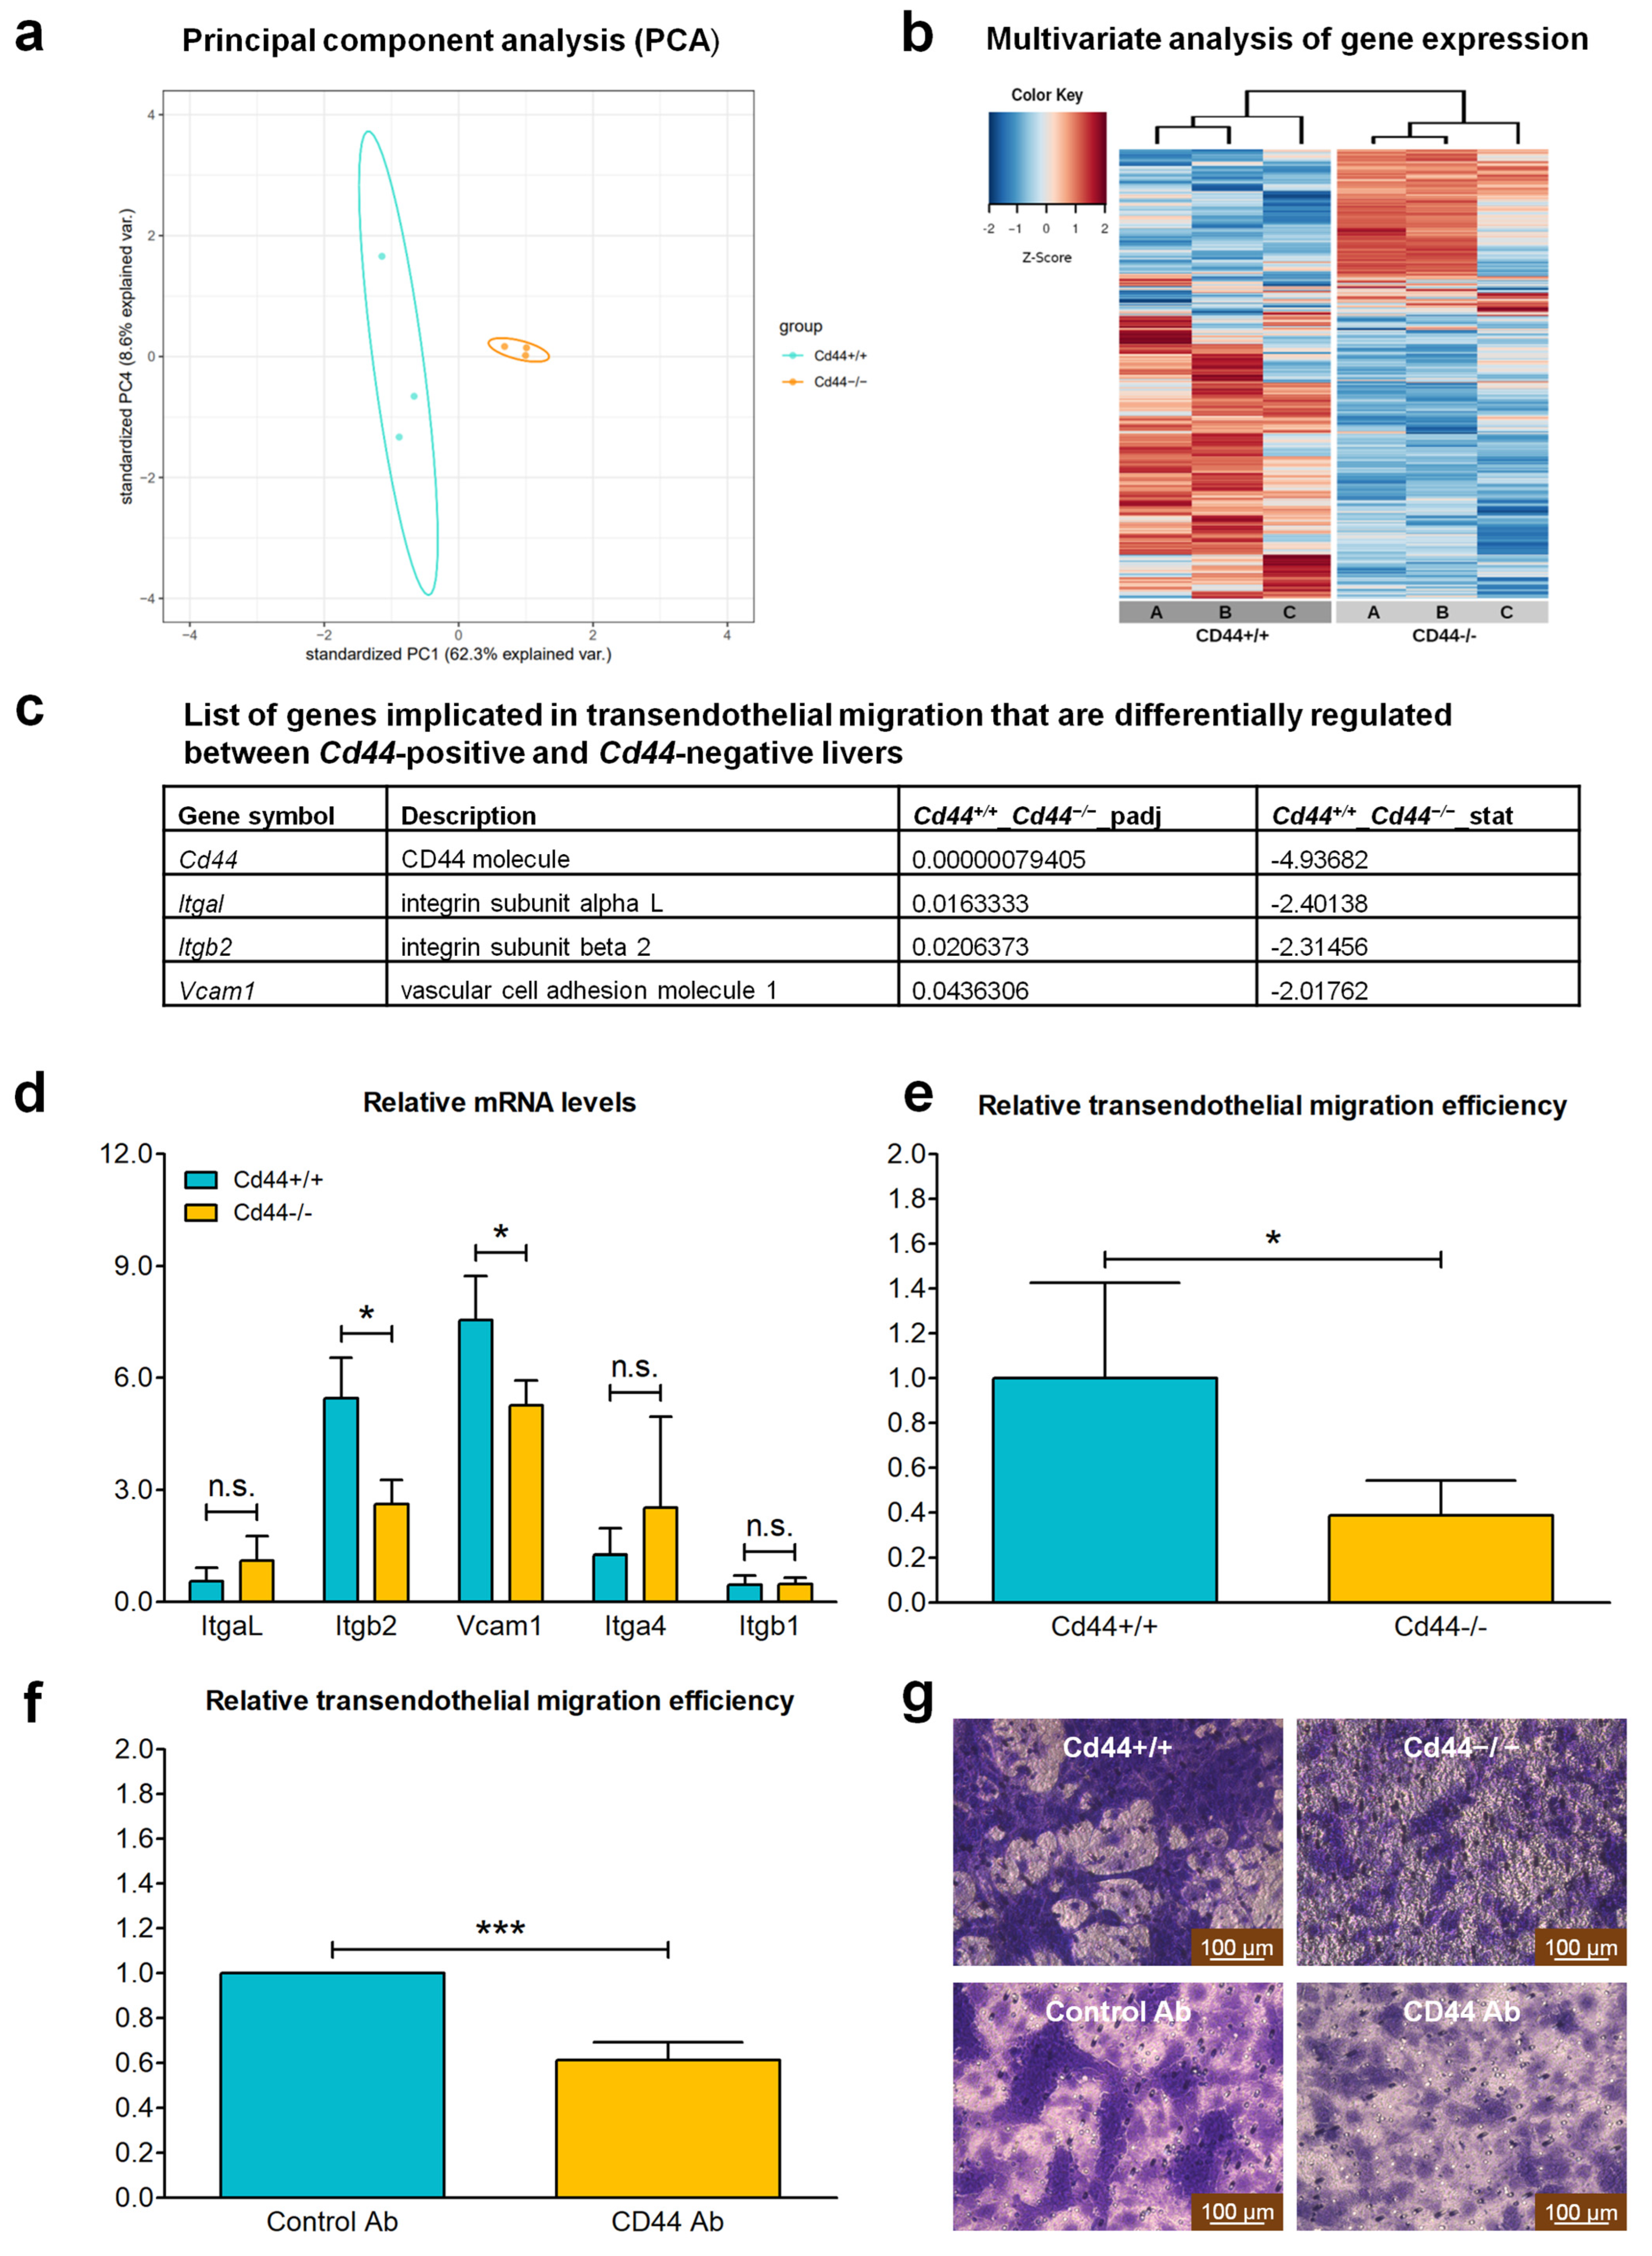
3.7. CD44 Contributes to Transendothelial Migration of Nf2-Negative Liver Cells by Upregulating Levels of Integrin Subunit Beta 2

An important hint about the potential mechanism underlying CD44-dependent metastasis formation was provided by our previous study [43]. We performed RNA-sequencing analysis on Cd44-positive and Cd44-negative livers isolated from Nf2-heterozygous mice (Figure 8a,b). We identified that several genes involved in transendothelial migration were among the top-ranked genes differentially regulated between Cd44-positive and Cd44-negative livers (Figure 8c). The full list of differentially regulated genes can be found in Table S1. Adhesion of tumor cells to endothelial cells and extravasation are important rate-limiting steps in the metastatic cascade. Integrin αLβ2 (LFA-1, lymphocyte function-associated antigen 1) and integrin α4β1 (VLA-4, very late antigen-4) are two major integrins implicated in transendothelial migration of leukocytes and tumor cells [53,54]. Interestingly, expression of genes encoding integrin subunit alpha L (ItgaL) and integrin subunit beta 2 (Itgb2), as well as the substrate of integrin α4β1, VCAM–1 (vascular cell adhesion molecule-1), were significantly downregulated in Cd44-negative livers compared to Cd44-positive counterparts (Figure 8c). These results strongly indicate a role of CD44 in regulating the major effectors of transendothelial migration of tumor cells.
Real-time qRT-PCR facilitated confirmation that the livers isolated from Cd44+/+;Nf2flox/flox;Alb-Cre animals express significantly higher levels of Itgb2 and Vcam1, compared to Cd44−/−; Nf2flox/flox;Alb-Cre livers, whereas the levels of mRNAs of ItgaL, Itga4 and Itgb1 were not significantly different (Figure 8d). These results are consistent with the RNA sequencing data, although there is a lack of differences in ItgaL expression levels between Cd44+/+;Nf2flox/flox;Alb-Cre and Cd44−/−; Nf2flox/flox;Alb-Cre animals. The observed discrepancy could depend upon the presence of frank liver tumors in Nf2flox/flox;Alb-Cre mice, but not in the analyzed Nf2-heterozygous mice. For instance, it is possible that both Cd44-positive and Cd44-negative tumors generate high levels of ItgaL, and in this case, the level of Itgb2 would be the limiting factor in the generation of functional integrin αLβ2 (LFA-1).
Liver cells isolated from Cd44−/−;Nf2flox/flox;Alb-Cre animals showed significantly reduced efficiency of transendothelial migration in vitro compared with those isolated from Cd44+/+;Nf2flox/flox;Alb-Cre mice (Figure 8e,g). Moreover, CD44-specific antibody significantly blocked transendothelial migration of Cd44-positive liver cells (Figure 8f,g). These results indicate that CD44 may promote metastatic dissemination of liver tumor cells by facilitating transendothelial migration through upregulation of Itgb2 and Vcam1 expression.

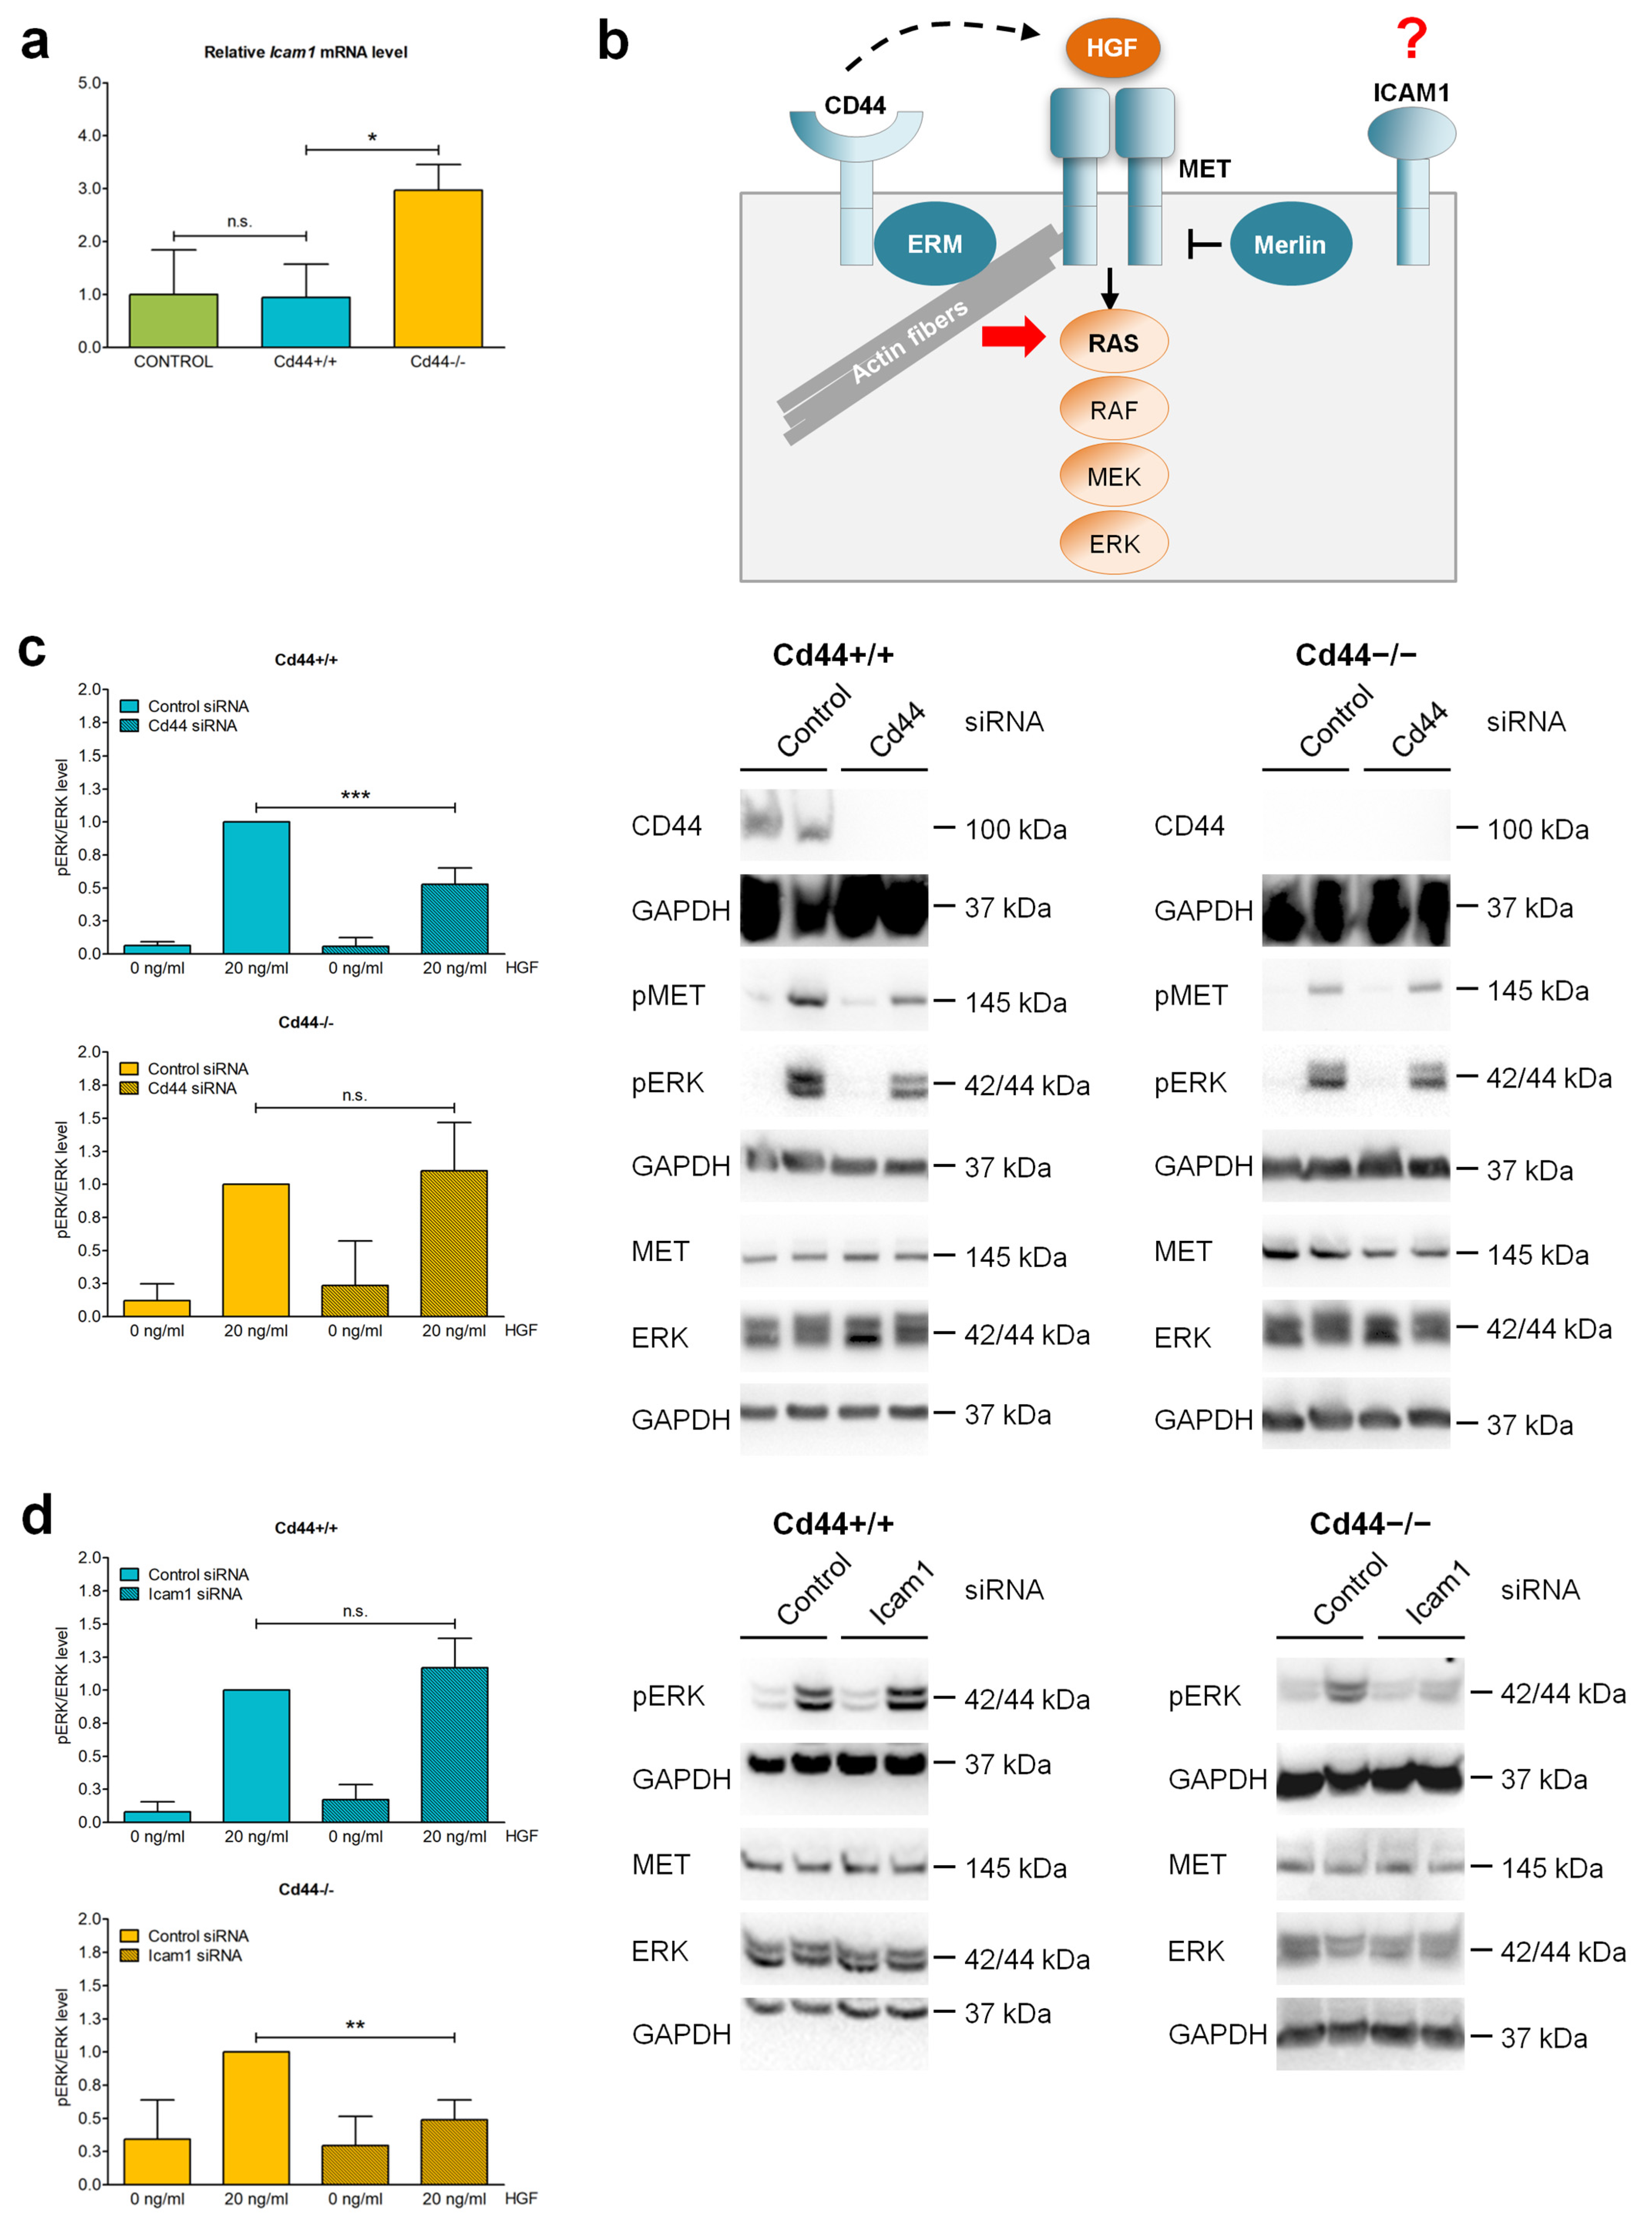
3.8. ICAM-1 May Overtake CD44 Function as a Coreceptor of Receptor Tyrosine Kinase MET in Cd44-Negative Liver Cells

Considering that Merlin inhibits putative tumor-promoting functions of CD44 (as discussed in the introduction), we expected that deletion of Nf2 would lead to more a severe phenotype in Cd44-positive mice when compared to Cd44-negative equivalents. This proved not to be the case; the Cd44 gene status had no influence on the development of primary liver tumors in Nf2flox/flox;Alb-Cre mice, suggesting that deletion of Nf2 leads to tumor-promoting mechanisms independent of Cd44. Alternatively, we considered that compensatory molecules may overtake CD44 function in Cd44-knockout mice. It has been demonstrated that ICAM-1 overtakes CD44 function as a coreceptor of receptor tyrosine kinase MET during liver regeneration [55].
To test the possibility that ICAM-1 may compensate for CD44 loss during tumorigenesis in Nf2flox/flox;Alb-Cre mice, we first investigated Icam1 expression in the livers of Nf2flox/flox;Alb-Cre mice. Interestingly, Cd44−/− livers showed significantly increased levels of Icam1 mRNA compared to Cd44+/+ livers, suggesting a compensatory mechanism (Figure 9a). Next, we tested the effect of Cd44 and Icam1 downregulation on HGF/MET signaling in liver cell lines isolated from Nf2-mutant mice. Cd44 and Icam1 expression was downregulated using small interfering RNA (siRNA). As readout for HGF/MET signaling, phosphorylated ERK was detected (see also diagram in Figure 9b). The levels of phosphorylated MET and ERK were strongly elevated in liver cells treated with 20 ng/mL of HGF (Figure 9c,d). In Cd44+/+ liver cells, the activation of MET was strictly dependent on CD44 as the levels of phosphorylated ERK were inhibited by Cd44-knockdown (Figure 9c). As expected, siRNA targeting Cd44 had no influence on MET-ERK signaling in Cd44-negative liver cells (Figure 9c). Interestingly, Icam1 knockdown inhibited ERK phosphorylation only in Cd44-negative liver cells, whereas it had no effect on MET/ERK signaling in Cd44-positive liver cells (Figure 9d). These results suggest that CD44 is sufficient for MET activation in the absence of ICAM-1. Nevertheless, ICAM-1 can overtake CD44 function as a coreceptor of MET in Cd44-knockout cells. This could explain why Cd44 knockout in the liver of Nf2flox/flox;Alb-Cre mice led to milder effects on tumor development and growth than expected based on previous reports [32,33,34,35,36].

4. Discussion

4.1. Deletion of Nf2 in the Liver Leads to CD44-Independent Liver Enlargement

This study analyzed the influence of CD44 on the phenotype of mice with a Nf2 deletion in the liver. To study the relative contribution of CD44- and Merlin-dependent signaling pathways on liver tumor development and progression, Cd44-deficient mice were crossed with Nf2flox/flox;Alb-Cre mice. Our results demonstrate that deletion of the Cd44 gene had no effect on liver size or primary tumor development in Nf2-mutant mice. Instead, CD44 was required for metastatic spreading of Nf2-deficient liver tumors. CD44 facilitates transendothelial migration of liver cancer cells by promoting expression of integrin subunit beta 2 (Itgb2). Moreover, our results indicate that ICAM-1 may substitute for CD44 function as a coreceptor of receptor tyrosine kinase MET, and thus may compensate for CD44 loss during other tumor-relevant processes in Nf2-deficient livers.
Nf2flox/flox;Alb-Cre mice showed progressive liver enlargement and developed HCCs, iCCAs, and tumors of mixed histology, often within the same liver (Figure 1). These results are consistent with previous reports demonstrating that deletion of the Nf2 gene in the liver [5,6]—or genetic inactivation of other members of the Hippo signaling pathway Mst1/2 [7,8,9], Lats1/2 [10,11], Mob1a/b [12], or Sav1 [9,13]—leads to liver overgrowth and promotes tumorigenesis. Nevertheless, the phenotype of our Nf2flox/flox;Alb-Cre mice was milder overall than previously reported [5,6]. In contrast to Benhamouche et al. [6], we did not observe any significant effects of Nf2-deletion on liver function or animal survival. The penetrance of Nf2-deficient liver phenotype could possibly be influenced by the genetic background of applied mice; C57BL/6 in our study, FVB/N in the study of Benhamouche et al. [6], and not specified in the study of Zhang et al. [5]. Association between genetic background and penetrance of a phenotype of genetically engineered mice is very well documented [56,57]. Other factors, including the strategy to impair Merlin function, were exactly the same in our study and in those of Benhamouche et al. [6] and Zhang et al. [5]; thus, the recombination efficiency of Nf2 flox alleles should also be comparable.

4.2. Origin of Active Cells during Ductular Reaction Observed in Nf2flox/flox;Alb-Cre Mice

The liver overgrowth observed in Nf2flox/flox;Alb-Cre mice was due to ductular proliferation of bile ducts in the portal tracts. We observed the appearance of small overproliferating cells that were positive for ductular/liver progenitor cell markers CK19 and SOX9 (Figure 4c,d and Figure S4c,d); however, the origin of these cells is unclear. The origin of active cells during ductular reaction could be cholangiocytes, hepatocytes, or hepatic progenitor cells [58]. The albumin promoter becomes active in embryonic hepatoblasts that give rise to both hepatocytes and cholangiocytes, and thus, recombination of floxed alleles in mice carrying the Alb-Cre transgene is expected to affect all major types of liver cells [6,46,47]. Previous studies reached contradictory conclusions about the origin of proliferating cells appearing in the livers of Nf2flox/flox;Alb-Cre mice. Based on the positive anti-pan-cytokeratin, A6, and anti-CD34 staining and morphological features characteristic for oval cells, Benhamouche et al. [6] concluded that overproliferating cells appearing in Nf2-deficient livers originated from putative liver progenitor cells. To support this hypothesis, they generated Nf2-deficient embryonic liver progenitor cells (hepatoblasts) and showed that, upon injection into the livers of immunocompromised mice, multiple foci of proliferating undifferentiated cells were generated. These cells progressed within 3–4 weeks to form larger neoplasia that exhibited both cholangiocytic and hepatocytic features [6]. In contrast, the injected control Nf2-positive hepatoblasts were scattered uniformly throughout the liver and did not form neoplasms [6]. Benhamouche et al. [6] concluded that disruption of the Nf2 gene is sufficient to affect a primary expansion of both embryonic and adult liver progenitor cells in vivo and to reproducibly yield both major forms of primary liver cancer. By employing a combination of lineage tracing and clonal analysis, Yimlamai et al. [59] reached a different conclusion. They discovered that deletion of Nf2 or overexpression of active YAP form (S127A), specifically in adult hepatocytes, using AAV-Cre, results in their dedifferentiation, driving liver overgrowth and appearance of ductal cells bearing characteristics of hepatic progenitors [59]. Overexpression of active YAP form in the biliary/progenitor compartment, on the other hand, led to hyperplasia, but did not result in an oval-cell-like appearance [59]. While Benhamouche et al. [6] interpreted their findings as liver progenitor-cell expansion and transformation driven by loss of Hippo signaling, those of Yimlamai et al. [59] suggest that hepatocytes might be the source of active cells during the ductular reaction found in Nf2flox/flox;Alb-Cre mice. Considering the findings of Yimlamai et al. [59] and the fact that hepatocytes continue to express Alb-Cre postnatally, it is plausible to assume that the overproliferating cells observed in Nf2-deficient livers originate from dedifferentiated hepatocytes [6,46,47]. Yet the question remains regarding how Nf2 deficiency induces dedifferentiation of some hepatocytes, leaving remaining hepatocytes unchanged. We observed that, despite Nf2 deficiency, the livers of Nf2flox/flox;Alb-Cre mice also contained differentiated hepatocytes that did not exhibit gross morphological alterations or aberrant Ki67 expression in vivo. A slight increase in apoptosis was observed in subcapsular areas, consistent with atrophy of liver parenchyma in these regions (Figure 3a,c). Moreover, Benhamouche et al. [6] observed that Nf2 deletion in adult mouse liver leads to very mild periporal hyperplasia, compared to dramatic and widespread ductular proliferation in Alb-Cre-mediated Nf2 deletion [6]. Therefore, deletion of Nf2 alone is not sufficient to reprogram liver cells. They showed that additional proliferative stimuli in the form of partial hepatectomy were required to induce emergence of overproliferating progenitor-like cells and tumor formation in mice with postnatal Nf2 deletion [6]. Importantly, liver regeneration occurred normally in the absence of Merlin, indicating that, even after receiving a proliferative stimulus and undergoing cell division, Nf2−/− hepatocytes can appropriately re-enter a quiescent state [6]. Thus, the exact interplay between signaling components that determine hepatocyte dedifferentiation and acquisition of mature phenotype remains to be determined.

4.3. CD44 Does Not Influence Primary Liver Tumor Development in Nf2flox/flox;Alb-Cre Mice

To mediate its major tumor suppressor functions, Merlin must be bound to the plasma membrane. This association occurs indirectly through interactions with plasma membrane proteins, including CD44, as the best characterized example [27,60]. Accordingly, numerous NF2 mutations in cancer patients are predicted to perturb the interaction of Merlin with CD44 [26] and anticipated to interfere with the tumor suppressor activity of Merlin [23]. We hypothesized that disruption of the Merlin-CD44 complex, through loss of Merlin, may unleash putative tumor- or metastasis-promoting functions of CD44. Accordingly, Cd44 expression was elevated in liver tumors of Nf2flox/flox;Alb-Cre mice when compared to control livers (Figure 6a), which is compatible with CD44 function in liver tumorigenesis. However, the status of Cd44 gene had no effect on primary liver tumor development in Nf2flox/flox;Alb-Cre mice (Figure 6c,d). Likewise, the ductular proliferation (Figure 2, Figure 3 and Figure 4) and liver size (Figure 1a) were unaffected by Cd44 loss. In contrast to our study, previous reports demonstrated that deletion of the Cd44 gene inhibits initiation of colon carcinoma in Apc(Min/+) mice [61] and oncogenic progression in the testis of RHAMM-deficient mice [62]. Thus, our results suggest that deletion of Nf2 may specifically release tumor-promoting mechanisms that are independent of CD44; or alternatively, CD44 function is compensated by other molecules in Cd44-deficient Nf2-mutant mice.
As reported elsewhere, these alternative signaling pathways which mediate the phenotype of Nf2flox/flox;Alb-Cre mice may include epidermal growth factor receptor (EGFR), RAC1 and YAP signaling. Benhamouche et al. [6] demonstrated that the phenotype of Nf2-mutant livers was effectively suppressed by treating the Nf2-deficient mice with erlotinib, an inhibitor of EGFR kinases [6], whereas Zhang et. al. [5] demonstrated that Nf2-mutant phenotype was suppressed by heterozygous inactivation of Yap. The suppression of Nf2-mutant phenotype by loss of Yap was specific, since Yap deficiency did not suppress liver overgrowth and tumorigenesis induced by the expression of an oncogenic KRAS mutant (G12D) [5]. Moreover, deletion of Rac1 was shown to block tumor initiation but paradoxically exacerbate hepatomegaly induced by Nf2 loss [63]. Liver-specific knockout of angiomotin (Amot), which functions upstream of both RAC1 and YAP [64], also effectively suppressed the Nf2- mutant phenotype [64]. Despite previous indications that CD44 promotes EGFR [65,66,67] and RAC1 [68,69] signaling and attenuates activation of the Hippo pathway [70,71,72,73,74] in vitro, Cd44 knockout had no effect on the phenotype of Nf2-mutant livers. As such, our results suggest that CD44 does not regulate the above-mentioned pathways in Nf2-deficient livers. Consistently, knockout of Cd44 did not prevent YAP activation in Nf2-deficient livers and cells (Figure 5 and Figure S8). Paradoxically, transcriptional activity of YAP was even higher in livers isolated from Cd44−/−;Nf2flox/flox;Alb-Cre compared to those isolated from Cd44+/+;Nf2flox/flox;Alb-Cre animals (Figure 5). However, this effect is difficult to interpret because of high variations in mRNA levels of YAP target genes between single Cd44−/− individuals (Figure 5c).

4.4. Compensatory Molecules May Substitute for CD44 Function during Primary Tumor Development in Cd44-Knockout Nf2flox/flox;Alb-Cre Mice

The unexpectedly mild effect of Cd44 deletion on the phenotype of Nf2-deficient livers led us to hypothesize that compensatory molecules may overtake CD44 function during liver tumor development in Cd44−/−;Nf2flox/flox;Alb-Cre mice. Existence of compensatory molecules was previously proposed to explain the striking discrepancy between in vitro studies, or interfering with CD44 function later during development, and the phenotype of Cd44−/− mice [48,49]. Cd44 knockout mice exhibit no overt phenotype during development and only have mild abnormalities in the adult [48,49]. In contrast, interfering with CD44 function later in development, using antisense oligonucleotides or specific CD44 antibodies, led to marked deficits in organ development, skin homeostasis, neuronal axon guidance, numerous immune functions, and haematopoiesis ([75,76]; as reviewed in [37]). These data strongly suggest that CD44 functions can be substituted during early embryogenesis (in knockout mice), whereas at later stages, this is not the case.
Interestingly, a previous study demonstrated that ICAM-1 can overtake the function of CD44 as a coreceptor of the receptor tyrosine kinase MET during liver regeneration in Cd44-null mice [55]. In a number of cellular systems [38,39], or in mice with haploinsufficiency of MET or HGF [77], coactivation of MET was shown to be strictly dependent on the expression of CD44, and specifically, on its isoforms which bear sequences encoded by variant exon v6. Indeed, all tested Cd44+/+ livers were positive for expression of CD44v6-bearing isoforms (Figure 6b), which is compatible with the role of CD44 as MET coreceptor. Interestingly, livers isolated from Cd44−/−;Nf2flox/flox;Alb-Cre mice showed elevated levels of mRNA encoding Icam1 (Figure 9a), suggesting potential compensatory effect. Most strikingly, siRNA-mediated downregulation of Cd44 inhibited MET activation in Cd44+/+ liver cells, whereas Icam1-specific knockdown interfered with MET-ERK signaling only in Cd44−/− liver cells (Figure 9c,d). Our results suggest that, in mice with early obliteration of CD44, receptor tyrosine kinase MET may recruit alternative coreceptor molecules, including ICAM-1 [55]. Not only is MET signaling relevant during liver regeneration; it also plays an important role in liver tumorigenesis [21,58]. Thus, due to expression of compensatory molecules, potential effects of CD44 on liver tumor development or growth may be overseen in Cd44-knockout mice. It is possible that interfering with CD44 function later in life will enable identification of additional tumor-relevant CD44 properties.

4.5. CD44 Facilitates Metastatic Dissemination of Nf2-Deficient Liver Tumors

Our results demonstrate that CD44 is essential for metastatic spreading of Nf2-deficient liver tumors (Figure 6e,f). Namely, formation of lung metastasis was observed in 44% of Cd44+/+;Nf2flox/flox;Alb-Cre animals, but in none of the analyzed Cd44-deficient Nf2-mutant mice (Figure 6e,f). Of note, one of the earliest reports on Cd44-knockout mice demonstrated deficits in migration/homing of myeloid-progenitor cells and lymphocytes [48,49]. Our previous data and other studies suggest that tumor and immune cells might use similar mechanisms to pass from the bloodstream into surrounding tissues and generate metastatic colonies [43,54,78,79]. It has been demonstrated that CD44 regulates expression and activation of integrins VLA-4 and LFA-1 on the surface of leukocytes and tumor cells [43,53,54,78,80,81]. Activated LFA-1 and VLA-4 integrins bind to their respective ligands, ICAM-1 and VCAM-1, on endothelial cells, enabling firm adhesion and passage of migratory cells through endothelium [53,81]. Interestingly, the genes encoding integrin LFA-1 (Itgal and Itgb2), as well as VCAM-1, were among the top-ranking genes differentially regulated between Cd44-positive and Cd44-negative livers of Nf2-heterozygous mice (Figure 8c). Real-time qRT-PCR results confirmed that expression of Itgb2 and Vcam1 is positively regulated by CD44 in Nf2-deficient livers (Figure 8d). Moreover, migration of liver cells through a monolayer of endothelial cells was effectively inhibited by Cd44-knockout, or by blocking antibodies specific for CD44 (Figure 8e–g). These outcomes suggest that CD44 has an important role in transendothelial migration of liver cells by regulating expression of integrins and their ligands.

5. Conclusions

Overall, our results suggest that CD44 facilitates metastatic dissemination of liver tumor cells by upregulating expression of integrin subunit beta 2 and VCAM-1, which are required for transendothelial migration of liver tumor cells. The pro-metastatic function documented in our study could apparently not be substituted by other molecules in Cd44-knockout mice. CD44 and integrins might represent a suitable target for interfering with metastatic spreading of liver cancer. Additional CD44 tumor-promoting functions might be revealed when interfering with CD44 function later in the development.

Supplementary Materials

The following supporting information can be downloaded at: https://www.mdpi.com/article/10.3390/cells12091257/s1.

Author Contributions

Conceptualization, M.H., P.H., J.U.M., P.R.G., H.M., H.L.M.-S., B.K.S., M.P.R. and N.H.; formal analysis, M.H., M.G. and D.B.; funding acquisition, M.H.; investigation, M.H., M.G.-R. and V.G.; methodology, M.H. and J.U.M.; supervision, M.H.; visualization, M.H. and M.G.-R.; writing—original draft preparation, M.H.; writing—review and editing, B.K.S., H.L.M.-S., N.H., H.M. and P.H. All authors have read and agreed to the published version of the manuscript.

Funding

This research was funded by Deutsche Krebshilfe, Grant/Award Number: 70113491 and Deutsche Forschungsgemeinschaft, Grant/Award Number: HA 7860/1-2.

Institutional Review Board Statement

The animal study protocol was approved by the local authorities (AZ: 23 177-07/G 16-1-028).

Informed Consent Statement

Not applicable.

Data Availability Statement

RNA-sequencing data have been deposited in the Gene Expression Omnibus (GEO) public repository under the accession GSE228630. The remaining data is contained within the article or Supplementary Materials.

Acknowledgments

We thank Bonny Adami and Silke Mitschke from the tissue biobank of the University Medical Center Mainz for processing of liver and lung tissue sections. We would also like to thank Carolin Brandscheid and Ivonne Görlich (CF NGS, FLI) for their excellent technical support.

Conflicts of Interest

B.K.S. received funds for an invited talk about pathology of hepatocellular carcinoma from Bayer Healthcare in 2022. All other authors declare no conflict of interest.

Abbreviations

AFPα-fetoprotein
AKTAK mouse plus transforming or thymoma
Albalbumin
Amotangiomotin
AraCcytosine b-D-arabinofuranoside
ARID1AAT-rich interactive domain-containing protein 1A
BCAbicinchoninic acid
BIRC5baculoviral IAP repeat containing 5
BMI1B lymphoma Mo-MLV insertion region 1 homolog
BSAbovine serum albumin
CD44cluster of differentiation 44
CK19cytokeratin 19
CPI-17C-kinase potentiated protein phosphatase-1 Inhibitor
Cre causes recombination
CRL4Cullin-RING ubiquitin ligase 4
CSCcancer stem cells
CTGFconnective tissue growth factor
CTLA-4 cytotoxic T-lymphocyte-associated protein 4
CYR61cysteine-rich angiogenic inducer 61
DAPI4’,6-diamidino-2-phenylindole
DCAF1 DDB1- and Cul4-associated factor 1
DMEMDulbecco’s Modified Eagle’s Medium
EGFRepidermal growth factor receptor
ELISAenzyme-linked immunosorbent assay
EMTepithelial-mesenchymal transition
ERKextracellular signal-regulated kinase
ERMEzrin-Radixin-Moesin
FAKfocal adhesion kinase
FAT1-4FAT atypical cadherin 1-4
FBSfetal bovine serum
FERM4.1 protein, ezrin, radixin, moesin
FGFRfibroblast growth factor receptor
H&Ehematoxylin and eosin
HAhyaluronic acid
HBVhepatitis B virus
HCChepatocellular carcinoma
HCVhepatitis C virus
HEPES2-(4-(2-hydroxyethyl)piperazin-1-yl)ethanesulfonic acid
HGFhepatocyte growth factor
HNF4αhepatocyte nuclear factor 4 alpha
HPRT1hypoxanthine phosphoribosyltransferase 1
HRPhorseradish peroxidase
ICAM-1intercellular adhesion molecule 1
iCCAintrahepatic cholangiocarcinoma
IDHisocitrate dehydrogenase
IL-6interleukin-6
JAG1Jagged 1
JAKjanus kinase
JNKc-JUN N-terminal kinase
KIBRAkidney and brain expressed protein
KRASKirsten rat sarcoma virus
LATS1/2
LFA-1
large tumor suppressor kinase 1 and 2
lymphocyte function-associated antigen 1
MAPKmitogen-activated protein kinase
MEKmitogen-activated protein kinase kinase
Merlin Moesin-Ezrin-Radixin-like protein
METmesenchymal epithelial transition factor receptor
MOB1A/1BMps one binder homolog A and B
MST1/2mammalian STE20-like protein kinase 1 and 2
mTORmammalian target of rapamycin
MYPT1myosin phosphatase targeting subunit 1
NF2neurofibromatosis type 2
NIHNational Institutes of Health
PAKp21-activated kinase
PBSphosphate-buffered saline
PCRpolymerase chain reaction
PD-1programmed cell death protein 1
PD-L1programmed death ligand 1
PFAparaformaldehyde
PI3Kphosphoinositide 3-kinase
PKAprotein kinase A
PP1δProtein Phosphatase 1 δ
PTPN3tyrosine-protein phosphatase non-receptor type 3
RACRas-related C3 botulinum toxin substrate
RAFrapidly accelerated fibrosarcoma
RASrat sarcoma
RASSFRAS association domain family
qRT-PCRquantitative reverse transcription PCR
RTroom temperature
RTKreceptor tyrosine kinase
RUNXRunt-related transcription factor
SAV1Salvador homolog 1
SMADmothers against ecapentaplegic homolog 2
SOX9SRY-box transcription factor 9
STATsignal transducer and activator of transcription
TACEtransarterial chemoembolization
TAZtranscriptional co-activator with PDZ-binding motif
TBPTATA box binding protein
TEADTEA domain
TERTtelomerase reverse transcriptase
TGFβtransforming growth factor β
TNFαtumor necrosis factor-α
TNMtumor, node, metastasis
TP53tumor protein 53
TUNELterminal deoxynucleotidyl transferase (TdT) dUTP nick-end labeling
VCAM–1vascular cell adhesion molecule–1
VEGFvascular endothelial growth factor
WNTwingless-related integration site
YAPYes-associated protein

References

  1. Sung, H.; Ferlay, J.; Siegel, R.L.; Laversanne, M.; Soerjomataram, I.; Jemal, A.; Bray, F. Global Cancer Statistics 2020: GLOBOCAN Estimates of Incidence and Mortality Worldwide for 36 Cancers in 185 Countries. CA A Cancer J. Clin. 2021, 71, 209–249. [Google Scholar] [CrossRef]
  2. Wang, G.; Wang, Q.; Liang, N.; Xue, H.; Yang, T.; Chen, X.; Qiu, Z.; Zeng, C.; Sun, T.; Yuan, W.; et al. Oncogenic driver genes and tumor microenvironment determine the type of liver cancer. Cell Death Dis. 2020, 11, 313. [Google Scholar] [CrossRef]
  3. Sidali, S.; Trepo, E.; Sutter, O.; Nault, J.C. New concepts in the treatment of hepatocellular carcinoma. United Eur. Gastroenterol. J. 2022, 10, 765–774. [Google Scholar] [CrossRef]
  4. Gelband, H.; Chen, C.J.; Chen, W.; Franceschi, S.; Hall, S.A.; London, W.T.; McGlynn, K.A.; Wild, C.P. Liver Cancer. In Cancer: Disease Control Priorities, 3rd ed.; Gelband, H., Jha, P., Sankaranarayanan, R., Horton, S., Eds.; The International Bank for Reconstruction and Development/The World Bank: Washington, DC, USA, 2015; Volume 3. [Google Scholar]
  5. Zhang, N.; Bai, H.; David, K.K.; Dong, J.; Zheng, Y.; Cai, J.; Giovannini, M.; Liu, P.; Anders, R.A.; Pan, D. The Merlin/NF2 tumor suppressor functions through the YAP oncoprotein to regulate tissue homeostasis in mammals. Dev. Cell 2010, 19, 27–38. [Google Scholar] [CrossRef] [PubMed]
  6. Benhamouche, S.; Curto, M.; Saotome, I.; Gladden, A.B.; Liu, C.H.; Giovannini, M.; McClatchey, A.I. Nf2/Merlin controls progenitor homeostasis and tumorigenesis in the liver. Genes Dev. 2010, 24, 1718–1730. [Google Scholar] [CrossRef] [PubMed]
  7. Zhou, D.; Zhang, Y.; Wu, H.; Barry, E.; Yin, Y.; Lawrence, E.; Dawson, D.; Willis, J.E.; Markowitz, S.D.; Camargo, F.D.; et al. Mst1 and Mst2 protein kinases restrain intestinal stem cell proliferation and colonic tumorigenesis by inhibition of Yes-associated protein (Yap) overabundance. Proc. Natl. Acad. Sci. USA 2011, 108, E1312–E1320. [Google Scholar] [CrossRef] [PubMed]
  8. Song, H.; Mak, K.K.; Topol, L.; Yun, K.; Hu, J.; Garrett, L.; Chen, Y.; Park, O.; Chang, J.; Simpson, R.M.; et al. Mammalian Mst1 and Mst2 kinases play essential roles in organ size control and tumor suppression. Proc. Natl. Acad. Sci. USA 2010, 107, 1431–1436. [Google Scholar] [CrossRef] [PubMed]
  9. Lu, L.; Li, Y.; Kim, S.M.; Bossuyt, W.; Liu, P.; Qiu, Q.; Wang, Y.; Halder, G.; Finegold, M.J.; Lee, J.S.; et al. Hippo signaling is a potent in vivo growth and tumor suppressor pathway in the mammalian liver. Proc. Natl. Acad. Sci. USA 2010, 107, 1437–1442. [Google Scholar] [CrossRef]
  10. Chen, Q.; Zhang, N.; Xie, R.; Wang, W.; Cai, J.; Choi, K.S.; David, K.K.; Huang, B.; Yabuta, N.; Nojima, H.; et al. Homeostatic control of Hippo signaling activity revealed by an endogenous activating mutation in YAP. Genes Dev. 2015, 29, 1285–1297. [Google Scholar] [CrossRef]
  11. Yi, J.; Lu, L.; Yanger, K.; Wang, W.; Sohn, B.H.; Stanger, B.Z.; Zhang, M.; Martin, J.F.; Ajani, J.A.; Chen, J.; et al. Large tumor suppressor homologs 1 and 2 regulate mouse liver progenitor cell proliferation and maturation through antagonism of the coactivators YAP and TAZ. Hepatology 2016, 64, 1757–1772. [Google Scholar] [CrossRef]
  12. Nishio, M.; Sugimachi, K.; Goto, H.; Wang, J.; Morikawa, T.; Miyachi, Y.; Takano, Y.; Hikasa, H.; Itoh, T.; Suzuki, S.O.; et al. Dysregulated YAP1/TAZ and TGF-β signaling mediate hepatocarcinogenesis in Mob1a/1b-deficient mice. Proc. Natl. Acad. Sci. USA 2016, 113, E71–E80. [Google Scholar] [CrossRef] [PubMed]
  13. Lee, K.P.; Lee, J.H.; Kim, T.S.; Kim, T.H.; Park, H.D.; Byun, J.S.; Kim, M.C.; Jeong, W.I.; Calvisi, D.F.; Kim, J.M.; et al. The Hippo-Salvador pathway restrains hepatic oval cell proliferation, liver size, and liver tumorigenesis. Proc. Natl. Acad. Sci. USA 2010, 107, 8248–8253. [Google Scholar] [CrossRef] [PubMed]
  14. Zender, L.; Spector, M.S.; Xue, W.; Flemming, P.; Cordon-Cardo, C.; Silke, J.; Fan, S.T.; Luk, J.M.; Wigler, M.; Hannon, G.J.; et al. Identification and validation of oncogenes in liver cancer using an integrative oncogenomic approach. Cell 2006, 125, 1253–1267. [Google Scholar] [CrossRef]
  15. Dong, J.; Feldmann, G.; Huang, J.; Wu, S.; Zhang, N.; Comerford, S.A.; Gayyed, M.F.; Anders, R.A.; Maitra, A.; Pan, D. Elucidation of a universal size-control mechanism in Drosophila and mammals. Cell 2007, 130, 1120–1133. [Google Scholar] [CrossRef] [PubMed]
  16. Camargo, F.D.; Gokhale, S.; Johnnidis, J.B.; Fu, D.; Bell, G.W.; Jaenisch, R.; Brummelkamp, T.R. YAP1 increases organ size and expands undifferentiated progenitor cells. Curr. Biol. CB 2007, 17, 2054–2060. [Google Scholar] [CrossRef] [PubMed]
  17. Mranda, G.M.; Xiang, Z.P.; Liu, J.J.; Wei, T.; Ding, Y. Advances in prognostic and therapeutic targets for hepatocellular carcinoma and intrahepatic cholangiocarcinoma: The hippo signaling pathway. Front. Oncol. 2022, 12, 937957. [Google Scholar] [CrossRef]
  18. Zhao, B.; Wei, X.; Li, W.; Udan, R.S.; Yang, Q.; Kim, J.; Xie, J.; Ikenoue, T.; Yu, J.; Li, L.; et al. Inactivation of YAP oncoprotein by the Hippo pathway is involved in cell contact inhibition and tissue growth control. Genes Dev. 2007, 21, 2747–2761. [Google Scholar] [CrossRef]
  19. Xu, M.Z.; Yao, T.J.; Lee, N.P.; Ng, I.O.; Chan, Y.T.; Zender, L.; Lowe, S.W.; Poon, R.T.; Luk, J.M. Yes-associated protein is an independent prognostic marker in hepatocellular carcinoma. Cancer 2009, 115, 4576–4585. [Google Scholar] [CrossRef] [PubMed]
  20. Petrilli, A.M.; Fernandez-Valle, C. Role of Merlin/NF2 inactivation in tumor biology. Oncogene 2016, 35, 537–548. [Google Scholar] [CrossRef]
  21. You, H.; Ding, W.; Dang, H.; Jiang, Y.; Rountree, C.B. c-Met represents a potential therapeutic target for personalized treatment in hepatocellular carcinoma. Hepatology 2011, 54, 879–889. [Google Scholar] [CrossRef] [PubMed]
  22. Luo, Z.L.; Cheng, S.Q.; Shi, J.; Zhang, H.L.; Zhang, C.Z.; Chen, H.Y.; Qiu, B.J.; Tang, L.; Hu, C.L.; Wang, H.Y.; et al. A splicing variant of Merlin promotes metastasis in hepatocellular carcinoma. Nat. Commun. 2015, 6, 8457. [Google Scholar] [CrossRef]
  23. Curto, M.; McClatchey, A.I. Nf2/Merlin: A coordinator of receptor signalling and intercellular contact. Br. J. Cancer 2008, 98, 256–262. [Google Scholar] [CrossRef]
  24. Sato, T.; Sekido, Y. NF2/Merlin Inactivation and Potential Therapeutic Targets in Mesothelioma. Int. J. Mol. Sci. 2018, 19, 988. [Google Scholar] [CrossRef]
  25. Cooper, J.; Giancotti, F.G. Molecular insights into NF2/Merlin tumor suppressor function. FEBS Lett. 2014, 588, 2743–2752. [Google Scholar] [CrossRef] [PubMed]
  26. Ahronowitz, I.; Xin, W.; Kiely, R.; Sims, K.; MacCollin, M.; Nunes, F.P. Mutational spectrum of the NF2 gene: A meta-analysis of 12 years of research and diagnostic laboratory findings. Hum. Mutat. 2007, 28, 1–12. [Google Scholar] [CrossRef]
  27. Morrison, H.; Sherman, L.S.; Legg, J.; Banine, F.; Isacke, C.; Haipek, C.A.; Gutmann, D.H.; Ponta, H.; Herrlich, P. The NF2 tumor suppressor gene product, merlin, mediates contact inhibition of growth through interactions with CD44. Genes Dev. 2001, 15, 968–980. [Google Scholar] [CrossRef]
  28. Bai, Y.; Liu, Y.J.; Wang, H.; Xu, Y.; Stamenkovic, I.; Yu, Q. Inhibition of the hyaluronan-CD44 interaction by merlin contributes to the tumor-suppressor activity of merlin. Oncogene 2007, 26, 836–850. [Google Scholar] [CrossRef] [PubMed]
  29. Hartmann, M.; Parra, L.M.; Ruschel, A.; Bohme, S.; Li, Y.; Morrison, H.; Herrlich, A.; Herrlich, P. Tumor Suppressor NF2 Blocks Cellular Migration by Inhibiting Ectodomain Cleavage of CD44. Mol. Cancer Res. MCR 2015, 13, 879–890. [Google Scholar] [CrossRef] [PubMed]
  30. Orian-Rousseau, V. CD44 Acts as a Signaling Platform Controlling Tumor Progression and Metastasis. Front. Immunol. 2015, 6, 154. [Google Scholar] [CrossRef]
  31. Senbanjo, L.T.; Chellaiah, M.A. CD44: A Multifunctional Cell Surface Adhesion Receptor Is a Regulator of Progression and Metastasis of Cancer Cells. Front. Cell Dev. Biol. 2017, 5, 18. [Google Scholar] [CrossRef]
  32. Luo, Y.; Tan, Y. Prognostic value of CD44 expression in patients with hepatocellular carcinoma: Meta-analysis. Cancer Cell Int. 2016, 16, 47. [Google Scholar] [CrossRef]
  33. Morine, Y.; Imura, S.; Ikemoto, T.; Iwahashi, S.; Saito, Y.U.; Shimada, M. CD44 Expression Is a Prognostic Factor in Patients with Intrahepatic Cholangiocarcinoma After Surgical Resection. Anticancer Res. 2017, 37, 5701–5705. [Google Scholar] [CrossRef]
  34. Kunlabut, K.; Vaeteewoottacharn, K.; Wongkham, C.; Khuntikeo, N.; Waraasawapati, S.; Pairojkul, C.; Wongkham, S. Aberrant expression of CD44 in bile duct cancer correlates with poor prognosis. Asian Pac. J. Cancer Prev. 2012, 13, 95–99. [Google Scholar]
  35. Kim, R.; Kim, S.B.; Cho, E.H.; Park, S.H.; Park, S.B.; Hong, S.K.; Chae, G. CD44 expression in patients with combined hepatocellular cholangiocarcinoma. Ann. Surg. Treat. Res. 2015, 89, 9–16. [Google Scholar] [CrossRef] [PubMed]
  36. Gu, M.J.; Jang, B.I. Clinicopathologic significance of Sox2, CD44 and CD44v6 expression in intrahepatic cholangiocarcinoma. Pathol. Oncol. Res. 2014, 20, 655–660. [Google Scholar] [CrossRef]
  37. Ponta, H.; Sherman, L.; Herrlich, P.A. CD44: From adhesion molecules to signalling regulators. Nat. Rev. Mol. Cell Biol. 2003, 4, 33–45. [Google Scholar] [CrossRef]
  38. Orian-Rousseau, V.; Chen, L.; Sleeman, J.P.; Herrlich, P.; Ponta, H. CD44 is required for two consecutive steps in HGF/c-Met signaling. Genes Dev. 2002, 16, 3074–3086. [Google Scholar] [CrossRef]
  39. Matzke, A.; Herrlich, P.; Ponta, H.; Orian-Rousseau, V. A five-amino-acid peptide blocks Met- and Ron-dependent cell migration. Cancer Res. 2005, 65, 6105–6110. [Google Scholar] [CrossRef]
  40. Lammich, S.; Okochi, M.; Takeda, M.; Kaether, C.; Capell, A.; Zimmer, A.K.; Edbauer, D.; Walter, J.; Steiner, H.; Haass, C. Presenilin-dependent intramembrane proteolysis of CD44 leads to the liberation of its intracellular domain and the secretion of an Aβ-like peptide. J. Biol. Chem. 2002, 277, 44754–44759. [Google Scholar] [CrossRef] [PubMed]
  41. Giovannini, M.; Robanus-Maandag, E.; van der Valk, M.; Niwa-Kawakita, M.; Abramowski, V.; Goutebroze, L.; Woodruff, J.M.; Berns, A.; Thomas, G. Conditional biallelic Nf2 mutation in the mouse promotes manifestations of human neurofibromatosis type 2. Genes Dev. 2000, 14, 1617–1630. [Google Scholar] [CrossRef] [PubMed]
  42. Dhar, D.; Antonucci, L.; Nakagawa, H.; Kim, J.Y.; Glitzner, E.; Caruso, S.; Shalapour, S.; Yang, L.; Valasek, M.A.; Lee, S.; et al. Liver Cancer Initiation Requires p53 Inhibition by CD44-Enhanced Growth Factor Signaling. Cancer Cell 2018, 33, 1061–1077.e6. [Google Scholar] [CrossRef] [PubMed]
  43. Ma, J.; Klemm, J.; Gerardo-Ramirez, M.; Frappart, L.; Castven, D.; Becker, D.; Zoch, A.; Parent, R.; Bartosch, B.; Minnich, K.; et al. Cluster of differentiation 44 promotes osteosarcoma progression in mice lacking the tumor suppressor Merlin. Int. J. Cancer 2020, 147, 2564–2577. [Google Scholar] [CrossRef] [PubMed]
  44. Bentley, D.R.; Balasubramanian, S.; Swerdlow, H.P.; Smith, G.P.; Milton, J.; Brown, C.G.; Hall, K.P.; Evers, D.J.; Barnes, C.L.; Bignell, H.R.; et al. Accurate whole human genome sequencing using reversible terminator chemistry. Nature 2008, 456, 53–59. [Google Scholar] [CrossRef] [PubMed]
  45. Pfaffl, M.W.; Horgan, G.W.; Dempfle, L. Relative expression software tool (REST) for group-wise comparison and statistical analysis of relative expression results in real-time PCR. Nucleic Acids Res. 2002, 30, e36. [Google Scholar] [CrossRef]
  46. Kellendonk, C.; Opherk, C.; Anlag, K.; Schutz, G.; Tronche, F. Hepatocyte-specific expression of Cre recombinase. Genesis 2000, 26, 151–153. [Google Scholar] [CrossRef]
  47. Postic, C.; Magnuson, M.A. DNA excision in liver by an albumin-Cre transgene occurs progressively with age. Genesis 2000, 26, 149–150. [Google Scholar] [CrossRef]
  48. Schmits, R.; Filmus, J.; Gerwin, N.; Senaldi, G.; Kiefer, F.; Kundig, T.; Wakeham, A.; Shahinian, A.; Catzavelos, C.; Rak, J.; et al. CD44 regulates hematopoietic progenitor distribution, granuloma formation, and tumorigenicity. Blood 1997, 90, 2217–2233. [Google Scholar] [CrossRef]
  49. Protin, U.; Schweighoffer, T.; Jochum, W.; Hilberg, F. CD44-deficient mice develop normally with changes in subpopulations and recirculation of lymphocyte subsets. J. Immunol. 1999, 163, 4917–4923. [Google Scholar] [CrossRef]
  50. Nguyen, Q.; Anders, R.A.; Alpini, G.; Bai, H. Yes-associated protein in the liver: Regulation of hepatic development, repair, cell fate determination and tumorigenesis. Dig Liver Dis. 2015, 47, 826–835. [Google Scholar] [CrossRef]
  51. Franken, N.A. Clonogenic assay of cells in vitro. Nat. Protoc. 2006, 1, 2315–2319. [Google Scholar] [CrossRef]
  52. Kim, Y.N.; Koo, K.H.; Sung, J.Y.; Yun, U.J.; Kim, H. Anoikis resistance: An essential prerequisite for tumor metastasis. Int. J. Cell Biol. 2012, 2012, 306879. [Google Scholar] [CrossRef] [PubMed]
  53. Siegelman, M.H.; Stanescu, D.; Estess, P. The CD44-initiated pathway of T-cell extravasation uses VLA-4 but not LFA-1 for firm adhesion. J. Clin. Investig. 2000, 105, 683–691. [Google Scholar] [CrossRef] [PubMed]
  54. Wang, H.S.; Hung, Y.; Su, C.H.; Peng, S.T.; Guo, Y.J.; Lai, M.C.; Liu, C.Y.; Hsu, J.W. CD44 cross-linking induces integrin-mediated adhesion and transendothelial migration in breast cancer cell line by up-regulation of LFA-1 (αLβ2) and VLA-4 (α4β1). Exp. Cell Res. 2005, 304, 116–126. [Google Scholar] [CrossRef] [PubMed]
  55. Olaku, V.; Matzke, A.; Mitchell, C.; Hasenauer, S.; Sakkaravarthi, A.; Pace, G.; Ponta, H.; Orian-Rousseau, V. c-Met recruits ICAM-1 as a coreceptor to compensate for the loss of CD44 in Cd44 null mice. Mol. Biol. Cell 2011, 22, 2777–2786. [Google Scholar] [CrossRef] [PubMed]
  56. Doetschman, T. Influence of genetic background on genetically engineered mouse phenotypes. Methods Mol. Biol. 2009, 530, 423–433. [Google Scholar] [CrossRef]
  57. Sanford, L.P.; Kallapur, S.; Ormsby, I.; Doetschman, T. Influence of genetic background on knockout mouse phenotypes. Methods Mol. Biol. 2001, 158, 217–225. [Google Scholar] [CrossRef] [PubMed]
  58. Wang, H.; Rao, B.; Lou, J.; Li, J.; Liu, Z.; Li, A.; Cui, G.; Ren, Z.; Yu, Z. The Function of the HGF/c-Met Axis in Hepatocellular Carcinoma. Front. Cell Dev. Biol. 2020, 8, 55. [Google Scholar] [CrossRef] [PubMed]
  59. Yimlamai, D.; Christodoulou, C.; Galli, G.G.; Yanger, K.; Pepe-Mooney, B.; Gurung, B.; Shrestha, K.; Cahan, P.; Stanger, B.Z.; Camargo, F.D. Hippo pathway activity influences liver cell fate. Cell 2014, 157, 1324–1338. [Google Scholar] [CrossRef] [PubMed]
  60. Stamenkovic, I.; Yu, Q. Merlin, a “magic” linker between extracellular cues and intracellular signaling pathways that regulate cell motility, proliferation, and survival. Curr. Protein Pept. Sci. 2010, 11, 471–484. [Google Scholar] [CrossRef]
  61. Zeilstra, J.; Joosten, S.P.; Dokter, M.; Verwiel, E.; Spaargaren, M.; Pals, S.T. Deletion of the WNT target and cancer stem cell marker CD44 in Apc(Min/+) mice attenuates intestinal tumorigenesis. Cancer Res. 2008, 68, 3655–3661. [Google Scholar] [CrossRef]
  62. Li, H.; Shukla, S.; Frappart, L.; Herrlich, P.; Ploubidou, A. cd44 deletion suppresses atypia in the precancerous mouse testis. Mol. Carcinog. 2019, 58, 621–626. [Google Scholar] [CrossRef] [PubMed]
  63. Shi, Y.; Bollam, S.R.; White, S.M.; Laughlin, S.Z.; Graham, G.T.; Wadhwa, M.; Chen, H.; Nguyen, C.; Vitte, J.; Giovannini, M.; et al. Rac1-Mediated DNA Damage and Inflammation Promote Nf2 Tumorigenesis but Also Limit Cell-Cycle Progression. Dev. Cell 2016, 39, 452–465. [Google Scholar] [CrossRef] [PubMed]
  64. Yi, C.; Shen, Z.; Stemmer-Rachamimov, A.; Dawany, N.; Troutman, S.; Showe, L.C.; Liu, Q.; Shimono, A.; Sudol, M.; Holmgren, L.; et al. The p130 isoform of angiomotin is required for Yap-mediated hepatic epithelial cell proliferation and tumorigenesis. Sci. Signal. 2013, 6, ra77. [Google Scholar] [CrossRef]
  65. Perez, A.; Neskey, D.M.; Wen, J.; Pereira, L.; Reategui, E.P.; Goodwin, W.J.; Carraway, K.L.; Franzmann, E.J. CD44 interacts with EGFR and promotes head and neck squamous cell carcinoma initiation and progression. Oral Oncol. 2013, 49, 306–313. [Google Scholar] [CrossRef] [PubMed]
  66. Yin, J.; Zhang, H.; Wu, X.; Zhang, Y.; Li, J.; Shen, J.; Zhao, Y.; Xiao, Z.; Lu, L.; Huang, C.; et al. CD44 inhibition attenuates EGFR signaling and enhances cisplatin sensitivity in human EGFR wild-type non-small-cell lung cancer cells. Int. J. Mol. Med. 2020, 45, 1783–1792. [Google Scholar] [CrossRef] [PubMed]
  67. Morath, I.; Jung, C.; Leveque, R.; Linfeng, C.; Toillon, R.A.; Warth, A.; Orian-Rousseau, V. Differential recruitment of CD44 isoforms by ErbB ligands reveals an involvement of CD44 in breast cancer. Oncogene 2018, 37, 1472–1484. [Google Scholar] [CrossRef]
  68. Oliferenko, S.; Kaverina, I.; Small, J.V.; Huber, L.A. Hyaluronic acid (HA) binding to CD44 activates Rac1 and induces lamellipodia outgrowth. J. Cell Biol. 2000, 148, 1159–1164. [Google Scholar] [CrossRef]
  69. Murai, T.; Miyazaki, Y.; Nishinakamura, H.; Sugahara, K.N.; Miyauchi, T.; Sako, Y.; Yanagida, T.; Miyasaka, M. Engagement of CD44 promotes Rac activation and CD44 cleavage during tumor cell migration. J. Biol. Chem. 2004, 279, 4541–4550. [Google Scholar] [CrossRef] [PubMed]
  70. Xu, Y.; Stamenkovic, I.; Yu, Q. CD44 attenuates activation of the hippo signaling pathway and is a prime therapeutic target for glioblastoma. Cancer Res. 2010, 70, 2455–2464. [Google Scholar] [CrossRef]
  71. Yu, S.; Cai, X.; Wu, C.; Wu, L.; Wang, Y.; Liu, Y.; Yu, Z.; Qin, S.; Ma, F.; Thiery, J.P.; et al. Adhesion glycoprotein CD44 functions as an upstream regulator of a network connecting ERK, AKT and Hippo-YAP pathways in cancer progression. Oncotarget 2015, 6, 2951–2965. [Google Scholar] [CrossRef] [PubMed]
  72. Zhang, J.; He, X.; Wan, Y.; Zhang, H.; Tang, T.; Zhang, M.; Yu, S.; Zhao, W.; Chen, L. CD44 promotes hepatocellular carcinoma progression via upregulation of YAP. Exp. Hematol. Oncol. 2021, 10, 54. [Google Scholar] [CrossRef]
  73. Fan, Z.; Xia, H.; Xu, H.; Ma, J.; Zhou, S.; Hou, W.; Tang, Q.; Gong, Q.; Nie, Y.; Bi, F. Standard CD44 modulates YAP1 through a positive feedback loop in hepatocellular carcinoma. Biomed. Pharmacother. 2018, 103, 147–156. [Google Scholar] [CrossRef] [PubMed]
  74. Ooki, T.; Murata-Kamiya, N.; Takahashi-Kanemitsu, A.; Wu, W.; Hatakeyama, M. High-Molecular-Weight Hyaluronan Is a Hippo Pathway Ligand Directing Cell Density-Dependent Growth Inhibition via PAR1b. Dev. Cell 2019, 49, 590–604.e9. [Google Scholar] [CrossRef] [PubMed]
  75. Sherman, L.; Wainwright, D.; Ponta, H.; Herrlich, P. A splice variant of CD44 expressed in the apical ectodermal ridge presents fibroblast growth factors to limb mesenchyme and is required for limb outgrowth. Genes Dev. 1998, 12, 1058–1071. [Google Scholar] [CrossRef] [PubMed]
  76. Kaya, G.; Rodriguez, I.; Jorcano, J.L.; Vassalli, P.; Stamenkovic, I. Selective suppression of CD44 in keratinocytes of mice bearing an antisense CD44 transgene driven by a tissue-specific promoter disrupts hyaluronate metabolism in the skin and impairs keratinocyte proliferation. Genes Dev. 1997, 11, 996–1007. [Google Scholar] [CrossRef]
  77. Matzke, A.; Sargsyan, V.; Holtmann, B.; Aramuni, G.; Asan, E.; Sendtner, M.; Pace, G.; Howells, N.; Zhang, W.; Ponta, H.; et al. Haploinsufficiency of c-Met in cd44−/− mice identifies a collaboration of CD44 and c-Met in vivo. Mol. Cell. Biol. 2007, 27, 8797–8806. [Google Scholar] [CrossRef]
  78. Fujisaki, T.; Tanaka, Y.; Fujii, K.; Mine, S.; Saito, K.; Yamada, S.; Yamashita, U.; Irimura, T.; Eto, S. CD44 stimulation induces integrin-mediated adhesion of colon cancer cell lines to endothelial cells by up-regulation of integrins and c-Met and activation of integrins. Cancer Res. 1999, 59, 4427–4434. [Google Scholar]
  79. Zen, K.; Liu, D.Q.; Guo, Y.L.; Wang, C.; Shan, J.; Fang, M.; Zhang, C.Y.; Liu, Y. CD44v4 is a major E-selectin ligand that mediates breast cancer cell transendothelial migration. PLoS ONE 2008, 3, e1826. [Google Scholar] [CrossRef]
  80. Gong, Y.; Zhang, Y.; Feng, S.; Liu, X.; Lu, S.; Long, M. Dynamic contributions of P- and E-selectins to β2-integrin-induced neutrophil transmigration. FASEB J. 2017, 31, 212–223. [Google Scholar] [CrossRef]
  81. Videira, P.A.; Silva, M.; Martin, K.C.; Sackstein, R. Ligation of the CD44 Glycoform HCELL on Culture-Expanded Human Monocyte-Derived Dendritic Cells Programs Transendothelial Migration. J. Immunol. 2018, 201, 1030–1043. [Google Scholar] [CrossRef]
Figure 1. Influence of Cd44 deletion on progressive liver enlargement in Nf2flox/flox;Alb-Cre mice. (a) Distribution of liver weight/body weight (Lw/Bw) ratios in Cd44+/+;Nf2flox/flox;Alb-Cre (turquoise), Cd44−/−;Nf2flox/flox;Alb-Cre (yellow) versus control Alb-Cre (green) mice between 6 and 48 weeks old. The bar chart shows mean percent ratio of liver weight/body weight (Lw/Bw) ±SD. The number of mice analyzed at different ages is as indicated in Table 4. “wk-old” stands for week-old. (b) Example pictures of livers isolated from Cd44+/+;Nf2flox/flox;Alb-Cre, Cd44−/−; Nf2flox/flox;Alb-Cre, Cd44flox/flox;Nf2flox/flox;Alb-Cre and control (Alb-Cre) mice at 6- and 48-weeks-old. Scale bar: 1 cm. (c) Serum level of bilirubin in 32-week-old mice. Bilirubin level was measured by immunoassay in serum of eight control, nine Cd44+/+;Nf2flox/flox;Alb-Cre and eight Cd44−/−;Nf2flox/flox;Alb-Cre mice. The bar chart shows mean level of bilirubin (µg/mL) ±SD. (d) Serum level of ALT in 32-week-old mice. ALT level was measured by immunoassay in serum of four control, six Cd44+/+;Nf2flox/flox;Alb-Cre and six Cd44−/−;Nf2flox/flox;Alb-Cre mice. The bar chart shows mean level of ALT (ng/mL) ± SD. Student’s t-test two-tailed values: n.s.: p > 0.05, **: p ≤ 0.01, ***: p ≤ 0.001, ****: p ≤ 0.0001.
Cells 12 01257 g001
Figure 2. H&E-stains of livers of 6-, 20- and 48-week-old mice. Representative photographs were taken on NanoZoomer 2 OHT (Hamamatsu Photonics GmbH, Herrsching am Ammersee, Germany). Overview photographs depicting general liver morphology (scale bar: 5 mm) are shown on the left. Framed pictures on the right side represent higher magnifications (scale bar: 250 µm). Portal tracts (arrowheads), central veins (CV), and dysplastic nodules (N) are denoted. Asterisks indicate areas with subcapsular fibrosis and ductular reaction with atrophy of liver parenchyma.
Cells 12 01257 g002aCells 12 01257 g002b
Figure 3. In situ detection of apoptosis and proliferation in livers from 6-week-old Nf2-mutant mice. (a,c) Apoptosis was detected in livers isolated from 6-week-old Alb-Cre, Cd44+/+;Nf2flox/flox;Alb-Cre and Cd44−/−;Nf2flox/flox;Alb-Cre mice using TUNEL assay. Alb-Cre livers treated with DNase I served as a positive control. Fluorescent photographs were generated with an ApoTome Axiovert 200 microscope (Carl Zeiss Meditec AG, Jena, Germany) with 40× magnification. The number of TUNEL-positive cells (Alexa Fluor 594—red) was calculated in six magnification fields (40×) for four independent Cd44+/+;Nf2flox/flox;Alb-Cre (turquoise) and three independent Cd44−/−;Nf2flox/flox;Alb-Cre (yellow) livers. The bar chart in (a) shows mean number of TUNEL-positive cells ±SD per one magnification filed (40×). Representative pictures taken for central and subcapsular areas of the livers are shown in (c). All three analyzed Alb-Cre control livers were negative for TUNEL staining. (b,d) Ki67 was detected as a marker of proliferation in livers isolated from 6-week-old Alb-Cre, Cd44+/+;Nf2flox/flox;Alb-Cre and Cd44−/−;Nf2flox/flox;Alb-Cre mice by immunohistochemistry. For negative control, primary antibodies were omitted. Photographs were taken using a Leica DFC290 microscope with 20× magnification. The number of Ki67-positive nuclei was calculated in four magnification fields (20×) for four independent Cd44+/+;Nf2flox/flox;Alb-Cre (turquoise) and three independent Cd44−/−;Nf2flox/flox;Alb-Cre (yellow) livers using ImageJ software. Ki67 staining was nearly undetectable in the three analyzed control livers (Alb-Cre). The bar chart in (b) shows mean number of Ki67-positive cells ±SD per one magnification filed (20×). Representative pictures taken for central and subcapsular areas of livers are shown in (d). Scale bar: 100 µm. Student’s t-test two-tailed values: n.s.: p > 0.05, *: p ≤ 0.05.
Cells 12 01257 g003
Figure 4. Immunohistochemical staining of livers from 32-week-old Nf2-mutant mice. (a) Ki67 staining revealed the presence of ductular reactions in portal tracts of Nf2flox/flox;Alb-Cre livers. Ki67 staining was almost undetectable in control livers (Alb-Cre). (b) Immunohistochemical detection of HNF4α as a marker of hepatocytes. (c,d) Immunohistochemical analysis using an anti-CK19 and anti-SOX9 antibody revealed prominent and progressive staining in the tumor-like ductular proliferations of livers isolated from Cd44+/+;Nf2flox/flox;Alb-Crem and Cd44−/−;Nf2flox/flox;Alb-Cre mice. In contrast, only a subset of portal bile duct cells expressed CK19 and SOX9 antigens in the control Alb-Cre livers. (e) Immunohistochemical analysis demonstrated prominent CD44 staining in bile ducts and ductular proliferations of livers isolated from Cd44+/+;Nf2flox/flox;Alb-Cre mice. CD44 staining was undetectable in Cd44−/−;Nf2flox/flox;Alb-Cre mice. Central veins (CV), portal tracts (arrowheads) and hepatocytes (arrows) are denoted. Photographs were taken using a Leica DFC290 microscope (Leica Microsystems CMS GmbH, Mannheim, Germany). Scale bar: 200 µm.
Cells 12 01257 g004
Figure 5. Effect of Nf2 knockout on YAP signaling in the liver. (a) Immunohistochemical localization of YAP in livers from 6-week-old Nf2-mutant mice. Prominent YAP staining is detected in ductular reactions in portal tracts of Nf2flox/flox;Alb-Cre livers. In contrast, hepatocytes are largely negative for YAP staining. Central veins (CV) and portal tracts (arrowheads) are denoted. Photographs were taken using a Leica DFC290 microscope. Scale bar: 200 µm. (b) Hippo tumor suppressor signaling pathway. Modified from Sato and Sekido, 2018 [24]; Cooper and Giancotti, 2014 [25]; Ma et. al. 2020 [43]. CD44 provides a link between Merlin and the plasma membrane. Merlin directly binds and recruits the LATS1/2 kinase to the plasma membrane, prompting its phosphorylation by the MST1/2 kinase bound to adapter protein SAV1 [50]. In turn, LATS1/2, in a complex with small regulator protein MOB1A/1B, phosphorylates and inactivates YAP/TAZ, blocking their role as TEAD/MEAD transcription factor co-activators [50]. (c) Expression of YAP target genes Ccn1 and Ccn2 was measured in livers isolated from 48-week-old animals by real-time qRT-PCR. The bar charts show mean mRNA level ±SD in four independent Cd44+/+;Nf2flox/flox;Alb-Cre (turquoise) and Cd44−/−;Nf2flox/flox;Alb-Cre (yellow) liver tumors, relative to the level in control livers (Alb-Cre, green). Student’s t-test two-tailed values: n.s.: p > 0.05, *: p ≤ 0.05, **: p ≤ 0.01, ***: p ≤ 0.001.
Cells 12 01257 g005
Figure 6. Influence of Cd44 expression on primary liver tumor development and metastasis formation. (a) Total Cd44 mRNA expression was measured in livers isolated from 48-week-old animals by real-time qRT-PCR using primers to detect all potential Cd44 isoforms. The bar chart shows mean Cd44 mRNA level ±SD in four independent Cd44+/+;Nf2flox/flox;Alb-Cre (turquoise) and Cd44−/−;Nf2flox/flox;Alb-Cre (yellow) liver tumors relative to the level in normal livers from four independent Alb-Cre (green) mice. Student’s t-test two-tailed values: *: p ≤ 0.05, **: p ≤ 0.01. (b) Expression of Cd44 variant exons v3, v6, and v7 was detected by real-time qRT-PCR. Four liver tumor samples (T) isolated from independent Cd44+/+;Nf2flox/flox;Alb-Cre mice and four normal livers (N) isolated from Alb-Cre control mice were analyzed. Sequences encoded by variant exon v3 were present in all four tumor samples and absent in normal livers. Sequences encoded by exon v6 were present in all four tumor samples and in one out of four normal livers. Sequences encoded by exon v7 were present ©n three out of four tumor samples and in one out of four normal livers. Chi-Square test of independence p values for tumor versus normal tissue are indicated. (c) Quantification of primary liver tumors in 48-week-old Nf2flox/flox;Alb-Cre mice. The bar chart shows mean number of tumors per 100 mm2 of liver specimen ±SD. Nine Cd44+/+;Nf2flox/flox;Alb-Cre (turquoise), nine Cd44−/−;Nf2flox/flox;Alb-Cre (yellow) and five Cd44flox/flox;Nf2flox/flox;Alb-Cre (yellow dashed) mice were analyzed. Student’s t-test two-tailed value: n.s.: p > 0.05. (d) Serum level of AFP in 48-week-old mice. AFP level was measured by immunoassay in serum of four Alb-Cre control, seven Cd44+/+;Nf2flox/flox;Alb-Cre, nine Cd44−/−;Nf2flox/flox;Alb-Cre, and five Cd44flox/flox;Nf2flox/flox;Alb-Cre mice. The bar chart shows mean level of AFP (ng/mL) ±SD. Student’s t-test two-tailed values: n.s.: p > 0.05, ****: p ≤ 0.0001. (e) Quantification of lung metastases in 48-week-old Nf2flox/flox;Alb-Cre mice. The bar chart shows percentage of mice with (dark grey) or without (light grey) lung metastases. Nine Cd44+/+;Nf2flox/flox;Alb-Cre, nine Cd44−/−;Nf2flox/flox;Alb-Cre, and five Cd44flox/flox;Nf2flox/flox;Alb-Cre mice were analyzed. The significance was determined by a Chi-Square test of independence. **: p ≤ 0.01 (f) Hematoxylin and eosin (H&E) -stained paraffin lung section with visible mixed HCC-iCCA lung metastasis (MET). The photograph was taken on NanoZoomer 2 OHT. Scale bar 250 µm.
Cells 12 01257 g006
Figure 7. Testing colony-forming ability and migration into cell-free gap of Nf2-negative liver cells. (a) Detection of Merlin and CD44 in liver cell lines by immunoblot. Cd44-positive and Cd44-negative liver cell lines were generated from Cd44+/+;Nf2flox/flox;Alb-Cre, and Cd44−/−;Nf2flox/flox;Alb-Cre mice. Three independent Cd44+/+ and two-three independent Cd44−/− cell lines were tested. NIH3T3 cells were applied as a positive control for detection of Merlin. The cells were seeded at 50% confluency in DMEM medium supplemented with 10% FBS and left overnight to attach, then subjected to immunoblot. Merlin was detected using anti-Merlin antibody, clone EPR2573(2). CD44 was detected using anti-CD44 antibody, clone E7K2Y. GAPDH was detected to control equal loading of samples. (b,c) Testing colony-forming ability of Nf2-deficient liver cells. Four independent Cd44-positive and Cd44-negative liver cell lines were seeded in triplicates in 6-well plates at a density of 100 (upper wells) or 1000 (lower wells) cells per well. The bar chart in (b) shows mean colony number ±SD formed after 7 days. The initial number of cells seeded (100 or 1000) is indicated on x-axis. Student’s t-test two-tailed values: n.s.: p > 0.05. (c) Representative pictures of colonies. (d,e) Testing anchorage-independent growth of liver cells. The bar chart in (d) represents mean value of colony surface area ±SD measured for four independent Cd44-positive and Cd44-negative liver cell lines. At least three technical replicates were completed for each cell line. (e) Representative pictures of colonies formed either upon serum starvation (noFBS) or in medium supplemented with 10% FBS. The photographs were taken using a Leica DFC290 microscope. Scale bar: 200 µm. Student’s t-test two-tailed value: n.s.: p > 0.05. (f,g) Testing migration of liver cells. Migration into cell-free gap was measured using conventional scratch assay. (f) The bar chart shows mean values of % cell-free gap ±SD measured after 72 h of migration for four independent Cd44-positive and three independent Cd44-negative liver cell lines. At least three technical replicates were completed for each cell line. (g) Representative pictures of gaps taken directly after introducing a gap (time 0h) and after 72 h of migration. Photographs were taken using a Leica DFC290 microscope. Scale bar: 500 µm.
Cells 12 01257 g007
Figure 8. Influence of CD44 on integrin expression and transendothelial migration. (a,b) RNA-sequencing analysis. RNA-sequencing was performed on Cd44-positive and Cd44-negative livers isolated from Nf2-mutant mice described previously [43]. (a) Principal component analysis (PCA) of RNA sequencing data. Data were plotted along the first and fourth principal components. Each dot in PCA plot indicates a single sample. (b) Multivariate analysis of gene expression between Cd44-positive and Cd44-negative livers. Unsupervised hierarchical clustering and heatmap showing Cd44+/+ and Cd44−/− livers clearly segregated from one another based on their RNA expression profiles. Three samples of each group were analyzed. Both downregulated (blue) and upregulated (red) RNAs were identified in Cd44−/− livers. The analysis was performed using an MADE4 package of R software. (c) List of genes implicated in transendothelial migration that are differentially regulated between Cd44-positive and Cd44-negative livers. The data are represented as Wald-statistic (stat). Genes with negative Wald-statistic values are downregulated in Cd44−/− compared to Cd44+/+ livers, and genes with positive values are upregulated. Benjamin Hochberg adjusted p-value (padj) is indicated. Gene description source: HGNC (www.genenames.org/; accessed on 21 February 2023). (d) Relative ItgaL, Itgb2, Vcam1, Itga4 and Itgb1 mRNA levels in Cd44-positive and Cd44-negative livers isolated from 48-week-old Nf2flox/flox;Alb-Cre mice. The bar chart shows mean mRNA level ±SD from three independent Cd44+/+;Nf2flox/flox;Alb-Cre (turquoise) and Cd44−/−; Nf2flox/flox;Alb-Cre (yellow) livers. Y-axis shows mean mRNA level relative to Alb-Cre control livers (three independent samples). X-axis indicates analyzed genes. (eg) Testing transendothelial migration of N2-deficient liver cells. Liver cells were allowed to migrate through confluent monolayer of endothelial cells for 22 h. Where indicated, liver cells were preincubated with CD44 blocking antibody (Ab), or isotype-matched control antibody at room temperature for 15 min prior to migration and migration performed in the presence of indicated antibodies (e) Bar chart shows mean value of relative transmigration ±SD, measured in triplicates for four independent Cd44-positive and Cd44-negative liver cell lines. (f) Bar chart shows mean value of relative transmigration ±SD, measured in triplicates and in three independent experiments. (g) Representative pictures of transmigrating liver cells stained blue. Photographs were taken using a Leica DFC290 microscope. Scale bar: 100 µm. Student’s t-test two-tailed values: n.s.: p > 0.05, *: p ≤ 0.05, ***: p ≤ 0.001.
Cells 12 01257 g008
Figure 9. Testing the effect of Icam1 knockdown on MET-ERK signaling in Cd44-negative liver cells. (a) Icam1 mRNA levels in livers isolated from 48-week-old mice. The bar chart shows mean Icam1 mRNA level ±SD from three independent Cd44+/+;Nf2flox/flox;Alb-Cre (turquoise) and Cd44−/−;Nf2flox/flox;Alb-Cre (yellow) livers relative to three independent Alb-Cre control (green) livers. (b) Cd44v6-bearing isoforms act as coreceptor for receptor tyrosine kinase MET, based on Orian-Rousseau et al., 2002 [38] and Morrison et al., 2001 [27]. CD44 participates in presenting HGF to receptor tyrosine kinase MET and is required for its activation. In addition, signal transduction from activated MET to MEK and ERK requires binding of CD44 to ERM proteins. In growth-inhibitory conditions, Merlin replaces ERM proteins bound to CD44, disrupts the link to the actin cytoskeleton, and blocks RAS signaling. (c,d) Influence of Cd44 and Icam1 downregulation on MET-ERK signaling in Cd44-positive and Cd44-negative liver cell lines. Cd44-positive and Cd44-negative liver cell lines were generated from Cd44+/+;Nf2flox/flox;Alb-Cre and Cd44−/−;Nf2flox/flox;Alb-Cre mice. Cells were seeded at 20–30% confluency in DMEM medium supplemented with 10% FBS. siRNA transfections were performed as described in the Materials and Methods section. Next, 48 h after transfection, the cells were serum starved for 16 h, then incubated with 20 ng/mL HGF (R&D Systems, Inc., Minneapolis, Minnesota, USA) in DMEM without serum and at 37 °C for 5 min. Immunoblots in (c,d) show detection of total and phosphorylated ERK1/2 and MET proteins. The efficiency of Cd44 knockdown was controlled by immunoblotting using antibody, clone E7K2Y. The average efficiency of Cd44 knockdown measured in Cd44-positive cells was 97.3% (SD: ± 0.9). Because the ICAM-1 antibody did not work for Western Blot, the efficiency of Icam1 knockdown was calculated by real-time qRT-PCR. The average efficiency of Icam1 knockdown was 81.22% (SD: ± 12.08) in Cd44+/+ cell lines and 79.23% (SD: ± 11.21) in Cd44−/− cell lines. GAPDH was detected to control equal loading of samples. The bar charts in (c,d) show relative pERK/ERK levels normalized to GAPDH ±SD from four (c), or three (d), independent Cd44+/+ and three independent Cd44−/− cell lines. Student’s t-test two-tailed values: n.s.: p > 0.05, *: p ≤ 0.05, **: p ≤ 0.01, ***: p ≤ 0.001.
Cells 12 01257 g009
Table 1. List of primary antibodies applied in the study.
Name:Cat. No.:Company:Application:
B (Blocking)
IF
(Immunofluorescence)
IHC (Immunohistochemistry)
WB (Western Blotting)
CD44, clone E7K2Y37259Cell Signaling Technology, Leiden, The NetherlandsIHC 1:100
WB 1:1000
CD44, clone IM7553131BD Biosciences, Heidelberg, GermanyB 1:50
CD44, clone KM201MABT78Merck KGaA, Darmstadt, GermanyIF 1:50
CK19, clone B-1sc-374192Santa Cruz Biotechnology, Inc, Heidelberg, GermanyIF 1:100
IHC 1:200
WB 1:500
GAPDH, clone G-9365062Santa Cruz Biotechnology, Inc, Heidelberg, GermanyWB 1:1000
HNF4α, clone K9218MA1-199Thermo Fisher Scientific GmbH, Darmstadt, GermanyIF 1:200
IHC 1:200
WB 1:1000
Ki67, clone D3B512202Cell Signaling Technology, Leiden, The NetherlandsIHC 1:200
LATS1, clone C66B53477Cell Signaling Technology, Leiden, The NetherlandsWB 1:1000
Phospho-LATS1(Thr1079), clone D57D38654Cell Signaling Technology, Leiden, The NetherlandsWB 1:1000
MET, clone B2sc-8057Santa Cruz Biotechnology, Inc, Heidelberg, GermanyWB 1:500
Phospho-MET3126Cell Signaling Technology, Leiden, The NetherlandsWB 1:1000
NF2 / Merlin, clone EPR2573(2)ab109244Abcam, Berlin, GermanyWB 1:1000
p44/42 MAPK (ERK1/2), clone L34F124696Cell Signaling Technology, Leiden, The NetherlandsWB 1:1000
Phospho-p44/42 MAPK (ERK1/2) (Thr202/Tyr204)9101Cell Signaling Technology, Leiden, The NetherlandsWB 1:1000
SOX9 polyclonalAB5535Merck KgaA, Darmstadt, GermanyIF 1:500
IHC 1:200
WB 1:2000
YAP polyclonal4912Cell Signaling Technology, Leiden, The NetherlandsIF 1:100
IHC 1:200
WB 1:1000
Phospho-YAP (Ser127) polyclonal4911Cell Signaling Technology, Leiden, The NetherlandsWB 1:1000
Table 2. List of secondary antibodies applied in the study.
Name:Cat. No.:Company:Application:
IF (Immunofluorescence)
IHC (Immunohistochemistry)
WB
(Western Blotting)
Goat anti-Mouse IgG (H+L) Secondary Antibody, HRP31430Thermo Fisher Scientific GmbH, Darmstadt, GermanyWB 1:1000
Goat anti-Rabbit IgG F(ab’)2 Secondary Antibody, HRP31461Thermo Fisher Scientific GmbH, Darmstadt, GermanyWB 1:1000
Goat anti-mouse (H+L) Secondary Antibody, Alexa Fluor 488A-11001Thermo Fisher Scientific GmbH, Darmstadt, GermanyIF 1:1000
Goat anti-Rabbit IgG (H+L) Secondary Antibody, Alexa Fluor 488A-11034Thermo Fisher Scientific GmbH, Darmstadt, GermanyIF: 1:500
Goat anti-Rat IgG (H+L) Secondary Antibody, Alexa Fluor 555A-21434Thermo Fisher Scientific GmbH, Darmstadt, GermanyIF: 1:500
Table 3. Oligonucleotides used for real-time qRT-PCR.
NamePrimer Sequence 5′-…….-3′
Actin Fwd4TGC CCT GAG GCT CTT TTC CA
Actin Rev4TTG GCA TAG AGG TCT TTA CGG AT
Actin Fwd5TGT TAC CAA CTG GGA CGA CA
Actin Rev5ACC AGA GGC ATA CAG GGA CA
Cd44 stable Ex5 Fwd1AGC ACC CCA GAA AGC TAC ATT
Cd44all Fwd1TCT GCC AGG CTT TCA ACA GT
Cd44all Rev1CTG CAC AGA TAG CGT TGG GA
Cd44v3 Rev1TGA TCC AGA AAA ACT GGG GTA
Cd44v6 Rev1GTT CTG AAA CCA CGT CTC CTG
Cd44v7 Rev1TGA TCC AGA AAA ACT GGG GTA
Ccn1 Fwd1AGA GGC TTC CTG TCT TTG GC
Ccn1 Rev1CCA AGA CGT GGT CTG AAC GA
Ccn2 Fwd3GTG CCA GAA CGC ACA CTG
Ccn2 Rev3CCC CGG TTA CAC TCC AAA
Hes1 Fwd1CCA GCC AGT GTC AAC ACG A
Hes1 Rev1AAT GCC GGG AGC TAT CTT TCT
Hprt Fwd5CCA TCA CAT TGT GGC CCT CT
Hprt Rev5AAT GTA ATC CAG CAG GTC AGC A
Icam1Fwd2TCC GTG GGG AGG AGA TAC TG
Icam1Rev2GGC ATG AGA AAT TGG CTC CG
Itgal Fwd1CCA CTT CCA CTT CCC GAT CT
Itgal Rev1AGG TCT CAG GAT AGG CTG CAT
Itga4 Fwd2TGT AGG ACA CAC CAG GCA TTC
Itga4 Rev2TGA TGC CCA AGG TGG TAT GTG
Itgb1 Fwd1TCG ATC CTG TGA CCC ATT GC
Itgb1 Rev1AGT CTC CAC AAC ATG CAC GA
Itgb2 Fwd1GCA GAA GGA CGG AAG GAA CA
Itgb2 Rev1CCA GAT GAC CAG GAG GAG GA
Sox9 Fwd1CAA GAC TCT GGG CAA GCT CTG
Sox9 Rev1TCC GCT TGT CCG TTC TTC AC
Tbp Fwd1GGC CTC TCA GAA GCA TCA CTA
Tbp Rev1GCC AAG CCC TGA GCA TAA
Vcam1 Fwd1AAG GGA CGA TTC CGG CAT TT
Vcam1 Rev1TCG GGC ACA TTT CCA CAA GT
Table 4. Number of analyzed mice. “wk-old” stands for week-old.
GenotypeAgeNumber of Mice
Control: Alb-Cre2-wk-old0
6-wk-old4
20-wk-old11
32-wk-old8
48-wk-old5
Cd44+/+;Nf2flox/flox;Alb-Cre2-wk-old5
6-wk-old5
20-wk-old12
32-wk-old17
48-wk-old9
Cd44−/−;Nf2flox/flox;Alb-Cre2-wk-old3
6-wk-old6
20-wk-old12
32-wk-old10
48-wk-old9
Cd44flox/flox;Nf2flox/flox;Alb-Cre2-wk-old0
6-wk-old0
20-wk-old0
32-wk-old1
48-wk-old5
Disclaimer/Publisher’s Note: The statements, opinions and data contained in all publications are solely those of the individual author(s) and contributor(s) and not of MDPI and/or the editor(s). MDPI and/or the editor(s) disclaim responsibility for any injury to people or property resulting from any ideas, methods, instructions or products referred to in the content.

