
Poly(ADP-Ribose) Polymerase-1 Lacking Enzymatic Activity Is Not Compatible with Mouse Development
 , , , , and
Abstract
:
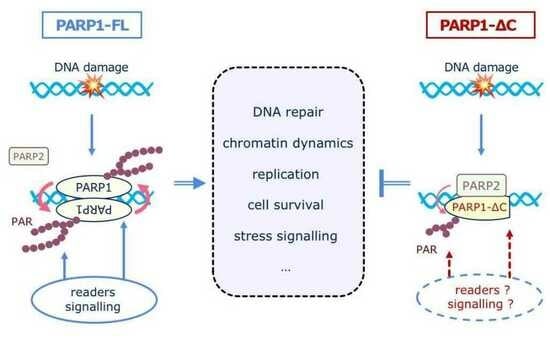
1. Introduction
2. Materials and Methods
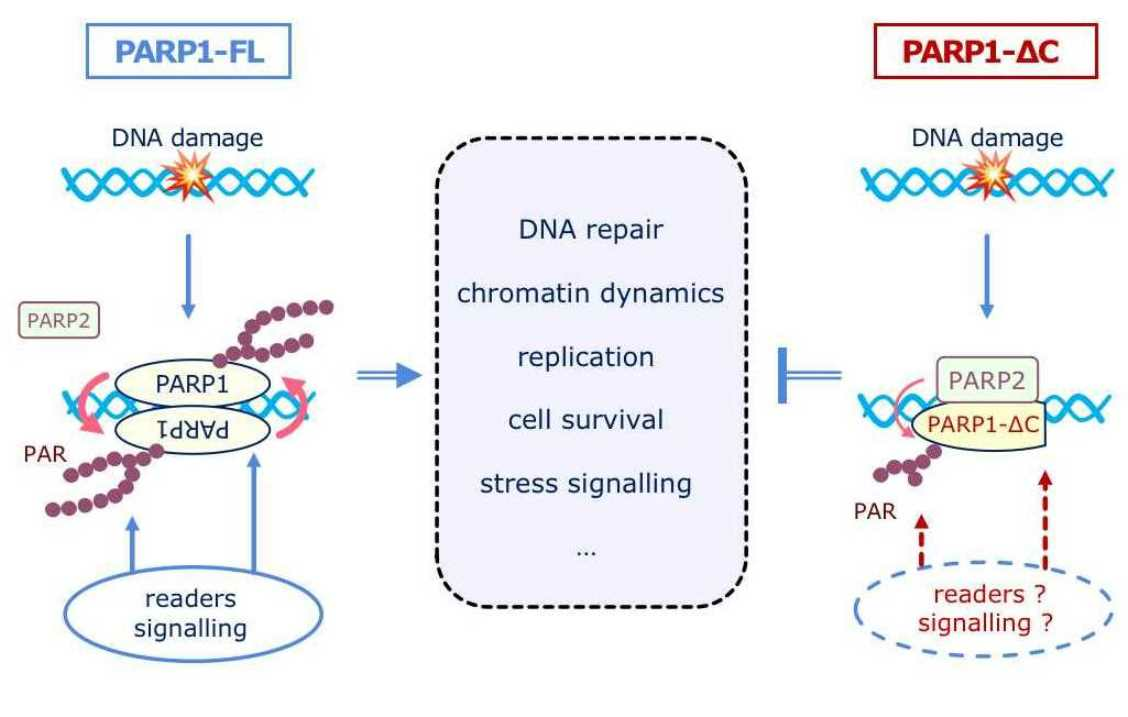
2.1. Generation of PARP1+/ΔC Mice
2.2. Mice
2.3. Tamoxifen Administration and Genotoxic Treatment of Mice
2.4. Genomic DNA Isolation and Genotyping
- PARP1-ΔC (Str1): 1-PARP1-dCt-Wt-Fw: GAA TAC CAG GAA CCA AGT CAG G, dCt-F3: TCT GGT GTC AAC GAT GCT, PARP1-E988K-R1: CTC AGG ACT AGT CTA GGC AA;
- PARP1-KnockOut (PARP1-KO) (Str2): KO-ZQWstr-Fw-1: AGG TCT ACG GGA CAC TTT AGG, OVL-RI: CCT TCC CAG AAG CAG GAG AAG, NEO RII: GCT TCA GTG ACA ACG TCG AG;
- PARP1-FLOX (Str3): PARP1-flox-Fw: GCT TCT ACT ACC TCC CAA GAA AGA GCG, PARP1-flox-Rv: GGC TTT AGT GTG GCA ACT TAT CCC, PARP1-del-Rv: CCT CTG CTG CGT GAC TAA GGC;
- PARG-KO (Str4): TK2800: TCC TTT TAT GTA GCT GCC TG, TK3033: GGT TAA CGT GAG GTT TAA AT, R327: CAC AAG TTC CAC GGA GAC CC;
- Cre (Str5): Cre 1: CGG TCG ATG CAA CGA GTG ATG), Cre 2: CCA GAG ACG GAA ATC CAT CGC, B2-1: CAC CGC AGA ATG GGA AGC CGA A, B2-2: TCC ACA CAG ATG GAG CGT CCA G.
2.5. Plasmid Cloning and Vector Construction
2.6. Cell Transfection
2.7. RT-qPCR
2.8. Isolation of ES Cells and Primary MEF Cells
2.9. Cell Culture
2.10. Proliferation Assay
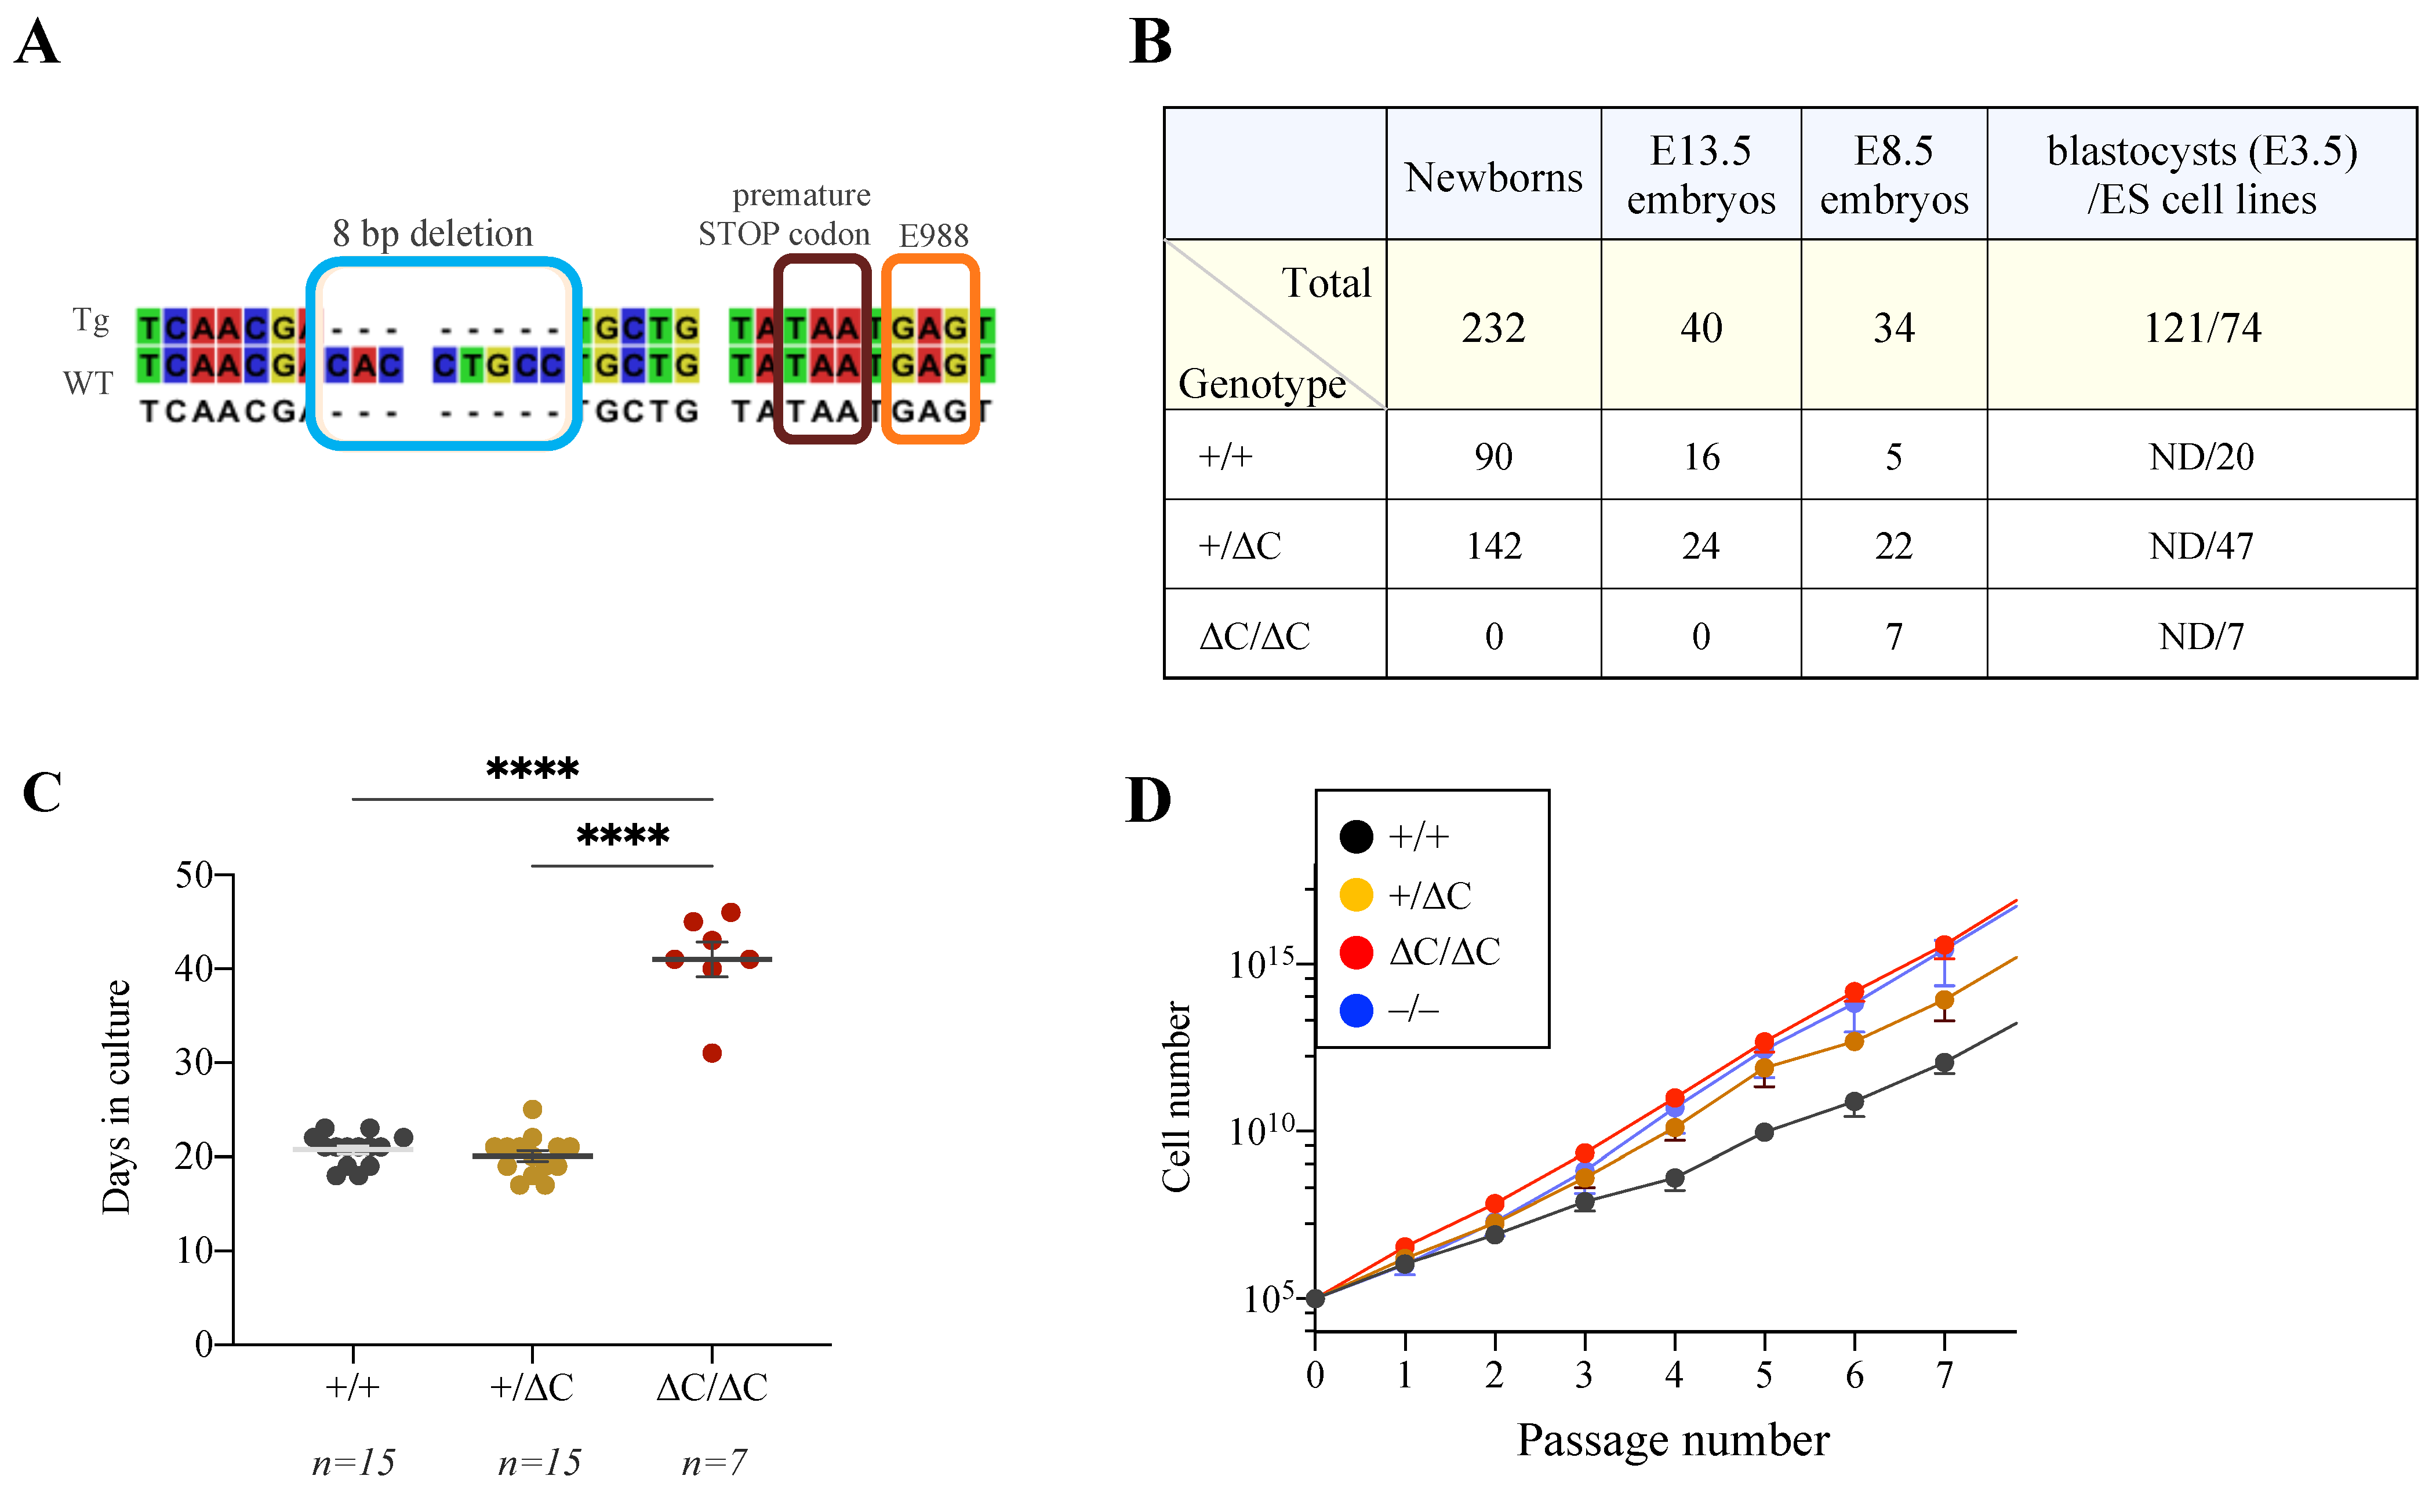
2.11. Embryoid Body (EB) Formation Assay
2.12. Immunofluorescence
2.13. Genotoxic Treatment of ES Cells or MEFs
2.14. Colony Formation Assay
2.15. Fractionation for DNA-Trapping Analysis
2.16. Western Blotting
2.17. Determination of NAD+ Levels
2.18. Statistical Analysis
3. Results
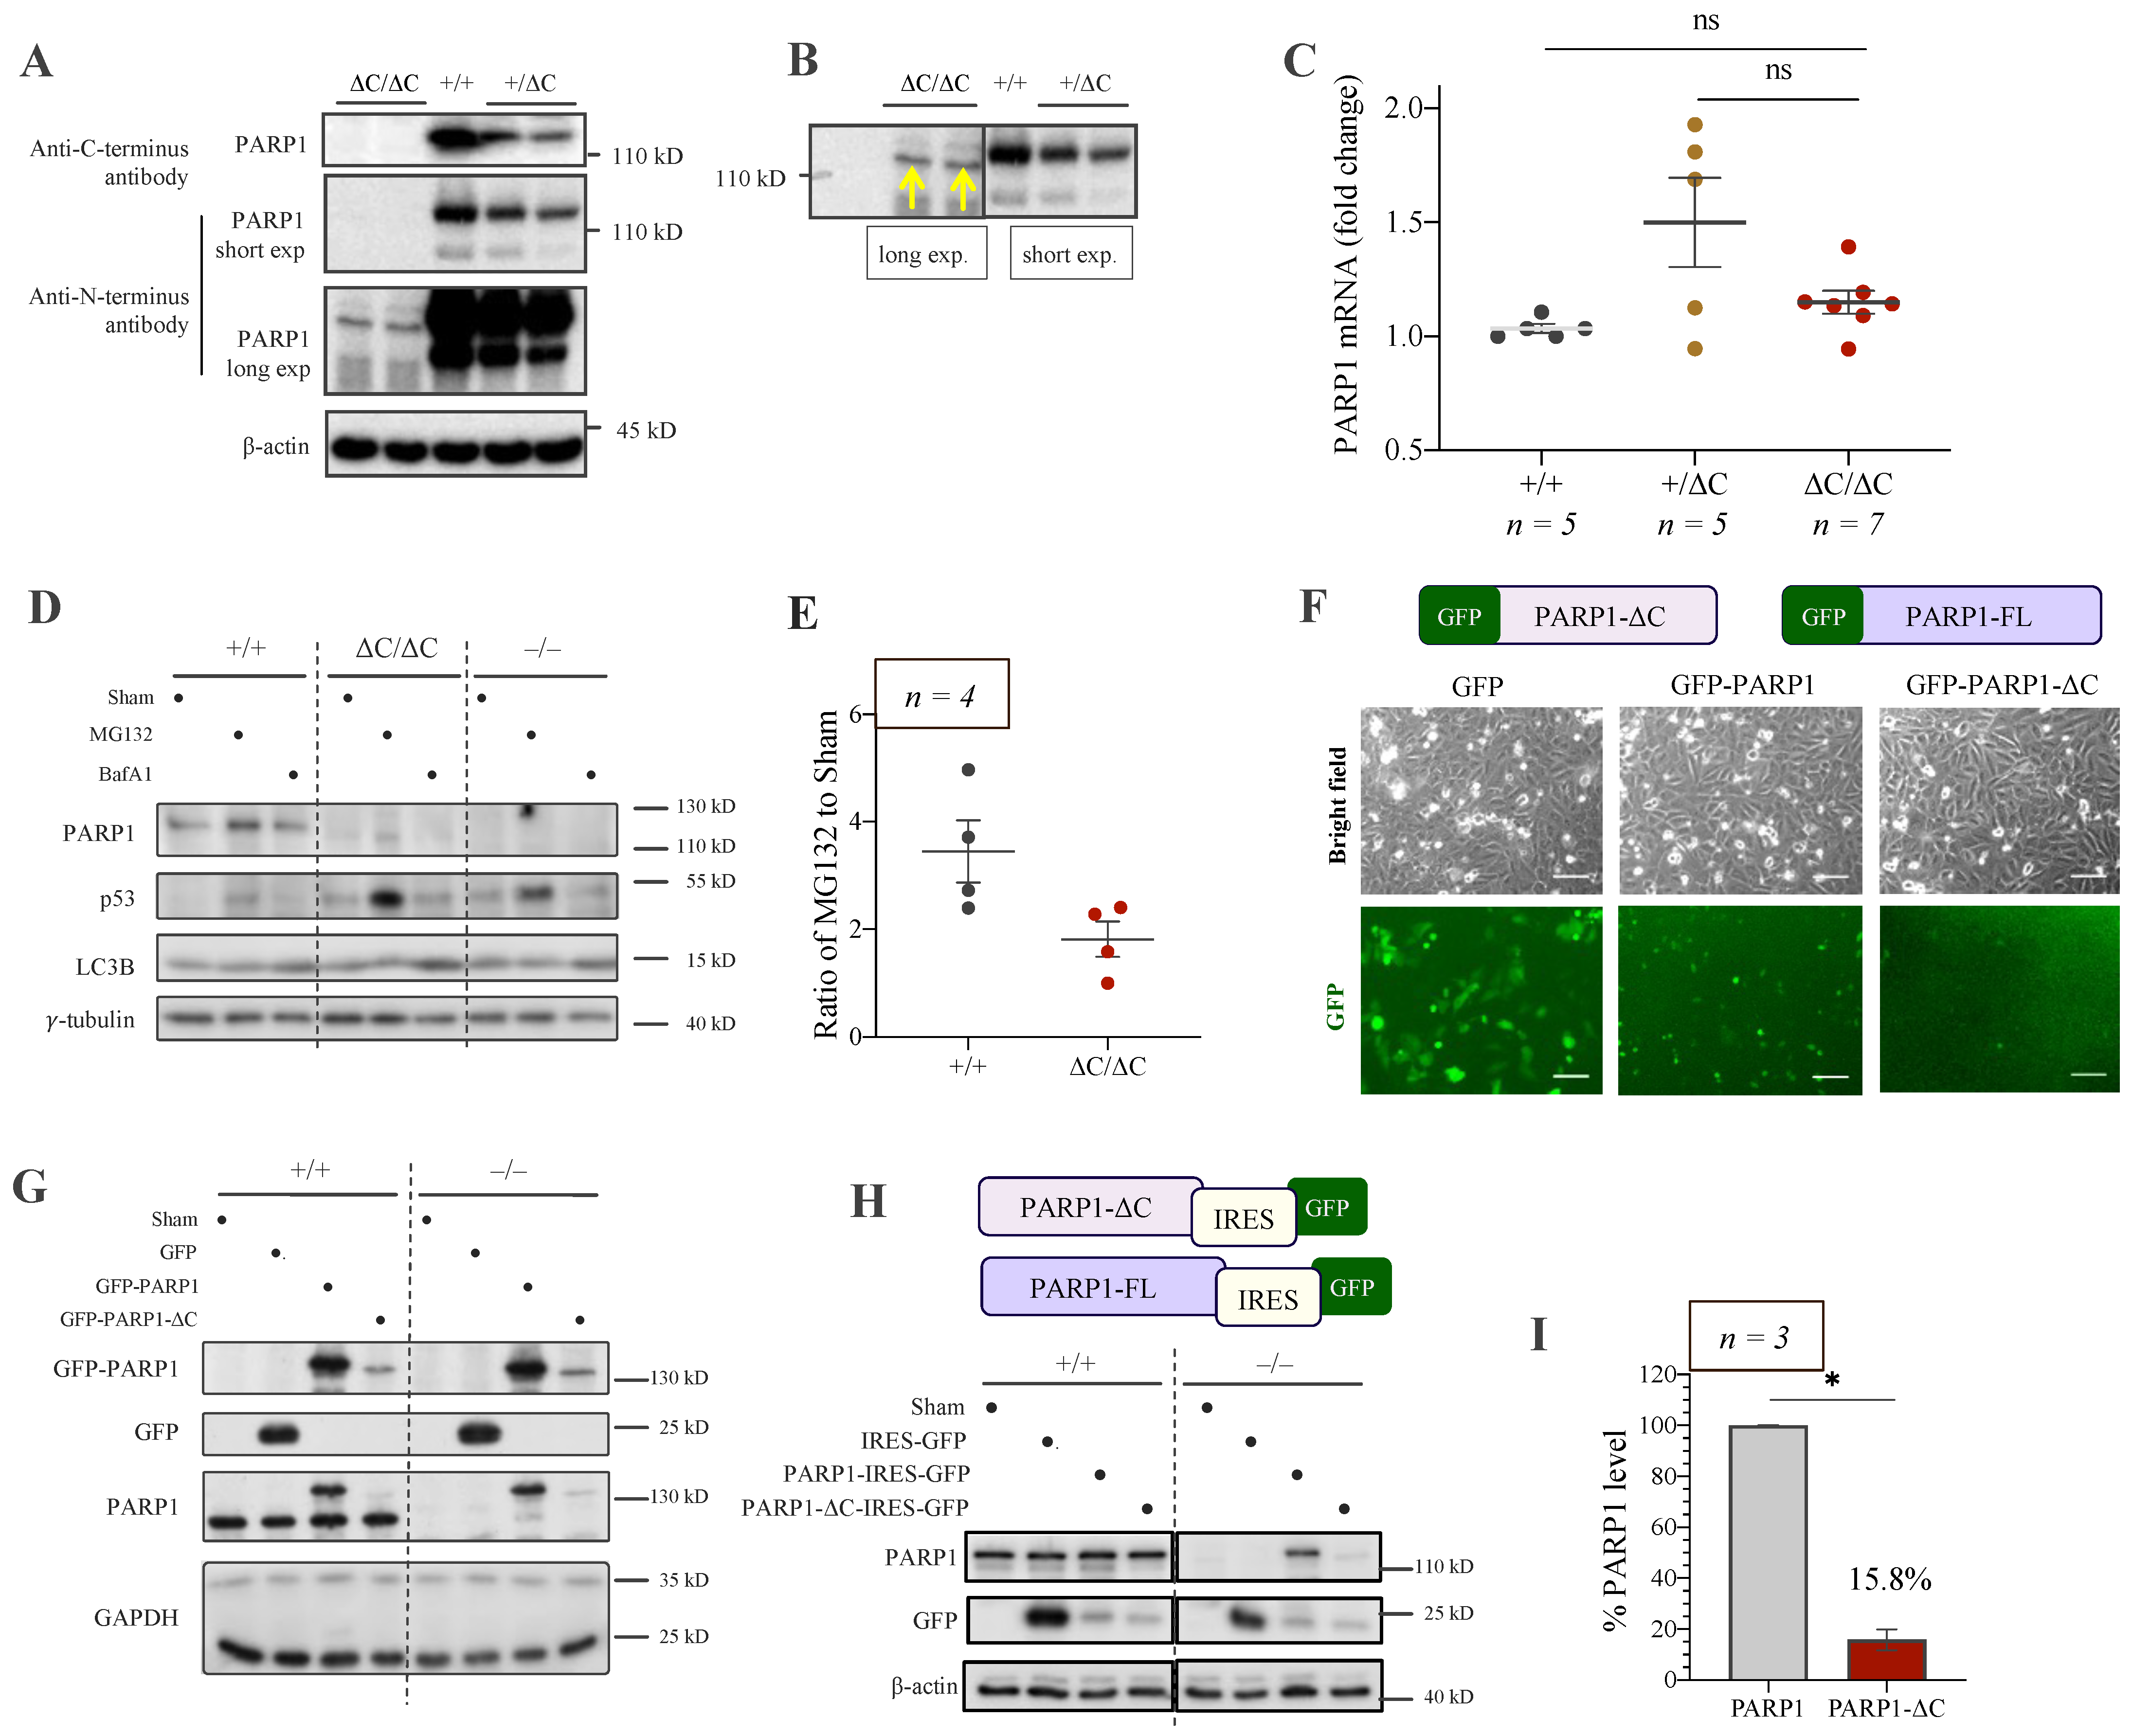
3.1. Generation of PARP1ΔC/ΔC Mice
3.2. Differentiation of PARP1ΔC/ΔC ES Cells
3.3. Low Expression of PARP1-ΔC Protein
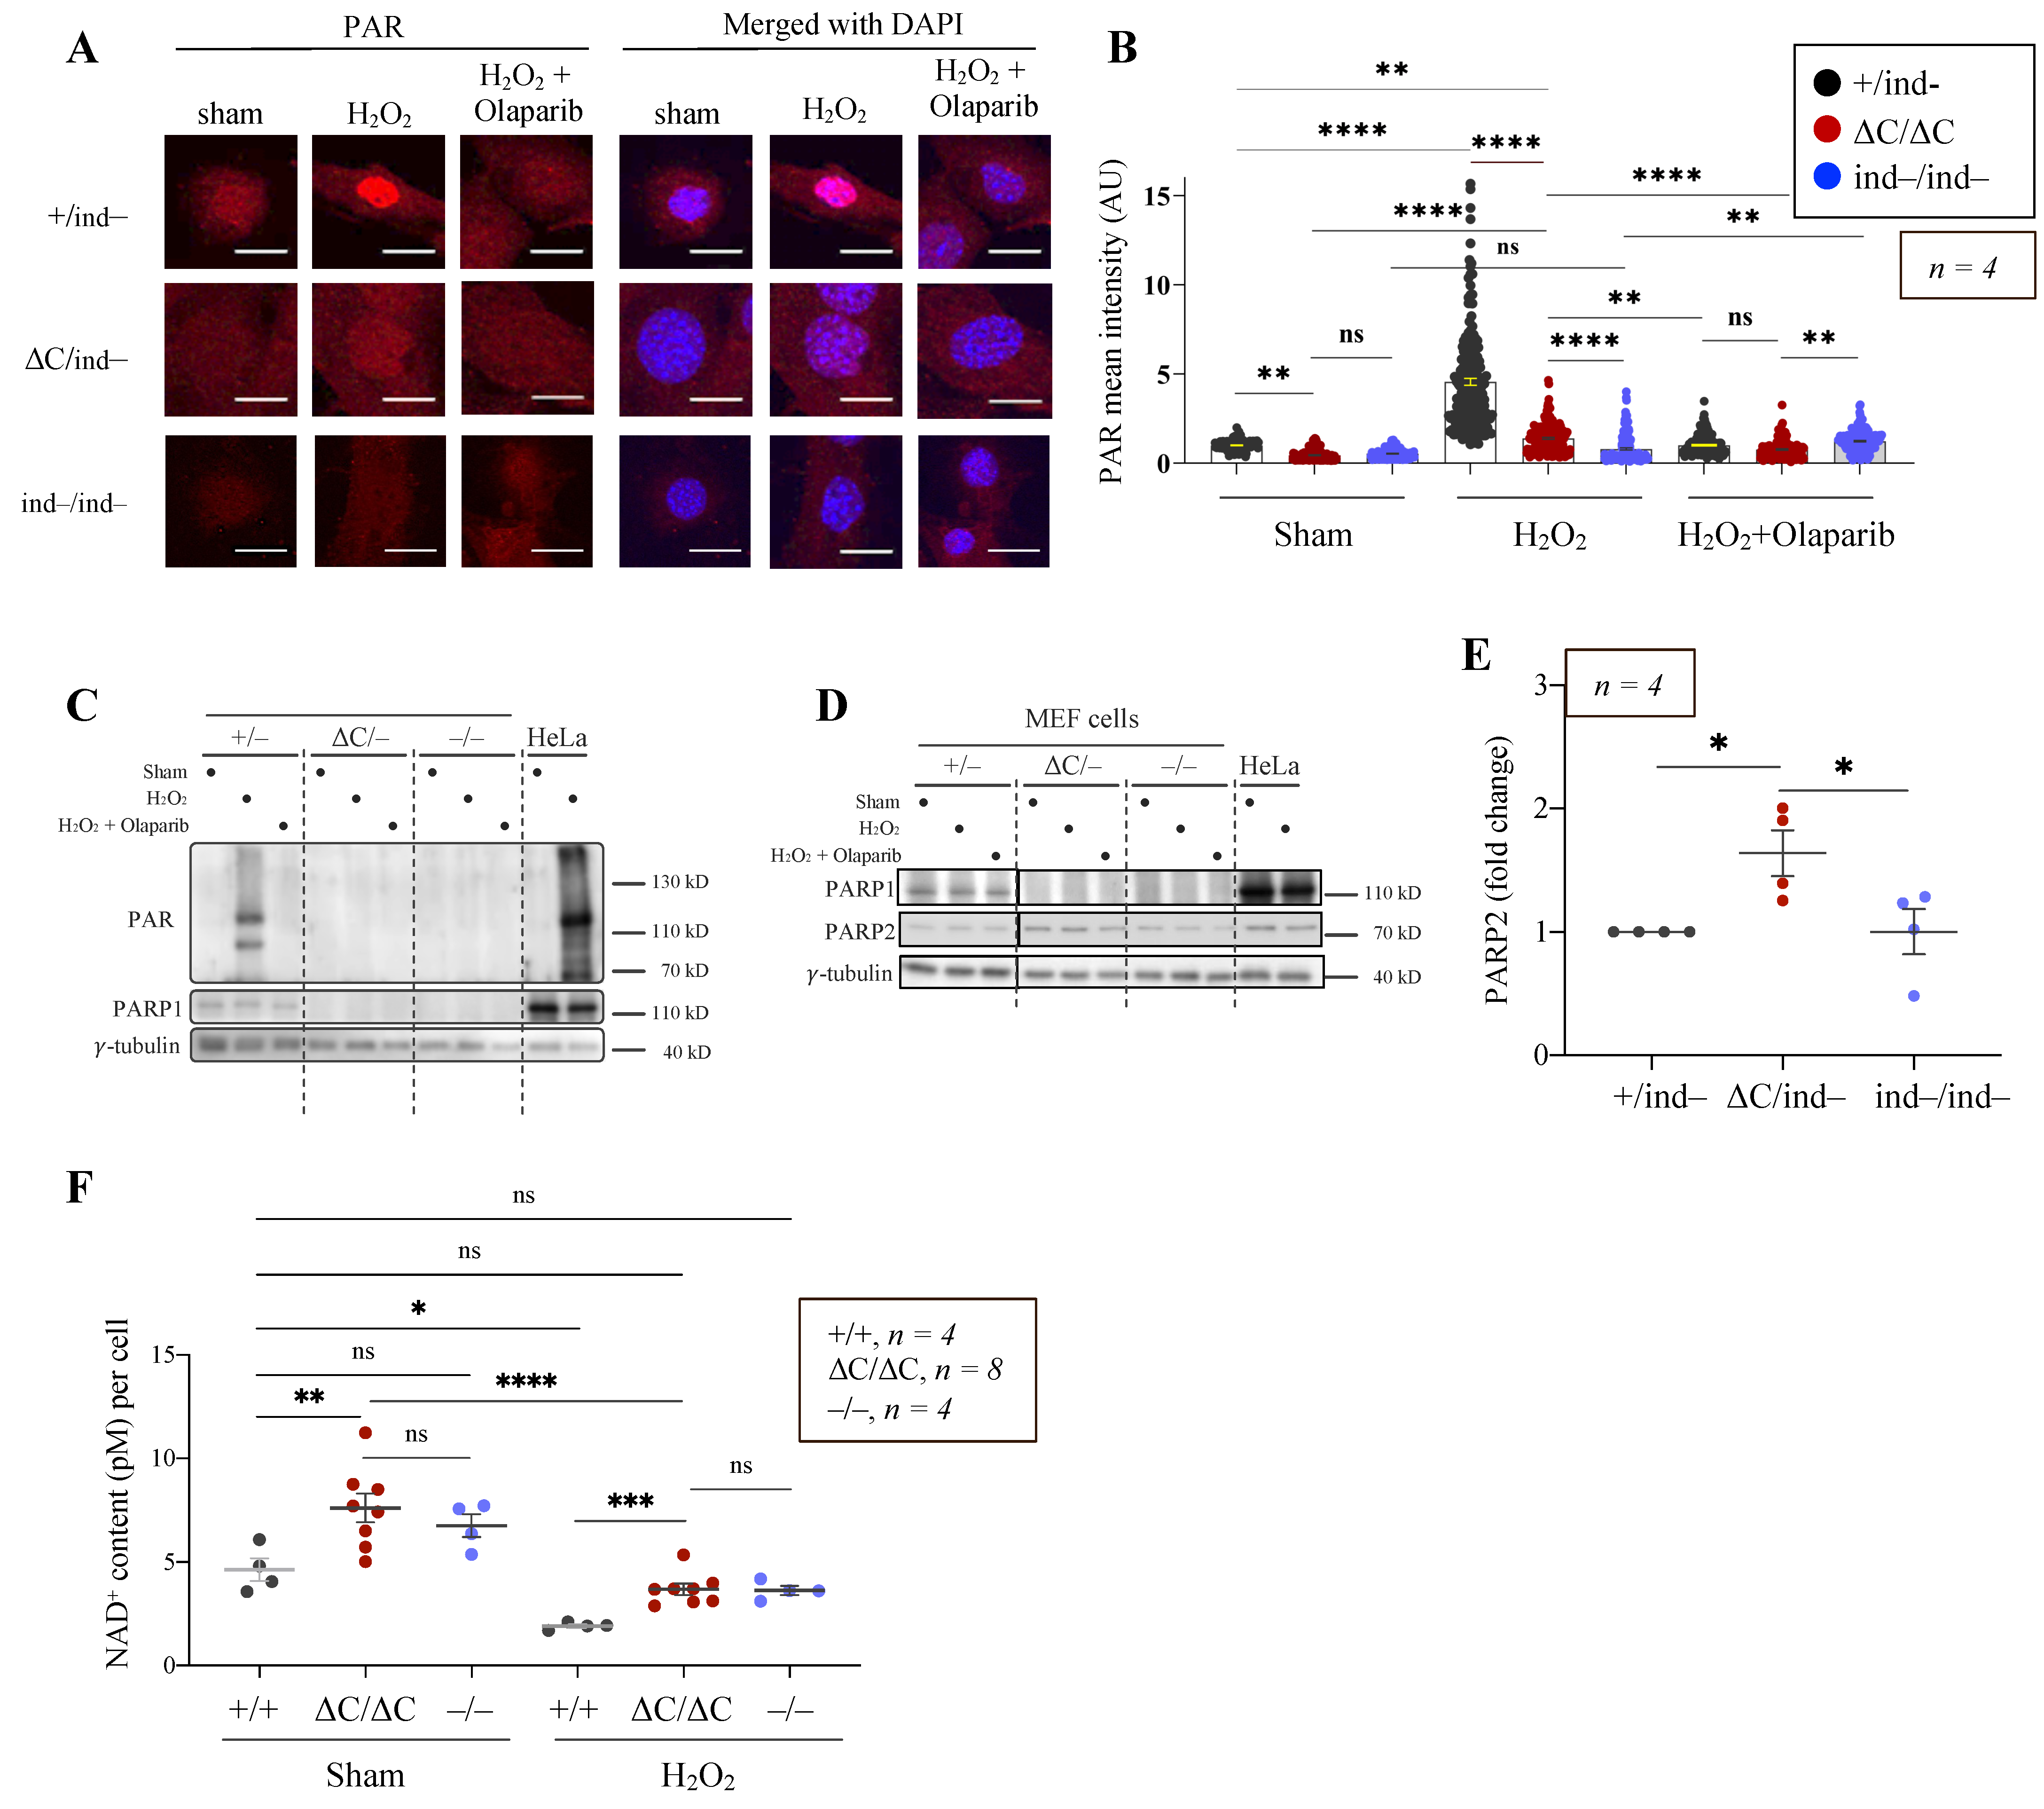
3.4. The PARylation Activity of PARP1-ΔC Cells
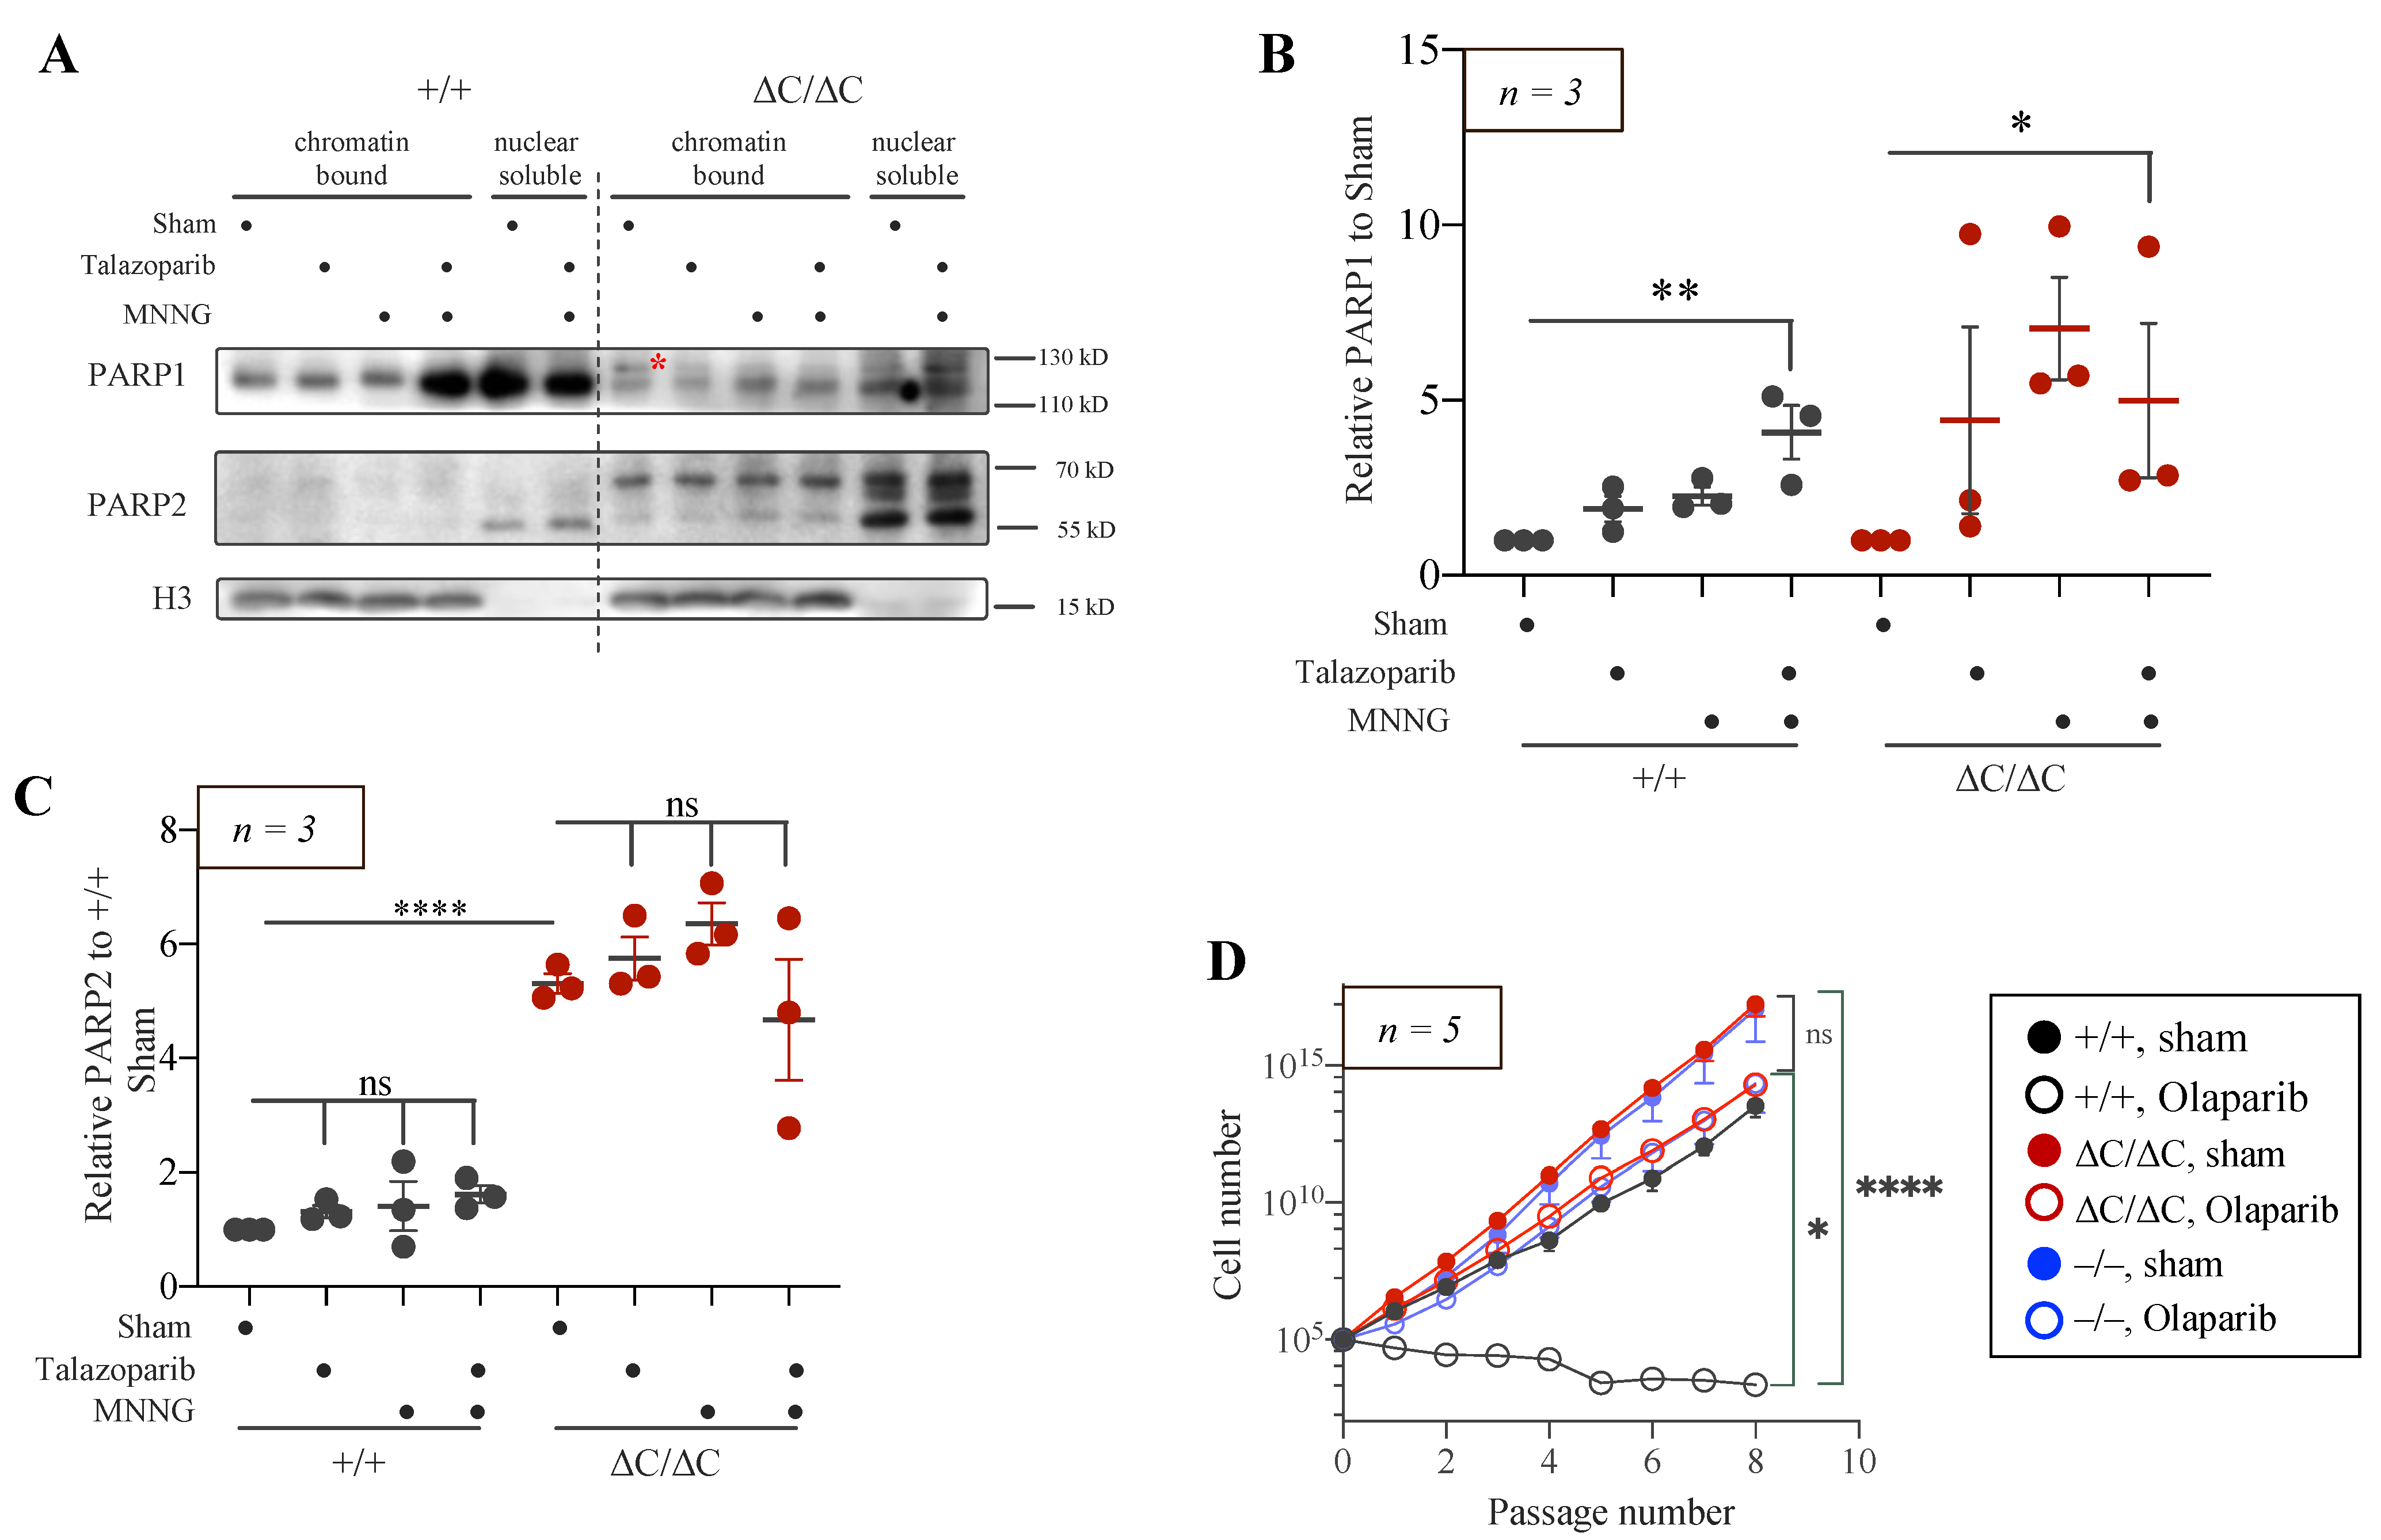
3.5. Trapping of PARP1 and PARP2 Proteins at Chromatin in PARP1-ΔC Cells
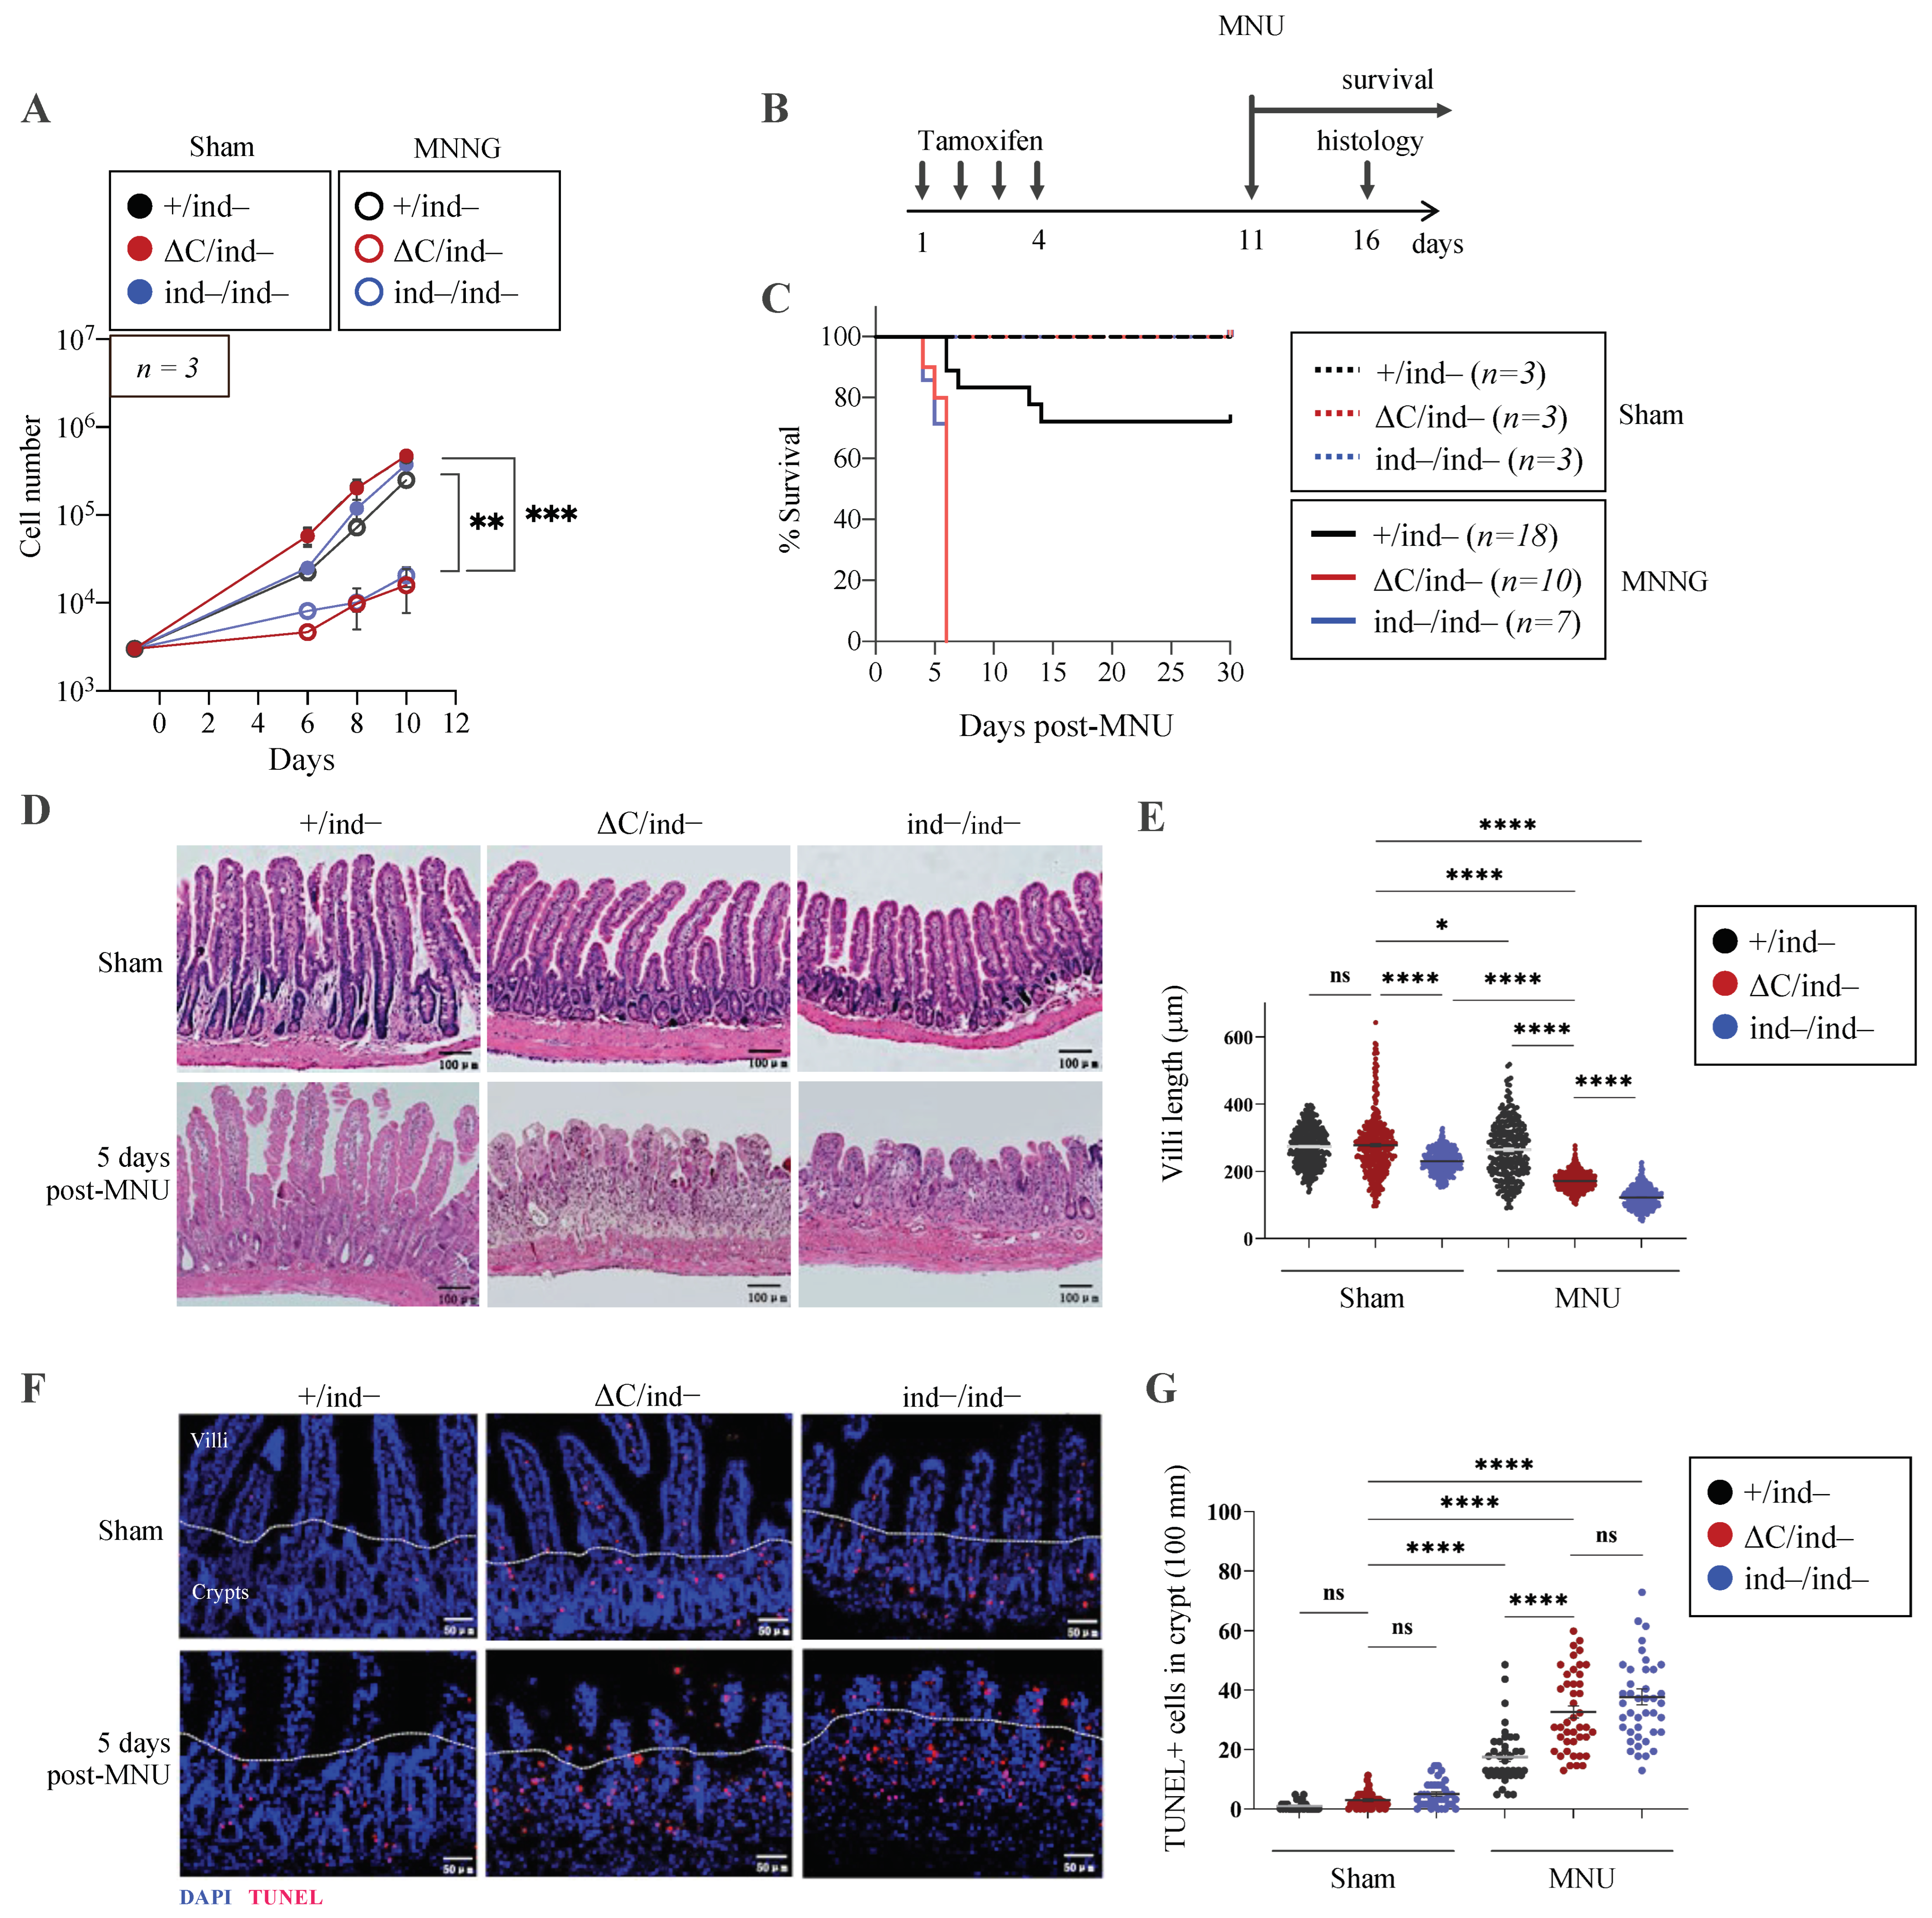
3.6. Inducible PARP1ΔC/ind− Mice Are Viable but Hypersensitive to Genotoxic Stress
4. Discussion
Supplementary Materials
Author Contributions
Funding
Institutional Review Board Statement
Informed Consent Statement
Acknowledgments
Conflicts of Interest
References
- Lüscher, B.; Ahel, I.; Altmeyer, M.; Ashworth, A.; Bai, P.; Chang, P.; Cohen, M.; Corda, D.; Dantzer, F.; Daugherty, M.D.; et al. ADP-ribosyltransferases, an update on function and nomenclature. FEBS J. 2021, 289, 7399–7410. [Google Scholar] [CrossRef]
- Sanderson, D.J.; Cohen, M.S. Mechanisms governing PARP expression, localization, and activity in cells. Crit. Rev. Biochem. Mol. Biol. 2020, 55, 541–554. [Google Scholar] [CrossRef]
- Szántó, M.; Gupte, R.; Kraus, W.L.; Pacher, P.; Bai, P. PARPs in lipid metabolism and related diseases. Prog. Lipid Res. 2021, 84, 101117. [Google Scholar] [CrossRef]
- Sousa, F.G.; Matuo, R.; Soares, D.G.; Escargueil, A.E.; Henriques, J.A.; Larsen, A.K.; Saffi, J. PARPs and the DNA damage response. Carcinogenesis 2012, 33, 1433–1440. [Google Scholar] [CrossRef]
- Ruf, A.; Mennissier de Murcia, J.; de Murcia, G.; Schulz, G.E. Structure of the catalytic fragment of poly(AD-ribose) polymerase from chicken. Proc. Natl. Acad. Sci. USA 1996, 93, 7481–7485. [Google Scholar] [CrossRef]
- Matveeva, E.A.; Al-Tinawi, Q.M.H.; Rouchka, E.C.; Fondufe-Mittendorf, Y.N. Coupling of PARP1-mediated chromatin structural changes to transcriptional RNA polymerase II elongation and cotranscriptional splicing. Epigenetics Chromatin 2019, 12, 15. [Google Scholar] [CrossRef]
- Hossain, M.B.; Ji, P.; Anish, R.; Jacobson, R.H.; Takada, S. Poly(ADP-ribose) Polymerase 1 Interacts with Nuclear Respiratory Factor 1 (NRF-1) and Plays a Role in NRF-1 Transcriptional Regulation. J. Biol. Chem. 2009, 284, 8621–8632. [Google Scholar] [CrossRef]
- Hassa, P.O.; Covic, M.; Hasan, S.; Imhof, R.; Hottiger, M.O. The enzymatic and DNA binding activity of PARP-1 are not required for NF-kappa B coactivator function. J. Biol. Chem. 2001, 276, 45588–45597. [Google Scholar] [CrossRef]
- Demin, A.A.; Hirota, K.; Tsuda, M.; Adamowicz, M.; Hailstone, R.; Brazina, J.; Gittens, W.; Kalasova, I.; Shao, Z.; Zha, S.; et al. XRCC1 prevents toxic PARP1 trapping during DNA base excision repair. Mol. Cell 2021, 81, 3018–3030.e3015. [Google Scholar] [CrossRef]
- Zong, W.; Gong, Y.; Sun, W.; Li, T.; Wang, Z.-Q. PARP1: Liaison of Chromatin Remodeling and Transcription. Cancers 2022, 14, 4162. [Google Scholar] [CrossRef]
- Kamaletdinova, T.; Fanaei-Kahrani, Z.; Wang, Z.-Q. The Enigmatic Function of PARP1: From PARylation Activity to PAR Readers. Cells 2019, 8, 1625. [Google Scholar] [CrossRef]
- Huang, D.; Kraus, W.L. The expanding universe of PARP1-mediated molecular and therapeutic mechanisms. Mol. Cell 2022, 82, 2315–2334. [Google Scholar] [CrossRef]
- Schuhwerk, H.; Bruhn, C.; Siniuk, K.; Min, W.; Erener, S.; Grigaravicius, P.; Krüger, A.; Ferrari, E.; Zubel, T.; Lazaro, D.; et al. Kinetics of poly(ADP-ribosyl)ation, but not PARP1 itself, determines the cell fate in response to DNA damage in vitro and in vivo. Nucleic Acids Res. 2017, 45, 11174–11192. [Google Scholar] [CrossRef]
- Wang, X.-G.; Wang, Z.-Q.; Tong, W.-M.; Shen, Y. PARP1 Val762Ala polymorphism reduces enzymatic activity. Biochem. Biophys. Res. Commun. 2007, 354, 122–126. [Google Scholar] [CrossRef]
- Pourfarjam, Y.; Kasson, S.; Tran, L.; Ho, C.; Lim, S.; Kim, I.K. PARG has a robust endo-glycohydrolase activity that releases protein-free poly(ADP-ribose) chains. Biochem. Biophys. Res. Commun. 2020, 527, 818–823. [Google Scholar] [CrossRef]
- Koh, D.W.; Lawler, A.M.; Poitras, M.F.; Sasaki, M.; Wattler, S.; Nehls, M.C.; Stöger, T.; Poirier, G.G.; Dawson, V.L.; Dawson, T.M. Failure to degrade poly(ADP-ribose) causes increased sensitivity to cytotoxicity and early embryonic lethality. Proc. Natl. Acad. Sci. USA 2004, 101, 17699–17704. [Google Scholar] [CrossRef]
- Cortes, U.; Tong, W.-M.; Coyle, D.L.; Meyer-Ficca, M.L.; Meyer, R.G.; Petrilli, V.; Herceg, Z.; Jacobson, E.L.; Jacobson, M.K.; Wang, Z.-Q. Depletion of the 110-Kilodalton Isoform of Poly(ADP-Ribose) Glycohydrolase Increases Sensitivity to Genotoxic and Endotoxic Stress in Mice. Mol. Cell. Biol. 2004, 24, 7163–7178. [Google Scholar] [CrossRef]
- Cuzzocrea, S.; Mazzon, E.; Genovese, T.; Crisafulli, C.; Min, W.-K.; Di Paola, R.; Muià, C.; Li, J.-H.; Malleo, G.; Xu, W.; et al. Role of poly(ADP-ribose) glycohydrolase in the development of inflammatory bowel disease in mice. Free Radic. Biol. Med. 2007, 42, 90–105. [Google Scholar] [CrossRef]
- Krüger, A.; Bürkle, A.; Hauser, K.; Mangerich, A. Real-time monitoring of PARP1-dependent PARylation by ATR-FTIR spectroscopy. Nat. Commun. 2020, 11, 2174. [Google Scholar] [CrossRef]
- Teloni, F.; Altmeyer, M. Readers of poly(ADP-ribose): Designed to be fit for purpose. Nucleic Acids Res. 2016, 44, 993–1006. [Google Scholar] [CrossRef]
- Schuhwerk, H.; Atteya, R.; Siniuk, K.; Wang, Z.-Q. PARPing for balance in the homeostasis of poly(ADP-ribosyl)ation. Semin. Cell Dev. Biol. 2017, 63, 81–91. [Google Scholar] [CrossRef]
- Chen, Q.; Ma, K.; Liu, X.; Chen, S.H.; Li, P.; Yu, Y.; Leung, A.K.L.; Yu, X. Truncated PARP1 mediates ADP-ribosylation of RNA polymerase III for apoptosis. Cell Discov. 2022, 8, 3. [Google Scholar] [CrossRef]
- Blackwell, T.S.; Christman, J.W. The role of nuclear factor-kappa B in cytokine gene regulation. Am. J. Respir. Cell Mol. Biol. 1997, 17, 3–9. [Google Scholar] [CrossRef]
- Maluchenko, N.V.; Nilov, D.K.; Pushkarev, S.V.; Kotova, E.Y.; Gerasimova, N.S.; Kirpichnikov, M.P.; Langelier, M.-F.; Pascal, J.M.; Akhtar, M.S.; Feofanov, A.V.; et al. Mechanisms of Nucleosome Reorganization by PARP1. Int. J. Mol. Sci. 2021, 22, 12127. [Google Scholar] [CrossRef]
- Masutani, M.; Suzuki, H.; Kamada, N.; Watanabe, M.; Ueda, O.; Nozaki, T.; Jishage, K.-i.; Watanabe, T.; Sugimoto, T.; Nakagama, H.; et al. Poly(ADP-ribose) polymerase gene disruption conferred mice resistant to streptozotocin-induced diabetes. Proc. Natl. Acad. Sci. USA 1999, 96, 2301–2304. [Google Scholar] [CrossRef]
- Murcia, J.M.d.; Niedergang, C.; Trucco, C.; Ricoul, M.; Dutrillaux, B.; Mark, M.; Oliver, F.J.; Masson, M.; Dierich, A.; LeMeur, M.; et al. Requirement of poly(ADP-ribose) polymerase in recovery from DNA damage in mice and in cells. Proc. Natl. Acad. Sci. USA 1997, 94, 7303–7307. [Google Scholar] [CrossRef]
- Wang, Z.Q.; Auer, B.; Stingl, L.; Berghammer, H.; Haidacher, D.; Schweiger, M.; Wagner, E.F. Mice lacking ADPRT and poly(ADP-ribosyl)ation develop normally but are susceptible to skin disease. Genes. Dev. 1995, 9, 509–520. [Google Scholar] [CrossRef]
- Ishizuka, S.; Martin, K.; Booth, C.; Potten, C.S.; de Murcia, G.; Bürkle, A.; Kirkwood, T.B.L. Poly(ADP-ribose) polymerase-1 is a survival factor for radiation-exposed intestinal epithelial stem cells in vivo. Nucleic Acids Res. 2003, 31, 6198–6205. [Google Scholar] [CrossRef]
- Wang, Z.Q.; Stingl, L.; Morrison, C.; Jantsch, M.; Los, M.; Schulze-Osthoff, K.; Wagner, E.F. PARP is important for genomic stability but dispensable in apoptosis. Genes. Dev. 1997, 11, 2347–2358. [Google Scholar] [CrossRef]
- Tong, W.-M.; Cortes, U.; Wang, Z.-Q. Poly(ADP-ribose) polymerase: A guardian angel protecting the genome and suppressing tumorigenesis. Biochim. Biophys. Acta (BBA)—Rev. Cancer 2001, 1552, 27–37. [Google Scholar] [CrossRef]
- Trucco, C.; Javier Oliver, F.; de Murcia, G.; Ménissier-de Murcia, J. DNA repair defect in poly(ADP-ribose) polymerase-deficient cell lines. Nucleic Acids Res. 1998, 26, 2644–2649. [Google Scholar] [CrossRef] [PubMed]
- Oliver, F.J.; Ménissier-de Murcia, J.; Nacci, C.; Decker, P.; Andriantsitohaina, R.; Muller, S.; de la Rubia, G.; Stoclet, J.C.; de Murcia, G. Resistance to endotoxic shock as a consequence of defective NF-kappaB activation in poly (ADP-ribose) polymerase-1 deficient mice. EMBO J. 1999, 18, 4446–4454. [Google Scholar] [CrossRef]
- Soriano, F.G.; Liaudet, L.; Szabó, É.; Virág, L.; Mabley, J.G.; Pacher, P.; Szabó, C. Resistance to Acute Septic Peritonitis in Poly(ADP-ribose) Polymerase-1-Deficient Mice. Shock 2002, 17, 286–292. [Google Scholar] [CrossRef] [PubMed]
- Cuzzocrea, S.; Wang, Z.-Q. Role of poly(ADP-ribose) glycohydrolase (PARG) in shock, ischemia and reperfusion. Pharmacol. Res. 2005, 52, 100–108. [Google Scholar] [CrossRef] [PubMed]
- Eliasson, M.J.L.; Sampei, K.; Mandir, A.S.; Hurn, P.D.; Traystman, R.J.; Bao, J.; Pieper, A.; Wang, Z.-Q.; Dawson, T.M.; Snyder, S.H.; et al. Poly(ADP-ribose) polymerase gene disruption renders mice resistant to cerebral ischemia. Nat. Med. 1997, 3, 1089–1095. [Google Scholar] [CrossRef] [PubMed]
- Endres, M.; Wang, Z.-Q.; Namura, S.; Waeber, C.; Moskowitz, M.A. Ischemic Brain Injury is Mediated by the Activation of Poly(ADP-Ribose)Polymerase. J. Cereb. Blood Flow. Metab. 1997, 17, 1143–1151. [Google Scholar] [CrossRef]
- Burkart, V.; Wang, Z.-Q.; Radons, J.; Heller, B.; Herceg, Z.; Stingl, L.; Wagner, E.F.; Kolb, H. Mice lacking the poly(ADP-ribose) polymerase gene are resistant to pancreatic beta-cell destruction and diabetes development induced by streptozocin. Nat. Med. 1999, 5, 314–319. [Google Scholar] [CrossRef]
- Zheng, J.; Devalaraja-Narashimha, K.; Singaravelu, K.; Padanilam, B.J. Poly(ADP-ribose) polymerase-1 gene ablation protects mice from ischemic renal injury. Am. J. Physiol. Ren. Physiol. 2005, 288, F387–F398. [Google Scholar] [CrossRef]
- Kauppinen, T.M. Multiple roles for poly(ADP-ribose)polymerase-1 in neurological disease. Neurochem. Int. 2007, 50, 954–958. [Google Scholar] [CrossRef]
- Aida, T.; Chiyo, K.; Usami, T.; Ishikubo, H.; Imahashi, R.; Wada, Y.; Tanaka, K.F.; Sakuma, T.; Yamamoto, T.; Tanaka, K. Cloning-free CRISPR/Cas system facilitates functional cassette knock-in in mice. Genome Biol. 2015, 16, 87. [Google Scholar] [CrossRef]
- Kunze, F.A.; Bauer, M.; Komuczki, J.; Lanzinger, M.; Gunasekera, K.; Hopp, A.K.; Lehmann, M.; Becher, B.; Müller, A.; Hottiger, M.O. ARTD1 in Myeloid Cells Controls the IL-12/18-IFN-γ Axis in a Model of Sterile Sepsis, Chronic Bacterial Infection, and Cancer. J. Immunol. 2019, 202, 1406–1416. [Google Scholar] [CrossRef] [PubMed]
- Zangala, T. Isolation of genomic DNA from mouse tails. J. Vis. Exp. 2007, 246. [Google Scholar] [CrossRef]
- Randolph, L.N.; Bao, X.; Zhou, C.; Lian, X. An all-in-one, Tet-On 3G inducible PiggyBac system for human pluripotent stem cells and derivatives. Sci. Rep. 2017, 7, 1549. [Google Scholar] [CrossRef]
- Zhou, Z.W.; Liu, C.; Li, T.L.; Bruhn, C.; Krueger, A.; Min, W.; Wang, Z.Q.; Carr, A.M. An essential function for the ATR-activation-domain (AAD) of TopBP1 in mouse development and cellular senescence. PLoS Genet. 2013, 9, e1003702. [Google Scholar] [CrossRef] [PubMed]
- Herkert, B.; Dwertmann, A.; Herold, S.; Abed, M.; Naud, J.F.; Finkernagel, F.; Harms, G.S.; Orian, A.; Wanzel, M.; Eilers, M. The Arf tumor suppressor protein inhibits Miz1 to suppress cell adhesion and induce apoptosis. J. Cell Biol. 2010, 188, 905–918. [Google Scholar] [CrossRef]
- Li, T.; Shi, Y.; Wang, P.; Guachalla, L.M.; Sun, B.; Joerss, T.; Chen, Y.-S.; Groth, M.; Krueger, A.; Platzer, M.; et al. Smg6/Est1 licenses embryonic stem cell differentiation via nonsense-mediated mRNA decay. EMBO J. 2015, 34, 1630–1647. [Google Scholar] [CrossRef]
- Kirtay, M.; Sell, J.; Marx, C.; Haselmann, H.; Ceanga, M.; Zhou, Z.-W.; Rahmati, V.; Kirkpatrick, J.; Buder, K.; Grigaravicius, P.; et al. ATR regulates neuronal activity by modulating presynaptic firing. Nat. Commun. 2021, 12, 4067. [Google Scholar] [CrossRef]
- Fontana, P.; Bonfiglio, J.J.; Palazzo, L.; Bartlett, E.; Matic, I.; Ahel, I. Serine ADP-ribosylation reversal by the hydrolase ARH3. eLife 2017, 6, e28533. [Google Scholar] [CrossRef]
- Spiegel, J.O.; Van Houten, B.; Durrant, J.D. PARP1: Structural insights and pharmacological targets for inhibition. DNA Repair 2021, 103, 103125. [Google Scholar] [CrossRef]
- Warga, R.M.; Kane, D.A. A role for N-cadherin in mesodermal morphogenesis during gastrulation. Dev. Biol. 2007, 310, 211–225. [Google Scholar] [CrossRef]
- Mukherjee, S.; Chaturvedi, P.; Rankin, S.A.; Fish, M.B.; Wlizla, M.; Paraiso, K.D.; MacDonald, M.; Chen, X.; Weirauch, M.T.; Blitz, I.L.; et al. Sox17 and β-catenin co-occupy Wnt-responsive enhancers to govern the endoderm gene regulatory network. eLife 2020, 9, e58029. [Google Scholar] [CrossRef] [PubMed]
- Engert, S.; Burtscher, I.; Liao, W.P.; Dulev, S.; Schotta, G.; Lickert, H. Wnt/β-catenin signalling regulates Sox17 expression and is essential for organizer and endoderm formation in the mouse. Development 2013, 140, 3128–3138. [Google Scholar] [CrossRef] [PubMed]
- Sampson, L.L.; Davis, A.K.; Grogg, M.W.; Zheng, Y. mTOR disruption causes intestinal epithelial cell defects and intestinal atrophy postinjury in mice. Faseb J. 2016, 30, 1263–1275. [Google Scholar] [CrossRef]
- Miranda, E.A.; Dantzer, F.; Ofarrell, M.; Demurcia, G.; Demurcia, J.M. Characterization of a Gain-of-Function Mutant of Poly(ADP-Ribose) Polymerase. Biochem. Biophys. Res. Commun. 1995, 212, 317–325. [Google Scholar] [CrossRef] [PubMed]
- Aberle, L.; Krüger, A.; Reber, J.M.; Lippmann, M.; Hufnagel, M.; Schmalz, M.; Trussina, I.; Schlesiger, S.; Zubel, T.; Schütz, K.; et al. PARP1 catalytic variants reveal branching and chain length-specific functions of poly(ADP-ribose) in cellular physiology and stress response. Nucleic Acids Res. 2020, 48, 10015–10033. [Google Scholar] [CrossRef]
- Gibbs-Seymour, I.; Fontana, P.; Rack, J.G.M.; Ahel, I. HPF1/C4orf27 Is a PARP-1-Interacting Protein that Regulates PARP-1 ADP-Ribosylation Activity. Mol. Cell 2016, 62, 432–442. [Google Scholar] [CrossRef]
- Shi, Y.; Zhou, F.; Jiang, F.; Lu, H.; Wang, J.; Cheng, C. PARP inhibitor reduces proliferation and increases apoptosis in breast cancer cells. Chin. J. Cancer Res. 2014, 26, 142–147. [Google Scholar] [CrossRef]
- Park, H.J.; Bae, J.S.; Kim, K.M.; Moon, Y.J.; Park, S.-H.; Ha, S.H.; Hussein, U.K.; Zhang, Z.; Park, H.S.; Park, B.-H.; et al. The PARP inhibitor olaparib potentiates the effect of the DNA damaging agent doxorubicin in osteosarcoma. J. Exp. Clin. Cancer Res. 2018, 37, 107. [Google Scholar] [CrossRef]
- Hopkins, T.A.; Ainsworth, W.B.; Ellis, P.A.; Donawho, C.K.; DiGiammarino, E.L.; Panchal, S.C.; Abraham, V.C.; Algire, M.A.; Shi, Y.; Olson, A.M.; et al. PARP1 Trapping by PARP Inhibitors Drives Cytotoxicity in Both Cancer Cells and Healthy Bone Marrow. Mol. Cancer Res. 2019, 17, 409–419. [Google Scholar] [CrossRef]
- Lin, X.; Jiang, W.; Rudolph, J.; Lee, B.J.; Luger, K.; Zha, S. PARP inhibitors trap PARP2 and alter the mode of recruitment of PARP2 at DNA damage sites. Nucleic Acids Res. 2022, 50, 3958–3973. [Google Scholar] [CrossRef]
- Cardinale, A.; Paldino, E.; Giampà, C.; Bernardi, G.; Fusco, F.R. PARP-1 Inhibition Is Neuroprotective in the R6/2 Mouse Model of Huntington’s Disease. PLoS ONE 2015, 10, e0134482. [Google Scholar] [CrossRef] [PubMed]
- Bonfanti, S.; Lionetti, M.C.; Fumagalli, M.R.; Chirasani, V.R.; Tiana, G.; Dokholyan, N.V.; Zapperi, S.; La Porta, C.A.M. Molecular mechanisms of heterogeneous oligomerization of huntingtin proteins. Sci. Rep. 2019, 9, 7615. [Google Scholar] [CrossRef]
- Ackerson, S.M.; Gable, C.I.; Stewart, J.A. Human CTC1 promotes TopBP1 stability and CHK1 phosphorylation in response to telomere dysfunction and global replication stress. Cell Cycle 2020, 19, 3491–3507. [Google Scholar] [CrossRef]
- Gu, P.; Min, J.-N.; Wang, Y.; Huang, C.; Peng, T.; Chai, W.; Chang, S. CTC1 deletion results in defective telomere replication, leading to catastrophic telomere loss and stem cell exhaustion. EMBO J. 2012, 31, 2309–2321. [Google Scholar] [CrossRef]
- Juhász, S.; Smith, R.; Schauer, T.; Spekhardt, D.; Mamar, H.; Zentout, S.; Chapuis, C.; Huet, S.; Timinszky, G. The chromatin remodeler ALC1 underlies resistance to PARP inhibitor treatment. Sci. Adv. 2020, 6, eabb8626. [Google Scholar] [CrossRef]
- Roskams, T.; Desmet, V. Embryology of extra- and intrahepatic bile ducts, the ductal plate. Anat. Rec. 2008, 291, 628–635. [Google Scholar] [CrossRef] [PubMed]
- Magenheimer, B.S.; St John, P.L.; Isom, K.S.; Abrahamson, D.R.; De Lisle, R.C.; Wallace, D.P.; Maser, R.L.; Grantham, J.J.; Calvet, J.P. Early embryonic renal tubules of wild-type and polycystic kidney disease kidneys respond to cAMP stimulation with cystic fibrosis transmembrane conductance regulator/Na(+),K(+),2Cl(-) Co-transporter-dependent cystic dilation. J. Am. Soc. Nephrol. 2006, 17, 3424–3437. [Google Scholar] [CrossRef] [PubMed]
- van Asselt, S.J.; de Vries, E.G.E.; van Dullemen, H.M.; Brouwers, A.H.; Walenkamp, A.M.E.; Giles, R.H.; Links, T.P. Pancreatic cyst development: Insights from von Hippel-Lindau disease. Cilia 2013, 2, 3. [Google Scholar] [CrossRef]
- Qiu, W.; Gu, P.-R.; Chuong, C.-M.; Lei, M. Skin Cyst: A Pathological Dead-End With a New Twist of Morphogenetic Potentials in Organoid Cultures. Front. Cell Dev. Biol. 2021, 8, 628114. [Google Scholar] [CrossRef]
- Guo, Q.; Xia, B.; Moshiach, S.; Xu, C.; Jiang, Y.; Chen, Y.; Sun, Y.; Lahti, J.M.; Zhang, X.A. The microenvironmental determinants for kidney epithelial cyst morphogenesis. Eur. J. Cell Biol. 2008, 87, 251–266. [Google Scholar] [CrossRef]
- Dzobo, K.; Dandara, C. The Extracellular Matrix: Its Composition, Function, Remodeling, and Role in Tumorigenesis. Biomimetics 2023, 8, 146. [Google Scholar] [CrossRef] [PubMed]
- Gulati, A.; Sevillano, A.M.; Praga, M.; Gutierrez, E.; Alba, I.; Dahl, N.K.; Besse, W.; Choi, J.; Somlo, S. Collagen IV Gene Mutations in Adults With Bilateral Renal Cysts and CKD. Kidney Int. Rep. 2019, 5, 103–108. [Google Scholar] [CrossRef] [PubMed]
- Mathieu, J.; Detraux, D.; Kuppers, D.; Wang, Y.; Cavanaugh, C.; Sidhu, S.; Levy, S.; Robitaille, A.M.; Ferreccio, A.; Bottorff, T.; et al. Folliculin regulates mTORC1/2 and WNT pathways in early human pluripotency. Nat. Commun. 2019, 10, 632. [Google Scholar] [CrossRef]
- Chu, L.; Luo, Y.; Chen, H.; Miao, Q.; Wang, L.; Moats, R.; Wang, T.; Kennedy, J.C.; Henske, E.P.; Shi, W. Mesenchymal folliculin is required for alveolar development: Implications for cystic lung disease in Birt-Hogg-Dubé syndrome. Thorax 2020, 75, 486–493. [Google Scholar] [CrossRef]
- Alemasova, E.E.; Lavrik, O.I. Poly(ADP-ribosyl)ation by PARP1: Reaction mechanism and regulatory proteins. Nucleic Acids Res. 2019, 47, 3811–3827. [Google Scholar] [CrossRef]
- Schreiber, V.; Amé, J.-C.; Dollé, P.; Schultz, I.; Rinaldi, B.; Fraulob, V.; Ménissier-de Murcia, J.; de Murcia, G. Poly(ADP-ribose) Polymerase-2 (PARP-2) Is Required for Efficient Base Excision DNA Repair in Association with PARP-1 and XRCC1*. J. Biol. Chem. 2002, 277, 23028–23036. [Google Scholar] [CrossRef]
- Schiewer, M.J.; Knudsen, K.E. Transcriptional roles of PARP1 in cancer. Mol. Cancer Res. 2014, 12, 1069–1080. [Google Scholar] [CrossRef]
- Ménissier de Murcia, J.; Ricoul, M.; Tartier, L.; Niedergang, C.; Huber, A.; Dantzer, F.; Schreiber, V.; Amé, J.C.; Dierich, A.; LeMeur, M.; et al. Functional interaction between PARP-1 and PARP-2 in chromosome stability and embryonic development in mouse. Embo J. 2003, 22, 2255–2263. [Google Scholar] [CrossRef]
- Boehler, C.; Gauthier, L.; Yelamos, J.; Noll, A.; Schreiber, V.; Dantzer, F. Phenotypic characterization of Parp-1 and Parp-2 deficient mice and cells. Methods Mol. Biol. 2011, 780, 313–336. [Google Scholar] [CrossRef] [PubMed]
- Chiang, Y.J.; Hsiao, S.J.; Yver, D.; Cushman, S.W.; Tessarollo, L.; Smith, S.; Hodes, R.J. Tankyrase 1 and tankyrase 2 are essential but redundant for mouse embryonic development. PLoS ONE 2008, 3, e2639. [Google Scholar] [CrossRef]
- Eleazer, R.; Fondufe-Mittendorf, Y.N. The multifaceted role of PARP1 in RNA biogenesis. Wiley Interdiscip. Rev. RNA 2021, 12, e1617. [Google Scholar] [CrossRef] [PubMed]


Disclaimer/Publisher’s Note: The statements, opinions and data contained in all publications are solely those of the individual author(s) and contributor(s) and not of MDPI and/or the editor(s). MDPI and/or the editor(s) disclaim responsibility for any injury to people or property resulting from any ideas, methods, instructions or products referred to in the content. |
© 2023 by the authors. Licensee MDPI, Basel, Switzerland. This article is an open access article distributed under the terms and conditions of the Creative Commons Attribution (CC BY) license (https://creativecommons.org/licenses/by/4.0/).
Share and Cite
Kamaletdinova, T.; Zong, W.; Urbánek, P.; Wang, S.; Sannai, M.; Grigaravičius, P.; Sun, W.; Fanaei-Kahrani, Z.; Mangerich, A.; Hottiger, M.O.; et al. Poly(ADP-Ribose) Polymerase-1 Lacking Enzymatic Activity Is Not Compatible with Mouse Development. Cells 2023, 12, 2078. https://doi.org/10.3390/cells12162078
Kamaletdinova T, Zong W, Urbánek P, Wang S, Sannai M, Grigaravičius P, Sun W, Fanaei-Kahrani Z, Mangerich A, Hottiger MO, et al. Poly(ADP-Ribose) Polymerase-1 Lacking Enzymatic Activity Is Not Compatible with Mouse Development. Cells. 2023; 12(16):2078. https://doi.org/10.3390/cells12162078
Chicago/Turabian StyleKamaletdinova, Tatiana, Wen Zong, Pavel Urbánek, Sijia Wang, Mara Sannai, Paulius Grigaravičius, Wenli Sun, Zahra Fanaei-Kahrani, Aswin Mangerich, Michael O. Hottiger, and et al. 2023. "Poly(ADP-Ribose) Polymerase-1 Lacking Enzymatic Activity Is Not Compatible with Mouse Development" Cells 12, no. 16: 2078. https://doi.org/10.3390/cells12162078