Article

The Petunia CHANEL Gene is a ZEITLUPE Ortholog Coordinating Growth and Scent Profiles

by
Marta I. Terry
1,
Fernando Pérez-Sanz
2,
M. Victoria Díaz-Galián
1,
Felipe Pérez de los Cobos
3,
Pedro J. Navarro
4,
Marcos Egea-Cortines
1 and
Julia Weiss
1,*
1
Genética Molecular, Instituto de Biotecnología Vegetal, Edificio I+D+I, Plaza del Hospital s/n, Universidad Politécnica de Cartagena, 30202 Cartagena, Spain
2
Biomedical Informatic and Bioinformatic Platform, Biomedical Research Institute of Murcia, University Clinical Hospital ‘Virgen de la Arrixaca’, University of Murcia, 30120 Murcia, Spain
3
Plant Breeding Department, Center of Edafology and Applied Biology of Segura-High Council for Scientific Research (CEBAS-CSIC), Espinardo University Campus, Espinardo, 30100 Murcia, Spain
4
Escuela Técnica Superior de Ingeniería de Telecomunicación (DSIE), Campus Muralla del Mar, s/n., Universidad Politécnica de Cartagena, 30202 Cartagena, Spain
*
Author to whom correspondence should be addressed.
Cells 2019, 8(4), 343; https://doi.org/10.3390/cells8040343
Submission received: 4 March 2019 / Revised: 8 April 2019 / Accepted: 9 April 2019 / Published: 11 April 2019

Abstract

:
The floral perianth, comprising sepals and petals, conceals the sexual organs and attracts pollinators. The coordination of growth and scent emission is not fully understood. We have analyzed the effect of knocking down CHANEL (PhCHL), the ZEITLUPE ortholog in petunia (PhCHL) by hairpin RNAs. Plants with low PhCHL mRNA had overall decreased size. Growth evaluation using time lapse image analysis showed that early leaf movement was not affected by RNAi:PhCHL, but flower angle movement was modified, moving earlier during the day in knockdown plants than in wild types. Despite differences in stem length, growth rate was not significantly affected by loss of PhCHL. In contrast, petal growth displayed lower growth rate in RNAi:PhCHL. Decreased levels of PhCHL caused strongly modified scent profiles, including changes in composition and timing of emission resulting in volatile profiles highly divergent from the wild type. Our results show a role of PhCHL in controlling growth and development of vegetative and reproductive organs in petunia. The different effects of PhCHL on organ development indicate an organ-specific interpretation of the down regulation of PhCHL. Through the control of both timing and quantitative volatile emissions, PhCHL appears to be a major coordinator of scent profiles.

1. Introduction

Plant aerial organs grow from lateral primordia that form in the shoot apical meristem [1]. The type of organs produced, i.e., leaves or flowers, are the result of a vegetative or reproductive developmental program. The formation of flowers is the result of the activation of the so-called floral organ identity genes. They comprise a set of MADS-BOX proteins that in a combinatorial fashion allow the formation of the different organs [2]. The interaction of different MADS-box proteins occur via formation of protein complexes that activate the different organ identity programs leading to the formation of sepals and petals in the perianth and stamens and carpels [3,4].
Floral organs play an important role in reproductive success in many plants. Proper floral size is a key component of flower-pollinator interaction [5]. Floral size, like in leaves, is controlled by coordinated cell division and expansion processes [6]. The genes controlling lateral organ size appear to be conserved. Indeed, general regulators of lateral growth such as AINTEGUMENTA control floral size in Arabidopsis, petunia, Antirrhinum and tobacco [7,8,9].
During late flower development and maturation there is a major transcriptional reprogramming and scent emission starts with flower opening [10,11]. Scent emission takes place when the floral organ identity genes are not fully active, indicating a quantitative effect of the DEFICIENS/GLOBOSA MADS box proteins and downstream factors on scent emission [11].
There are a large number of plants that emit floral volatiles with significantly larger outputs during the day or during the night [12,13,14,15,16], suggesting a circadian regulation of scent emission. The circadian clock genes LATE ELONGATED HYPOCOTYL in petunia (PhLHY) and NaLHY and ZEITLUPE (NaZTL) in Nicotiana attenuata have been investigated and control the timing of emission of methyl benzoate and benzyl benzoate in petunia and benzyl acetone in N. attenuata [17,18]. Thus, a default pathway controlled by petal identity may activate floral scent emission, and the fine tuning in terms of emission timing should be regulated by the clock. However, this emerging hypothesis requires further experimental support; the studies mentioned have analyzed a small number of volatile organic compounds (VOCs), but the effect, if any, of the circadian clock on scent profiles is not known.
In this work, we have analyzed the down-regulation of the petunia gene ortholog of ZTL and its effect on growth and scent emission. We found that PhZTL plays a differential role in stem and floral size and is a major coordinator of floral scent profiles in petunia. As a result, we named the gene CHANEL (PhCHL).

2. Materials and Methods

2.1. Gene Identification and Phylogenetic Analysis

We identified ZTL orthologs and paralogs in the Petunia genome using BLAST [19]. The identified scaffolds and cDNAs were used to confirm the genome annotation using Genewise [20]. Protein alignment was performed with CLUSTALX [21]. Phylogenetic analysis was performed with the R libraries ape and phangorn [22,23], using the Maximum Likelihood as statistical method, JTT (Jones, Taylor and Thornton) as model of amino acid substitution, and 1000 bootstrap replicates. Trees were visualized and annotated with ggtree [24] using R, (R version 3.5.1). Protein accessions are listed in Table S1.

2.2. Silencing of PhCHL

We obtained sequence information from the genomic clone of PhCHL (Peaxi162Scf01124g00126.1) found in W115 (or Mitchell) and amplified 255 bp encompassing the last nine coding codons and 3′untranslated region. As the major effect of silencing of ZTL in petunia was a major disruption of scent profiles, we called it CHANEL, a famous perfume. The specific sequence of PhCHL was:
>PhCHL
TGAACTATCTTTAGCAAGCTCTGTCATTTGAATAAAGAAAAAAGTAATGATGAAGAGAAGGTGTTGTGCAGTATTCATAATGAAAATTTTGCCTCAAGAATAAAGAGAGTCCCGAGCAAACTATTGCAGTGCGGTTTTTGCATTGCACCAAATGCATAAATGACTAGCAAGTACCTGTGAGTTAGTGGCTGTCTTGTTTATTCTTGTGTGGCTCATATGCCATGGTGAGCAAATGGTCCTATTGAGCAGATGGTC
We used primers, introducing a partial attb1 and attb2 recombination site for GATEWAY cloning using PhCHLrnaiaattb1 and PhCHLrnaiattb2 (Table S2). We performed a second PCR using attb1 and attb2 to add the corresponding sequences for recombination. The amplified fragment was recombined into pDONR221 and into the GATEWAY vector pHELLSGATE12 to obtain a hairpin construct [25]. The pHELLSGATE12 drives the hairpin construct using a standard 35S promoter. The W115 Mitchell double haploid was transformed as described previously [7].
Transformed plants were identified by PCR with primers amplifying NPTII. The completeness of the construct was tested with the Agri 51 and Agri 56 primers [26] (see Table S2). The PCR conditions were 3 min at 95 °C followed by 35 cycles of 15 s at 95 °C, 15 s at 55 °C and 15 s at 72 °C, and terminated by 5 min at 72 °C (Kapa Biosistems). The PCR reactions were loaded on 1% agarose gel containing ethydium bromide. PCR products from T2 plants were purified and sequenced.

2.3. Plant Growth Conditions and Sampling

Petunia plants were grown using a commercial substrate in a greenhouse under natural conditions. All experiments were conducted with at least three biological replicates. To study the expression of PhCHL, non-transgenic siblings and two independent RNAi:PhCHL T2 lines (RNAi:PhCHL3 and RNAi:PhCHL10) were transferred to a climate chamber with 12 h of light and 12 h of dark (12LD) or 8L:16D and 23 °C and 18 °C for day and night, respectively. Plants were acclimated for 4–5 days. Young leaves and petals from 2–3 day-old flowers were sampled every three h for 24 h; tissues were immediately frozen in liquid nitrogen and stored at -80 °C until further analysis.
To analyze the floral scent of non-transgenic and transgenic petunia flowers, we took at least three biological replicates of 2–3 day-old flowers (one flower per plant) every three h.

2.4. Housekeeping Genes and Gene Expression Analysis by qPCR

RNA was extracted from three biological replicates per time point of leaves and corollas using acid phenol [27]. Concentrations were measured using NanoDrop (Thermo-Fisher). Equal amounts of total RNA were used to obtain cDNA using Maxima kits (Thermo-Fisher) according to the user manual.
Previously, we performed a study to validate the housekeeping gene or genes, in two tissue samples, petal and leaf, for time course studies according to [28]. The candidate genes were ACTIN 11 (ACT), CYCLOPHILIN (CYP), ELONGATION FACTOR 1α (EF1α), GLYCALDEHYDE-3-PHOSPHATE DEHYDROGENASE (GADPH), RIBOSOMAL PROTEIN S13 (RPS13), GTP-NUCLEAR BINDING PROTEIN (RAN1) and POLYUBIQUITIN (UBQ) (Table S2). PCR analysis was performed as described previously [28]. The following protocol was used for 40 cycles: 95 °C for 5 s, 60 °C for 20 s and 72 °C for 15 s (Clontech SYBR Green Master Mix and Mx3000P qPCR Systems, Agilent Technologies), samples were run in duplicate. Cycle threshold (Ct) values were analyzed by BestKeeper [29], NormFinder [30], geNorm [31] and comparative ΔCt methods [32] implemented in the web-based tool RefFinder [33] at different time points (Figure S1).
Analyzing all tissues, the most stable genes were PhCYP and PhEF1α (Figure S2A). Moreover, for individual tissues, results were slightly different: the best genes for normalization in leaves were PhACT and PhEF1α, and for petals, PhACT and PhCYP (Figure S2B,C).
We used PhACT to normalize the expression of clock genes in petunia leaves and petals as described [34]. Normalized expression was calculated as described [34] using the REST program [29] and PhACT as internal control gene.
Primers for circadian clock genes were designed using pcrEfficiency [35] (Table S2) and the following protocol was used for 40 cycles: 95 °C for 5 s, 60 °C for 20 s and 72 °C for 15 s. Samples were run in duplicate. Primer combinations were tested with genomic DNA from Mitchell, and we found that all of them gave a single copy DNA on agarose gels. The endpoint PCR was further verified by melting point analysis where all primer combinations gave a single peak of melting (Figure S3).

2.5. Image Acquisition

We used an image acquisition system described previously [36]. Plants were grown inside a growth chamber comprising LED lights covering from UV to red light. Day and night images were taken by activating an Infrared light at 840 nm wavelength during short intervals of time (3 s). Images were acquired every ten minutes with an artificial vision camera comprising two CCD sensors, a multichannel 24-bit RGB absorbing at 610 nm, 540 nm and 460 nm, and a monochromatic sensor capturing at 800 nm. The acquired images have a resolution of 1296 × 966 pixels.
We obtained data using transgenic lines and compared them to the segregating siblings. Leaf growth and movement in seedlings was recorded for a period of 12 days with a total of 1728 images. Stem and flower growth was recorded for a period of 5 days and 16 h for line 3 and 3 days for line 10, for a total of 822 images and 432 images respectively. Using a semi-automatic procedure, we measured the length and angle of the longitudinal axis as referred to the horizontal plane of the flowers, as well as the length of the stem. The acquisition intervals were 1 hour for line 3 and 2 h for line 10, to explore differences in flower and stem growth patterns between wild-type and transgenic individuals. Analysis of growth was performed using the R package grofit [37]. Graphics were done using the color-blind friendly palette.

2.6. Scent Analysis

Flowers were placed in a glass beaker with a solution 4% of glucose inside a desiccator. Emitted volatiles were collected with twisters from the headspace every three h and analyzed by GM/CS as described [16]. Total and relative amounts were calculated using total integrated area divided by fresh weight as described before [38]. Detection of rhythmic scent emission was performed using the JTK_CYCLE algorithm [39] implemented in the R package MetaCycle [40]. Scent profile figures were plotted using the R library ggplot2 [41], using color palettes providing by the package viridis [42].

3. Results

3.1. The Petunia Genomes Have a Single ZTL Gene

We mined the petunia genomes to identify ZEITLUPE/FLAVIN-BINDING KELCH REPEAT F-BOX (ZTL/FKF) orthologs and paralogs using BLAST. We found two genes with homology to the Arabidopsis genome in P. axillaris: Peaxi162Scf01124g00126.1 and Peaxi162Scf00655g00114.1; and three in P. inflata: Peinf101Scf01230g02037.1, Peinf101Scf02808g00015.1 and Peinf101Scf04186g00007.1 (Table S3).
We performed a phylogenetic reconstruction of the genes found in petunia and compared them to the LOV-F-box-KELCH proteins from several monocots, dicots and the basal plant Marchantia polymorpha (Figure S4). As previously mentioned, the silencing of PhCHL caused a major change in the composition of floral scent. Thus, we named the gene CHANEL (PhCHL) (see below).
The phylogenetic reconstruction shows two major clades, one containing all the FKF)-like genes and a second one comprising the ZTL and the Arabidopsis LOV KELCH PROTEIN2 (LKP2). In both clades, two subclades separate monocots from dicots. The Marchantia FKF like gene [43] falls somewhere between the FKF group of coding genes and the ZTL coding set of genes. The genomes of P. axillaris and P. inflata appear to have one gene corresponding to PhCHL, but differ in the copy number of FKF that is found in two copies in P. inflata. According to the ancestral region by gene analysis of Petunia hybrida W115, the ZTL-FKF genes present in P. hybrida correspond to P. axillaris [19]. Thus, based on the phylogenetic reconstruction, we identified Peaxi162Scf01124g00126.1 as PhCHL and Peaxi162Scf00655g00114.1 as PhFKF.

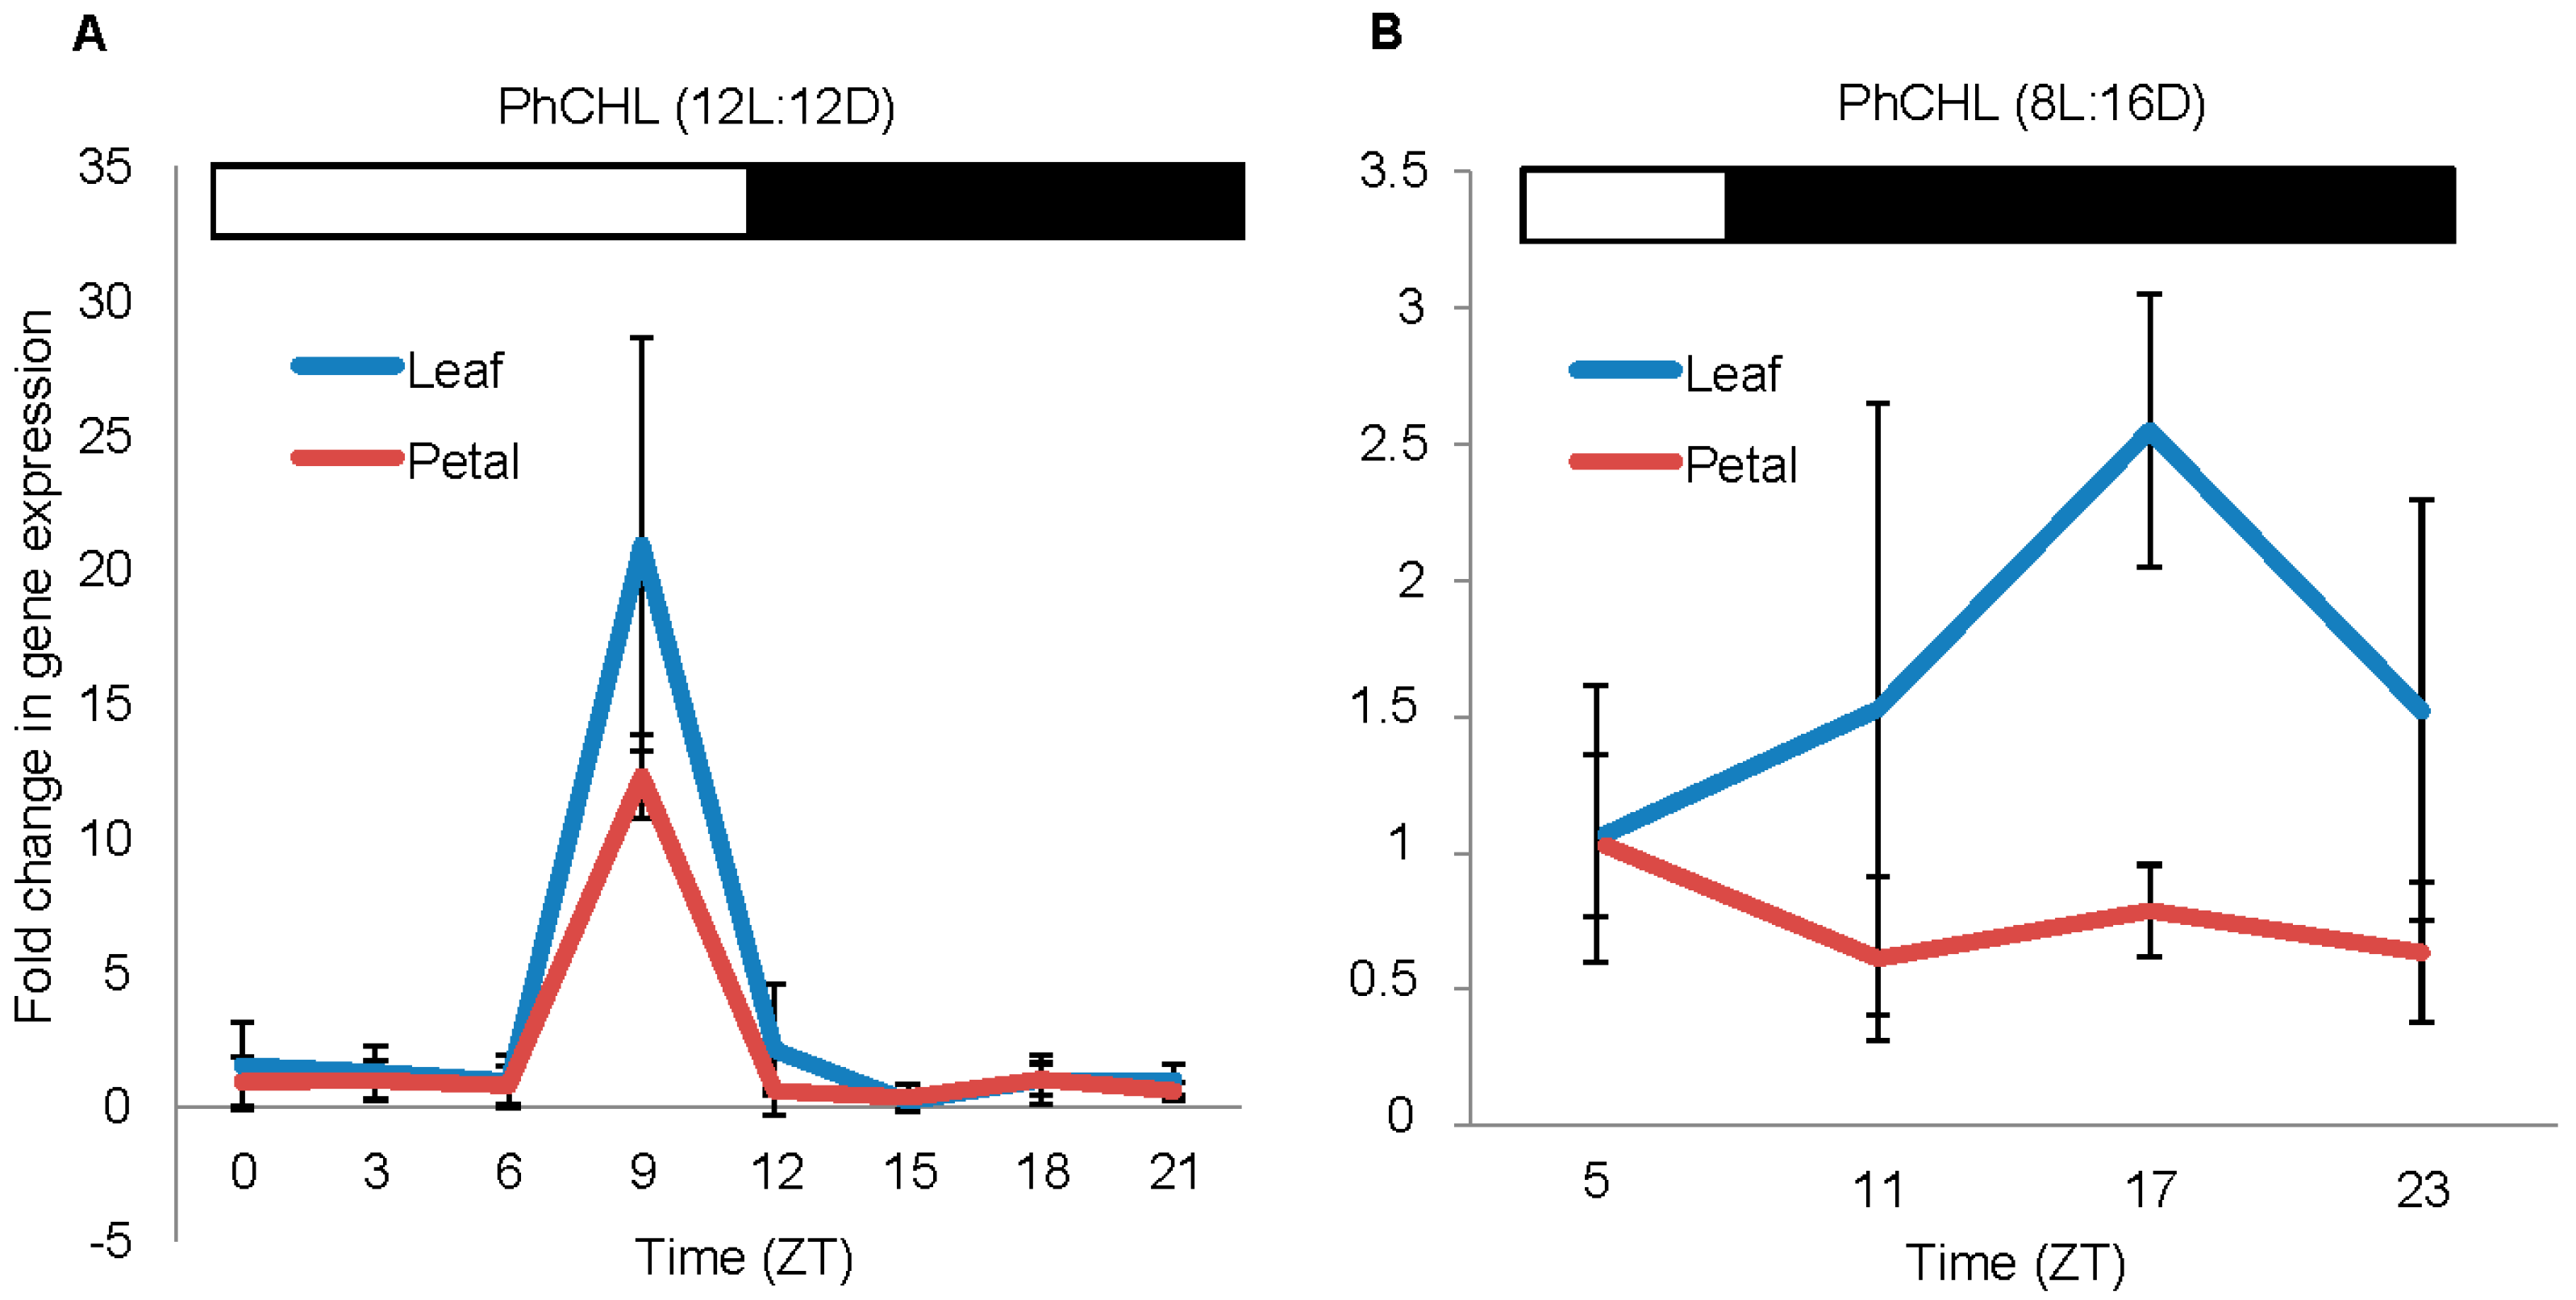
3.2. The Expression of PhCHL is Organ Specific and Affected by Day Length

The PhCHL expression has been studied in leaves and seedlings of Nicotiana attenuata and Arabidopsis [17,44,45]. In these plants and tissues, PhCHL does not show rhythmic expression. We determined the set of reference genes for circadian expression in leaves and petals in order to establish the circadian gene expression patterns in petunia (see Materials and Methods). We analyzed the expression of PhCHL in petunia corolla using a 12:12 LD light regime and found that the expression had its maximum at ZT9 (Figure 1A). We found that the expression at ZT9 was significantly higher, and the lowest expression occurred at ZT15. Although the expression of PhCHL in corollas showed a peak at ZT9, the mathematical analysis for circadian oscillation using the JTK_CYCLE algorithm indicated that the expression of PhCHL in petunia corollas was not rhythmic (p = 1). We also analyzed the expression of PhCHL in leaves and the pattern was similar to corollas: PhCHL increased at ZT9 (Figure 1A), and its expression was not rhythmic (p = 1). Under short days (8L:16D), the expression of PhCHL in leaves reached its maximum at midnight (ZT17) while the maximum expression in petals was detected during the afternoon (ZT5) (Figure 1B). As observed under 12L:12D, PhCHL did not display a rhythmic expression either in leaves or petals (p > 0.05).

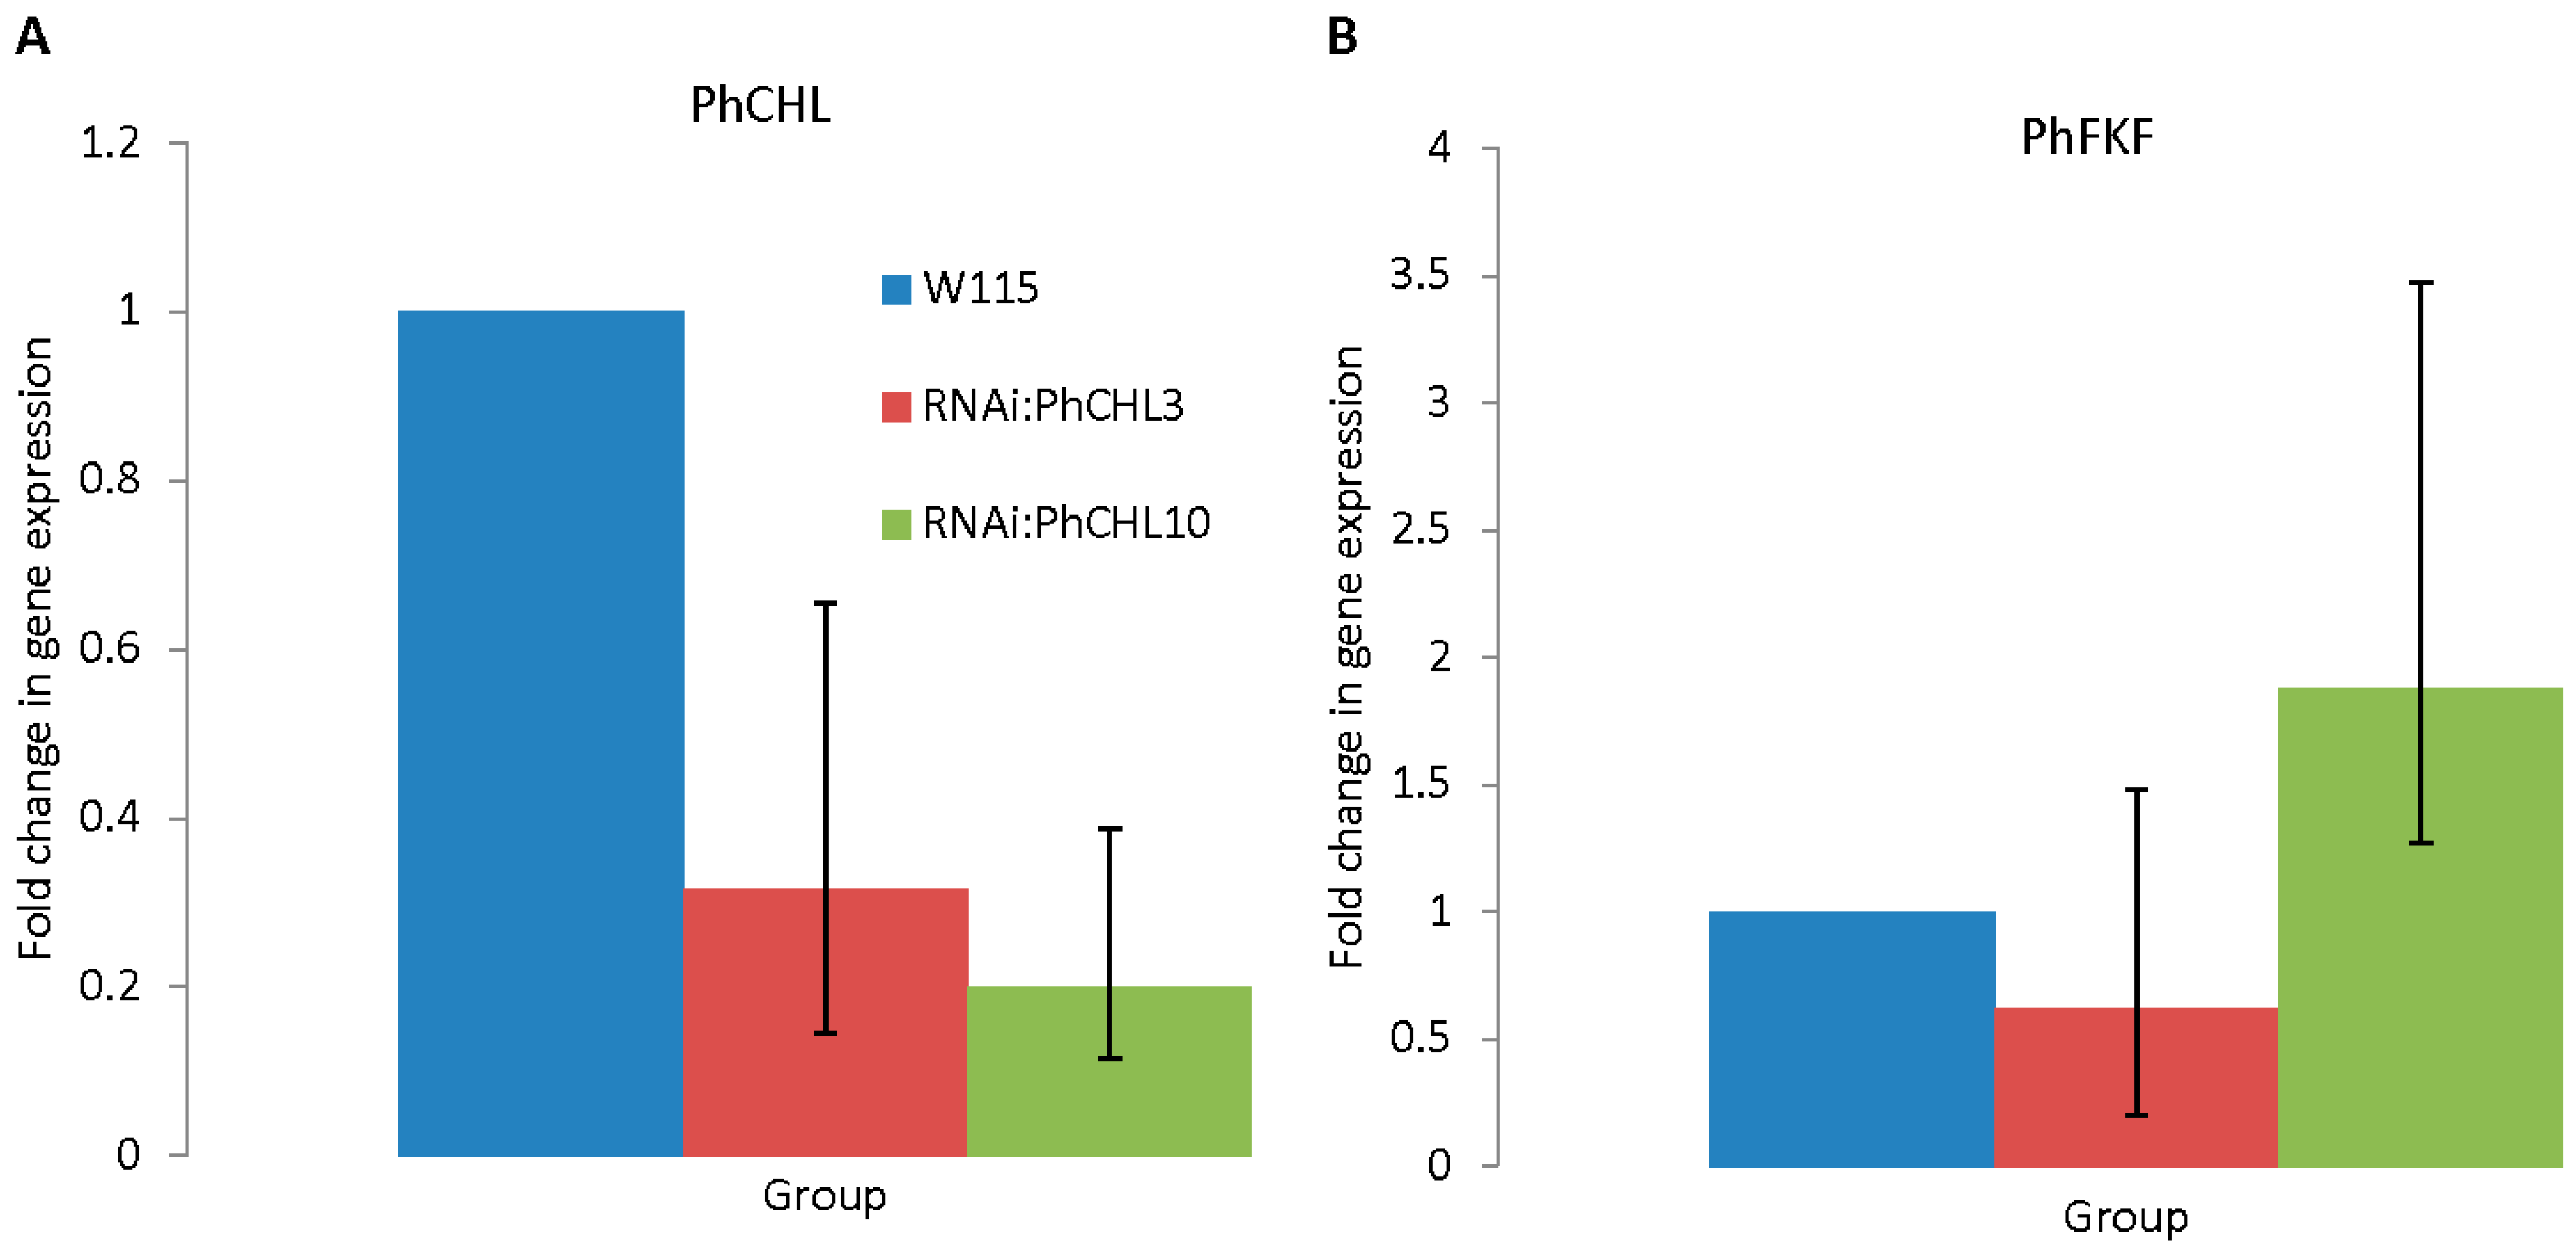
3.3. Silencing PhCHL Does Not Affect PhFKF

We knocked down PhCHL using a RNAi hairpin construct and found significant down regulation of ZTL in several lines. We used two lines for further analysis. RNAi:PhCHL10 showed a down regulation of 80% (p = 0.032), while RNAi:PhCHL3 showed a downregulation of 68% (p = 0.047) (Figure 2A). We also analyzed the expression of FLAVIN-BINDING KELCH REPEAT F-BOX 1 (PhFKF), to discard co-silencing of the paralogous genes (ZT5). The expression of PhFKF did not differ significantly between transgenic and non-transgenic petunias (Figure 2B).

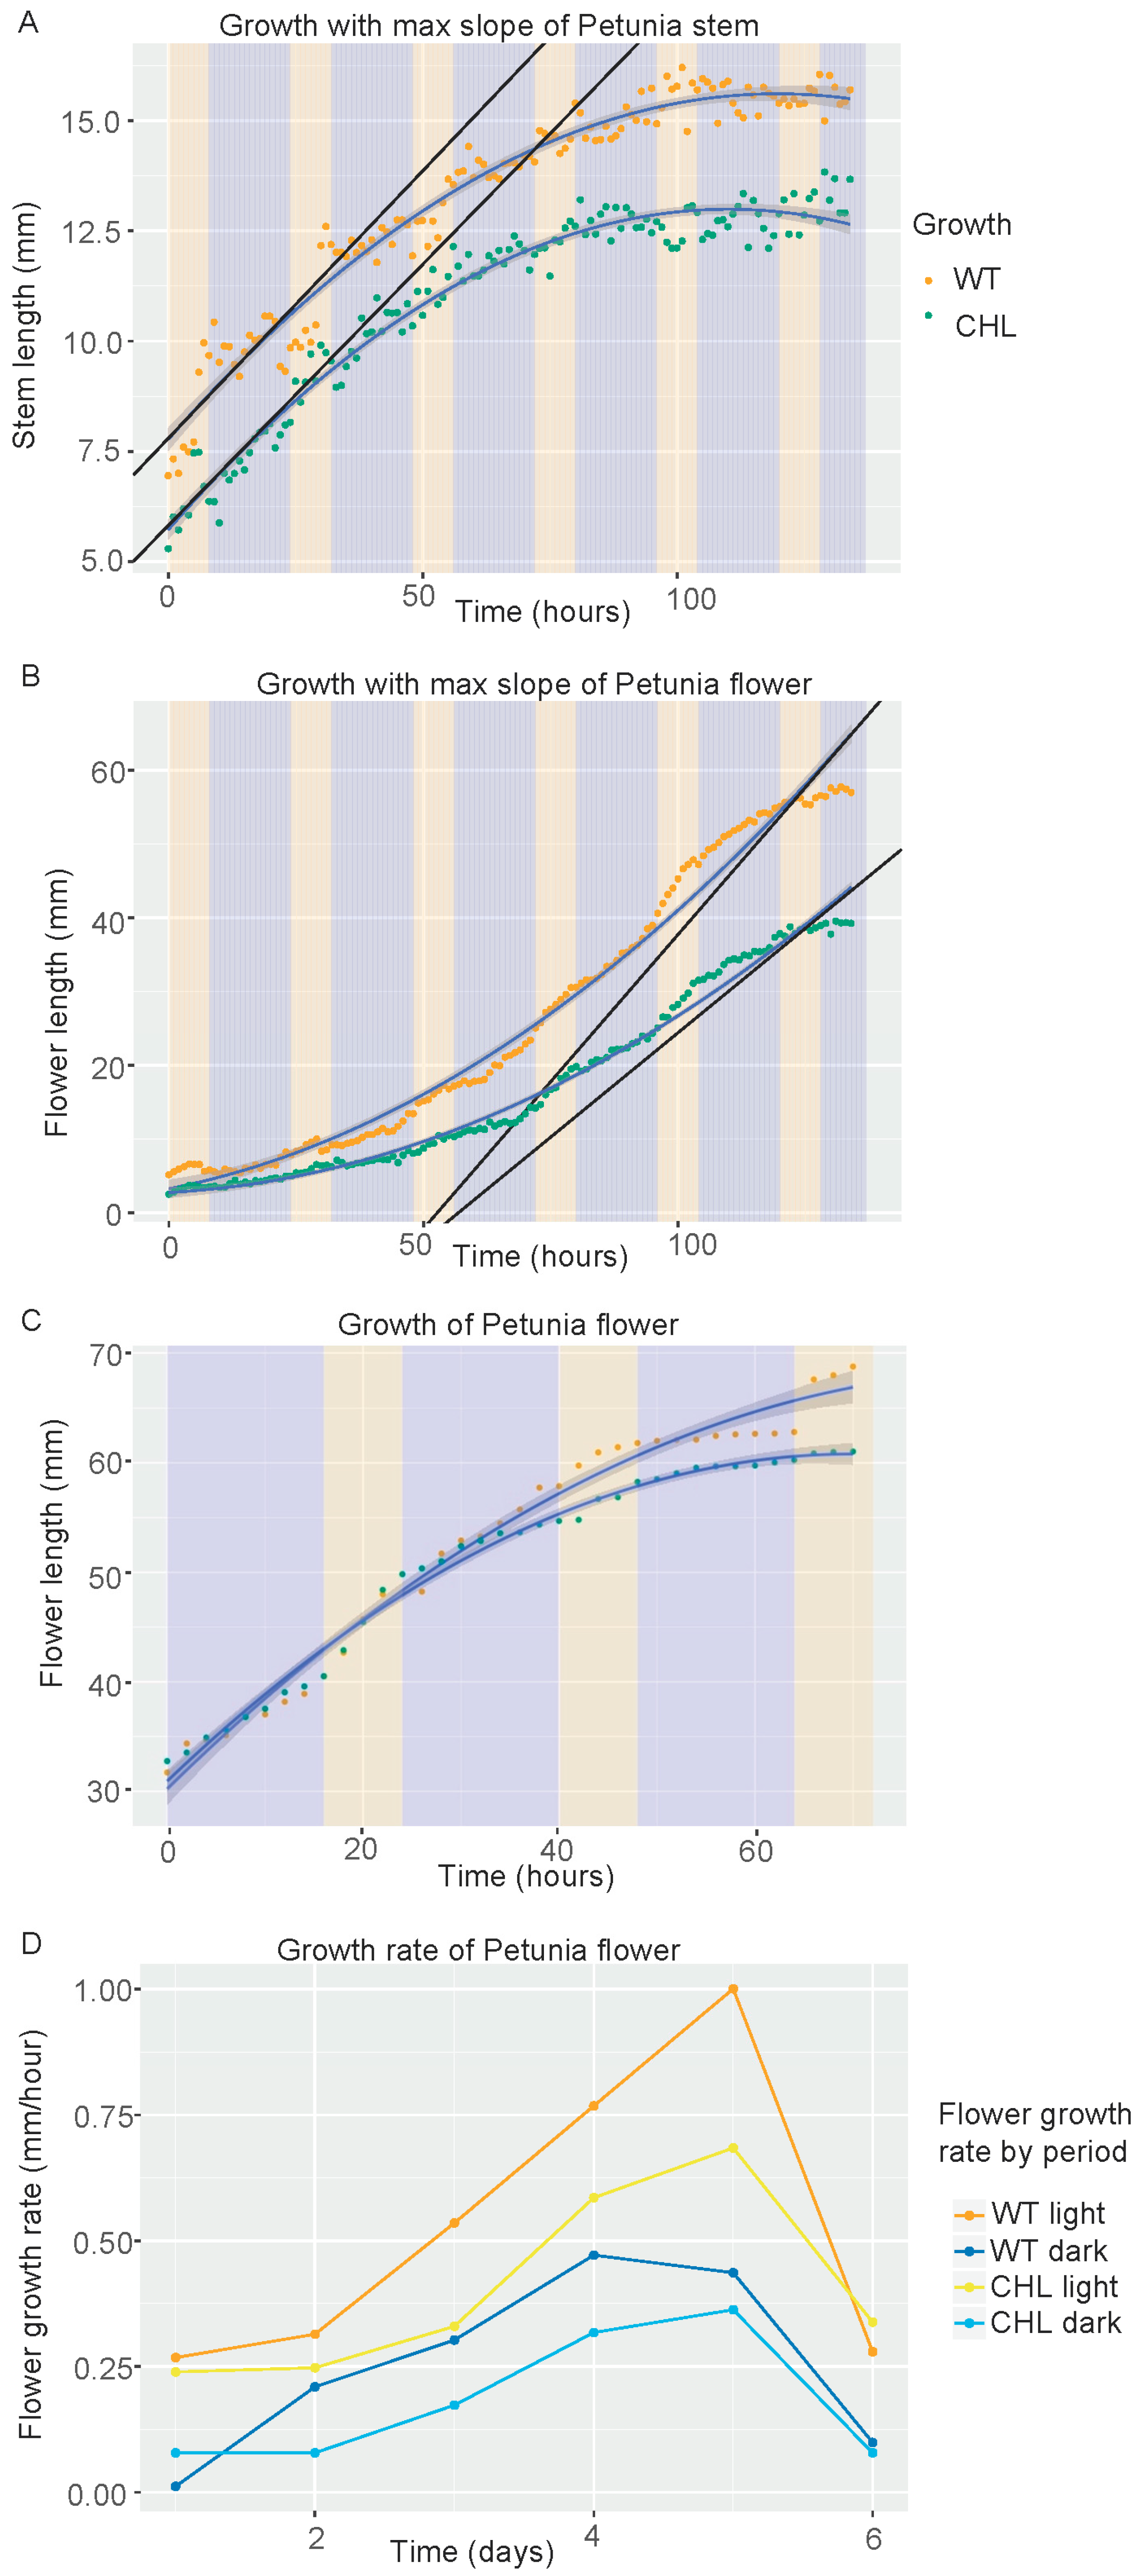
3.4. PhCHL Is a Positive Regulator of Lateral Organ Growth

We quantified the effect of RNAi:PhCHL on plant development and found that while not all parameters analyzed showed statistically significant changes, in general terms, PhCHL appears to play a role in the production of above ground biomass affecting organ size (Table 1). Thus, RNAi:PhCHL plants were significantly shorter than the non-transgenic siblings by roughly 23%. We analyzed floral size by measuring the length of the tube and the maximum expansion of the limb and found that, while the tube length was not always affected, the limb expansion was significantly reduced by RNAi:PhCHL, with size changes in the range of 12–18% (Table 1). Finally, we did not find differences in chlorophyll content (Table 1) or in the general canopy architecture i.e., number of branches (data not shown).
We can conclude that RNAi:PhCHL is a positive regulator of lateral organ size with a pleiotropic effect causing a decrease in shoot and flower size.

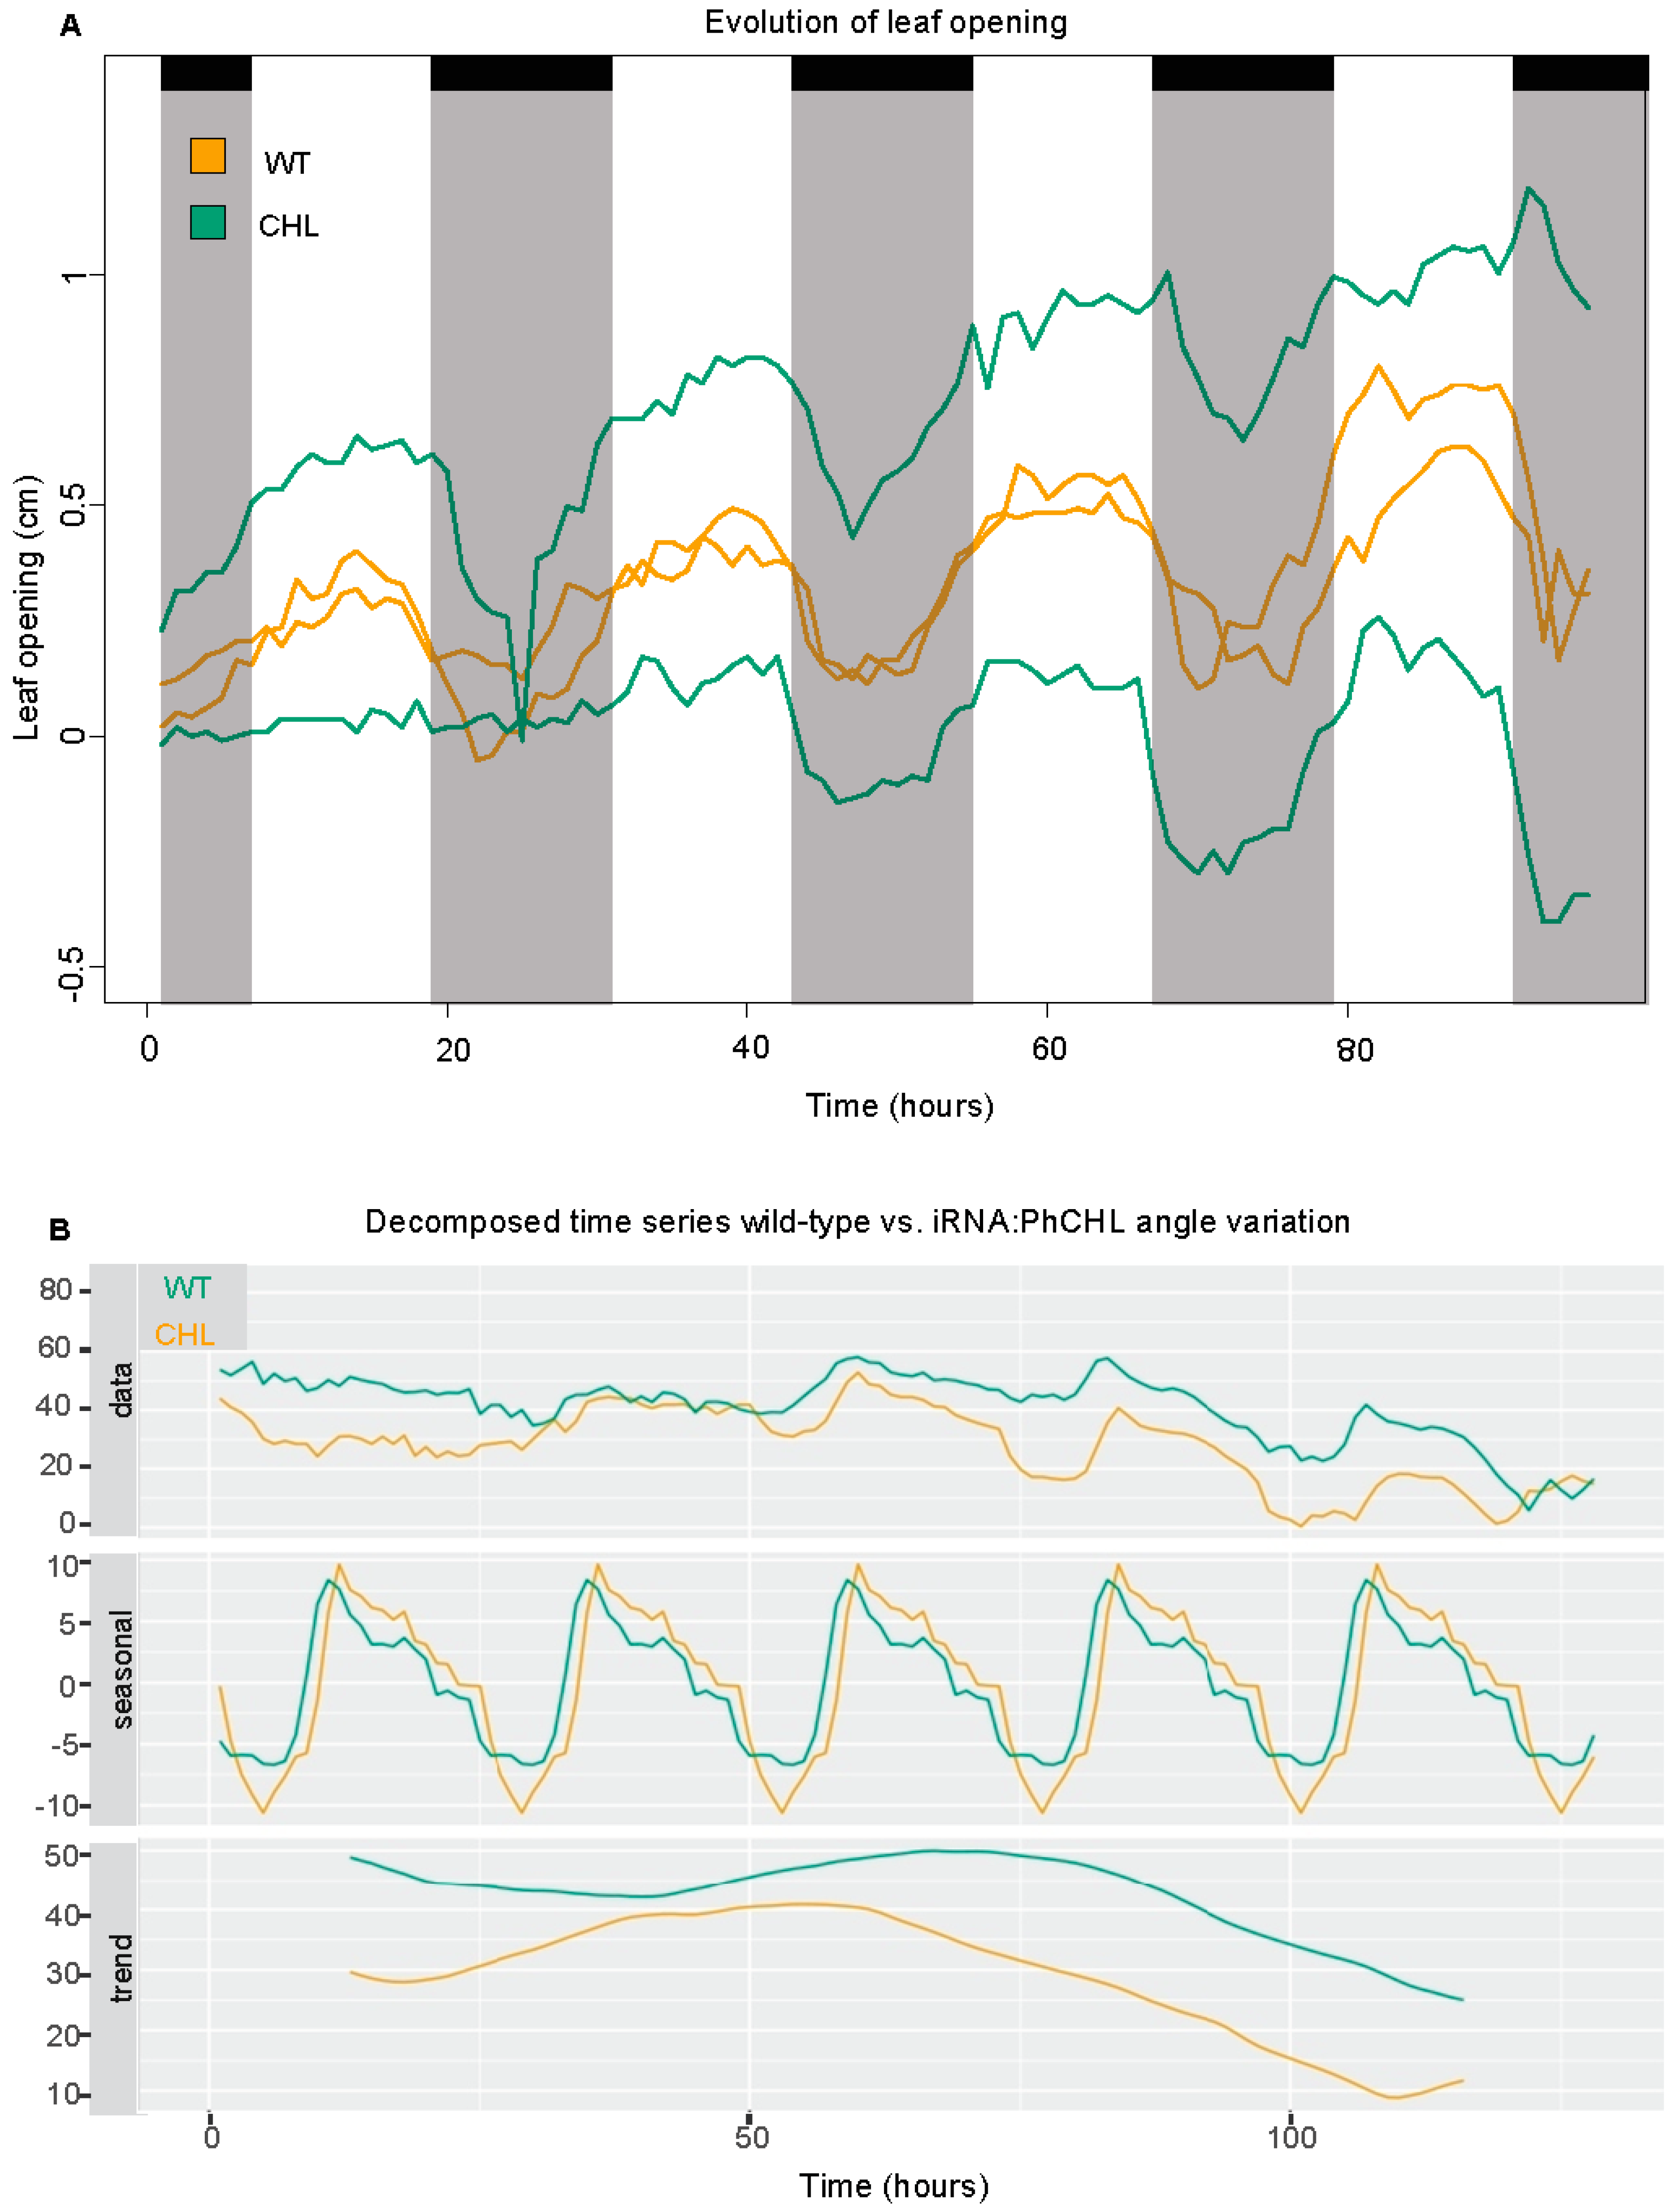
3.5. PhCHL Is Involved in Flower Angle Changes but Not Leaf Movement

As size was negatively affected by RNAi:PhCHL (Table 1), we used a phenomics approach with time lapse image acquisition to identify the effects on growth kinetics [46]. We tried to analyze leaf growth in seedlings; however, leaf movement, a trait under light and circadian control, was so extreme that we could not obtain reliable data for growth (Movie S1). Changes in leaf position appeared to correspond to day/night changes. We measured the changes in leaf position every hour for a period of four days. We found that both non-transgenic and transgenic lines had open leaves during the day and closed leaves during the night (Movie S1). The changes in leaf opening and closing, in terms of speed or timing were not affected by the PhCHL expression levels (Figure 3A). Indeed, a mathematical analysis of the period, lag phase and amplitude did not show significant differences between RNAi:PhCHL and wild type (Table S4).
We analyzed flower angle against the horizontal axis, as it is a parameter related to pollination that is regulated by NaZTL in Nicotiana attenuata [17]. Both wild-type and transgenic lines had a similar daily pattern of flower movement; however, RNAi line 3 flowers had always higher angles than the non-transgenic siblings. A decomposed time series showed that their daily changes in angle were slightly advanced compared to wild type (Figure 3B).

3.6. Differential Effect of PhCHL on Stem and Flower Growth Rate

The difference in overall plant size indicated a role of PhCHL in plant growth. We analyzed stem growth and found that growth curves (Table 2) were similar in wild-type and transgenic plants (Figure 4A; Table 2). Still, maximal growth speed in transgenic line 3 was 80.7% compared to wild type and area under the curve was 82%. The data indicates that stems are shorter because growth occurs during shorter periods of time, but growth speed appears to be less affected in the stem (see discussion).
We analyzed the increase in flower length. Down regulation of PhCHL caused a strong decrease in flower growth speed in line 3 (Movie S2). The wild-type flowers had an overall growth speed that was always higher than in transgenic lines (Figure 4B). We calculated the differences in growth speed and found that the maximal slope indicating growth speed was 1.4-fold higher in wild type compared to transgenic line 3 (Table 2). We analyzed line 10, but due to flowering time differences, we were able to obtain data only from older flowers. These flowers also grew at a lower speed than wild type, but differences were not so pronounced (Movie S3) (Figure 4C).
Growth of hypocotyls in Arabidopsis is gated by the plant circadian clock [47]. We tested the hypothesis that petunia flowers may grow at different speeds during day and night. Indeed, we found that overall flower growth speed was higher during the day than during the night, coming to a sharp decrease in growth speed when flowers open (Figure 4D). The flowers corresponding to RNAi:PhCHL always grew slower than the wild types, but the time required to become fully developed was not affected by PhCHL (Figure 4D). Altogether, our data shows that PhCHL plays a role in organ growth speed and duration that is organ-specific.

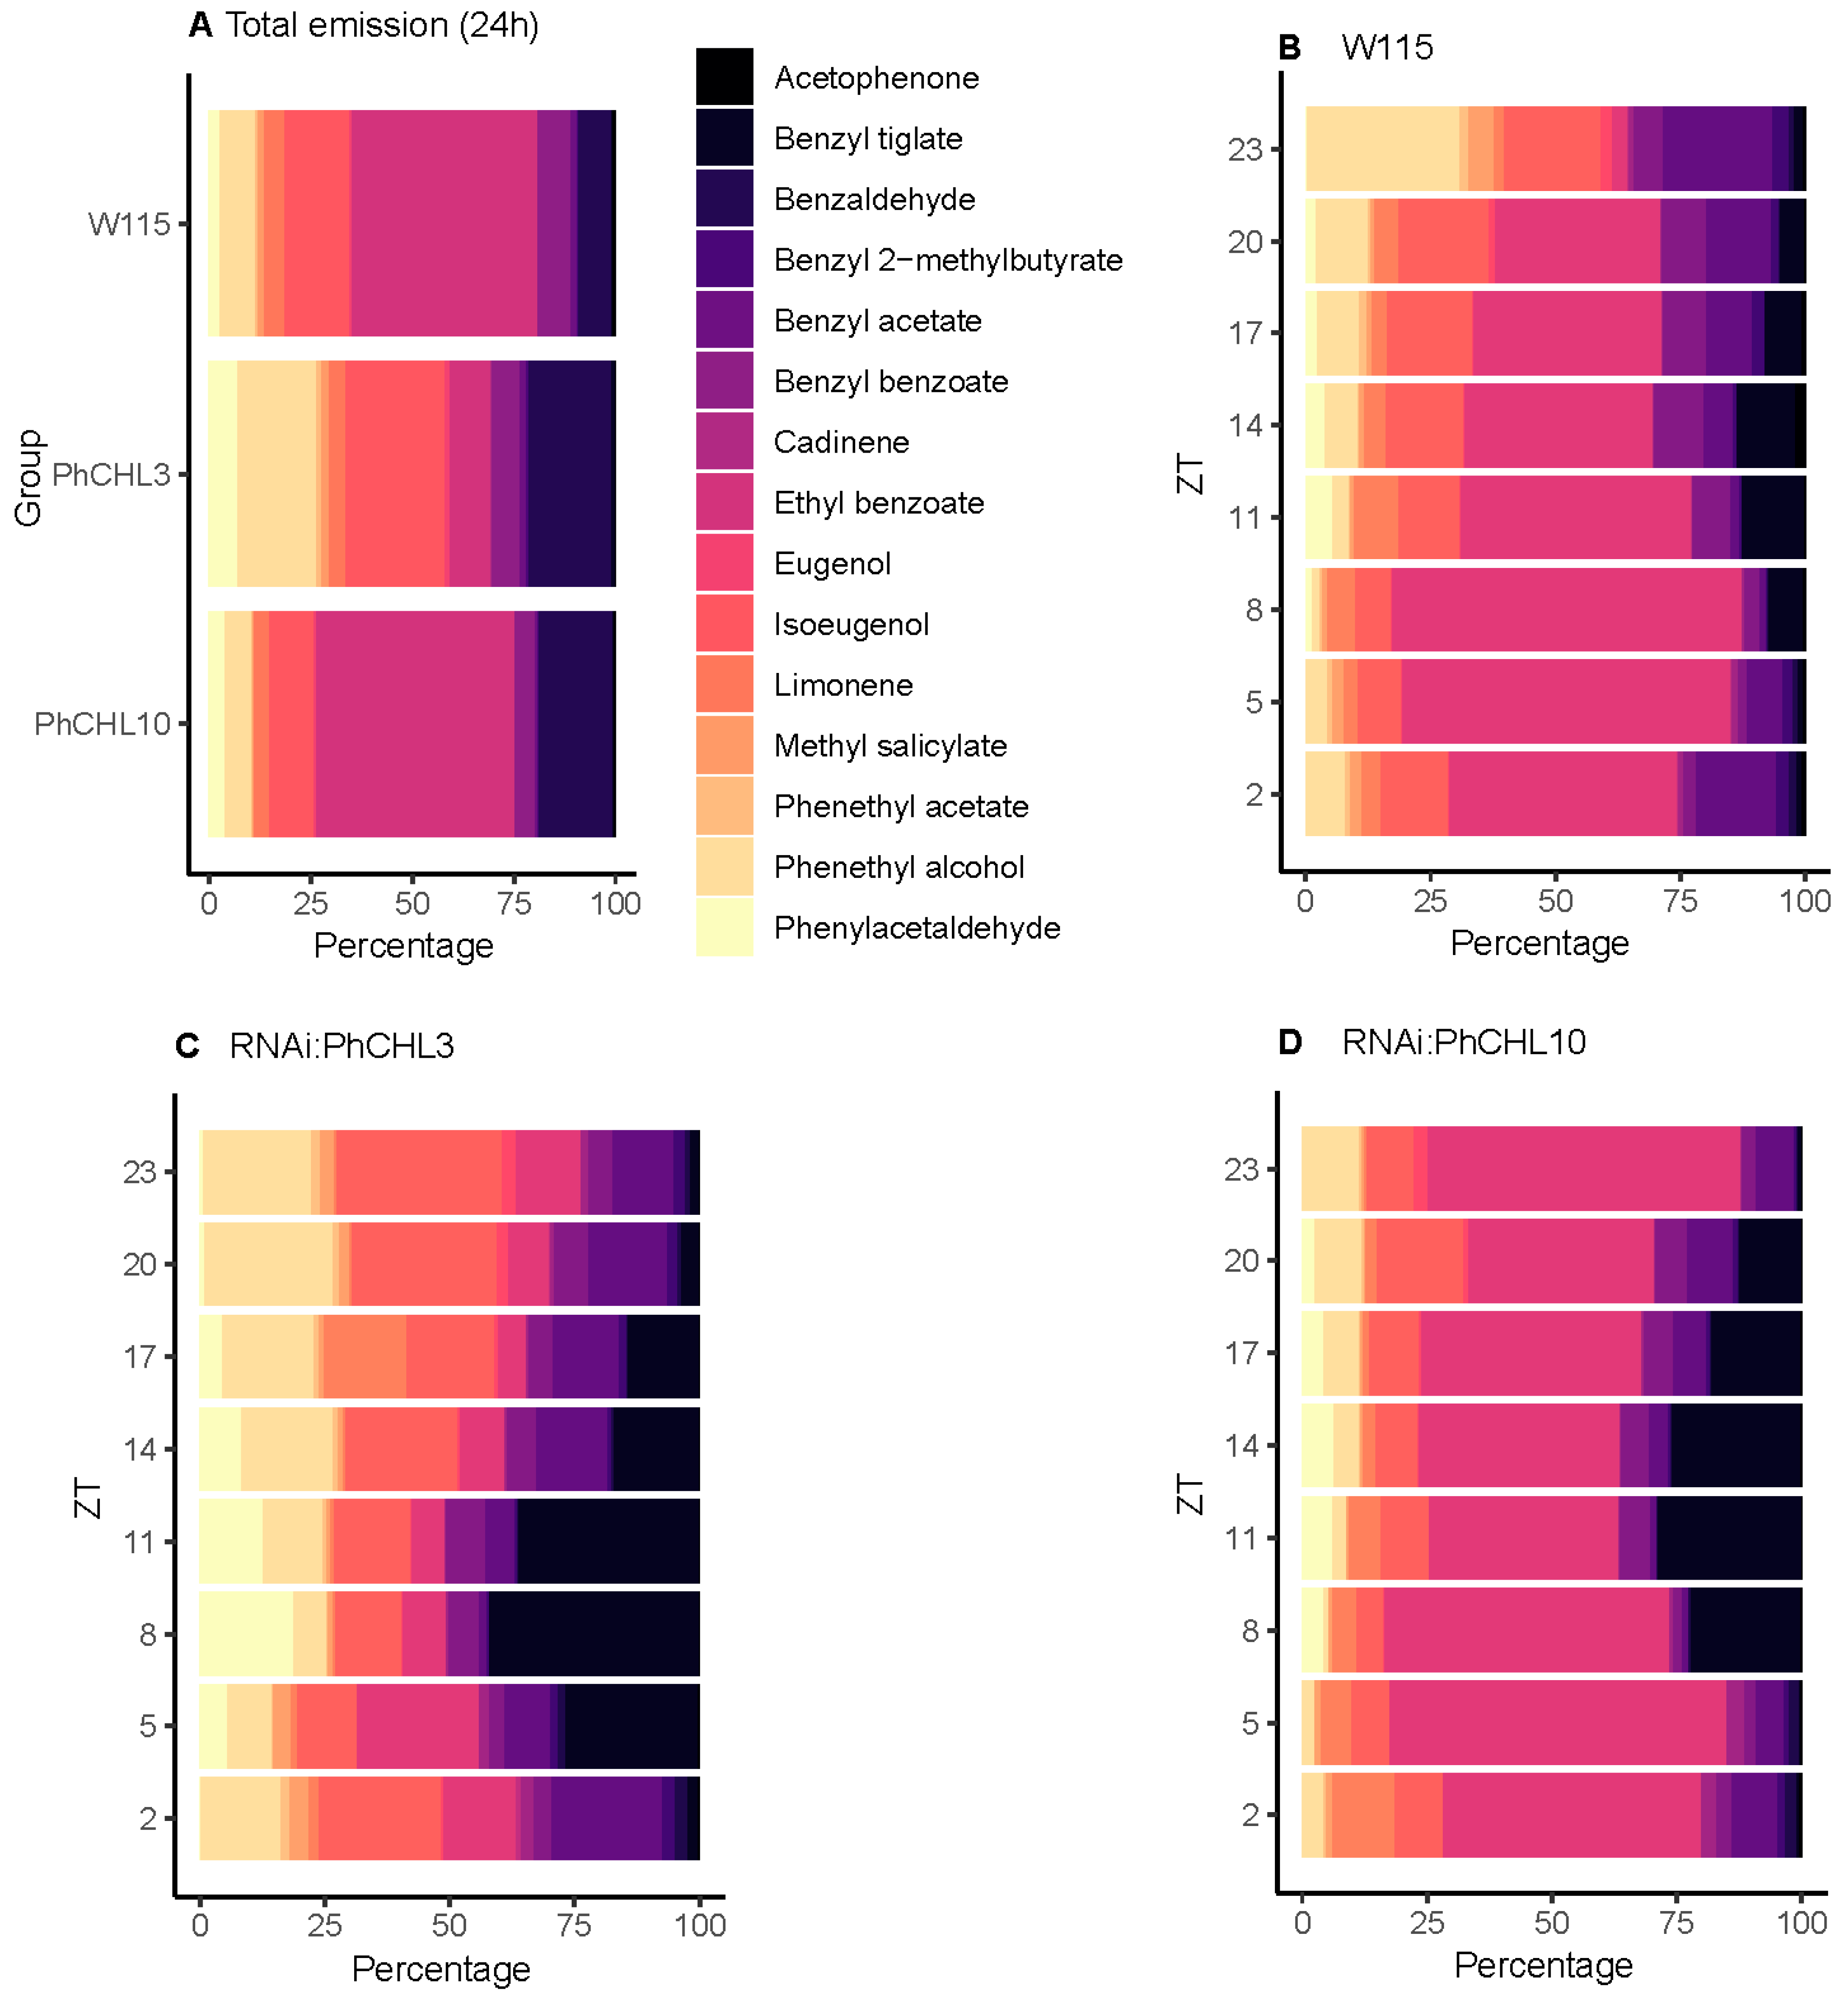
3.7. PhCHL Coordinates Daily Changes in Scent Profiles

Petunia flowers emit mostly benzenoids/phenylpropanoids, including methyl benzoate, benzaldehyde and benzyl benzoate [48]. We also identified emission of terpenoids, cadinene and limonene. We selected 17 volatile organic compounds (VOCs) to analyze the effect of PhCHL silencing in volatile emission for a 24-hour period (Table 3). The major VOC emitted by P. hybrida was methyl benzoate (74.90% of selected volatiles) whereas cadinene was the volatiles with the lowest emission (0.02% of selected compounds). Methyl benzoate was also the principal emitted volatile in transgenic lines: 79.1% in RNAi:PhCHL3 and 58.51% in RNAi:PhCHL10 petunia flowers. The volatile with the lowest emission was acetophenone for RNAi:PhCHL3 (0.01%) and cadinene for RNAi:PhCHL10 (0.018%). Due to the high emission of methyl benzoate in all petunia lines, we analyzed the volatile profile excluding this compound (Figure 5, Figure S5A).
Excluding methylbenzoate (Figure S5A), the second-highest emitted volatile was ethyl benzoate in wild-type petunia and RNAi:PhCHL10 line (45.72% and 48.61% of selected compounds, respectively). In contrast, the emission of ethyl benzoate was lower in RNAi:PhCHL3 (10.23%) and the second major volatile in this transgenic line was isoeugenol (24.38%). Isoeugenol represented 15.84% in wild type and 10.92% in RNAi:PhCHL10 (Figure 5A). We found that certain volatiles increased their emission in both RNAi:PhCHL lines: benzaldehyde, phenylacetaldehyde, benzyl tiglate and benzyl 2-methylbutyrate (Figure 5A). The volatiles limonene, benzyl benzoate and acetophenone decreased their emission in RNAi:PhCHL3 and RNAi:PhCHL10 petunia flowers (Figure 5A) Finally, the quantities of some emitted volatiles varied among lines; the emission of benzyl acetate, cadinene, methyl salicylate, phenethyl acetate and phenethyl alcohol was higher in RNAi:PhCHL3, whereas the quantities of these compounds decreased in the RNAi:PhCHL10 line (Figure 5A).
As the quantitative changes in scent could occur at different times of the day, we collected scent every three h in an 8L:16D cycle. The profile analysis of floral compounds throughout 24 h revealed modifications in the contribution of single compounds to the scent profile.
Methyl benzoate was the major emitted compound by non-transgenic and transgenic petunia flowers. Its contribution to the floral scent varied from 69 to 79% in wild-type petunias, (Figure S5B), from 73 to 87% in RNAi line 3 (Figure S5C) and from 46% to 71% in RNAi line 10 (Figure S5D). Methyl benzoate tended to decrease during the light period in wild-type and RNAi:PhCHL10 plants, in contrast in RNAi:PhCHL3 the highest contribution to the floral scent occurred at ZT5 (Figure S5B–D).
As mentioned above, we excluded methyl benzoate to analyze the temporal variation in scent emission profiles of those volatiles with lower emission. Briefly, in the wild-type plants, benzyl 2-methylbutyrate contribution to the scent profile increased during the light period (ZT2, ZT5). Cadinene, had the highest contribution at dawn and transition to day light (ZT23-ZT2). In contrast, the VOCs benzaldehyde, ethyl benzoate, limonene and phenylacetaldehyde showed their major contribution to the scent composition at dusk and early night (ZT8, ZT11). Acetophenone and benzyl benzoate displayed their highest contribution to the flower aroma at midnight (ZT14, ZT17). Finally, benzyl alcohol, benzyl acetate, eugenol, isoeugenol, methyl salicylate, phenethyl alcohol and phenethyl acetate percent composition was higher at late night (ZT20, ZT23) (Figure 5B).
When we analyzed the floral scent composition in RNAi petunias, three types of changes in the scent profile were observed. A set of volatiles showed similar profiles to the wild type (Figure 5B–D). These included of benzaldehyde, benzyl 2-methylbutyrate, cadinene, eugenol, isoeugenol and phenethyl alcohol. A second set of volatiles showed increased production during th late night and dawn (ZT23) as in wild type but did not decay during the light period (ZT2). Finally, acetophenone that had its maximal emission at midnight (ZT14–ZT17) and methyl salicylate (ZT20–ZT23) shifted their maxima to the light period at ZT2–ZT5.
These changes in timing of emission are reflected in the different quantitative combinations of VOCs found between wild-type and transgenic lines. Indeed, at the time when lights went off at ZT8, ethyl benzoate was the second important emitted volatile in W115 (70% of selected volatiles), decreasing in RNAi:PhCHL10 to 57% and RNAi:PhCHL3 to 8.7%. The VOCs acetophenone and phenenthyl alcohol also decreased their emission in both transgenic lines. In contrast, benzaldehyde emission increased in both transgenic lines from 6.85% W115 (6.85%) to 41.8% in RNAi:PhCHL3 and 22.1% t in RNAi:PhCHL10. Phenylacetaldehyde also increased its emission in both RNAi:PhCHL3 (18.7%) and RNAi:PhCHL10 (4.3%) as petunia this volatile only represented a 1.4% of the profile in the wild-type (Figure 5B–D). When the lights went on at ZT0, scent also differed in transgenic and non-transgenic petunia flowers. The predominant compounds in the wild-type scent profile were phenethyl alcohol (30.5%), benzyl alcohol (21.9%) and isoeugenol (19.3%). In contrast, the major compounds in RNAi:PhCHL3 were isoeugenol (33%), phenethyl alcohol (21.8%) ethyl benzoate (12.7%) meanwhile in RNAi:PhCHL10 were ethyl benzoate (62.7%), phenethyl alcohol (11.4%) and isoeugenol (9.6%) (Figure 5B–D).

3.8. PhCHL Is Required for Timing of Scent Profiles

Petunia is considered a nocturnal plant; its scent emission is synchronized with pollinator activity. We analyzed the circadian rhythmicity of scent emission and the effect of silencing the gene PhCHL. In wild-type plants, benzaldehyde, benzyl acetate, benzyl alcohol, benzyl benzoate, eugenol, isoeugenol, methyl benzoate, phenylacetaldehyde, phenethyl acetate and phenethyl alcohol were rhythmically emitted (p < 0.05), while acetophenone, benzyl 2-methylbutyrate, benzyl tiglate, cadinene, limonene, ethyl benzoate and methyl salicylate turned out to be arrhythmic (p > 0.05) (Table 4). In the RNAi plants, most compounds emitted in a rhythmic fashion in wild type were emitted in a rhythmic manner (Table 4). Moreover, benzyl tiglate, benzyl 2-methylbutyrate and methyl salicylate were not rhythmically emitted both in W115 and RNAi:PhCHL10 line oscillated significantly in RNAi:PhCHL3 petunias (Table 4).
We also analyzed the phase or time point with the highest emission of selected volatiles. Most compounds increased their emission during the dark period, and we classified the volatiles according to their maximum emission. In the wild-type petunia, first group comprised benzyl tiglate and cadinene, which showed their peaks during the subjective day (ZT2 and ZT5, respectively). The second group included the volatiles ethyl benzoate and acetophenone, that reached its maximum emission at early night (ZT11 and ZT12.5, respectively). The third group consisted of those VOCs which peaked at midnight, from ZT15 to ZT18.5: benzaldehyde, benzyl acetate, limonene, isoeugenol, methyl benzoate and phenylacetaldehyde. Finally, the fourth group included benzyl 2-methylbutyrate, benzyl acetate, benzyl alcohol, eugeno, methyl salicylate, phenethyl acetate and phenethyl alcohol, that showed their maximum emission at late night (ZT20 to ZT23) (Table 4).
Analyzing the phase of emitted volatiles in transgenic lines revealed important differences. We found four types of behavior. First, the volatiles benzyl acetate, eugenol and phenethyl acetate did not change their peak in wild-type and transgenic petunias (Table 4). Second, benzyl benzoate, cadinene and ethyl benzoate delayed their maximum emission in both transgenic lines (Table 4). Third, acetophenone, benzyl alcohol and phenethyl alcohol displayed an advanced phase in RNAi:PhCHL plants (Table 4). Finally, a group of volatiles did not follow the same pattern in RNAi:PhCHL3 and RNAi:PhCHL10 lines; benzyl 2-methylbutirate and isoeugenol did not change their peak in RNAi:PhCHL3 compared to W115 petunias whereas these compounds were emitted in advanced in the line RNAi:PhCHL10; on the other hand, the compounds benzaldehyde and methyl benzoate peaked at the same time in non-transgenic and RNAi:PhCHL10 petunias but in the RNAi:PhCHL3 line this peak was advanced (Table 4).
Altogether, PhCHL plays a fundamental role in coordinating floral scent profile of petunia that could be related to the timing of maximal production of different VOCs. The effect on single compounds appears to be opposite in some cases, suggesting a control of scent pathway at one of several points that we do not understand yet.

4. Discussion

The ZTL gene in Arabidopsis plays a central role in the circadian clock regulation and affects several traits such as flowering time [45], and in Nicotiana it also controls flower daily movement and the emission of benzyl acetone [17]. Here we have performed a systematic study of PhCHL, the ortholog of ZTL, and its outputs in Petunia hybrida, uncovering several unreported functions.
The ZTL/FKF/LKP2 proteins are blue light receptors in Arabidopsis. The expression of ZTL is not rhythmic in Arabidopsis or Nicotiana [44,45]. While PhCHL showed a clear peak of expression in 12L:12D, we could not find a significant rhythm, indicating a conserved expression pattern with other plants where it has been analyzed. This is the first time that PhCHL, a ZTL ortholog, has been analyzed in petals. The similarity of expression of PhCHL in leaves and petals indicates that the leaf and petal clock may be partly conserved. However, this needs further analysis with more genes, as clock transcriptional structure has been shown to change in roots, pods or seeds [49,50].
One of the classical experiments in Chronobiology in plants was performed by d’Ortous de Mairan. He demonstrated that leaf movement was rhythmic and endogenous [51]. Leaf angle and leaf movement have been widely studied in crops, including soybean and maize [52,53] and in the canonical model Arabidopsis. The analysis of circadian clock mutants in Arabidopsis revealed that the clock genes GIGANTEA (GI) and EARLY FLOWERING 4 (ELF4) are required to maintain leaf movement rhythmicity [54,55]. In petunia, we detected periodic changes in leaf position but diel changes in position were not affected by the down-regulation of PhCHL. This result suggests that PhCHL did not play a critical role in leaf rhythms at early stages of development.
The first apparent effect of down-regulating PhCHL was a decrease in plant body size. A detailed analysis using time lapse images showed that the stem of wild-type plants and siblings knocked down for PhCHL grew at similar speed. This suggests that the identified decrease in shoot length maybe the result of smaller primordia, decreased growth duration or a combination of both phenomena. In contrast, petal development appeared to be affected in growth rate. Furthermore, petal growth occurred at higher rates during the day than during the night both in wild-type and transgenic plants, suggesting that gated growth of flowers was independent of PhCHL. Work in Arabidopsis and maize has shown that the process of growth rate and duration maybe differentially affected by mutations [56,57,58]. Our results show that measuring two different organs may yield different results related to growth rate and duration. The plant circadian clock appears to have an organ specific resetting in roots, pods and seeds [50,59,60,61]. In this context, shoot growth is driven by the shoot apical meristem while flowers have undergone major organ identity reprogramming. As both cell division and expansion are under direct control of the clock [62,63], our results indicate a somewhat different interpretation of loss of PhCHL in stems and flowers.
We performed a complete scent profile analysis in wild-type and knockdown lines. Floral scent comprised 98.66% benzenoids/phenylpropanoids and 1.34% terpenoids in wild-type petunias. This composition was somewhat similar in transgenic lines, indicating that the effects of PhCHL are not specific for a single volatile family of compounds. The emission of several phenylpropanoids/benzenoids compounds, such as methyl benzoate, benzyl alcohol, benzyl benzoate o benzaldehyde, displayed a rhythmic oscillation whereas acetophenone or ethyl benzoate (phenylpropranoids/benzenoids) and the terpenoids cadinene and limonene did not. In addition, the amount of emitted volatiles tended to increase and peak during the dark phase, coinciding with petunia pollinators activity [64]. These results are similar to those described previously for whole flowers, indicating that petal volatiles and those emitted by other organs have similar control mechanism [14]. This suggests that the circadian clock plays a key role in the regulation of biosynthesis and emission of certain compounds that interacts and/or attracts pollinators. In contrast, volatiles which did not oscillate such as acetophenone, or terpenoids may play a role in defense [65,66].
The disruption of PhCHL shifted the maximum emission of benzyl alcohol was advanced whereas the peaks of benzyl benzoate and ethyl benzoate were delayed. Other volatiles, such as benzyl alcohol, eugenol and phenethyl acetate, were not affected by the knockdown of PhCHL. These results suggest that PhCHL was involved, directly or indirectly, in the emission pattern of certain volatiles. However complete knockouts for PhCHL may show a stronger effect in the volatiles affected and/or additional effects on those that appear to remain stable.
Flower fragrances play a complex biological role. The dominant nocturnal emitted volatiles of Petunia axillaris, benzaldehyde, benzyl alcohol and methyl benzoate, act as attractant of its nocturnal pollinator [64] whereas benzaldehyde has been described as a mild repellent [67]. On the other hand, the highest emitted compound by P. integrifolia is benzaldehyde [64]. In Petunia hybrida, the three major compounds were methyl benzoate, ethyl benzoate and isoeugenol. In contrast, the three principal released VOCs in RNAi:PhCHL3 were methyl benzoate, isoeugenol and benzaldehyde, while in RNAi:PhCHL10, they were methyl benzoate, ethyl benzoate and benzaldehyde. In addition, in the present work, we described how the proportion of the compounds emitted by wild-type and RNAi:PhCHL petunias changed throughout a 24 h period. Previous studies that covered the down-regulation of the clock genes LHY and ZTL in petunia and wild tobacco, have report a reduction in volatile emission and production [17,18]. Our results showed that silencing PhCHL modified blend ratios, resulting in a different scent profile. Changes in emission pattern and fragrance composition may have an effect in pollinator attraction, plant defense against herbivores and pathogens or plant-plant signaling [68,69,70]. Our work shows that PhCHL plays a major role in the quantities and timing of VOC emission, thus coordinating the proper composition and daily changes of scent blends.

Supplementary Materials

Supplementary materials are available online.

Author Contributions

M.I.T. designed experiments, performed experiments, performed formal data analysis, wrote, revised and edited the paper. F.P.S. designed experiments, developed the software, performed experiments, performed formal data analysis and revised and edited the paper. M.V.D.G. performed formal data analysis and revised and edited the paper. F.P.C. performed formal data analysis and revised and edited the paper. P.J.N. conceived and coordinated the study, designed experiments, developed the software, performed formal data analysis, revised and edited the paper, supervised this work and acquired funding. M.E.C. conceived and coordinated the study, designed experiments, performed formal data analysis, wrote, revised and edited the paper, supervised this work and acquired funding. J.W. conceived and coordinated the study, designed experiments, performed experiments, performed formal data analysis, revised and edited the paper, supervised this work and acquired funding. All authors revised and approved the final draft.

Funding

This research was funded by Fundación Seneca 19398/PI/14, 19895/GERM/15 and MC BFU-2017 88300-C2-1-R and BFU-2017 88300-C2-2-R.

Acknowledgments

We would like to acknowledge María José Roca for technical assistance.

Conflicts of Interest

The authors declare no conflict of interest. The funders had no role in the design of the study; in the collection, analyses, or interpretation of data; in the writing of the manuscript, or in the decision to publish the results.

References

  1. Barton, M.K. Twenty years on: The inner workings of the shoot apical meristem, a developmental dynamo. Dev. Biol. 2010, 341, 95–113. [Google Scholar] [CrossRef] [PubMed] [Green Version]
  2. Angenent, G.C.; Immink, R.G.H.; Kaufmann, K. The “ABC” of MADS domain protein behaviour and interactions. Semin. Cell Dev. Biol. 2010, 21, 87–93. [Google Scholar]
  3. Egea-Cortines, M.; Saedler, H.; Sommer, H. Ternary complex formation between the MADS-box proteins SQUAMOSA, DEFICIENS and GLOBOSA is involved in the control of floral architecture in Antirrhinum majus. EMBO J. 1999, 18, 5370–5379. [Google Scholar] [CrossRef] [PubMed]
  4. Honma, T.; Goto, K. Complexes of MADS-box proteins are sufficient to convert leaves into floral organs. Nature 2001, 409, 525–529. [Google Scholar] [CrossRef] [PubMed]
  5. Bernardello, G.; Anderson, G.J.; Stuessy, T.F.; Crawford, D.J. A survey of floral traits, breeding systems, floral visitors, and pollination systems of the angiosperms of the Juan Fernandez Islands (Chile). Bot. Rev. 2001, 67, 255–308. [Google Scholar] [CrossRef]
  6. Hepworth, J.; Lenhard, M. Regulation of plant lateral-organ growth by modulating cell number and size. Curr. Opin. Plant Biol. 2014, 17, 36–42. [Google Scholar] [CrossRef] [PubMed]
  7. Manchado-Rojo, M.; Weiss, J.; Egea-Cortines, M. Validation of Aintegumenta as a gene to modify floral size in ornamental plants. Plant Biotechnol. J. 2014, 12, 1053–1065. [Google Scholar] [CrossRef] [PubMed] [Green Version]
  8. Krizek, B.A. Ectopic expression AINTEGUMENTA in Arabidopsis plants results in increased growth of floral organs. Dev. Genet. 1999, 25, 224–236. [Google Scholar] [CrossRef]
  9. Kuluev, B.; Avalbaev, A.; Nurgaleeva, E.; Knyazev, A.; Nikonorov, Y.; Chemeris, A. Role of AINTEGUMENTA-like gene NtANTL in the regulation of tobacco organ growth. J. Plant Physiol. 2015, 189, 11–23. [Google Scholar] [CrossRef] [PubMed]
  10. Muhlemann, J.K.; Maeda, H.; Chang, C.Y.; Miguel, P.S.; Baxter, I.; Cooper, B.; Perera, M.A.; Nikolau, B.J.; Vitek, O.; Morgan, J.A.; et al. Developmental Changes in the Metabolic Network of Snapdragon Flowers. PLoS ONE 2012, 7, e40381. [Google Scholar] [CrossRef] [PubMed]
  11. Manchado-Rojo, M.; Delgado-Benarroch, L.; Roca, M.J.; Weiss, J.; Egea-Cortines, M. Quantitative levels of Deficiens and Globosa during late petal development show a complex transcriptional network topology of B function. Plant J. 2012, 72, 294–307. [Google Scholar] [CrossRef] [PubMed]
  12. Fenske, M.P.; Imaizumi, T. Circadian Rhythms in Floral Scent Emission. Front. Plant Sci. 2016, 7, 462. [Google Scholar] [CrossRef] [PubMed]
  13. Dudareva, N.; Murfitt, L.M.; Mann, C.J.; Gorenstein, N.; Kolosova, N.; Kish, C.M.; Bonham, C.; Wood, K. Developmental regulation of methyl benzoate biosynthesis and emission in snapdragon flowers. Plant Cell 2000, 12, 949–961. [Google Scholar] [CrossRef] [PubMed]
  14. Verdonk, J.C.; Ric de Vos, C.H.; Verhoeven, H.A.; Haring, M.A.; van Tunen, A.J.; Schuurink, R.C.; de Vos, C.H.R. Regulation of floral scent production in petunia revealed by targeted metabolomics. Phytochemistry 2003, 62, 997–1008. [Google Scholar] [CrossRef]
  15. Hendel-Rahmanim, K.; Masci, T.; Vainstein, A.; Weiss, D. Diurnal regulation of scent emission in rose flowers. Planta 2007, 226, 1491–1499. [Google Scholar] [CrossRef]
  16. Ruíz-Ramón, F.; Águila, D.J.; Egea-Cortines, M.; Weiss, J. Optimization of fragrance extraction: Daytime and flower age affect scent emission in simple and double narcissi. Ind. Crops Prod. 2014, 52, 671–678. [Google Scholar] [CrossRef]
  17. Yon, F.; Joo, Y.; Cort, L.; Rothe, E.; Baldwin, I.T.; Kim, S.; Kim, S. Silencing Nicotiana attenuata LHY and ZTL alters circadian rhythms in flowers. New Phytol. 2015, 203, 1058–1066. [Google Scholar] [CrossRef]
  18. Fenske, M.P.; Hewett Hazelton, K.D.; Hempton, A.K.; Shim, J.S.; Yamamoto, B.M.; Riffell, J.A.; Imaizumi, T. Circadian clock gene LATE ELONGATED HYPOCOTYL directly regulates the timing of floral scent emission in Petunia. Proc. Natl. Acad. Sci. USA 2015, 112, 9775–9780. [Google Scholar] [CrossRef] [Green Version]
  19. Bombarely, A.; Moser, M.; Amrad, A.; Bao, M.; Bapaume, L.; Barry, C.C.S.; Bliek, M.; Boersma, M.R.M.; Borghi, L.; Bruggmann, R.; et al. Insight into the evolution of the Solanaceae from the parental genomes of Petunia hybrida. Nat. Plants 2016, 2, 1–9. [Google Scholar] [CrossRef]
  20. Birney, E.; Clamp, M.; Durbin, R. GeneWise and Genomewise. Genome Res. 2004, 14, 988–995. [Google Scholar] [CrossRef] [Green Version]
  21. Larkin, M.A.; Blackshields, G.; Brown, N.P.; Chenna, R.; McGettigan, P.A.; McWilliam, H.; Valentin, F.; Wallace, I.M.; Wilm, A.; Lopez, R.; et al. Clustal W and clustal X version 2.0. Bioinformatics 2007, 23, 2947–2948. [Google Scholar] [CrossRef] [PubMed]
  22. Paradis, E.; Claude, J.; Strimmer, K. APE: Analyses of Phylogenetics and Evolution in R language. Bioinformatics 2004, 20, 289–290. [Google Scholar] [CrossRef] [PubMed] [Green Version]
  23. Schliep, K.P. Phangorn: Phylogenetic analysis in R. Bioinformatics 2011, 27, 592–593. [Google Scholar] [CrossRef]
  24. Yu, G.; Smith, D.K.; Zhu, H.; Guan, Y.; Lam, T.T.-Y. Ggtree: An r package for visualization and annotation of phylogenetic trees with their covariates and other associated data. Methods Ecol. Evol. 2017, 8, 28–36. [Google Scholar] [CrossRef]
  25. Helliwell, C.; Waterhouse, P. Constructs and methods for high-throughput gene silencing in plants. Methods 2003, 30, 289–295. [Google Scholar] [CrossRef]
  26. Hilson, P.; Allemeersch, J.; Altmann, T.; Aubourg, S.; Avon, A.; Beynon, J.; Bhalerao, R.P.; Bitton, F.; Caboche, M.; Cannoot, B.; et al. Versatile gene-specific sequence tags for Arabidopsis functional genomics: Trancript profiling and reverse genetics applications. Genome Res. 2004, 14, 26–2189. [Google Scholar] [CrossRef] [PubMed]
  27. Box, M.S.; Coustham, V.; Dean, C.; Mylne, J.S. Protocol: A simple phenol-based method for 96-well extraction of high quality RNA from Arabidopsis. Plant Methods 2011, 7, 7. [Google Scholar] [CrossRef]
  28. Mallona, I.; Lischewsky, S.; Weiss, J.; Hause, B.; Egea-Cortines, M. Validation of reference genes for quantitative real-time PCR during leaf and flower development in Petunia hybrida. BMC Plant Biol. 2010, 10, 4. [Google Scholar] [CrossRef] [PubMed]
  29. Pfaffl, M.W.; Tichopad, A.; Prgomet, C.; Neuvians, T.P. Determination of stable housekeeping genes, differentially regulated target genes and sample integrity: BestKeeper—Excel-based tool using pair-wise correlations. Biotechnol. Lett. 2004, 26, 509–515. [Google Scholar] [CrossRef] [PubMed]
  30. Andersen, C.L.; Jensen, J.L.; Orntoft, T.F. Normalization of real-time quantitative reverse transcription-PCR data: A model-based variance estimation approach to identify genes suited for normalization, applied to bladder and colon cancer data sets. Cancer Res. 2004, 64, 5245–5250. [Google Scholar] [CrossRef]
  31. Vandesompele, J.; De Preter, K.; Pattyn, F.; Poppe, B.; Van Roy, N.; De Paepe, A.; Speleman, F. Accurate normalization of realtime quantitative RT-PCR data by geometric averaging of multiple internal control genes. Genome Biol. 2002, 3, RESEARCH0034. [Google Scholar] [CrossRef] [PubMed]
  32. Silver, N.; Best, S.; Jiang, J.; Thein, S.L. Selection of housekeeping genes for gene expression studies in human reticulocytes using real-time PCR. BMC Mol. Biol. 2006, 7, 33. [Google Scholar] [CrossRef] [PubMed]
  33. Xie, F.; Xiao, P.; Chen, D.; Xu, L.; Zhang, B. miRDeepFinder: A miRNA analysis tool for deep sequencing of plant small RNAs. Plant Mol. Biol. 2012, 80, 75–84. [Google Scholar] [CrossRef] [PubMed]
  34. Schmittgen, T.D.; Livak, K.J. Analyzing real-time PCR data by the comparative CT method. Nat. Protoc. 2008, 3, 1101–1108. [Google Scholar] [CrossRef]
  35. Mallona, I.; Weiss, J.; Egea-Cortines, M. pcrEfficiency: A Web tool for PCR amplification efficiency prediction. BMC Bioinform. 2011, 12, 404. [Google Scholar] [CrossRef]
  36. Navarro, P.J.; Pérez, F.; Weiss, J.; Egea-Cortines, M. Machine learning and computer vision system for phenotype data acquisition and analysis in plants. Sensors 2016, 16, 641. [Google Scholar] [CrossRef]
  37. Kahm, M.; Hasenbrink, G.; Ludwig, J. Grofit: Fitting Biological Growth Curves with R. J. Stat. Softw. 2010, 33, 1–21. [Google Scholar] [CrossRef]
  38. Ruiz-Hernández, V.; Roca, M.J.; Egea-Cortines, M.; Weiss, J. A comparison of semi-quantitative methods suitable for establishing volatile profiles. Plant Methods 2018, 14, 67. [Google Scholar] [CrossRef] [PubMed]
  39. Hughes, M.E.; Hogenesch, J.B.; Kornacker, K. JTK_CYCLE: An efficient nonparametric algorithm for detecting rhythmic components in genome-scale data sets. J. Biol. Rhythm. 2010, 25, 372–380. [Google Scholar] [CrossRef] [PubMed]
  40. Wu, G.; Anafi, R.C.; Hughes, M.E.; Kornacker, K.; Hogenesch, J.B. MetaCycle: An integrated R package to evaluate periodicity in large scale data. Bioinformatics 2016, 32, 3351–3353. [Google Scholar] [CrossRef]
  41. Wickham, H. Ggplot2: Elegant Graphics for Data Analysis; Springer: Berlin/Heidelberg, Germany, 2016; ISBN 978-3-319-24277-4. [Google Scholar]
  42. Garnier, S.; Ross, N.; Rudis, B.; Sciaini, M.; Scherer, C. Viridis: Default Color Maps from “Matplotlib”; R Project: Vienna, Austria, 2018; R Package Version 0.5; Available online: https://cran.r-project.org/web/packages/viridis/index.html (accessed on 11 April 2019).
  43. Kubota, A.; Kita, S.; Ishizaki, K.; Nishihama, R.; Yamato, K.T.; Kohchi, T. Co-option of a photoperiodic growth-phase transition system during land plant evolution. Nat. Commun. 2014, 5, 3668. [Google Scholar] [CrossRef] [PubMed] [Green Version]
  44. Yon, F.; Seo, P.-J.; Ryu, J.Y.; Park, C.-M.; Baldwin, I.T.; Kim, S.-G. Identification and characterization of circadian clock genes in a native tobacco, Nicotiana attenuata. BMC Plant Biol. 2012, 12, 172. [Google Scholar] [CrossRef] [PubMed]
  45. Somers, D.E.; Schultz, T.F.; Milnamow, M.; Kay, S.A. ZEITLUPE encodes a novel clock-associated PAS protein from Arabidopsis. Cell 2000, 101, 319–329. [Google Scholar] [CrossRef]
  46. Navarro, P.J.; Fernández, C.; Weiss, J.; Egea-Cortines, M. Development of a configurable growth chamber with a vision system to study circadian rhythm in plants. Sensors 2012, 12, 15356–15375. [Google Scholar] [CrossRef] [PubMed]
  47. Nusinow, D.A.; Helfer, A.; Hamilton, E.E.; King, J.J.; Imaizumi, T.; Schultz, T.F.; Farré, E.M.; Kay, S.A.; Farre, E.M. The ELF4-ELF3-LUX complex links the circadian clock to diurnal control of hypocotyl growth. Nature 2011, 475, 398. [Google Scholar] [CrossRef] [PubMed]
  48. Amrad, A.; Moser, M.; Mandel, T.; de Vries, M.; Schuurink, R.C.; Freitas, L.; Kuhlemeier, C. Gain and Loss of Floral Scent Production through Changes in Structural Genes during Pollinator-Mediated Speciation. Curr. Biol. 2016, 26, 3303–3312. [Google Scholar] [CrossRef] [PubMed]
  49. Endo, M. Tissue-specific circadian clocks in plants. Curr. Opin. Plant Biol. 2016, 29, 44–49. [Google Scholar] [CrossRef] [Green Version]
  50. Weiss, J.; Terry, M.I.; Martos-Fuentes, M.; Letourneux, L.; Ruiz-hernández, V.; Fernández, J.A.; Egea-cortines, M. Diel pattern of circadian clock and storage protein gene expression in leaves and during seed filling in cowpea (Vigna unguiculata). BMC Plant Biol. 2018, 18, 33–53. [Google Scholar] [CrossRef]
  51. De Mairan, J.-J. Observation Botanique; Histoire de l’Académie Royale des Sciences Paris; Institut de France: Paris, France, 1729; p. 35. [Google Scholar]
  52. Ku, L.; Wei, X.; Zhang, S.; Zhang, J.; Guo, S.; Chen, Y. Cloning and Characterization of a Putative TAC1 Ortholog Associated with Leaf Angle in Maize (Zea mays L.). PLoS ONE 2011, 6, e20621. [Google Scholar] [CrossRef] [PubMed]
  53. Kao, W.-Y.; Tsai, T.-T. Tropic leaf movements, photosynthetic gas exchange, leaf δ13C and chlorophyll a fluorescence of three soybean species in response to water availability. Plant Cell Environ. 1998, 21, 1055–1062. [Google Scholar] [CrossRef] [Green Version]
  54. Park, D.H. Control of Circadian Rhythms and Photoperiodic Flowering by the Arabidopsis GIGANTEA Gene. Science 1999, 285, 1579–1582. [Google Scholar] [CrossRef] [PubMed]
  55. Doyle, M.R.; Davis, S.J.; Bastow, R.M.; McWatters, H.G.; Kozma-Bognar, L.; Nagy, F.; Millar, A.J.; Amasino, R.M. The ELF4 gene controls circadian rhythms and flowering time in Arabidopsis thaliana. Nature 2002, 419, 74–77. [Google Scholar] [CrossRef] [PubMed]
  56. Kennaway, R.; Coen, E.; Green, A.; Bangham, A. Generation of diverse biological forms through combinatorial interactions between tissue polarity and growth. PLoS Comput. Biol. 2011, 7, e1002071. [Google Scholar] [CrossRef]
  57. Beemster, G.T.S.; De Vusser, K.; De Tavernier, E.; De Bock, K.; Inze, D. Variation in growth rate between Arabidopsis ecotypes is correlated with cell division and A-type cyclin-dependent kinase activity. Plant Physiol. 2002, 129, 854–864. [Google Scholar] [CrossRef]
  58. Feys, K.; Demuynck, K.; De Block, J.; Bisht, A.; De Vliegher, A.; Inzé, D.; Nelissen, H. Growth rate rather than growth duration drives growth heterosis in maize B104 hybrids. Plant Cell Environ. 2017, 41, 374–382. [Google Scholar] [CrossRef] [PubMed] [Green Version]
  59. Thain, S.C.; Murtas, G.; Lynn, J.R.; McGrath, R.B.; Millar, A.J. The circadian clock that controls gene expression in Arabidopsis is tissue specific. Plant Physiol. 2002, 130, 102–110. [Google Scholar] [CrossRef] [PubMed]
  60. Bordage, S.; Sullivan, S.; Laird, J.; Millar, A.J.; Nimmo, H.G. Organ specificity in the plant circadian system is explained by different light inputs to the shoot and root clocks. New Phytol. 2016, 212, 136–149. [Google Scholar] [CrossRef] [PubMed] [Green Version]
  61. Voß, U.; Wilson, M.H.; Kenobi, K.; Gould, P.D.; Robertson, F.C.; Peer, W.A.; Lucas, M.; Swarup, K.; Casimiro, I.; Holman, T.J.; et al. The circadian clock rephases during lateral root organ initiation in Arabidopsis thaliana. Nat. Commun. 2015, 6, 7641. [Google Scholar] [CrossRef] [PubMed] [Green Version]
  62. Farré, E.M. The regulation of plant growth by the circadian clock. Plant Biol. 2012, 14, 401–410. [Google Scholar] [CrossRef]
  63. Fung-Uceda, J.; Lee, K.; Seo, P.J.; Polyn, S.; De Veylder, L.; Mas, P. The Circadian Clock Sets the Time of DNA Replication Licensing to Regulate Growth in Arabidopsis. Dev. Cell 2018, 45, 101–113. [Google Scholar] [CrossRef] [PubMed]
  64. Hoballah, M.E.; Stuurman, J.; Turlings, T.C.J.; Guerin, P.M.; Connétable, S.; Kuhlemeier, C.; Connetable, S.; Kuhlemeier, C. The composition and timing of flower odour emission by wild Petunia axillaris coincide with the antennal perception and nocturnal activity of the pollinator Manduca sexta. Planta 2005, 222, 141–150. [Google Scholar] [CrossRef] [PubMed] [Green Version]
  65. Unsicker, S.B.; Kunert, G.; Gershenzon, J. Protective perfumes: The role of vegetative volatiles in plant defense against herbivores. Curr. Opin. Plant Biol. 2009, 12, 479–485. [Google Scholar] [CrossRef]
  66. Pichersky, E.; Gershenzon, J. The formation and function of plant volatiles: Perfumes for pollinator attraction and defense. Curr. Opin. Plant Biol. 2002, 5, 237–243. [Google Scholar] [CrossRef]
  67. Junker, R.R.; Blüthgen, N. Floral scents repel potentially nectar-thieving ants. Evol. Ecol. Res. 2008, 10, 295–308. [Google Scholar]
  68. Aharoni, A. Terpenoid Metabolism in Wild-Type and Transgenic Arabidopsis Plants. Plant Cell Online 2003, 15, 2866–2884. [Google Scholar] [CrossRef] [PubMed]
  69. Yon, F.; Kessler, D.; Joo, Y.; Cortés Llorca, L.; Kim, S.G.; Baldwin, I.T. Fitness consequences of altering floral circadian oscillations for Nicotiana attenuata. J. Integr. Plant Biol. 2017, 59, 180–189. [Google Scholar] [CrossRef] [PubMed]
  70. Bhatia, V.; Maisnam, J.; Jain, A.; Sharma, K.K.; Bhattacharya, R. Aphid-repellent pheromone E-β-farnesene is generated in transgenic Arabidopsis thaliana over-expressing farnesyl diphosphate synthase2. Ann. Bot. 2015, 115, 581–591. [Google Scholar] [CrossRef] [PubMed]
Figure 1. PhCHL expression in W115 petunia under 12LD (A) and 8L16D cycle (B) in leaves (blue line) and petals (red line) revealed a different pattern depending on light conditions. The maximum expression ocurred before the dark period (ZT9) in leaves and petals under a 12LD cycle (A). This maximum was delayed in leaves under short days. PhCHL maintained its peak before dusk in petals (B). Results represent average ± standard deviation from three replicates. White bar indicates the light period and black bar, the dark period.
Cells 08 00343 g001
Figure 2. PhCHL (A) and PhFKF (B) expression in wild-type (blue bar) and RNAi:PhCHL plants (red bar and green bar) petals. PhCHL expression was significantly down-regulated in RNAi:PhCHL3 (p = 0.047) and RNAi:PhCHL10 (p = 0.032) compared to the wild-type (A). Silencing PhCHL did not affect PhFKF expression RNAi:PhCHL3 (p value = 0.6), RNAi:PhCHL10 (p value = 0.06) (B).
Cells 08 00343 g002
Figure 3. Down regulation of PhCHL does not affect leaf movement (A) The distance between the center of the plant and the end of each leaf is shown. Furthermore, these data correspond to the distance in the X axis. Negative values correspond to leaf positions where the tip of the leaf passed the center of the plant. Down regulation of PhCHL causes increased flower angles and advanced daily changes (green line, B). Orange line represents WT plants, green line represents RNAi:PhCHL plants.
Cells 08 00343 g003
Figure 4. Down regulation of PhCHL affects growth length in stems (A) and growth rate in flowers (B,C). Graphics show the raw data (points), the adjusted curve and confidence interval (grey shade). Orange line represents WT plants, green line represents RNAi:PhCHL plants. Yellow and blue areas indicated light and dark period, respectively. (D) Flower growth rate by period, day versus night in wild-type and RNAi:PhCHL transgenic lines.
Cells 08 00343 g004
Figure 5. Petunia scent profiles expressed as percentage. Due to its high emission, methyl benzoate was excluded to visualize the remaining volatiles. Profiles were determined for 24 h emission under a 8L:16D cycle for the wild-type (first bar) and the transgenic lines (second and third bar) (A) and in a time-course (BD), where each bar represent one sampling point (in ZT h) for wild-type (B), RNAi:PhCHL3 (C) and RNAi:PhCHL10 (D) petunia flowers.
Cells 08 00343 g005
Table 1. Phenotypic analysis of RNAi:PhCHL lines 3 and 10 and comparison to non-transgenic siblings in T2 generation. Plant height, floral limb and floral tube length were measured from RNAi:PhCHL lines (3, 10) and the wild-type W115. Results, in centimeters, represent average ± standard deviation. p-value < 0.05 indicates a significant difference between non-transgenic and transgenic plants, significance levels are indicated with one asterisks (* for p < 0.05), two asterisks (** for p < 0.001) and three asterisks (*** for p < 0.0001). NS indicates not significant differences.
MeasureRNAi:PhCHLW115p-Value
Line 3Line 10RNAi:PhCHL3 RNAi:PhCHL10
Plant height25.1 ± 1.8921.7 ± 4.1837.33 ± 3.00.070.022 *
Floral limb4.37 ± 0.444.76 ± 0.555.38 ± 0.290.00009 ***0.0038 **
Floral tube4.07 ± 0.374.81 ± 0.514.82 ± 0.350.00055 ***NS
Chlorophyll 39.43 ± 6.3236.65 ± 9.7739.30 ± 9.80NSNS
Table 2. Growth rate of petunia stems and flowers. Maximal growth is expressed in mm. Stems grew from day 0 and total growth refers to size achieved after 5 days and 16 h taking as reference the stem at time zero. Maximum growth for flowers refers to the same period but comprises the overall floral size. The maximum slope depicts growth rate while the area under the model (integral) gives an estimation of the overall difference in accumulated growth.
GroupRateMax.Growth/Std.ErrorMax.Slope/Std.ErrorArea under Model
WTStem growth16.084/0.1420.121/0.0051778.3
RNAi:PhCHLStem growth12.984/0.0960.118/0.0061471.53
WTFlower growth57.698/0.4030.798/0.0133598.88
RNAi:PhCHLFlower growth39.677/0.3440.566/0.0112328.95
Table 3. Retention time (RT) expressed in minutes, name and CAS number (assigned by the Chemical Abstract Services) of selected volatiles.
RTNameCAS
4.873Benzaldehyde100-52-7
6.435Limonene138-86-3
6.539Benzyl alcohol100-51-6
6.735Phenylacetaldehyde122-78-1
7.230Acetophenone98-86-2
7.825Methyl benzoate93-58-3
8.149Phenylethyl alcohol60-12-8
9.125Benzyl acetate140-11-4
9.244Ethyl benzoate93-89-0
9.668Methyl salicylate119-36-8
10.720Phenylethyl acetate103-45-7
12.287Eugenol97-53-0
12.711Benzyl 2-methylbutyrate56423-40-6
13.587Isoeugenol (isomers)97-45-1; 5932-68-3
14.254Benzyl tiglate37526-88-8
14.625Cadinene483-76-1
17.525Benzyl benzoate120-51-4
Table 4. Analysis of emitted volatiles with MetaCycle. The JTK_CYCLE algorithm implemented in the R library “MetaCycle” was used to detect rhythms in emitted volatiles of petunia wild-type (W115) and transgenic RNAi:PhCHL lines (PhCHL3, PhCHL10). Volatiles with significant p value (p value < 0.05) showed a rhythmic emission. Phase is defined as the time point, in ZT h, with the highest emission.
VolatileW115 p ValuePhasePhCHL3 p ValuePhasePhCHL10 p ValuePhase
Benzyl tiglate1.00020.0140.50.4765
Cadinene0.44550.246231.0009.5
Ethyl benzoate1.000111.000201.00020
Acetophenone1.00012.51.00080.21011
Benzaldehyde0.00015.50.00012.50.00015.5
Benzyl benzoate0.00115.50.023170.00117
Limonene0.16515.50.280171.00011
Phenylacetaldehyde0.00115.50.00012.50.00020
Methyl benzoate0.017170.00315.50.01117
Isoeugenol0.00118.50.00718.50.01417
Benzyl acetate0.003200.001200.00520
Eugenol0.001200.000200.01920
Methyl salicylate1.000200.009201.00015.5
Phenylethyl acetate0.048200.002200.00020
Phenylethyl alcohol0.000200.00018.50.00015.5
Benzyl alcohol0.00021.50.007200.00020
Benzyl 2-methylbutyrate1.000230.011230.1942

