The Snapdragon LATE ELONGATED HYPOCOTYL Plays A Dual Role in Activating Floral Growth and Scent Emission
by
 , , , and
Marta I. Terry
1 ,
,
Fernando Pérez-Sanz
2,
Pedro J. Navarro
3,
Julia Weiss
1 and
Marcos Egea-Cortines
1,* 1
Genética Molecular, Instituto de Biotecnología Vegetal, Edificio I+D+I, Plaza del Hospital s/n, Universidad Politécnica de Cartagena, 30202 Cartagena, Spain
2
Biomedical Informatic and Bioinformatic Platform, Biomedical Research Institute of Murcia, University Clinical Hospital ‘Virgen de la Arrixaca’, University of Murcia, 30120 Murcia, Spain
3
Escuela Técnica Superior de Ingeniería de Telecomunicación (DSIE), Campus Muralla del Mar, s/n, Universidad Politécnica de Cartagena, 30202 Cartagena, Spain
*
Author to whom correspondence should be addressed.
Cells 2019, 8(8), 920; https://doi.org/10.3390/cells8080920
Submission received: 17 July 2019
/
Revised: 9 August 2019
/
Accepted: 16 August 2019
/
Published: 17 August 2019
Abstract
:The plant circadian clock controls a large number of internal processes, including growth and metabolism. Scent emission displays a circadian pattern in many species such as the snapdragon. Here we show that knocking down LATE ELONGATED HYPOCOTYL in Antirrhinum majus affects growth and scent emission. In order to gain an understanding of the growth kinetics, we took a phenomic approach using in-house artificial vision systems, obtaining time-lapse videos. Wild type flowers showed a higher growth speed than knockdown plants. The maximal growth rate was decreased by 22% in plants with lower LHY expression. Floral volatiles were differentially affected as RNAi plants showed advanced emission of compounds synthesized from cinnamic acid and delayed emission of metabolites of benzoic acid. The monoterpenes myrcene and ocimene were delayed, whereas the sesquiterpene farnesene was advanced. Overall, transgenic lines showed an altered volatile emission pattern and displayed a modified scent profile. Our results show that AmLHY plays an important role in the quantitative and qualitative control of floral growth and scent emission.
1. Introduction
Floral organs are arranged in whorls of sepals, petals, stamens, and carpels. They acquire their identities when a set of genes called floral organ identity genes are activated. These organ identity genes activate the morphogenetic program in combinations [1]. The MADS-BOX genes DEFICIENS and GLOBOSA form protein complexes that drive petal and stamen development [2,3]. The so-called C-function genes are involved in the organ identity of the stamens and carpels [4] and cause the termination of the floral meristem development [5,6].
Floral organ size is primarily controlled by the organ identity genes in a quantitative way [7,8]. Changes in floral organ size occur by changes in the time and/or rate of cell division and expansion [9,10]. Lateral organs grow by a combination of cell division and expansion. Several genes controlling these processes also play a role in the final size of the flower. Amongst them are the transcription factor AINTEGUMENTA [1,2,3,4], affecting both cell division and expansion and EXPANSINS, which control primarily cell expansion [11,12].
The emission of floral scent occurs in many cases from petal tissues [13] and has several functions including the attraction and guidance of pollinators and the repulsion of non-beneficial insects [14,15]. Apart of the important role of Volatile Organic Compounds (VOCs) emission in plant reproduction and protection, the general floral bouquet, which is perceived by the human olfactory system, is also of aesthetic value [16,17]. Floral volatiles are emitted in a circadian fashion and this fact characterizes some plants as day emitters, like Antirrhinum or roses, or night emitters, like Petunia or Silene [18,19,20], indicating that the majority of the volatiles are released during a given timeframe.
The circadian clock has been extensively studied in Arabidopsis [21]. Research on circadian clock in other species is increasingly contributing to the understanding of the genetics of the circadian clock in plants and the importance of its restructuring for optimal outputs in adaptation to the environment [22,23,24]. Cell expansion is controlled by the circadian clock through the coordination of DELLA (aspartic acid-glutamic acid-leucine-leucine-alanine) proteins and the PHYTOCHROME INTERACTING FACTOR (PIF) transcription factors [25]. Cell division is also under the direct control of the clock via binding of TIMING OF CAB 1 to the promoter of CDC6 in Arabidopsis [26]. Scent emission is also directly controlled by the clock. Knocking down the LATE ELONGATED HYPOCOTYL (LHY) in Petunia causes the down regulation of the benzenoid/phenylpropanoid pathway [27], limiting the timing of floral volatile emission to the evening. Additional evidence for a direct role of the circadian clock on the regulation of floral scent emission has been found in Nicotiana attenuate, where knockdown of LHY or ZEITLUPE cause changes in the emission of the attractant benzyl acetone [28]. Recent work has shown that the ortholog of ZEITLUPE in Petunia, PhCHANEL, coordinates scent profiles [29].
In this work, we have addressed the function of the core clock gene LHY on flower development in Antirrhinum majus using RNA interference. Using a phenomics approach we analyzed the effect of knocking down AmLHY on growth. We also analyzed in detail the function of AmLHY on scent emission. Our results indicate a non-linear and complex control of the floral scent synthesis and emission process by AmLHY.
2. Materials and Methods
2.1. Phylogenetic Analysis
We obtained the AmLHY gene by BLAST (Basic Local Aligment Search Tool) against a set of genomic scaffolds using the Arabidopsis LHY as a query. We used the close relative gene from Mimulus gutattus (Migut.N01518.2.p) downloaded from Phytozome to obtain a cDNA model using Genewise [30]. The EMBL-EBI accession number was PRJEB24602.
LHY/CCA1 protein sequences were obtained from National for Biotechnology Information (NCBI) using BLASTp (Table S1). REVEILLE (RVE) Arabidopsis protein sequences were used as a query to identify these proteins in Antirrhinum majus, using the program tblastn and the genome version 3 in the Snapdragon Genome Database (http://bioinfo.sibs.ac.cn/Am/index.php), that had been recently released [31]. Protein alignment was performed by CLUSTAL X, a Windows interface for the ClustalW multiple sequence alignment software [32]. Phylogenetic trees were built with the R libraries “ape” and “phangorn” [33,34], Maximum Likelihood was used as a statistical method and Jones, Taylor, and Thornton (JTT) as a model of amino acids substitution [35] with 1000 bootstrap replicates. Trees were visualized with the R package “ggtree” [36]. Protein domains and functional sites were inferred using the web-based tool “PROSITE” (https://prosite.expasy.org/) [37] and the schematic structure of proteins was plotted with the Bioconductor package “drawProteins” [38]. All libraries were built under R version 3.5.1.
2.2. Plant Material and Transformation
We used the pHELLSGATE12 plasmid [39] to obtain a construct encompassing 156 bp, starting 45 bp before the predicted ATG. Antirrhinum majus hypocotyls of the Sippe 50 (Max-Planck-Institut für Pflanzenzüchtungsforschung, Köln, Germany) line were transformed using the Agrobacterium tumefaciens strain EHA105 as described previously [8]. Sippe 50 was an inbred line that had been used for genetic analysis since 1910 [40,41]. As it has been selfed since then it can be considered completely homozygous. Transgenic plants were confirmed by polymerase chain reaction (PCR) based on the amplification of the gene NPTII. Genomic DNA was isolated from leaves using a kit (NucleoSpin® Plant II, Düren, Germany). PCR was conducted with OneTaq® DNA Polymerase (see Table S3 for primers details). The PCR conditions were 30 s at 94 °C followed by 40 cycles of 15 s at 94 °C, 30 s at 60 °C, and 30 s at 72 °C and terminated by 5 min at 72 °C.
A. majus Sippe 50 and transgenic snapdragon seeds were germinated in vermiculite and were placed in a growth chamber with 16 h light/8 h dark cycle conditions at 23/18 °C during day and night, respectively. Transgenic plants were detected by PCR (NEB, One Taq DNA Polymerase, Ipswich, MA, USA) using NPTII primers (Table S3). We selected 3 independent lines: RNAi:AmLHY14, RNAi:AmLHY26, and RNAi:AmLHY27. Later, seedlings were transferred to pots with a mixture of peat, vermiculite, and perlite 1.1:1 in a greenhouse under natural conditions. Finally, seven days before sampling, plants were placed in a growth chamber with 12 h light/12 h dark cycles with 23/18 °C temperature cycles. Zeitgeber time 0 (ZT 0) was defined by the time when the lights turned on.
2.3. Gene Expression Analysis
Fully expanded leaves were collected from 3 to 4 plants at 6 h intervals for a complete day (24 h). Leaves were immediately frozen in liquid N₂ and stored at −80 °C until use. Total RNA from leaves was extracted using a phenol-based method as described in reference [42] and treated with DNase I (Fermentas-ThermoFisher, Waltham, MA, USA). Equal amounts of total RNA (ThermoFisher, NanoDrop 2000, Waltham, MA, USA) were used for cDNA synthesis (ThermoFisher, Maxima First Strand cDNA Synthesis Kit, Waltham, MA, USA). AmLHY expression levels were analyzed by quantitative polymerase chain reaction (qPCR) (Agilent Mx3000P QPCR System, Santa Clara, CA, USA) with SYBR Green (TaKaRa, SYBR Green Master Mix, Kusatsu, Shiga, Japan) according to manufacture manuals, and the following protocol was used for 40 cycles: 95 °C for 4 min and then cycling at 95 °C for 15 s, 60 °C for 15 s, and 72 °C for 30 s. UBIQUITIN (AmUBQ) was used as an internal control and samples were run in duplicate (Table S3). Normalized expression was expressed as 2−ΔΔCt , thus we used an efficiency of 2 for data analysis [43]. Daily gene expression of AmLHY was normalized by the average expression level across the time-course; AmLHY expression in RNAi lines was normalized to WT. To test differences in expression between wild-type and transgenic plants we performed a Student’s t-test using the package “stats” in R (R version 3.5.1).
2.4. Flower Measurements
Flowers from A. majus Sippe 50 non-transgenic siblings and T2 generations were measured 2 to 3 days post-anthesis according to reference [44]. Flowers were sampled from 3 to 4 different plants per group. In total, we measured 8 flowers from non-transgenic siblings, 9 flowers from RNAi:AmLHY14, 4 flowers from RNAi:AmLHY26, and 7 flowers from RNAi:AmLHY27 line. Floral parameters were compared between non-transgenic and transgenic siblings with the Student’s t-test performed in R (R version 3.5.1).
2.5. Growth Analysis and Artificial Vision
We used an image acquisition system described previously [45,46]. Plants were grown inside a growth chamber comprising LED day lights covering from UV to red light. Night images were taken by activating an infrared light at 840 nm wavelength during short intervals of time (3 s). Images were acquired with an artificial vision camera comprising two CCD sensors, a multichannel 24-bits RGB absorbing at 610 nm, 540 nm, and 460 nm, and a monochromatic sensor capturing at 800 nm. The acquired images have a resolution of 1296 × 966 pixels.
We obtained data using a light/dark 12 h/12 h period of A. majus Sippe 50 and the segregating siblings of RNAi:AmLHY for a period of 8 days and 7 h. Images were acquired every 10 min for a total of 1196 images comprising 3 wild type and 3 transgenic flowers. Using a semiautomatic process, we measured the length every two hours. A curve was fitted to the raw data using a GENERAL ADDITIVE MODEL (GAM) using the package “mgcv” from R. The maximum growth corresponded to the maximal size of the flowers, corresponding to the maximal value of the curve. We obtained the maximal slope that would correspond to the maximum growth rate by deriving 200 points of the curve and obtaining the highest number. The area under the curve was obtained by integrating the fitted curve using the integrative function from the “stats” package.
2.6. Volatiles Collection, Gas Chromatography Mass Spectrometry, and Scent Analysis
Non-transgenic plants and plants belonging to T2 generations were sampled. Three or four flowers per line from 2 to 3 days post anthesis were used as described previously [47]. We collected volatiles starting at ZT3, for a period of 6 h during 24 h. All plants were acclimated to 12 h light/12 h dark (12LD) and 18/23 ºC cycle. The volatiles captured were analyzed by gas chromatography mass spectrometry (GC/MS) as described in reference [8]. Flower scent was analyzed by the R package “gcProfileMakeR” (unpublished results), selecting a 60% frequency and default quality. Selected volatiles amount was expressed as an integrated area divided by flower fresh weight [48]. The phase was calculated using the JTK-CYCLE implemented in “MetaCycle” [49] (R version 3.5.1). Graphs were plotted with “ggplot2” [50] using a color blind-friendly palette provided by “viridis” [51]. Volatile pathways were represented using the software “PathVisio” (version 3.3.0) [52].
3. Results
3.1. The Antirrhinum Majus LHY
We obtained a single scaffold that had high similarity to the LHY gene from Arabidopsis. A multiple sequence alignment of the translated proteins showed a high level of homology of snapdragon LHY (AmLHY) to other LHY and REVEILLE (RVE) coding genes (Figure S1, Table S1). In total, we identified seven RVEs genes in snapdragon and one LHY by BLAST, with high similarity to Arabidopsis (Table S2). A phylogenetic reconstruction using predicted proteins showed that the AmLHY clusters with other LHY proteins and they were clearly separated from the RVE clade (Figure S1). Moreover, CCA1a and CCA1b from Physcomitrella patens clustered between the RVE1/2/7 and RVE4/8 clades. LHY/CCA1/RVE (AtLHY, AtCCA1, and AtRVE in Arabidopsis) are MYB proteins, which are characterized by a conserved DNA-binding domain [53,54,55]
We identified the MYB domain and the HTH DNA-binding domain (helix-turn-helix motif) in AmLHY, which were highly conserved in size and position, as observed in other species such as Petunia or Vigna (Figure S1C). The coding region of AmLHY differed compared to AtLHY. AmLHY showed additional aminoacids that resulted in a longer protein (Figure S2). As mentioned above, we identified seven genes related to the RVE family in snapdragon, which shared a high homology with Arabidopsis except for three genes. We could not identify the MYB domain in AmRVE1/2/7A and AmRVE1/2/7B, while AmRVE1/2/7D showed two MYB domains (Figure S1C), suggesting an internal gene duplication.
3.2. The AmLHY Shows A Diurnal Expression Pattern
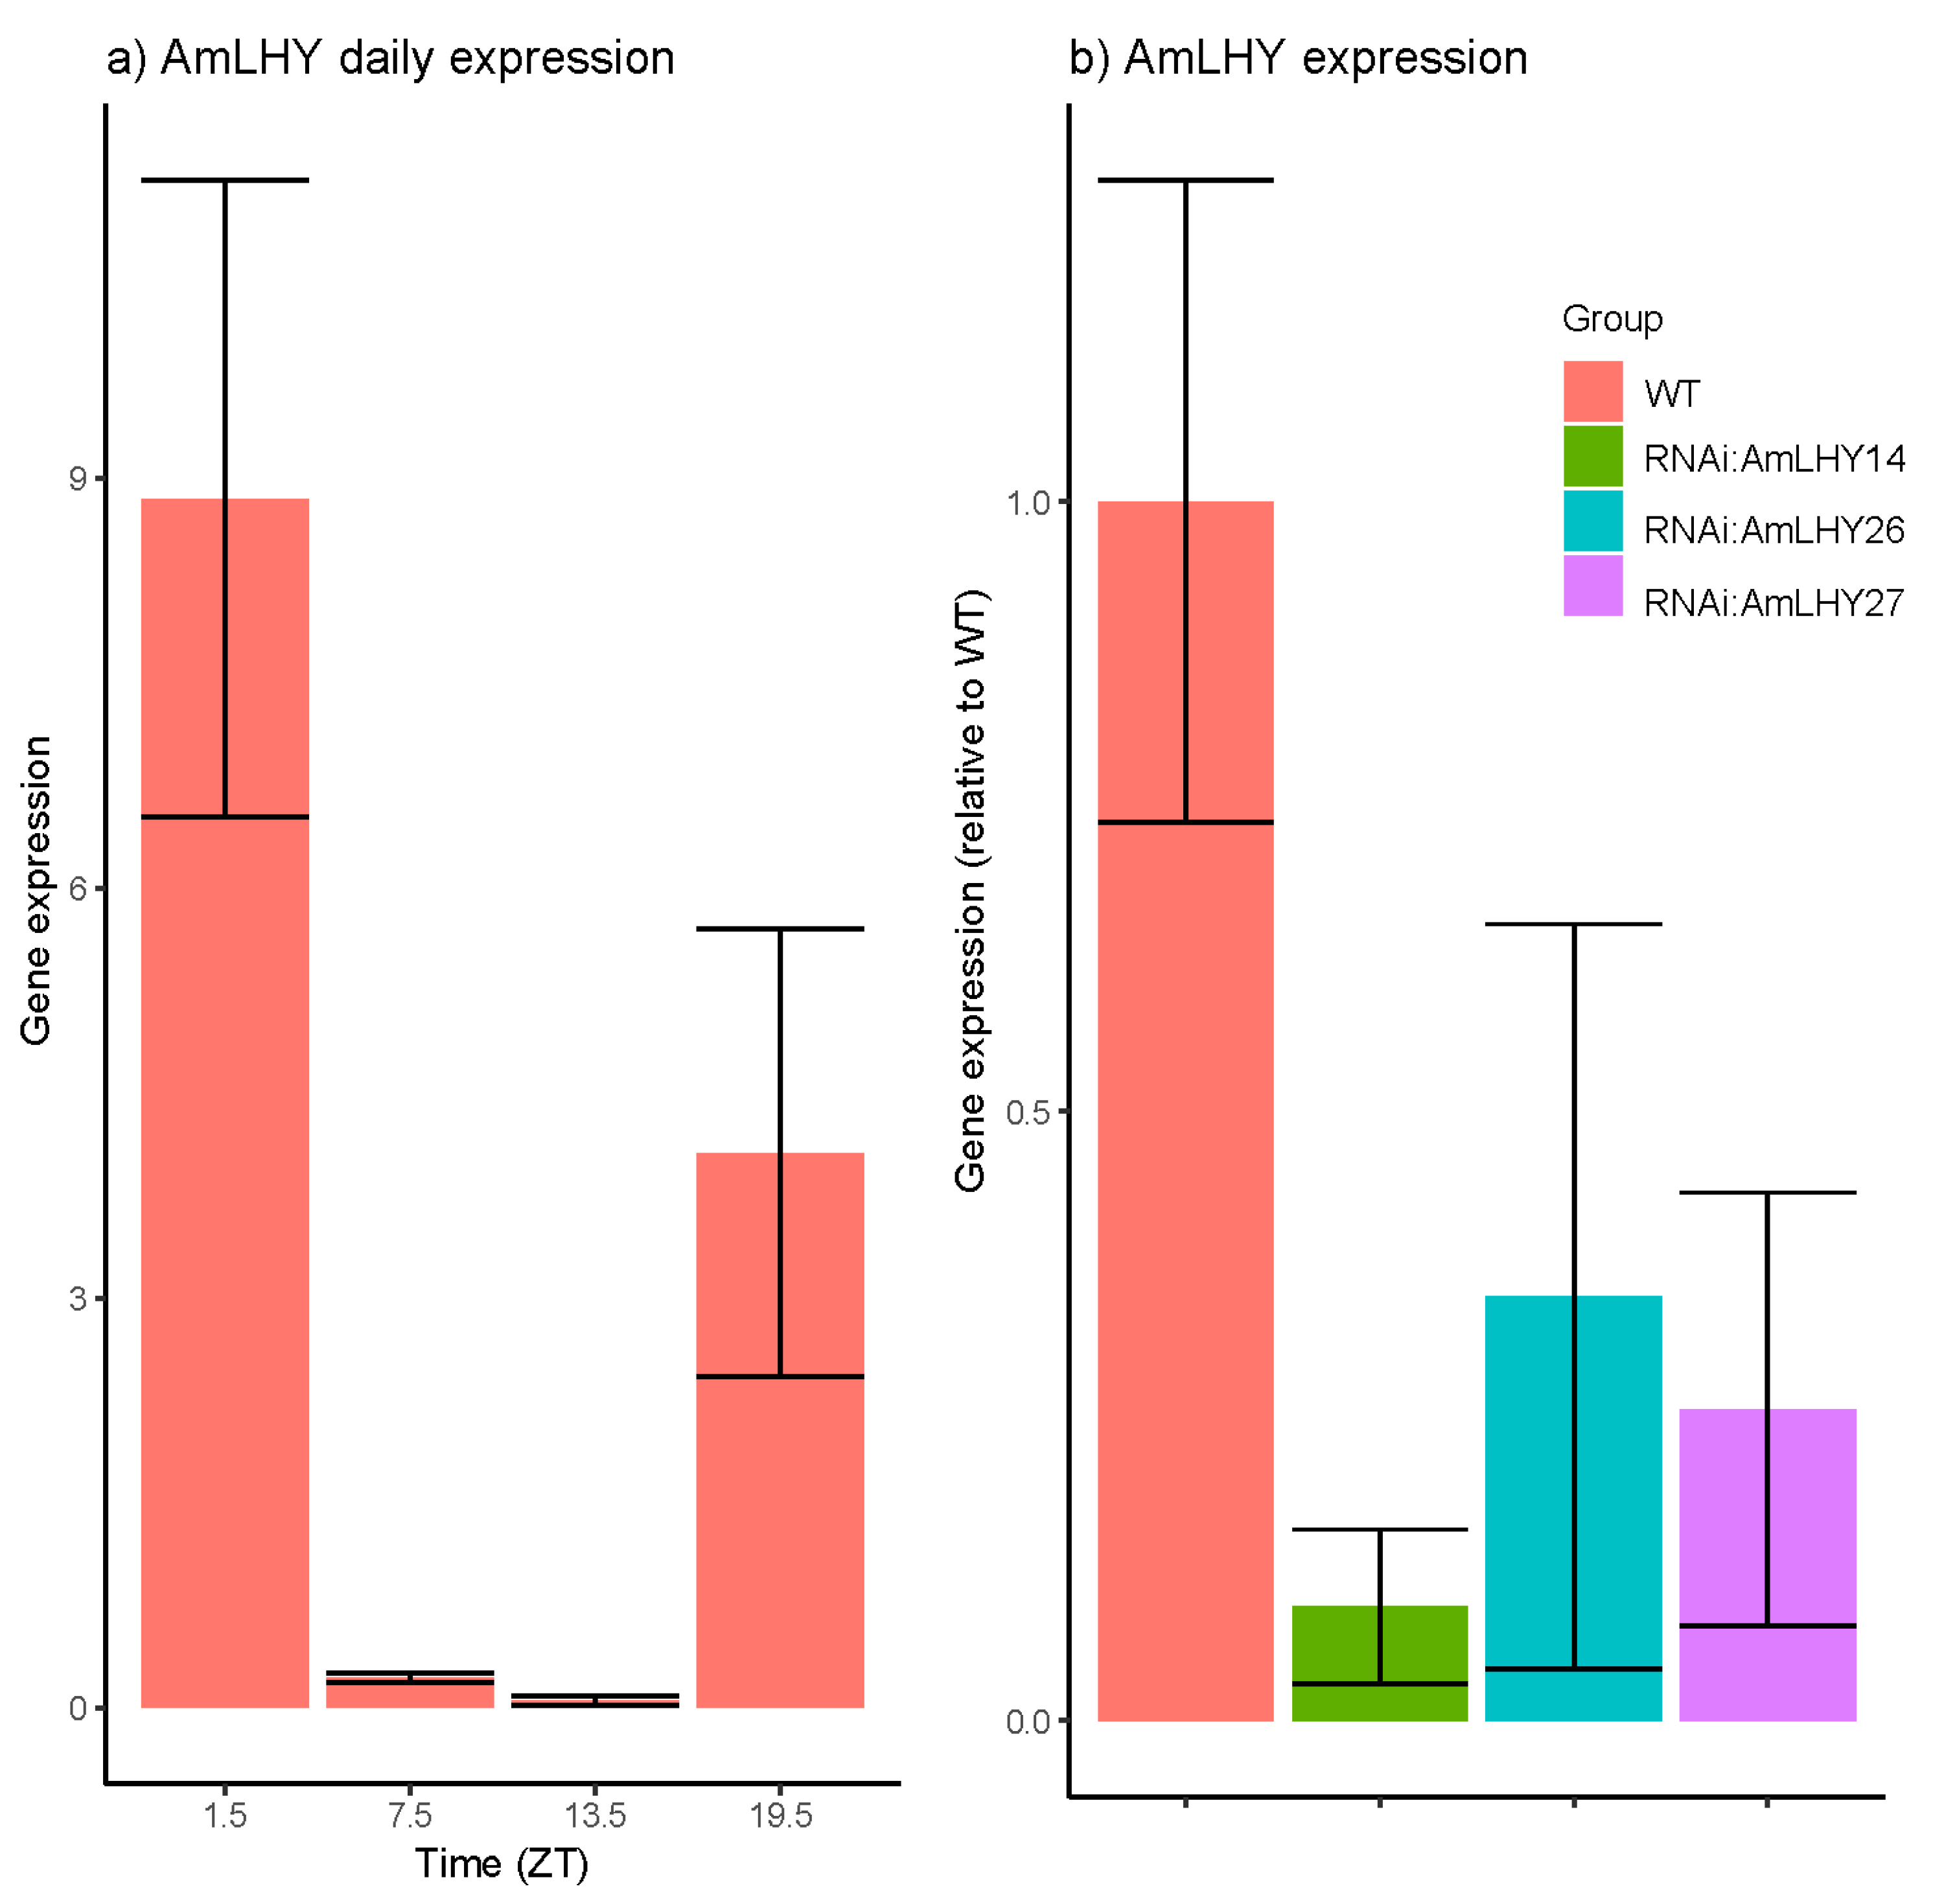
We analyzed the expression of AmLHY in leaves of wild-type plants under a 12LD cycle. We found that AmLHY expression increased at the end of the subjective night, peaking in the early morning. AmLHY showed a robust and significant oscillation (Figure 1a, p value = 3.3 × 10−06), as described in other species including Arabidopsis, cowpea, or wild tobacco [54,56,57]. We selected T1 plants from three independent lines (RNAi:AmLHY14, RNAi:AmLHY26 and RNAi:AmLHY27). In T2, all selected lines displayed a significant lower transcript level of AmLHY (Figure 1b, Table 1). RNAi:AmLHY14 showed an average of 90% reduction in AmLHY expression levels, RNAi:AmLHY26 of 65% and finally, RNAi:AmLHY27 of 74%.
3.3. AmLHY Does Not Affect Flower Morphology and Size
The typical snapdragon flower has five sepals and five petals, these petals are fused resulting in a tubular and bilaterally symmetrical flower. We did not observe changes in organ identity or aberrant growth. All plants showed fully opened flowers.
We characterized snapdragon flowers analyzing 11 floral parameters, comparing the wild-type Sippe 50 and RNAi:AmLHY lines. These measurements included sepals, petals, and reproductive organs. The down regulation of LHY did not significantly affect the flower size, with the exception of petal height, lower petal expansion, and palate, which decreased in RNAi:AmLHY14 line (Figure S3, Table S4).
3.4. AmLHY Enhances Growth Speed
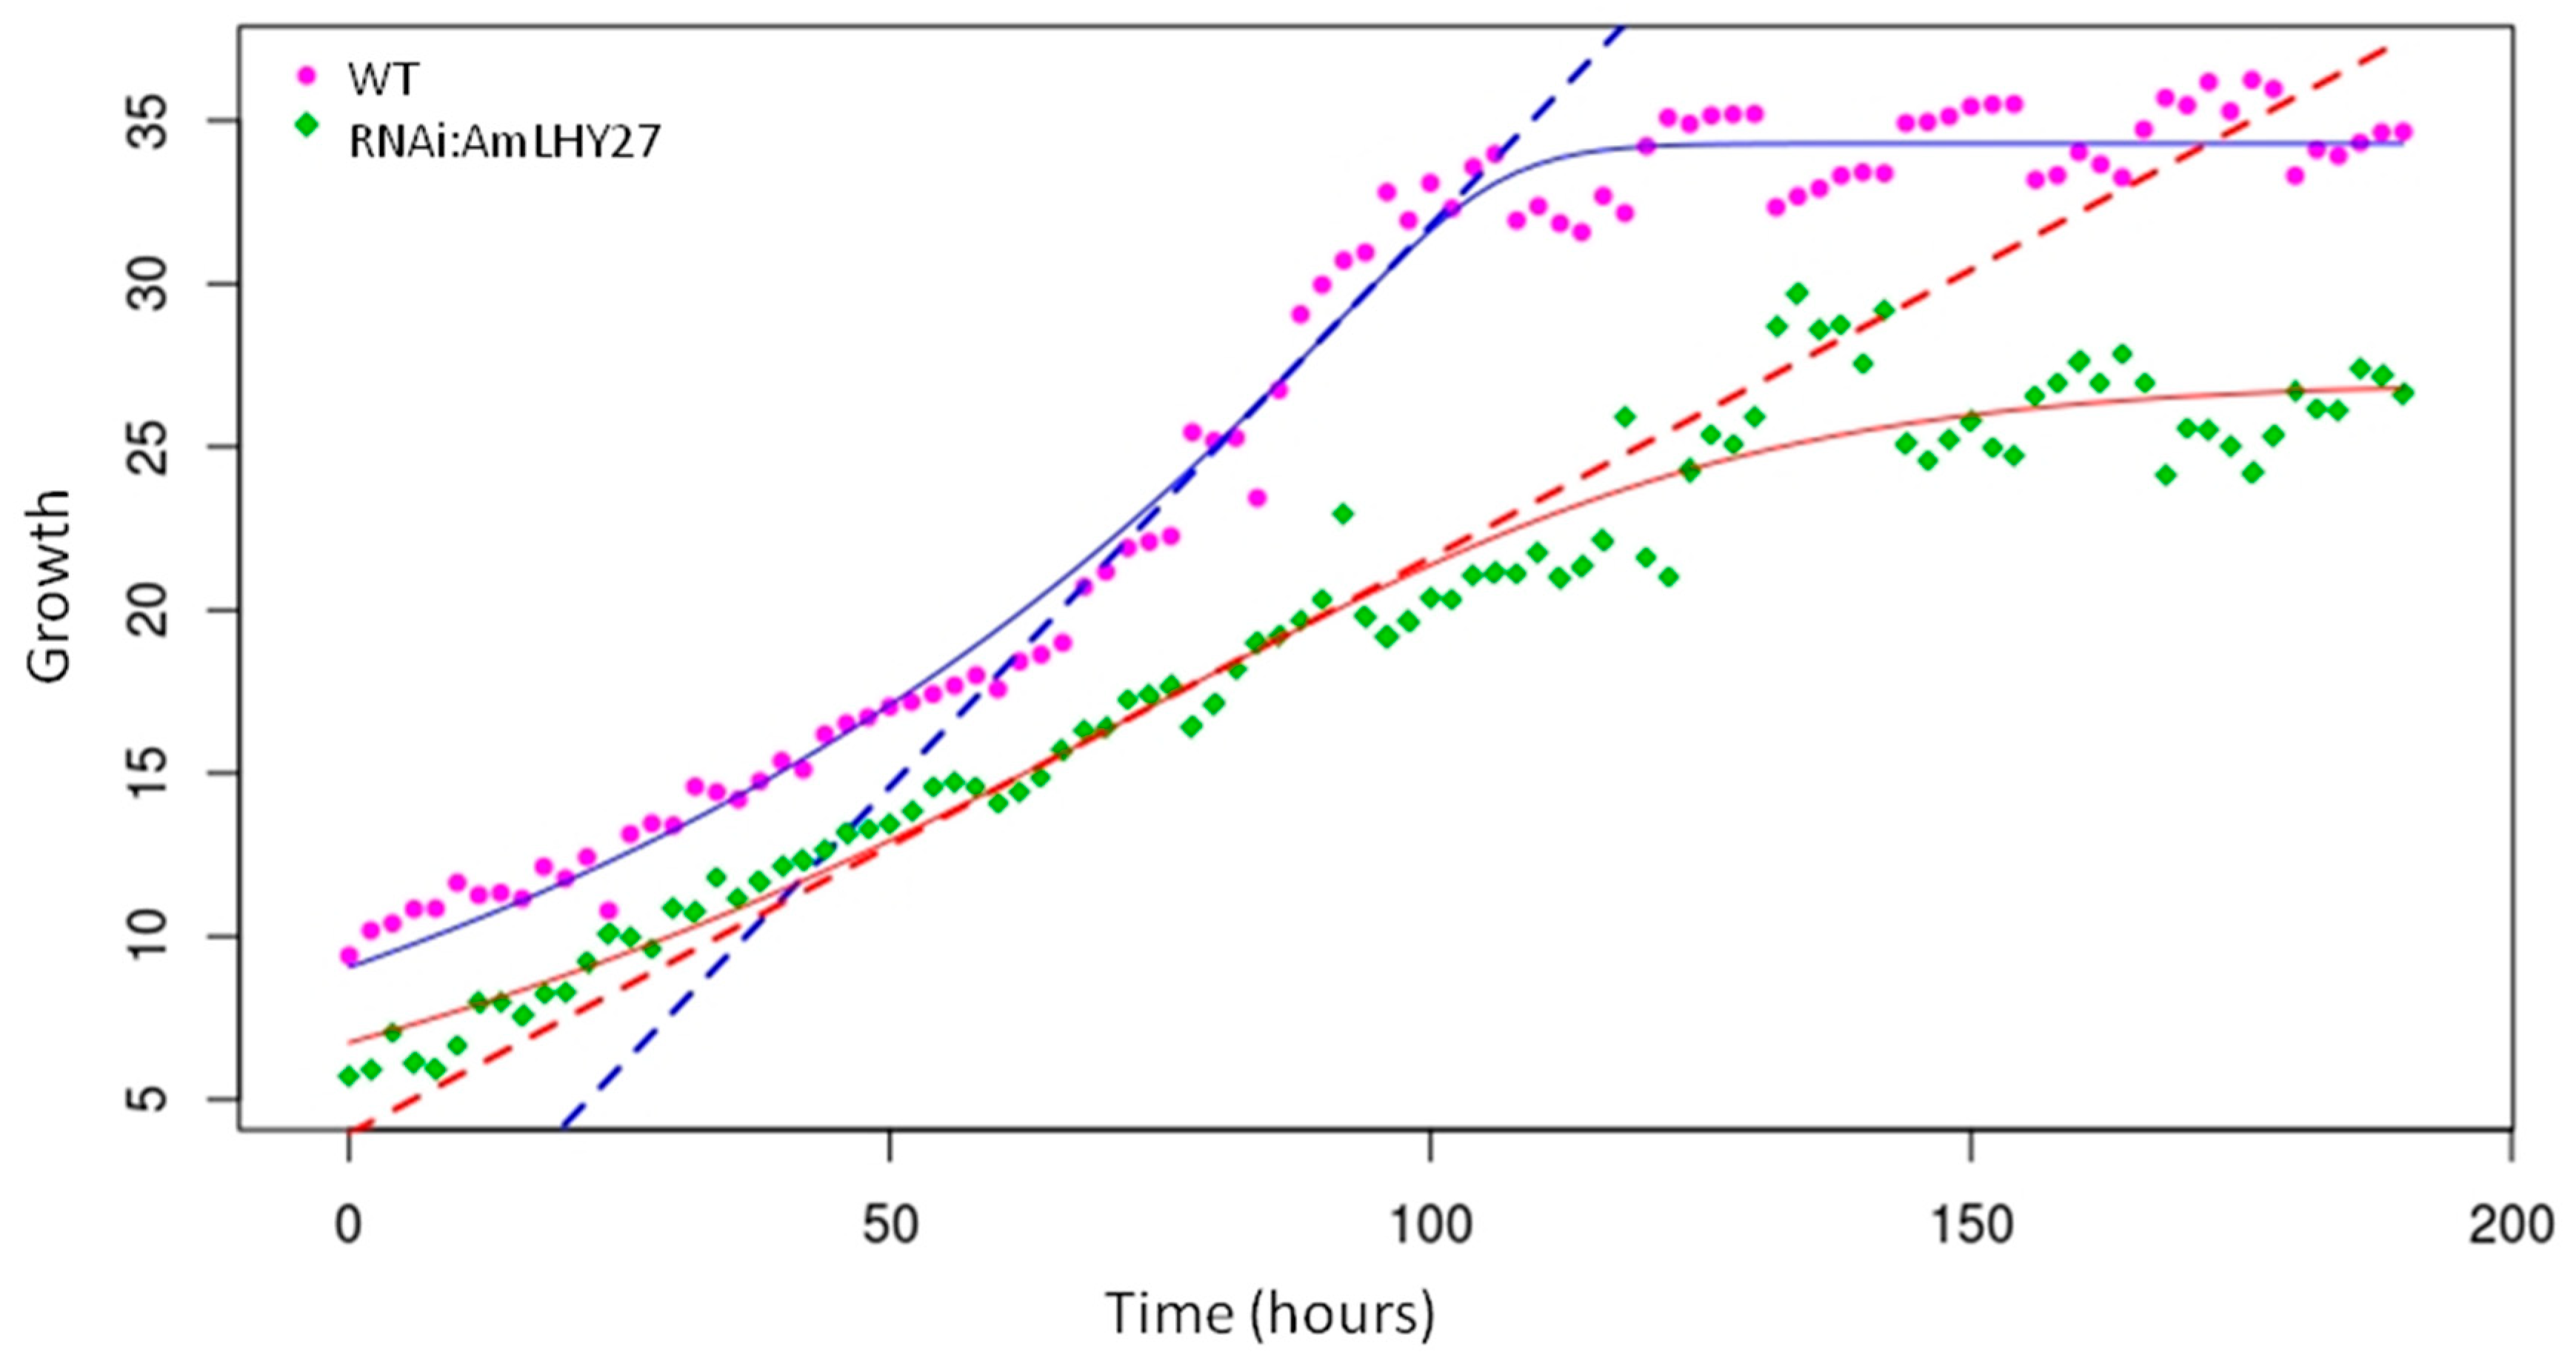
The study of mutants affecting floral size in Arabidopsis, Antirrhinum, and other species have relied mostly on endpoint analysis of mutants [10,58]. There is very little information about the growth kinetics that causes the final changes in terms of size. Modifications in growth leading to differences in final size may occur as a result of the duration of the growth period, changes in growth speed, or a combination of both parameters. We used a previously described in-house artificial vision system to obtain time lapse pictures of line RNAi:AmLHY27 and an azygote segregating sibling (Movie S1). We obtained growth curves for wildtype and transgenic siblings and results showed a very strong effect of the down regulation of AmLHY on flower growth rate (Figure 2). The maximal growth speed achieved by the RNAi:AmLHY line was roughly 78% of the non-transgenic sibling, and the area under the growth curve model was 73% of the non-transgenic sibling (Table 2). The maximal slope used to calculate growth rate [59] suggested that the overall growth rate was only 51% as compared to wild type. As far as we could analyze, the length of the flower growth period was similar in WT and in RNAi:AmLHY27, indicating that modifying the plant circadian clock affected growth speed in the petals.
3.5. AmLHY is Required for Major Volatile Production
We analyzed the floral scent emitted by wild-type and RNAi:AmLHY flowers using a time course with sampling six hours apart. A collection of volatiles was performed under a 12LD cycle. We detected 15 compounds during the time-course sampling (Table S5). Most detected volatiles belonged to the phenylpropanoid/benzenoid pathway but we also found terpenes as described previously [60]. We divided the volatile organic compounds into two groups. The first group comprised those VOCs, which contributed to the scent profile above 2% (major volatiles) and the second group contained the remaining compounds (minor volatiles).
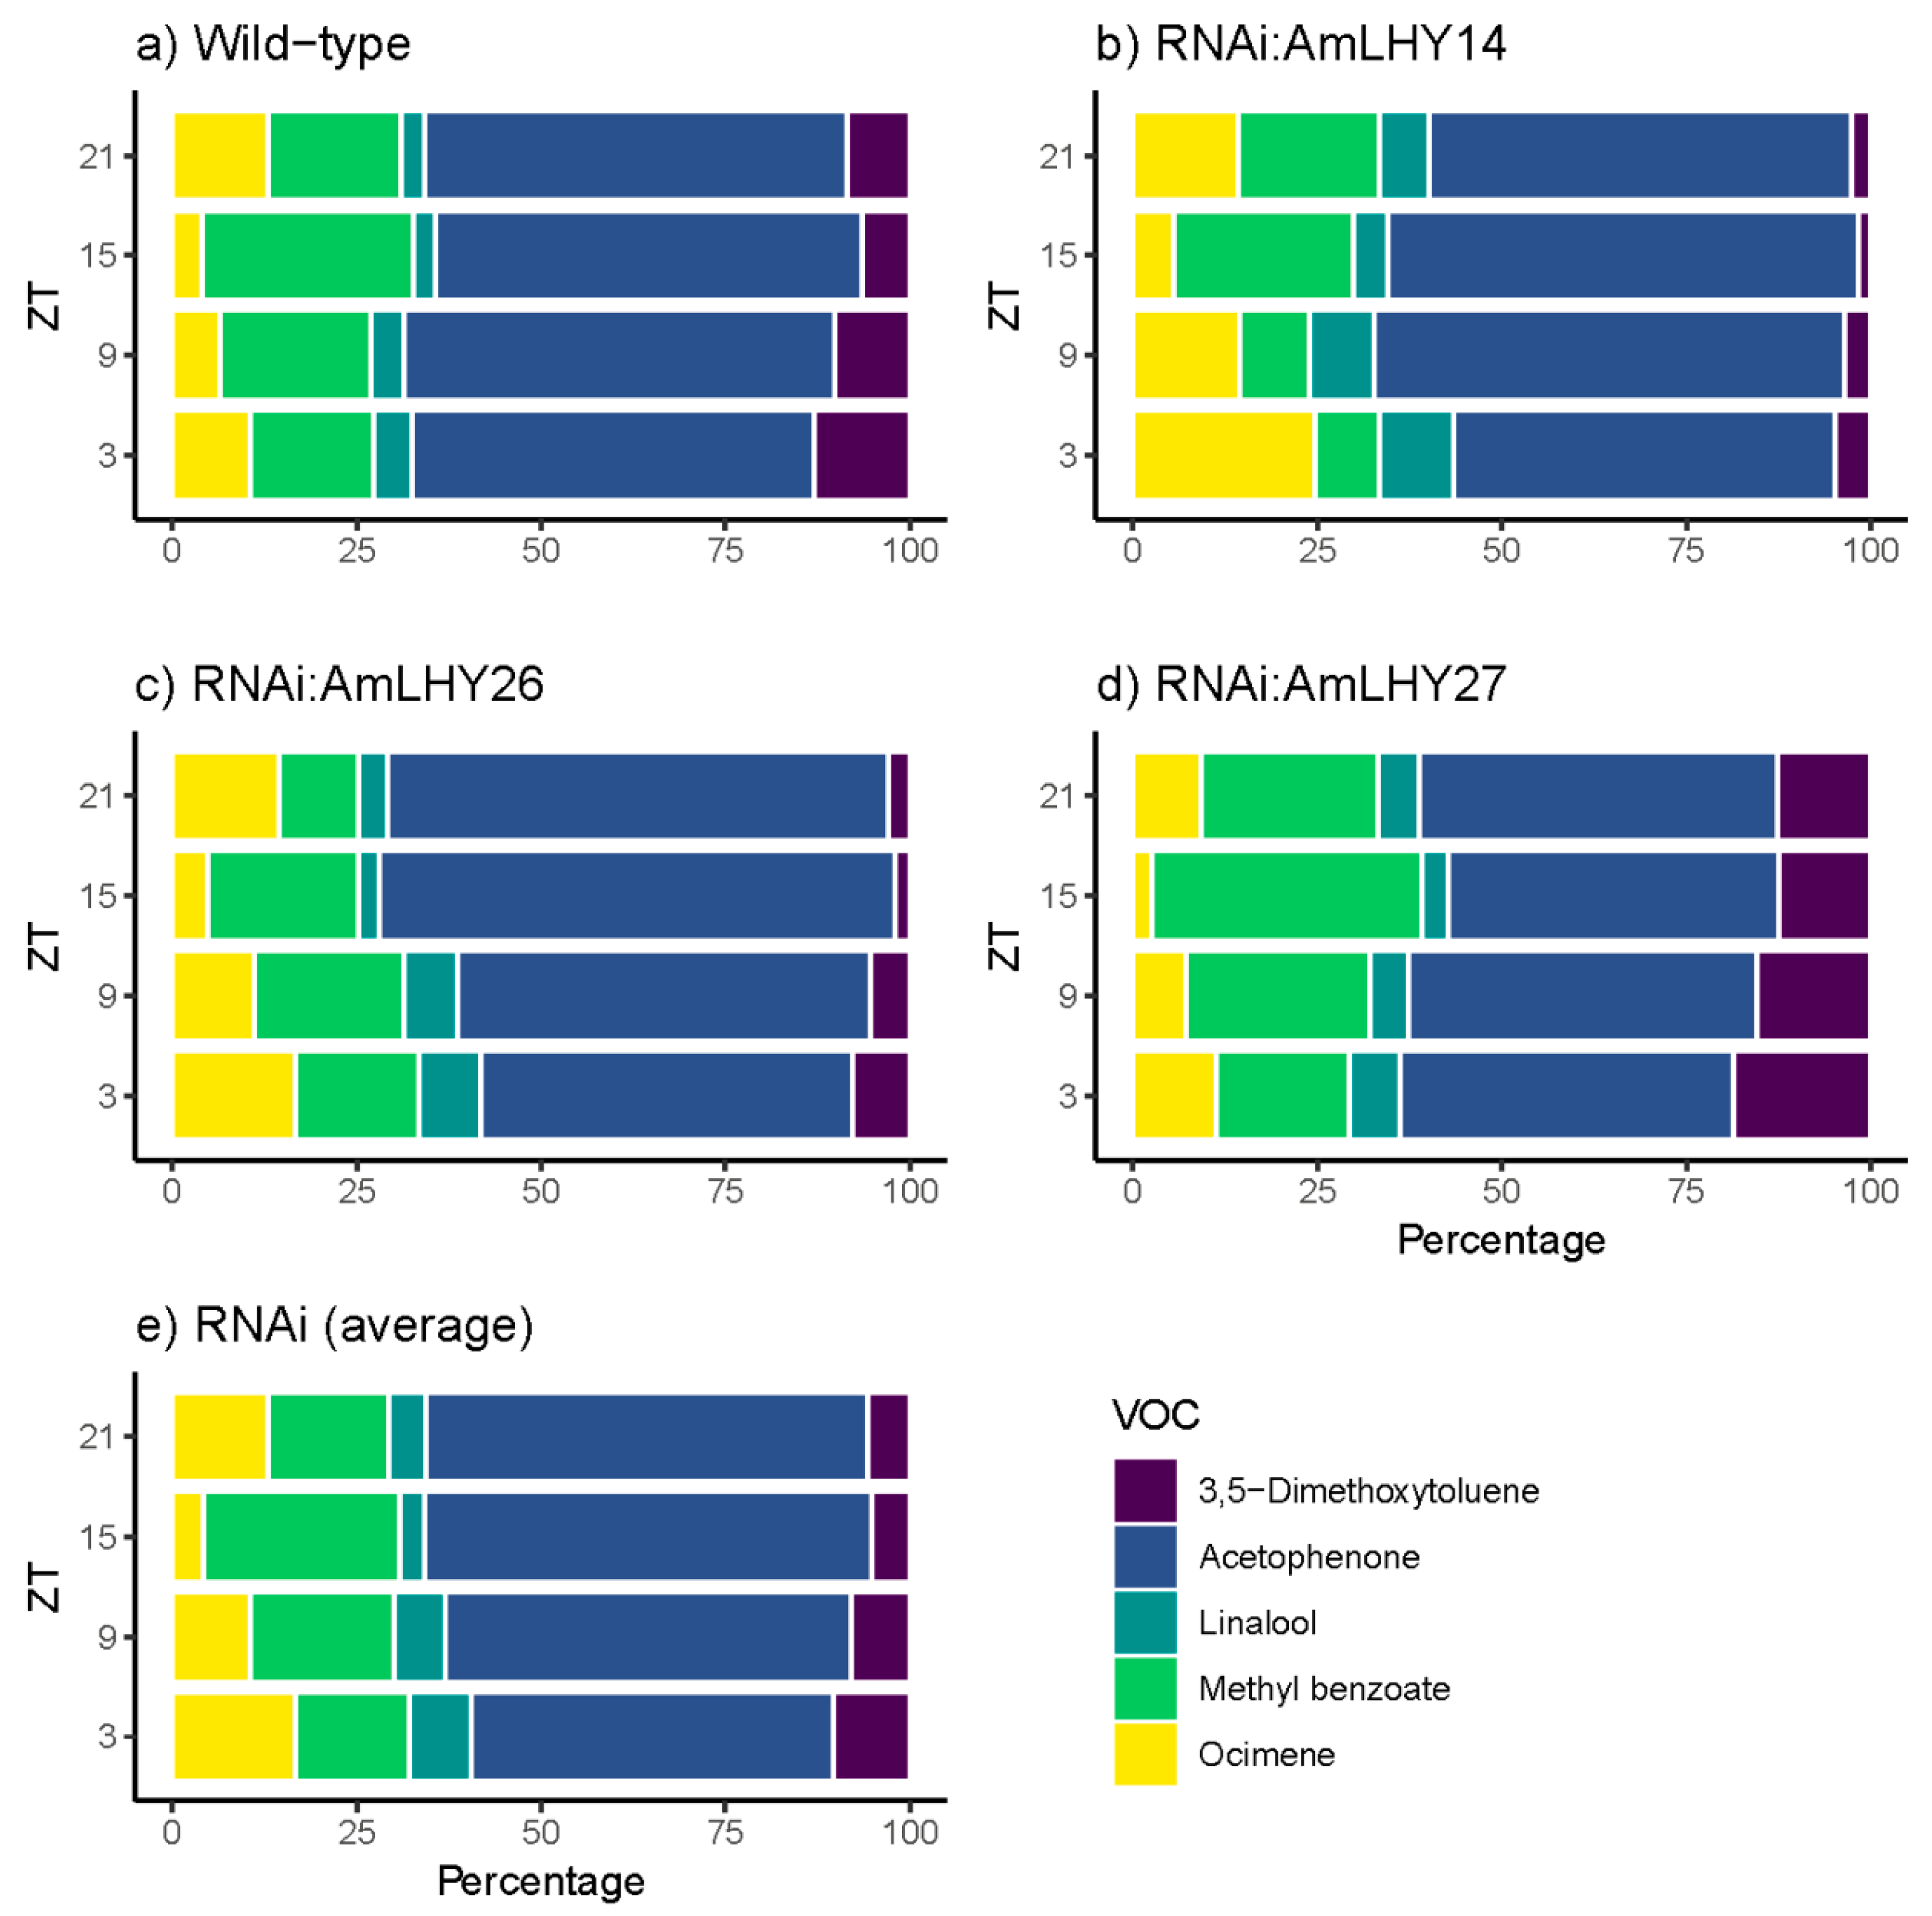
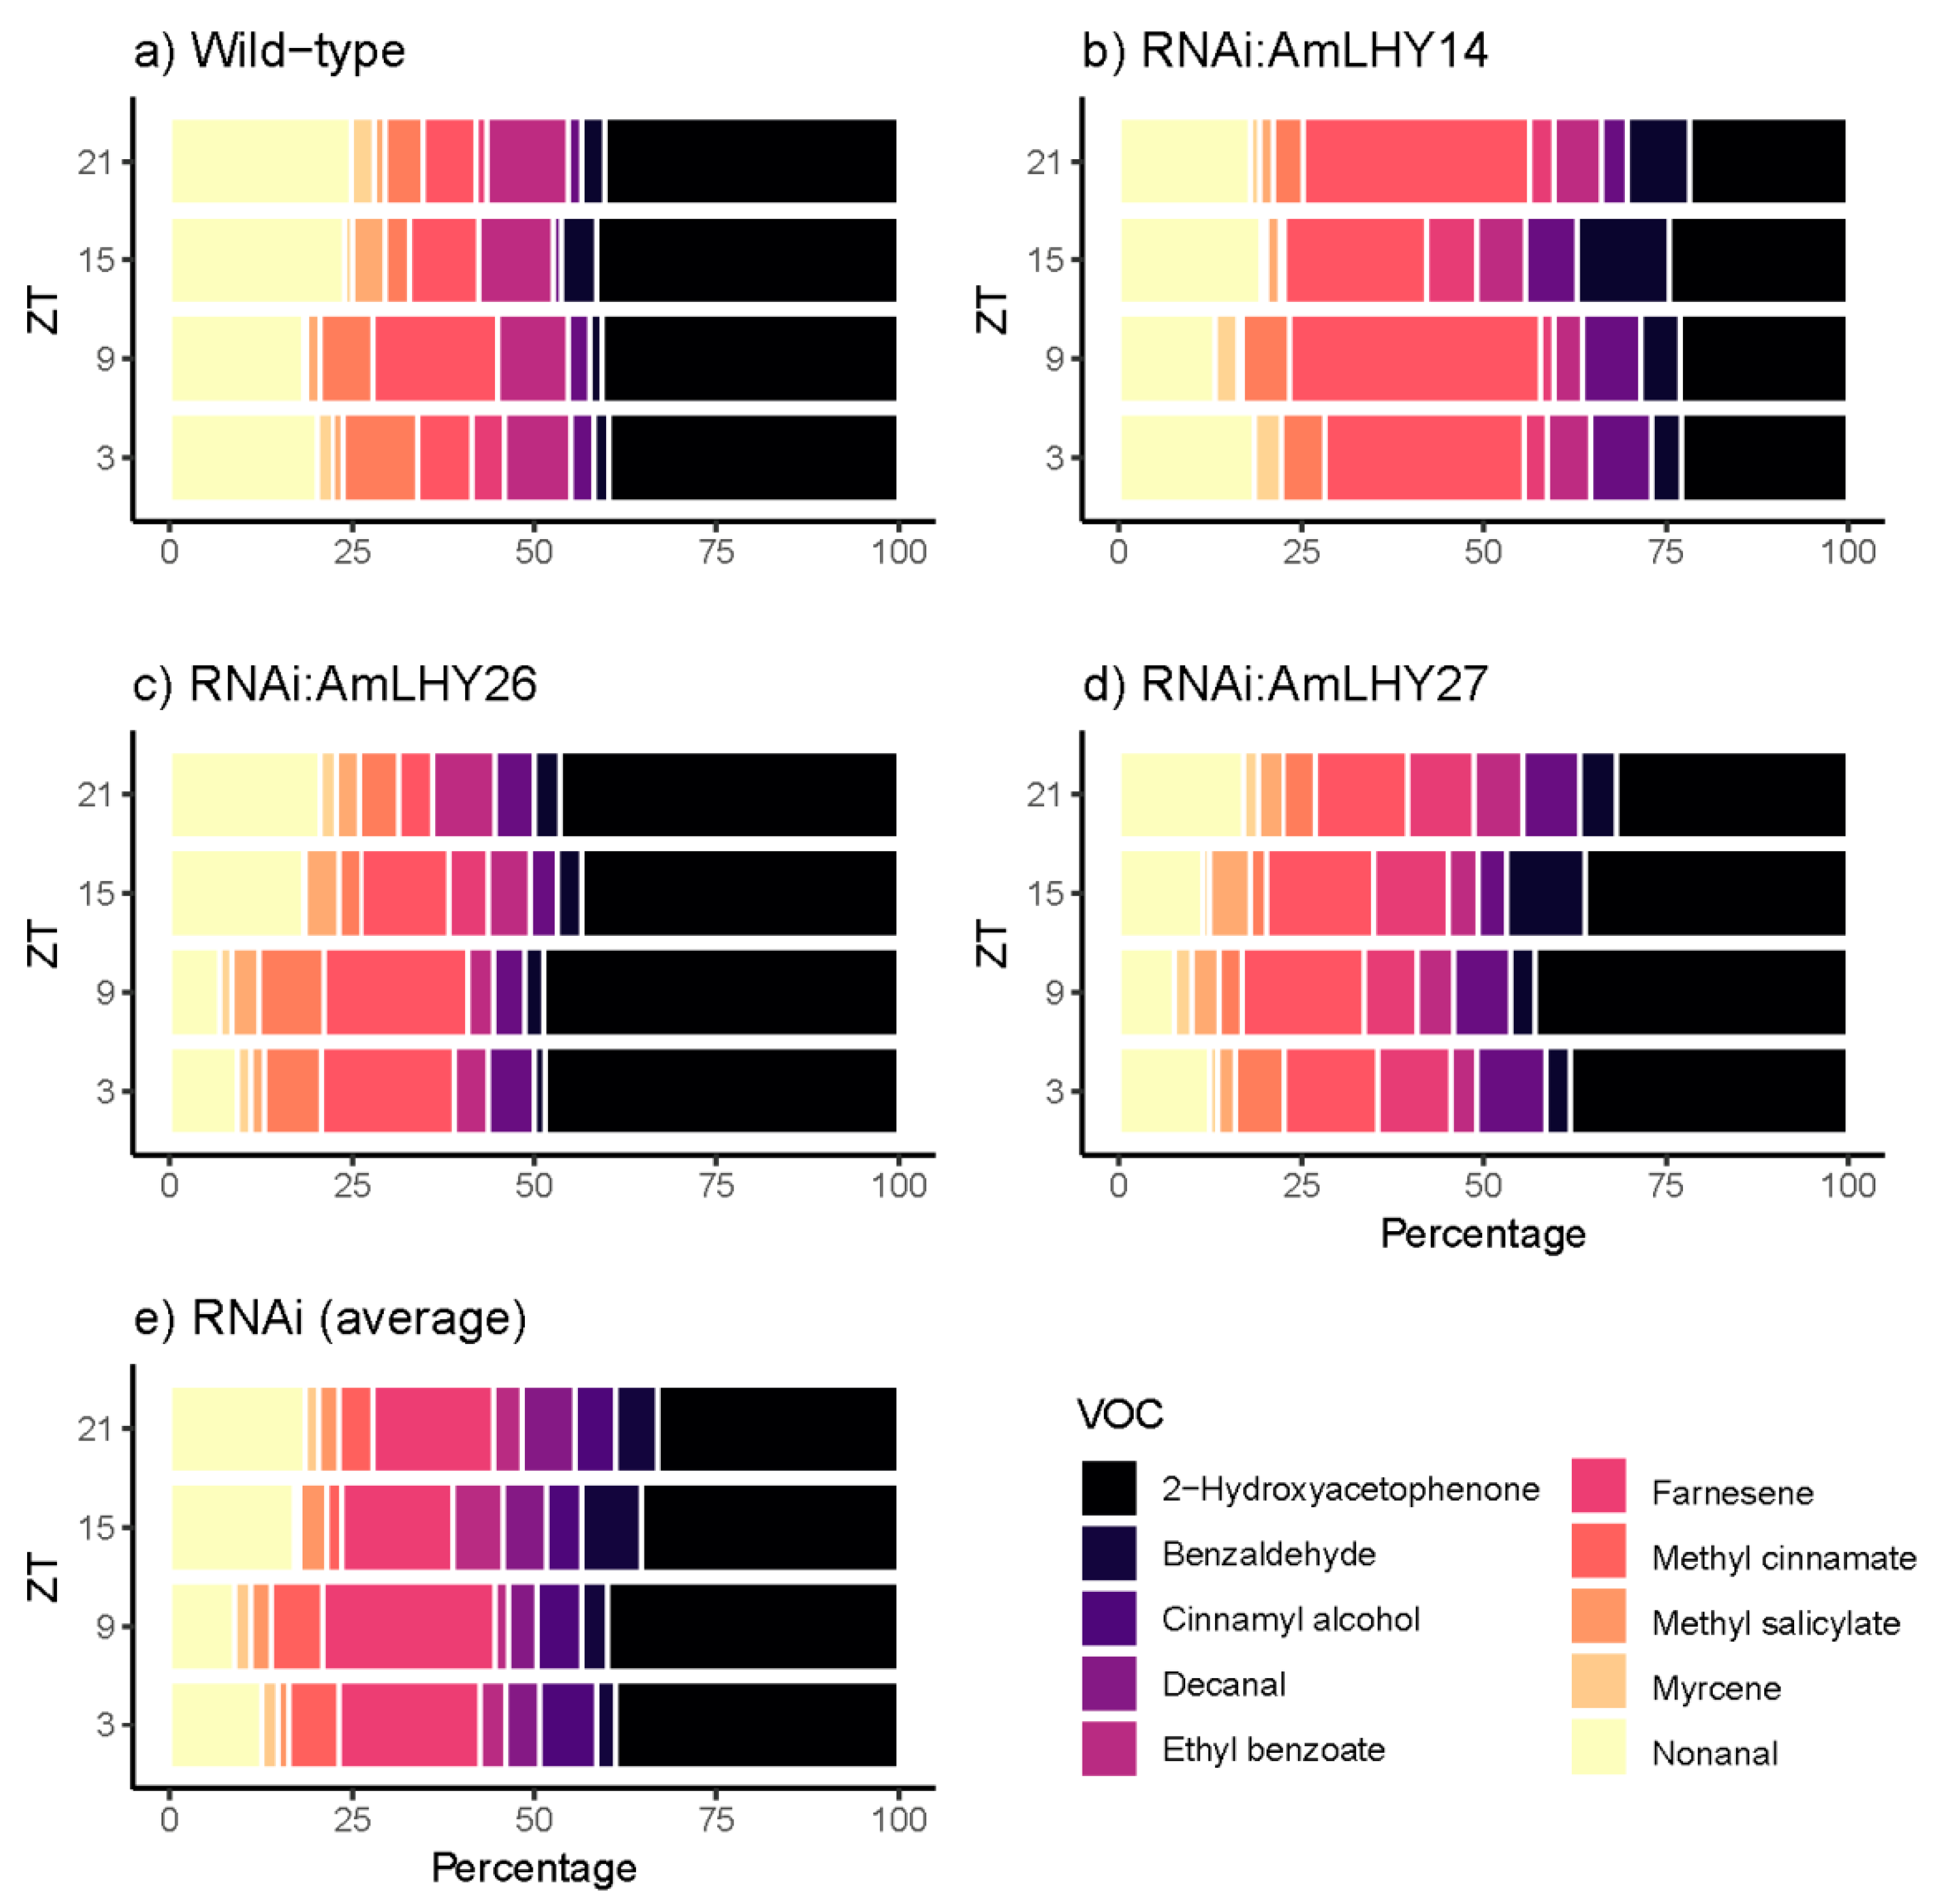
The major group comprised five compounds: Acetophenone, methyl benzoate, 3,5-dimethoxytoluene, ocimene, and linalool. We found major changes in the overall profile (24 h) in RNAi:AmLHY. The monoterpenes ocimene and linalool increased their levels in transgenic lines by 34.5% and 46.16%, respectively. In contrast, the volatile 3,5-dimethoxytoluene contribution to the scent profile was reduced by 23.6% in RNAi plants. Acetophenone and methyl benzoate, the two major compounds, decreased but not significantly in RNAi lines (2.6 and 7.5% respectively) (Figure S4). These five compounds comprised 98.35% of the profile in wild-type plants and an average of 97.81% in RNAi:AmLHY lines. Interestingly, the minor volatiles, whose contribution to the fragrance aroma was 1.65% in WT and 2.19% in transgenic lines, revealed the highest complexity of the snapdragon aroma. We classified the volatiles into two groups. The first group comprised compounds which decreased in the profile: The aldehydes nonanal and decanal. The second group included the benzenoids/phenylpropanoids 2-hydroxyacetophenone, benzaldehyde, cinnamyl alcohol, ethyl benzoate, methyl cinnamate, and methyl salicylate, and the terpenes farnesene and myrcene, which increased their contribution to the odour (Figure S4).
Daily emission also revealed changes in the scent profile. In major compounds, we found that the contribution of the benzenoids acetophenone and 3,5-dimethoxytoluene to the scent profile was lower in RNAi lines along all the time points analyzed. Methyl benzoate level was lower in all time points, except at ZT15, which increased its contribution slightly. In contrast, the monoterpenes linalool and ocimene were higher in transgenic lines (Figure 3).
We also observed changes in minor volatiles. The aldehydes nonanal and decanal contribution were lower in transgenic lines. Furthermore, the benzenoid/phenylpropanoids benzadelhyde, cinnamyl alcohol, and methyl salicylate levels were higher in RNAi:AmLHY lines. The remaining compounds, 2-hydroxyacetophenone, ethyl benzoate, methyl cinnamate, and myrcene did not show a robust pattern as myrcene, that showed the highest increment by 668% at ZT9, but decreased by 33% at ZT15 and by 37% at ZT21 (Figure 4).
Altogether these results suggest a complex regulation of synthesis and/or emission of volatile organic compounds by AmLHY, acting at different levels over the phenylpropanoid/benzenoid and terpene pathways. All these changes resulted in a different and new flower-odour blend.
3.6. AmLHY Controls the Timing of Scent Emission
We detected 15 volatile organic compounds (Table S5; Figure 3 and Figure 4). In wild-type flowers, most selected volatiles showed a diurnal pattern. The release of VOCs started in the early morning, reaching their maximum emission at midday or before dusk. We classified the emitted VOCs in three groups based on their time of maximum emission. The first group comprises myrcene, ocimene, linalool, decanal, nonanal, 3,5-dimethoxytoluene, 2-hydroxiacetophenone, and methyl cinnamate, that reached their maximum emission at early day and midday. A second group included cinnamyl alcohol and farnesene that peaked at the end of the light period. Finally, the third group covered acetophenone, methyl benzoate, and methyl salicylate, which increased their emission at midnight (Table S6).
In contrast, we found that the maximum emission of some VOCs shifted in RNAi lines, and we divided the volatiles into three groups. First, the monoterpene linalool, the aldehydes nonanal and decanal and the benzenoids/phenylpropanoids cinnamyl alcohol, 3,5-dimethoxytoluene, and 2-hydroxyacetophenone did not present any differences with wild-type flowers, showing its maximum emission at the same time. The second group comprised the derivatives of benzoic acid methyl benzoate and methyl salicylate, and the monoterpenes myrcene and ocimene, which delayed their maximum emission. Finally, acetophenone, benzaldehyde, methyl cinnamate (except in line RNAi:AmLHY26, which did not show any difference) and the sesquiterpene farnesene peaked early in transgenic lines (Table S6). We could not determine the phase of the ethyl benzoate, due to their irregular emission (Table S6).
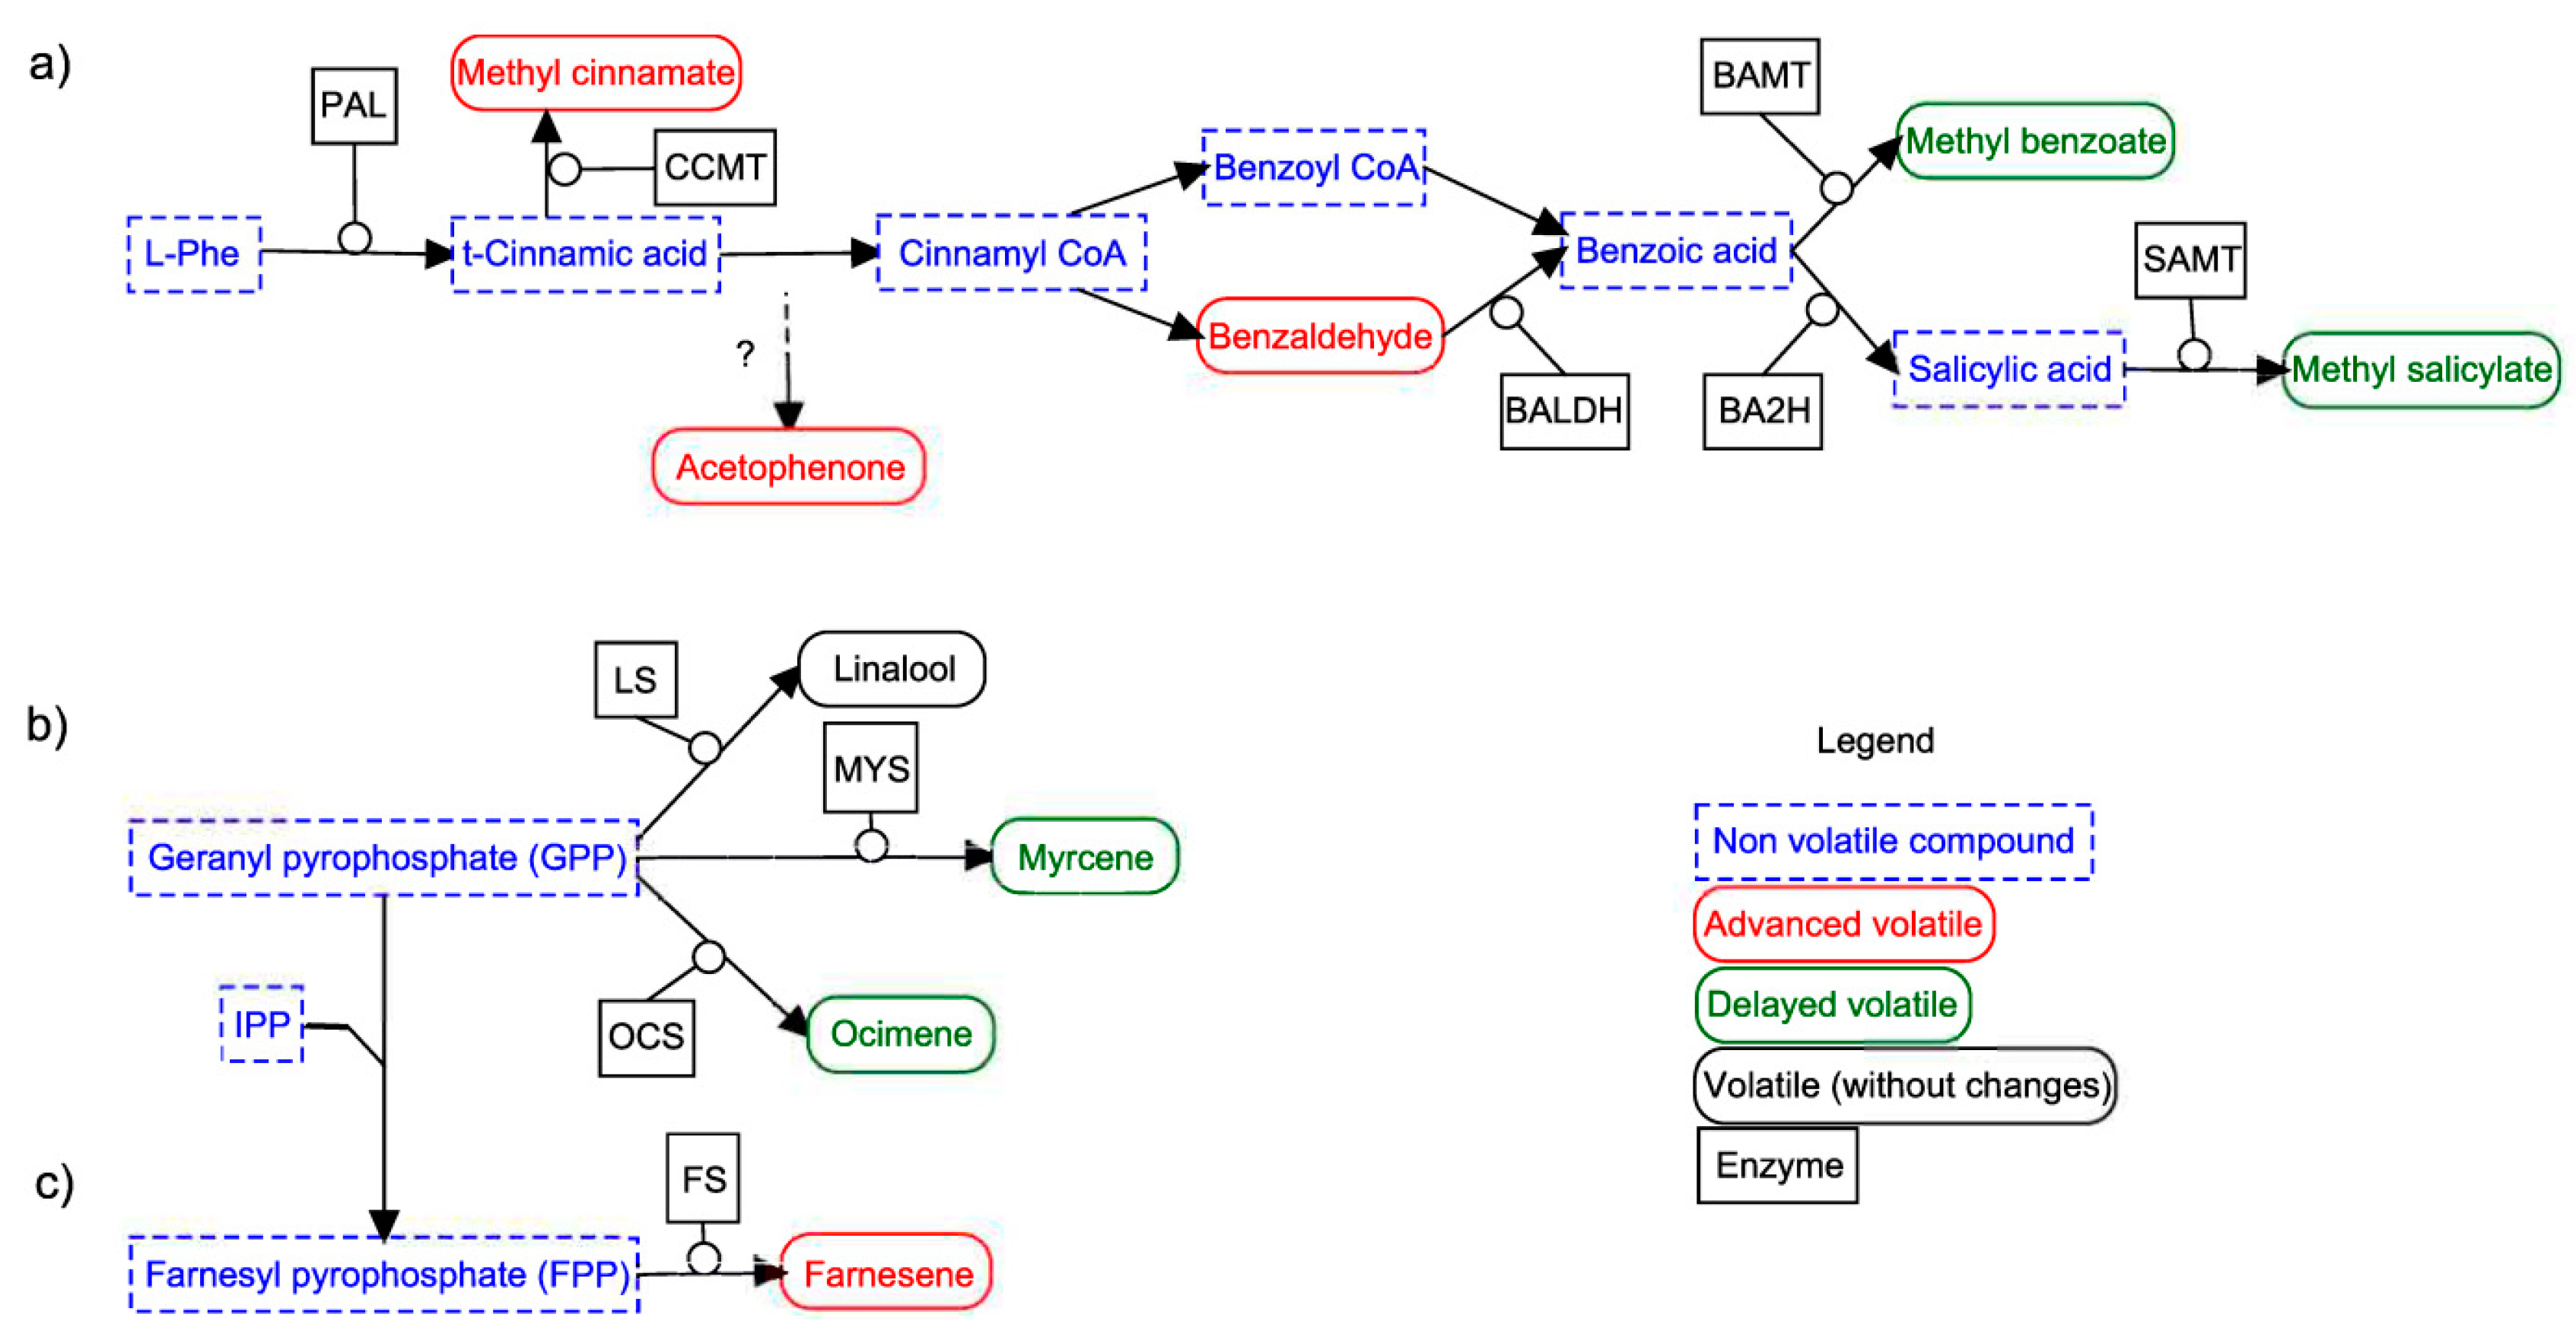
Based on the known phenylpropanoid/benzenoid pathway we divided it into two principal branches, which have a common precursor, L-phenylalanine. The first branch included those compounds that derived from trans-cinnamic acid, as methyl cinnamate. The second branch covered benzoic acid derivatives, methyl salicylate, and methyl benzoate (Figure 5). Our results showed that the down-regulation of AmLHY advanced the maximum emission of acetophenone, benzaldehyde, and methyl cinnamate, while it caused a delayed peak of methyl salicylate and methyl benzoate.
We found a similar pattern in terpene emission. Geranyl pyrophosphate (GPP) is the precursor of the monoterpenes linalool, myrcene, and ocimene [61], whose reactions are catalyzed by linalool synthase (LS), myrcene synthase (MYS) and ocimene synthase (OCS), respectively. RNAi flowers displayed a delayed emission of myrcene and ocimene, peaking at midday (ZT6). In contrast, linalool was not affected. The emission of farnesene, a sesquiterpene that derives from farnesyl pyrophosphate (FPP) by addition of isopentyl diphosphate (IPP) to GPP [62], was advanced in transgenic snapdragons (Figure 5, Table S6).
Altogether, our results suggest that AmLHY regulates the synthesis and/or emission of volatile compounds at different levels. First, principal changes were found in minor compounds contribution, which comprises the highest diversity fraction of snapdragon aroma. Second, the emission of those VOCs derived from trans-cinnamic acid (benzaldehyde and methyl cinnamate) started earlier, whereas the compounds that derived from benzoic acid (methyl benzoate and methyl salicylate) started later. The terpenes myrcene and ocimene, which shared the precursor GPP, also displayed a delayed emission phenotype, while farnesene peaked early in RNAi lines.
4. Discussion
In this work, we have performed a functional analysis of the Antirrhinum majus LHY gene. The LHY gene is found as a single copy gene in many plants such as Petunia, Arabidopsis, tomato, or Nicotiana attenuata [23,57]. Our results indicate that in Antirrhinum there is a single gene that may have similar functions to the ones described in Arabidopsis, Petunia, or Nicotiana, including control of growth and scent emission. In this work, we have uncovered a function in floral development where it enhances growth speed.
We found that loss of function of LHY in Antirrhinum does not affect organ identity. Despite the importance of the plant circadian clock on the maintenance of the photosynthetic apparatus [63,64] , our results indicate that the plant circadian clock is not involved in the degradation of the chlorophyll machinery during petal development. Sepaloid petals result from decreased activity of B function genes and their targets [65], but we could not find evidence for an effect of AmLHY on petal identity. The transcriptional structure of the plant circadian clock varies between tissues and possible changes of the plant clock in petals versus other tissues or organs remains to be determined.
The size of plant lateral organs is the result of a combination of cell division and expansion. A variety of mutants affecting these processes in Antirrhinum show that petal growth can be differentially affected by genes indicating an intricate coordination of cell division, cell expansion, and compensation mechanisms [66]. The plant circadian clock is known to control cell expansion, our results demonstrate that AmLHY did not affect equally all the floral parameters analyzed. Our results did not differ from the findings in nightshades as down regulation of LHY does not affect floral size, petal junction distance, and corolla length, in Nicotiana attenuata or Petunia [27,28].
The temporal timing of cell division and expansion plays a key role in plant development. Both the length of the growth period and growth rate determine the final size of an organ. Our phenomic analysis of the Antirrhinum flower shows that the growth period is not controlled by AmLHY whereas the growth rate is substantially reduced. We may conclude that the period between cell divisions could be elongated in RNAi:AmLHY plants, resulting in organs with fewer and/or smaller cells. This hypothesis may require additional testing. Recent studies indicate that LHY represses abscisic acid (ABA) synthesis and signaling pathways [61], indicating that the newly identified effect of AmLHY on growth may occur via modulation of ABA. Our results are congruent due to the slow growth rate observed in RNAi plants highlighting the role of the circadian clock in flower development. The fact that floral organ size is not significantly reduced but growth speed is slowed in AmLHY knockdown lines indicates that compensation in terms of growth time may be occurring in order to achieve wild type organ size.
Floral scent profiles play a key role in the interaction of plants with both pollinators and pests [14]. The volatile blend is thought to be a complex interphase of interaction, and it is specific for a species [60]. The A. majus scent profile is highly complex as it comprises phenylpropanoids/benzenoids, and terpenes amongst the major VOCs. Previous studies showed that silencing ZTL in Nicotiana atenuatta causes a major reduction of benzyl acetone while LHY causes an early emission. The down regulation of PhLHY causes an earlier emission and reduction of methyl benzoate and benzyl benzoate [27,28]. Interestingly, bumblebees, one of the A. majus pollinators, are capable of detecting variations in aroma blends among snapdragon species, and wild Antirrhinum emitting different scent blends appear to have specialized pollinators [67,68]. As silencing AmLHY resulted in new aroma ratios, it may alter pollinators behaviour. Future studies may address the effect of silencing AmLHY and the interaction with pollinators as well as pests and/or pathogens.
We found that AmLHY plays a complex and central role in the coordination of floral scent emission, affecting timing and scent profile. While it does not have a major effect on the total emission, it has a profound effect on the emission of single volatiles. An important difference between Antirrhinum and the Solanaceae Nicotiana and Petunia is that it emits floral volatiles preferentially during the day. In contrast to previously published work in Petunia [27], we found that the down regulation of AmLHY caused a delayed emission of methyl benzoate (Figure 5). We can conclude that as the expression patterns of AmLHY and PhLHY are identical, the opposite effect on individual scent components emission timing is probably coordinated by a second layer of transcription factors. As the emission of single volatiles from the phenylpropanoids/benzenoids and monoterpene/sesquiterpenes is advanced or delayed in a consistent manner it appears that there might be either a difference at the transcriptional level or at the actual metabolic flux, giving rise to the observed differences. These two scenarios are not mutally exclusive and future research should help us understand the fine tuning of scent emission by AmLHY.
5. Conclusions
Our work shows that AmLHY plays a role in growth and scent emission. The combination of floral organ identity and circadian control are main factors required for proper flower development. Our results also revealed that the complexity of floral aroma depends on timing emission, which is under circadian clock regulation, and the contribution (or amount) of every single volatile. Interestingly, the down-regulation of AmLHY affected volatiles biosynthesis pathways at different branches. Timing of emission is an additional variable that may be well worth testing in plant-insect interactions.
Supplementary Materials
The following are available online at https://www.mdpi.com/2073-4409/8/8/920/s1, Movie S1: Snapdragon flowers growth, Figure S1: Phylogenetic reconstruction of AmLHY, LHY, and RVE predicted proteins, Figure S2: AtLHY and AmLHY protein alignment, Figure S3: Floral parameters in non-transgenic (WT) and transgenic lines (RNAi:AmLHY), Figure S4: 24 h scent profile, Figure S5: Total volatile amounts, Table S1: Accession numbers of proteins used in phylogenetic reconstruction, Table S2: BLAST analysis, Table S3: PCR primers used in the current study, Table S4: Analysis of floral parameters in non-transgenic and transgenic lines, Table S5: Retention time in minutes Table S6: Analysis of daily emitted volatiles with the algorithm JTK_CYCLE.
Author Contributions
Conceptualization, M.I.T., F.P.-S., P.J.N., J.W. and M.E.-C.; data curation, M.I.T., F.P.-S., J.W., and M.E.-C.; formal analysis, M.I.T., F.P.-S., P.J.N., J.W., and M.E.-C.; funding acquisition, P.J.N., J.W. and M.E.-C.; investigation, M.I.T., F.P.-S., P.J.N., J.W., and M.E.-C.; Methodology, M.I.T., F.P.-S., P.J.N., and M.E.-C.; project administration, P.J.N., J.W., and M.E.-C.; resources, J.W. and M.E.-C.; software, F.P.-S. and P.J.N.; supervision, P.J.N., J.W., and M.E.-C.; validation, M.E.-C.; writing—original draft, M.I.T., J.W. and M.E.-C.; writing—review and editing, M.I.T., F.P.-S., P.J.N., J.W., and M.E.-C.
Funding
This research was funded by Ministerio de Ciencia, Innovación y Universidades MICINN grants BFU-2017- 88300-C2–1-R (JW and MEC) and BFU-2017- 88300-C2-2-R (PJN).
Conflicts of Interest
The authors declare no conflict of interest.
References
- Irish, V. The ABC model of floral development. Curr. Biol. 2017, 27, R887–R890. [Google Scholar] [CrossRef] [PubMed] [Green Version]
- Davies, B.; Egea-Cortines, M.; de Andrade Silva, E.; Saedler, H.; Sommer, H. Multiple interactions amongst floral homeotic MADS box proteins. EMBO J. 1996, 15, 4330–4343. [Google Scholar] [CrossRef] [PubMed]
- Egea-Cortines, M.; Saedler, H.; Sommer, H. Ternary complex formation between the MADS-box proteins SQUAMOSA, DEFICIENS and GLOBOSA is involved in the control of floral architecture in Antirrhinum majus. EMBO J. 1999, 18, 5370–5379. [Google Scholar] [CrossRef] [PubMed] [Green Version]
- Bradley, D.; Carpenter, R.; Sommer, H.; Hartley, N.; Coen, E. Complementary floral homeotic phenotypes result from opposite orientations of a transposon at the plena locus of antirrhinum. Cell 1993, 72, 85–95. [Google Scholar] [CrossRef]
- Lenhard, M.; Bohnert, A.; Jürgens, G.; Laux, T. Termination of Stem Cell Maintenance in Arabidopsis Floral Meristems by Interactions between WUSCHEL and AGAMOUS. Cell 2001, 105, 805–814. [Google Scholar] [CrossRef] [Green Version]
- Lohmann, J.U.; Hong, R.L.; Hobe, M.; Busch, M.A.; Parcy, F.; Simon, R.; Weigel, D. A Molecular Link between Stem Cell Regulation and Floral Patterning in Arabidopsis. Cell 2001, 105, 793–803. [Google Scholar] [CrossRef] [Green Version]
- Bey, M.; Stüber, K.; Fellenberg, K.; Schwarz-Sommer, Z.; Sommer, H.; Saedler, H.; Zachgo, S. Characterization of Antirrhinum Petal Development and Identification of Target Genes of the Class B MADS Box Gene DEFICIENS. Plant Cell 2004, 16, 3197–3215. [Google Scholar] [CrossRef]
- Manchado-Rojo, M.; Delgado-Benarroch, L.; Roca, M.J.; Weiss, J.; Egea-Cortines, M. Quantitative levels of Deficiens and Globosa during late petal development show a complex transcriptional network topology of B function. Plant J. 2012, 72. [Google Scholar] [CrossRef]
- Reale, L.; Porceddu, A.; Lanfaloni, L.; Moretti, C.; Zenoni, S.; Pezzotti, M.; Romano, B.; Ferranti, F. Patterns of cell division and expansion in developing petals of Petunia hybrida. Sex. Plant Reprod. 2002, 15, 123–132. [Google Scholar] [CrossRef]
- Weiss, J.; Delgado-Benarroch, L.; Egea-Cortines, M. Genetic control of floral size and proportions. Int. J. Dev. Biol. 2004, 49, 513–525. [Google Scholar] [CrossRef]
- Zenoni, S.; Fasoli, M.; Tornielli, G.B.; Santo, S.D.; Sanson, A.; de Groot, P.; Sordo, S.; Citterio, S.; Monti, F.; Pezzotti, M. Overexpression of PhEXPA1 increases cell size, modifies cell wall polymer composition and affects the timing of axillary meristem development in Petunia hybrida. New Phytol. 2011, 191, 662–677. [Google Scholar] [CrossRef]
- Zenoni, S.; Reale, L.; Tornielli, G.B.; Lanfaloni, L.; Porceddu, A.; Ferrarini, A.; Moretti, C.; Zamboni, A.; Speghini, A.; Ferranti, F.; et al. Downregulation of the Petunia hybrida α-Expansin Gene PhEXP1 Reduces the Amount of Crystalline Cellulose in Cell Walls and Leads to Phenotypic Changes in Petal Limbs. Plant Cell 2004, 16, 295–308. [Google Scholar] [CrossRef]
- Adebesin, F.; Widhalm, J.R.; Boachon, B.; Lefèvre, F.; Pierman, B.; Lynch, J.H.; Alam, I.; Junqueira, B.; Benke, R.; Ray, S.; et al. Emission of volatile organic compounds from petunia flowers is facilitated by an ABC transporter. Science 2017, 356, 1386–1388. [Google Scholar] [CrossRef] [Green Version]
- Kessler, D.; Diezel, C.; Clark, D.G.; Colquhoun, T.A.; Baldwin, I.T. Petunia flowers solve the defence/apparency dilemma of pollinator attraction by deploying complex floral blends. Ecol. Lett. 2013, 16, 299–306. [Google Scholar] [CrossRef]
- Turlings, T.C.; Ton, J. Exploiting scents of distress: The prospect of manipulating herbivore-induced plant odours to enhance the control of agricultural pests. Curr. Opin. Plant Biol. 2006, 9, 421–427. [Google Scholar] [CrossRef]
- Verhoeven, H.A.; Blaas, J.; Brandenburg, W.A. Fragrance Profiles of Wild and Cultivated Roses. In Reference Module in Life Sciences; Elsevier: Amsterdam, The Netherlands, 2017; ISBN 978-0-12-809633-8. [Google Scholar]
- Pichersky, E.; Dudareva, N. Scent engineering: Toward the goal of controlling how flowers smell. Trends Biotechnol. 2007, 25, 105–110. [Google Scholar] [CrossRef]
- Kolosova, N.; Gorenstein, N.; Kish, C.M.; Dudareva, N. Regulation of Circadian Methyl Benzoate Emission in Diurnally and Nocturnally Emitting Plants. Plant Cell 2001, 13, 2333–2347. [Google Scholar] [CrossRef] [Green Version]
- Dötterl, S.; Wolfe, L.M.; Jürgens, A. Qualitative and quantitative analyses of flower scent in Silene latifolia. Phytochemistry 2005, 66, 203–213. [Google Scholar] [CrossRef]
- Hendel-Rahmanim, K.; Masci, T.; Vainstein, A.; Weiss, D. Diurnal regulation of scent emission in rose flowers. Planta 2007, 226, 1491–1499. [Google Scholar] [CrossRef]
- de Montaigu, A.; Tóth, R.; Coupland, G.; Toth, R.; Coupland, G. Plant development goes like clockwork. Trends Genet 2010, 26, 296–306. [Google Scholar] [CrossRef]
- Müller, N.A.; Wijnen, C.L.; Srinivasan, A.; Ryngajllo, M.; Ofner, I.; Lin, T.; Ranjan, A.; West, D.; Maloof, J.N.; Sinha, N.R.; et al. Domestication selected for deceleration of the circadian clock in cultivated tomato. Nat. Genet. 2016, 48, 89–93. [Google Scholar] [CrossRef]
- Bombarely, A.; Moser, M.; Amrad, A.; Bao, M.; Bapaume, L.; Barry, C.; Bliek, M.; Boersma, M.; Borghi, L.; Bruggmann, R.; et al. Insight into the evolution of the Solanaceae from the parental genomes of Petunia hybrida. Nat. Plants 2016, 2, 1–9. [Google Scholar] [CrossRef]
- Marcolino-Gomes, J.; Rodrigues, F.A.; Fuganti-Pagliarini, R.; Bendix, C.; Nakayama, T.J.; Celaya, B.; Molinari, H.B.C.; de Oliveira, M.C.N.; Harmon, F.G.; Nepomuceno, A. Diurnal Oscillations of Soybean Circadian Clock and Drought Responsive Genes. PLoS ONE 2014, 9, e86402. [Google Scholar] [CrossRef]
- de Lucas, M.; Prat, S. PIFs get BRright: PHYTOCHROME INTERACTING FACTORs as integrators of light and hormonal signals. New Phytol. 2014, 202, 1126–1141. [Google Scholar] [CrossRef]
- Fung-Uceda, J.; Lee, K.; Seo, P.J.; Polyn, S.; De Veylder, L.; Mas, P. The Circadian Clock Sets the Time of DNA Replication Licensing to Regulate Growth in Arabidopsis. Dev. Cell 2018, 45, 101–113. [Google Scholar] [CrossRef]
- Fenske, M.P.; Hewett Hazelton, K.D.; Hempton, A.K.; Shim, J.S.; Yamamoto, B.M.; Riffell, J.A.; Imaizumi, T. Circadian clock gene LATE ELONGATED HYPOCOTYL directly regulates the timing of floral scent emission in Petunia. Proc. Natl. Acad. Sci. USA. 2015, 112, 9775–9780. [Google Scholar] [CrossRef]
- Yon, F.; Joo, Y.; Cort, L.; Rothe, E.; Baldwin, I.T.; Kim, S.; Kim, S. Silencing Nicotiana attenuata LHY and ZTL alters circadian rhythms in flowers. New Phytol. 2015, 209, 1058–1066. [Google Scholar] [CrossRef]
- Terry, M.I.; Pérez-Sanz, F.; Díaz-Galián, M.V.; Pérez de los Cobos, F.; Navarro, P.J.; Egea-Cortines, M.; Weiss, J. The Petunia CHANEL Gene is a ZEITLUPE Ortholog Coordinating Growth and Scent Profiles. Cells 2019, 8, 343. [Google Scholar] [CrossRef]
- Birney, E.; Clamp, M.; Durbin, R. GeneWise and Genomewise. Genome Res. 2004, 14, 988–995. [Google Scholar] [CrossRef] [Green Version]
- Li, M.; Zhang, D.; Gao, Q.; Luo, Y.; Zhang, H.; Ma, B.; Chen, C.; Whibley, A.; Zhang, Y.; Cao, Y.; et al. Genome structure and evolution of Antirrhinum majus L. Nat. Plants 2019, 5, 174. [Google Scholar] [CrossRef]
- Thompson, J.D.; Gibson, T.J.; Higgins, D.G. Multiple Sequence Alignment Using ClustalW and ClustalX. Curr. Protoc. Bioinforma. 2003, 2–3. [Google Scholar] [CrossRef]
- Paradis, E.; Claude, J.; Strimmer, K. APE: Analyses of Phylogenetics and Evolution in R language. Bioinformatics 2004, 20, 289–290. [Google Scholar] [CrossRef] [Green Version]
- Schliep, K.P. phangorn: Phylogenetic analysis in R. Bioinformatics 2011, 27, 592–593. [Google Scholar] [CrossRef]
- Jones, D.T.; Taylor, W.R.; Thornton, J.M. The rapid generation of mutation data matrices from protein sequences. Bioinformatics 1992, 8, 275–282. [Google Scholar] [CrossRef]
- Yu, G.; Smith, D.K.; Zhu, H.; Guan, Y.; Lam, T.T.-Y. ggtree: An r package for visualization and annotation of phylogenetic trees with their covariates and other associated data. Methods Ecol. Evol. 2017, 8, 28–36. [Google Scholar] [CrossRef]
- Hulo, N.; Bairoch, A.; Bulliard, V.; Cerutti, L.; De Castro, E.; Langendijk-Genevaux, P.S.; Pagni, M.; Sigrist, C.J.A. The PROSITE database. Nucleic Acids Res. 2006, 34, D227–D230. [Google Scholar] [CrossRef] [Green Version]
- Brennan, P. drawProteins: A Bioconductor/R package for reproducible and programmatic generation of protein schematics. F1000Research 2018, 7, 1–15. [Google Scholar] [CrossRef]
- Helliwell, C.; Waterhouse, P. Constructs and methods for high-throughput gene silencing in plants. Methods 2003, 30, 289–295. [Google Scholar] [CrossRef]
- Stubbe, H. Genetik und Zytologie von Antirrhinum L. sect. Antirrhinum; Veb Gustav Fisher Verlag: Jena, Germany, 1966. [Google Scholar]
- Schwarz-Sommer, Z.; Gubitz, T.; Weiss, J.; Gomez-di-Marco, P.; Delgado-Benarroch, L.; Hudson, A.; Egea-Cortines, M. A molecular recombination map of Antirrhinum majus. BMC Plant Biol. 2010, 10, 275. [Google Scholar] [CrossRef]
- Box, M.S.; Coustham, V.; Dean, C.; Mylne, J.S. Protocol: A simple phenol-based method for 96-well extraction of high quality RNA from Arabidopsis. Plant Methods 2011, 7, 7. [Google Scholar] [CrossRef]
- Schmittgen, T.D.; Livak, K.J. Analyzing real-time PCR data by the comparative CT method. Nat. Protoc. 2008, 3, 1101–1108. [Google Scholar] [CrossRef]
- Bayo-Canha, A.; Delgado-Benarroch, L.; Weiss, J.; Egea-Cortines, M. Artificial decrease of leaf area affects inflorescence quality but not floral size in Antirrhinum majus. Sci. Hortic. 2007, 113, 383–386. [Google Scholar] [CrossRef]
- Navarro, P.J.; Fernández, C.; Weiss, J.; Egea-Cortines, M. Development of a configurable growth chamber with a computer vision system to study circadian rhythm in plants. Sensors 2012, 12, 15356–15375. [Google Scholar] [CrossRef]
- Navarro, P.; Pérez, F.; Weiss, J.; Egea-Cortines, M. Machine Learning and Computer Vision System for Phenotype Data Acquisition and Analysis in Plants. Sensors 2016, 16, 641. [Google Scholar] [CrossRef]
- Ruiz-Hernández, V.; Hermans, B.; Weiss, J.; Egea-Cortines, M. Genetic Analysis of Natural Variation in Antirrhinum Scent Profiles Identifies BENZOIC ACID CARBOXYMETHYL TRANSFERASE As the Major Locus Controlling Methyl Benzoate Synthesis. Front. Plant Sci. 2017, 8, 1–13. [Google Scholar] [CrossRef]
- Ruiz-Hernández, V.; Roca, M.J.; Egea-Cortines, M.; Weiss, J. A comparison of semi-quantitative methods suitable for establishing volatile profiles. Plant Methods 2018, 14, 67. [Google Scholar] [CrossRef]
- Wu, G.; Anafi, R.C.; Hughes, M.E.; Kornacker, K.; Hogenesch, J.B. MetaCycle: An integrated R package to evaluate periodicity in large scale data. Bioinformatics 2016, 32, 3351–3353. [Google Scholar] [CrossRef]
- Wickham, H. ggplot2: Elegant Graphics for Data Analysis; Springer: Berlin/Heidelberg, Germany, 2016; ISBN 978-3-319-24277-4. [Google Scholar]
- Garnier, S.; Ross, N.; Rudis, B.; Sciaini, M.; Scherer, C. viridis: Default Color Maps from “matplotlib”. 2018. [Google Scholar]
- Kutmon, M.; van Iersel, M.P.; Bohler, A.; Kelder, T.; Nunes, N.; Pico, A.R.; Evelo, C.T. PathVisio 3: An Extendable Pathway Analysis Toolbox. PLoS Comput. Biol. 2015, 11, e1004085. [Google Scholar] [CrossRef]
- Ogata, K.; Kanei-Ishii, C.; Sasaki, M.; Hatanaka, H.; Nagadoi, A.; Enari, M.; Nakamura, H.; Nishimura, Y.; Ishii, S.; Sarai, A. The cavity in the hydrophobic core of Myb DNA-binding domain is reserved for DNA recognition and trans -activation. Nat. Struct. Biol. 1996, 3, 178. [Google Scholar] [CrossRef]
- Schaffer, R.; Ramsay, N.; Samach, A.; Corden, S.; Putterill, J.; Carre, I.A.; Coupland, G.; Centre, J.I.; Lane, C. The late elongated hypocotyl Mutation of Arabidopsis Disrupts Circadian Rhythms and the Photoperiodic Control of Flowering. Cell 1998, 93, 1219–1229. [Google Scholar] [CrossRef]
- Andersson, C.R.; Harmer, S.L.; Schultz, T.F.; Kay, S.A. The Reveille (RVE) family of DNA binding proteins and circadian clock. Abstract. In Proceedings of the 10th International Conference on Arabidopsis Research, Melbourne, Australia, 4–8 July 1999. [Google Scholar]
- Weiss, J.; Terry, M.I.; Martos-Fuentes, M.; Letourneux, L.; Ruiz-hernández, V.; Fernández, J.A.; Egea-cortines, M. Diel pattern of circadian clock and storage protein gene expression in leaves and during seed filling in cowpea ( Vigna unguiculata ). BMC Plant Biol. 2018, 18, 33–53. [Google Scholar] [CrossRef]
- Yon, F.; Seo, P.-J.; Ryu, J.Y.; Park, C.-M.; Baldwin, I.T.; Kim, S.-G. Identification and characterization of circadian clock genes in a native tobacco, Nicotiana attenuata. BMC Plant Biol. 2012, 12, 172. [Google Scholar] [CrossRef]
- Delgado-Benarroch, L.; Causier, B.; Weiss, J.; Egea-Cortines, M. FORMOSA controls cell division and expansion during floral development in Antirrhinummajus. Planta 2009, 229, 1219–1229. [Google Scholar] [CrossRef]
- Kahm, M.; Hasenbrink, G.; Ludwig, J. grofit: Fitting Biological Growth Curves with R. J. Stat. Softw. 2010, 33, 1–21. [Google Scholar] [CrossRef]
- Weiss, J.; Mühlemann, J.K.; Ruiz-Hernández, V.; Dudareva, N.; Egea-Cortines, M. Phenotypic Space and Variation of Floral Scent Profiles during Late Flower Development in Antirrhinum. Front. Plant Sci. 2016, 7, 1–12. [Google Scholar] [CrossRef]
- Adams, S.; Grundy, J.; Veflingstad, S.R.; Dyer, N.P.; Hannah, M.A.; Ott, S.; Carré, I.A. Circadian control of abscisic acid biosynthesis and signalling pathways revealed by genome-wide analysis of LHY binding targets. New Phytol. 2018, 220, 893–907. [Google Scholar] [CrossRef]
- Dudareva, N.; Pichersky, E. Biochemical and Molecular Genetic Aspects of Floral Scents. PLANT Physiol. 2000, 122, 627–634. [Google Scholar] [CrossRef] [Green Version]
- Yakir, E.; Hilman, D.; Harir, Y.; Green, R.M. Regulation of output from the plant circadian clock. FEBS J. 2007, 274, 335–345. [Google Scholar] [CrossRef]
- Dodd, A.N.; Belbin, F.E.; Frank, A.; Webb, A.A.R. Interactions between circadian clocks and photosynthesis for the temporal and spatial coordination of metabolism. Front. Plant Sci. 2015, 6. [Google Scholar] [CrossRef] [Green Version]
- Mara, C.D.; Huang, T.; Irish, V.F. The Arabidopsis Floral Homeotic Proteins APETALA3 and PISTILLATA Negatively Regulate the BANQUO Genes Implicated in Light Signaling. Plant Cell 2010, 22, 690–702. [Google Scholar] [CrossRef]
- Delgado-Benarroch, L.; Weiss, J.; Egea-Cortines, M. The mutants compacta ähnlich, Nitida and Grandiflora define developmental compartments and a compensation mechanism in floral development in Antirrhinum majus. J. Plant Res. 2009, 122, 559–569. [Google Scholar] [CrossRef]
- Vargas, P.; Ornosa, C.; Ortiz-Sánchez, F.J.; Arroyo, J. Is the occluded corolla of Antirrhinum bee-specialized? J. Nat. Hist. 2010, 44, 1427–1443. [Google Scholar] [CrossRef]
- Suchet, C.; Dormont, L.; Schatz, B.; Giurfa, M.; Simon, V.; Raynaud, C.; Chave, J. Floral scent variation in two Antirrhinum majus subspecies influences the choice of naïve bumblebees. Behav. Ecol. Sociobiol. 2011, 65, 1015–1027. [Google Scholar] [CrossRef]
Figure 1.
AmLHY expression: (a) Daily expression in wild-type plants under a 12 h light/12 h dark (12LD) cyle; (b) AmLHY expression at ZT1.5 in wild-type (red) and transgenic lines RNAi:AmLHY14 (green), RNAi:AmLHY26 (blue) and RNAi:AmLHY27 (purple). Expression was determined by the ΔΔCt method using the wild-type as a control. Reference gene was AmUBI. Each bar represents the average ± standard deviation from 3 to 4 biological replicates.

Figure 2.
Growth curve, expressed in mm, of flowers of non-transgenic (WT, purple) and RNAi.AmLHY27 (green). Dots represent the raw data, solid lines indicate the adjusted curve and dashed lines denote the maximum slope, that corresponds to the maximum growth rate.
Figure 2.
Growth curve, expressed in mm, of flowers of non-transgenic (WT, purple) and RNAi.AmLHY27 (green). Dots represent the raw data, solid lines indicate the adjusted curve and dashed lines denote the maximum slope, that corresponds to the maximum growth rate.

Figure 3.
Daily scent emission of major compounds in wild type (a), and transgenic lines RNAi:AmLHY14 (b), RNAi:AmLHY26 (c), RNAi:AmLHY27 (d). An average of RNAi lines is represented in (e). ZT indicates zeitgeber time.
Figure 3.
Daily scent emission of major compounds in wild type (a), and transgenic lines RNAi:AmLHY14 (b), RNAi:AmLHY26 (c), RNAi:AmLHY27 (d). An average of RNAi lines is represented in (e). ZT indicates zeitgeber time.

Figure 4.
Daily scent emission of minor compounds in wild type (a), and transgenic lines RNAi:AmLHY14 (b), RNAi:AmLHY26 (c), RNAi:AmLHY27 (d). An average of RNAi lines is represented in (e). ZT indicates zeitgeber time.
Figure 4.
Daily scent emission of minor compounds in wild type (a), and transgenic lines RNAi:AmLHY14 (b), RNAi:AmLHY26 (c), RNAi:AmLHY27 (d). An average of RNAi lines is represented in (e). ZT indicates zeitgeber time.

Figure 5.
Schematic view of some phenylpropanoids/benzenoids (a), monoterpenes (b) and sesquiterpenes (c) pathway. Non-volatile compounds are represented in a dashed and blue rectangle and volatile compounds with a solid line and a rounded rectangle, the green color indicates a volatile that displays a delayed emission and the red color, an advanced emission. Enzymes and the C5 unit IPP (isopentyl diphosphate) are shown over the arrows. Enzyme abbreviations: BA2H (benzoic acid 2-hydroxylase), BALDH (benzaldehyde dehydrogenase), BAMT (benzoic acid carboxyl methyl transferase), CCMT (cinnamic acid carboxyl methyl transferase), FS (farnesene synthase), LS (linalool synthase), MYS (myrcene synthase), OCS (ocimene synthase), PAL (phenylalanine ammonia lyase) and SAMT (salicylic acid carboxyl methyl transferase).


Table 1.
AmLHY expression in wild-type and RNAi lines at ZT 1.5. Expression was normalized by WT. Average and standard deviation (SD) represents 3 to 4 biological replicates. The knock down percentage in RNAi lines is shown in the % KD column. Differences were tested by a Student’s t-test; a p-value <0.05 indicates a significant down-regulation.
| Group | Average | SD | % KD | p-Value |
|---|---|---|---|---|
| WT | 1 | 0.263 | ||
| RNAi:AmLHY14 | 0.093 | 0.063 | 90.66 | 0.001 |
| RNAi:AmLHY26 | 0.348 | 0.306 | 65.23 | 0.006 |
| RNAi:AmLHY27 | 0.256 | 0.178 | 74.44 | 0.003 |
Table 2.
Parameters obtained from the phenomic analysis. Maximum growth corresponds to final maximum of the curve in mm. The maximum slope indicates the growth rate. The area under the model is an estimation of the difference in accumulated growth.
Table 2.
Parameters obtained from the phenomic analysis. Maximum growth corresponds to final maximum of the curve in mm. The maximum slope indicates the growth rate. The area under the model is an estimation of the difference in accumulated growth.
| Group | Max. Growth/Std. Error | Max. Slope/Std. Error | Area |
|---|---|---|---|
| WT | 34.301/0.191 | 0.344/0.021 | 4892.457 |
| RNAi:AmLHY27 | 27.014/0.531 | 0.176/0.0078 | 3604.565 |
© 2019 by the authors. Licensee MDPI, Basel, Switzerland. This article is an open access article distributed under the terms and conditions of the Creative Commons Attribution (CC BY) license (http://creativecommons.org/licenses/by/4.0/).
Share and Cite
MDPI and ACS Style
Terry, M.I.; Pérez-Sanz, F.; Navarro, P.J.; Weiss, J.; Egea-Cortines, M. The Snapdragon LATE ELONGATED HYPOCOTYL Plays A Dual Role in Activating Floral Growth and Scent Emission. Cells 2019, 8, 920. https://doi.org/10.3390/cells8080920
AMA Style
Terry MI, Pérez-Sanz F, Navarro PJ, Weiss J, Egea-Cortines M. The Snapdragon LATE ELONGATED HYPOCOTYL Plays A Dual Role in Activating Floral Growth and Scent Emission. Cells. 2019; 8(8):920. https://doi.org/10.3390/cells8080920
Chicago/Turabian StyleTerry, Marta I., Fernando Pérez-Sanz, Pedro J. Navarro, Julia Weiss, and Marcos Egea-Cortines. 2019. "The Snapdragon LATE ELONGATED HYPOCOTYL Plays A Dual Role in Activating Floral Growth and Scent Emission" Cells 8, no. 8: 920. https://doi.org/10.3390/cells8080920
Note that from the first issue of 2016, this journal uses article numbers instead of page numbers. See further details here.