Kupffer Cells Sense Free Fatty Acids and Regulate Hepatic Lipid Metabolism in High-Fat Diet and Inflammation

 , and
, and 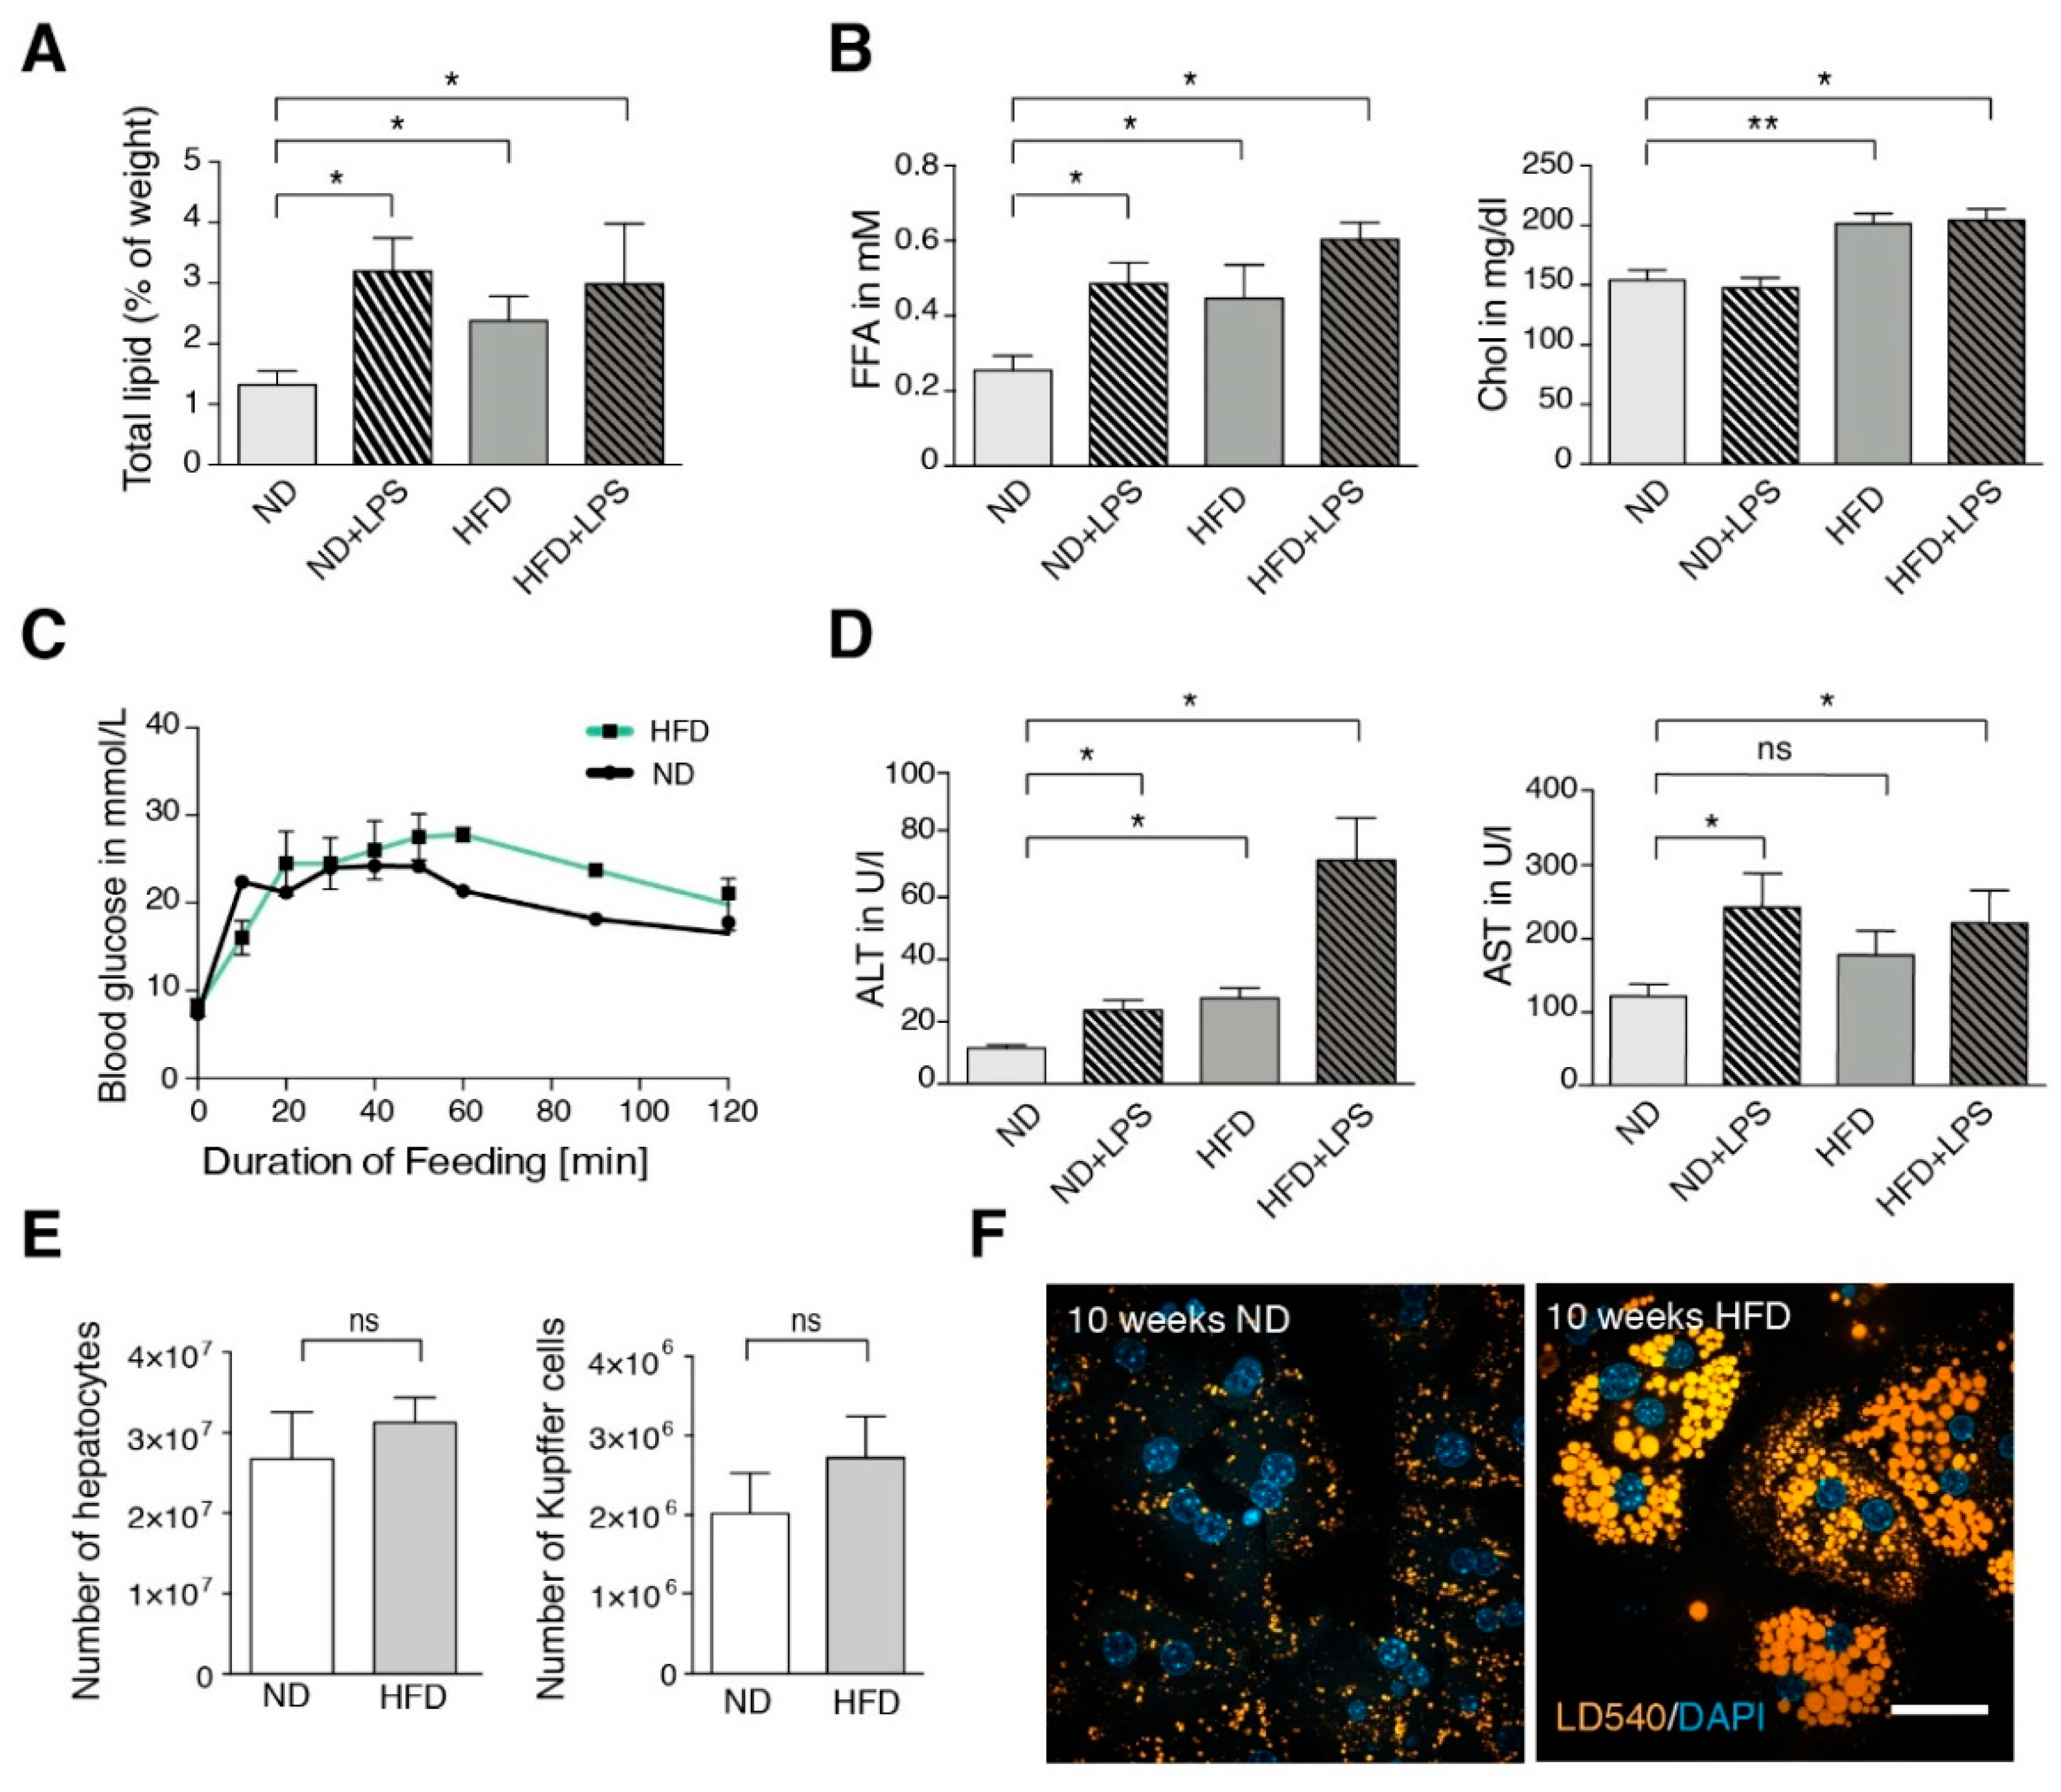
Abstract
:1. Introduction
2. Materials and Methods
2.1. Mouse Experiments In Vivo
2.1.1. Glucose Tolerance Tests
2.1.2. LPS and TNF In Vivo
2.1.3. Isolation and Culture of Hepatocytes and Kupffer Cells
2.1.4. Serum Parameters
2.1.5. Determination of Total Hepatic Lipid Content
2.2. In Vitro Experiments
2.2.1. LPS and TNF In Vitro
2.2.2. Hepatocyte/Kupffer Cell Co-Culture and Supernatant Transfer Experiments
2.2.3. Flow Cytometry
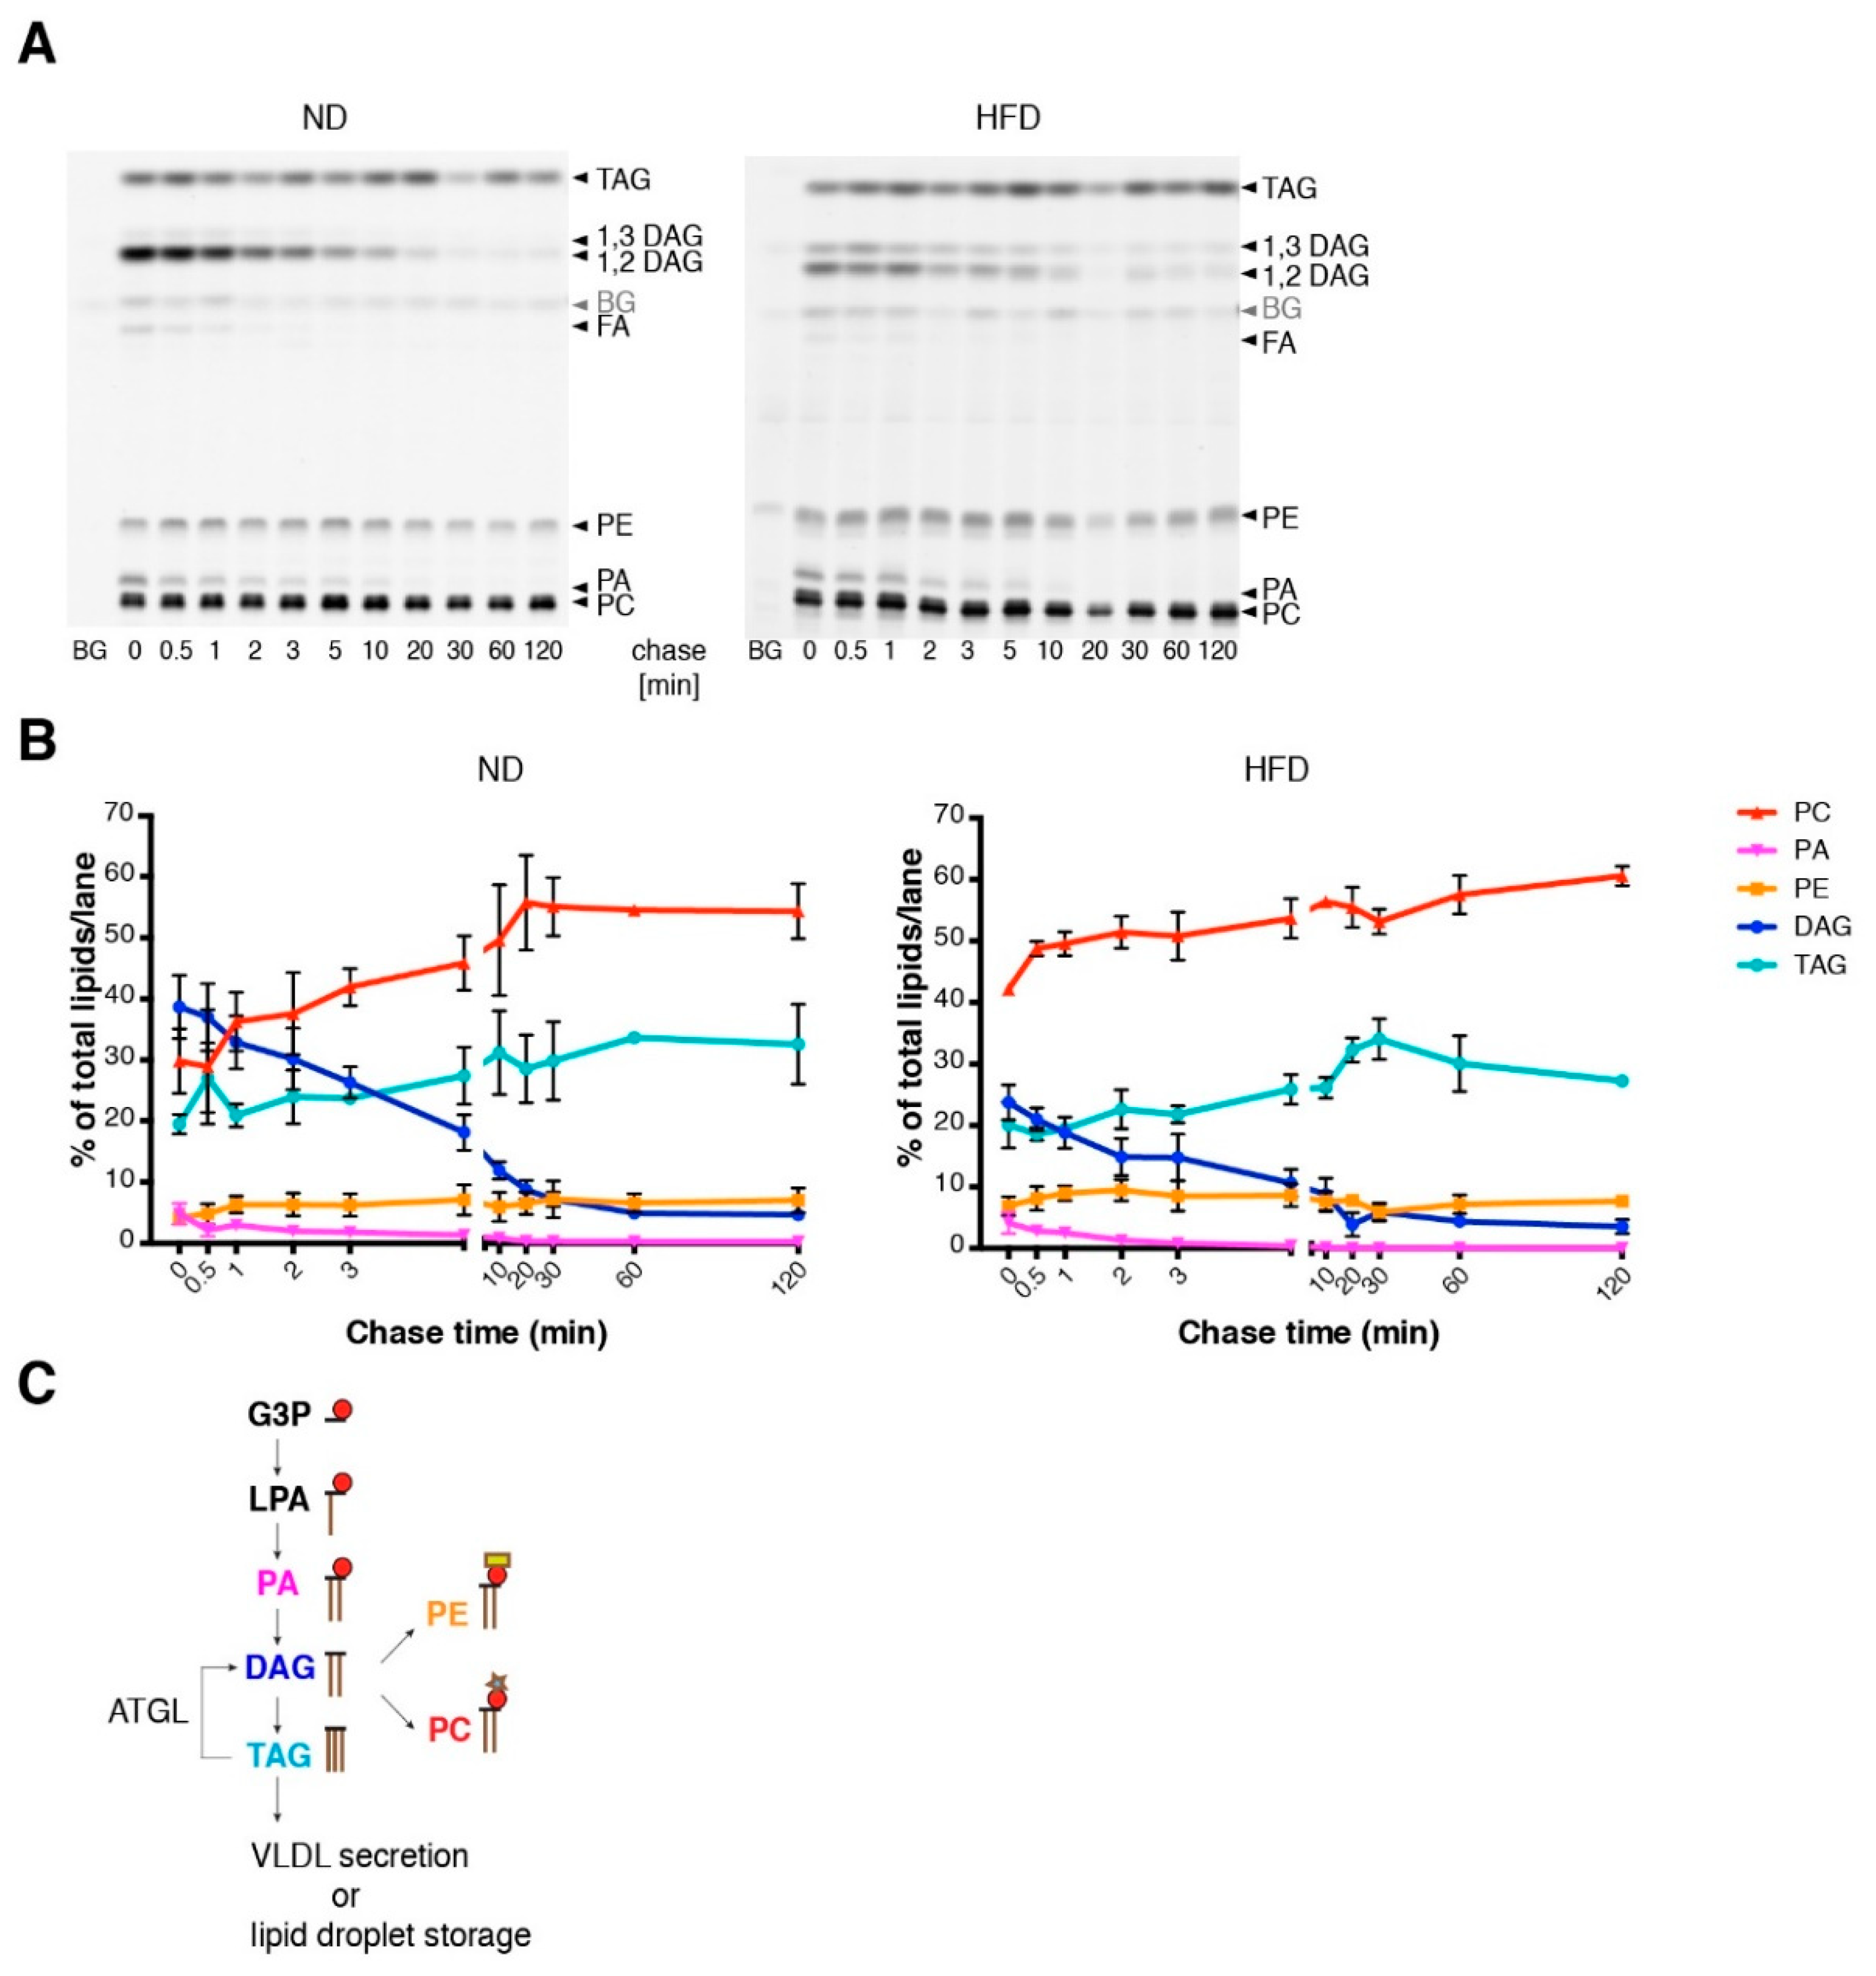
2.2.4. Pulse-Chase Experiments with Alkyne Lipids
2.2.5. ELISA
2.2.6. Fluorescence Microscopy
2.3. Statistical Analysis
3. Results
3.1. High-Fat Diet (HFD) Mice Show Mild Steatotic Characteristics
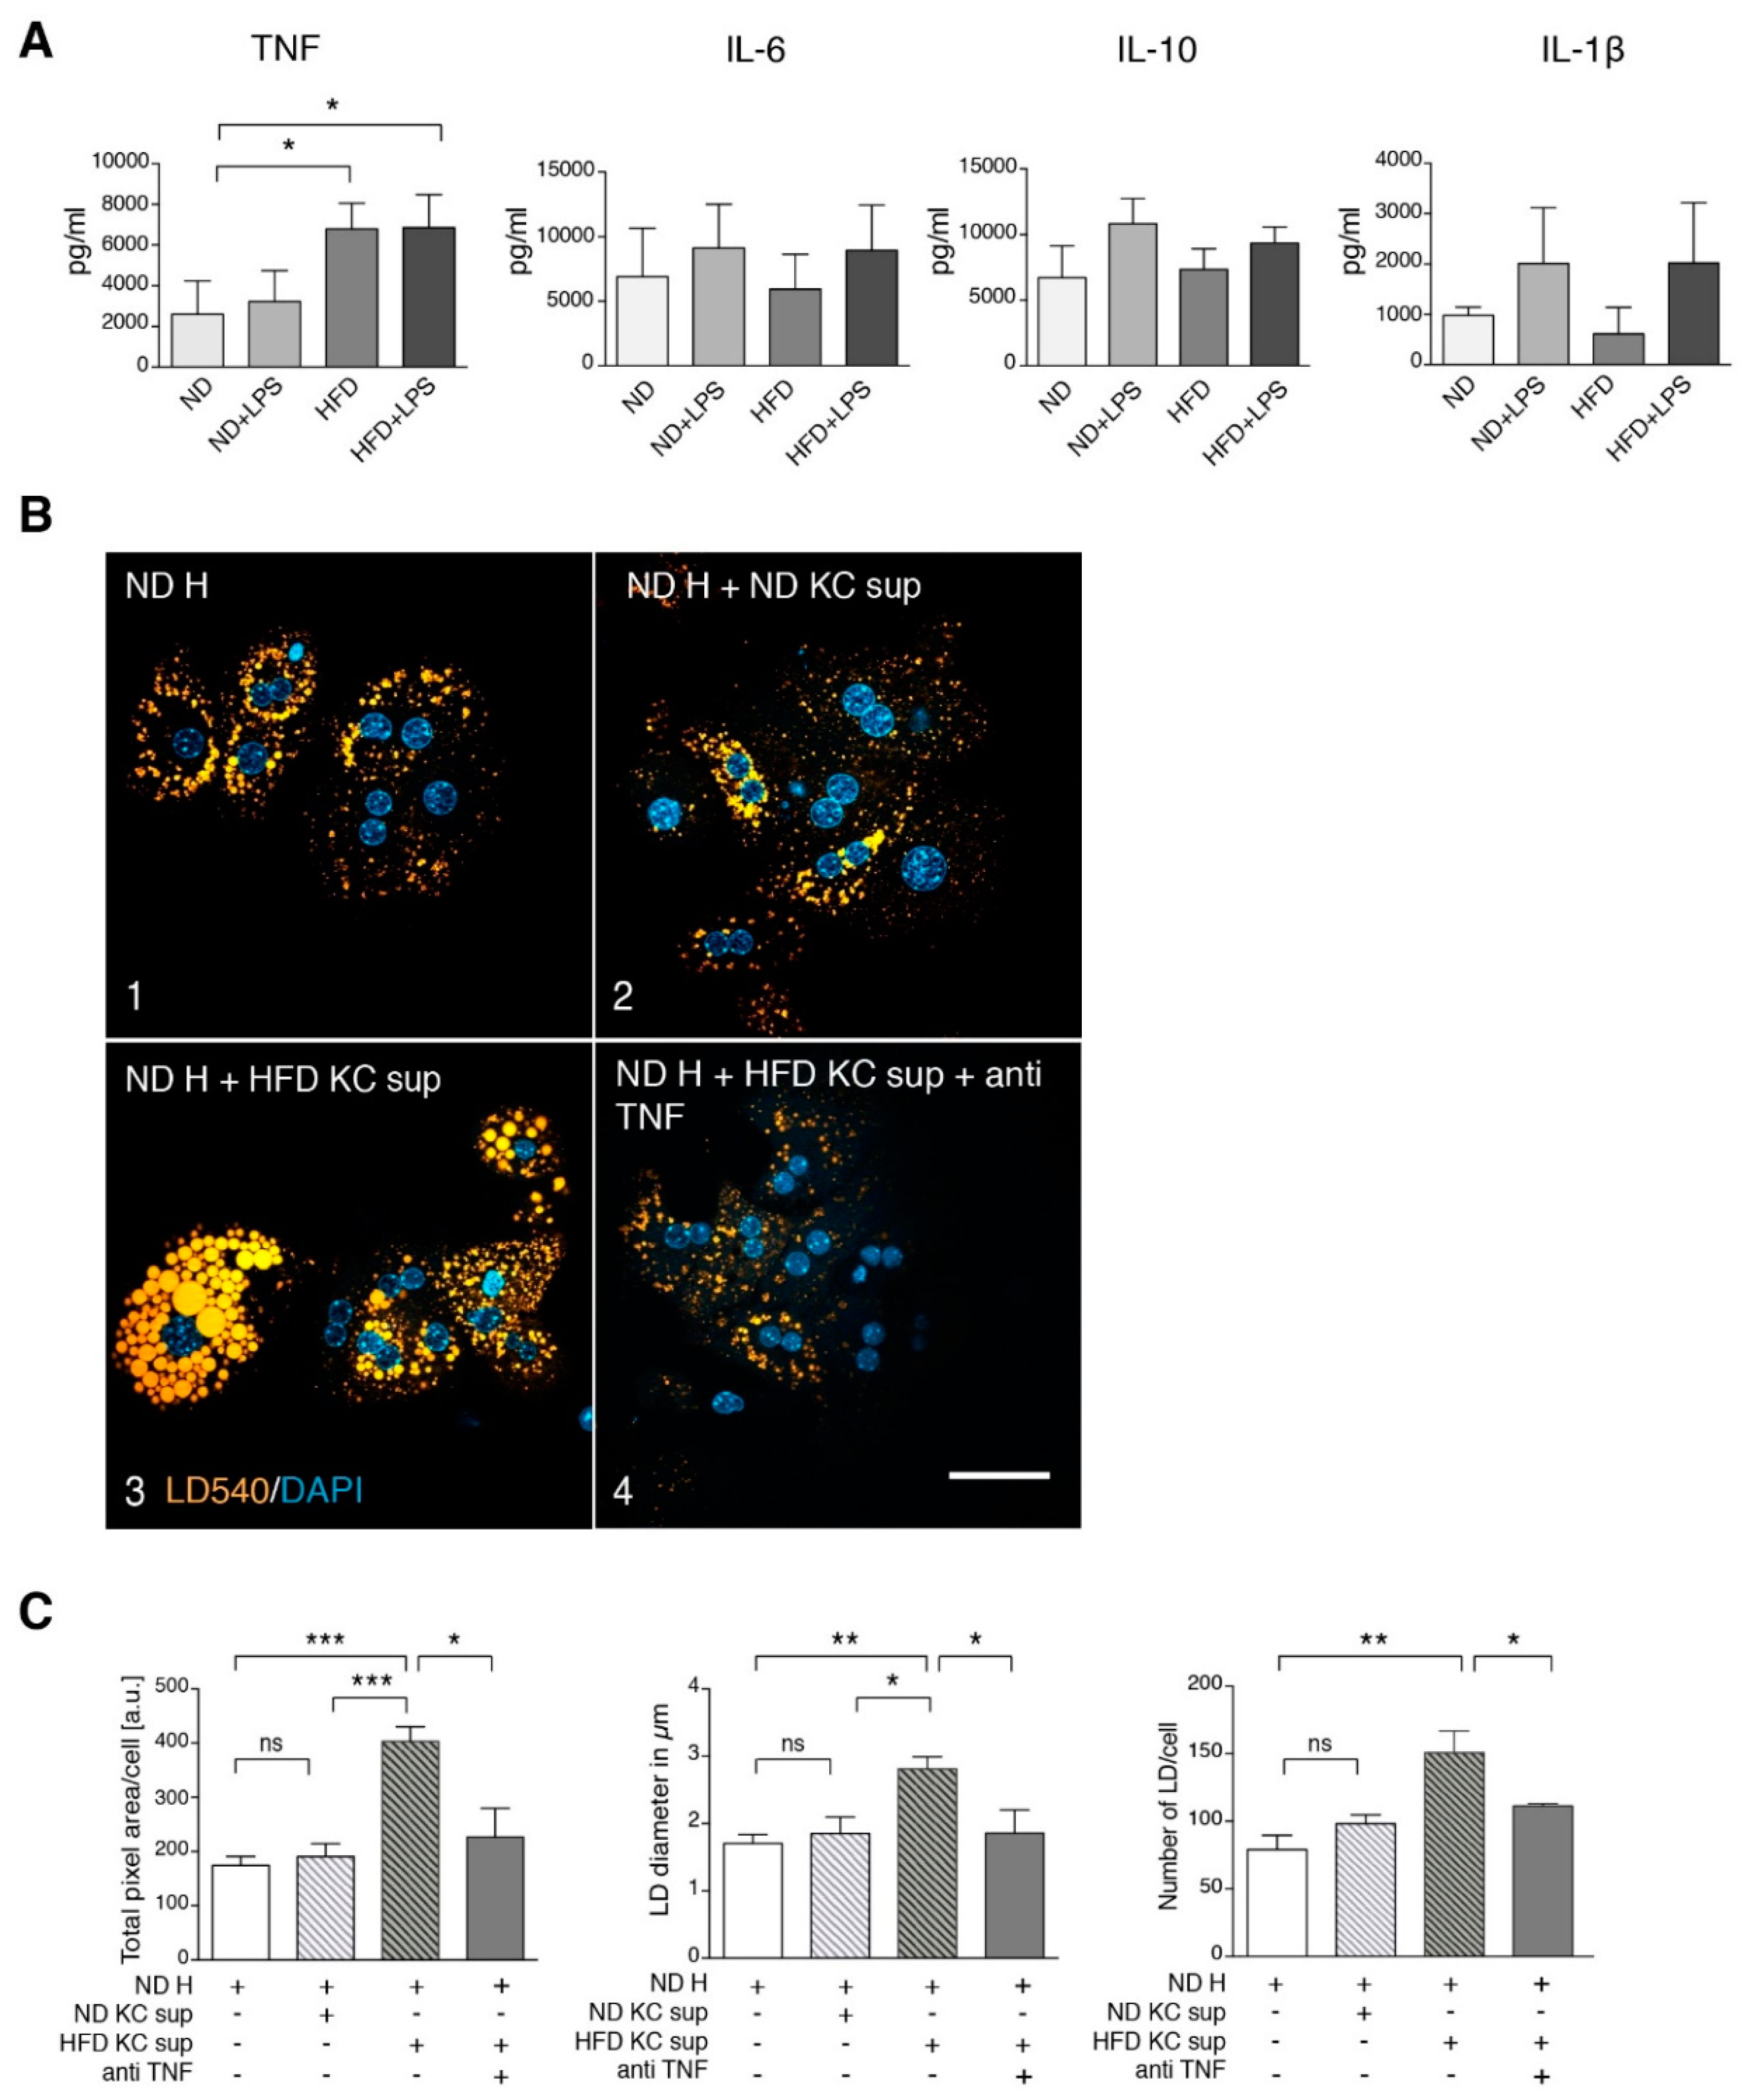
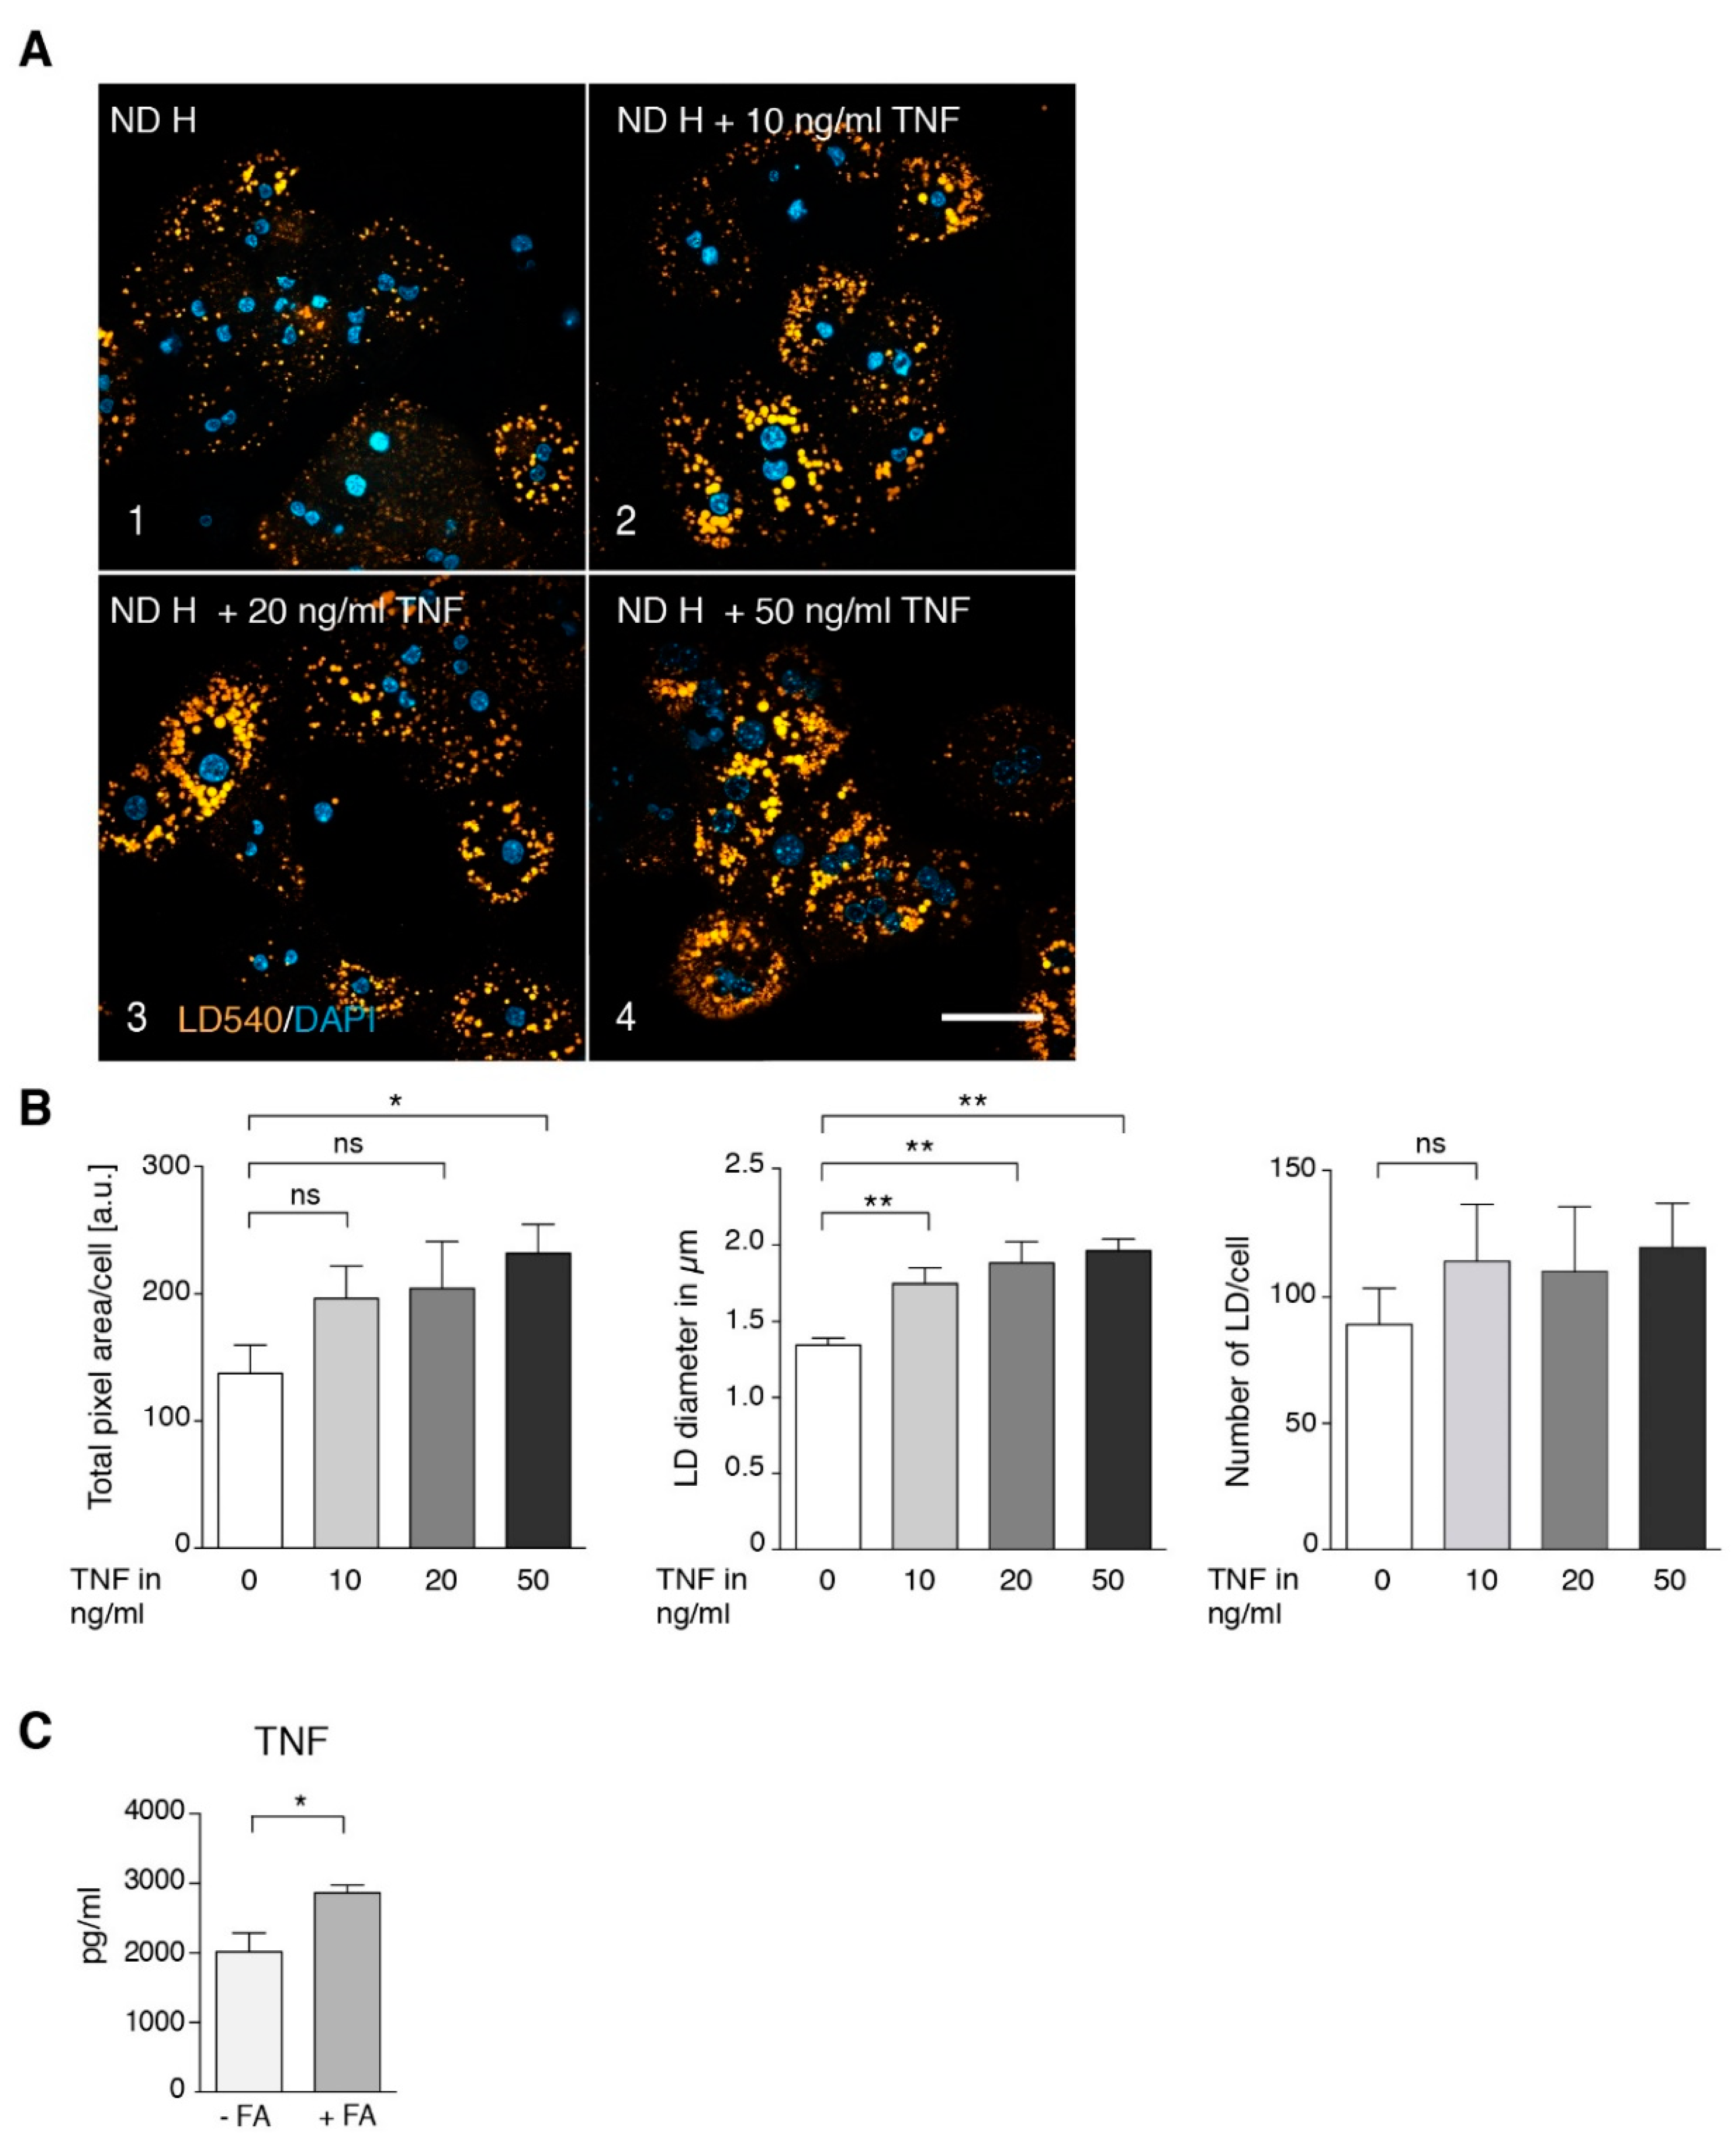
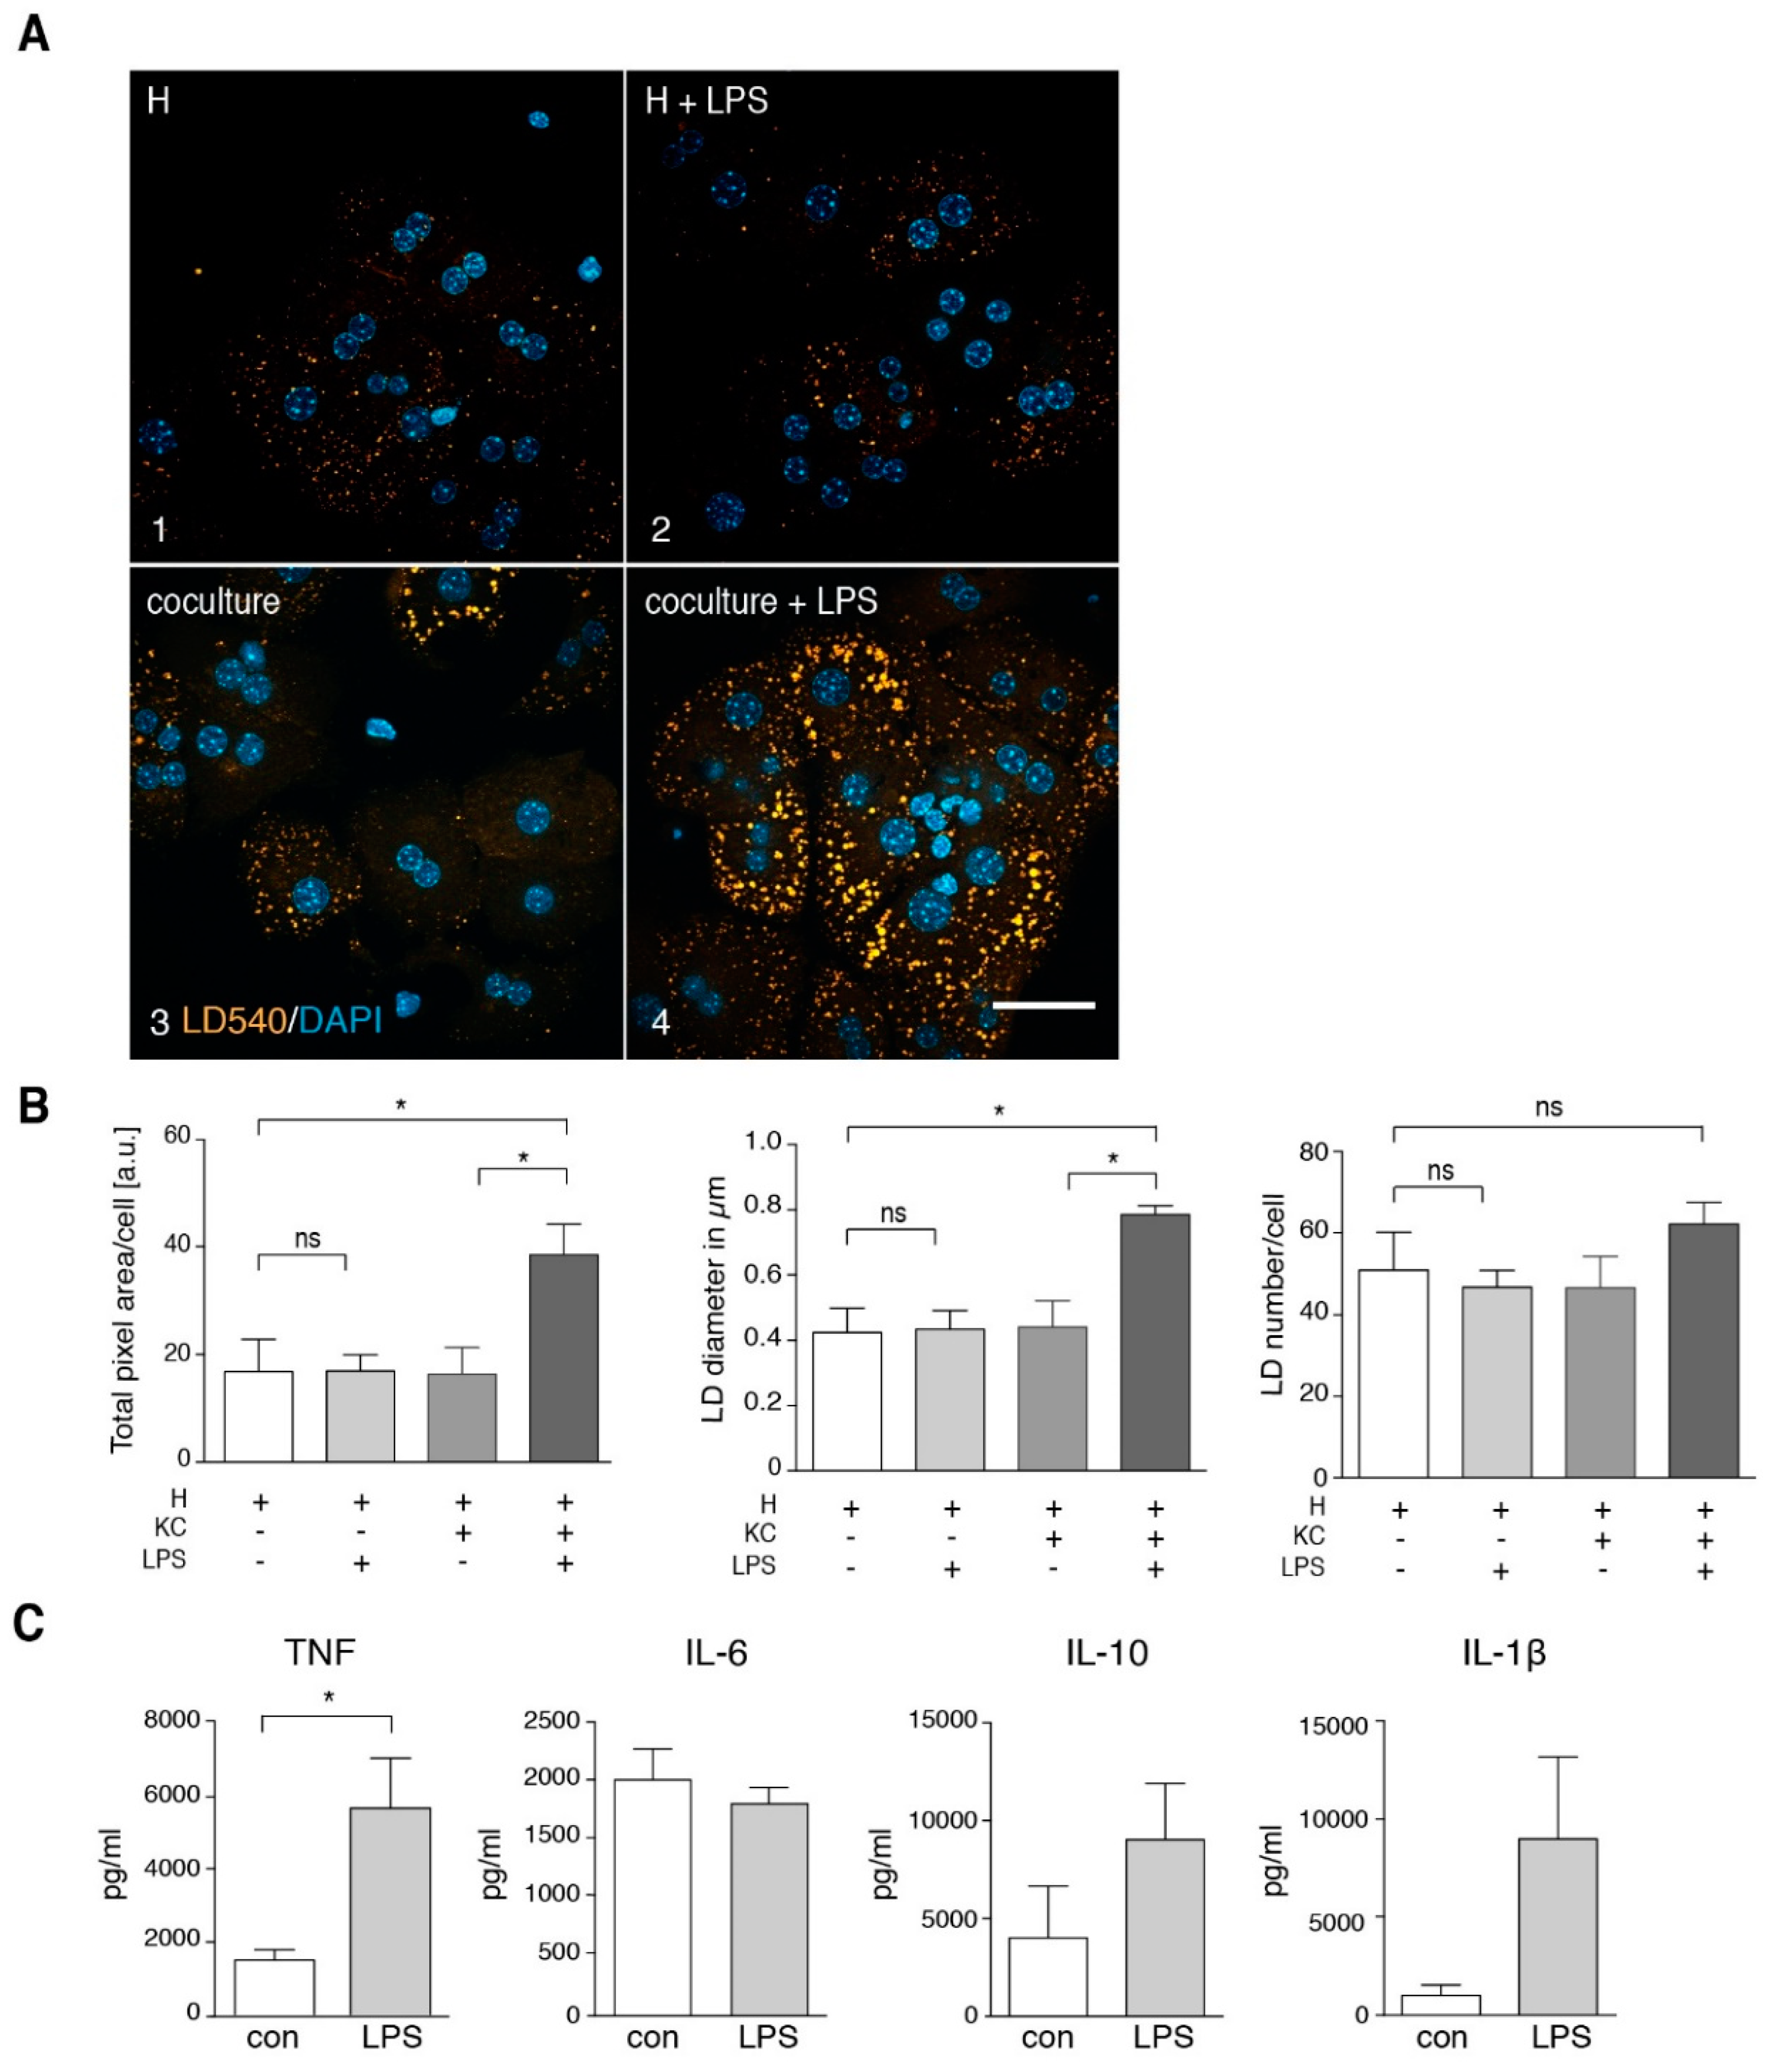
3.2. TNF Is a Major Player in Generating a Steatotic Phenotype in ND Hepatocytes
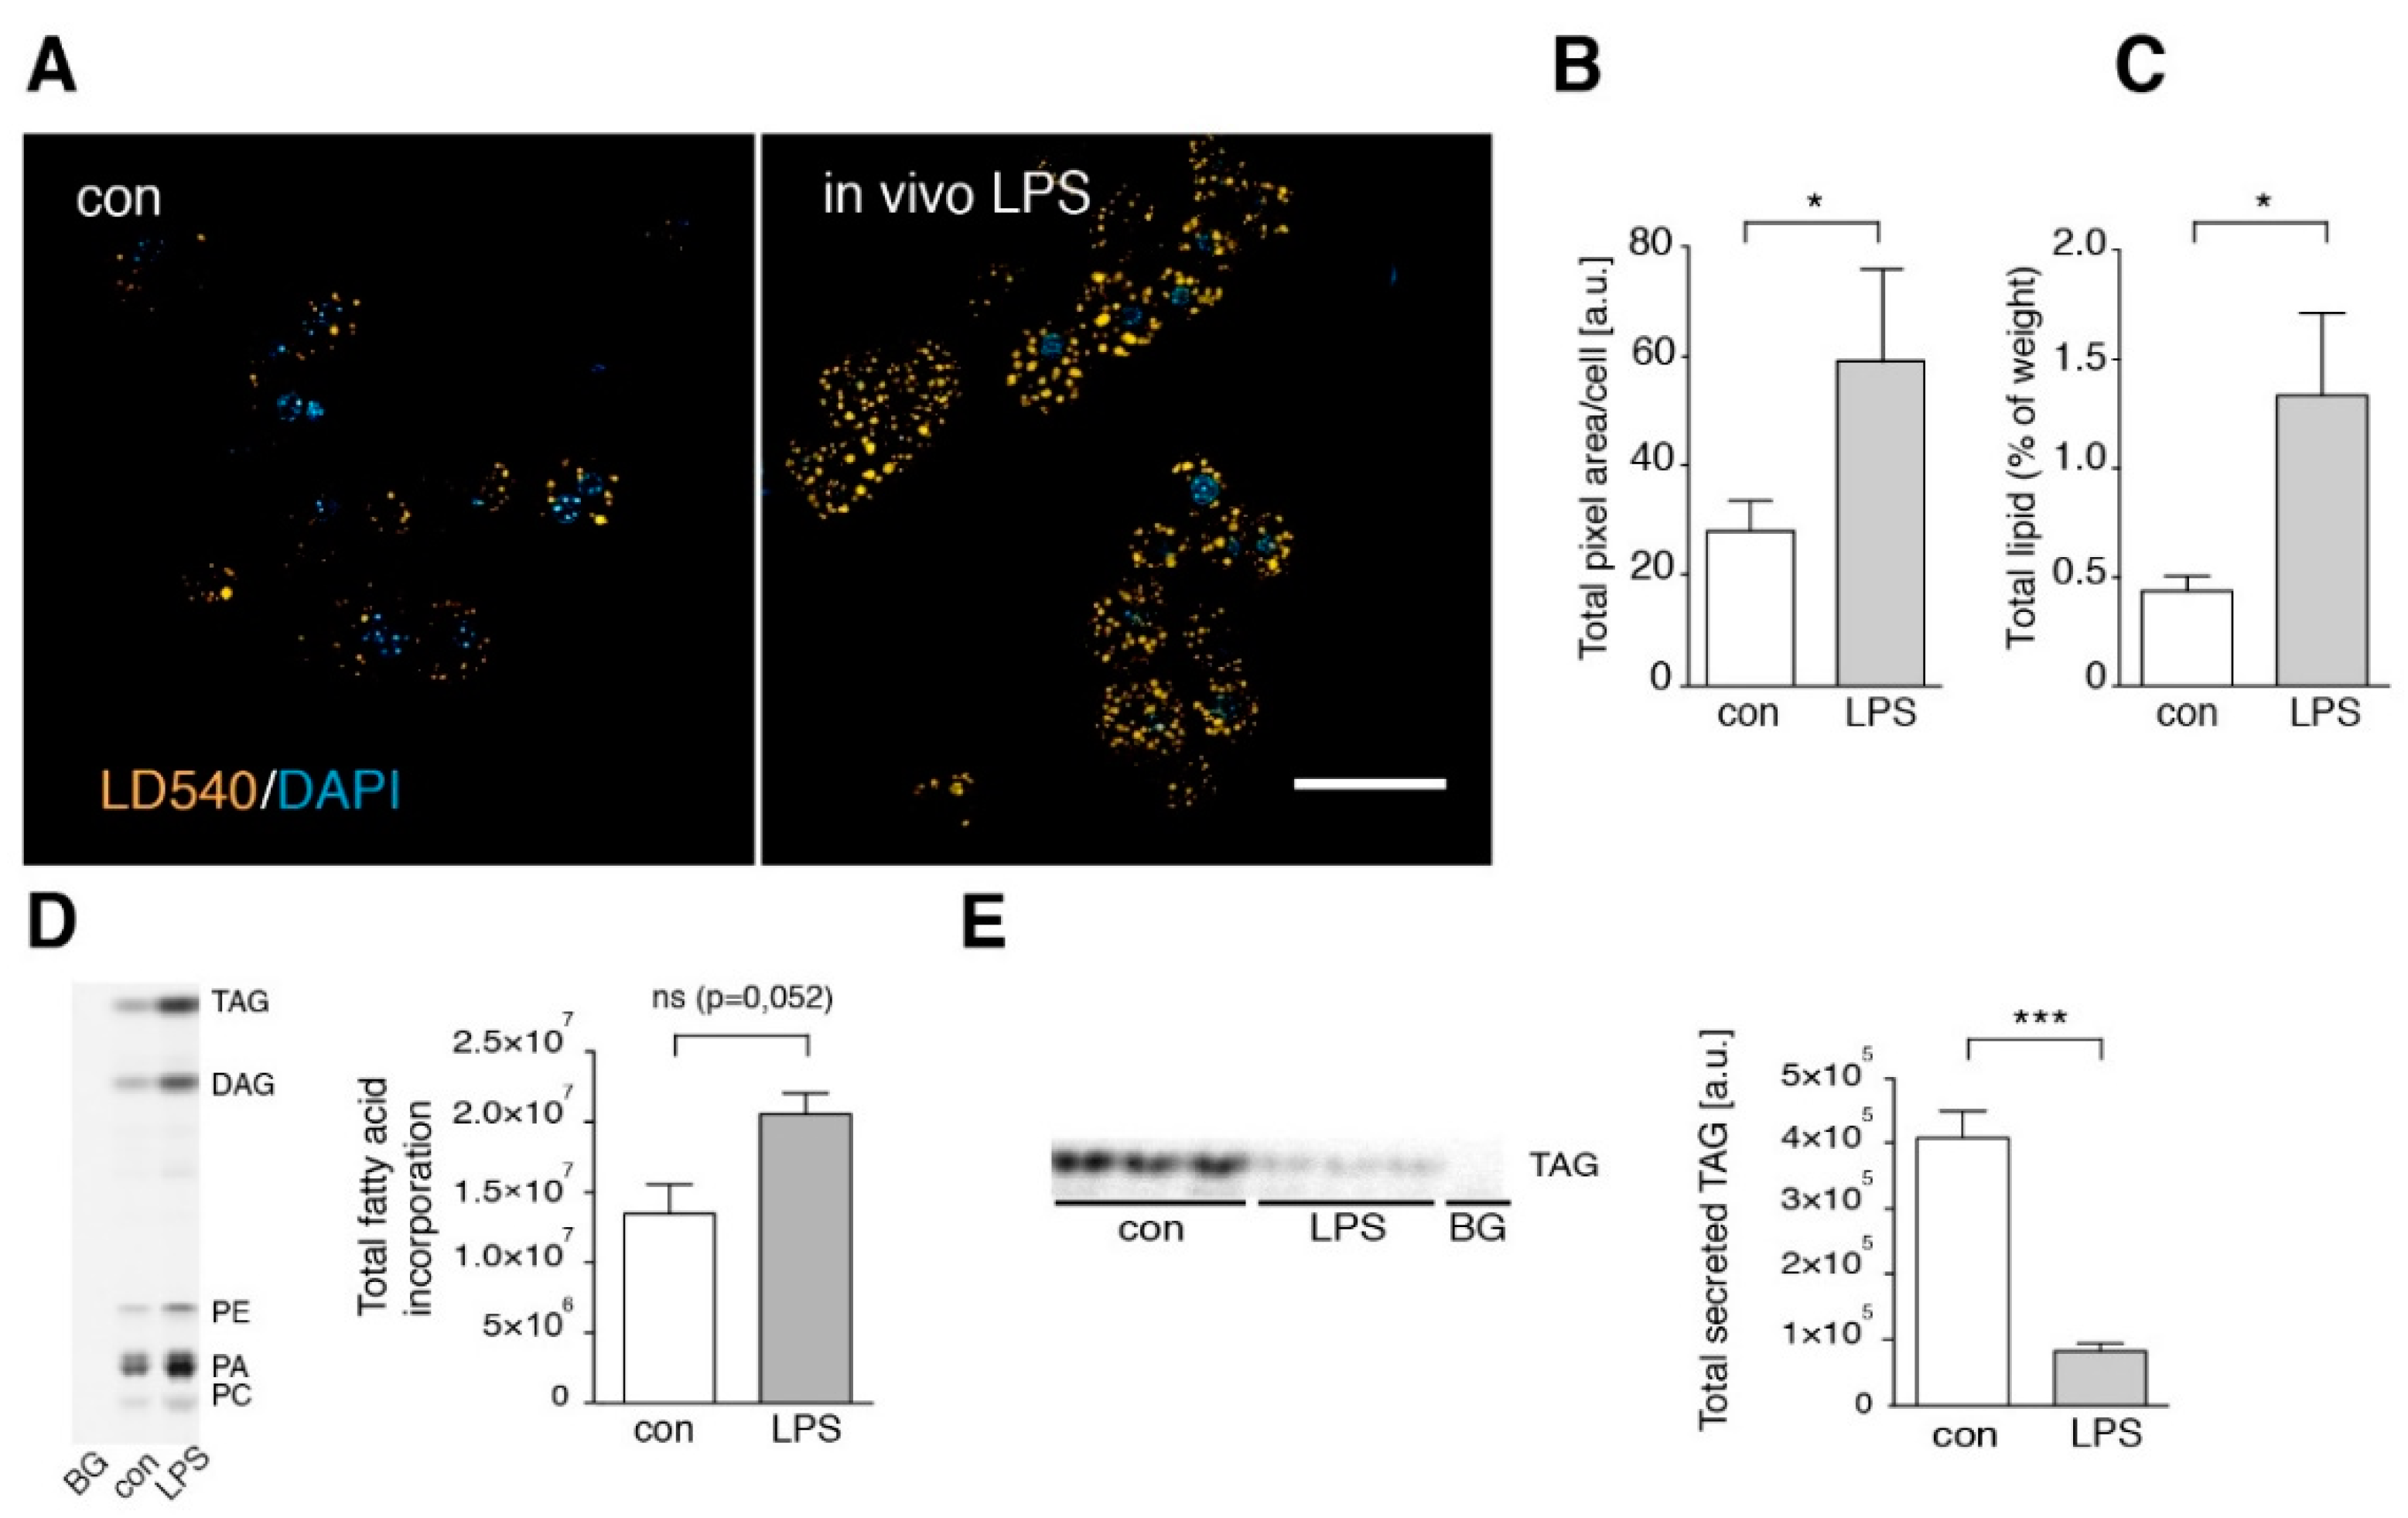
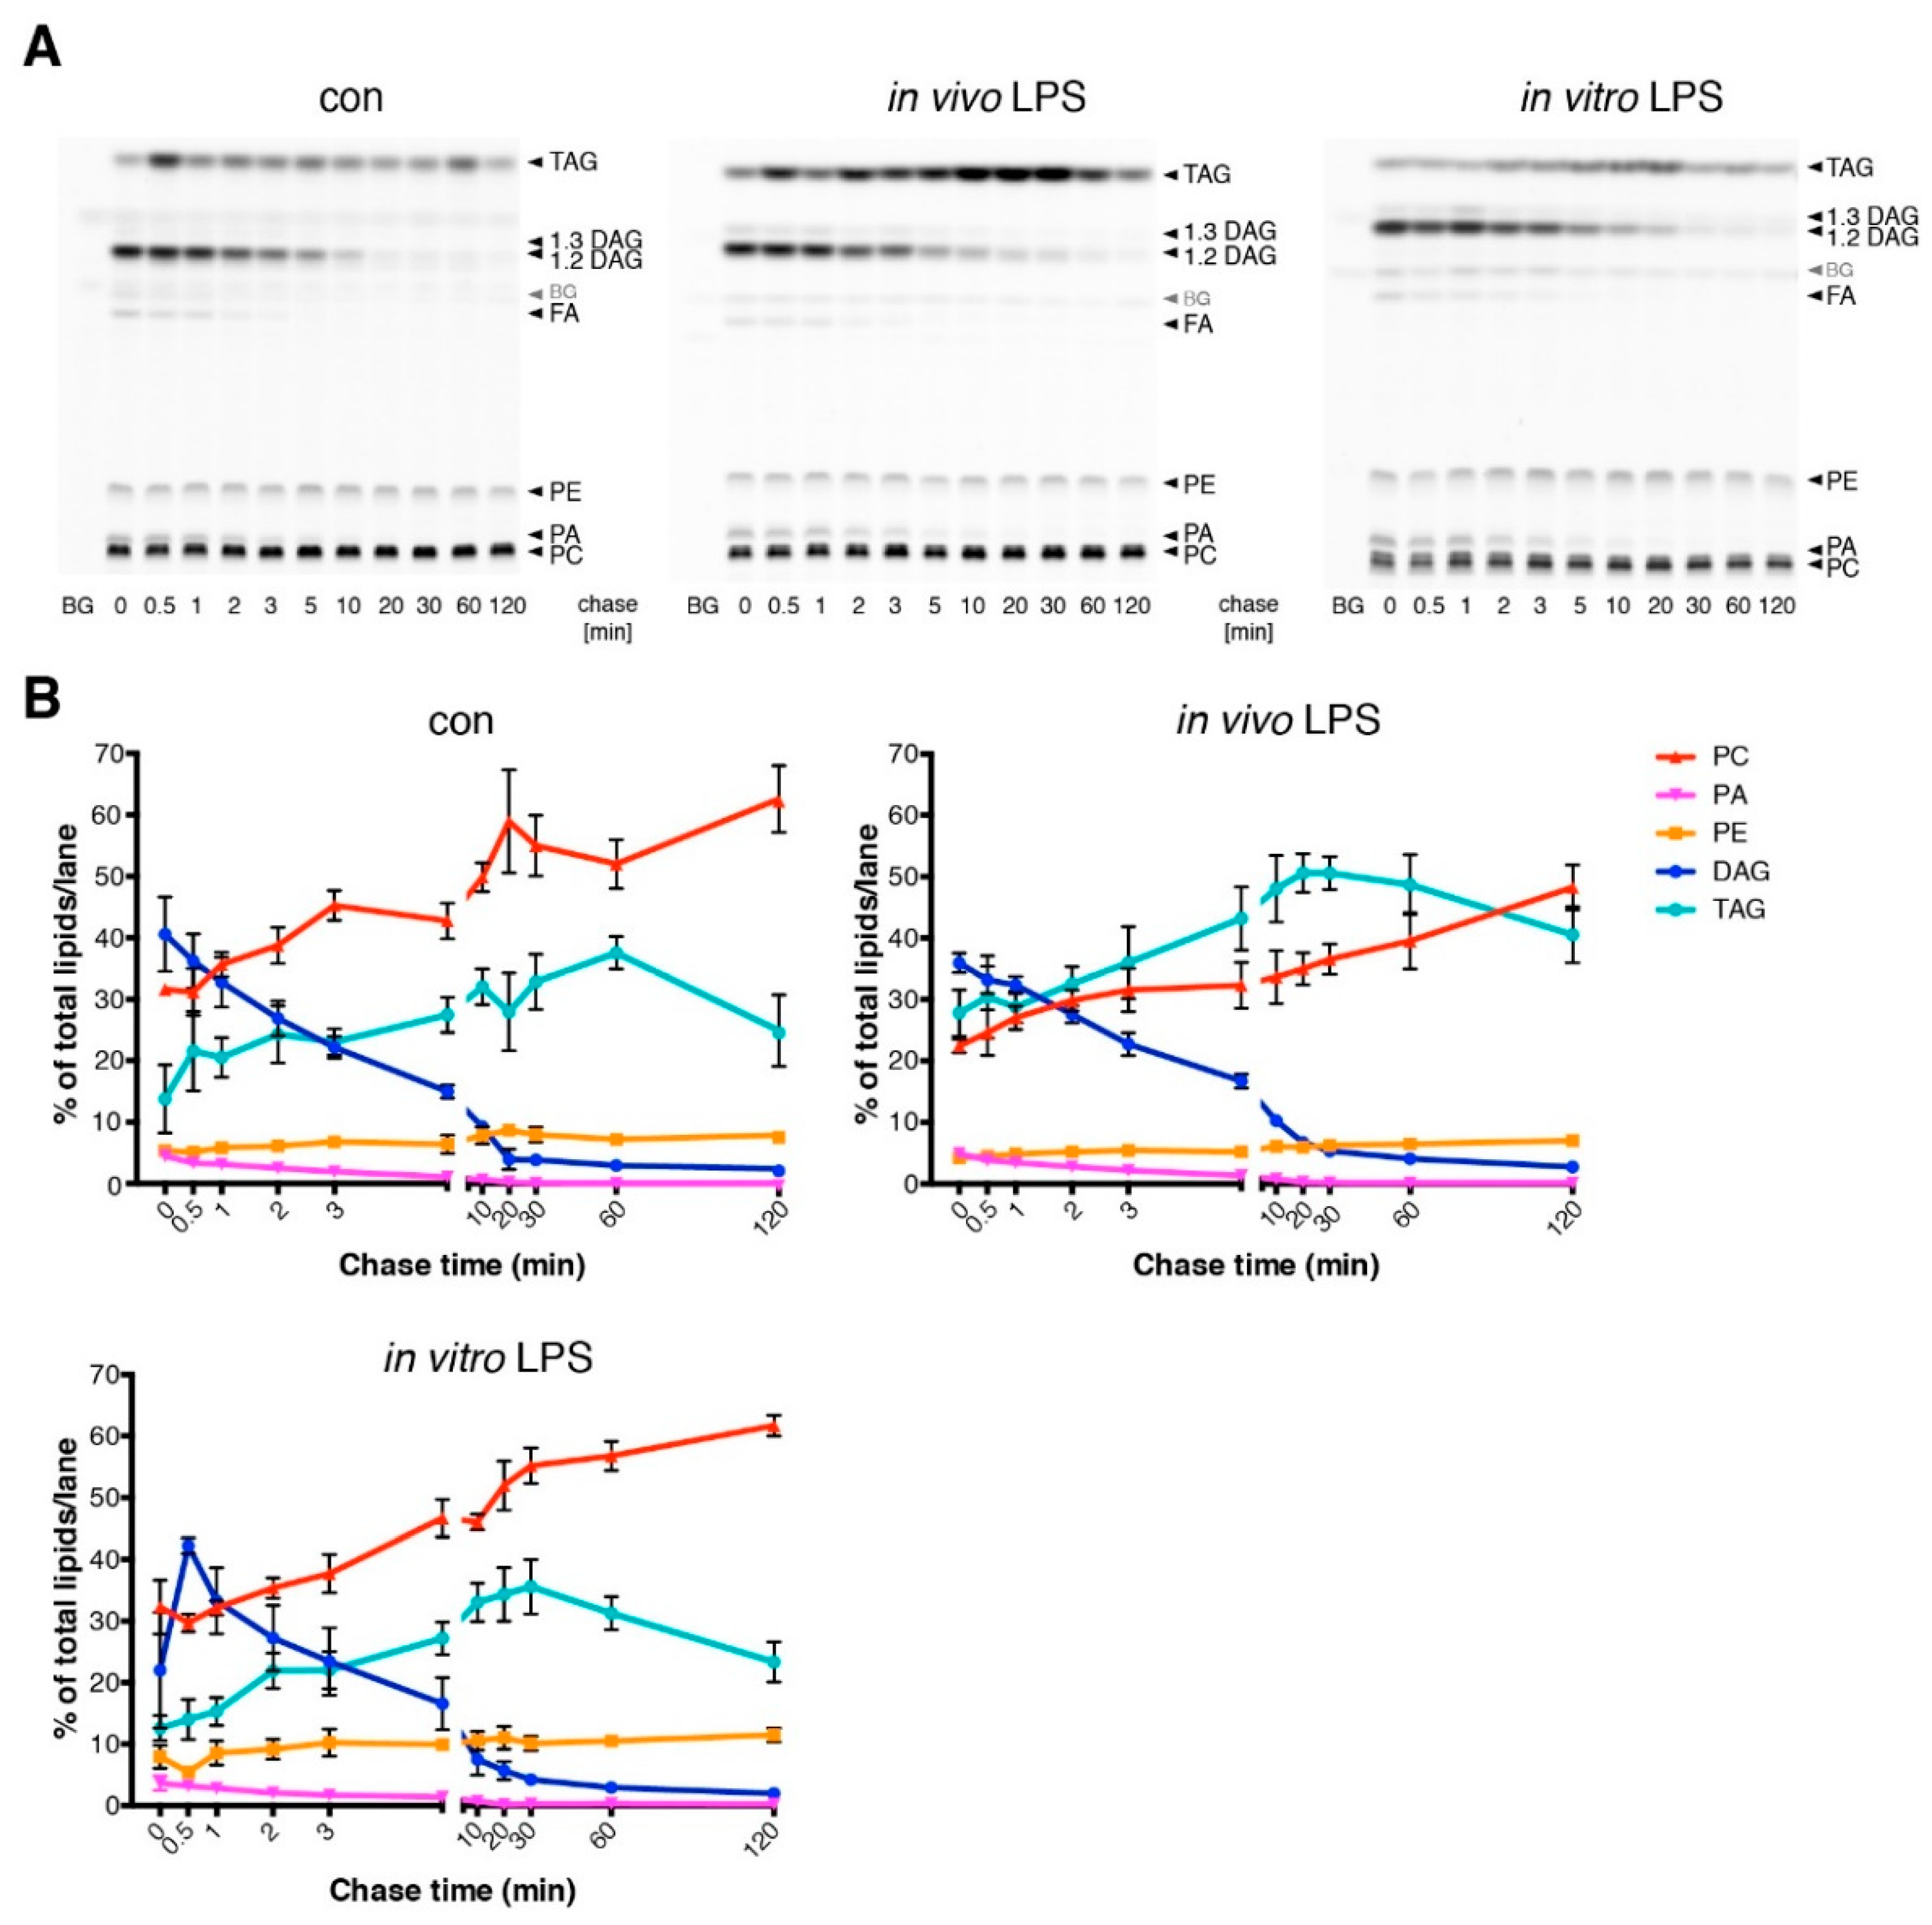
3.3. Short Term LPS Stimulation In Vivo Alters the Hepatic Lipid Metabolism
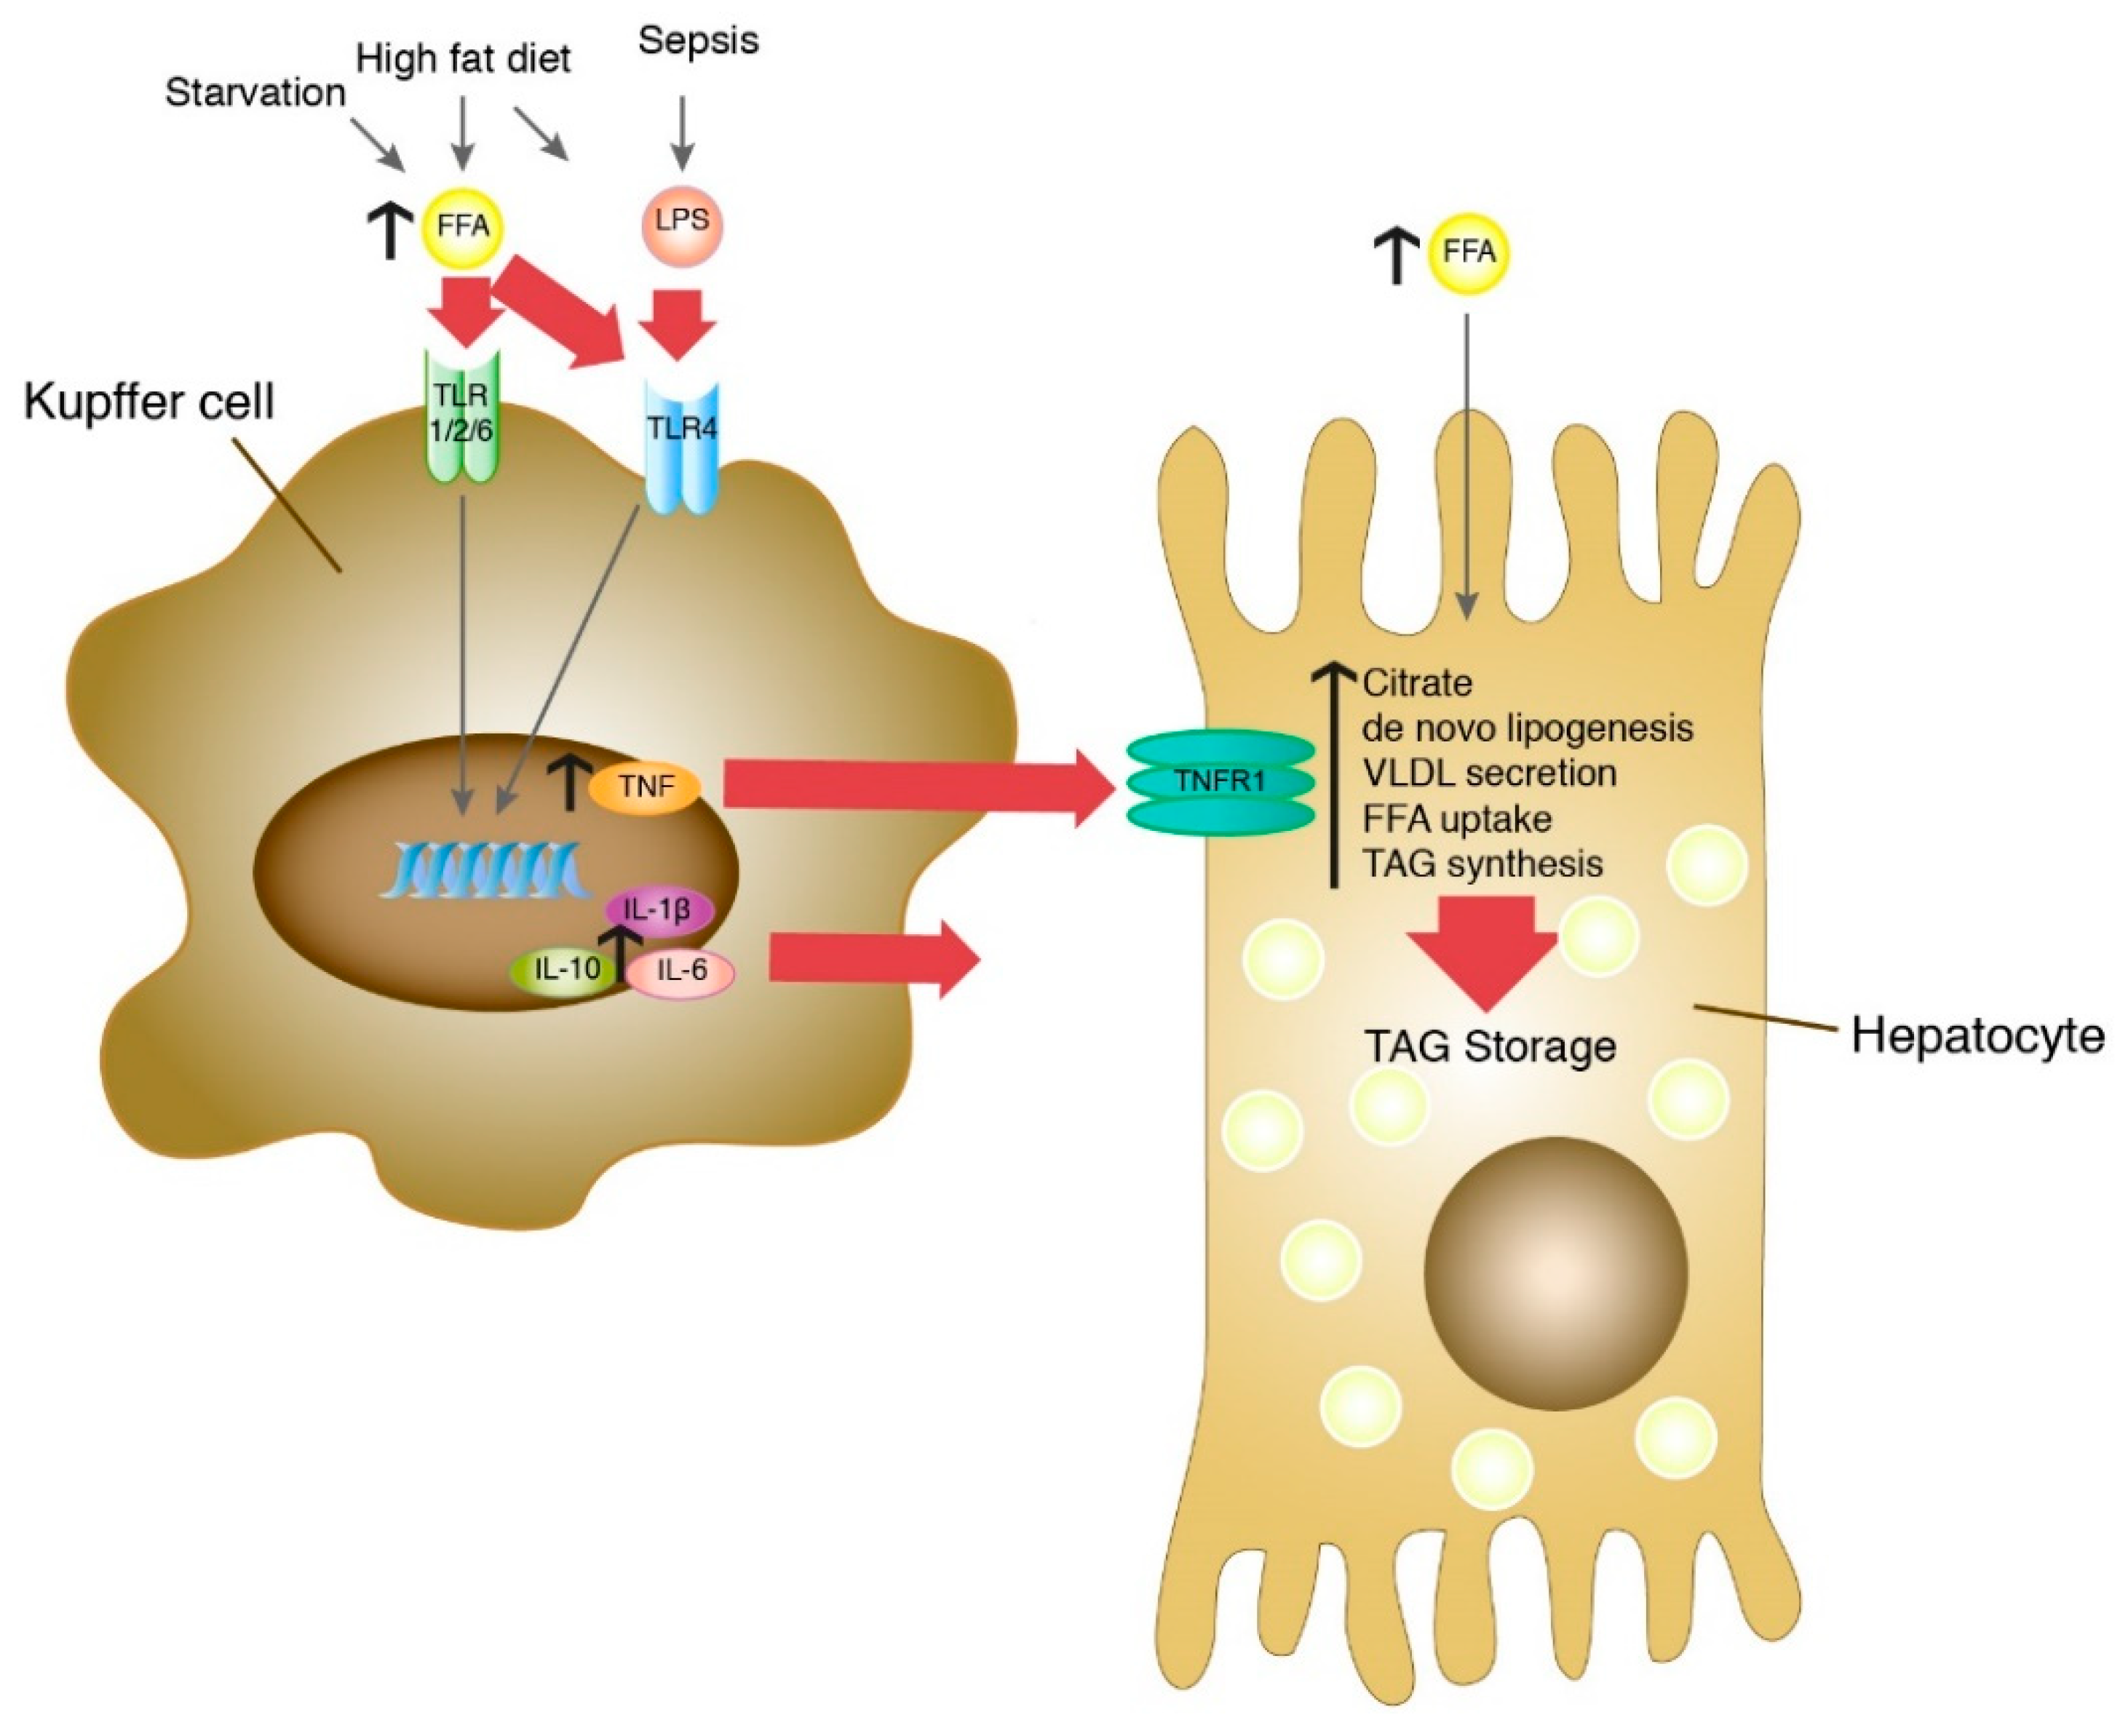
4. Discussion
Supplementary Materials
Author Contributions
Funding
Acknowledgments
Conflicts of Interest
References
- Marchesini, G.; Brizi, M.; Bianchi, G.; Tomassetti, S.; Bugianesi, E.; Lenzi, M.; McCullough, A.J.; Natale, S.; Forlani, G.; Melchionda, N. Nonalcoholic fatty liver disease: A feature of the metabolic syndrome. Diabetes 2001, 50, 1844–1850. [Google Scholar] [CrossRef] [PubMed] [Green Version]
- Clark, J.M.; Brancati, F.L.; Diehl, A.M. Nonalcoholic fatty liver disease. Gastroenterology 2002, 122, 1649–1657. [Google Scholar] [CrossRef] [PubMed] [Green Version]
- Meli, R.; Mattace Raso, G.; Calignano, A. Role of innate immune response in non-alcoholic Fatty liver disease: Metabolic complications and therapeutic tools. Front. Immunol. 2014, 5, 177. [Google Scholar] [CrossRef] [PubMed] [Green Version]
- Day, C.P.; James, O.F. Steatohepatitis: A tale of two “hits”? Gastroenterology 1998, 114, 842–845. [Google Scholar] [CrossRef]
- Arner, P. Insulin resistance in type 2 diabetes: Role of fatty acids. Diabetes. Metab. Res. Rev. 2002, 18 (Suppl. 2), S5–S9. [Google Scholar] [CrossRef] [PubMed]
- Boden, G. Obesity and free fatty acids. Endocrinol. Metab. Clin. North Am. 2008, 37, 635–646. [Google Scholar] [CrossRef] [Green Version]
- Jansen, P.L.M. Non-alcoholic steatohepatitis. Eur. J. Gastroenterol. Hepatol. 2004, 16, 1079–1085. [Google Scholar] [CrossRef]
- Cohen, J.C.; Horton, J.D.; Hobbs, H.H. Human fatty liver disease: Old questions and new insights. Science 2011, 332, 1519–1523. [Google Scholar] [CrossRef] [Green Version]
- Baffy, G. Kupffer cells in non-alcoholic fatty liver disease: The emerging view. J. Hepatol. 2009, 51, 212–223. [Google Scholar] [CrossRef] [Green Version]
- Zhan, Y.-T.; An, W. Roles of liver innate immune cells in nonalcoholic fatty liver disease. World J. Gastroenterol. 2010, 16, 4652–4660. [Google Scholar] [CrossRef]
- Tosello-Trampont, A.-C.; Landes, S.G.; Nguyen, V.; Novobrantseva, T.I.; Hahn, Y.S. Kuppfer cells trigger nonalcoholic steatohepatitis development in diet-induced mouse model through tumor necrosis factor-α production. J. Biol. Chem. 2012, 287, 40161–40172. [Google Scholar] [CrossRef] [PubMed] [Green Version]
- Tilg, H.; Moschen, A.R. Evolution of inflammation in nonalcoholic fatty liver disease: The multiple parallel hits hypothesis. Hepatology 2010, 52, 1836–1846. [Google Scholar] [CrossRef] [PubMed]
- Jack, R.S.; Fan, X.; Bernheiden, M.; Rune, G.; Ehlers, M.; Weber, A.; Kirsch, G.; Mentel, R.; Fürll, B.; Freudenberg, M.; et al. Lipopolysaccharide-binding protein is required to combat a murine gram-negative bacterial infection. Nature 1997, 389, 742–745. [Google Scholar] [CrossRef] [PubMed]
- Heumann, D.; Roger, T. Initial responses to endotoxins and Gram-negative bacteria. Clin. Chim. Acta 2002, 323, 59–72. [Google Scholar] [CrossRef]
- Harte, A.L.; da Silva, N.F.; Creely, S.J.; McGee, K.C.; Billyard, T.; Youssef-Elabd, E.M.; Tripathi, G.; Ashour, E.; Abdalla, M.S.; Sharada, H.M.; et al. Elevated endotoxin levels in non-alcoholic fatty liver disease. J. Inflamm. (Lond) 2010, 7, 15. [Google Scholar] [CrossRef] [PubMed] [Green Version]
- Harris, K.; Kassis, A.; Major, G.; Chou, C.J. Is the gut microbiota a new factor contributing to obesity and its metabolic disorders? J. Obes. 2012, 2012, 879151. [Google Scholar] [CrossRef] [Green Version]
- Soares, J.-B.; Pimentel-Nunes, P.; Roncon-Albuquerque, R.; Leite-Moreira, A. The role of lipopolysaccharide/toll-like receptor 4 signaling in chronic liver diseases. Hepatol. Int. 2010, 4, 659–672. [Google Scholar] [CrossRef] [Green Version]
- Kolios, G.; Valatas, V.; Kouroumalis, E. Role of Kupffer cells in the pathogenesis of liver disease. World J. Gastroenterol. 2006, 12, 7413–7420. [Google Scholar] [CrossRef]
- Duarte, N.; Coelho, I.C.; Patarrão, R.S.; Almeida, J.I.; Penha-Gonçalves, C.; Macedo, M.P. How Inflammation Impinges on NAFLD: A Role for Kupffer Cells. BioMed Res. Int. 2015, 2015, 984578. [Google Scholar] [CrossRef]
- Stienstra, R.; Saudale, F.; Duval, C.; Keshtkar, S.; Groener, J.E.M.; van Rooijen, N.; Staels, B.; Kersten, S.; Müller, M. Kupffer cells promote hepatic steatosis via interleukin-1beta-dependent suppression of peroxisome proliferator-activated receptor alpha activity. Hepatology 2010, 51, 511–522. [Google Scholar] [CrossRef]
- Huang, W.; Metlakunta, A.; Dedousis, N.; Zhang, P.; Sipula, I.; Dube, J.J.; Scott, D.K.; O’Doherty, R.M. Depletion of liver Kupffer cells prevents the development of diet-induced hepatic steatosis and insulin resistance. Diabetes 2010, 59, 347–357. [Google Scholar] [CrossRef] [PubMed] [Green Version]
- Jia, L.; Vianna, C.R.; Fukuda, M.; Berglund, E.D.; Liu, C.; Tao, C.; Sun, K.; Liu, T.; Harper, M.J.; Lee, C.E.; et al. Hepatocyte Toll-like receptor 4 regulates obesity-induced inflammation and insulin resistance. Nat. Commun. 2014, 5, 3878. [Google Scholar] [CrossRef] [PubMed] [Green Version]
- Severgnini, M.; Sherman, J.; Sehgal, A.; Jayaprakash, N.K.; Aubin, J.; Wang, G.; Zhang, L.; Peng, C.G.; Yucius, K.; Butler, J.; et al. A rapid two-step method for isolation of functional primary mouse hepatocytes: Cell characterization and asialoglycoprotein receptor based assay development. Cytotechnology 2012, 64, 187–195. [Google Scholar] [CrossRef] [PubMed] [Green Version]
- Li, P.-z.; Li, J.-z.; Li, M.; Gong, J.-p.; He, K. An efficient method to isolate and culture mouse Kupffer cells. Immunol. Lett. 2014, 158, 52–56. [Google Scholar] [CrossRef] [PubMed]
- Parasuraman, S.; Raveendran, R.; Kesavan, R. Blood sample collection in small laboratory animals. J. Pharmacol. Pharmacother. 2010, 1, 87–93. [Google Scholar] [CrossRef] [Green Version]
- Lopez, B.G.; Tsai, M.S.; Baratta, J.L.; Longmuir, K.J.; Robertson, R.T. Characterization of Kupffer cells in livers of developing mice. Comp. Hepatol. 2011, 10, 2. [Google Scholar] [CrossRef] [Green Version]
- Sunman, J.A.; Hawke, R.L.; LeCluyse, E.L.; Kashuba, A.D.M. Kupffer cell-mediated IL-2 suppression of CYP3A activity in human hepatocytes. Drug Metab. Dispos. 2004, 32, 359–363. [Google Scholar] [CrossRef] [Green Version]
- Yerkovich, S.T.; Rigby, P.J.; Fournier, P.A.; Olynyk, J.K.; Yeoh, G.C.T. Kupffer cell cytokines interleukin-1beta and interleukin-10 combine to inhibit phosphoenolpyruvate carboxykinase and gluconeogenesis in cultured hepatocytes. Int. J. Biochem. Cell Biol. 2004, 36, 1462–1472. [Google Scholar] [CrossRef]
- Thiele, C.; Papan, C.; Hoelper, D.; Kusserow, K.; Gaebler, A.; Schoene, M.; Piotrowitz, K.; Lohmann, D.; Spandl, J.; Stevanovic, A.; et al. Tracing fatty acid metabolism by click chemistry. ACS Chem. Biol. 2012, 7, 2004–2011. [Google Scholar] [CrossRef]
- Spandl, J.; White, D.J.; Peychl, J.; Thiele, C. Live cell multicolor imaging of lipid droplets with a new dye, LD540. Traffic 2009, 10, 1579–1584. [Google Scholar] [CrossRef]
- Schindelin, J.; Arganda-Carreras, I.; Frise, E.; Kaynig, V.; Longair, M.; Pietzsch, T.; Preibisch, S.; Rueden, C.; Saalfeld, S.; Schmid, B.; et al. Fiji: An open-source platform for biological-image analysis. Nat. Methods 2012, 9, 676–682. [Google Scholar] [CrossRef] [PubMed] [Green Version]
- Eichmann, T.O.; Kumari, M.; Haas, J.T.; Farese, R.V.; Zimmermann, R.; Lass, A.; Zechner, R. Studies on the substrate and stereo/regioselectivity of adipose triglyceride lipase, hormone-sensitive lipase, and diacylglycerol-O-acyltransferases. J. Biol. Chem. 2012, 287, 41446–41457. [Google Scholar] [CrossRef] [PubMed] [Green Version]
- Wigg, A.J.; Roberts-Thomson, I.C.; Dymock, R.B.; McCarthy, P.J.; Grose, R.H.; Cummins, A.G. The role of small intestinal bacterial overgrowth, intestinal permeability, endotoxaemia, and tumour necrosis factor alpha in the pathogenesis of non-alcoholic steatohepatitis. Gut 2001, 48, 206–211. [Google Scholar] [CrossRef] [PubMed] [Green Version]
- Roh, Y.S.; Seki, E. Toll-like receptors in alcoholic liver disease, non-alcoholic steatohepatitis and carcinogenesis. J. Gastroenterol. Hepatol. 2013, 28 (Suppl. 1), 38–42. [Google Scholar] [CrossRef] [Green Version]
- Petersen, K.F.; Befroy, D.; Dufour, S.; Dziura, J.; Ariyan, C.; Rothman, D.L.; DiPietro, L.; Cline, G.W.; Shulman, G.I. Mitochondrial dysfunction in the elderly: Possible role in insulin resistance. Science 2003, 300, 1140–1142. [Google Scholar] [CrossRef] [Green Version]
- Ibdah, J.A.; Perlegas, P.; Zhao, Y.; Angdisen, J.; Borgerink, H.; Shadoan, M.K.; Wagner, J.D.; Matern, D.; Rinaldo, P.; Cline, J.M. Mice heterozygous for a defect in mitochondrial trifunctional protein develop hepatic steatosis and insulin resistance. Gastroenterology 2005, 128, 1381–1390. [Google Scholar] [CrossRef]
- Baker, N.; Hill, V.; Ookhtens, M. Regulation of plasma-free fatty acid mobilization by dietary glucose in Ehrlich ascites tumor-bearing mice. Cancer Res. 1978, 38, 2372–2377. [Google Scholar]
- Faggioni, R.; Moser, A.; Feingold, K.R.; Grunfeld, C. Reduced leptin levels in starvation increase susceptibility to endotoxic shock. Am. J. Pathol. 2000, 156, 1781–1787. [Google Scholar] [CrossRef] [Green Version]
- Tang, T.; Sui, Y.; Lian, M.; Li, Z.; Hua, J. Pro-inflammatory activated Kupffer cells by lipids induce hepatic NKT cells deficiency through activation-induced cell death. PLoS ONE 2013, 8, e81949. [Google Scholar] [CrossRef]
- Shi, H.; Kokoeva, M.V.; Inouye, K.; Tzameli, I.; Yin, H.; Flier, J.S. TLR4 links innate immunity and fatty acid-induced insulin resistance. J. Clin. Investig. 2006, 116, 3015–3025. [Google Scholar] [CrossRef]
- Imajo, K.; Fujita, K.; Yoneda, M.; Nozaki, Y.; Ogawa, Y.; Shinohara, Y.; Kato, S.; Mawatari, H.; Shibata, W.; Kitani, H.; et al. Hyperresponsivity to low-dose endotoxin during progression to nonalcoholic steatohepatitis is regulated by leptin-mediated signaling. Cell Metab. 2012, 16, 44–54. [Google Scholar] [CrossRef] [PubMed] [Green Version]


© 2020 by the authors. Licensee MDPI, Basel, Switzerland. This article is an open access article distributed under the terms and conditions of the Creative Commons Attribution (CC BY) license (http://creativecommons.org/licenses/by/4.0/).
Share and Cite
Diehl, K.L.; Vorac, J.; Hofmann, K.; Meiser, P.; Unterweger, I.; Kuerschner, L.; Weighardt, H.; Förster, I.; Thiele, C. Kupffer Cells Sense Free Fatty Acids and Regulate Hepatic Lipid Metabolism in High-Fat Diet and Inflammation. Cells 2020, 9, 2258. https://doi.org/10.3390/cells9102258
Diehl KL, Vorac J, Hofmann K, Meiser P, Unterweger I, Kuerschner L, Weighardt H, Förster I, Thiele C. Kupffer Cells Sense Free Fatty Acids and Regulate Hepatic Lipid Metabolism in High-Fat Diet and Inflammation. Cells. 2020; 9(10):2258. https://doi.org/10.3390/cells9102258
Chicago/Turabian StyleDiehl, Kira L., Julia Vorac, Kristina Hofmann, Philippa Meiser, Iris Unterweger, Lars Kuerschner, Heike Weighardt, Irmgard Förster, and Christoph Thiele. 2020. "Kupffer Cells Sense Free Fatty Acids and Regulate Hepatic Lipid Metabolism in High-Fat Diet and Inflammation" Cells 9, no. 10: 2258. https://doi.org/10.3390/cells9102258