
Development of a Portable and Modular Gas Generator: Application to Formaldehyde Analysis


1
Institut de Chimie et Procédés pour l’Energie, l’Environnement et la Santé, Université de Strasbourg, CNRS, ICPEES UMR 7515, F-67034 Strasbourg, France
2
Institut Charles Sadron, Université de Strasbourg, CNRS, ICS UPR 22, F-67034 Strasbourg, France
*
Author to whom correspondence should be addressed.
Chemosensors 2022, 10(4), 131; https://doi.org/10.3390/chemosensors10040131
Submission received: 17 February 2022
/
Revised: 18 March 2022
/
Accepted: 28 March 2022
/
Published: 31 March 2022
(This article belongs to the Special Issue Advances in Chemosensors Technologies for Monitoring and Diagnostics)
Abstract
:This work aims at developing and validating under laboratory-controlled conditions a gas mixture generation device designed for easy on-site or laboratory calibration of analytical instruments dedicated to air monitoring, such as analysers or sensors. This portable device, which has been validated for formaldehyde, is compact and is based on the diffusion of liquid formaldehyde through a short microporous interface with an air stream to reach non-Henry equilibrium gas–liquid dynamics. The geometry of the temperature-controlled assembly has been optimised to allow easy change of the aqueous solution, keeping the microporous tube straight. The formaldehyde generator has been coupled to an on-line formaldehyde analyser to monitor the gas concentration generated as a function of the liquid formaldehyde concentration, the temperature, the air gas flow rate, and the microporous tube length. Our experimental results show that the generated gaseous formaldehyde concentration increase linearly between 10 and 1740 µg m−3 with that of the aqueous solution ranging between 0 and 200 mg L−1 for all the gas flow rates studied, namely 25, 50 and 100 mL min−1. The generated gas phase concentration also increases with increasing temperature according to Henry’s law and with increasing the gas–liquid contact time either by reducing the gas flow rate from 100 to 25 mL min−1 or increasing the microporous tube length from 3.5 to 14 cm. Finally, the performances of this modular formaldehyde generator are compared and discussed with those reported in the scientific literature or commercialised by manufacturers. The technique developed here is the only one allowing to operate with a low flow rate such as 25 to 100 mL min−1 while generating a wide range of concentrations (10–1000 µg m−3) with very good accuracy.
1. Introduction
Nowadays, people spend 70–90% of their time in enclosed spaces, especially at home, where indoor air can be more or less polluted [1,2,3,4,5]. The regular use of multiple synthetic products in homes, whether for construction, renovation, or cleaning, causes the release of many various chemical compounds into the air. Most of these chemicals belong to the large family of volatile organic compounds (VOCs). VOCs are often more numerous and concentrated indoors than outdoors due to the multiplicity of indoor sources [6,7,8,9]. Among VOCs, formaldehyde is a major pollutant of indoor air due to its numerous emission sources and its toxicity [10,11,12]. It is widely used in the manufacture of construction materials (chipboard) and in various elements that equip the home (parquet floor, carpeting, insulation, etc.) [6,13,14].
In indoor domestic environments, formaldehyde concentrations may vary between 10 and 100 µg m−3, which is 2 to 15 times higher than those found in outdoor air [6,8,15,16]. In June 2004, the International Agency for Research on Cancer (IARC) classified formaldehyde as a human carcinogen, like benzene [17]. In professional environments, the formaldehyde concentration can also reach much higher values [18,19,20]. Occupational exposure to high concentrations of formaldehyde occurs mainly in companies that manufacture or release formaldehyde and in companies that are exposed to the combustion of organic material. In industries manufacturing formaldehyde, the average levels of exposure to formaldehyde are around 1 ppm [18]. For industries releasing formaldehyde, i.e., the wood industry or, more surprisingly, hair salons, the formaldehyde concentrations are 0.5 to 1.52 ppm (614 to 1867 µg m−3) [19] and 0.02 to 1.19 ppm (25 to 1462 µg m−3), respectively [20]. For garage owners, exposed to engine exhaust fumes, their average exposure to formaldehyde is 0.10 ppm (123 µg m−3) [18]. Lang et al assessed the irritant effects of formaldehyde in the workplace [21]. Consequently, the European occupational exposure limit value for formaldehyde has been set in 2019 at 0.3 ppm (370 µg m−3) for an 8 h exposure and at 0.6 ppm (740 µg m−3) for a 15 min exposure [22].
Formaldehyde can be analysed by different methods. The firsts correspond to the reference method(s) widely used to quantify airborne formaldehyde levels and involve a passive or active sampling of gaseous formaldehyde on a DNPH tube [23,24,25] for several hours or even several days to produce the corresponding hydrazone followed by off-line laboratory HLPC/UV analysis [26,27,28,29]. If this analytical approach is time-consuming, the quantification is very simple since it only requires the calibration of the HPLC with the appropriate range of hydrazone solutions and sampling means, i.e., the gas flow rate for an active sampling. However, these reference methods give only an average value of the concentration over a certain period.
To overcome this drawback for gaseous formaldehyde quantification, the current trend in this analytical field is to develop real-time measurement tools such as sensors [30,31,32,33,34,35], analysers [36,37,38] or even microanalyzers [14,39,40,41,42]. Chemical sensors are based on various gas detection mechanisms [43], namely resistive/chemoresistive, electrochemical, metal-oxide-semiconductor field effect transistors (MOSFET), optical (surface plastic resonance (SPR)) and surface acoustic. Although the development of increasingly efficient sensors is currently in vogue for many gaseous organic pollutants [43,44,45], it should be noted that they do not (yet) provide the necessary selectivity and sensitivities for continuous measurement of these pollutants in outdoor or indoor air, which limits the use of such chemical sensors for air monitoring. This is especially true for formaldehyde, which very often has low response factors with chemical sensors [30,31,32,33,34,35]. For the detection of gaseous formaldehyde at ppb levels, analysers and microanalyzers are often based on the on-line reaction of formaldehyde with a specific derivatising agent followed by detection by colorimetry [37,46,47,48] or fluorimetry [14,39,49,50,51,52].
However, all these instruments need to be calibrated regularly to provide accurate formaldehyde concentrations. Hence, there is a need for a reliable source of formaldehyde that can produce gaseous concentrations in the range 10 and 740 µg m−3, the lower and upper targeted values corresponding to that found in a clean indoor environment and that recommended for acute exposure to formaldehyde, respectively.
Gaseous formaldehyde can be produced following different methods that are listed in Table 1 and Table 2: a catalytic synthesis with molybdenum [53]; through the use of syringe pumps [54]; with high-pressure instruments [55] such as nebulizers [56], diffusion or permeation tubes [54,57,58,59]; or by liquid evaporation [60,61]. Raw materials for the production of gaseous formaldehyde include liquid formaldehyde solutions [54,55,56,58,60,61] with 10–15% w/w methanol (to avoid self-polymerization) [53], a solid paraformaldehyde [54,59] or formaldehyde trimer called trioxane [57].
To meet in situ calibration requirements in domestic and professional indoor environments, one should use an instrument that can be easily transported and a method which generates gaseous pollutant concentrations in the range 10–740 µg m−3 along with a low carrier gas flow rate of c.a. 25–100 mL min−1 to limit gas consumption and allows for long term use in the field. However, none of the aforementioned instruments meet all these requirements (see Table 1 and Table 2).
Thus, the main objective of this work is to develop a compact apparatus for the generation of a gaseous formaldehyde stream. In our study, the minimum value of 25 mL min−1 was chosen because it makes it possible to supply known gas concentrations of formaldehyde to our formaldehyde analyser (µF-1, Chromatotec, Val-de-Virvée, France), which takes 20 mL min−1, while ensuring a leakage of 5 mL min−1 to the atmosphere. This value corresponds also to the minimum gas flow rate required for the calibration of sensors placed in a small hermetic enclosure.
This work reports on the instrumental development carried out to obtain a functional prototype of a gaseous formaldehyde generator based on the permeation method from an aqueous formaldehyde solution to establish non-Henry equilibrium gas–liquid dynamics. It describes the implementation of this method under controlled-laboratory conditions for concentrations of liquid formaldehyde ranging from 0 to 200 mg L−1. The concentrations of gaseous formaldehyde generated were tested by modifying different factors: the temperature of the liquid formaldehyde solution, the gas–liquid surface area, i.e., the microporous tube length, and exchange time by varying the gas flow rate. The performances of this new formaldehyde generator are then compared with those found in the literature and the marketed ones. The different conditions are also discussed in terms of their practical potential application in the field.
2. Materials and Methods
This section describes the novel generator of gaseous formaldehyde developed in this work and based on a microporous tube immersed in an aqueous formaldehyde solution. The resulting generated gas concentrations of formaldehyde were monitored by two techniques described below, i.e., an on-line formaldehyde analyser [14] and off-line measurements using the conventional DNPH sampling method coupled to HPLC/UV analysis [62].
2.1. Chemicals
Aqueous formaldehyde mixtures in the range of 2.5–200 mg L−1 (8.33 × 10⁻⁵–6.66 × 10⁻³ mol L−1) were prepared from a commercial formaldehyde solution (252549-500 mL, 37% in water, contains 10–15% methanol as a stabilizer, Sigma-Aldrich, Saint-Quentin-Fallavier, France) and Milli-Q water (18.2 MΩ.cm at 25 °C, Millipore, Molsheim, France) using suitably calibrated micropipettes (Eppendorf, Hamburg, Germany) and appropriated volumetric flasks.
For the operation of the formaldehyde analyser, acetylacetone solutions (0.01 M) were prepared by mixing 0.3 mL acetic acid (100%, Merck, Molsheim, France), 0.2 mL acetylacetone (99%, Merck, Molsheim, France), 15.4 g ammonium acetate (98%, Sigma-Aldrich, Saint-Quentin-Fallavier, France) in 200 mL Milli-Q water (18.2 MΩ.cm at 25 °C, Millipore, Molsheim, France).
2.2. On-Line Formaldehyde Analyser
The microfluidic formaldehyde analyser (µF1, Chromatotec, Val-de-Virvée, France) used in this work was developed [14,52], patented [63] by our laboratory and tested in several studies [14,64]. This device works continuously and is based on the specific derivatization of aqueous formaldehyde with fluoral-p (or acetylacetone solution) generating 3,5-diacetyl-1,4- dihydrolutidine (DDL) via a Hantszch reaction already detailed elsewhere [14,52,65,66].
Given the high solubility of formaldehyde characterized by its Henry’s law constant of 5020 M amt−1 at 293 K [36], gaseous formaldehyde is first advantageously trapped into an aqueous solution of fluoral-p by establishing a specific two-phase flow. Indeed, an annular flow is obtained by co-injecting 20 mL min−1 of sampling air and 17 μL min−1 of fluoral-p solution into a 150 cm long, 530 μm ID hydrophilic silica capillary [14,36,52]. At the outlet of the capillary, the gas escapes from the liquid through a microporous tube.
The gas-free liquid solution, containing both formaldehyde and fluoral-p, flows into an oven set at 65 °C for about 3.5 min, to increase the derivatization rate and thus convert all the formaldehyde into DDL.
Once the derivatization fully occurred, DDL is detected by fluorescence, the excitation occurring at 415 nm and the fluorescence being collected on a photomultiplier (Hamamatsu, Massy, France) at 530 ± 40 nm [14,39,40]. Then, the fluorescence signal is amplified with a photomultiplier and averaged over two seconds.
This instrument is also equipped with a sensor of temperature and relative humidity (SHT1x, Sensirion, Stäfa, Switzerland).
The embedded software (version v1.3, Chromatotec, Val-de-Virvée, France) runs under Linux and allows the acquisition of formaldehyde concentrations, temperature, and relative humidity with a 2 s time step.
2.3. Off-Line Formaldehyde Quantification with the ISO 16000-3 Reference Method
Airborne formaldehyde was also quantified using the ISO 16000-3 reference method, which is based on active sampling using 2,4-Dinitrophenylhydrazine (DNPH) tube (Waters, Sep-Pak, Saint-Quentin-en-Yvelines, France) followed by its hydrazone quantification with HPLC-UV [67]. In this study, the air is sampled with an automatic sampling device, namely DNPH MP4V, composed of a mass flow controller (Low-∆P-flow, F-201-DV-100-AAD-22-V, 0–2000 mL min−1, Bronkhorst, Nijverheidsstraat, The Netherlands), a gas pump (830 KNDC, KNF) and 4 ways, each of them being equipped with two solenoid valves (VDW23-6G-3, SMC). The sampling flow has been set to 150 mL min−1 for 12 h to obtain a sample volume of 108 L. Once sampling is achieved, DNPH tubes are stored at 4 °C and then eluted with a small and known volume (usually 2–3 mL) of acetonitrile (99.8%, Sigma-Aldrich, Saint-Quentin-Fallavier, France). The resulting hydrazone solution is further analysed by HPLC/UV (Serie 1100, Agilent Technology, Santa Clara, CA, USA): 20 µL is injected into a nonpolar C18 column (Supelcosil LC-18, Supelco, Saint-Quentin-Fallavier, France) and quantified at 360 nm using an external calibration [10,68].
2.4. The Novel Gas Generator: Setup and Experimental Conditions
As already mentioned, the novel generator of gaseous formaldehyde is based on a microporous tube immersed in an aqueous formaldehyde solution.
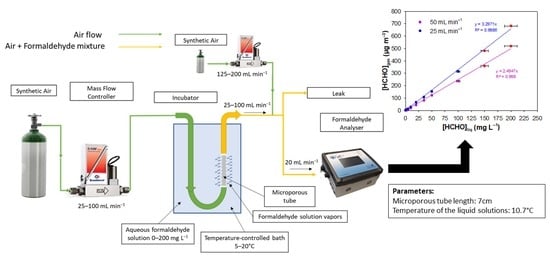
The overall arrangement is shown in Figure 1. A transparent or amber glass flask of 250 mL is filled with the aqueous formaldehyde solution. The microporous tube and its support, shown in Figure 2, are then completely immersed in the formaldehyde solution. In this work, the support was designed using computer-aided design (CAD) and manufactured in Acrylonitrile Butadiene Styrene (ABS) with 3D printer (Extended 3, Ultimaker, Utrecht, The Netherlands). In practice, a large flask with a wide neck of 4.5 cm allows the introduction of microporous tubes long enough to vary their length and connect them in series when necessary (see Figure 2). In addition, the large flask capacity permits to have enough formaldehyde molecules to assume that the aqueous and gaseous formaldehyde concentrations will remain constant over time.
Pure dry synthetic air (Air FID, ≥99.9995, Messer, Folschviller, France) is injected at a constant gas flow rate (here between 25 and 100 mL min−1) by means of a mass flow controller called MFC (El-flow F-201-CV-100-AAD-33-V, 0–100 mL min−1, Bronkhorst, Nijverheidsstraat, The Netherlands) through a microporous tube thanks to a Teflon tube (o.d.: 1/16″, i.d.: 1 mm), which is connected to the microporous tube with a small stainless steel tube (o.d.: 1 mm, i.d.: 0.7 mm, length: 30 mm) whose external diameter, rigidity and slightly bevelled end allow the microporous tube to easily slide over it (see Figure 2). The same connector is used at the exit of the microporous tube to attach another Teflon tube (o.d.: 1/16″, i.d.: 1 mm). The stopper placed on the flask allows the two 1/16″ tubes to pass through in a perfectly sealed manner, thus avoiding any contact between the outside air and the solution.
The whole reactor including the flask of 250 mL, the stopper and part of the gas pipes were placed inside a temperature-controlled system (±2 °C). The temperature of the incubator (IVYX-INCUB5L, IVYX Scientific, Berlin, Germany) was checked with calibrated temperature sensors (Testo 174H, Testo, Lenzkirch, Germany). In practice, the temperature setpoint of the incubator can be varied in increments of 1 °C. The setting temperature of the incubator was varied in the range 5–20 °C, corresponding to exact values of 5.8–21.8 °C.
At the gas generator outlet, a part of the gas flow in the range 25–100 mL min−1 is sampled by the online formaldehyde analyser at a constant gas flow rate of 20 mL min−1, to monitor the formaldehyde concentration and the relative humidity in near real-time. When the concentrations of formaldehyde generated were too high and would saturate the detector of the formaldehyde analyser (signal saturation at 2.07 × 10⁶ µV), the gas mixture generated by the source was first diluted with pure synthetic air using a second MFC (Low-∆P-flow F-201-DV-AAD-33-V 0–500 mL min−1, Bronkhorst, Nijverheidsstraat, The Netherlands) prior analysis. The total gas flow rate was always set at 225 mL min−1.
For the sampling on DNPH tube according to the ISO 16000-3 reference method requiring a higher sampling rate of 150 mL min−1 to limit the uncertainty on the sampling gas flow rate, the gaseous formaldehyde mixture is further diluted with a controlled gas flow of pure dry synthetic air (Air FID, ≥99.9995, Messer, Folschviller, France) regulated with a second MFC (Low-∆P-flow F-201-DV-AAD-33-V 0–500 mL min−1, Bronkhorst, Nijverheidsstraat, The Netherlands) to obtain a total gas flow rate of 200 mL min−1 (see Figure S1).
For both analytical devices, the excess gas flow leaks out while maintaining atmospheric pressure in the set-up.
The final device without the portable gas cylinder weighs 5.6 kg and measures 26 cm long, 28 cm deep and 33 cm high.
In practice, the diluted formaldehyde solution was usually placed the day before the experiments in the incubator, which is set at the desired temperature, i.e., in the range 10.7–21.8 °C, while maintaining a minimum air flow rate of 10 mL min−1 overnight to avoid any condensation in the Teflon tubes. When the temperature of the solution was changed during the day, the temperature stabilisation time was around 3 h before gaseous formaldehyde monitoring was performed at the outlet of the developed gas generator. The same procedure was followed when the length of the microporous tube was changed. In addition, real-time analysis thanks to the on-line formaldehyde analyser had the great advantage of quickly checking whether the concentration of formaldehyde generated was stable, some typical formaldehyde monitoring being shown in Figure 3.
For fixed values of formaldehyde aqueous solution, temperature, and microporous tube length, it was then possible to vary the gas flow rate. Each time the flow rate was changed, there was a 45 to 60 min delay for stabilisation of the gas generation before proceeding with the quantification of formaldehyde in the gas phase. The raw 2 s data provided by the formaldehyde analyser were then average on a typical duration of 30 min and the standard deviations were calculated.
When changing the formaldehyde aqueous solution or temperature, or microporous tube length, the same procedure was repeated. Sampling of the DNPH cartridges, which involves 12 h, was systematically performed at night.
3. Results
Once the gas generator was assembled, all parameters that could have an impact on the formaldehyde gas/liquid equilibrium were studied. It was evaluated under controlled laboratory conditions by varying the liquid formaldehyde concentration ([HCHO]liq), the gas flow rate (Fgas), the temperature (T), the length of the microporous tube (L), i.e., the gas–liquid exchange surface, and the position of the microporous tube inside the aqueous formaldehyde solution. For this, two analytical methods were coupled to the gas generator and were used to monitor the generated gaseous formaldehyde concentration.
Figure 3a shows the typical signals obtained with the formaldehyde analyser when analysing the gas mixture obtained with different experimental conditions. In this series of experiments, only the aqueous formaldehyde concentration ([HCHO]liq) was varied from 2.5 to 200 mg L−1 whereas all the remaining parameters were fixed as: Fgas = 50 mL min−1, T = 10.7 °C, L = 7 cm. Before each concentration variation, pure air was injected into the analyser to obtain a reference signal that corresponds to the baseline (analytical blank). Since these experiments imply the change of the aqueous solution and then the temperature stabilisation of this solution between two experiments, they were not performed on the same day. Thus, Figure 3a reconstructs the variation of the analyser signal even though the measurements were not made continuously. As observed in Figure 3a, the blank signal was constant and stable during our analyses. When a given concentration of formaldehyde gas was injected into the analyser, the signal increased to reach a plateau (see Figure 3a). This signal returned to the baseline when clean air was injected into the analyser. The generated gas concentration of formaldehyde varied from 3.4 to 432.1 µg m−3. For the two highest concentrations (E and F), the gas mixture generated by the source was previously diluted with pure air prior to analysis with the formaldehyde analyser.
In addition to the formaldehyde analyser, the concentrations generated were quantified with the off-line method based on the sampling on DNPH tube coupled to HPLC-UV analysis. In Figure 3b, the signal of the formaldehyde analyser is plotted as a function of the real formaldehyde concentrations measured with the ISO 16000-3 reference method. This Figure 3b shows on the one hand that there is a perfect correlation between the two analytical techniques and on the other hand allows the calibration of the signal of the formaldehyde analyser to avoid any saturation of the fluorescence detector (saturation at 2.07 × 10⁶ µV).
3.1. Influence of the Liquid Formaldehyde Concentration
The influence of the liquid formaldehyde concentration ([HCHO]liq) in the range 0–200 mg L−1 on the generated gaseous concentration of formaldehyde was studied using the formaldehyde analyser (µ-F1, Chromatotec, Val-de-Virvée, France) calibrated according to Figure 3b. The temperature of the aqueous formaldehyde solution was set at 10.7 °C, which corresponds to a setpoint of 10 °C for the incubator.
The gas flow rate through the microporous tube was set at 50 mL min−1 and the microporous tube length at 7 cm. Again, for the two highest concentrations of 358.8 and 519.4 µg m−3, obtained with [HCHO]liq of 150 and 200 mg L−1, respectively, the gas mixture generated by the source was previously diluted with pure air before its quantification analysis with the formaldehyde analyser. Consequently, corrections on the generated formaldehyde concentration and the Relative Humidity (%) have been applied from the experimental measurements and the subsequent dilutions.
In Figure 4, the generated gaseous formaldehyde concentration increases linearly from 0 to 519 µg m−3 for liquid formaldehyde concentrations in the range 0–200 mg L−1, the zero value being obtained with a pure water solution. In the same conditions, the RH value varies from 31 to 39%.
3.2. Influence of Gas Flow Rate
The impact of the air flow rate in the range 25–100 mL min−1 through the microporous tube on the generated gaseous formaldehyde concentration was investigated by monitoring the resulting [HCHO]gas with the online formaldehyde analyser. The temperature of the liquid solution of formaldehyde was maintained at 10.7 °C, the microporous tube length was 7 cm and the aqueous formaldehyde concentration ranged between 0 and 200 mg L−1.
Figure 5a shows [HCHO]gas vs. [HCHO]liq for the three investigated gas flow rates, i.e., 25, 50, and 100 mL min−1 and for liquid formaldehyde concentrations ranging between 0 and 200 mg L−1. The gaseous formaldehyde concentrations are in the ranges 2.1–682.2 µg m−3, 1.4–519.4 µg m−3, 0.7–337.4 µg m−3 for 25, 50 and 100 mL min−1, respectively. The RH values are also reported in Figure 5a. They vary in the ranges 31–42%, 27–39% and 24–32% for 25, 50 and 100 mL min−1, respectively. Again, for the two highest liquid formaldehyde concentrations for each gas flow rate, the gas mixture generated by the source was previously diluted with pure air prior to gas analysis. Subsequent corrections on the generated formaldehyde concentration and the relative humidity (%) have been applied from the experimental measurements and the applied dilutions.
Figure 5b focuses on the lowest liquid concentrations, i.e., in the range 0–50 mg L−1.
3.3. Influence of the Temperature of the Liquid Solution
The temperature influences on the non-Henry equilibrium gas–liquid dynamics and thus on the generated gaseous formaldehyde concentration was studied at two different temperatures: 10.7 and 21.8 °C. A gas flow rate of 50 mL min−1 and a microporous tube length of 7 cm were fixed whereas the liquid concentration of formaldehyde ranged between 0 and 200 mg L−1. The resulting formaldehyde gas concentration was monitored with the online formaldehyde analyser.
The plots of [HCHO]gas vs. [HCHO]liq is displayed in Figure 6 for the two investigated temperatures and for liquid formaldehyde concentrations ranging between 0 and 200 mg L−1. The gaseous formaldehyde concentrations are in the ranges 1.4–519.4 µg m−3, 3–1141.6 µg m−3, for 10.7 and 21.8 °C, respectively. The RH values are also reported in Figure 6 and they vary in the ranges 27–34% and 48–57% for 10.7 and 21.8 °C, respectively. For each temperature and for the two highest liquid formaldehyde concentrations, the gas mixture generated by the source was previously diluted with pure air prior to gas analysis. Corrections on the generated [HCHO]gas and RH (%) have been therefore applied from the experimental measurements and dilutions.
As a complement to this study, a measurement of the humidity was carried out at different gas flows and temperatures. Figure 7 exhibits the values of RH as a function of the gas flow rate between 25 and 100 mL min−1 for four distinct temperatures, i.e., 5.8 °C, 10.7 °C, 15.4 °C and 21.8 °C.
For the four investigated temperatures, RH varies in the ranges 20–27%, 25–42%, 34–51% and 45–65% for 5.8 °C, 10.7 °C, 15.4 °C and 21.8 °C, respectively.
3.4. Influence of the Microporous Tube Length
Here, the effect of the length of the microporous tube on the generated quantities of gaseous formaldehyde and water vapor was studied under the same experimental conditions. The gas flow rate was set at 100 mL min−1 and the temperature of the formaldehyde solutions was regulated at 10.7 °C. Three microporous tube lengths were studied: 3.5 cm, 7 cm, and twice 7 cm to obtain 14 cm for different liquid formaldehyde concentrations from 10 to 100 mg L−1.
The linear plots of [HCHO]gas vs. [HCHO]liq is displayed in Figure 8a for the three studied microporous tube lengths. For liquid formaldehyde concentrations ranging between 0 and 100 mg L−1. The generated gaseous formaldehyde concentrations are in the ranges 0.6–82.7 µg m−3, 1.4–141.0 µg m−3 and 2.1–320.0 µg m−3, for L = 3.5 cm, L = 7 cm, and L = 14 cm, respectively. The corresponding relative humidity varies between 23–27%.
For a given value of [HCHO]liq in the range 10–100 mg L−1, Figure 8b shows linear plots of [HCHO]gas vs. the microporous tube length.
3.5. Influence of the Microporous Tube Position
Finally, the effect of the position of the microporous tube on the generated gaseous formaldehyde concentration and more precisely on its stability was also studied. For this, five configurations comprising coiled and straight tubes as illustrated in Figure 9 were investigated and combined with various microporous tube lengths (L = 3.5–20 cm). This effect of the microporous tube configuration was studied under the same experimental conditions with a liquid formaldehyde concentration of 20 mg L−1, a liquid solution temperature of 10.7 °C and a gas flow rate of 50 mL min−1.
Figure 10 shows the fluorescence signal of the formaldehyde analyser for the five studied configurations.
4. Discussion
The results presented above, and the influence of the different studied parameters on the non-Henry equilibrium gas–liquid dynamics are discussed below following the same arrangement as in Section 3. In addition, the consumption of formaldehyde in an aqueous solution has been determined to estimate the autonomy of this gaseous formaldehyde generator for laboratory applications or field calibrations. The performances of this novel gas generator are also compared with those already either described in the scientific literature or available on the market (see Table 1 and Table 2).
4.1. Influence of the Liquid Formaldehyde Concentration
For given values of Fgas, T and L, the generated gaseous formaldehyde concentration, expressed in µg m−3, increases perfectly linearly with the aqueous formaldehyde concentration when this latter ranges between 0 and 200 mg L−1 (see Figure 4). The generated gaseous formaldehyde concentration is therefore proportional to the liquid one, proving that a dynamic equilibrium is established at the gas/liquid interface formed by the microporous tube. According to the results shown in Figure 4, it seems quite easy, with this device, to generate very stable concentrations of gaseous formaldehyde over a wide range from a few µg m−3 to more than 500 µg m−3, by simply changing the concentration of the solution in the vial. In practice, this can be done very simply in a few minutes once the formaldehyde solution has been prepared and pre-cooled to the desired temperature.
In addition, with this type of linear regression obtained in Figure 4, it is also easy to determine the formaldehyde solution to be prepared for the targeted formaldehyde concentration in the gas phase.
It should also be noted that the gaseous formaldehyde concentrations obtained are typically those measured in indoor air, either in domestic (0–100 µg m−3) [6,8,13,15] or in professional environments (0–740 µg m−3) [22].
In these conditions (Fgas = 50 mL min−1, T = 10.7 °C, L = 7 cm), the relative humidity fluctuates around 35%.
4.2. Influence of Gas Flow Rate
For a given microporous tube length, the gas flow rate applied can directly modify the gas/liquid contact time, a higher flow rate implying a shorter contact time.
The gas flow rate was varied in the range 25–100 mL min−1 to limit gas consumption mainly for field use and calibration purposes. It should be noted that the minimum gas flow value of 25 mL min−1 was chosen because of the 20 mL min−1 sample gas flow required for the formaldehyde analyser [14,37], which nevertheless maintained a small leakage of 5 mL min−1 of the excess gas to leave the set-up at atmospheric pressure.
As shown in Figure 5, for fixed values of the temperature and the microporous tube length, [HCHO]gas increases perfectly with the values of [HCHO]liq between 0 and 200 mg L−1 for the three air flow rates tested, namely 25, 50 and 100 mL min−1, confirming that a dynamic equilibrium is established at gas/liquid interface, whatever the gas flow rate used. For a fixed liquid concentration of formaldehyde, the gaseous formaldehyde concentration obtained increases when the gas flow rate decreases. Indeed, the gas–liquid contact time at the microporous tube interface increases when decreasing the gas flow rate. Thus, the higher this contact time, the higher are the generated gaseous formaldehyde concentration and hygrometry in the gas phase.
For Fgas of 25, 50 and 100 mL min−1, the slopes are 3.30 ± 0.08, 2.49 ± 0.07 and 1.59 ± 0.08 (µg m−3 mg−1 L), respectively, where the quoted errors correspond to two times the standard deviation. Consequently, doubling the gas flow rate Fgas from 25 to 50 mL min−1 and 50 to 100 mL min−1 leads on average to a decrease in the gas phase concentration of about 25% and 36%, respectively, according to the ratio of the slopes obtained at these flow rates. While changing the concentration of the formaldehyde solution seems more appropriate to easily vary the generated formaldehyde gas concentration typically over at least two orders of magnitude, a decrease in gas flow through the micropore tube by a factor of 4 from 100 to 25 mL min−1 can already double the generated concentration. Such a variation can be controlled by computer, whereas changing the solution requires human intervention.
With the three flow rates studied, the concentrations generated, i.e., 2.1–682.2 µg m−3, 1.4–519.4 µg m−3 and 0.7–337.4 µg m−3 for 25, 50 and 100 mL min−1, respectively, correspond well to the calibration requirements in terms of concentrations encountered in domestic indoor environments (0–100 µg m−3) [6,7,8,15] and professional ones (0–1000 µg m−3) [18,22,69]. The choice of the gas flow rate could be dictated by the sampling gas flow rate of the instrument to be calibrated.
Concerning the average relative humidity generated at T = 10.7 °C and with L = 7 cm, it slightly decreases when the gas flow rate increases: 36%, 33% and 28% for 25, 50 and 100 mL min−1, respectively. This corresponds to the lower limits of RH values found in indoor environments [70].
4.3. Influence of the Temperature of the Liquid Solution
For a given molecule, the distribution between the gaseous and aqueous phases is driven by Henry’s law (Equation (1)) as soon as the aqueous solution is sufficiently diluted, i.e., typically for aqueous concentration lower than 1 × 10⁻³ or 1 × 10⁻² mol L−1, which is the case in the present study.
In the literature, several studies describe a device based on a dynamic equilibrium between the gas and liquid phases where the gas passes through a porous tube immersed in a dilute solution containing an organic molecule X and regulated in temperature [71,72,73,74,75]. Nevertheless, the length of their porous tube was very long in these studies reaching several meters to obtain an equilibrium verifying Henry’s law at the reactor outlet:
where HX is the Henry’s law constant of X (in M atm−1), [X]aq is the aqueous concentration (M) and PX is the partial pressure of X (atm). According to the perfect gases law, PX can be easily expressed in ppb and then in µg m−3.
HX = [X]aq/Px,
In this work, the length of the microporous tube (L = 3.5–14 cm) was drastically reduced to obtain a transportable compact device for generating gas mixtures. Therefore, in our study, Henry’s equilibrium is not reached at the outlet of the microporous tube.
However, non-Henry equilibrium gas–liquid dynamics met in our experiments and thus the concentration of formaldehyde generated in the gas phase should be impacted with temperature according to the temperature dependence of the Henry’s law constant which follows a Van’t Hoff law.
This is confirmed by our experimental results shown in Figure 6 for the two investigated temperatures: the concentration of gaseous formaldehyde increases perfectly linearly with the liquid one between 0 and 200 mg L−1 for both temperatures tested. At 10.7 °C (283.85 K) and 21.8 °C (294.95 K), the slopes are S = 2.49 ± 0.07 and S = 5.52 ± 0.15 (µg m−3 mg−1 L), respectively, where the quoted errors correspond to two times the standard deviation.
The slopes (S) of these plots are inversely proportional to the Henry’s law constant:
S = 1/HX = Px/[X]aq,
According to Equation (2), we can calculate the ratio between the two slopes, S294.95 K and S283.85 K, obtained at 21.8 °C (294.95 K) and 10.7 °C (283.85 K):
S294.95 K/S283.85 K = HHCHO, 283.85 K/HHCHO, 294.95 K,
Experimentally, the ratio S294.95 K/S283.85 K = 5.52/2.49 = 2.21 ± 0.13 where the quoted error is calculated from the uncertainties on both experimental slopes.
Temperature dependence of the Henry’s law constant of formaldehyde was previously reported in the literature [73]. According to the Van’t Hoff expression of HHCHO given by Allou et al (2011), the ratio between the Henry’s law constants at 283.85 and 294.95 K, respectively, is the following:
where the quoted errors on the two Henry’s law constants are those reported by Allou et al (2011) [73].
Within the error bars on both ratios, the equality of Equation (3) is verified, and the results are therefore consistent.
From a practical point of view, the increase from 10.7 to 21.8 °C (10 to 20 °C on the incubator control) allows the generated concentration of gaseous formaldehyde to be increased by 230% on average from aqueous formaldehyde solutions between 0 and 200 mg L−1. The increase effect on the gas concentration is comparable to a decrease in the flow rate from 100 to 25 mL min−1, as observed in Section 4.2.
However, the gas concentration change will be faster with a change in the gas flow rate because a temperature change requires a certain amount of time (about 2 h in our conditions from 10.7 to 21.8 °C) due to the thermal inertia of the device related to the volume of the solution.
In addition, the temperature change can significantly alter the relative humidity of the generated gas phase. Indeed, under our experimental conditions, average RH values are about 30% at 10.7 °C and around 52% at 21.8 °C (see Figure 6). Figure 7 highlights that RH decreases when the temperature decreases and when the gas flow rate decreases, as already observed in Figure 5. However, it will be advisable to avoid having the temperature of the generating device too high compared to the room temperature to prevent any condensation of water droplets in the tubing downstream of the generating device. Such condensation and water droplet formation will trap gaseous formaldehyde and will induce instabilities in terms of gaseous formaldehyde concentrations generated since this compound is very water soluble.
4.4. Influence of the Microporous Tube Length
The length of the porous membrane can strongly affect the transfer of formaldehyde into the gas phase, since it changes the total surface area of the interface and increases the gas/liquid contact time when increasing the microporous tube length.
This is confirmed by the results obtained in this work and displayed in Figure 8a,b at 10.7 °C and Fgas = 100 mL min−1. Figure 8a highlights that for a given concentration of formaldehyde in aqueous solution, the microporous tube length influences the generated gaseous formaldehyde. Indeed, for microporous tube lengths of 3.5 cm, 7 cm and 14 cm, the slopes of the calibration curves are 0.78 ± 0.08, 1.48 ± 0.11 and 3.19 ± 0.07 µg m−3 mg−1 L, respectively, where the quoted errors correspond to two times the standard deviation. The slopes of the curves are proportional to the length of the microporous tube. This proportionality is also verified in Figure 8b, wherein the gaseous formaldehyde concentration is increasing linearly with the length of the microporous tube up to 14 cm. Such an observation supports the hypothesis of the establishment of a dynamic equilibrium between the gas and liquid phases at the porous interface, where the gas–liquid contact time influences the formaldehyde transfer efficiency from the liquid to the gas phase. These results confirm also that the non-Henry equilibrium is not reached in our conditions for L = 3.5–14 cm.
Conversely, the results obtained in Figure 8 indicate that relative humidity is poorly influenced by the length of the microporous tube with an average value of 25% in our conditions.
In practice, a shorter microporous tube will be used to generate a lower range of gaseous formaldehyde concentrations while a longer one will be more suitable for generating high concentrations of gaseous formaldehyde. While changing the length of this microporous tube does allow the gas concentrations generated to be modified, it does require maintenance of the instrument. Again, changing the gas flow rate or the solution and thus its liquid concentration seems more appropriate to simply vary the generated gas concentration of formaldehyde.
4.5. Influence of the Microporous Tube Position
Figure 10 shows that for a coiled tube configuration, the generated gas concentrations are not stable (points A and B) whereas for perfectly straight tube configurations, the generated concentrations are very stable (points C, D and E). Its helical positioning alters the gas–liquid exchange surface, resulting in disturbances and thus unstable concentrations of gaseous formaldehyde.
Thus, in case of analytical calibration purposes, the microporous tube must be perfectly straight for reproducible formaldehyde gas generation.
4.6. Consumption of Formaldehyde in Aqueous Solution and Device Autonomy
The device autonomy is a key point to ensure stable gas generation over time, at least during the calibration of the instruments. It could be assumed that the liquid formaldehyde concentration can be considered constant if less than 1% of the formaldehyde molecules have been transferred in the gas phase. Therefore, Table S1 shows the time tautonomy (min) required for this consumption of 1%, which will be defined as the operating autonomy of the device. This time is calculated as follows considering the gaseous formaldehyde as perfect gas:
With:
nHCHO liq: number of moles of formaldehyde in the liquid solution (mol);
nHCHO gas: number of moles of formaldehyde in gas generated (mol);
[HCHO]liq: concentration of formaldehyde in the liquid solution (mol L−1);
Vsol: Volume of liquid solution (L);
MHCHO: molar mass of formaldehyde (g mol−1);
PHCHO gas: partial pressure of formaldehyde derived from the experimental gas concentrations (µg m−3) obtained in this work at atmospheric pressure (Pa);
VHCHO gas: Volume of gaseous formaldehyde (m3);
R: Universal constant of perfect gases (J K−1 mol−1);
T: Temperature (K);
FHCHO gas: gas flow rate through the microporous tube (m3 min−1).
Based on the experimental concentrations of formaldehyde in the gas phase, Figure 11 shows the autonomy calculated according to Equation (8) as a function of the concentration of formaldehyde in solution, for the three gas flow rates studied.
For a given flow rate and for liquid concentrations from 5 to 200 mg L−1, the autonomy is relatively stable, a moderate decrease is observed: 22% (25 mL min−1), 24% (50 mL min−1) and 20% (100 mL min−1). The inconsistency of the data at 2.5 mg L−1 suggests that either the gas concentrations generated under these conditions are too low for reliable measurement with the two analytical techniques used or liquid formaldehyde concentrations could be affected by the presence of residual liquid formaldehyde in pure water. The formaldehyde gas concentrations with 2.5 mg L−1 at 10.7 °C, are equal to 8.6, 2.5 et 1.3 µg m−3 for 25, 50 and 100 mL min−1, respectively.
Conversely, the gas phase flow rate strongly impacts the autonomy of the device, as highlighted in Figure 11. At 25 mL min−1, the autonomy is approximately twice that found with 100 mL min−1.
It should be noted that a doubled volume of solution would double the autonomy of the gas generator.
At 10 °C and for gas flow rates of 25, 50 or 100 mL min−1, it appears that all experimental conditions allow us to obtain an autonomy of more than 10 days with a continuous operation 24 h a day (see Table S1 and Figure 11). After 10 days, it is therefore advisable to renew the aqueous formaldehyde solution for the unwary user.
4.7. Comparison with Other Gas Generators of Formaldehyde
As mentioned in the introduction, gaseous formaldehyde can be generated by many methods (see Table 1 and Table 2) and using several reagents: methanol, paraformaldehyde and trioxane (polymerized solids), formaldehyde (in liquid solution).
The objective of this work was to obtain a relatively low-cost device able to generate low formaldehyde concentrations while using low gas flow rates and to be able to easily modulate the generated concentrations in the range of gas concentrations of domestic and professional indoor environments. To facilitate the comparison with the present work, Figure 12 gathers the performances of the different gaseous sources of formaldehyde [54,56,59,60,76] and allows us to visualize the gaseous concentrations of formaldehyde generated as a function of the gas flow rate used (mL min−1). Only the techniques where both generated gas formaldehyde concentrations and gas flow rates are provided by the authors or manufacturers are displayed in Figure 12.
According to Figure 12, the permeation-based methods are the most used in the literature, with a wide range of air or nitrogen flow rates from 12.4 to 6500 mL min−1, in contrast to the other techniques which use flow rates from 250 to 2000 mL min−1. For paraformaldehyde permeation tubes, several parameters can vary such as the gas flow rate and tube length used. The temperature could be a variable parameter; however, it is most often fixed at 70 °C to convert paraformaldehyde into gaseous formaldehyde. For a given length of permeation tube, only the gas flow rate can vary the resulting formaldehyde gas concentration. Andrawes et al generated a concentration of 6633 µg m−3 for a gas flow rate of 12.4 mL min−1 [54] (Figure 12, reference A) whereas the Chromatotec company generated a concentration of 214 µg m−3 for a flow rate of 70 mL min−1 with a permeation tube length of 4.5 cm [76] (Figure 12, reference G). This lower concentration can be obtained at the expense of a large gas flow, leading to a decrease in the formaldehyde gas concentration. A similar behaviour was observed by Aoyagi et al with a permeation tube length of 5 cm (Figure 12, reference D), their generated concentrations being equal to 120, 60, 20 and 10 µg m−3 for the flow rates of 507-, 993-, 3040- and 6050 mL min−1, respectively [59]. Whatever the study [54,59], in the case of the permeation tube used with solid paraformaldehyde, the application of a fixed gas flow rate generates a single formaldehyde concentration in the gas phase.
In our study, in addition to the gas flow rate and the microporous tube length, which are parameters that can be varied with a permeation tube operating with paraformaldehyde [54,59], two other parameters allow us to easily modify the generated formaldehyde gaseous concentration: the temperature and the concentration of the formaldehyde solution. Therefore, for a given gas flow applied, the resulting ranges of gaseous formaldehyde concentration can be very large, from 2.1 to 1738.7 µg m−3, 1.4 to 1141.6 µg m−3 and 0.7 to 622.7 µg m−3 for 25, 50 and 100 mL min−1, respectively.
For the commercial permeation tube (Permeater PD1B, Gastec, Kanagawa, Japan) which also operates with a liquid formaldehyde solution, they report a concentration range of 6 to 295 µg m−3 for a gas flow rate of 200 to 10,000 mL min−1 with a permeation tube of 5 cm [77]. However, they do not specify the liquid concentration used and indicate that their apparatus operates at 25 and 50 °C. In Figure 12 (reference F), it was assumed that the concentration of 295 µg m−3 was obtained with 200 mL min−1. This latter is consistent with our value of 622.7 obtained at 100 mL min−1, T = 10.7 °C and [HCHO]liq = 200 mg L−1. In their case, lower concentrations are then obtained by dilution with pure air [77], requiring very high gas flow rates of several L min−1 to reach concentrations of the order of 10–50 µg m−3.
The dynamic evaporation of aqueous formaldehyde solution consists of bubbling pure air into a 10 mL formaldehyde solution contained in a vial of 20 mL and recovering the formaldehyde loaded gas. Zhu et al (2019) conducted experiments in which Fgas = 40 mL min−1. They reached a gas concentration of HCHO ranging between 1 and 123 µg m−3 as shown in Figure 12 (reference E) by varying the liquid concentration [60].
The technique based on liquid droplets vaporization generated with a nebulizer from an aqueous formaldehyde solution (see reference C in Figure 12), permits to only generate huge gaseous formaldehyde concentrations (4.5–180 × 103 µg m−3) despite a strongly reduced liquid flow rate of 0.2–9.2 pL min−1 in a gas flow of 900 mL min−1.
Finally, the use of a pump motor driven syringe allows us to vary the concentration of gaseous formaldehyde between 983 and 1597 µg m−3 by continuously injecting a liquid solution of formaldehyde (37%) at a very low liquid flow rate of 0.10 µL h−1 in an air flow of 315 mL min−1 (Figure 12, reference B) [54].
Figure 12 demonstrates that the technique developed in this work is the only one that allows us to work with a low flow rate such as 25 to 100 mL min−1 while generating a wide range of concentrations (10–1000 µg m−3) with a very good accuracy. In its simplest configuration, the device uses only one RDM, which reduces the cost of the instrument to EUR 1850, since the RDM alone costs about EUR 1440. The generated concentration range is also perfectly representative of indoor air ones.
5. Conclusions
The present work reports the development and the validation of a new simple and easy to use generator of gas mixtures based on non-Henry equilibrium gas–liquid dynamics at a microporous interface. This device has been validated with formaldehyde, which is a major indoor air pollutant.
The gas mixture of interest is generated from a temperature-controlled aqueous formaldehyde solution placed inside a 250 mL vial in which a short straight microporous tube is immersed. A non-emissive 3D device has been designed and manufactured to ensure that it is positioned perfectly straight. A carrier gas (synthetic air or nitrogen) is injected into the microporous tube at a given flow rate, thanks to tubing that are connected to the microporous tube in a perfectly sealed manner. At the outlet of the reactor, the gas pollutant concentration depends on the pollutant concentration of the liquid solution, the gas flow rate, the temperature, and the length of the microporous tube.
Our results show that gas concentrations of formaldehyde, representative of indoor environments at home or at work, can be easily generated, typically from a few tens to several hundred ppb and even more. Indeed, this device allows the generation of precise and stable gaseous formaldehyde levels in the range of 10–1739 µg m−3 (8.1–1416 ppb). To date, there are different types of devices for the generation of gaseous formaldehyde. However, this device is the only one that has a very wide concentration range with a low carrier gas flow rate.
The developed instrument is very flexible, since the length of the microporous tube, gas flow rate, temperature and concentration of the liquid solution can be adapted to the range of formaldehyde concentrations targeted. To achieve high gas concentrations that can be found in industrial or heavily polluted environments, the length of the microporous tube, the aqueous concentration and temperature can be increased, whereas the flow rate of the carrier gas can be decreased. Conversely, to generate low concentrations, the length of the microporous tube, the concentration and temperature of the pollutant solution can be decreased, and the carrier gas flow rate increased. However, the carrier gas flow rate affects the autonomy of the device. When using a high flow rate, the liquid pollutant solution has to be changed every 10 days, whereas for a low flow rate of 25 mL min−1, the solution can be used continuously for 20 days.
For the calibration of multi-point measurement instruments, we recommend the two approaches detailed below:
- −
- The first is to vary the concentration of the aqueous formaldehyde solution and recheck at least one of the highest formaldehyde concentrations generated with sampling on DNPH tube followed by HPLC analysis.
- −
- The second consists of fixing the gaseous concentration of formaldehyde, for example Fgas = 25 mL min−1, T = 10 °C, and [HCHO]liq = 100 mg L−1. Again, it will be necessary to recheck the concentration generated with the reference method involving an active sampling on DNPH tube and its HPLC analysis. Then, the concentration of gaseous formaldehyde will be varied by diluting this gaseous mixture with a gaseous flow of pure air at the outlet of the device which could be beforehand purified with a DNPH tube to remove the residual gaseous formaldehyde. This will allow for an easy and fast variation of the formaldehyde gas concentrations for a quick calibration, avoiding the time loss to reach a new dynamic equilibrium when changing the experimental conditions.
The concentration of gaseous formaldehyde, while maintaining a stable relative humidity, can be varied by changing the formaldehyde concentration of the liquid solution for a fixed temperature and a constant gas flow rate. For example, at 10 °C and 50 mL min−1, the generated gas concentration of HCHO ranges between 21 and 519 µg m−3 (17–422 ppb), for RH = 31–34% and [HCHO]liq = 10–200 mg L−1.
For a given generated gaseous formaldehyde concentration, it is also possible to vary the relative humidity with the developed device based on the set-up presented in Figure S2 where three different gas flow rates are needed. Indeed, DHCHO, Ddry and Dhumid correspond to the gas flow rates of formaldehyde obtained by the developed gas generator, dry air, and humid air, respectively. The humid air is obtained with the same gas generator as that used for formaldehyde, with pure water replacing the aqueous formaldehyde solution. The experimental conditions permitting to generate a fixed target formaldehyde concentration of 100 µg m−3 (81.4 ppb) at the outlet of the set-up shown in Figure S2, are summarized in Table S2. The resulting theoretical relative humidity (RHtotal) derived from our experimental data can vary between 7 and 62%. As water vapour is likely to interfere with many analytical instruments dedicated to formaldehyde [78,79]. Varying the relative humidity easily for the same formaldehyde concentration may therefore be of great interest to demonstrate the effect of gaseous water on formaldehyde measurement. The first limitation of this gas generator is that it cannot generate perfectly dry gas mixtures unlike permeation tubes using paraformaldehyde [54,59], which could be useful for some specific applications.
The new gas generator is relatively compact and light, making it easy to transport for on-site calibrations. Currently, the size of the incubator is slightly oversized, and a custom-made temperature control device could be developed to reduce the overall footprint.
Using a 110 L nitrogen cylinder (197140, Air Products, Aubervilliers, France) and a gas flow rate of 25 mL min−1, the operating time is estimated to be approximately 73 h, or 9.2 days at 8 h per day. If we consider that it takes only a few hours for a stable concentration of gaseous formaldehyde, this autonomy allows for a complete calibration with 5 points and even much more.
This study was focused on the generation of gaseous formaldehyde to take advantage of our expertise in the on-line measurement of this soluble species. Of course, this gas generator will not permit the generation of non-water-soluble compounds such alkanes, alkenes, aromatic compounds, etc., which constitutes the second limitation of the device. Nevertheless, this method of generating pollutants in the gas phase can be used for all molecules soluble in aqueous solution and for the following families of organic pollutants: aldehydes, ketones, alcohols, esters, carboxylic acids, etc. However, for some species, the pH of the aqueous solution can have an impact on the concentration generated in the gas phase.
Supplementary Materials
The following supporting information can be downloaded at: https://www.mdpi.com/article/10.3390/chemosensors10040131/s1, Figure S1: Device used for the generation of gaseous formaldehyde from a liquid solution. This device integrates a cylinder of pure air, a mass flow controller, a glass reactor containing the aqueous formaldehyde solution where the microporous tube and its fixing system are immersed. At the outlet of the device, an autosampler allows a sampling of the gas generated on a DNPH cartridge for a subsequent analysis on HPLC-UV, Figure S2: Set-up recommended to vary the relative humidity of a generated gaseous formaldehyde mixture. MFC means Mass Flow Controller. DHCHO, Ddry and Dhumid are the gas flow rates of formaldehyde obtained by developed gas generator, dry air, and humid air, respectively. The humid air is obtained with the same gas generator than that used for formaldehyde, pure water replacing the aqueous formaldehyde solution, Table S1: Calculation of the autonomy (tautonomy), i.e., the time required for a loss of 1% of the mole number present in the formaldehyde solution at 10.7 °C and a gas flow rate Fgas of 25, 50 and 100 mL min−1, with a volume of liquid solution of 300 mL and for liquid formaldehyde concentration in the range 2.5–200 mg L−1, Table S2: Calculation of the theoretical Relative Humidity (RHtotal) obtained for various conditions and a fixed target formaldehyde concentration of [HCHO]gas, final = 100 µg m−3 (81.4 ppb) at the outlet of the set-up shown in Figure S2. THCHO, liq is the temperature of the liquid solution of formaldehyde; [HCHO]liq and [HCHO]gas are the formaldehyde concentrations in liquid and gas phases, respectively. The aqueous formaldehyde concentrations have been derived from the linear plots of [HCHO]gas vs. [HCHO]liq. DHCHO, Ddry and Dhumid are the gas flow rates of formaldehyde obtained by developed gas generator, dry air and humid air, respectively. The humid air is obtained with the same gas generator than that used for formaldehyde, pure water replacing the aqueous formaldehyde solution. Dtotal is the resulting total gas flow. RHHCHO, RHdry and RHhumid are the experimental relative humidities obtained in this work. RHtotal is the theoretical resulting final humidity of the gas mixture according to the relative contribution of each gas to the total flow rate.
Author Contributions
Conceptualization, A.B., S.L.C.; methodology, A.B. and S.L.C.; validation, A.B. and S.L.C.; formal analysis, A.B. and N.L.; investigation, A.B. and S.L.C.; resources, S.L.C. and C.A.S.; writing—original draft preparation, S.L.C. and A.B.; writing—review and editing, A.B. and S.L.C.; visualization, A.B.; supervision, S.L.C.; project administration, S.L.C.; funding acquisition, S.L.C. and C.A.S. All authors have read and agreed to the published version of the manuscript.
Funding
This work was funded by the MICA Carnot Institute through the GMG2 project. The activities of the MICA Carnot Institute are focused on functional materials, surfaces and interfaces.
Institutional Review Board Statement
Not applicable.
Informed Consent Statement
Not applicable.
Data Availability Statement
The data presented in this study are available on request from the corresponding author. The data are not publicly available because the authors want to keep priority for conference presentations.
Acknowledgments
The authors thank the technical department of ICPEES and more particularly Christophe Sutter (Electronic engineer) and Michel Wolf (Assistant Mechanical Engineer) as well as all the administrative staff of ICPEES for their support. The authors would also like to thank the entire staff of the MICA Carnot Institute for the quality of the exchanges and the animation of this network of laboratories as well as the interdisciplinary thematic institute “Hierarchical and functional materials for health, environment and energy” (ITI HiFunMat).
Conflicts of Interest
The authors declare no conflict of interest.
References
- Dehghani, M.H.; Zarei, A.; Farhang, M.; Kumar, P.; Yousefi, M.; Kim, K.-H. Levels of formaldehyde in residential indoor air of Gonabad, Iran. Hum. Ecol. Risk Assess. Int. J. 2020, 26, 483–494. [Google Scholar] [CrossRef]
- Martonos, I.; Matei, A.; Rosu, C. Ventilation and Indoor Air Quality in Learning Environments from Cluj-Napoca. In Proceedings of the Air and Water Components of the Environment Conference Proceedings, Cluj-Napoca, Romania, 20–22 March 2020; pp. 23–36. [Google Scholar] [CrossRef]
- Saini, J.; Dutta, M.; Marques, G. A comprehensive review on indoor air quality monitoring systems for enhanced public health. Sustain. Environ. Res. 2020, 30, 6. [Google Scholar] [CrossRef] [Green Version]
- Orola, B. Seasonal variations in indoor air quality parameters and occupants self-reported physical health within a warm humid climatic environment. Sustain. Build. 2020, 5, 2. [Google Scholar] [CrossRef]
- Yuan, Y.; Alahmad, B.; Kang, C.-M.; Al-Marri, F.; Kommula, V.; Bouhamra, W.; Koutrakis, P. Dust Events and Indoor Air Quality in Residential Homes in Kuwait. Int. J. Environ. Res. Public. Health 2020, 17, 2433. [Google Scholar] [CrossRef] [Green Version]
- Wang, B.; Lee, S.C.; Ho, K.F. Characteristics of carbonyls: Concentrations and source strengths for indoor and outdoor residential microenvironments in China. Atmos. Environ. 2007, 13, 2851–2861. [Google Scholar] [CrossRef]
- Salthammer, T.; Mentese, S.; Marutzky, R. Formaldehyde in the indoor environment. Chem. Rev. 2010, 110, 2536–2572. [Google Scholar] [CrossRef] [PubMed]
- Xiaoyan, W.; Huixiang, W.; Shaoli, W. Ambient formaldehyde and its contributing factor to ozone and OH radical in a rural area. Atmos. Environ. 2010, 44, 2074–2078. [Google Scholar] [CrossRef]
- Mokalled, T.; Adjizian Gérard, J.; Abboud, M.; Liaud, C.; Nasreddine, R.; Le Calvé, S. An assessment of indoor air quality in the maintenance room at Beirut-Rafic Hariri International Airport. Atmos. Pollut. Res. 2019, 10, 701–711. [Google Scholar] [CrossRef]
- Marchand, C.; Calvé, S.L.; Mirabel, P.; Glasser, N.; Casset, A.; Schneider, N.; de Blay, F. Concentrations and determinants of gaseous aldehydes in 162 homes in Strasbourg (France). Atmos. Environ. 2008, 3, 505–516. [Google Scholar] [CrossRef]
- Marchand, C.; Bulliot, B.; Le Calvé, S.; Mirabel, P. Aldehyde measurements in indoor environments in Strasbourg (France). Atmos. Environ. 2006, 40, 1336–1345. [Google Scholar] [CrossRef]
- Casset, A.; Marchand, C.; Purohit, A.; Le Calve, S.; Uring-Lambert, B.; Donnay, C.; Meyer, P.; de Blay, F. Inhaled formaldehyde exposure: Effect on bronchial response to mite allergen in sensitized asthma patients. Allergy 2006, 61, 1344–1350. [Google Scholar] [CrossRef] [PubMed]
- Salthammer, T. Formaldehyde sources, formaldehyde concentrations and air exchange rates in European housings. Build. Environ. 2019, 150, 219–232. [Google Scholar] [CrossRef]
- Trocquet, C.; Bernhardt, P.; Guglielmino, M.; Malandain, I.; Liaud, C.; Englaro, S.; Le Calvé, S. Near Real-Time Monitoring of Formaldehyde in a Low-Energy School Building. Atmosphere 2019, 10, 763. [Google Scholar] [CrossRef] [Green Version]
- Gilbert, N.L.; Guay, M.; Gauvin, D.; Dietz, R.N.; Chan, C.C.; Lévesque, B. Air change rate and concentration of formaldehyde in residential indoor air. Atmos. Environ. 2008, 10, 2424–2428. [Google Scholar] [CrossRef]
- Liu, C.; Miao, X.; Li, J. Outdoor formaldehyde matters and substantially impacts indoor formaldehyde concentrations. Build. Environ. 2019, 158, 145–150. [Google Scholar] [CrossRef]
- IARC Classifies Formaldehyde as Carcinogenic. Available online: http://journals.lww.com/oncology-times/fulltext/2004/07100/iarc_classifies_formaldehyde_as_carcinogenic.27.aspx (accessed on 7 March 2022).
- Fontaine, B. Expositions Professionnelles Au Formaldéhyde. Air Pur 2008, 6, 43–48. [Google Scholar]
- Jafari, M.J.; Rahimi, A.; Omidi, L.; Behzadi, M.H.; Rajabi, M.H. Occupational Exposure and Health Impairments of Formaldehyde on Employees of a Wood Industry. Health Promot. Perspect. 2016, 5, 296–303. [Google Scholar] [CrossRef] [PubMed]
- Pierce, J.S.; Abelmann, A.; Spicer, L.J.; Adams, R.E.; Glynn, M.E.; Neier, K.; Finley, B.L.; Gaffney, S.H. Characterization of Formaldehyde Exposure Resulting from the Use of Four Professional Hair Straightening Products. J. Occup. Environ. Hyg. 2011, 8, 686–699. [Google Scholar] [CrossRef]
- Lang, I.; Bruckner, T.; Triebig, G. Formaldehyde and chemosensory irritation in humans: A controlled human exposure study. Regul. Toxicol. Pharmacol. 2008, 50, 23–36. [Google Scholar] [CrossRef]
- Formaldéhyde—INRS. Available online: https://www.inrs.fr/risques/formaldehyde/ce-qu-il-faut-retenir.html (accessed on 24 January 2022).
- Williams, J.; Li, H.; Ross, A.B.; Hargreaves, S.P. Quantification of the influence of NO2, NO and CO gases on the determination of formaldehyde and acetaldehyde using the DNPH method as applied to polluted environments. Atmos. Environ. 2019, 218, 117109. [Google Scholar] [CrossRef]
- Herrington, J.S.; Hays, M.D. Concerns Regarding 24-h Sampling for Formaldehyde, Acetaldehyde, and Acrolein Using 2,4-Dinitrophenylhydrazine (DNPH)-Coated Solid Sorbents. Atmos. Environ. 2012, 55, 179–184. [Google Scholar] [CrossRef]
- Trocquet, C.; Lara-Ibeas, I.; Schulz, A.; Bernhardt, P.; Cormerais, B.; Englaro, S.; Le Calvé, S. Continuous aldehydes monitoring in primary schools in France: Evaluation of emission sources and ventilation practices over 5 weeks. Atmos. Pollut. Res. 2021, 12, 340–351. [Google Scholar] [CrossRef]
- Hornshøj, B.H.; Kobbelgaard, S.; Blakemore, W.R.; Stapelfeldt, H.; Bixler, H.J.; Klinger, M. Quantification of free formaldehyde in carrageenan and processed Eucheuma seaweed using high-performance liquid chromatography. Food Addit. Contam. Part A 2015, 32, 152–160. [Google Scholar] [CrossRef] [PubMed]
- Freitas Rezende, F.B.; de Souza Santos Cheibub, A.M.; Pereira Netto, A.D.; de Carvalho Marques, F.F. Determination of formaldehyde in bovine milk using a high sensitivity HPLC-UV method. Microchem. J. 2017, 134, 383–389. [Google Scholar] [CrossRef]
- Rosenberger, W.; Beckmann, B.; Wrbitzky, R. Airborne aldehydes in cabin-air of commercial aircraft: Measurement by HPLC with UV absorbance detection of 2,4-dinitrophenylhydrazones. J. Chromatogr. B Analyt. Technol. Biomed. Life Sci. 2016, 1019, 117–127. [Google Scholar] [CrossRef] [PubMed]
- Soman, A.; Qiu, Y.; Chan Li, Q. HPLC-UV method development and validation for the determination of low level formaldehyde in a drug substance. J. Chromatogr. Sci. 2008, 46, 461–465. [Google Scholar] [CrossRef] [Green Version]
- Van den Broek, J.; Cerrejon, D.K.; Guntner, A.T.; Pratsinis, S.E. Compact Formaldehyde Detector Based on Filter–Sensor System with Validated Performance in Indoor Air. ECS Meet. Abstr. 2021, MA2021-01, 1567. [Google Scholar] [CrossRef]
- Liao, C.; Zhang, M.; Gao, N.; Tian, Q.; Shi, J.; Chen, S.; Wang, C.; Zang, L. Paper-Based Vapor Detection of Formaldehyde: Colorimetric Sensing with High Sensitivity. Chemosensors 2021, 9, 335. [Google Scholar] [CrossRef]
- Mariuta, D.; Baldas, L.; Colin, S.; Le Calvé, S.; Korvink, J.G.G.; Brandner, J.J. Prototyping a miniaturized microfluidic sensor for real-time detection of airborne formaldehyde. Int. J. Chem. Eng. Appl. 2020, 11, 23–28. [Google Scholar] [CrossRef]
- Feng, L.; Feng, L.; Li, Q.; Cui, J.; Guo, J. Sensitive Formaldehyde Detection with QCM Sensor Based on PAAm/MWCNTs and PVAm/MWCNTs. ACS Omega 2021, 6, 14004–14014. [Google Scholar] [CrossRef]
- Jo, Y.K.; Jeong, S.-Y.; Moon, Y.K.; Jo, Y.-M.; Yoon, J.-W.; Lee, J.-H. Exclusive and ultrasensitive detection of formaldehyde at room temperature using a flexible and monolithic chemiresistive sensor. Nat. Commun. 2021, 12, 4955. [Google Scholar] [CrossRef] [PubMed]
- Baldelli, A.; Jeronimo, M.; Tinney, M.; Bartlett, K. Real-time measurements of formaldehyde emissions in a gross anatomy laboratory. SN Appl. Sci. 2020, 2, 769. [Google Scholar] [CrossRef] [Green Version]
- Allouch, A.; Guglielmino, M.; Bernhardt, P.; Serra, C.A.; Le Calvé, S. Transportable, fast and high sensitive near real-time analyzers: Formaldehyde detection. Sens. Actuators B Chem. 2013, 181, 551–558. [Google Scholar] [CrossRef]
- Guglielmino, M.; Bernhardt, P.; Trocquet, C.; Serra, C.A.; Le Calvé, S. On-line gaseous formaldehyde detection by a microfluidic analytical method based on simultaneous uptake and derivatization in a temperature controlled annular flow. Talanta 2017, 172, 102–108. [Google Scholar] [CrossRef]
- Hanoune, B.; LeBris, T.; Allou, L.; Marchand, C.; Le Calvé, S. Formaldehyde measurements in libraries: Comparison between infrared diode laser spectroscopy and a DNPH-derivatization method. Atmos. Environ. 2006, 40, 5768–5775. [Google Scholar] [CrossRef]
- Becker, A.; Andrikopoulou, C.; Bernhardt, P.; Ocampo-Torres, R.; Trocquet, C.; Le Calvé, S. Development and Optimization of an Airborne Formaldehyde Microfluidic Analytical Device Based on Passive Uptake through a Microporous Tube. Micromachines 2019, 10, 807. [Google Scholar] [CrossRef] [Green Version]
- Becker, A.; Andrikopoulou, C.; Bernhardt, P.; Ocampo-Torres, R.; Trocquet, C.; Le Calvé, S. On-Line Gaseous Formaldehyde Detection Based on a Closed-Microfluidic-Circuit Analysis. Chemosensors 2020, 8, 57. [Google Scholar] [CrossRef]
- Le Calvé, S.; Andrikopoulou, C.; Becker, A.; Trocquet, C.; Plaisance, H. FR3097967 Procédé et Dispositifs D’Analyses Microfluidiques Pour La Quantification De Polluants Gazeux Solubles Dans L’Eau. Available online: https://patentscope.wipo.int/search/fr/detail.jsf?docId=FR315301918&_cid=P10-KSQ19R-92862-1 (accessed on 5 February 2022).
- Mariuta, D.; Govindaraji, A.; Colin, S.; Barrot, C.; Le Calvé, S.; Korvink, J.G.; Baldas, L.; Brandner, J.J. Optofluidic Formaldehyde Sensing: Towards On-Chip Integration. Micromachines 2020, 11, 673. [Google Scholar] [CrossRef]
- Yaqoob, U.; Younis, M.I. Chemical Gas Sensors: Recent Developments, Challenges, and the Potential of Machine Learning—A Review. Sensors 2021, 21, 2877. [Google Scholar] [CrossRef]
- Nie, S.; Dastan, D.; Li, J.; Zhou, W.-D.; Wu, S.-S.; Zhou, Y.-W.; Yin, X.-T. Gas-sensing selectivity of n-ZnO/p-Co3O4 sensors for homogeneous reducing gas. J. Phys. Chem. Solids 2021, 150, 109864. [Google Scholar] [CrossRef]
- Mohammad Beigia, S.; Mesgari, F.; Hossein, M.; Dastan, D.; Xu, G. Electrochemiluminescence Sensors based on Lanthanide Nanomaterials as Modifiers. Curr. Anal. Chem. 2022, 18, 53–62. [Google Scholar] [CrossRef]
- Pretto, A.; Milani, M.R.; Cardoso, A.A. Colorimetric determination of formaldehydein air using a hanging drop of chromotropic acid. J. Environ. Monit. 2000, 2, 566–570. [Google Scholar] [CrossRef] [PubMed]
- Toda, K.; Yoshioka, K.-I.; Mori, K.; Hirata, S. Portable system for near-real time measurement of gaseous formaldehyde by means of parallel scrubber stopped-flow absorptiometry. Anal. Chim. Acta 2005, 531, 41–49. [Google Scholar] [CrossRef]
- Sassine, M.; Picquet-Varrault, B.; Perraudin, E.; Chiappini, L.; Doussin, J.F.; George, C. A new device for formaldehyde and total aldehydes real-time monitoring. Environ. Sci. Pollut. Res. Int. 2014, 21, 1258–1269. [Google Scholar] [CrossRef]
- Sakai, T.; Tanaka, S.-I.; Teshima, N.; Yasuda, S.; Ura, N. Fluorimetric flow injection analysis of trace amount of formaldehyde in environmental atmosphere with 5,5-dimethylcyclohexane-1,3-dione. Talanta 2002, 58, 1271–1278. [Google Scholar] [CrossRef]
- Li, J.; Dasgupta, P.K.; Luke, W. Measurement of gaseous and aqueous trace formaldehyde: Revisiting the pentanedione reaction and field applications. Anal. Chim. Acta 2005, 531, 51–68. [Google Scholar] [CrossRef]
- Zheng, W. Développement D’Un Analyseur Rapide Et Transportable Du Formaldéhyde Dans L’Air. Ph.D. Thesis, University of Strasbourg, Strasbourg, France, 2010. [Google Scholar]
- Guglielmino, M.; Allouch, A.; Serra, C.A.; Calvé, S.L. Development of microfluidic analytical method for on-line gaseous Formaldehyde detection. Sens. Actuators B Chem. 2017, 243, 963–970. [Google Scholar] [CrossRef]
- Chu, P.M.; Thorn, W.J.; Sams, R.L.; Guenther, F.R. On-demand generation of a formaldehyde-in-air standard. J. Res. Natl. Inst. Stand. Technol. 1997, 102, 559. [Google Scholar] [CrossRef]
- Andrawes, F.F. Detection of Traces of Formaldehyde in Pure Air by Gas Chromatography and Helium Ionization Detection. J. Chromatogr. Sci. 1984, 22, 506–508. [Google Scholar] [CrossRef]
- Luong, J.; Yang, X.; Hua, Y.; Yang, P.; Gras, R. Gas Chromatography with In Situ Catalytic Hydrogenolysis and Flame Ionization Detection for the Direct Measurement of Formaldehyde and Acetaldehyde in Challenging Matrices. Anal. Chem. 2018, 90, 13855–13859. [Google Scholar] [CrossRef]
- Lindahl, R.; Levin, J.-O.; Mårtensson, M. Validation of a diffusive sampler for the determination of acetaldehyde in air. Analyst 1996, 121, 1177–1181. [Google Scholar] [CrossRef]
- Geisling, K.L.; Miksch, R.R.; Rappaport, S.M. Generation of dry formaldehyde at trace levels by the vapor-phase depolymerization of trioxane. Anal. Chem. 1982, 54, 140–142. [Google Scholar] [CrossRef]
- Dong, S. Dasgupta Solubility of gaseous formaldehyde in liquid water and generation of trace standard gaseous formaldehyde. Environ. Sci. Technol. 1986, 20, 637–640. [Google Scholar] [CrossRef] [PubMed]
- Aoyagi, R.; Matsunobu, K. Stability of Formaldehyde Calibration Gas by Permeation Tube Using Paraformaldehyde. Indoor Environ. 2012, 15, 7–14. [Google Scholar] [CrossRef] [Green Version]
- Zhu, H.; She, J.; Zhou, M.; Fan, X. Rapid and sensitive detection of formaldehyde using portable 2-dimensional gas chromatography equipped with photoionization detectors. Sens. Actuators B Chem. 2019, 283, 182–187. [Google Scholar] [CrossRef]
- Marsella, A.M.; Purdham, J.T.; Mabury, S.A. A New Method for the Measurement of Airborne Formaldehyde Using Derivatization with 3,5-Bis(Trifluoromethyl) Phenylhydrazine and Analysis by GC-ECD and GC-MS/SIM. Int. J. Environ. Anal. Chem. 2000, 76, 241–256. [Google Scholar] [CrossRef]
- ISO 16000-3:2011. Indoor Air—Part 3: Determination of Formaldehyde and Other Carbonyl Compounds—Active Sampling Method. Available online: https://www.iso.org/obp/ui/#iso:std:iso:16000:-3:ed-2:v1:en (accessed on 7 March 2022).
- Le Calvé, S.; Allouch, A.; Bernhardt, P.; Guglielmino, M.; Serra, C.A. FR3016441 Dispositifs Microfluidiques Pour L’Analyse De Polluants En Écoulement, Brevet Français. Déposé Le 14 Janvier 2014, Publié Le 17 Juillet 2015, Délivré Le 16 Juin 2017. Autres Références: EP3094405, US20160349188, CN106457240, JP2017505920, WO/2015/107298, CA2936771. Available online: https://patentscope.wipo.int/search/fr/detail.jsf?docId=EP179900057&_cid=P10- (accessed on 17 February 2022).
- Lara-Ibeas, I.; Megías-Sayago, C.; Louis, B.; Le Calvé, S. Adsorptive removal of gaseous formaldehyde at realistic concentrations. J. Environ. Chem. Eng. 2020, 8, 103986. [Google Scholar] [CrossRef]
- Salthammer, T. Photophysical properties of 3,5-diacetyl-1,4-dihydrolutidine in solution: Application to the analysis of formaldehyde. J. Photochem. Photobiol. Chem. 1993, 74, 195–201. [Google Scholar] [CrossRef]
- Eisner, U.; Kuthan, J. Chemistry of dihydropyridines. Chem. Rev. 1972, 72, 1–42. [Google Scholar] [CrossRef]
- Standard Test Method for Determination of Formaldehyde and Other Carbonyl Compounds in Air (Active Sampler Methodology). Available online: https://www.astm.org/d5197-16.html (accessed on 13 January 2022).
- Salthammer, T. Formaldehyde in the ambient atmosphere: From an indoor pollutant to an outdoor pollutant? Angew. Chem. Int. Ed. Engl. 2013, 52, 3320–3327. [Google Scholar] [CrossRef]
- ANSES—Agence Nationale De Sécurité Sanitaire De L’Alimentation, De L’Environnement et Du Travail. Valeurs Guides De Qualité D’Air Intérieur (Vgai) Le Formaldéhyde. Available online: https://www.anses.fr/fr/system/files/AIR2017SA0041Ra.pdf. (accessed on 7 March 2022).
- Arundel, A.V.; Sterling, E.M.; Biggin, J.H. Indirect health effects of relative humidity in indoor environments. Environ. Health Perspect. 1986, 65, 351–361. [Google Scholar] [PubMed] [Green Version]
- Rice, C.P.; Nochetto, C.B.; Zara, P. Volatilization of Trifluralin, Atrazine, Metolachlor, Chlorpyrifos, α-Endosulfan, and β-Endosulfan from Freshly Tilled Soil. J. Agric. Food Chem. 2002, 50, 4009–4017. [Google Scholar] [CrossRef] [PubMed]
- Staudinger, J.; Roberts, P.V. A critical review of Henry’s law constants for environmental applications. Crit. Rev. Environ. Sci. Technol. 1996, 26, 205–297. [Google Scholar] [CrossRef]
- Allou, L.; El Maimouni, L.; Le Calvé, S. Henry’s law constant measurements for formaldehyde and benzaldehyde as a function of temperature and water composition. Atmos. Environ. 2011, 45, 2991–2998. [Google Scholar] [CrossRef]
- Feigenbrugel, V.; Le Calvé, S.; Mirabel, P.; Louis, F. Henry’s law constant measurements for phenol, o-, m-, and p-cresol as a function of temperature. Atmos. Environ. 2004, 38, 5577–5588. [Google Scholar] [CrossRef]
- Feigenbrugel, V.; Le Calvé, S.; Mirabel, P. Temperature dependence of Henry’s law constants of metolachlor and diazinon. Chemosphere 2004, 57, 319–327. [Google Scholar] [CrossRef]
- Mascles, M.; Grandjean, A.; Le Calvé, S.; Bazin, D.; Amiet, F. Development and comparison of three analytical systems for detection and quantification of formaldehyde and other aldehydes for process, indoor and ambient air emissions. In Proceedings of the 14ème Congrès de L’Association Francophone des Sciences Séparatives (AFSEP), Paris, France, 5–7 October 2021. [Google Scholar]
- PermeaterPD-1B/PD-1B-2. GASTEC Corporation. Available online: https://www.gastec.co.jp/en/product/detail/id=2161 (accessed on 7 February 2022).
- Chiappini, L.; Dagnelie, R.; Sassine, M.; Fuvel, F.; Fable, S.; Tran-Thi, T.-H.; George, C. Multi-tool formaldehyde measurement in simulated and real atmospheres for indoor air survey and concentration change monitoring. Air Qual. Atmos. Health 2011, 4, 211–220. [Google Scholar] [CrossRef] [Green Version]
- Sidheswaran, M.; Cohn, S.; Sullivan, D.; Gundel, L. Performance Evaluation of Real Time Formaldehyde Monitors: PTR-MS and Interscan 4160-500B Portable Monitor. Available online: https://www.osti.gov/servlets/purl/1165367 (accessed on 7 March 2022).
Figure 1.
Device used for the generation of gaseous formaldehyde from a liquid solution. This device integrates a cylinder of pure air, a mass flow controller, a glass reactor containing the aqueous formaldehyde solution in which the microporous tube and its fixing system are immersed, an incubator to regulate the temperature. At the outlet of the device, the formaldehyde analyser monitored the gaseous formaldehyde concentration and the relative humidity in the gas mixture.

Figure 2.
Support pictures of the microporous tube either designed by CAD (left) or manufactured in ABS by 3D printing. A: 3D support of the microporous tube; B: microporous tube of 7 cm long; C: bevelled stainless-steel tube serving as a connector for the microporous tube; D: 1/16-inch Teflon tube; E: GL 45 bottle cap.

Figure 3.
Fluorescence signal of the formaldehyde analyser (µF1, Chromatotec, Val-de-Virvée, France) obtained at various gaseous formaldehyde concentrations: (A) 3.4 µg m−3 (2.7 ppb), (B) 17.5 µg m−3 (14.0 ppb), (C) 73.6 µg m−3 (58.9 ppb), (D) 192.8 µg m−3 (154.4 ppb), (E) 304.6 µg m−3 (243.9 ppb), (F) 432.1 µg m−3 (346.1 ppb) with Fgas = 50 mL min−1, T = 10.7 °C, L = 7 cm, a photomultiplier gain set at 50% and [HCHO]liq = 2.5–200 mg L−1. Red data mean that the formaldehyde gas mixture generated by the source was previously diluted with pure air prior to analysis, so a correction has been applied to obtain the real values. (a) Raw fluorescence signal of the formaldehyde analyser for the concentrations A–F (reconstructed plot, see text); (b) Calibration of the formaldehyde analyser: fluorescence signal vs. gaseous formaldehyde concentrations generated by the gas generator shown in Figure 3a and measured by the ISO 16000-3 reference method. The quoted error bars on the concentration are calculated from uncertainties of the MFC, the sampling volume and the HPLC analysis of DNPH tubes. Vertical error bars correspond to two times the standard deviation, but they are too small to be visible.

Figure 4.
Concentration of gaseous formaldehyde ([HCHO]gas) and relative humidity measured with the formaldehyde analyser (µF1, Chromatotec, Val-de-Virvée, France) vs. the liquid formaldehyde concentration with Fgas = 50 mL min−1, T = 10.7 °C, L = 7 cm, a photomultiplier gain set at 50% and [HCHO]liq = 0–200 mg L−1. The horizontal error bars correspond to the uncertainties calculated from the preparation of the liquid formaldehyde solution. The vertical error bars correspond to two times the standard deviation, but they are too small to be visible. Red circles and black triangles mean that the generated gaseous formaldehyde mixture has been diluted prior to analysis, so a correction has been applied to obtain the real values of [HCHO]gas and RH.

Figure 5.
Concentration of the generated gaseous formaldehyde and relative humidity measured with the formaldehyde analyser (µF1, Chromatotec, Val-de-Virvée, France) vs. the liquid formaldehyde concentration for three different gas flow rates (25 mL min−1 in green, 50 mL min−1 in blue and 100 mL min−1 in purple). The other parameters were fixed as follows: T = 10.7 °C, L = 7 cm, photomultiplier gain = 50%. The liquid formaldehyde concentrations were in the ranges: (a) 0–200 mg L−1 and (b) 0–50 mg L−1. The horizontal error bars correspond to the uncertainties calculated from the preparation of the liquid formaldehyde solution. The vertical error bars correspond to two times the standard deviation, but they are too small to be visible. Red circles and black triangles mean that the generated gaseous formaldehyde mixture has been diluted prior to analysis, so a correction has been applied to obtain the real values of [HCHO]gas and RH.

Figure 6.
Generated concentration of gaseous formaldehyde and relative humidity obtained with a formaldehyde analyser (µF1, Chromatotec, Val-de-Virvée, France) vs. the liquid formaldehyde concentration for two different temperatures (10.7 °C in blue and 21.8 °C in purple), [HCHO]liq = 0–200 mg L−1, Fgas = 50 mL min−1, L = 7 cm, photomultiplier gain = 50%. The horizontal error bars correspond to the uncertainties calculated from the preparation of the liquid formaldehyde solution. The vertical error bars correspond to two times the standard deviation, but they are too small to be visible. Red circles and black triangles mean that the generated gaseous formaldehyde mixture has been diluted prior to analysis, so a correction has been applied to obtain the real values of [HCHO]gas and RH.

Figure 7.
Relative humidity measured with the formaldehyde analyser (µF1, Chromatotec, Val-de-Virvée, France) vs. the gas flow rate applied in the microporous tube using pure water. T = 5.8, 10.7, 15.4 and 21.8 °C, Fgas = 25, 50, 60, 80 and 100 mL min−1.
Figure 7.
Relative humidity measured with the formaldehyde analyser (µF1, Chromatotec, Val-de-Virvée, France) vs. the gas flow rate applied in the microporous tube using pure water. T = 5.8, 10.7, 15.4 and 21.8 °C, Fgas = 25, 50, 60, 80 and 100 mL min−1.

Figure 8.
Generated gaseous formaldehyde concentration and relative humidity measured with a formaldehyde analyser (µF1, Chromatotec, Val-de-Virvée, France) for different tube lengths (L = 3.5 cm in purple, L = 7 cm in blue and L = 14 cm in green), with [HCHO]liq = 0–100 mg L−1, Fgas = 100 mL min−1, T = 10.7 °C, photomultiplier gain = 50%. The horizontal error bars correspond to the uncertainties calculated from the preparation of the liquid formaldehyde solution. The vertical error bars correspond to two times the standard deviation, but they are too small to be visible. (a) [HCHO]gas vs. [HCHO]liq for L = 3.5, 7 and 14 cm; (b) [HCHO]gas vs. the microporous tube length for [HCHO]liq = 10–10 mg L−1.

Figure 9.
Pictures of the 5 microporous tube configurations of different tube lengths and positions. (A): L = 20 cm, coiled; (B): L = 14 cm, coiled; (C): L = 14 cm, straight; (D): L = 7 cm, straight; (E): L = 3.5 cm, straight.
Figure 9.
Pictures of the 5 microporous tube configurations of different tube lengths and positions. (A): L = 20 cm, coiled; (B): L = 14 cm, coiled; (C): L = 14 cm, straight; (D): L = 7 cm, straight; (E): L = 3.5 cm, straight.

Figure 10.
Raw fluorescence signal of the formaldehyde analyser measured with the 5 studied configurations: A: L = 20 cm, coiled; B: L = 14 cm, coiled; C: L = 14 cm, straight; D: L = 7 cm, straight; E: L = 3.5 cm, straight. The other parameters were fixed as follows: [HCHO]liq = 20 mg L−1, Fgas = 50 mL min−1, T = 10.7 °C, photomultiplier gain = 50%.

Figure 11.
Autonomy (tautonomy) vs. liquid formaldehyde concentration for a gas flow rate of 25, 50 and 100 mL min−1. The autonomy (tautonomy) is the time required for a loss of 1% of the mole number present in the formaldehyde solution at 10 °C, with a volume of liquid solution of 300 mL and for liquid formaldehyde concentration in the range 2.5–200 mg L−1.

Figure 12.
Comparison of gaseous formaldehyde concentrations generated vs. gas flow rate using the different dynamic generation methods reported in the literature and this work. A: permeation tube with paraformaldehyde, Andrawes et al, (1984) [54]; B: pump motor driven syringe, Andrawes et al, (1984) [54]; C: vaporization with nebulizer of aqueous formaldehyde solution, Lindahl et al, (1996) [56]; D: permeation tube with paraformaldehyde, Aoyagi et al, (2012) [59]; E: Dynamic evaporation of aqueous formaldehyde solution, Zhu et al, (2019) [60]; F: Commercial instrument, Permeation tube with an aqueous solution of formaldehyde, Permeater PD1-B, Gastec, Japan [77]; G: Commercial instrument, permeation tube with paraformaldehyde, Chromatotec [76]; H: This work.


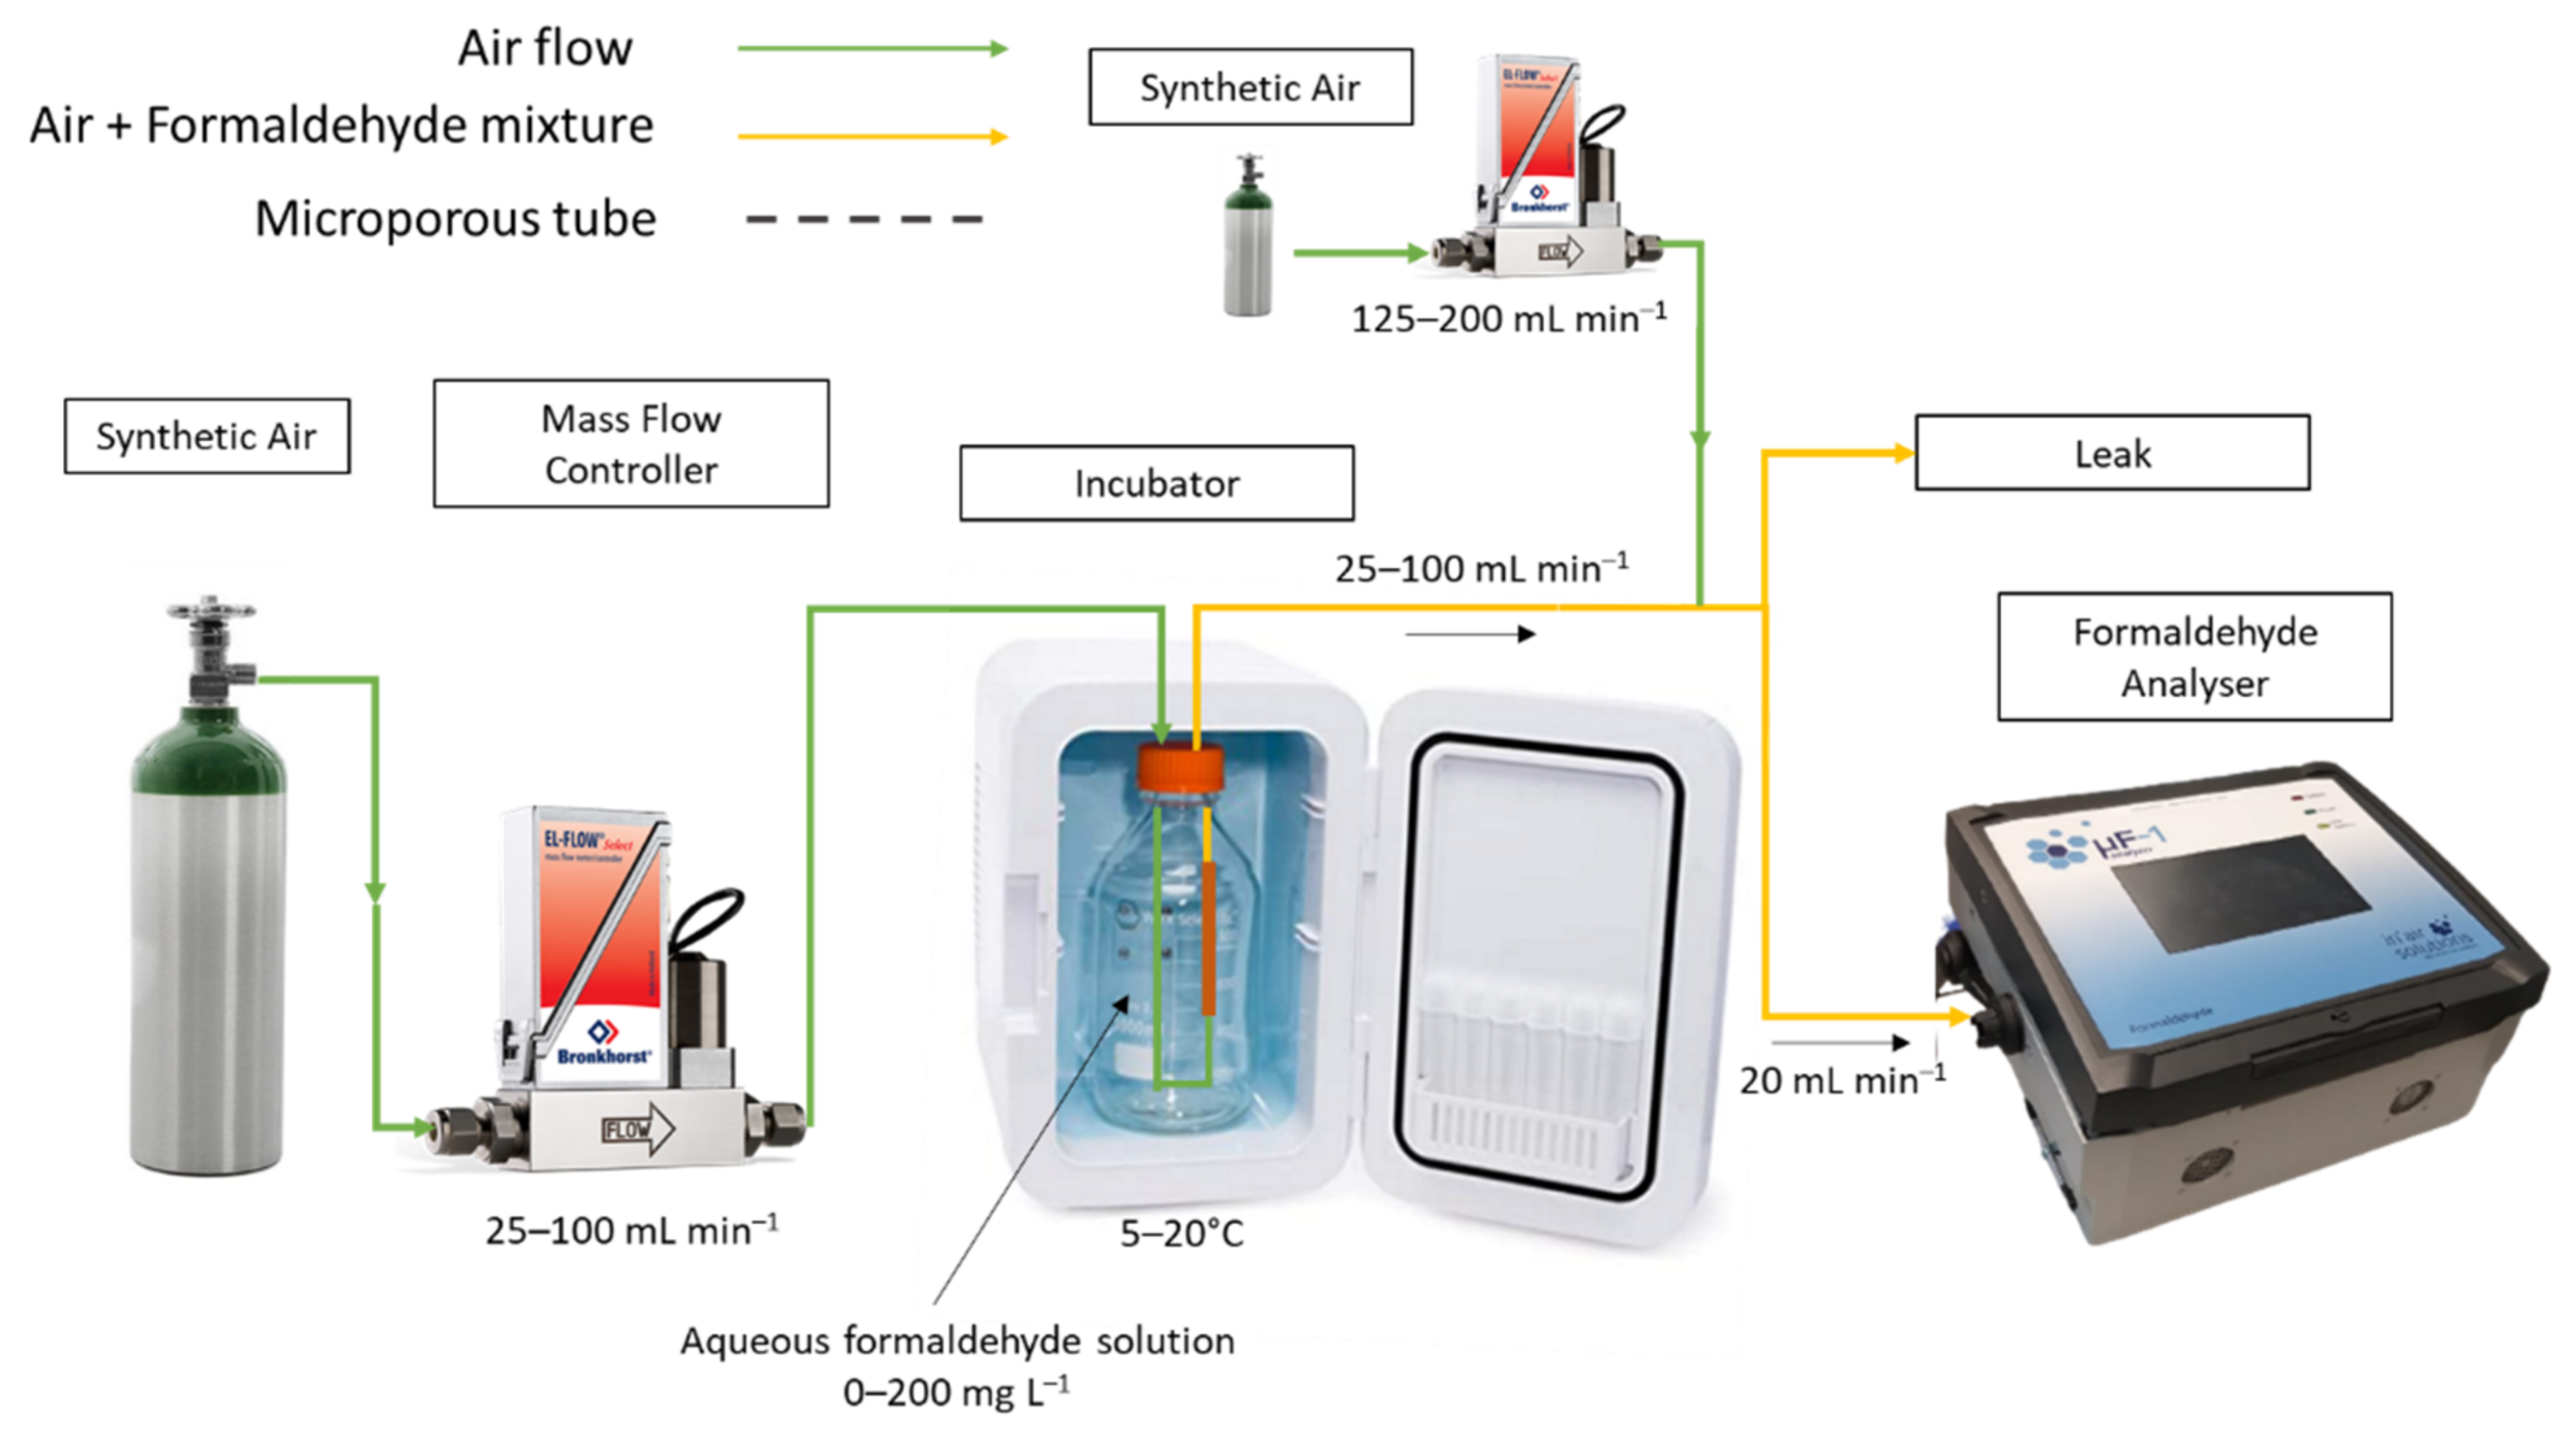
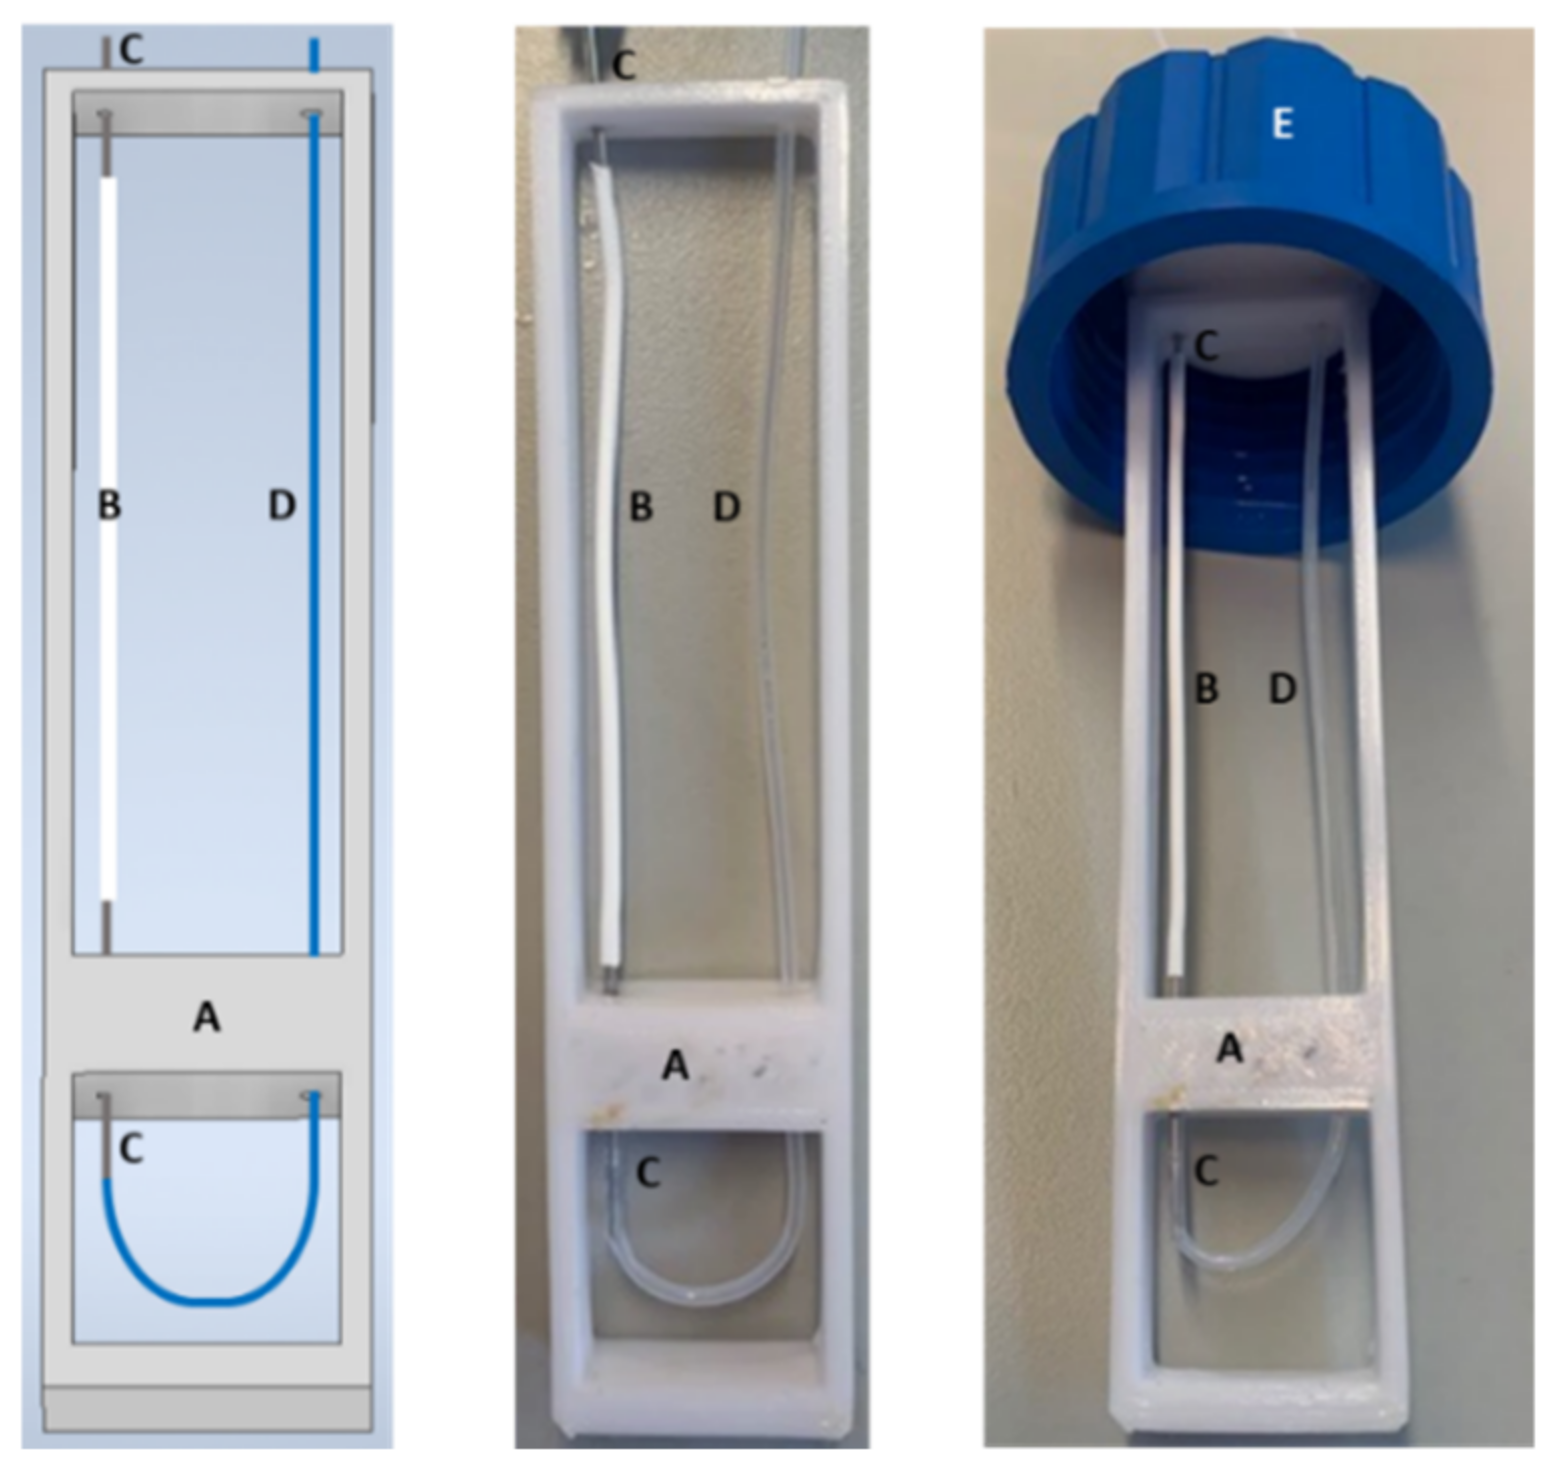
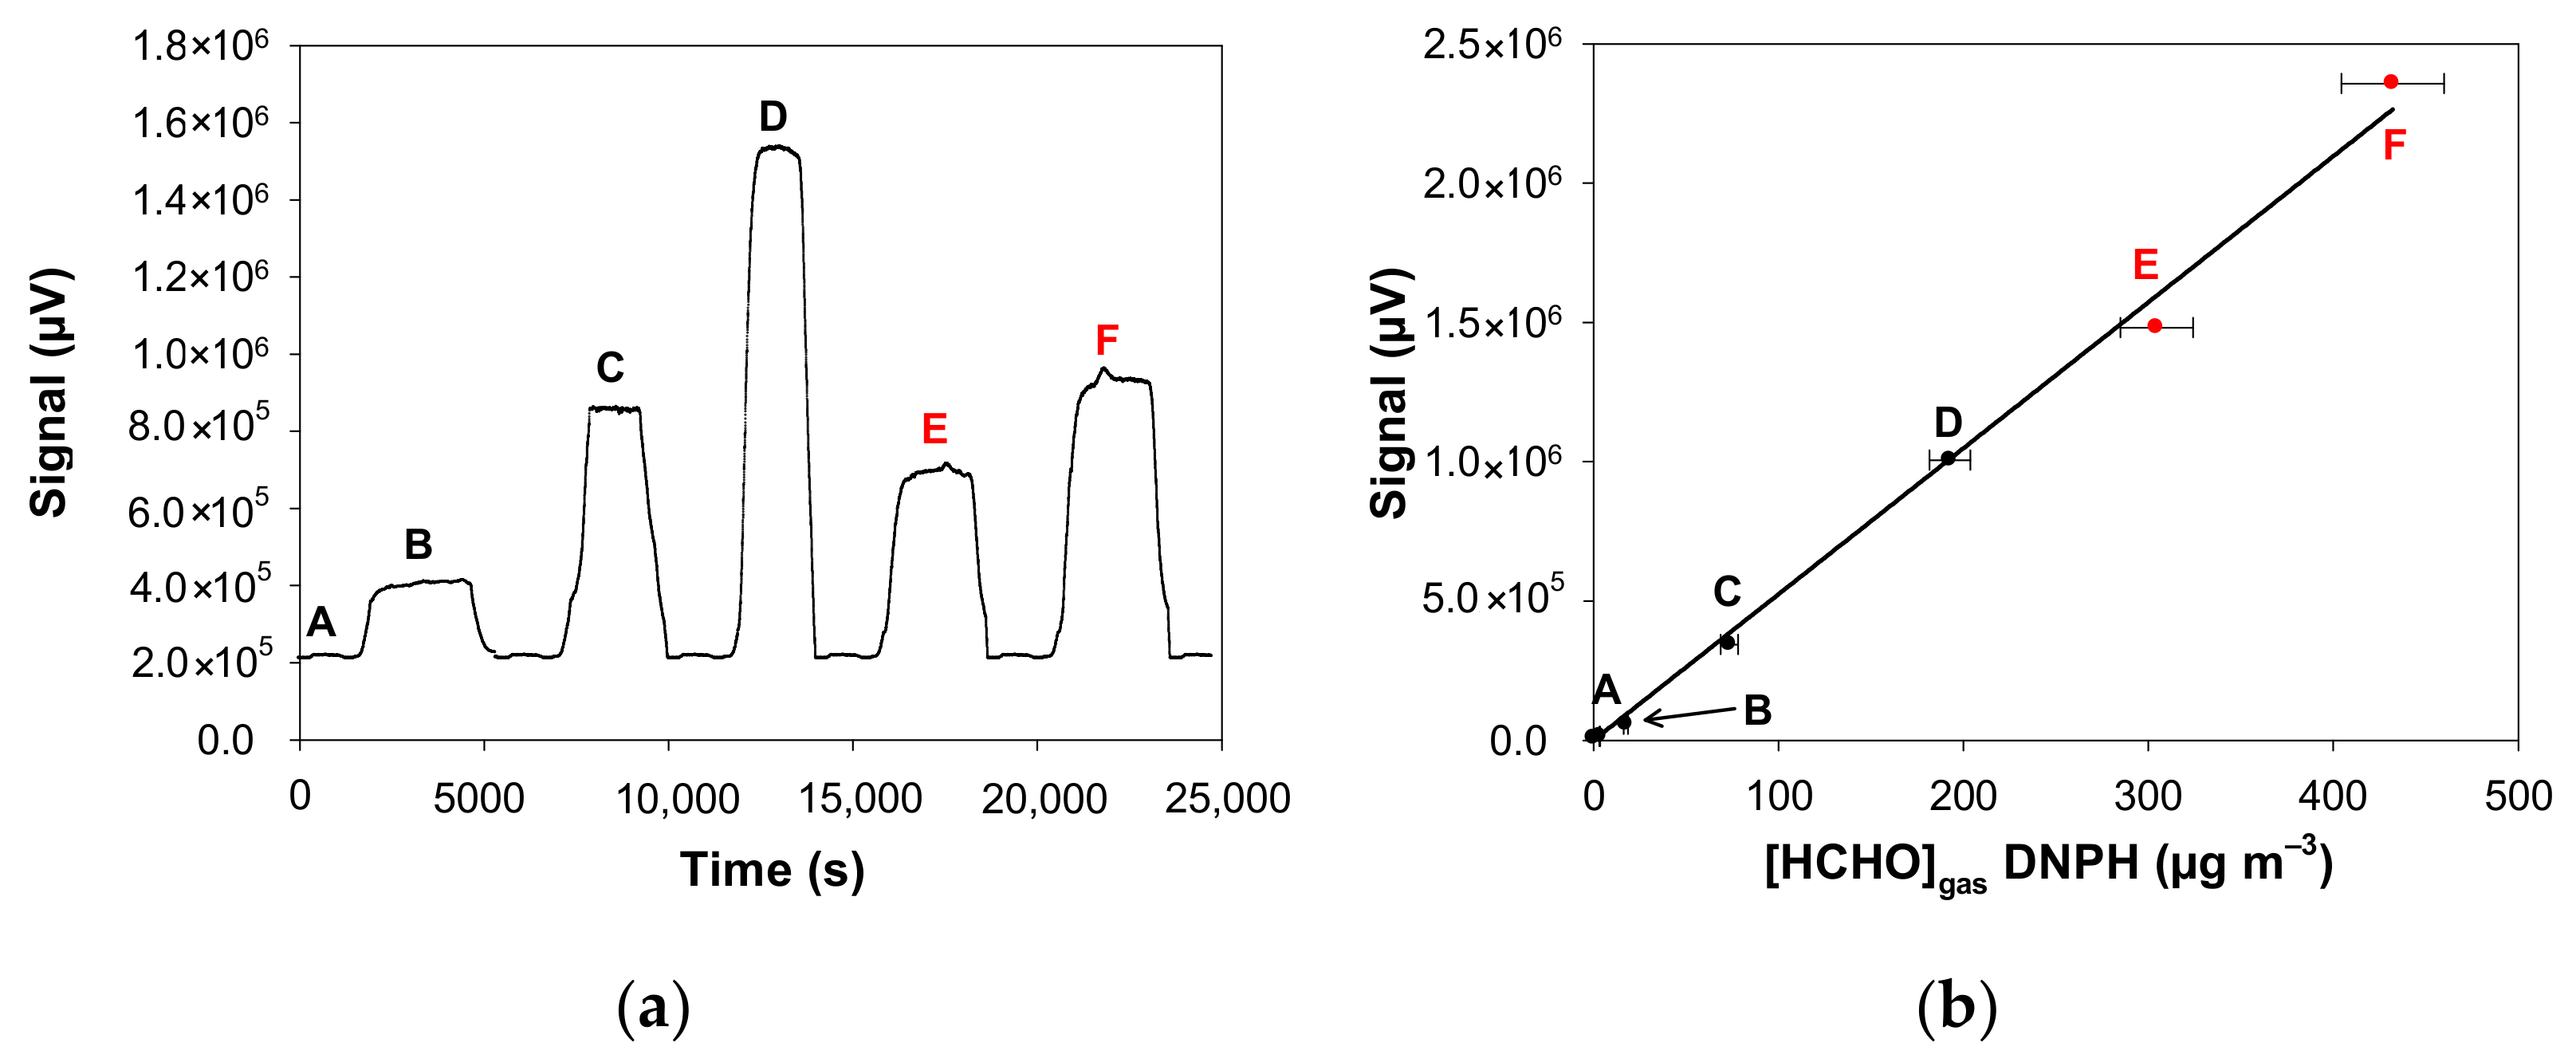
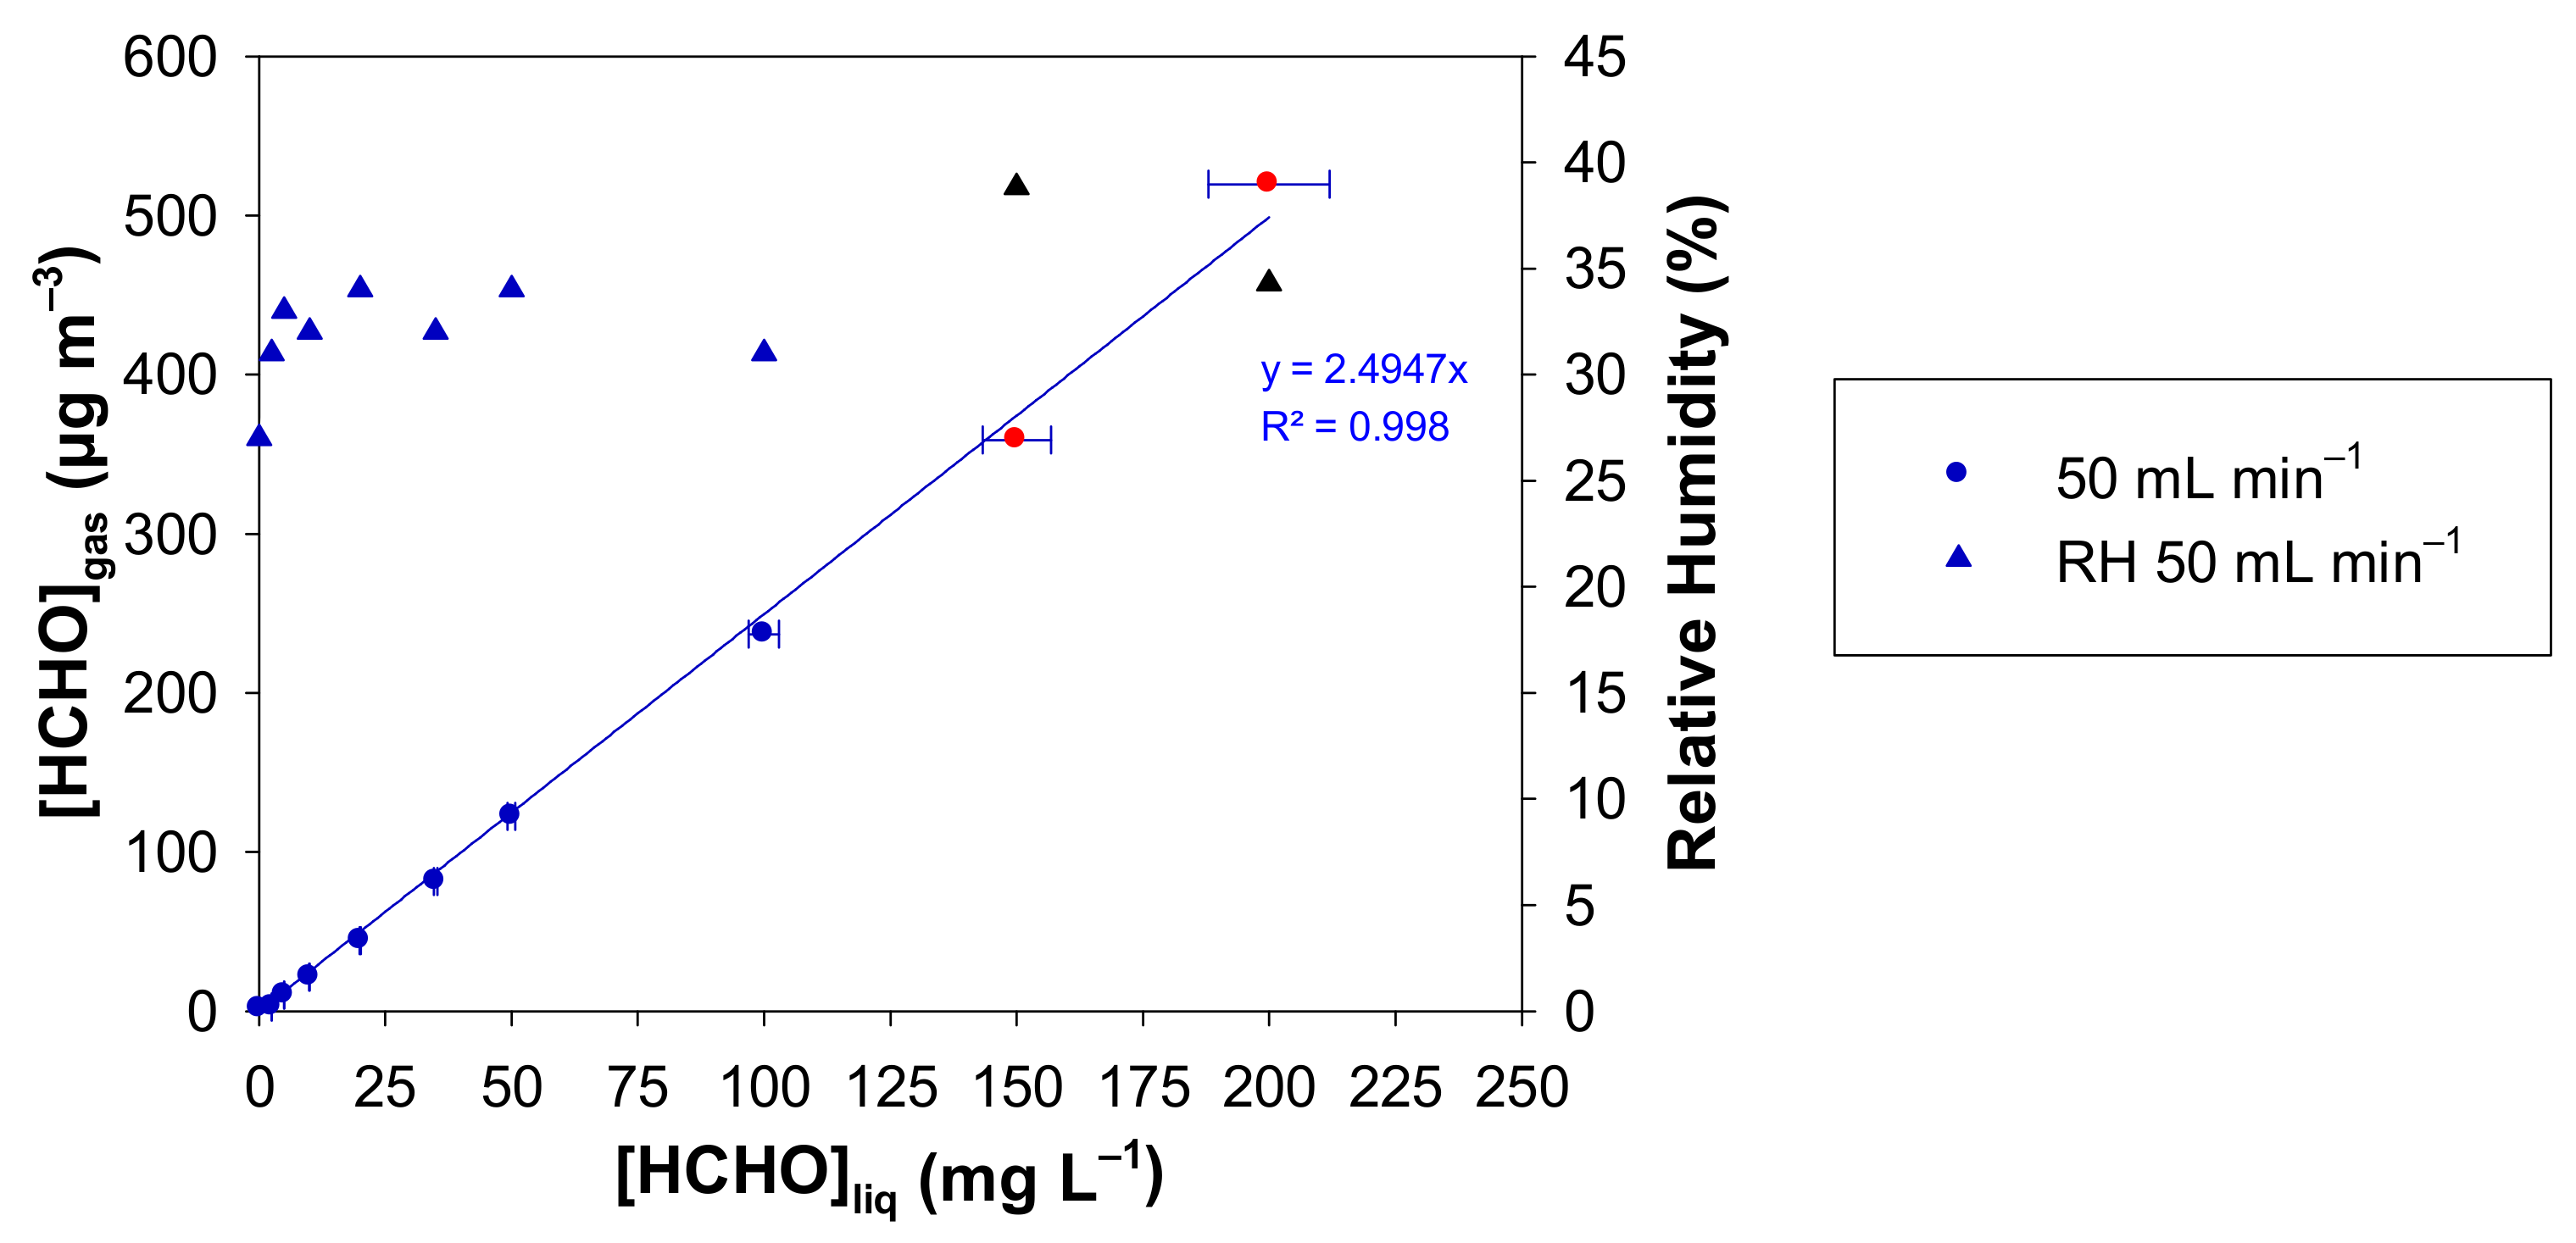
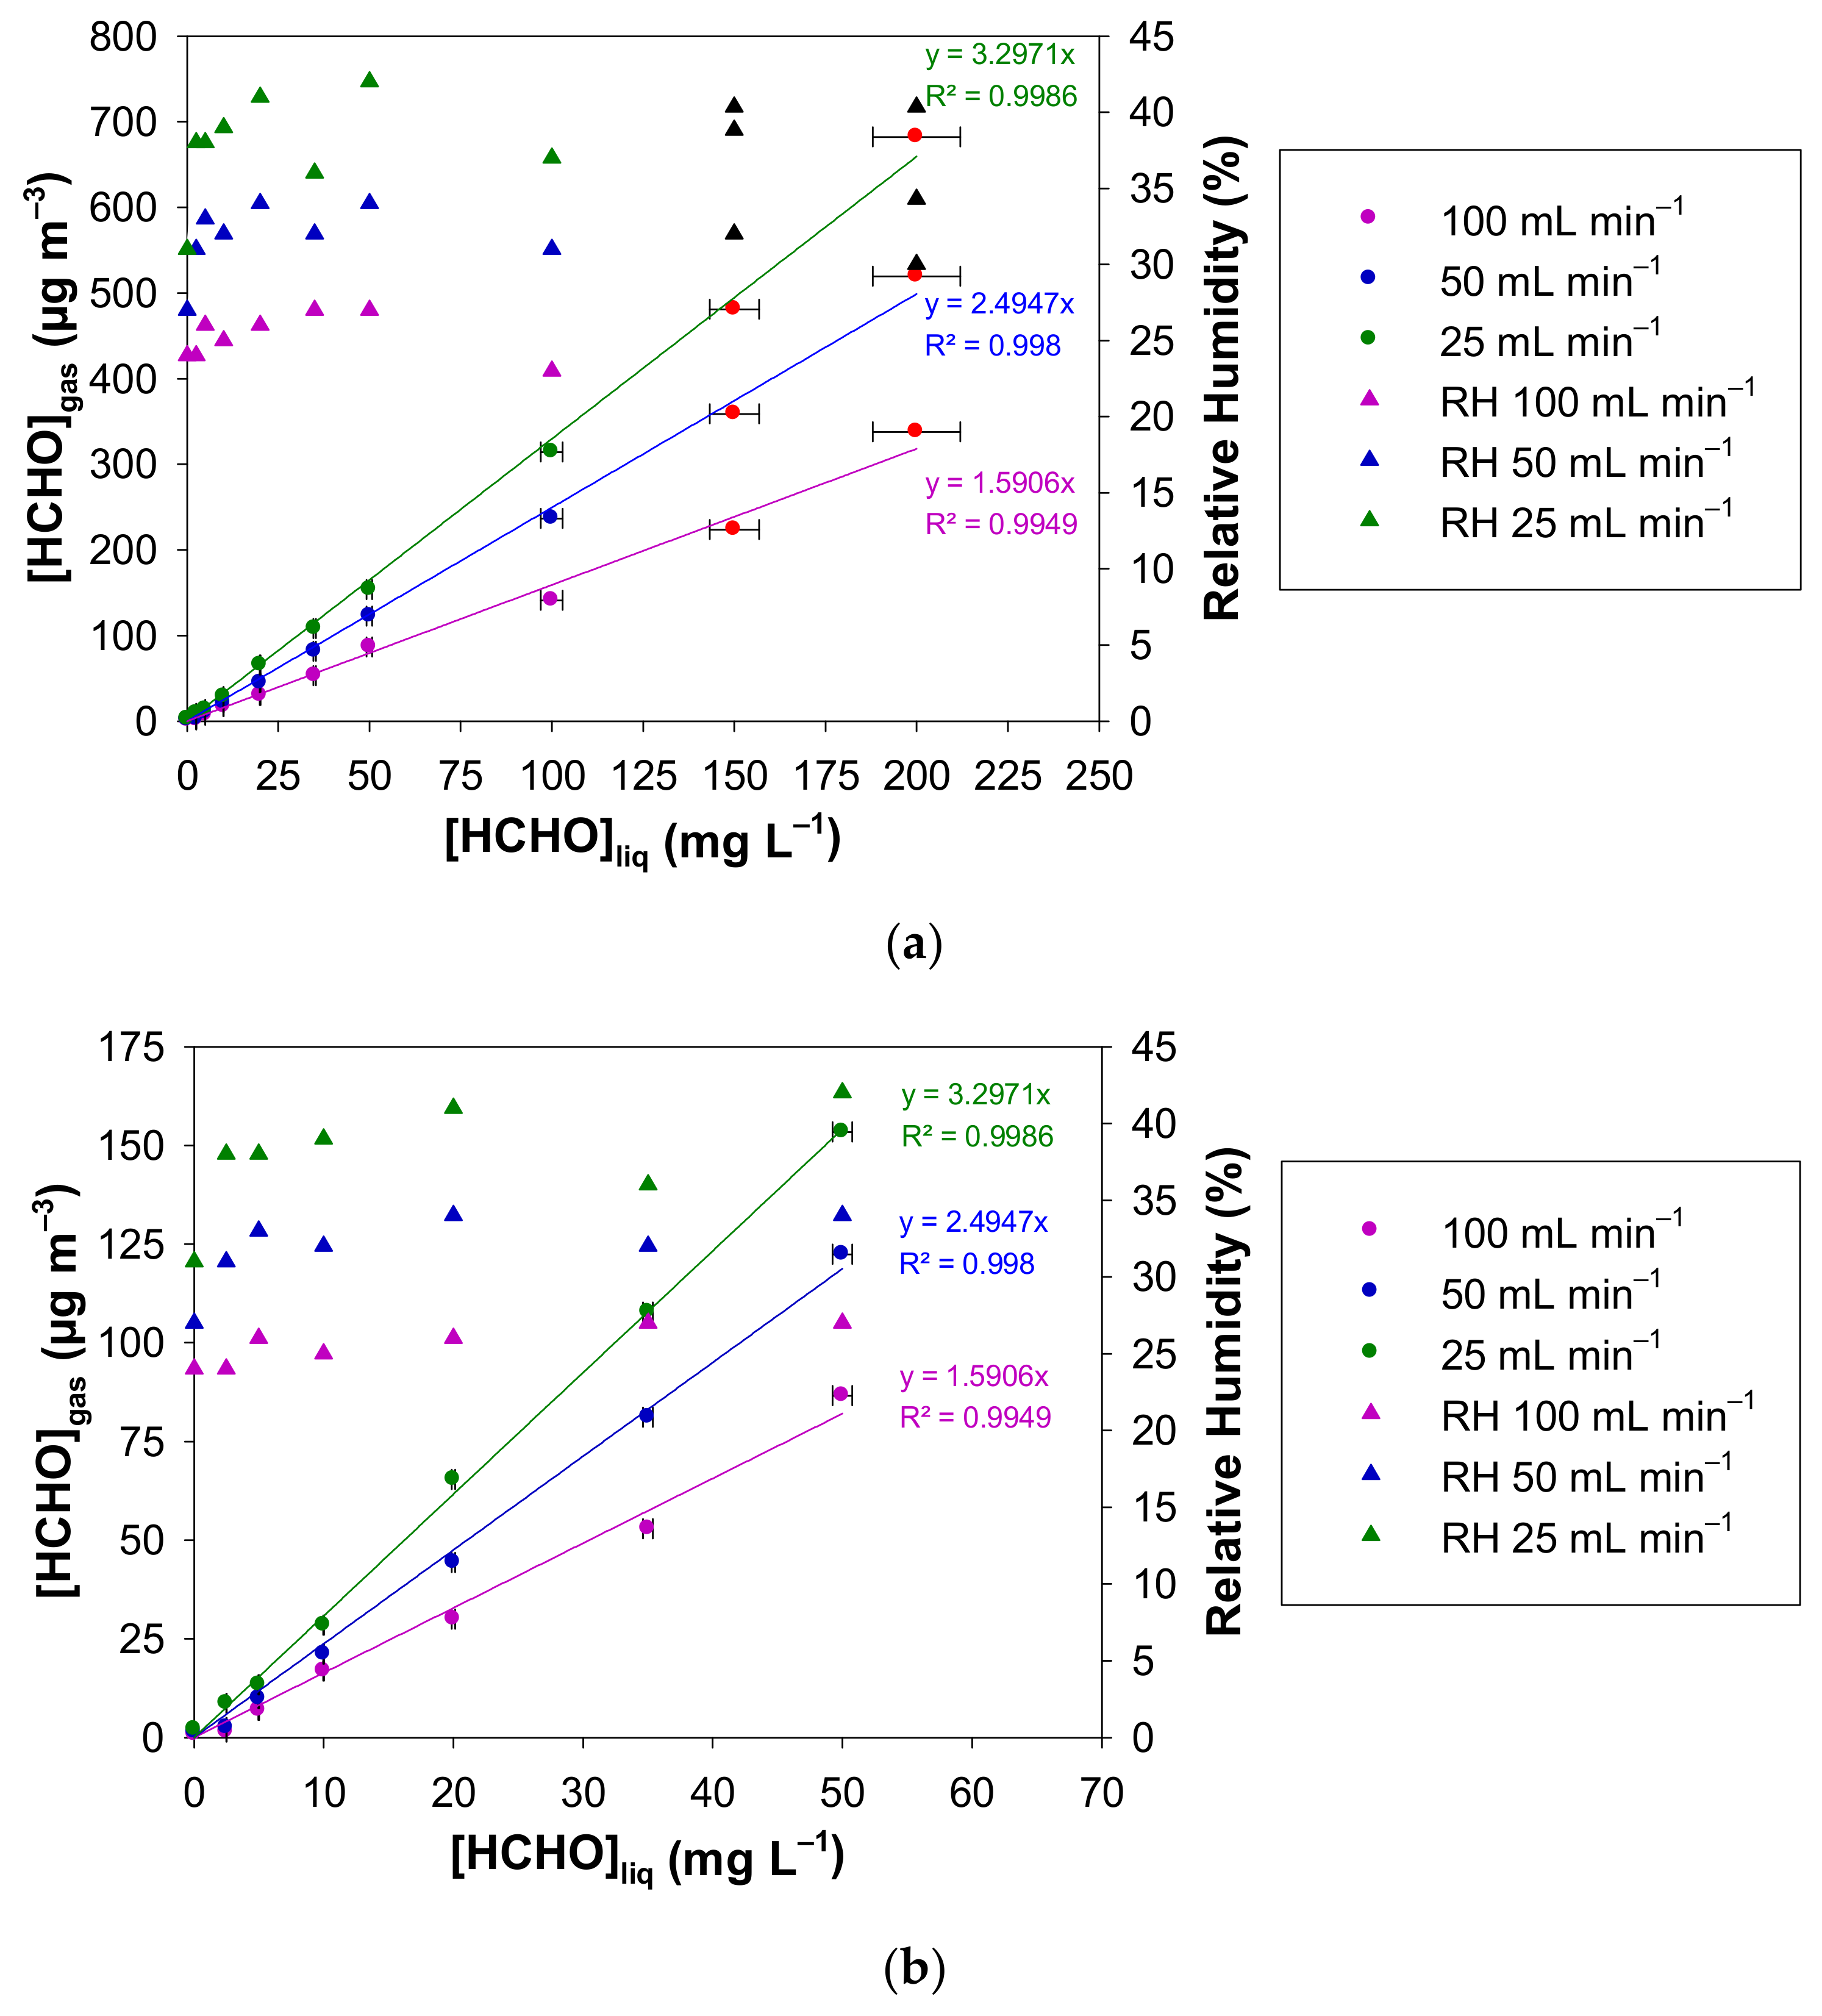
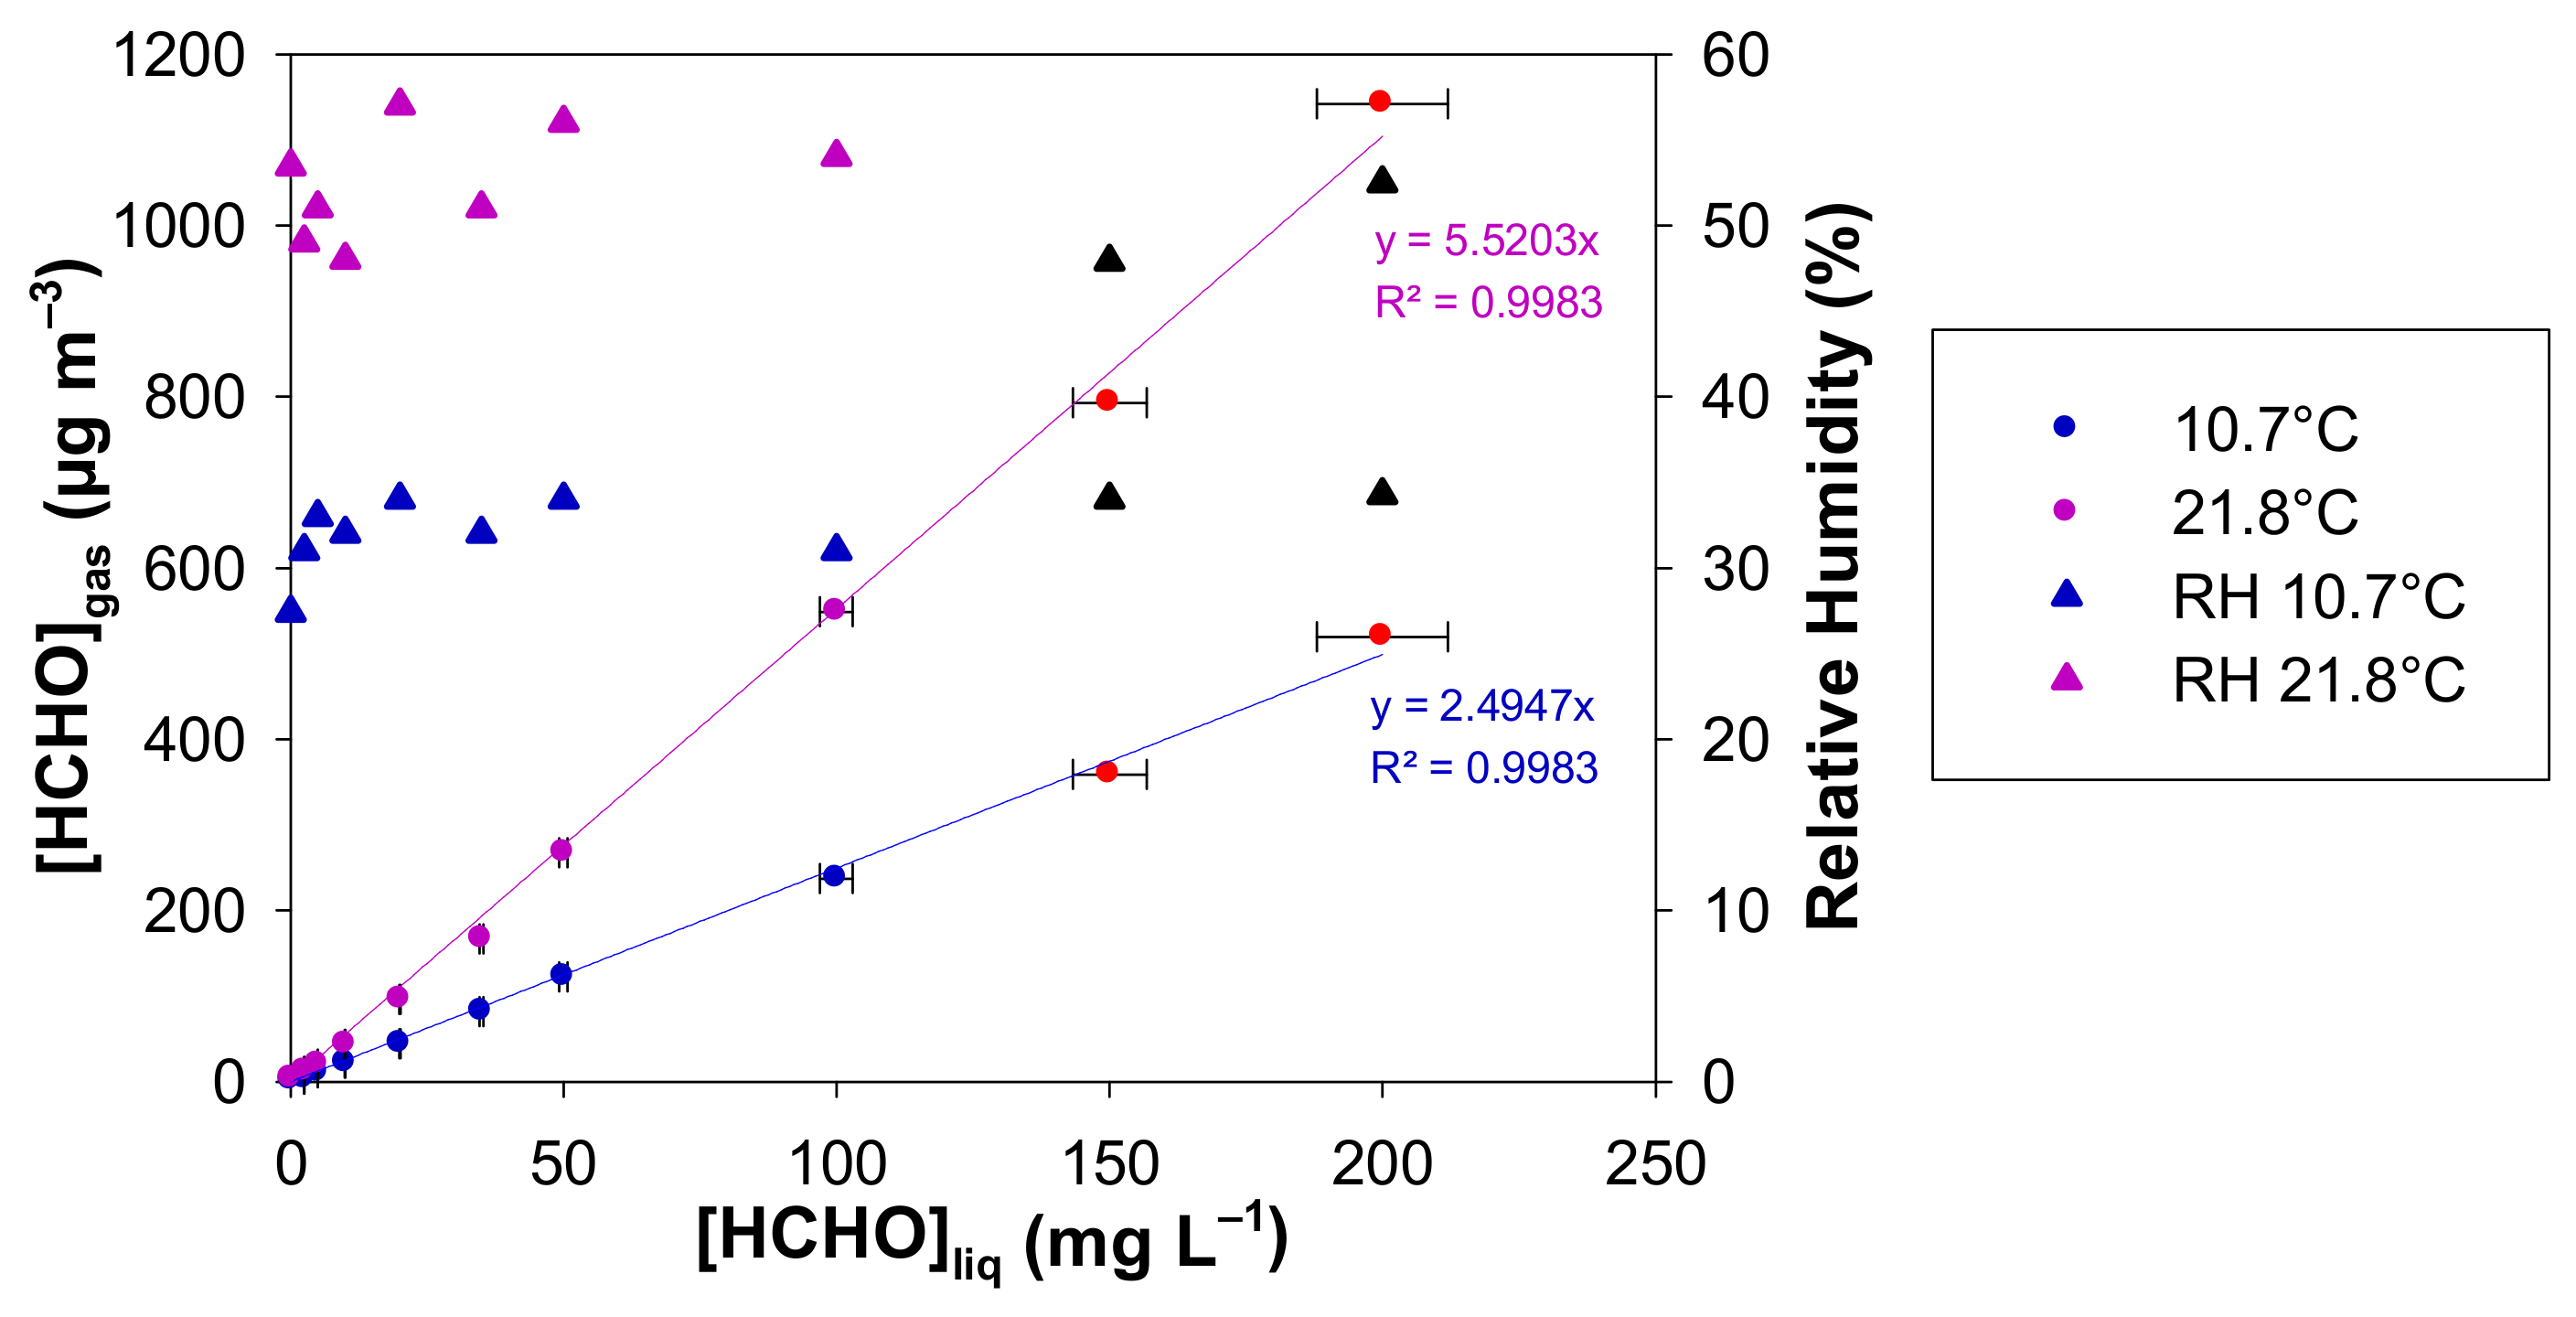
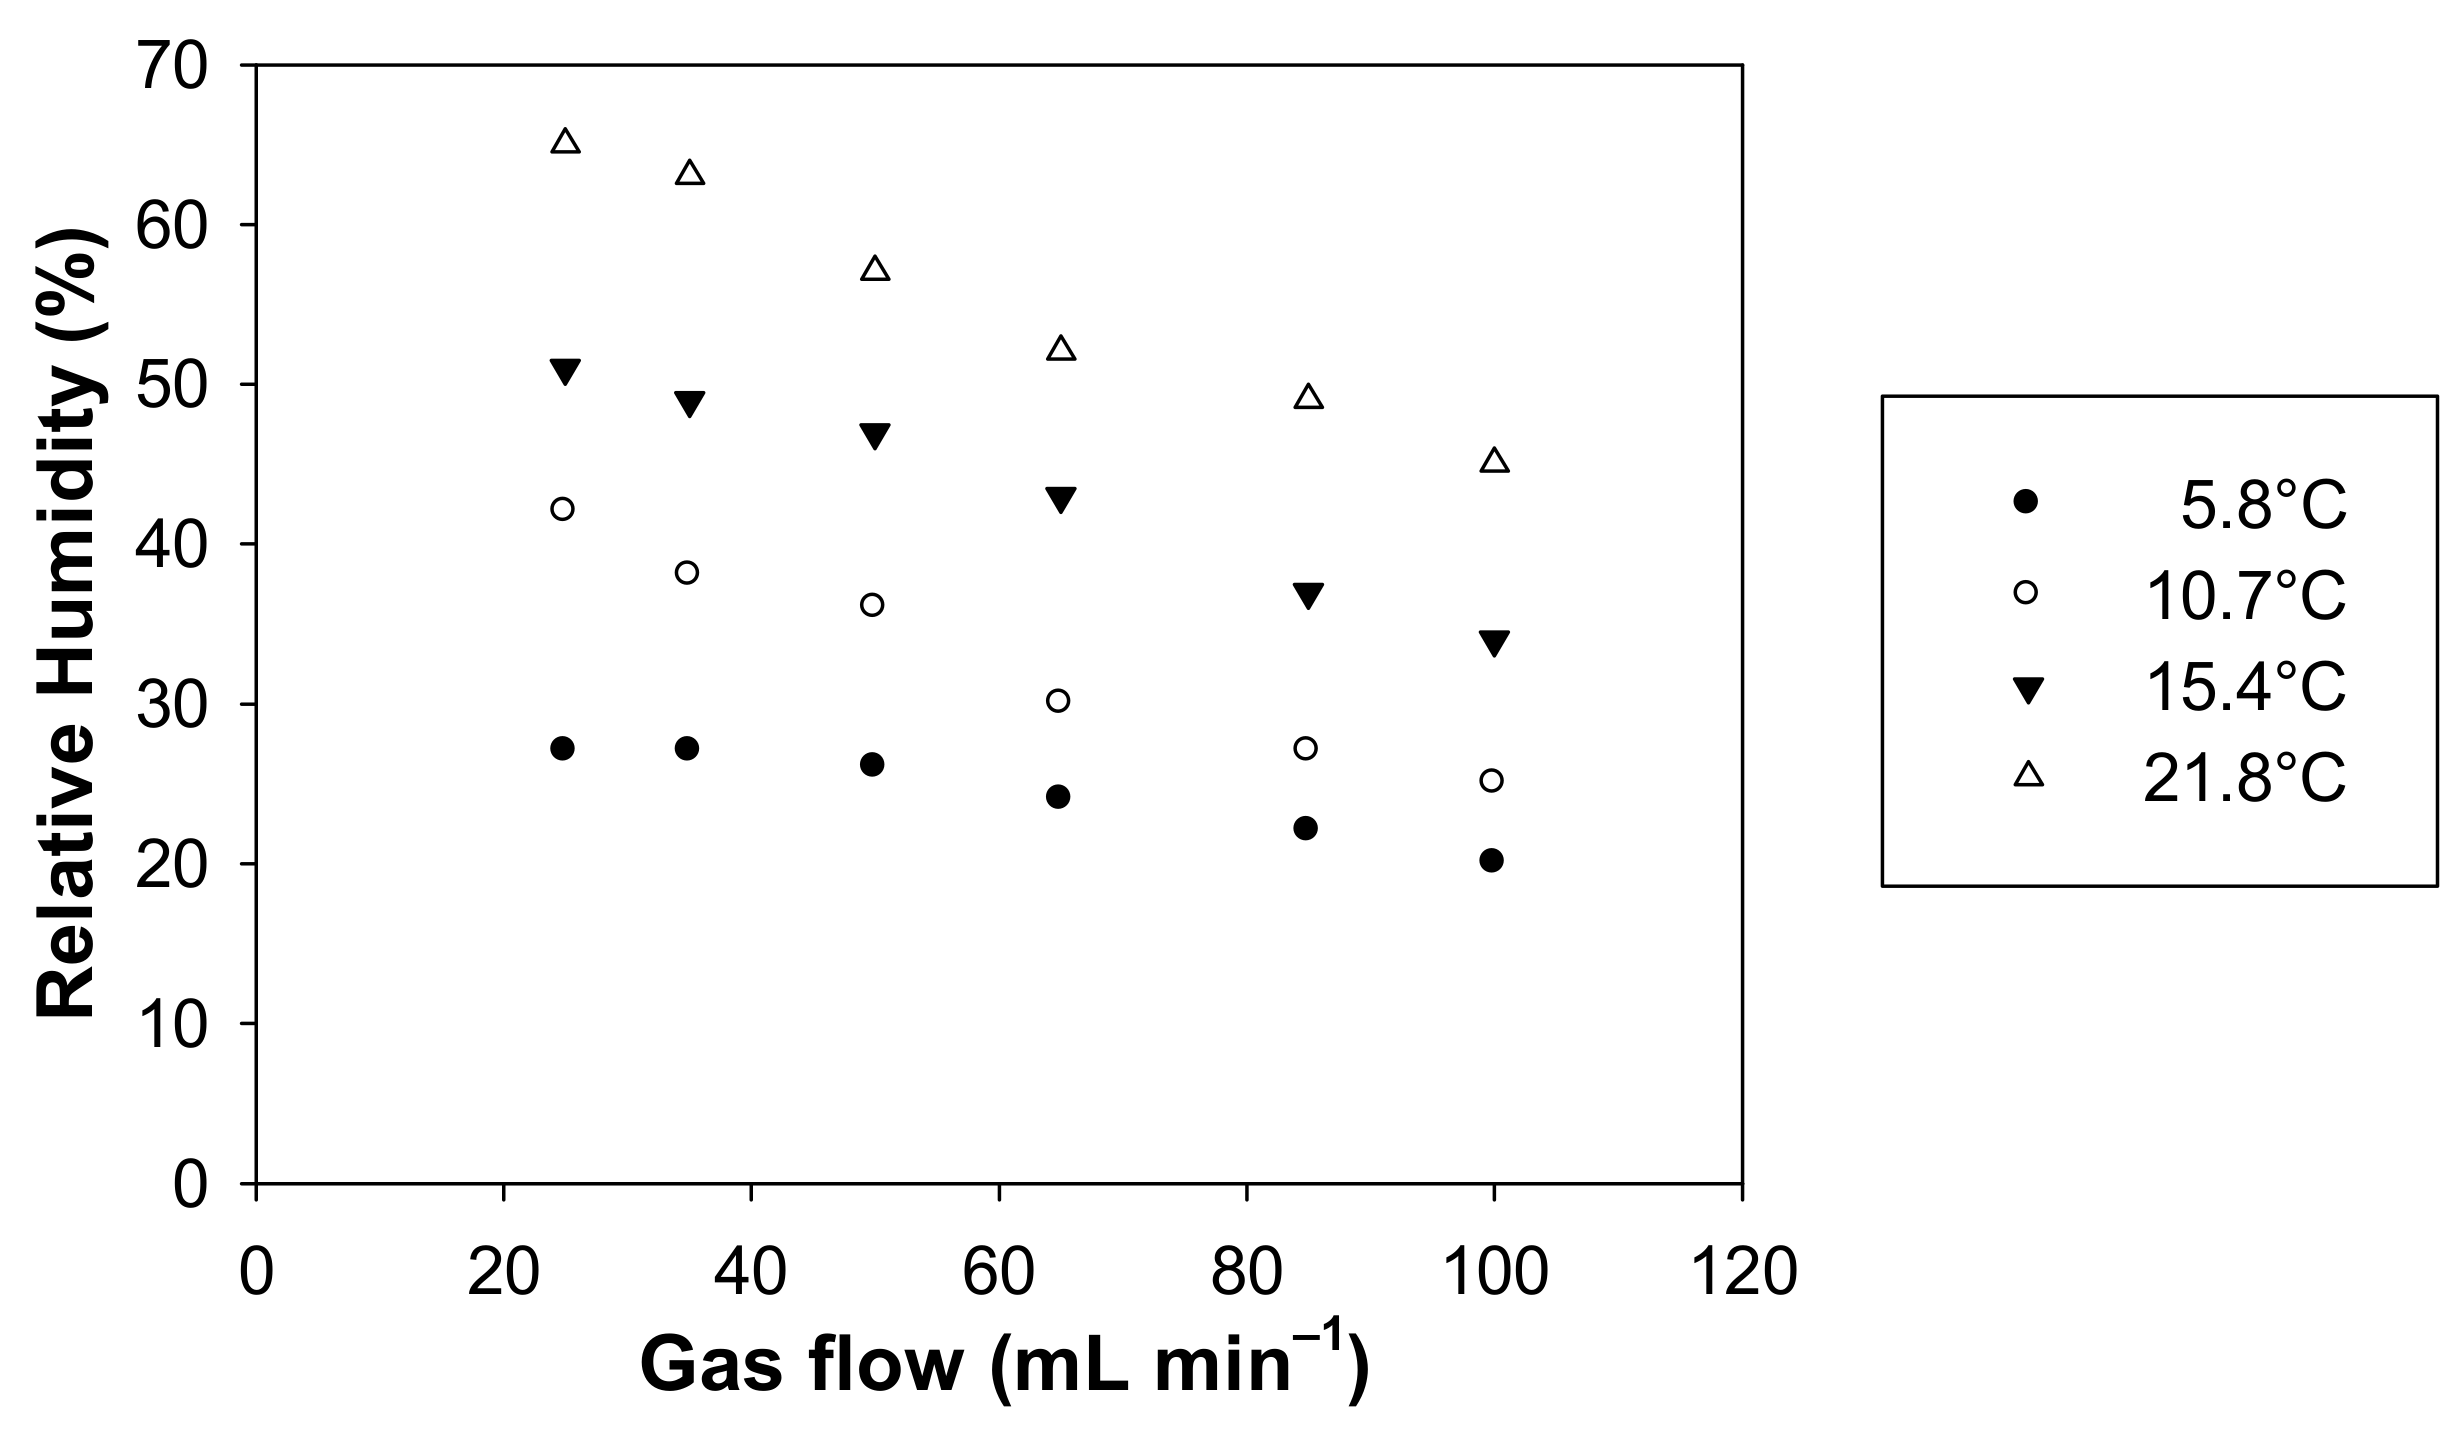
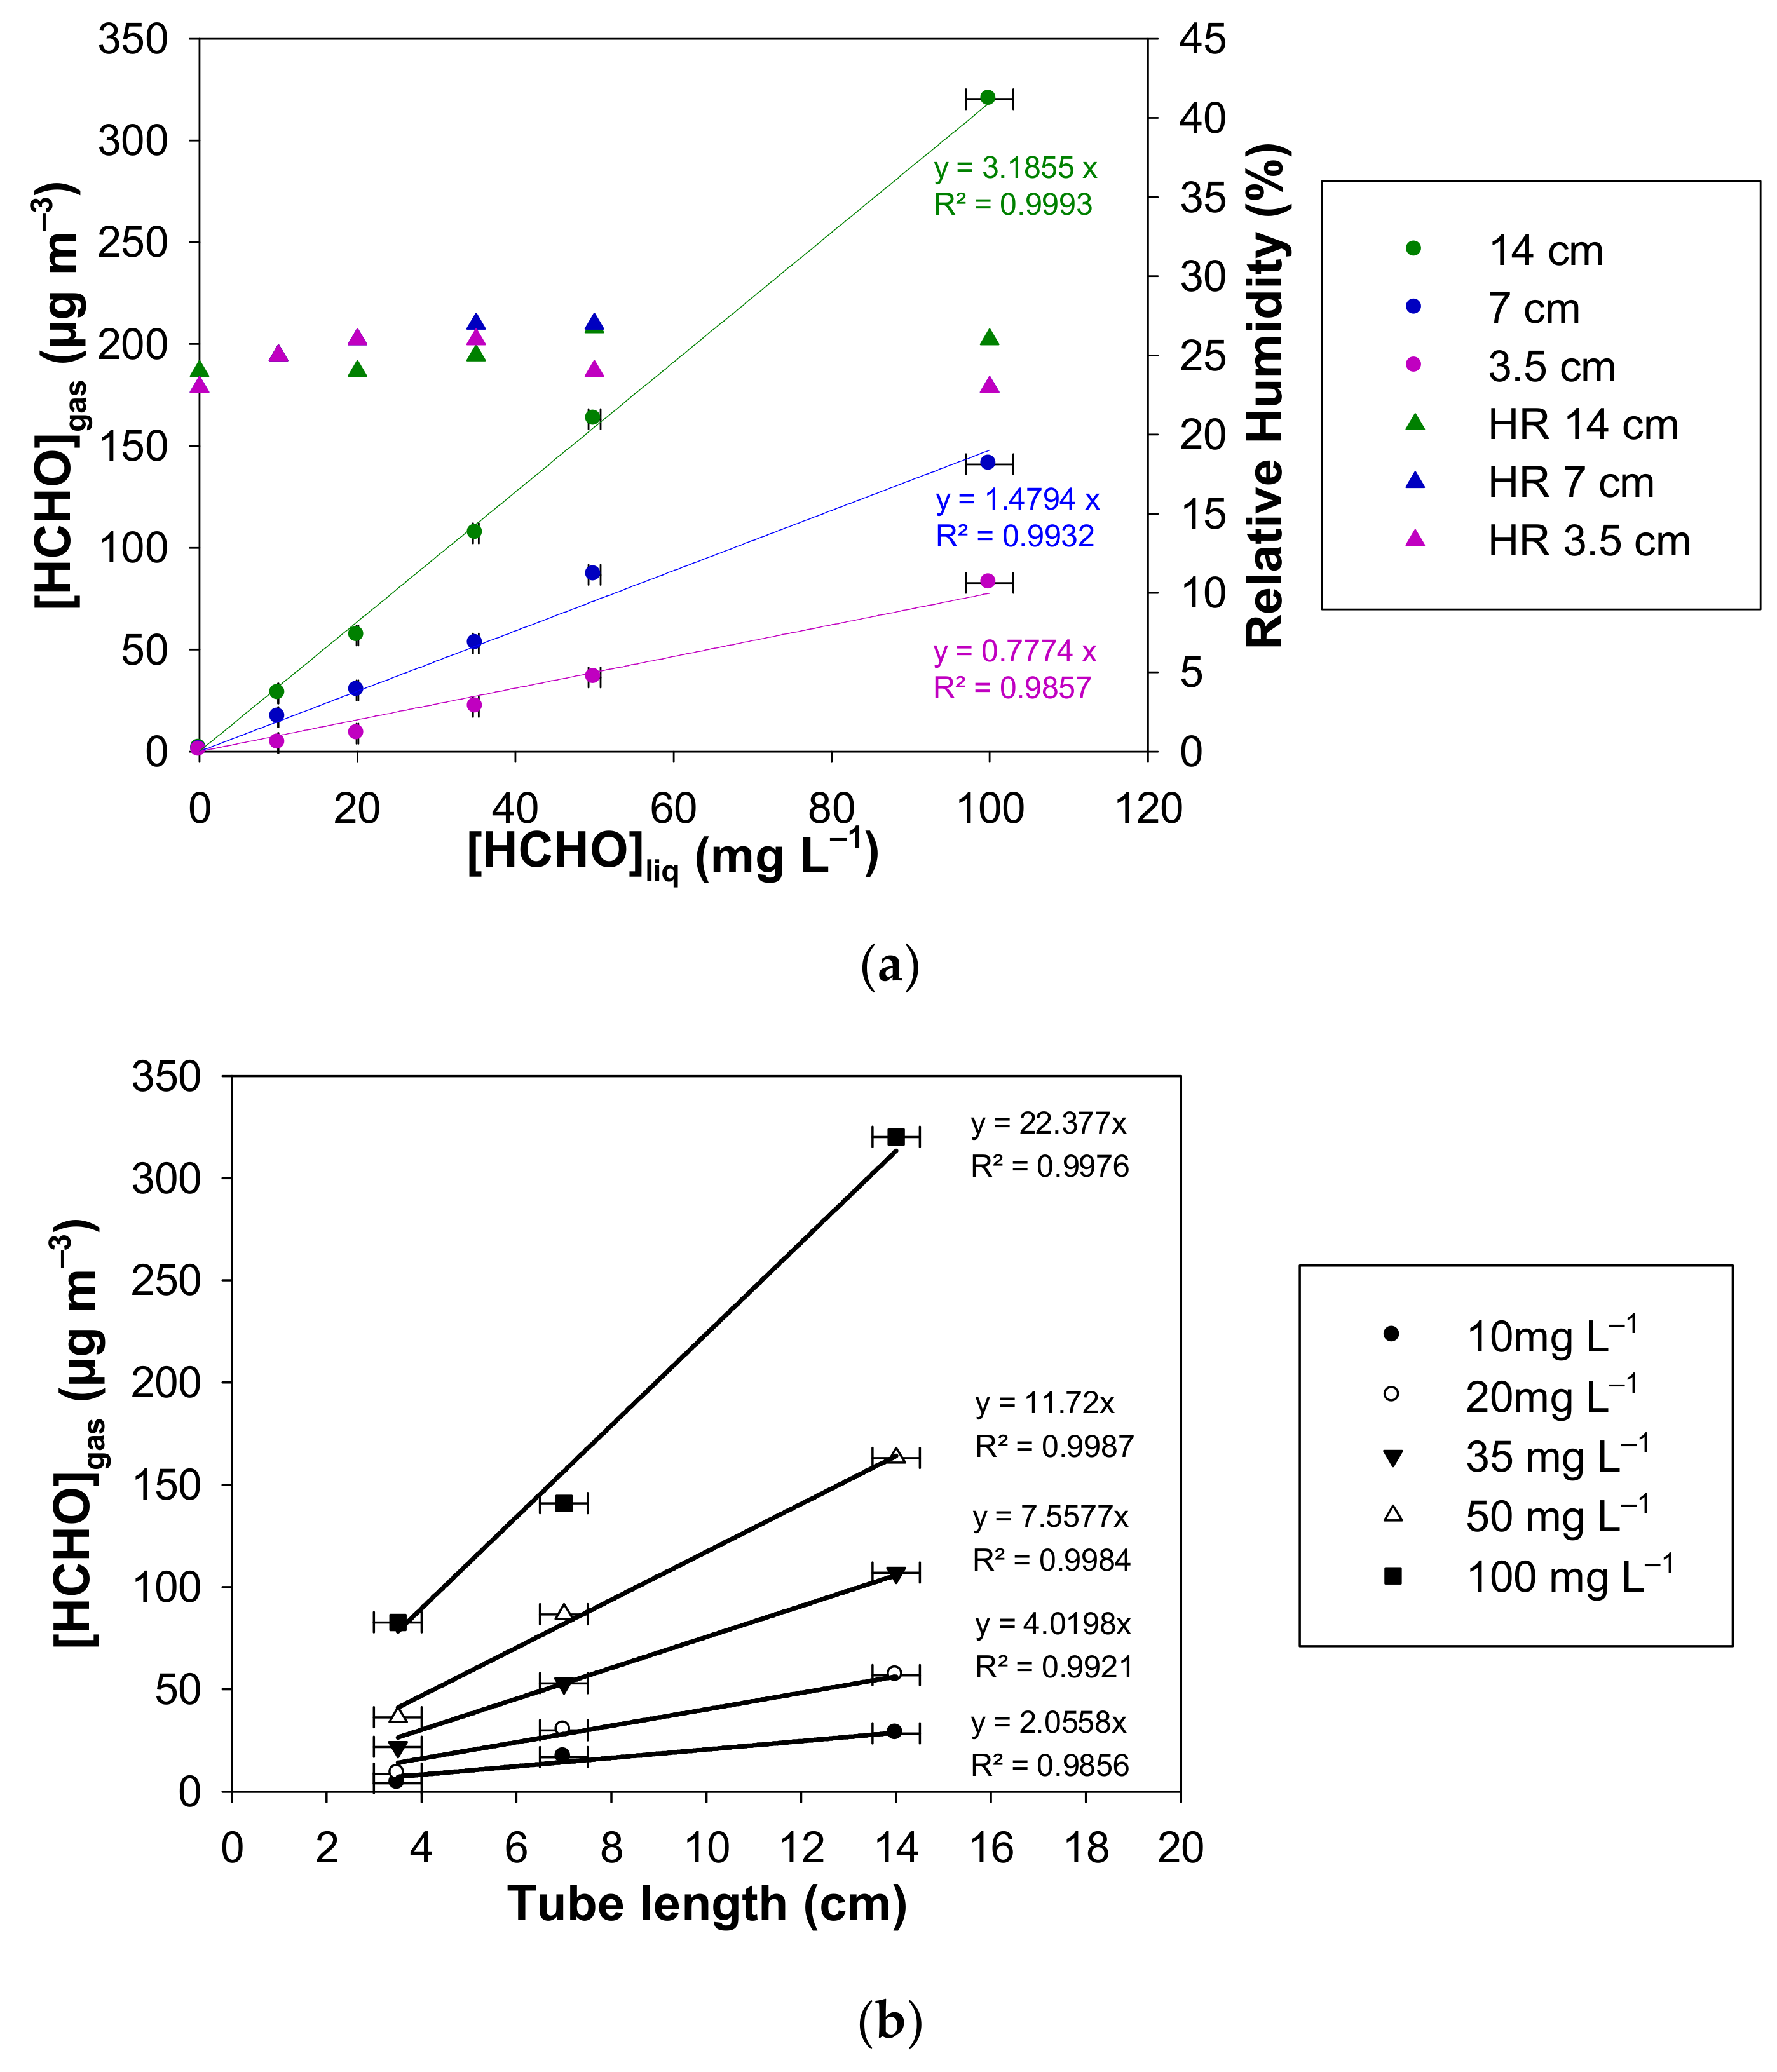
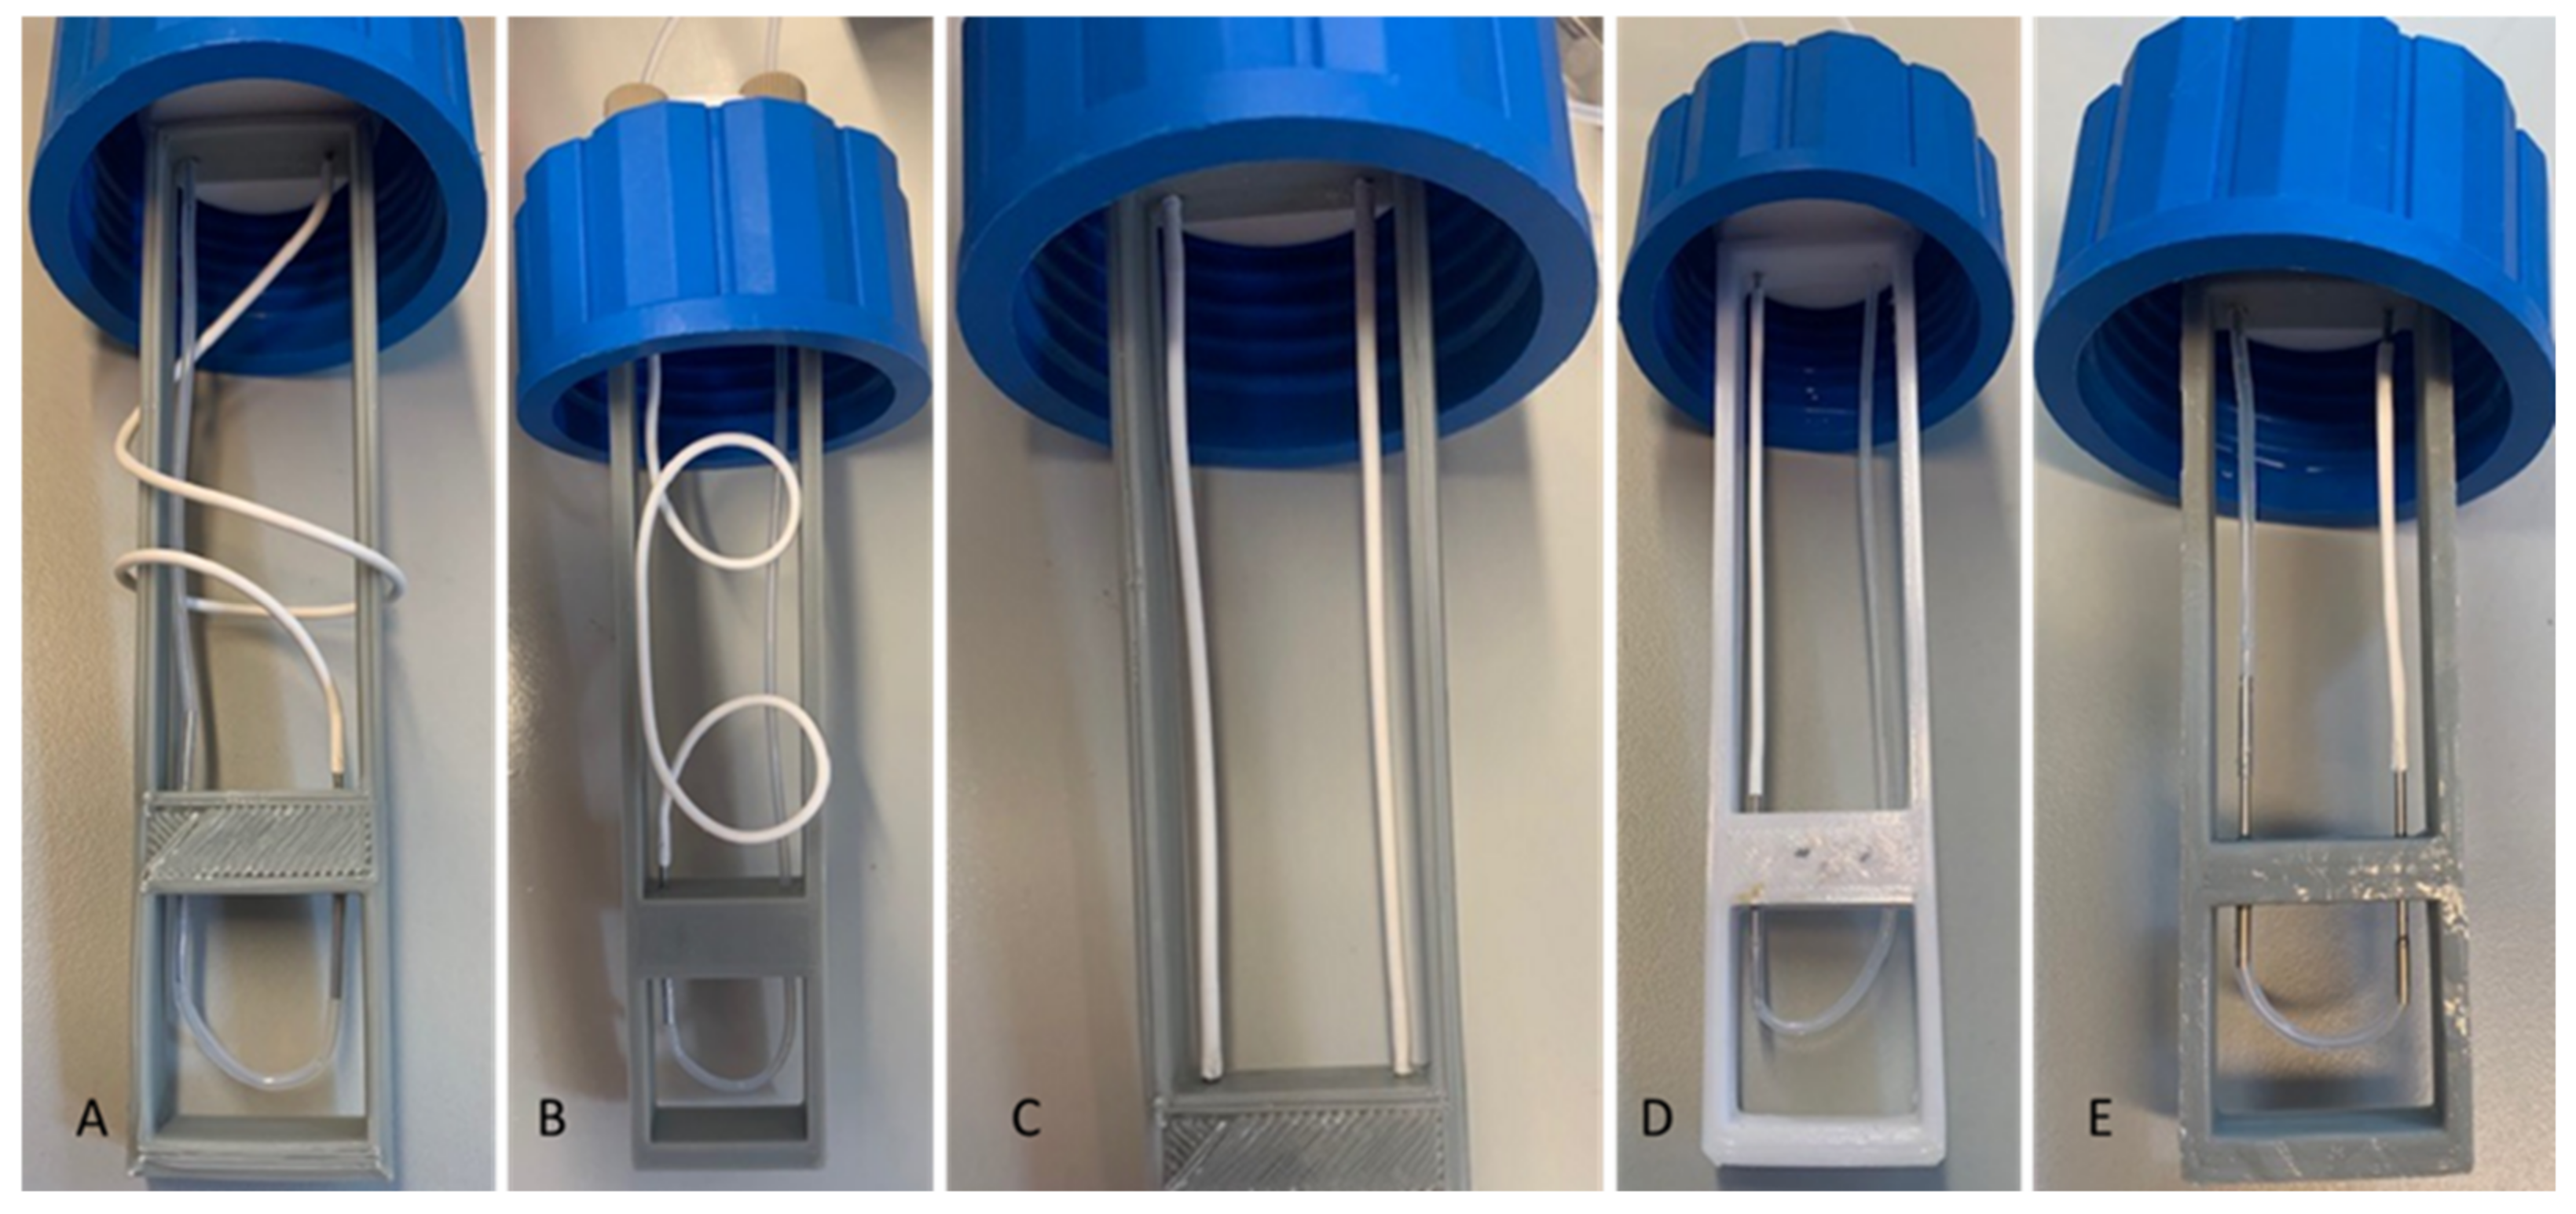
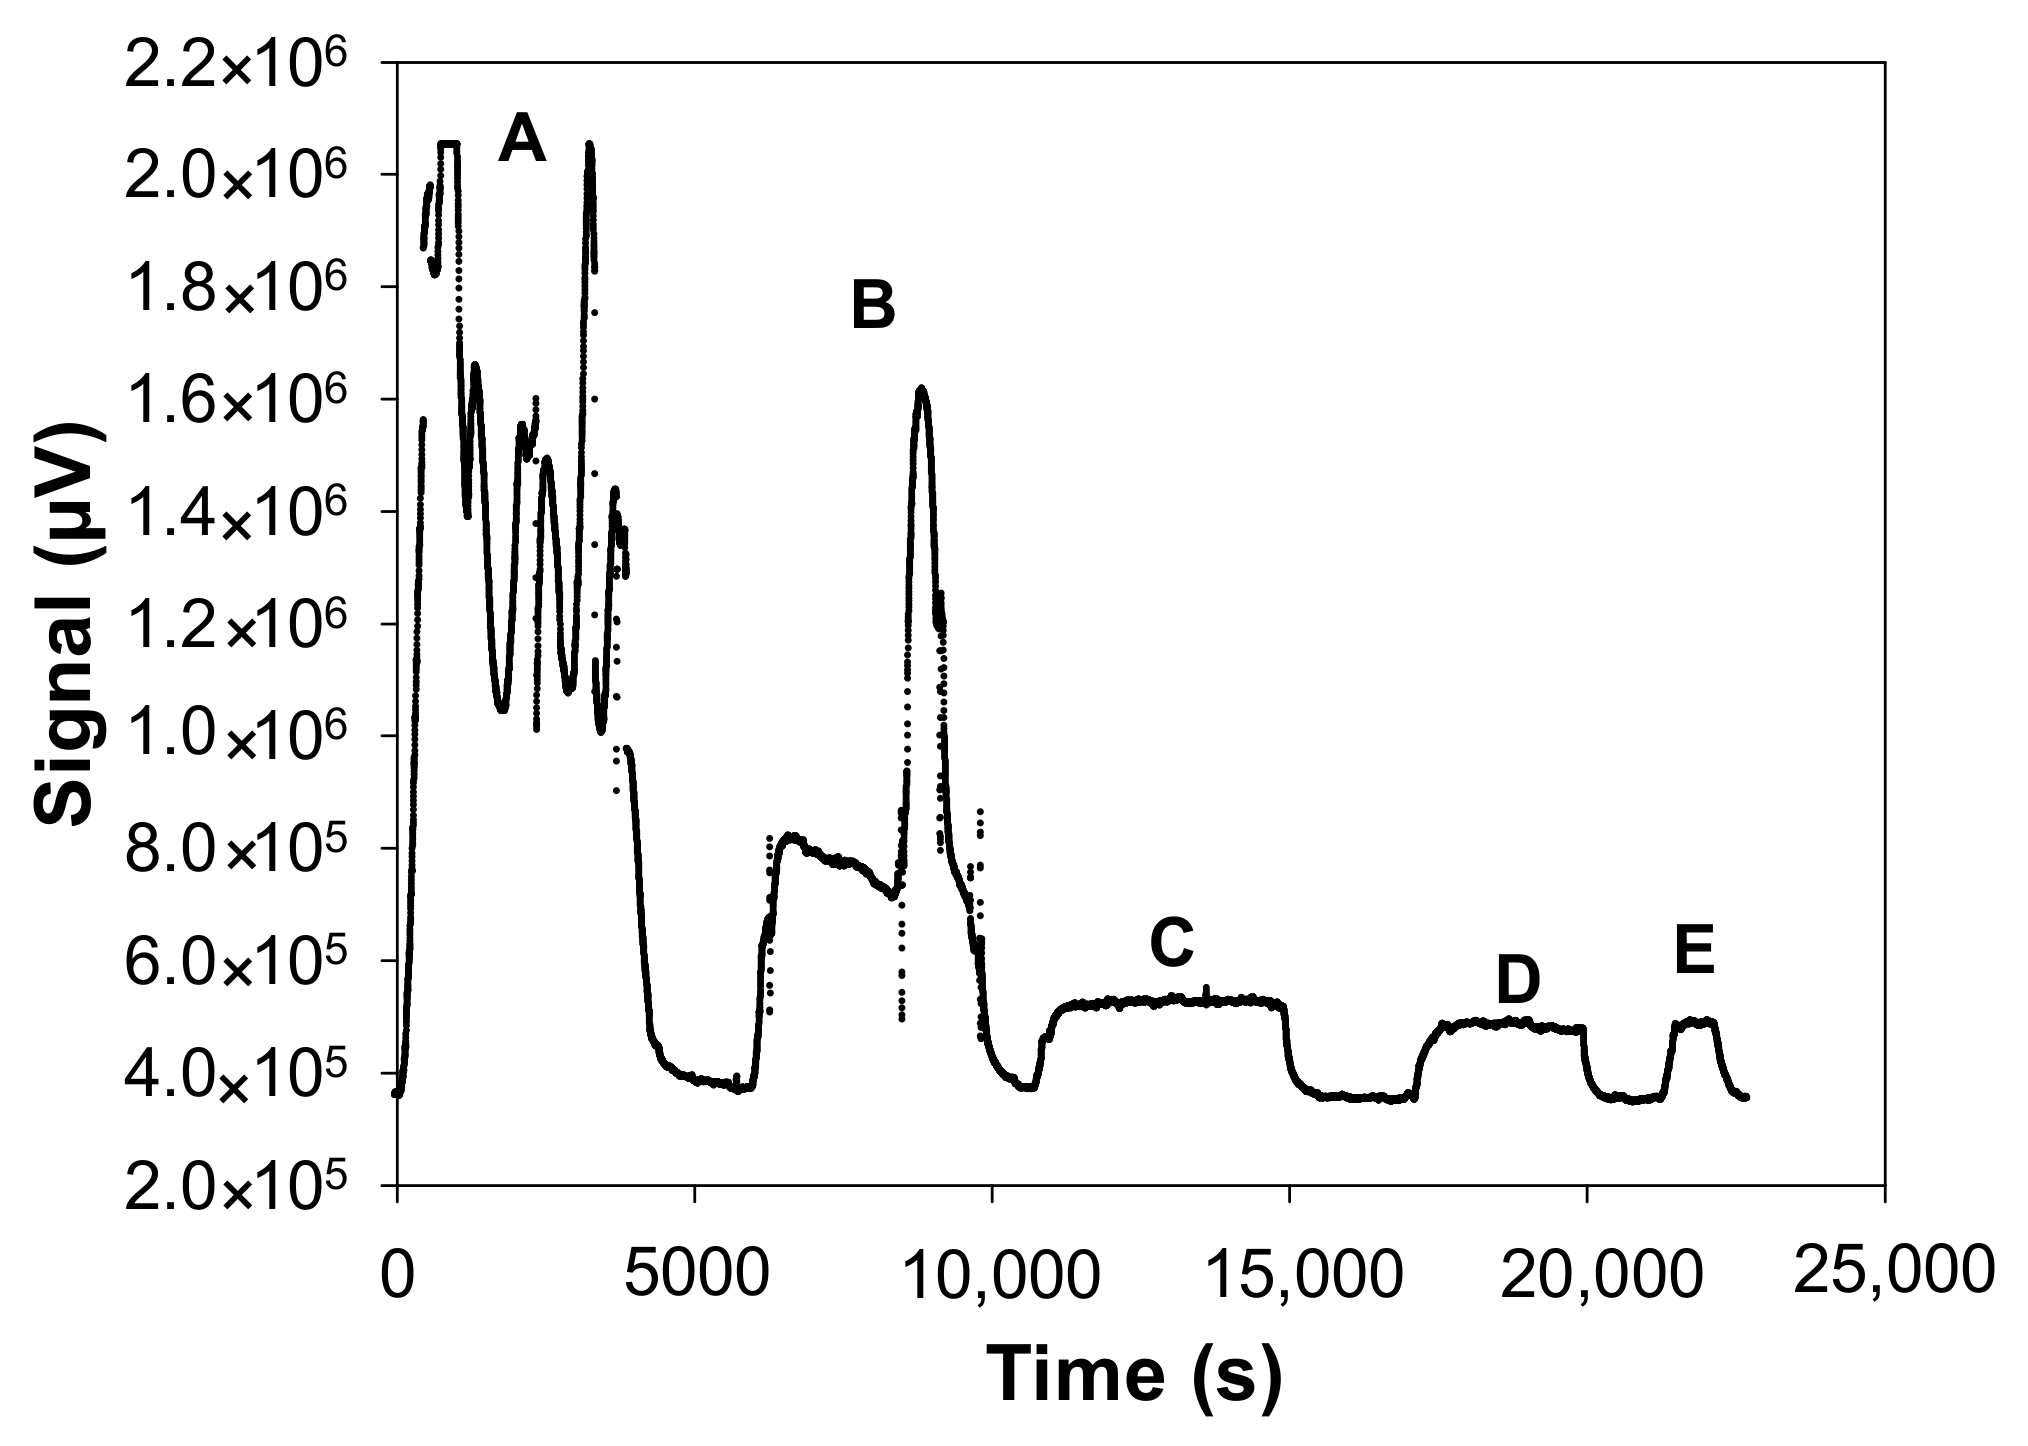
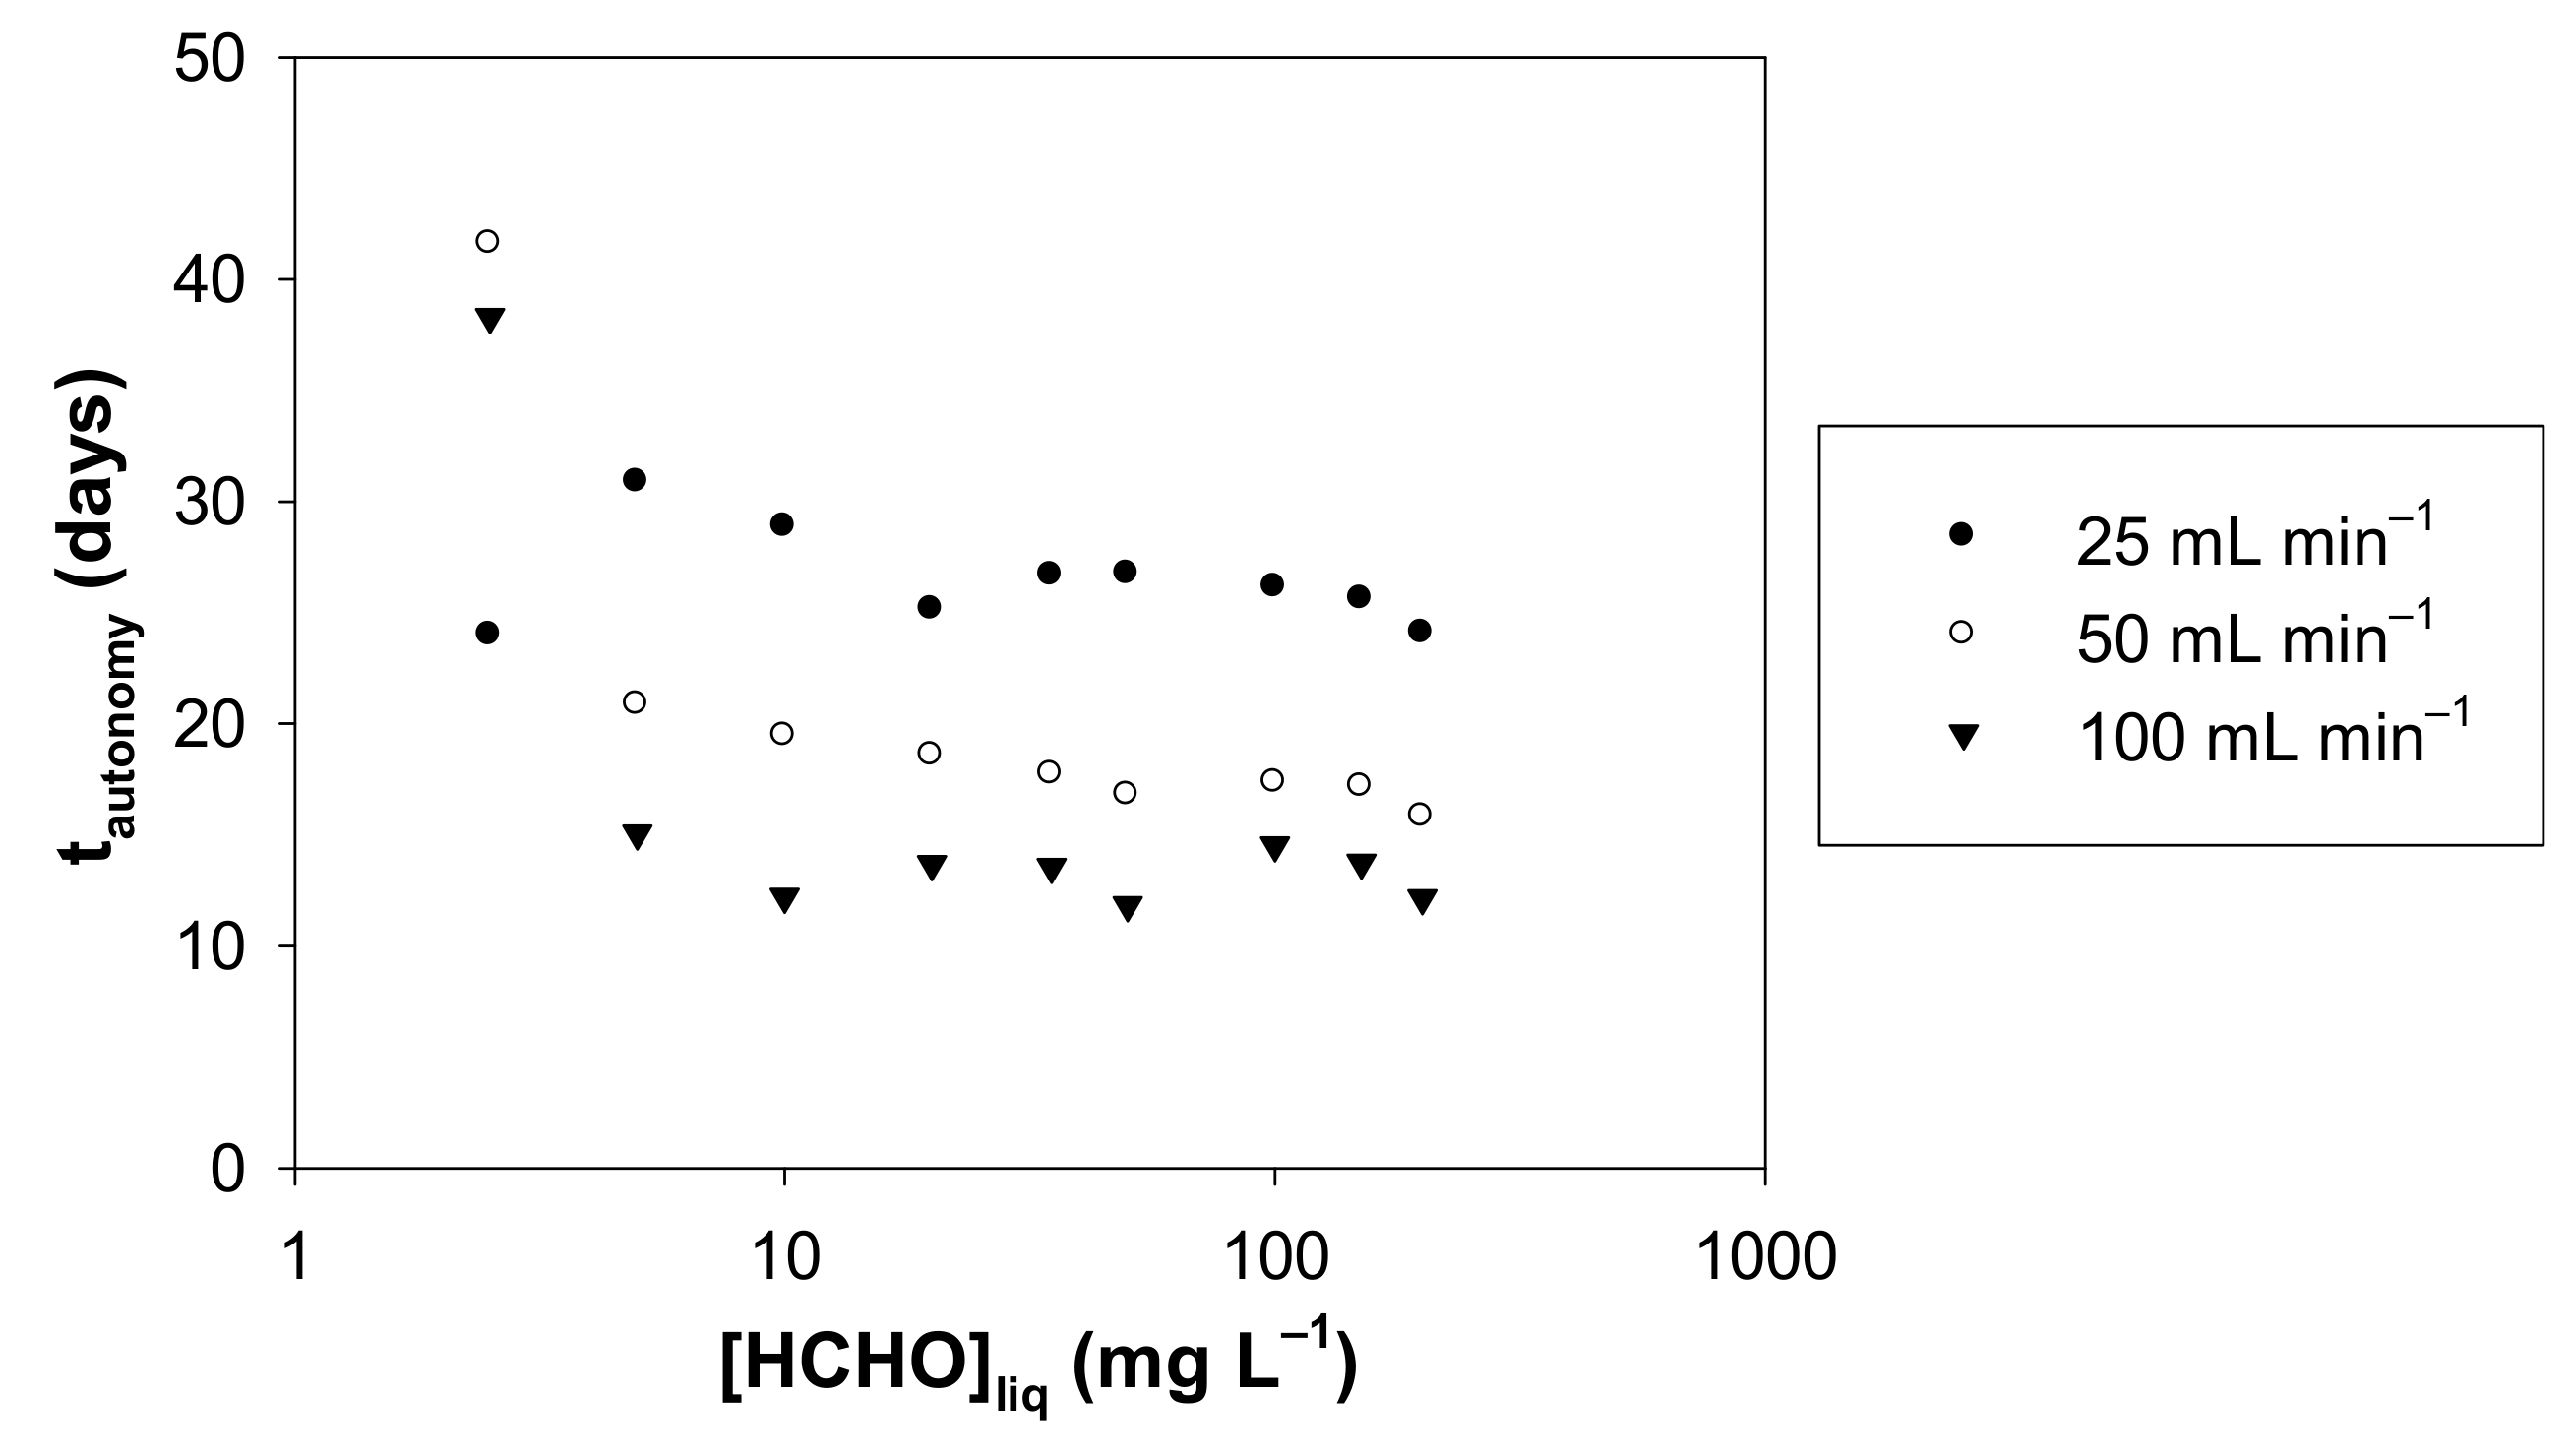
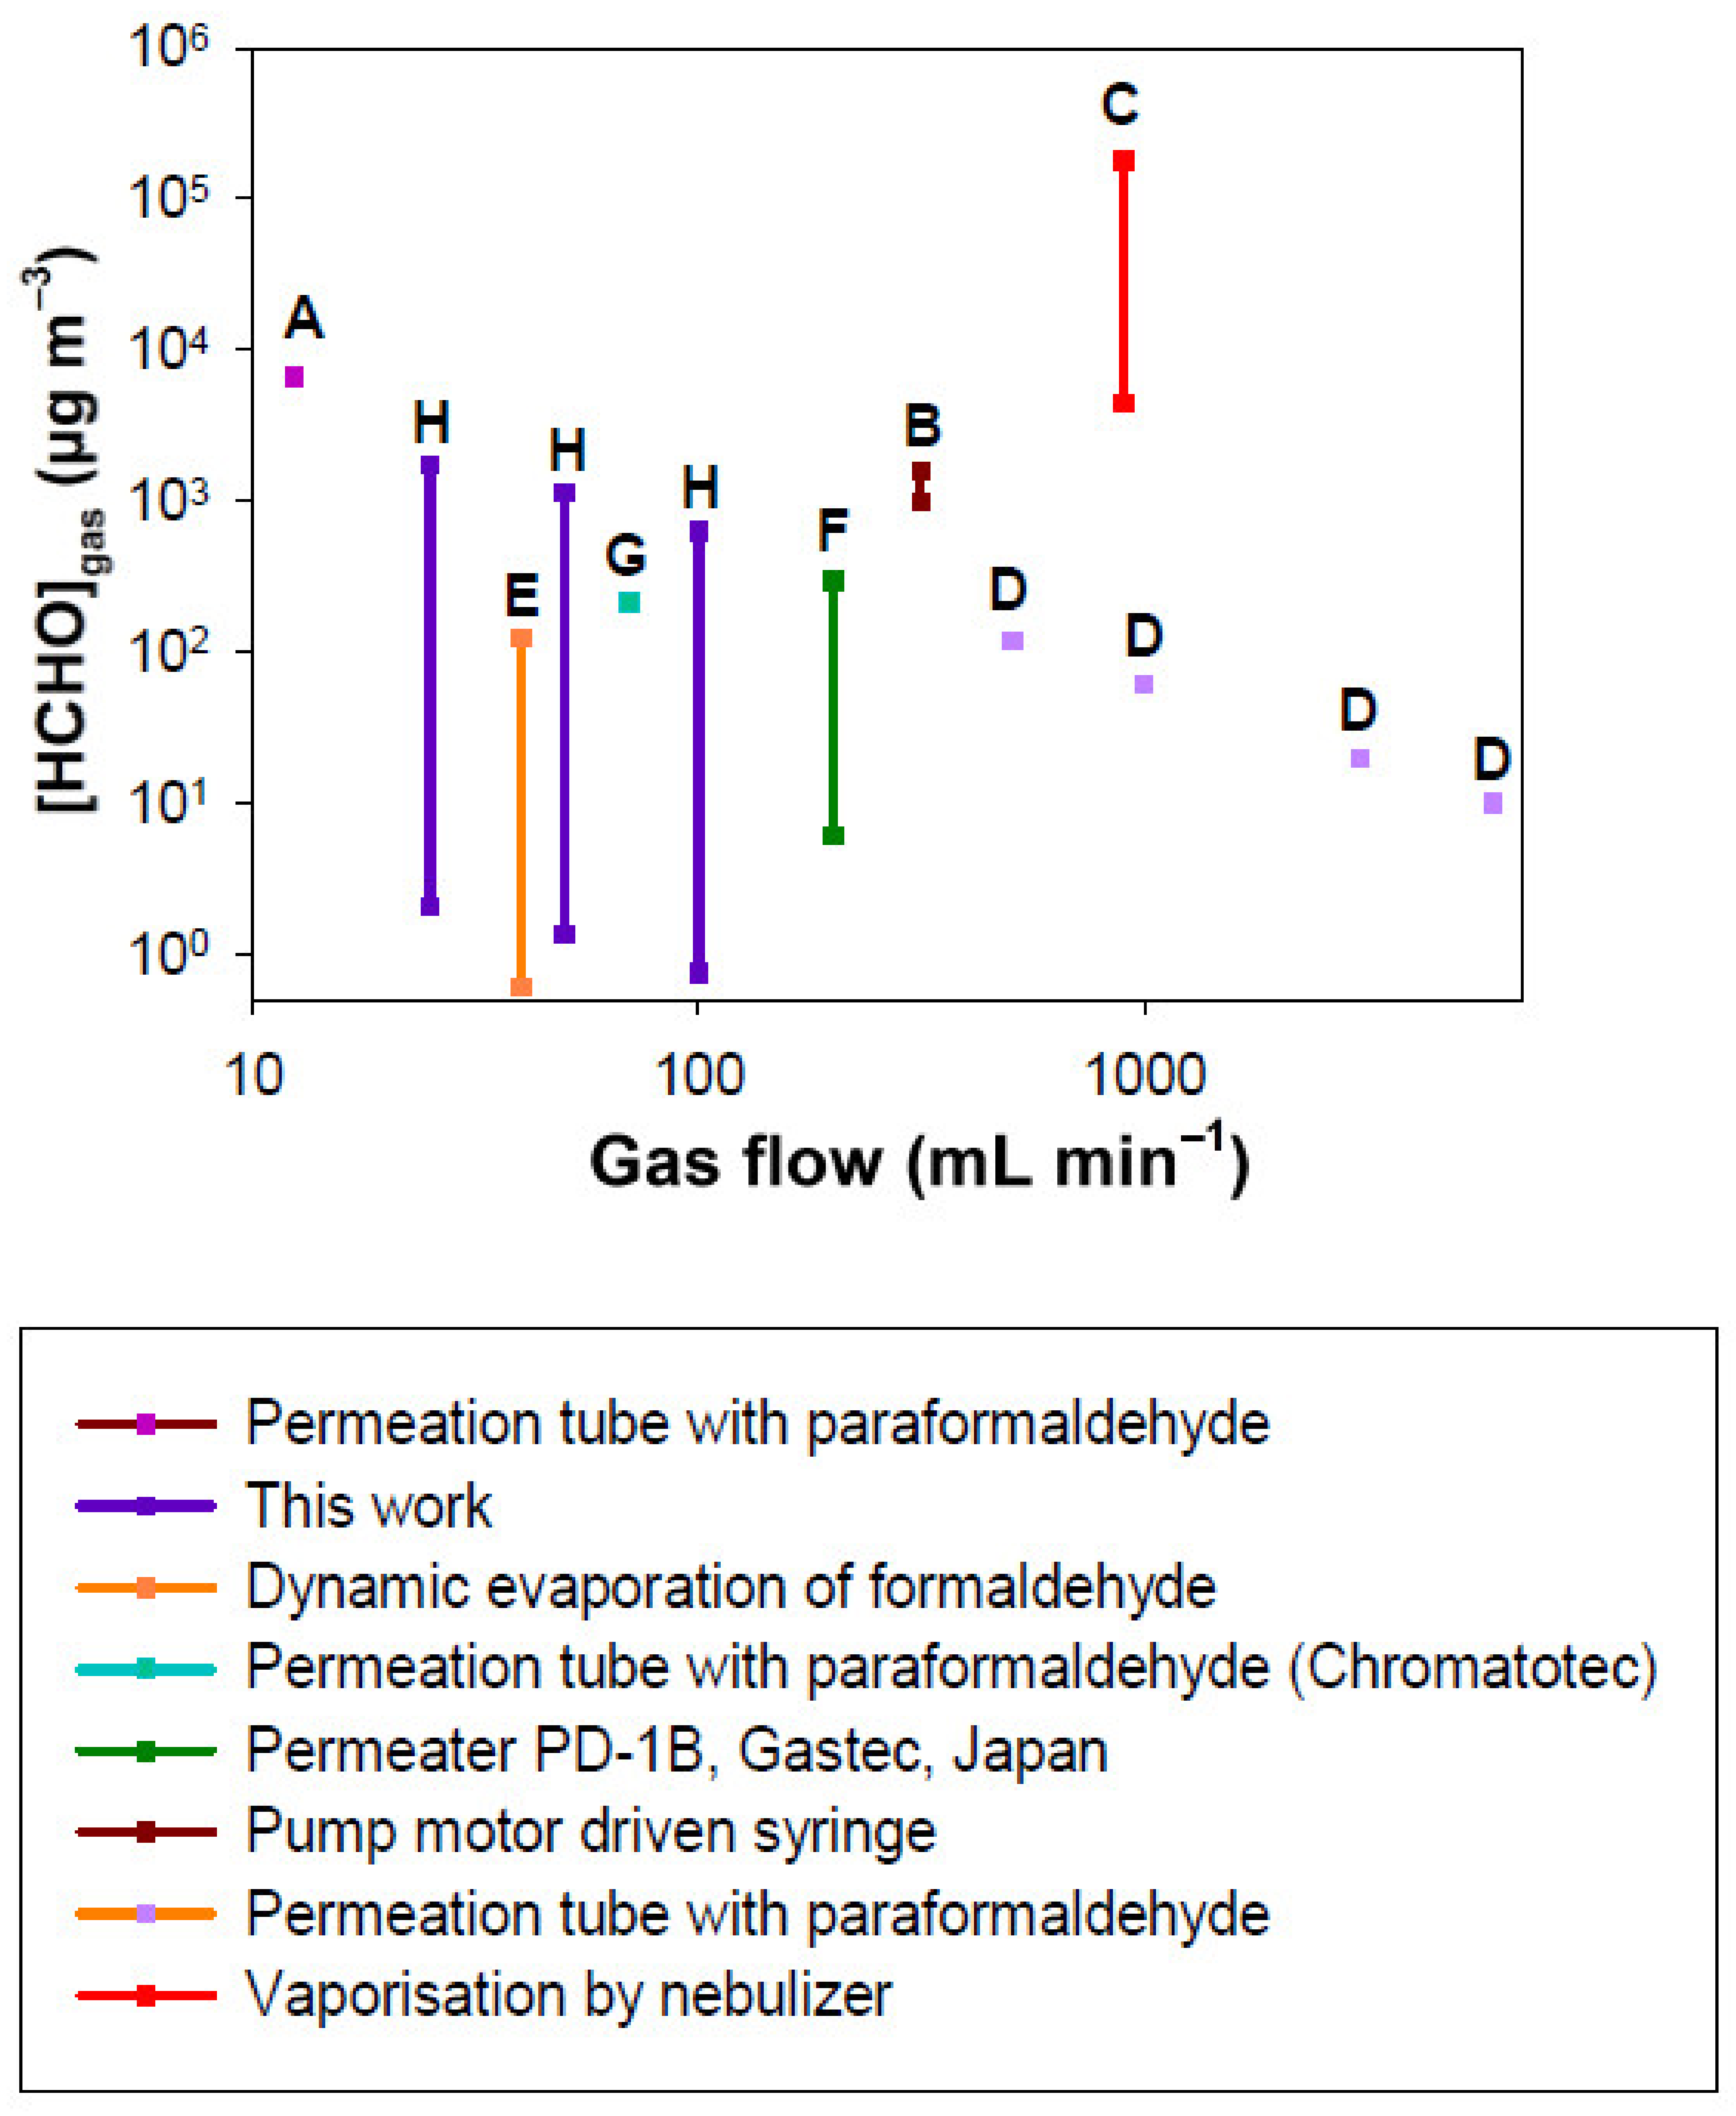
Table 1.
Devices for generating gaseous formaldehyde from liquid or solid reagents.
| Generation Mode | Reagent | Dynamic or Static Method | Reagent Concentration (mg L−1) | Gas Flow Rate (mL min−1) | Formaldehyde Concentration Range (µg m−3) | Gas Concentration Variation Method | Temperature (°C) | References |
|---|---|---|---|---|---|---|---|---|
| Catalytic Conversion with molybdenum | Methanol | Dynamic | N/A a | 1000 (nitrogen) | N/A a | Catalytic bed length (7.6 and 15.2 cm) Methanol concentration | 90 | [53] |
| Pump motor driven syringe | Formaldehyde | Dynamic | 32,430 | 315 | 980–16,000 | Liquid flow ≥10 µL h−1 | N/Aa | [54] |
| Permeation tube with paraformaldehyde (manufacturer) | Paraformaldehyde (weight loss of 60 ng min−1 at 70 °C) Tube length: N/Aa | Dynamic | 12.4 | 6630 | No variation | 70 | [54] | |
| Paraformaldehyde (weight loss of 83 µg min−1 at 50 °C) Tube length of 5 cm | Dynamic | 6050 3040 993 507 | 9.92 19.7 60.4 120 | Gas flow rate | 50 | [59] | ||
| Vaporisation by nebulizer | Acetaldehyde (applicable with formaldehyde) | Dynamic | N/A a | 900 | 4500–180,000 | Liquid flow rate (0.23–9.2 pL min−1) | Room temperature | [56] |
| Vaporisation by vacuum | Formaldehyde | Static | 403,310 | Purge (nitrogen) | 370,000 | No variation | 50 | [55] |
| Evaporation of formaldehyde solution | Formaldehyde | Dynamic | 0.1–14 | 40 (nitrogen) | 0.6–120 | Liquid formaldehyde concentration | 25 | [60] |
| Formaldehyde | Dynamic | N/A a | 250–1000 (nitrogen) | 12–380 | Gas flow rate | 40 | [61] | |
| Permeation tube | Formaldehyde | Dynamic | 0.3–206 | <400 | 4–1500 | Liquid formaldehyde concentration | 5–25 | [58] |
| Diffusion tube | Trioxane | Dynamic | N/A a | N/A a | 60–2500 | Gas flow rate | 35.2 | [57] |
| Microporous tube | Formaldehyde | Dynamic | 2.5–200 | 25 50 100 | 2.1–1738.7 1.4–1141.6 0.7–622.7 | Gas flow rate Liquid formaldehyde concentration Tube length Temperature of the liquid solution | 10.7 and 21.8 | This work |
a N/A: data not available.
Table 2.
Commercial devices for generating gaseous formaldehyde based on the permeation tube method.
Table 2.
Commercial devices for generating gaseous formaldehyde based on the permeation tube method.
| Module | Manufacturer | Reagent | Picture of the Device | Oven Temperature (°C) | Flow Range (mL min−1) | Weight (kg) | Dimension (cm) | Main Characteristic |
|---|---|---|---|---|---|---|---|---|
| AirmoHCHO | Chromatotec | Paraformaldehyde |  | 60 | 70 | 20 | 22 × 48 × 66 | [HCHO]gas = 214 µg m−3 Tube length: 4.5 cm |
| DynaCalibrator | Vici Metronics (Santa Clara, CA, USA) | Paraformaldehyde |  | 2–110 | 1000–20,000 | 33 | 43 × 60 × 26 | [HCHO]gas = 1–10,000 µg m−3 Max tube length: 24 cm Solid compound |
| ETG CALG 100 | ETG Risosse e Tecnologia (Montiglio, Italy) | Formaldehyde or paraformaldehyde |  | 2–60 | N/A a | 9 | 13 × 48 × 38 | [HCHO]gas = 1–10,000 µg m−3 Liquid or solid compounds |
| FlexStream | KIN-TEK (La Marque, TX, USA) | Formaldehyde |  | 5–150 | 250–5000 | 13 | 18 × 34 × 20 | Modular up to 8 components The permeation tube is immersed in the formaldehyde solution |
| OVG-4 | Owistone Med (Norwalk, CT, USA) | Formaldehyde or paraformaldehyde |  | 35–100 | 50–500 | 5 | 26 × 14 × 26 | High number of available analyte compounds, including solids and liquids [HCHO]gas = 1–10,000 µg m−3 |
| PermeaterPD-1B/PD 1B-2 | Gastec (Kanagawa, Japan) | Formaldehyde |  | 25–50 | 200–10,000 | 13 | 30 × 30 × 27 | [HCHO]gas = 6–295 µg m−3 Tube length 5 cm |
a N/A: data not available.
Publisher’s Note: MDPI stays neutral with regard to jurisdictional claims in published maps and institutional affiliations. |
© 2022 by the authors. Licensee MDPI, Basel, Switzerland. This article is an open access article distributed under the terms and conditions of the Creative Commons Attribution (CC BY) license (https://creativecommons.org/licenses/by/4.0/).
Share and Cite
MDPI and ACS Style
Becker, A.; Lohmann, N.; Serra, C.A.; Le Calvé, S. Development of a Portable and Modular Gas Generator: Application to Formaldehyde Analysis. Chemosensors 2022, 10, 131. https://doi.org/10.3390/chemosensors10040131
AMA Style
Becker A, Lohmann N, Serra CA, Le Calvé S. Development of a Portable and Modular Gas Generator: Application to Formaldehyde Analysis. Chemosensors. 2022; 10(4):131. https://doi.org/10.3390/chemosensors10040131
Chicago/Turabian StyleBecker, Anaïs, Nathaly Lohmann, Christophe A. Serra, and Stéphane Le Calvé. 2022. "Development of a Portable and Modular Gas Generator: Application to Formaldehyde Analysis" Chemosensors 10, no. 4: 131. https://doi.org/10.3390/chemosensors10040131
Note that from the first issue of 2016, this journal uses article numbers instead of page numbers. See further details here.