
Ion Sensors for Pulsed and Continuous Detonation Combustors
by
 , ,
, ,
Sergey M. Frolov
1,2,*,
Igor O. Shamshin
1,
Viktor S. Aksenov
1,2,
Vladislav S. Ivanov
1 and
Pavel A. Vlasov
1 1
Semenov Federal Research Center for Chemical Physics of the Russian Academy of Sciences, Moscow 119991, Russia
2
Institute of Laser and Plasma Technologies, National Research Nuclear University MEPhI (Moscow Engineering Physics Institute), Moscow 115409, Russia
*
Author to whom correspondence should be addressed.
Chemosensors 2023, 11(1), 33; https://doi.org/10.3390/chemosensors11010033
Submission received: 13 December 2022
/
Revised: 22 December 2022
/
Accepted: 29 December 2022
/
Published: 1 January 2023
(This article belongs to the Section Materials for Chemical Sensing)
Abstract
:Presented in the article are the design and operation principles of ion sensors intended for detecting the propagating reaction fronts, the deflagration/detonation mode, apparent subsonic/supersonic propagation velocity of the reaction front, and duration of heat release by measuring the ion current in the reactive medium. The electrical circuits for ion sensors without and with intermediate amplifiers, with short response time and high sensitivity, as well as with the very wide dynamic range of operation in the reactive media with highly variable temperature and pressure, are provided and discussed. The main advantages of ion sensors are their very short response time of about 1 ms, versatility of design, and capability of detecting and monitoring reaction fronts of different intensities directly in combustion chambers. Several examples of ion sensor applications in sensing deflagration-to-detonation transition in pulsed detonation engines and developed detonations in rotating detonation engines operating on different fuel–air and fuel–oxygen mixtures are presented and discussed.
1. Introduction
Combustion of gases and sprays can be accompanied by the generation of positive and negative ions and free electrons due to both chemical and thermal ionization [1,2,3,4,5]. Chemical ionization is the formation of ions and free electrons in the reactions of electronically excited and unexcited atoms, radicals, and molecules in the gas phase. For the chemical ionization to occur, the energy released in the reactions must be close to the energy required for ionization of the atoms/molecules formed. Chemical ionization was observed mostly in oxygen-containing media, while it was not observed in oxygen-free and flames [6]. Replacement of oxygen (air) with nitrous oxide did not change the mechanism of chemical ionization proposed for hydrocarbon–oxygen flames [7]. Some researchers claim that chemical ionization is the prerogative of hydrocarbon flames [8,9] despite some evidence of chemical ionization in flames of hydrogen-free [10] and carbon-free [11] fuels. Thermal ionization is the formation of ions and free electrons due to collisions of atoms, radicals, and molecules with high kinetic energy of thermal motion. It is determined by the gas temperature and ionization potentials of gas species and therefore can be observed in high-temperature flames of different origin.
Availability of charged particles in the medium allows sensing the combustion process by various sensors including Langmuir-type ion sensors (ISs) [12,13] detecting the ion current. Combustion diagnostics and analysis through the use of ISs is currently well established. In particular, ISs are widely used in spark-ignition (SI) piston engines for detecting knock, misfire, flame flashback, etc., in gasoline engines [14,15,16], in SI engines operating on alternative fuels [17,18], in diesel engines [19,20], and in homogeneous charge compression ignition (HCCI) engines [21,22,23,24], as well as in gas turbines [25]. Frolov et al. [26,27] showed that ISs can be successfully used for detecting both fast flames (deflagrations) and detonations in continuous and pulsed detonation power plants operating on gaseous and liquid fuels. The main advantages of ISs are their very short response time, versatility of design, and capability of detecting and monitoring flames of different intensities directly in combustion chambers. The low signal-to-noise ratio, in particular under low-exothermicity conditions [28,29], can be treated as the main disadvantage of the IS. The ISs usually contain one or two metal electrodes immersed in the reacting medium and measure either the charge induced by charged particles in the electrodes or the ion current produced by charged particles between the biased electrodes with the applied electrical field. A signal obtained by the IS depends on the ion concentration in the medium and allows monitoring many important characteristics of the combustion process, including pressure pulsations and traversing reaction fronts.
The chemical and physical mechanisms of ion formation in a reactive medium depends on both fuel and oxidizer and their mixture composition, as well as on combustion mode and conditions. The detailed kinetic mechanism of chemical and thermal ionization for the simplest hydrocarbon fuel, such as methane, with the account of formation of negative ions has been reported, e.g., by Prager et al. [30]. Chemical and thermal ionization in methane–air and natural gas–air flames in constant-volume enclosures was studied theoretically and experimentally, e.g., in [31,32,33,34] for mixtures with different fuel-to-air equivalence ratios (ERs). Aithal [31] analyzed the temporal variation of the equilibrium combustion products using a detailed kinetic mechanism containing multiple neutral and charged species and found that the important charged species were , , , and for all ERs. As for other charged species like , , and , their mole fractions were negligible. The charged particles participated in the reactions are listed in Table 1. Temporal variation of the ion current predicted based on the equilibrium concentration of charged species was in good agreement with IS measurements. Despite the mixture, ER had a strong impact on the peak value of ion current, especially for near-stoichiometric mixtures, the effect of ER on the current time history was captured well. It was also found both experimentally and computationally that the mixture composition had a greater impact on the peak current as compared with temperature.
This manuscript presents the design and operation principle of ISs intended for detecting propagating reaction fronts and the combustion mode (deflagration or detonation), apparent propagation velocity of the reaction front (subsonic or supersonic), duration of heat release, etc. by measuring the ion current in the medium. Several examples of IS applications in sensing deflagration-to-detonation transition (DDT [35]) in pulsed detonation engines (PDEs [36]) and developed detonations in rotating detonation engines (RDEs [37,38]) operating on gaseous (hydrogen, ethylene, propane) and liquid (propane-butane, gasoline, etc.) fuels with air or oxygen as oxidizers are presented. The use of ISs for detecting propagating reaction fronts in propulsion devices utilizing the controlled detonations of gaseous or liquid fuels is a novel and distinctive feature of this research.
2. Materials and Methods
2.1. Sensing Principle and Designs of Ion Sensors
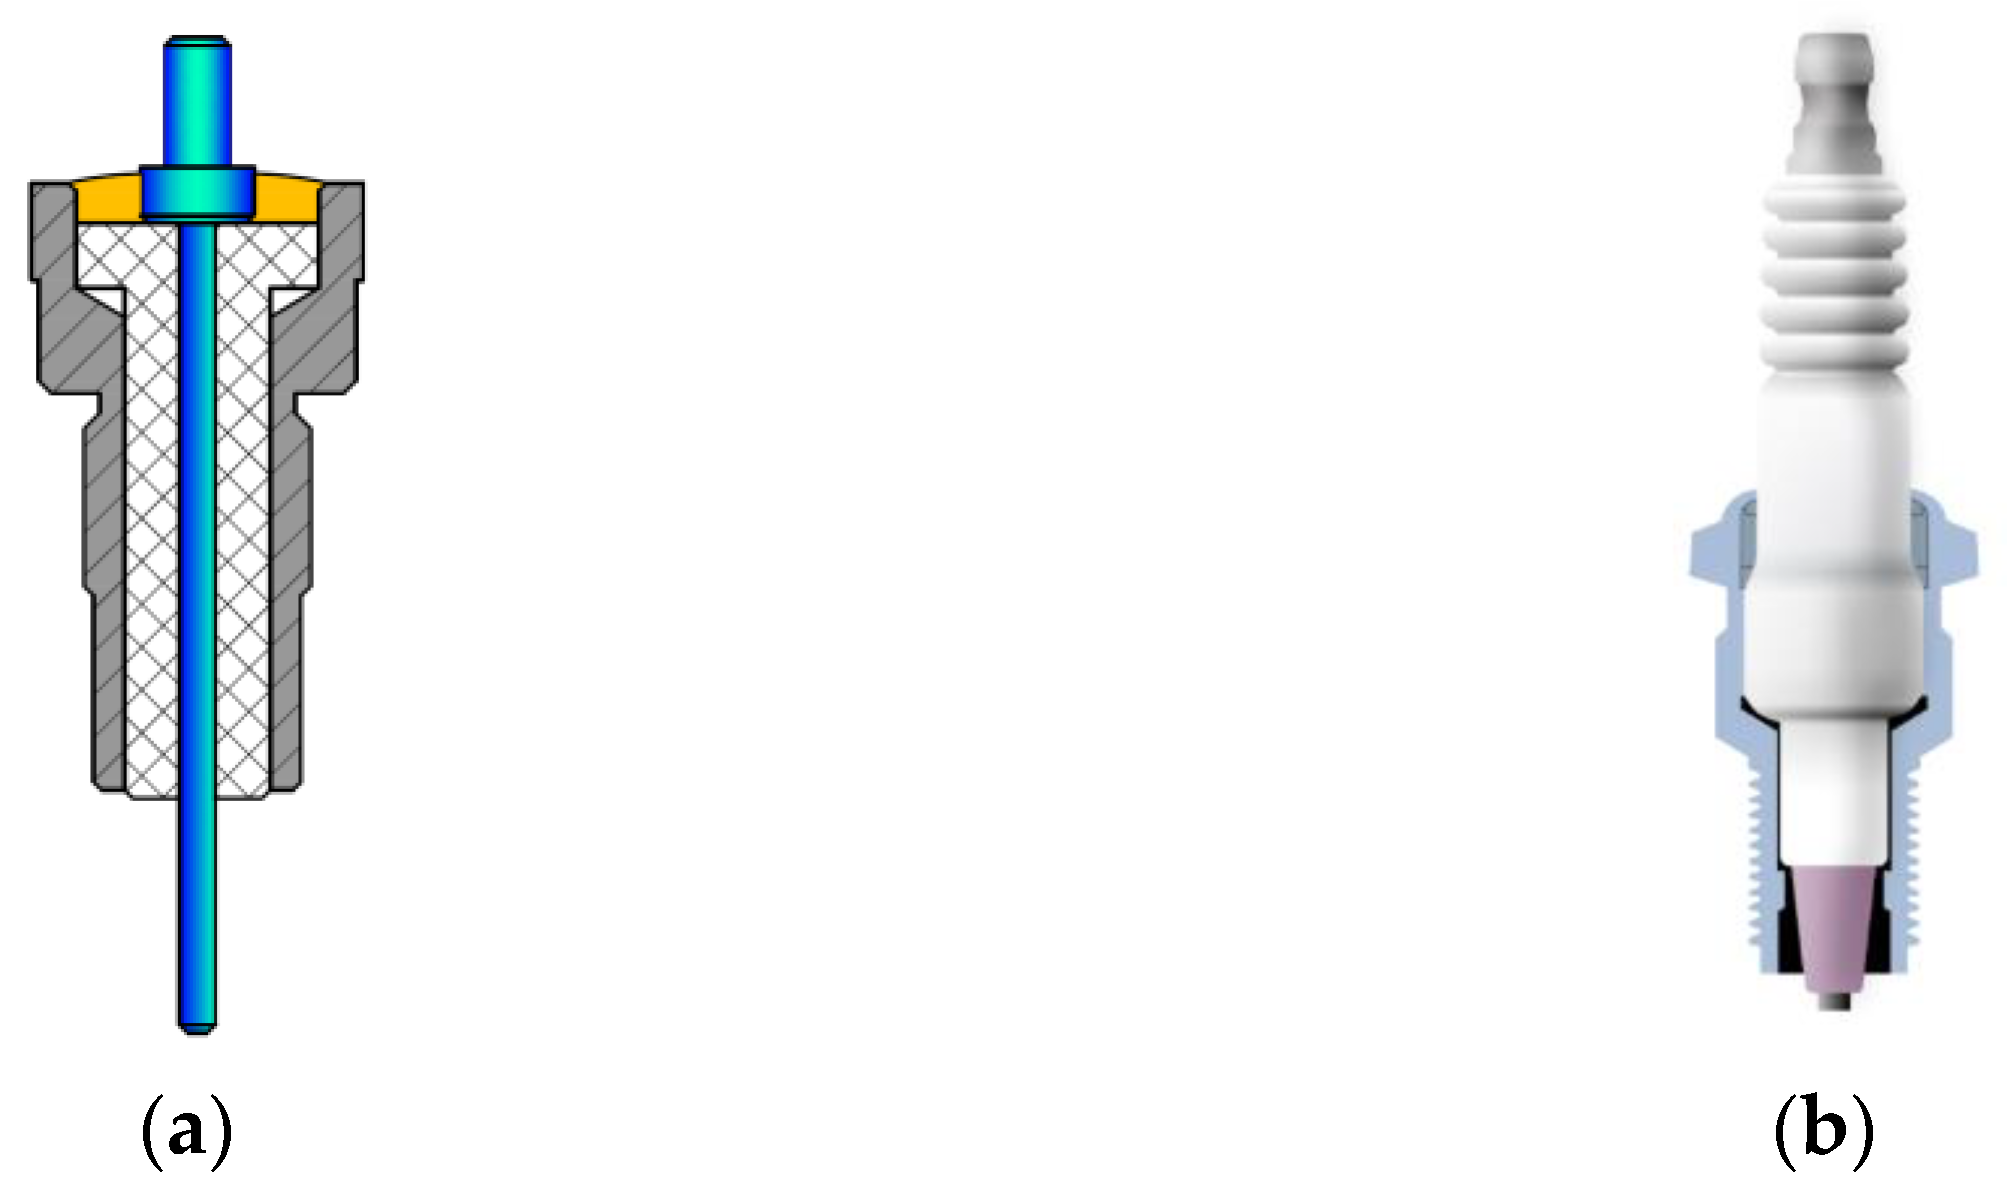
The ion sensor is a well-known Langmuir probe operating with a positive potential in the electron collection mode and negative ions in the saturation mode. The IS appears as a needle usually made from a refractory metal (e.g., nickel or tungsten) and insulated from the housing (Figure 1a). One end of the needle is introduced into the combustor. Its other end is soldered to a shielded cable connected to an analog-to-digital converter (ADC) of the data acquisition system. When a certain positive potential is applied to the needle, the nature of the movement of charged particles near it changes: the density of positive ions around it decreases, whereas the density of electrons and negative ions increases compared with the surrounding undisturbed plasma. Therefore, one can measure the electrical conductivity in the region around the needle as an electrical current via a measuring resistor. Such an IS possesses an almost ohmic current–voltage characteristic.
The choice of a positive potential is made based on the following considerations. In general, both negative and positive potentials can be applied to the needle. With the negative potential, positive ions will be attracted to it. However, the studies of the effect of electric field on the flame show that the movement of positive ions can affect the shape of the flame, causing the ionic wind phenomenon [39]. With the positive potential, the needle will collect negative charge carriers, and this will not cause a change in the shape of the flame. The main negative charge carriers in flames are electrons, whose mobility is three orders of magnitude higher than that of positive ions. The concentration of charged particles in the flame is low (the degree of ionization is very low, of all excited particles (radicals), only a small part, ~, are ions), the removal of all charged particles using an IS (saturation mode) occurs at electric fields less than the breakdown voltage. Thus, the electric field of the needle does not create new charge carriers, except for those that are obtained during chemical reactions. Taking these facts into account, it is thus more preferable to apply a positive potential to the needle. Moreover, the removal of both negative and positive charge carriers does not have a significant effect on the course of chemical transformations, that is the use of IS ensures the smallness of the perturbations introduced by the needle into the combustion process.
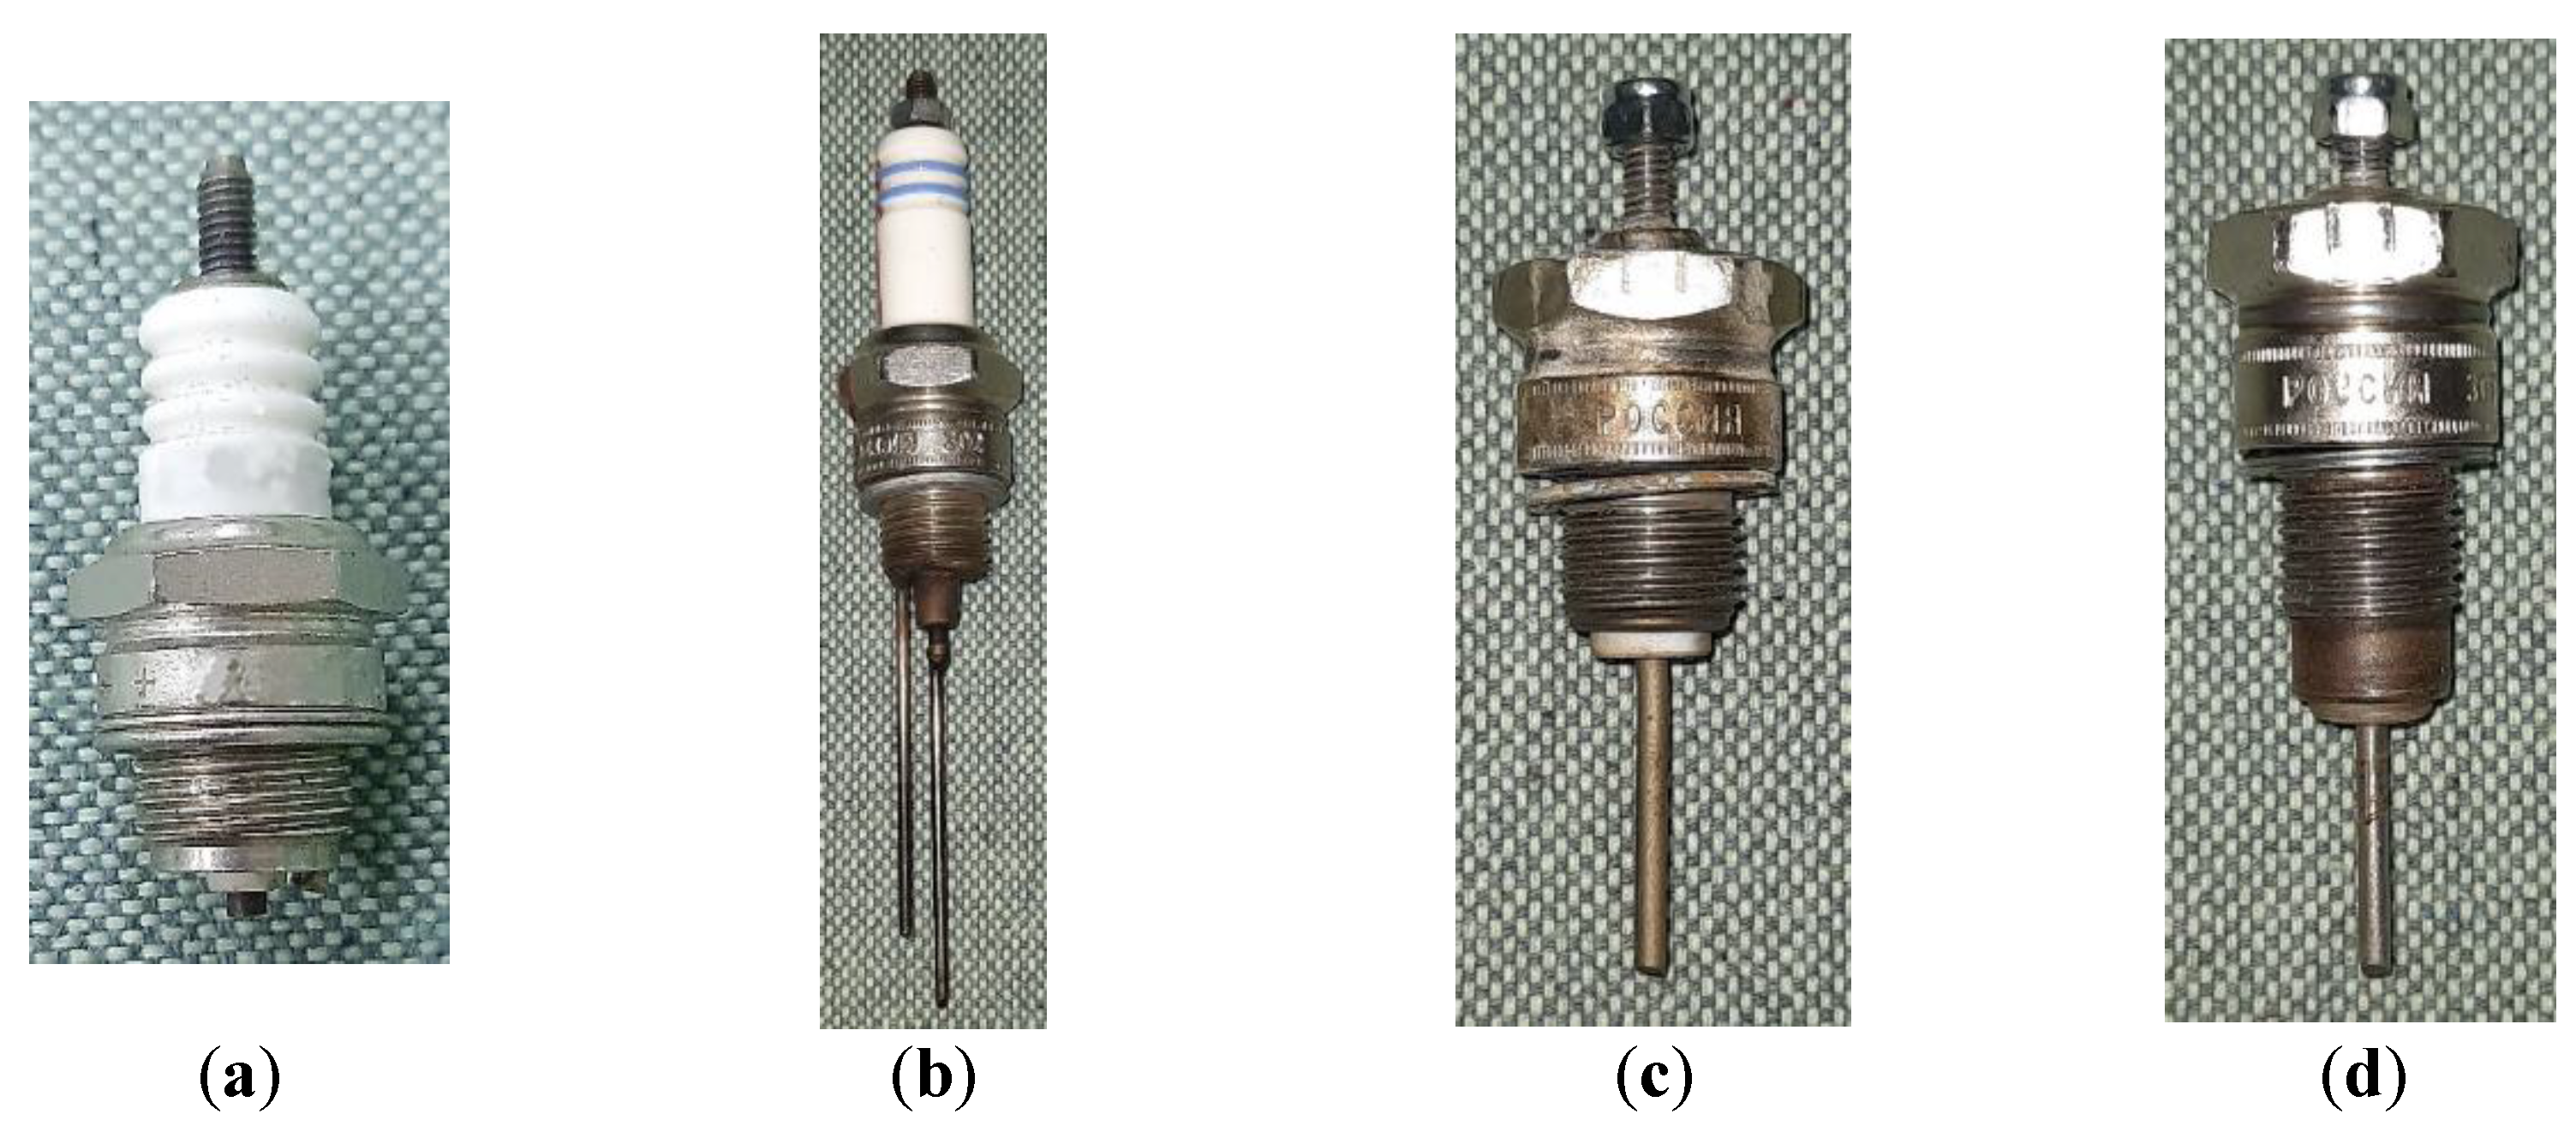
To study fast combustion processes in tubes such as inherent in DDT and detonations in fuel–air and fuel–oxygen mixtures, a regular automobile spark plug with ceramic insulator can be used as a probe (Figure 1b). Thread diameter and length usually vary from 8 to 14 mm and from 11 to 25 mm, respectively. The type of seal can be selected depending on the design of the setup. To restore symmetry, the ground electrode on the spark plug can be removed (Figure 2a). If it is necessary to increase the IS sensitivity or to measure the ion current in the central sections of the test tube, the central electrode can be extended (Figure 2b–d). Ion sensors based on spark plugs with a ceramic insulator offer a number of operational advantages. Firstly, they withstand heating to a white-heat temperature and are able to withstand large pressure changes. The temperature limit of the ISs is determined only by their parasitic action on the combustion process, e.g., causing pre-ignition. Secondly, they have a low cost. As compared to ISs, pressure and optical sensors do not tolerate long-term tests with repeatable DDT in a PDE or continuously rotating detonation in an annular gap of RDE due to their overheating.
2.2. Ion Sensors without Intermediate Amplifiers
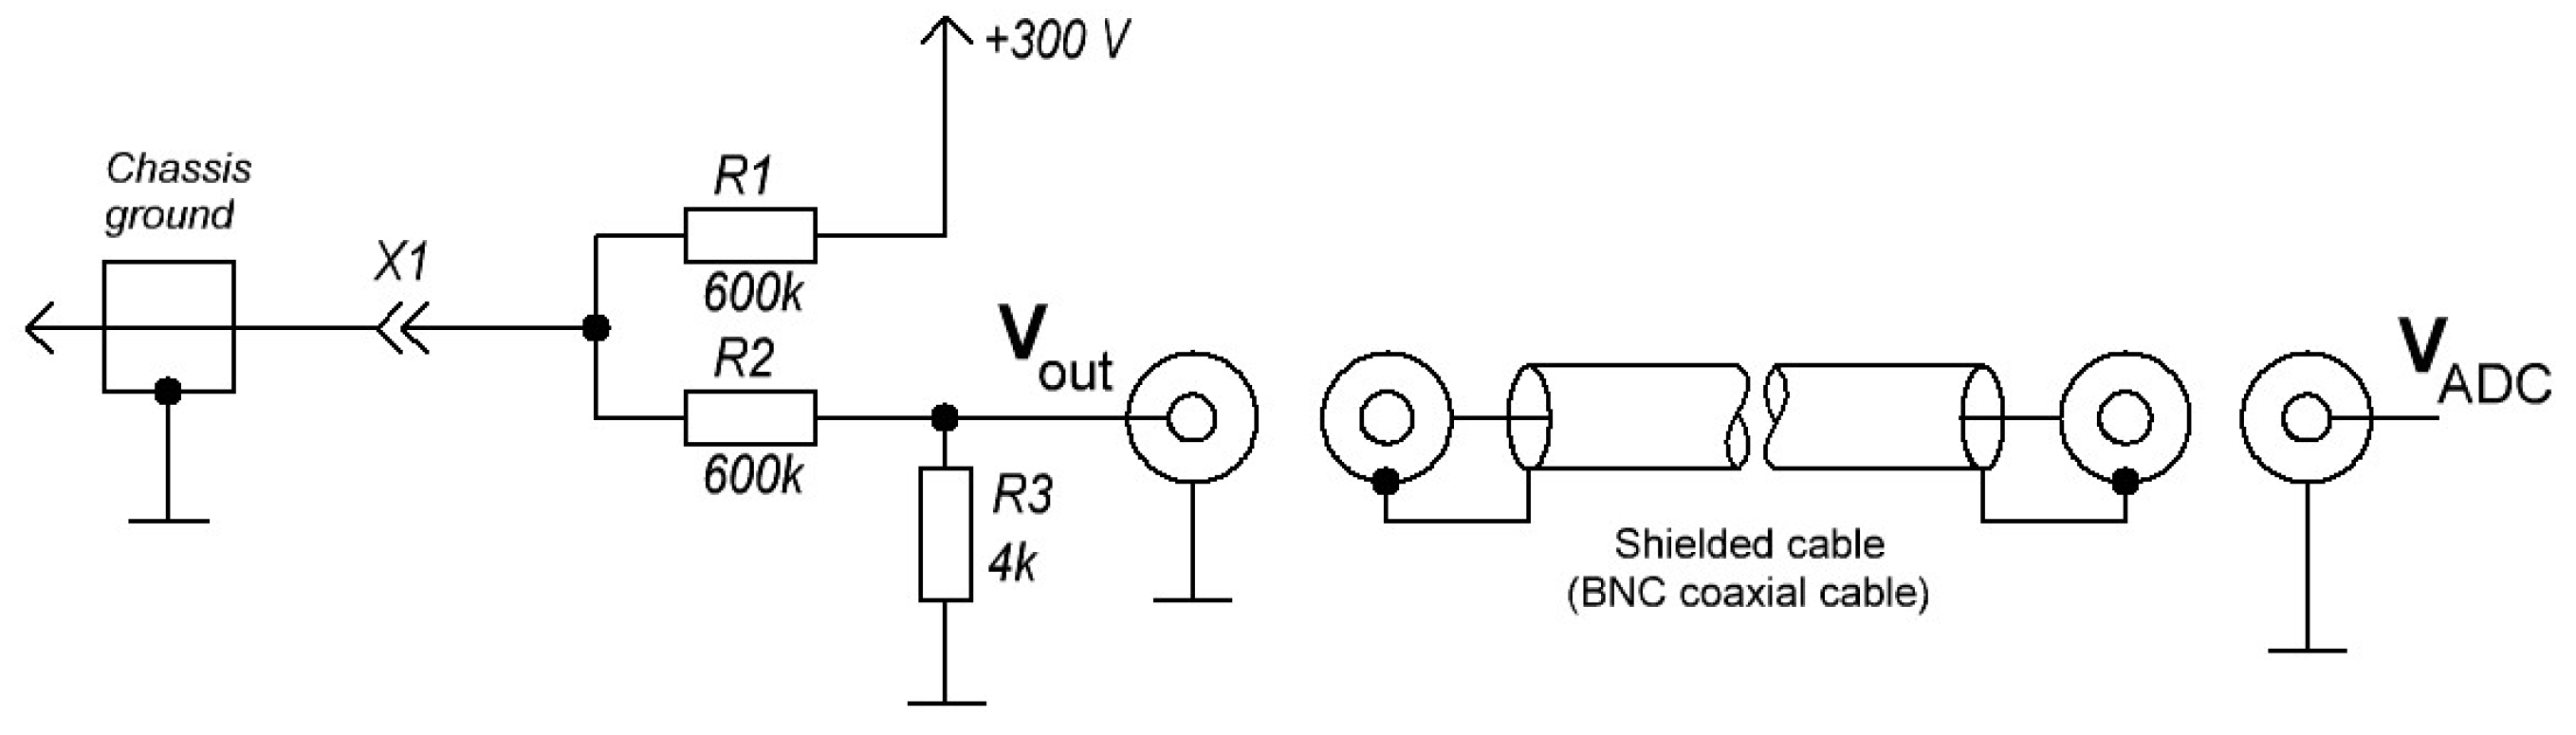
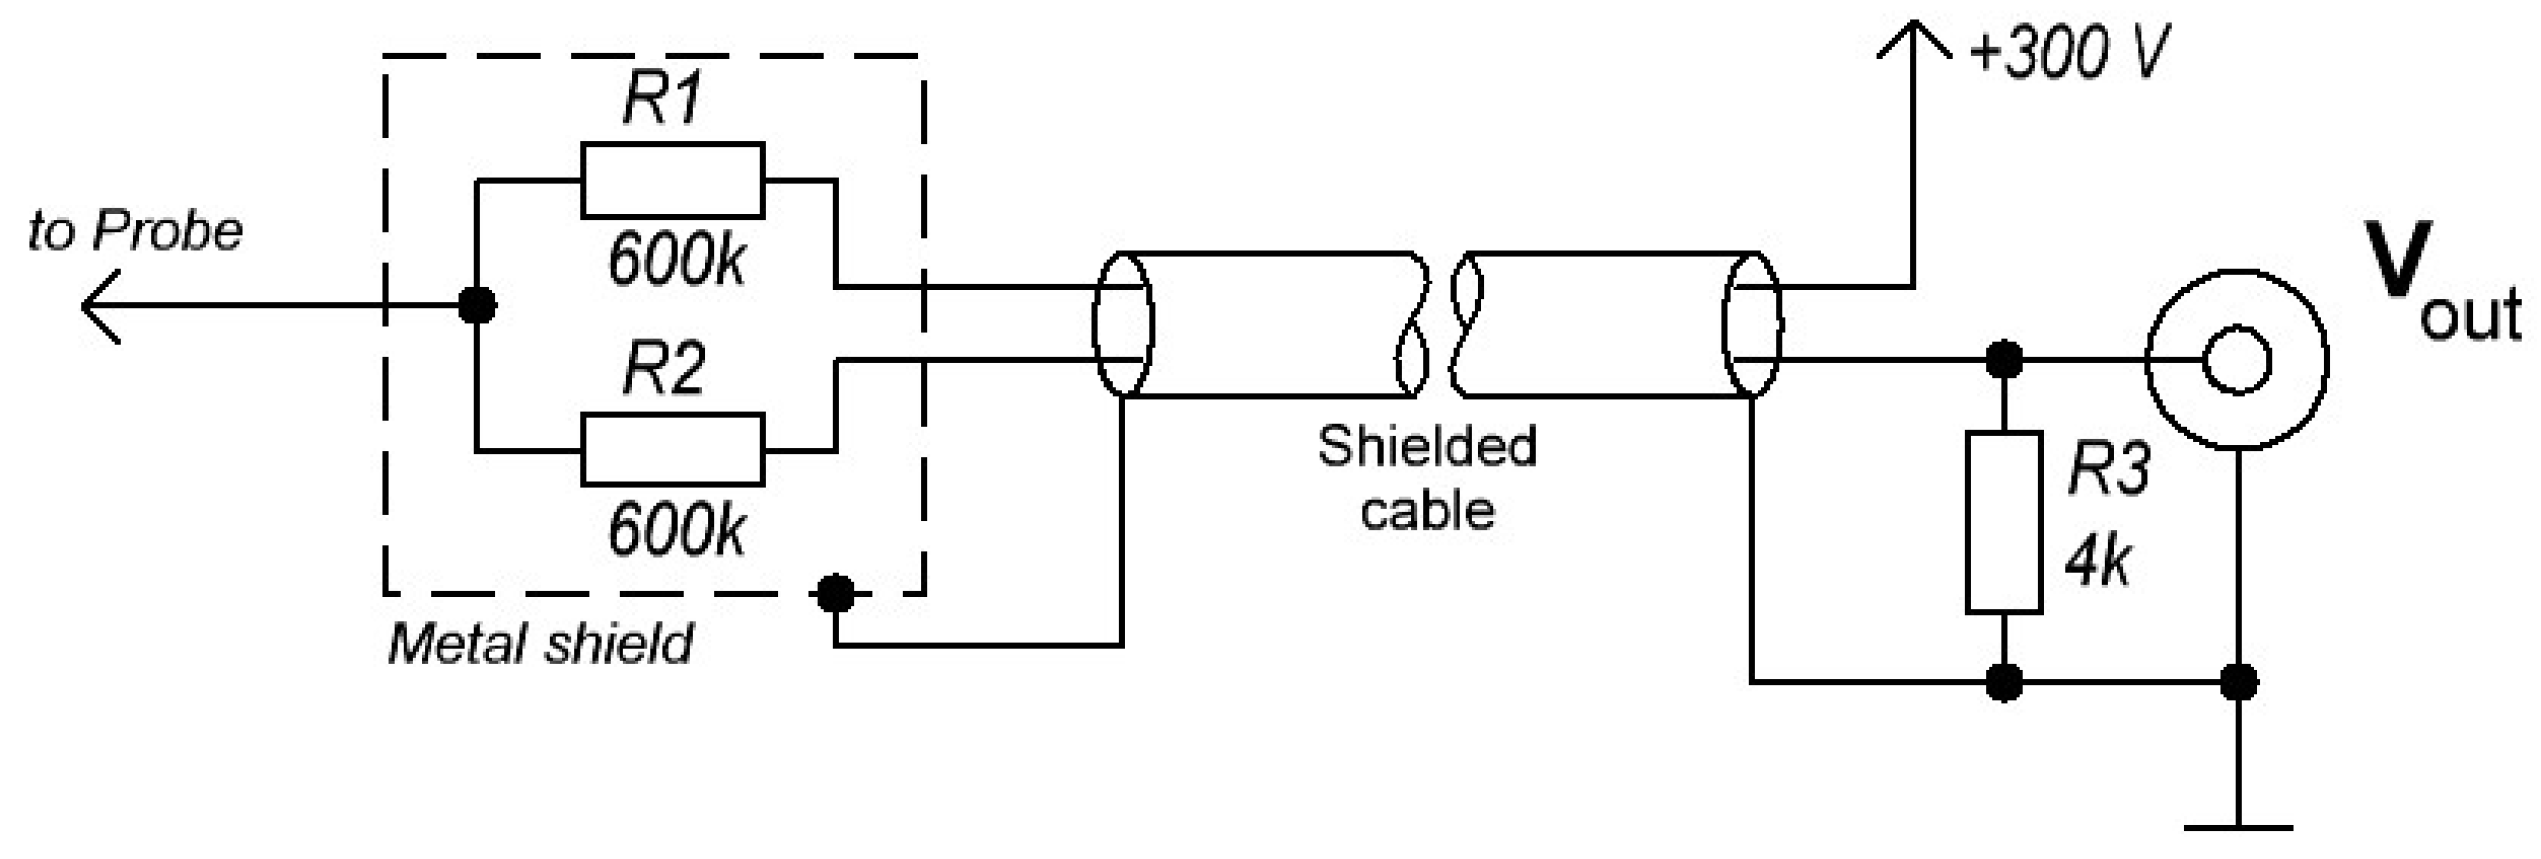
Figure 3 shows the simple electrical circuit of the IS without intermediate amplifiers. Together with the IS, this circuit is designed to study the DDT process in a PDE and is capable of registering reaction fronts inherent in fast flames and detonations in fuel–air mixtures. The connector X1 is used to connect the IS probe. The electrical circuit contains a +300 V direct current (DC) voltage source and resistors R1, R2, and R3 as passive elements. Resistors R1 and R2 form a voltage divider that provides optimal voltage parameters on the IS (+150 V), whereas resistor R1 sets a high internal resistance of the power supply. Resistors R2 and R3 make up the second voltage divider for generating the output signal, which is transmitted for registration to the ADC. The output signal of the IS, , is connected to the ADC by a shielded coaxial cable. The power supply and voltage dividers are placed in a common housing. One housing accommodates 8 to 32 dividers for connecting and powering 8 to 32 ISs.
The resistor values can differ significantly and are chosen based on the conditions of the experiment and the problem statement. The typical values of resistors R1 and R2 are 600 kΩ, and that of resistor R3 is 4 kΩ. The current–voltage characteristic of the scheme is linear. The supply current varies from 0 to 500 μA. The threshold sensitivity of the IS at the specified ratings is about 1 μA. For a 1-m input cable line and a weak input signal with an input current of 2.5 µA typical of a laminar flame front, the probe response time is around 30 µs, and the output signal amplitude is around 10 mV at the DC component of the output signal of 1 V. The response time of the IS for a strong signal characteristic of a fast turbulent flame or a detonation front turns out to be significantly smaller. In such a reaction front, at an equivalent resistance of the gap between the central electrode of the IS and the tube walls of around 10 kΩ, the response time of the input circuit of the IS is around 1 μs for an input cable line 1 m long. The amplitude of the output signal in this case is about 970 mV at the constant component of the output signal of 1 V. At the output resistance of the voltage divider equal to the value of resistor R3 (4 kΩ) and with a capacitance of the output line less than 250 pF, the response time of the output circuit is less than 1 μs. At such a response time, to measure the propagation velocity of the detonation wave in a PDE tube (a typical value of ~2000 m/s) with an accuracy of 1%, the measuring segment between two ISs installed in the tube must be around 200 mm. If it is required to increase the output signal swing, then the resistors’ values must be reduced, while the maximum supply current of the IS will also increase. For example, in our studies of propagating detonations, the values of resistors R1, R2, and R3 were often chosen to be equal to 300 kΩ, 300 kΩ, and 4 kΩ, respectively. Thus, for a simple IS without intermediate amplifiers with an input and output cable lines 1 and 3 m long, respectively, the response time of the IS when probing fast combustion and detonation fronts is less than 1 μs. Such a short response time is achieved due to the increased voltage on the IS (which ensures its operation in the saturation mode) and due to the output voltage divider with a low output resistance (which is provided by a high division ratio due to the increased supply voltage of the IS).
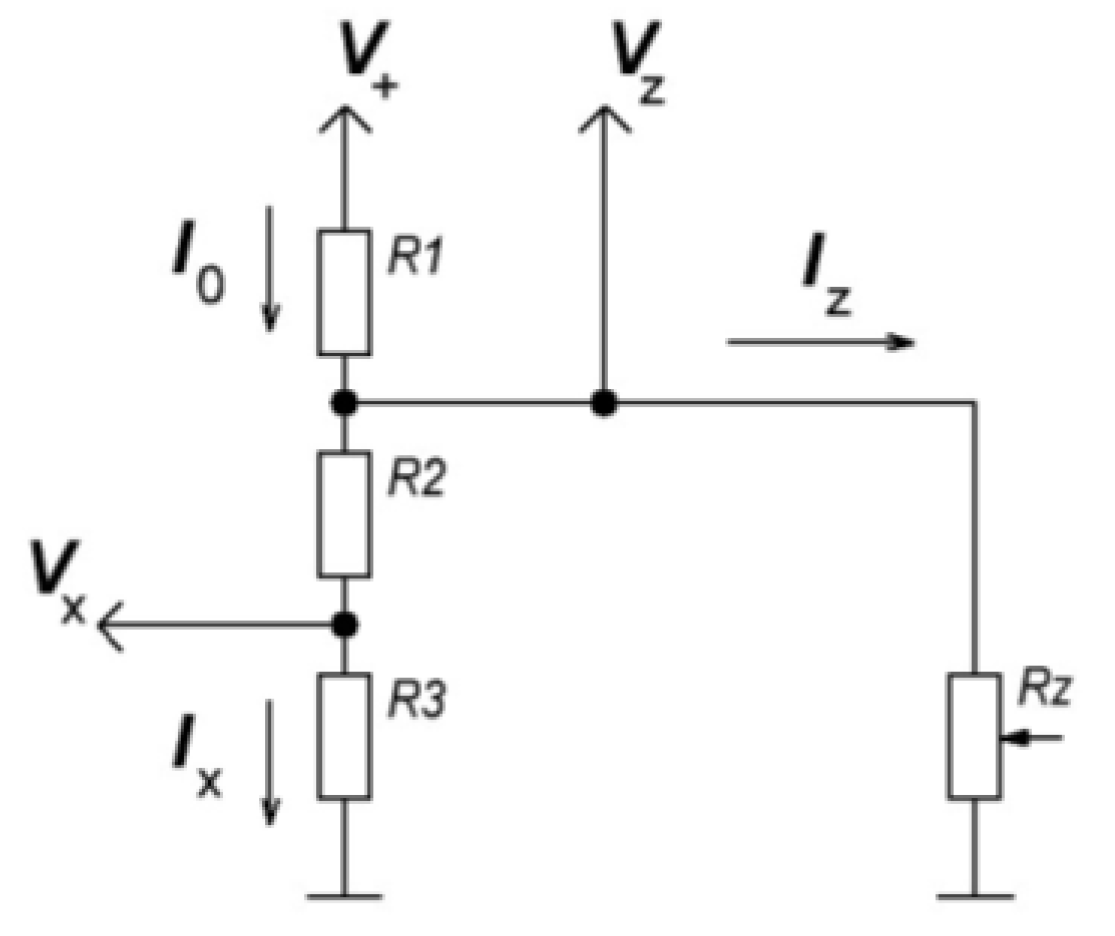
Using the simplest IS electrical circuit of Figure 3, it is possible to explain how one can estimate the resistance (conductivity) of the flame and detonation during the passage of a combustion wave through the IS using the voltage recorded by the ADC. Figure 4 shows a schematic of the power supply of the IS, in which the sensor itself is represented by a variable resistor Rz. A constant supply voltage = 300 V is applied to resistor R1. The sensor voltage is , and the circuit output voltage is fed to the ADC. Current flows through resistor R1. The current through the sensor is labeled , and the current flowing through resistors R2 and R3 is labeled in the schematic (the input resistance of the ADC is much higher than resistors R2 and R3, and the ADC input current can be neglected).
Let us write for this circuit the relations following from the Ohm and Kirchhoff laws:
As a result, one obtains:
These relationships allow the determination of the sensor resistance:
or sensor conductivity:
If the sensor is powered by an unregulated power supply or it differs for different sensors, then the current through the sensor can be calculated taking into account the output signal when the sensor circuit is broken, i.e., at = ∞:
Denoting the value of the output signal when the circuit is broken , one can rewrite the calculation formula for the current flowing through the sensor:
As can be seen from the relations obtained, when a combustion or detonation wave passes through the sensor, the resistance of the sensor decreases (the conductivity of the sensor increases), which simultaneously causes an increase in the current flowing through the sensor and a voltage drop across the sensor (a decrease in the positive potential applied to the central electrode of the sensor). Thus, regardless of the conductivity of the substance, only a small fraction of ions (electrons) is taken to the sensor: when there are few charge carriers, a high potential is applied to the sensor, due to which a high sensitivity of the sensor is achieved, and when there are many charge carriers, a low potential is set on the sensor.
2.3. Ion Sensors with Short Response Time
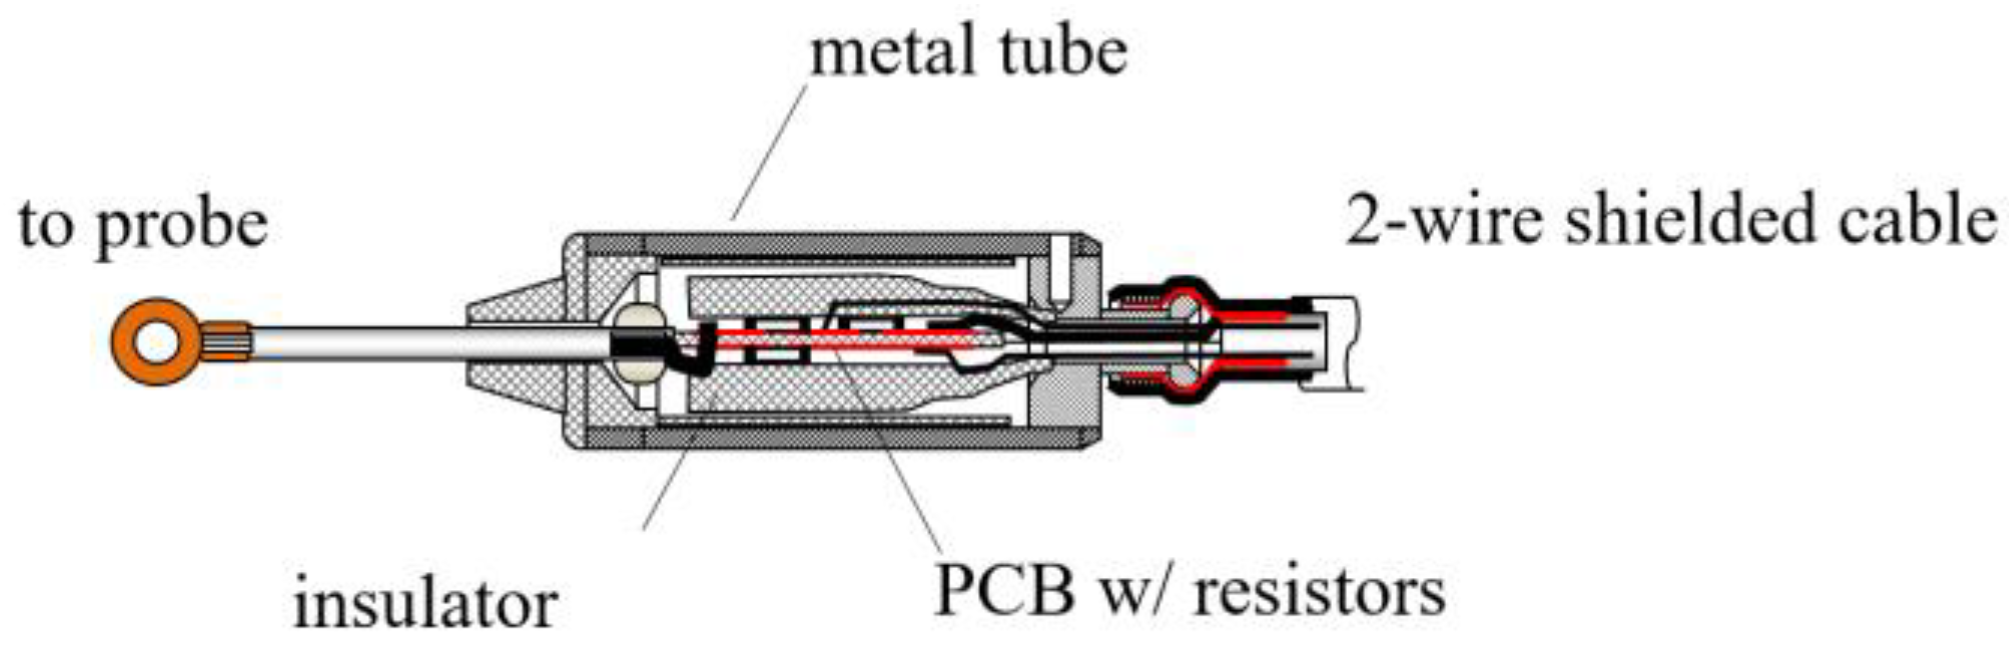
It is possible to significantly decrease the response time of the input circuit using an external divider, which reduces the capacitance of the connecting cable. Figure 5 shows the electrical circuit of the IS with an external divider. The voltage divider consisting of resistors R1 and R2 is similar to that shown in Figure 3 but is placed in a shielded case with a short heat-resistant flexible wire 5 to 10 cm long to connect directly to the IS. Such an electric circuit allows obtaining the response time of the IS in a hydrocarbon–air laminar flame as short as 3 to 5 μs. An example of the design of an external divider is shown in Figure 6. The divider is placed in a 12 × 1 mm tube 40 mm long.
2.4. Ion Sensors with Wide Dynamic Range of Ion Current
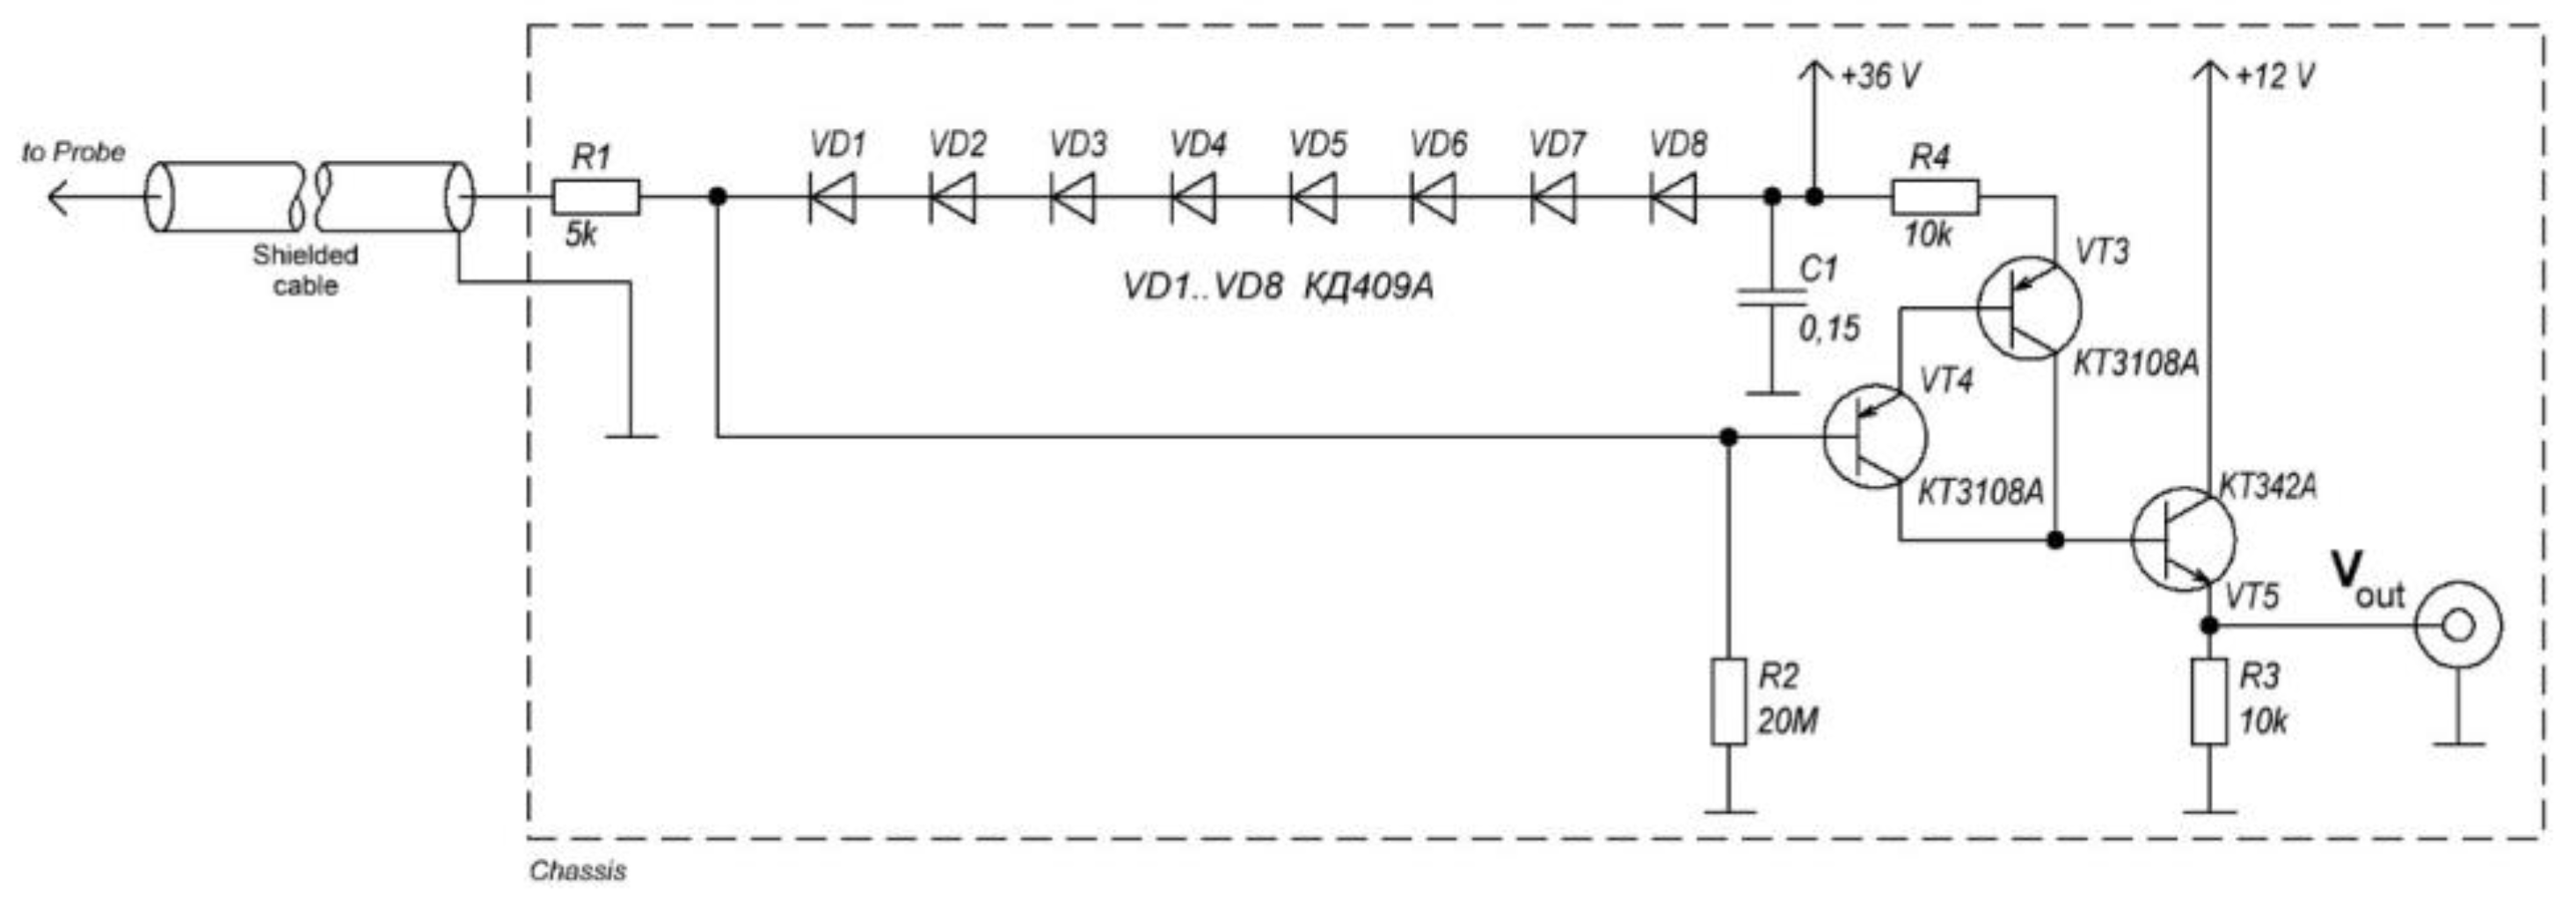
When studying the DDT process with flames and detonations, there is a need for covering a very wide dynamic range of the ion currents measured by the IS. This is due to the fact that the ion currents in laminar flames and in detonation waves differ significantly. Thus, for a detailed study of the DDT process, it is required to record signals in the range from several nA to several mA, i.e., the currents can differ by 4–5 orders of magnitude. The need for increased sensitivity and a wide dynamic range arises, for example, in the study of conductivity during the combustion and detonation of hydrogeneous mixtures and other combustible mixtures with low conductivity. This problem can be solved using an amplifier with hardware logarithm of the sensor current. Figure 7 shows a schematic of an active logarithmic sensor. The circuit provides a dynamic range of the probe with current registration from 5 to 5 A. The output signal of the logarithmic amplifier circuit is optimized for the ADC input with a voltage of 5 V. Transistors in the circuit are selected from the following considerations. The logarithmic amplifier is made in the form of a decision amplifier using the logarithmic properties of the current–voltage characteristic of semiconductor diodes in a wide dynamic range. The voltage on the diode assembly is released on the emitter follower, assembled according to the compound transistor circuit (the well-known Darlington circuit). Then the selected voltage is transmitted according to the current mirror circuit to the output relative to the common point. The selected type of transistors VT3 and VT4 has the necessary p-n-p structure and a sufficiently high maximum collector–emitter voltage of 60 V. These transistors have a noise figure normalized at a frequency of 100 MHz, and most importantly, they are intended for use in logarithmic video amplifiers and high-frequency linear amplifiers. These transistors have low collector reverse current (less than 0.2 μA) and low resistance between the collector and emitter at saturation (less than 25 Ω). The VT5 transistor is selected with a high current gain for accurate signal transmission according to the current mirror circuit. Diodes VD1 to VD8 have the main technical characteristics suitable for a logarithmic link: the operation frequency of the diodes is quite high (50 to 1000 MHz), whereas the differential resistance and capacitance of the diodes are low (on the order of 1 Ω and 2 pF). This allows the reduction of the dynamic errors of the converter amplifier. The use of an eight-diode logarithm makes it easy to average the individual diode characteristics to create identical hardware signal conditioning channels and make optimal use of the ADC’s 5 V input signal range.
2.5. Ion Sensors with High Sensitivity
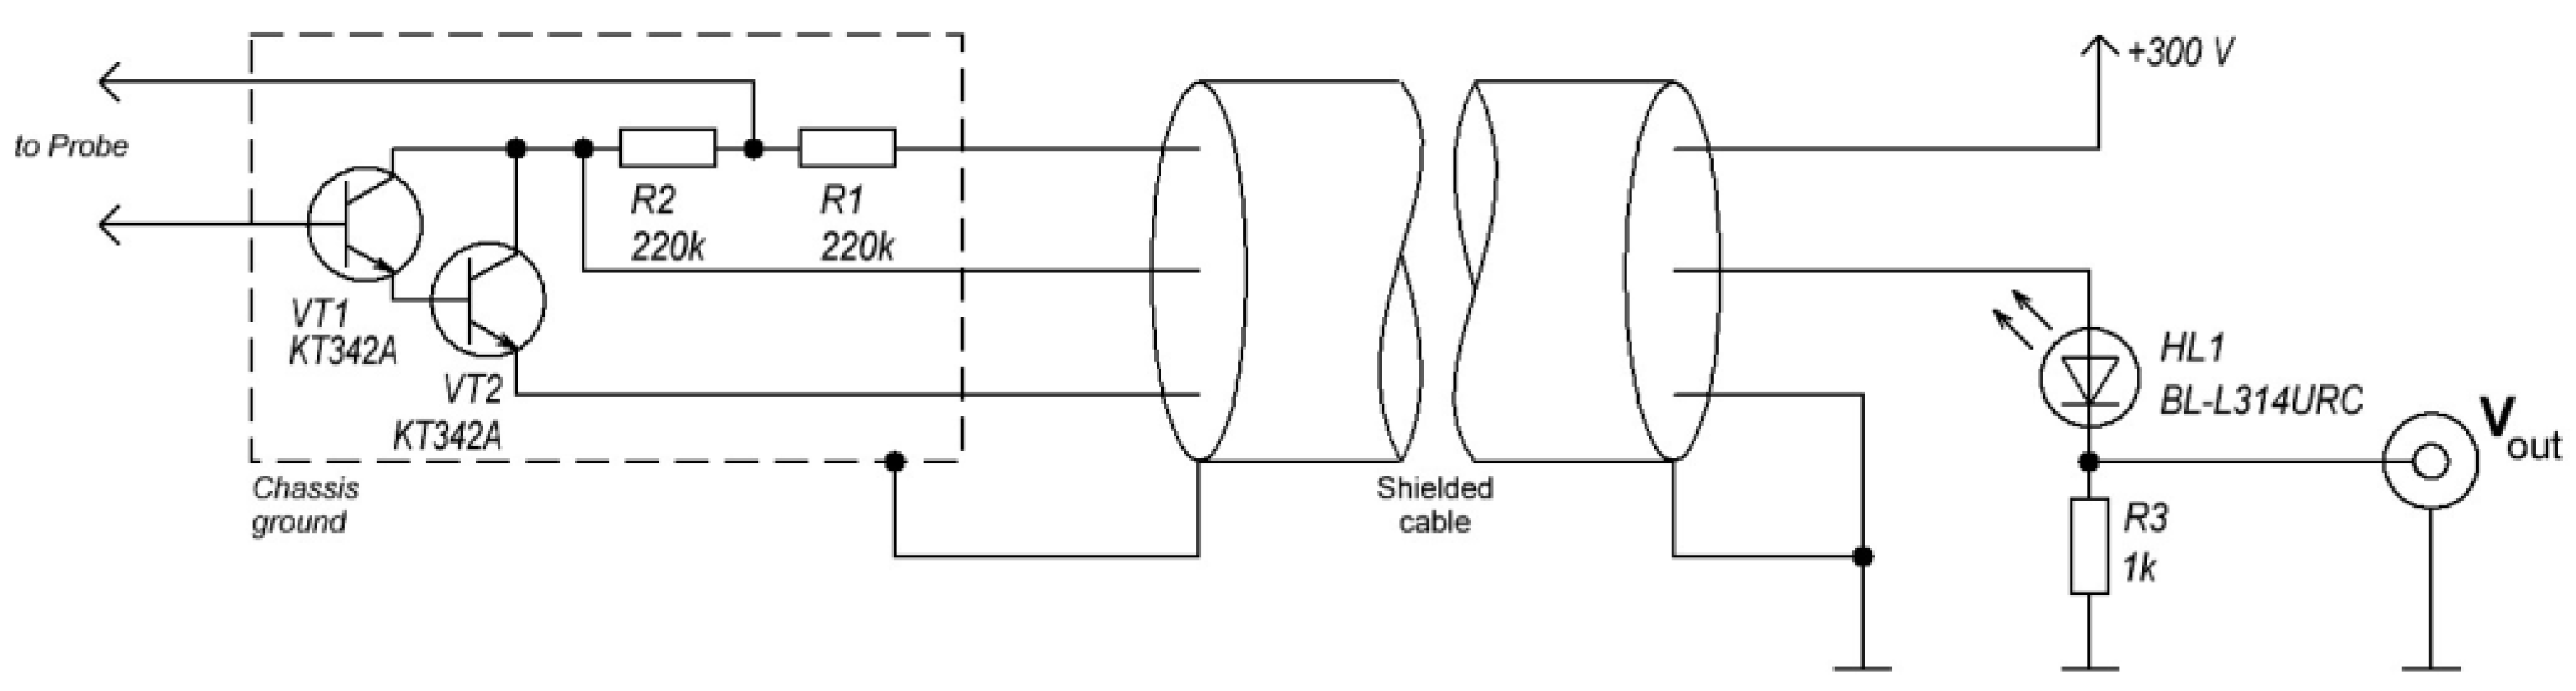
It is also possible to significantly increase the sensitivity of the IS for registering flames with low exothermicity like those propagating in fuel-lean hydrogen–air mixtures. Flame propagation in hydrogen–air mixtures is characterized by very low conductivity associated with very weak chemical ionization. The combustion of fuel-lean hydrogen–air mixtures proceeds at a relatively low flame temperature in the almost complete absence of visible radiation. The study of such flames using ISs requires an increase in their sensitivity by 2–3 orders of magnitude. The electrical circuit of the IS must provide registration of an electrical current of the order of 10 nA. Figure 8 shows a schematic of an active twin IS. The circuit is powered from a stabilized +300 V power source. Directly in the IS, appearing in the form of two needles made of conductive material, there is an electrometric amplifier with two transistors connected according to a composite circuit and a voltage divider similar to that used in the circuit with an external divider (see Figure 4). The electrometric amplifier is complemented by a LED current indicator. The first electrode of the IS is supplied with a voltage of about +150 V from a voltage divider with an internal resistance of about 110 kΩ. The second electrode is connected to an electrometric amplifier, which is powered by a divider current. When the chemical ionization current appears, the output signal current is shunted by the output current of the amplifier. The current amplification factor of the amplifier based on transistors VT1 and VT2 is at least . The maximum saturation current of the amplifier is 30 to 40 nA. The electrometric amplifier is made in the form of an emitter follower assembled according to a composite transistor circuit (Darlington circuit). The shunted circuit of resistors R3 and R4 and LED HL1 is nonlinear; therefore, the proposed circuit is intended solely for indicating the passage of the flame front rather than for quantitative measurement of the chemical ionization current. The symmetrical design of the sensor largely eliminates the issue of sensor polarity. The power supply station contains the power supply itself, as well as the output resistor of the divider and the current indicator on the LED for each channel. The active twin IS is placed in a metal 12 × 1 mm tube 50 mm long. As the flame passes through the sensor, the current increases and the transistors shunt the output circuit. The LED goes out and the output is set to a low voltage close to zero. Due to the high sensitivity of the circuit to small leakage currents, high requirements are placed on insulation. The resistance between the sensor needles must be at least 10 GΩ. The LED allows one to make sure that there are no current leaks and that the IS is ready for operation with a cursory glance at the sensor power station, which is convenient when conducting experiments in the field. It should be noted that this circuit is very sensitive to electromagnetic pickups, and therefore it is necessary to shield the circuit elements and the detonation tube itself from pickups with a frequency of 50 Hz along network cables and from other sources of electrical noise. The circuit shown in Figure 8 allows a sensitivity of around 1 nA to be achieved at a nominal current of 100 nA, which makes it possible to record the passage of a flame through a very lean hydrogen–air mixture containing 12%vol. hydrogen.
2.6. Ion Sensors with High Heat Resistance
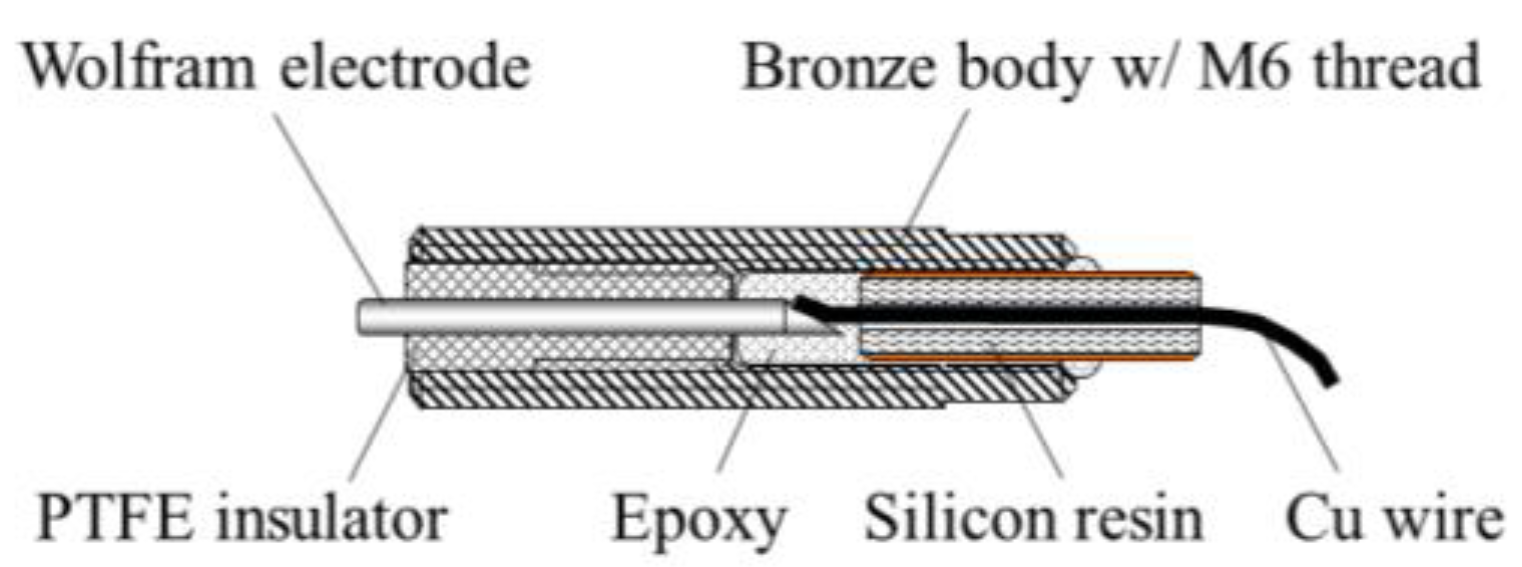
The use of ISs in testing RDEs operating on fuel–oxygen mixtures requires the development of sensors with a special heat-resistant design. Tests with oxygen-containing fuel mixtures are characterized by very high temperatures and very large heat fluxes in the combustor walls. For adequate cooling, the model combustor is often made of copper and cooled with water. The ISs must withstand at least 10,000 cycles of detonation wave passage in several seconds. Figure 9 shows a sketch of the IS design developed for sensing rotating detonations in RDEs operating on fuel–oxygen mixtures. The miniature body of the sensor is made of a bronze alloy (or pure copper) and has an M6 male thread with a total length of 28 mm. The central electrode of the sensor is made of a tungsten rod with a diameter of 1.6 mm, to which an insulated copper wire is soldered. The electrode is pressed into a fluoroplastic sleeve. The wire with silicone high-temperature insulation is additionally fixed in an ebonite bushing. The interior space is filled with epoxy resin. The inside of the case has an incomplete M4 thread for better adhesion and increased strength.
During testing with an annular RDE of outer diameter 100 mm and a gap 5 mm wide, three ISs are usually installed on the RDE combustor wall on a thread flush with the inner surface of the combustor. The thread is sealed with silicone sealant. During operation, the tungsten electrode and fluoroplastic evaporate, preventing rapid sensor burnout. The total operation time of the ISs of this design for the RDEs using gaseous (hydrogen, methane, propane) and liquid (propane–butane, hexane) fuels and gaseous oxygen as an oxidizer was least 10 s at a pressure in the combustion chamber with up to 6 MPa. The use of fluoroplastic as a sensor insulator instead of ceramics when testing RDEs, despite the small resource, has undeniable advantage: while maintaining its dielectric properties, it is less subject to carburization when RDE operates on fuel-rich mixtures due to its evaporation.
3. Results and Discussion
3.1. Sensing of Fuel-Lean Hydrogen–Air Flames
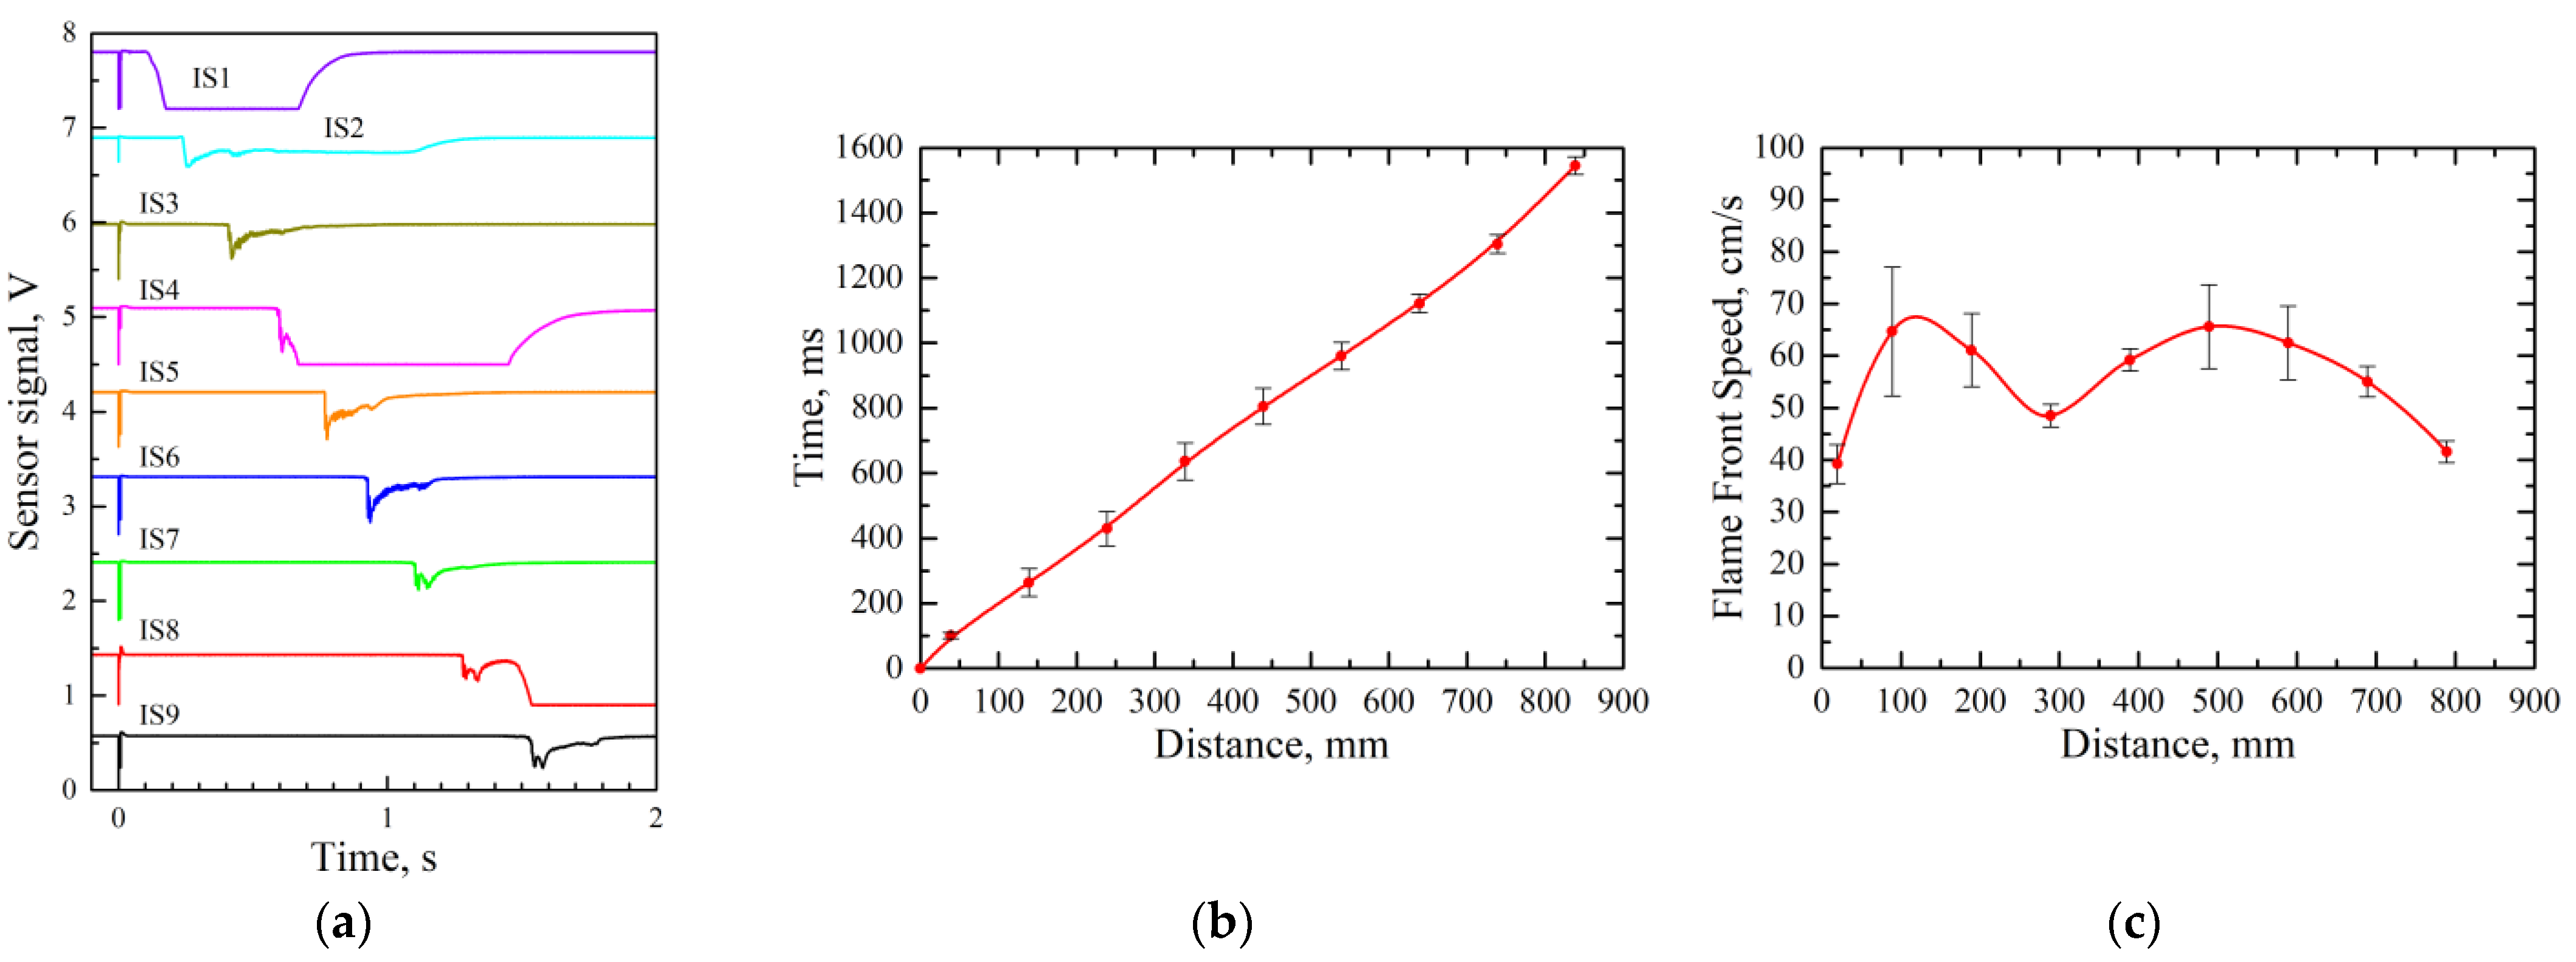
Due to the very low visibility of fuel-lean hydrogen–air flames [40], various methods of optical emission spectroscopy are usually used for flame detection. Herein, ISs with high sensitivity (see Section 2.5) were used to study the propagation of a flame through fuel-lean hydrogen–air mixtures in a transparent PMMA tube 20 mm in inner diameter (30 mm in outer diameter) and a length of 972 mm. One end of the tube was closed, whereas the other end was open to the atmosphere. As an example, consider experiments with a hydrogen content in the mixture of 12%vol. The mixture was supplied to the tube through the opening in its closed end, while ignition was triggered near the open end: the igniter electrodes were deepened into the tube by 28 mm from the open end. Each experiment was repeated seven times. Table 2, Table 3 and Table 4 show the measuring segments and IS locations (Table 2), measured values of mean (averaged over all experiments) time and RMS for flame arrival at each IS (Table 3), and calculated mean flame velocities at all measuring segments (Table 4).
Figure 10 shows signals of nine ISs in one of seven experiments (Figure 10a), the time–distance diagram (Figure 10b), and the mean flame velocity along the tube (Figure 10c). The measured mean flame propagation velocity was 40 to 80 cm/s. The flames were noticeably elongated and oscillating, i.e., they were not flat and their surface area changed with time. This was the reason why the measured mean flame velocity was a factor two to four times larger than the laminar flame velocity reported in the literature. Thus, the value reported in [41] for the same mixture was (20 ± 2) cm/s, whereas the value reported in [42] was 14–22 cm/s. It is worth noting that the sensitivity of conventional ion sensors (see Section 2.2) in these experiments was not sufficient for detecting the flame passage. Due to the high sensitivity of the used ISs and different gain factors (different transistors had a gain spread), the voltage signal of some ISs remained low after the flame passage, thus indicating that the sensor signal was saturated. Moreover, as a result of hydrogen combustion, water was formed and deposited on the tube walls. The interaction of water with available impurities led to the formation of weak electrolytes, which caused sensor short circuits.
3.2. Sensing of Deflagration-to-Detonation Transition
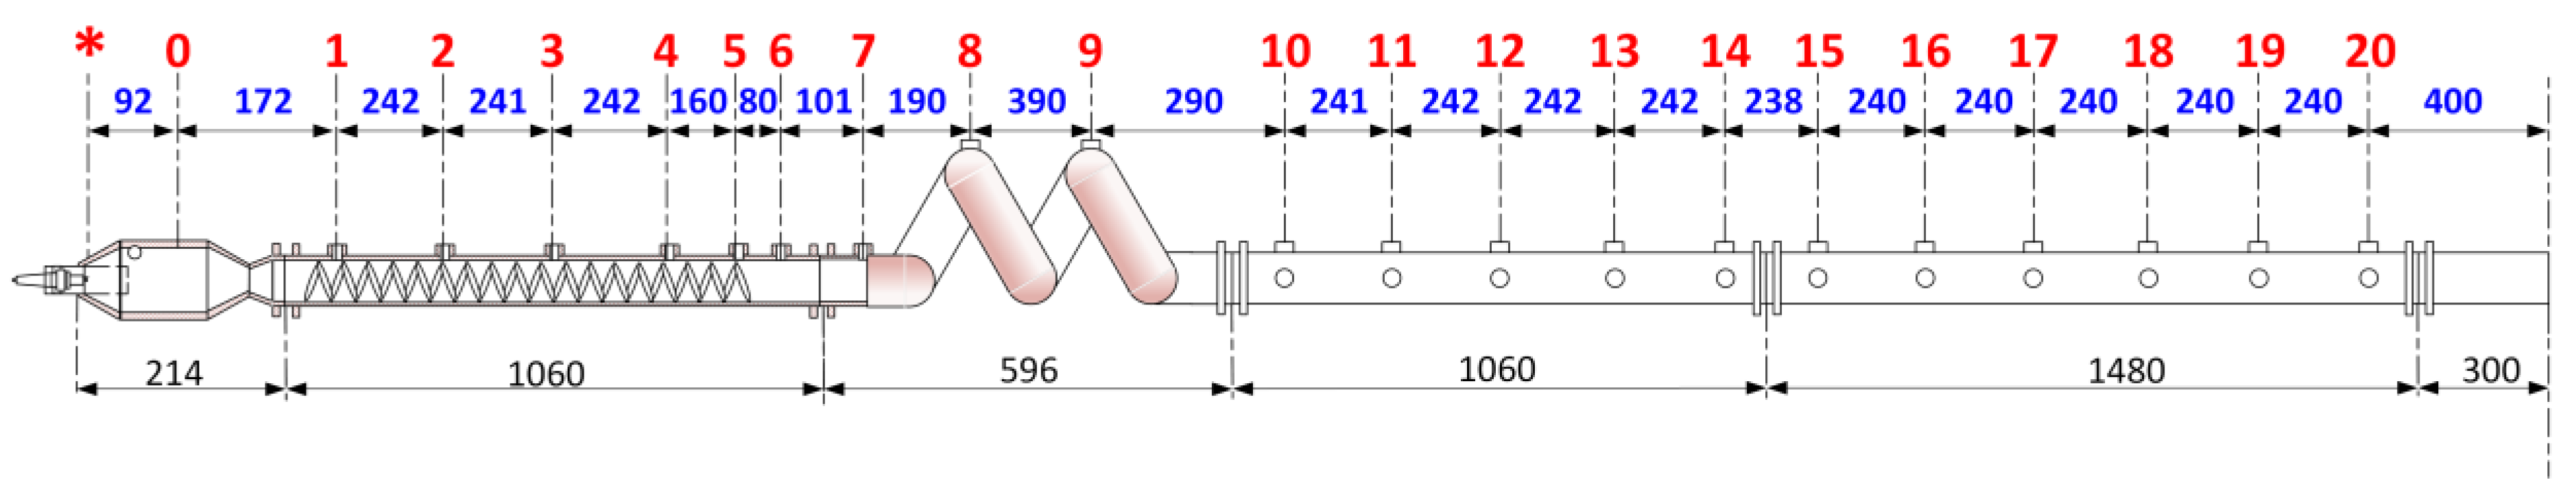
Figure 11 shows a schematic of the pulse-detonation tube (PDT) used for systematic experimental studies of DDT in premixed stoichiometric methane–air [43], propane–air [44], and ethylene–air [45] mixtures diluted with hydrogen, with the hydrogen dilution ratio changing from 0 to 1. The PDT was 50 mm in diameter. It was composed of a prechamber with the inlet valve and spark plug (asterisk in Figure 11) and three sections: flame acceleration, shock focusing, and measuring section. The PDT was equipped with control and data acquisition systems. The volume of test mixture stored in the mixer was intended for five successive “shots” of the PDT. A fuel–air mixture was first blown through the tube until the gas volume was four times the tube volume. Then the inlet valve in the prechamber was closed; the fuel–air mixture was ignited, and the arising flame transmitted to the flame acceleration section with a Shchelkin spiral. The spiral was 940 mm long. It was made of steel wire 6.7 mm thick with a pitch of 24 mm. The flame accelerated and generated a lead shock wave of increasing intensity ahead of the flame. Thereafter the shock wave and succeeding flame transmitted to the shock-focusing section. This was a double-coil helical tube with coil outer and inner diameters of 136 and 36 mm, respectively, and a pitch of 220 mm. The lead shock wave formed by accelerating flame was subject to reflections and gasdynamic focusing in the helical section, thus promoting DDT according to [46]. The measuring section was a 2.8 m long straight smooth-walled tube with an open end. The tube was equipped with multiple dual measuring ports for high-frequency pressure sensors (PSs) and ISs in each cross section (numbered in red in Figure 11). Ion sensors had a wide dynamic range of ion current (see Section 2.4) and a response time of 2 μs.
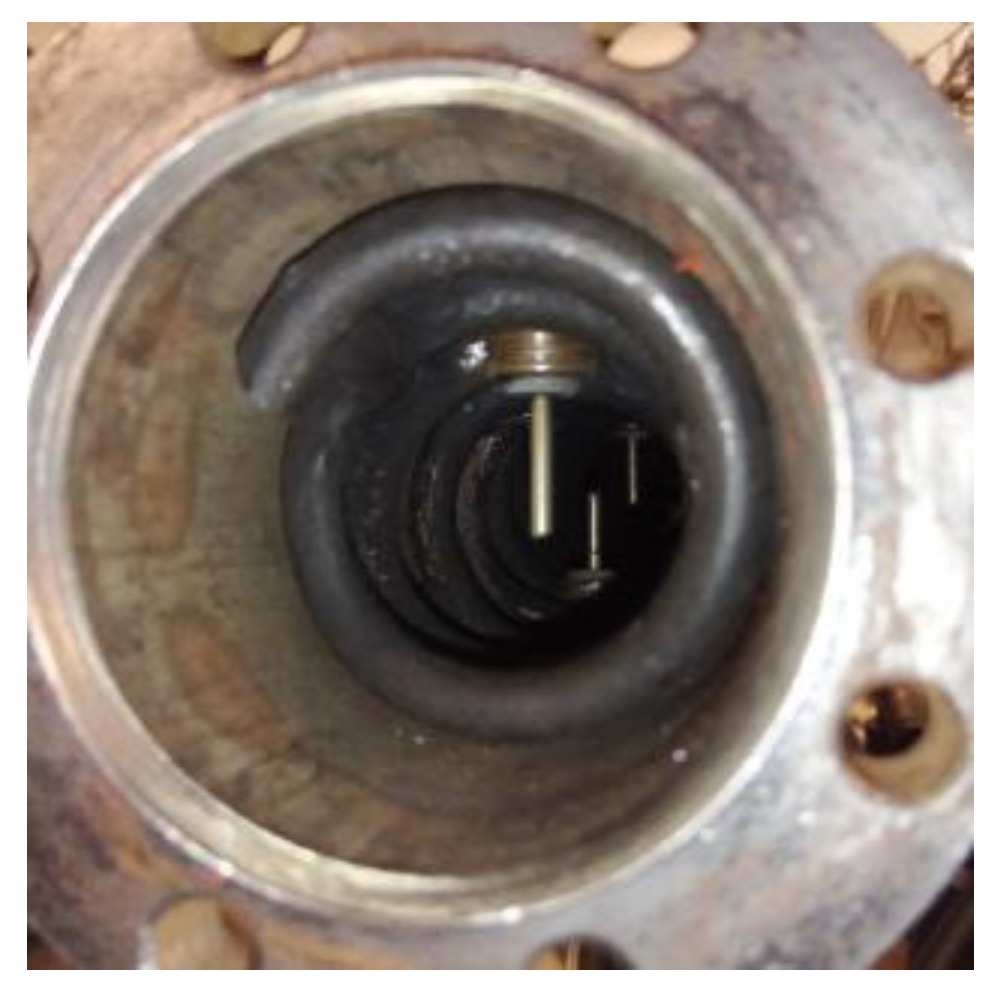
Figure 12 shows a photo of the tube section with the Shchelkin spiral taken from the end of the section before assembling the installation. The photo shows the first few turns of the spiral and three ISs. The ISs were installed between the turns of the spiral. The design of the ISs was axial with the central electrode brought to the axis of the tube, i.e., the length of the electrode protruding from the sensor was 25 mm for short sensors installed flush with the inner wall of the tube (the length of the thread on the sensor was 12 mm), and 18–20 mm for sensors converted from automobile spark plugs with a long thread of 19 mm (see Figure 2d).
In experiments with the binary methane–hydrogen fuel, interesting effects associated with near-limiting modes of detonation propagation were observed. As an example, we consider herein only two experiments (529#2 and 529#5) from a series of five shots with the same stoichiometric fuel–air mixture. The fuel was composed of 65%vol. methane and 35%vol. hydrogen. This was exactly the test mixture for which a significant increase in the DDT run-up time and distance was observed in the experiments [43]. Moreover, experiments with such a test mixture exhibited the maximum scatter in the DDT run-up time and distance, i.e., the system was very sensitive to initial parameters.
Due to certain unknown circumstances, in one of the considered experiments, namely 529#2, the DDT was not obtained. On the contrary, in the other experiment, namely 529#5, the DDT was registered, and the arising detonation wave propagated steadily in the measuring section at the velocity close to the thermodynamic Chapman–Jouguet (CJ) detonation velocity = 1821 m/s. Thus, at the measuring segments between ports 17 and 18, 18 and 19, and 19 and 20 in Figure 11, the measured detonation velocity was = 1875 m/s, = 1800 m/s, and = 1850 m/s, respectively. The estimated measurement error of the detonation velocity was less than 2%. Figure 13a shows the dependences of the shock wave and reaction front velocities on the distance along the pulse-detonation tube. For the sake of convenience, Figure 13b shows the corresponding time–distance diagram. The velocities are calculated based on the time taken for the lead shock wave and reaction front to pass the known distance between the measuring ports. Closed symbols correspond to the shock wave propagation velocity, , determined from the PS measurements, whereas open symbols correspond to the reaction front propagation velocity, , determined from the IS measurements. Additionally, Figure 13a indicates the levels of the sound speed in the initial mixture (), sound speed in the detonation products (), and the CJ detonation velocity (). The vertical dotted lines mark the position of the helical section.
It can be seen from Figure 13 that, in the two experiments under consideration, the velocities at the initial stage of flame propagation do not differ at all. They begin to differ noticeably after the waves pass through the first coil of the helical section. At the exit from the helical section, there is an extended distance where the lead shock wave velocity remains almost constant: about 1200 m/s for experiment 529#2 and about 1400 m/s for experiment 529#5. It is worth noting that, in both cases, there is a significant fluctuation in the apparent velocity of the reaction front. The reaction front either accelerates and approaches the lead shock wave (its propagation velocity is getting higher than the shock wave velocity) or slowly decelerates (its propagation velocity is getting lower than the shock wave velocity). In the course of such velocity oscillations, layer-to-layer relay-race mixture ignition in the turbulent flame brush can be replaced, under proper conditions, by the spontaneous ignition of a certain volume of the unreacted mixture between the shock wave and flame front. In this case, the rates of energy release and chemical processes as a whole can become much higher than those inherent even in the steadily propagating detonation wave. Such an event must be accompanied by an increase in the concentration of active centers, in particular ions, and, consequently, this must also affect the gas conductivity.
Figure 14 shows pressure and conductivity records. The latter were obtained by processing voltage signals from ISs. When recalculating the initial output voltage signal from an IS, , into the conductivity of the interelectrode section of a sensor, the following values were used:
which were obtained on the assumption that all resistances of the same type in the converter were ideal and identical, and their ratings were 510 kΩ and 4.7 kΩ, while the voltage supplied to the resistive divider was constant and equal to 310 V.
After the wave exited from the helical section of the tube (see sensors’ records P10 and S10 in port 10 in Figure 14), in both experiments, one can see somewhat similar pressure and conductivity records despite the strong difference in wave velocities (and, consequently, difference in gas temperatures). The time delay, i.e., the time interval the reaction front lags behind the lead shock wave, plays a significant role. In experiment 529#5, the time delay is obviously shorter. Despite some similarity, the profiles themselves are different. In experiment 529#2, the rise in conductivity starts only behind the front of the secondary shock wave, whereas in experiment 529#5, two fronts are visible on the conductivity signal, which correspond to the lead and secondary shock waves. On the next two sensors in ports 11 (P11, S11) and 12 (P12, S12), the signals differ little from each other, except for the time delay between the reaction front and the lead shock wave. An interesting picture is seen on the records in port 13 (P13, S13). Comparing the figures on the left and right, it can be noted that the figure on the left exhibits a smaller shock wave amplitude (by a factor of 1.5), a longer time delay between the reaction front and the lead shock wave (120 µs vs. 40 µs), and a lower maximum conductivity (by a factor of two). Moreover, the conductivity signal on the right has a distinct peak with a sharp rise and fall, while the decrease in the conductivity signal corresponds to a decrease in pressure. This can be treated as an example of the coherent propagation of the lead shock wave and the reaction front: reaction is accelerated due to shock compression, whereas chemical energy release supports the propagation of the lead shock wave. Interestingly, the sensor records in port 14 (P14, S14) become again somewhat similar, but there are important differences. The amplitude of the lead shock wave on the right figure is seen to be higher, and the time delay between the conductivity signal and the lead shock wave is shorter. The qualitative change in the evolution of sensor signals in the experiments under consideration appears in port 15 (P15, S15). This port is located in the place where the lead shock wave velocity jumps from 1400 to 2000 m/s in Figure 13a. For this port, the figure on the right (see Figure 14) indicates the detonation onset behind the lead shock wave through the stage of overdriven detonation [47]. In this wave, the pressure and reaction fronts merge, i.e., the chemical reaction proceeds in the self-ignition mode behind a strong secondary shock wave. Finally, in ports 16 (P16, S16) and 17 (P17, S17), one can see the propagation of the developed detonation wave along the tube. The characteristic pressure oscillations behind the detonation front indicate that the detonation wave propagates in the mode of near-critical spinning detonation. In this mode, both the lead pressure peak and gas conductivity registered by PSs and ISs can change considerably depending on the proximity of the spin head to the corresponding sensors.
Similar measurements of propagating reaction fronts and pressure waves in a detonation tube during DDT in methane–air mixtures were reported in [48], wherein photodiodes were used instead of ISs. Detonation was also identified based on two characteristics: (1) the steady-state shock wave velocity and (2) the coincidence of the arrival of the shock front and flame luminosity front to a particular section of the tube. Combining the results of [43,48], one can conclude that the simultaneous triggering of ISs and PSs in the detonation wave indicates that the ISs of proposed design can be robustly used for monitoring detonation waves in PDEs.
3.3. Sensing of Rotating Detonations in Rdes
The operation of ISs depends on the density (pressure) of the medium. So, when studying the operation of hydrogen-fueled RDEs at the inlet total pressures 110–230 kPa, the sensor signal (conductivity) decreases greatly as the static pressure in the chamber decreases significantly. Figure 15 shows a model of the RDE studied in [49,50]. The model ensured the deceleration of the incoming supersonic airflow to a flow with a maximum local Mach number of M ~ 2.5 in the minimum section of the intake. In the expanding annular combustor, the air flow accelerated to M ~ 4. The outer diameter of the combustor was 310 mm. The total length of the RDE was 540 mm.
To guarantee detonative combustion in the RDE, a provision was made for throttling the flow in the combustor outlet section by connecting throttling disks to the central body. Such disks blocked the outlet cross section of the combustor by 30 to 50%. Hydrogen was fed to the combustor through the belt of 200 radial fuel nozzles 0.8 mm in diameter uniformly distributed in the central body 10 mm downstream from the minimum section of the intake. Hydrogen was supplied from the hydrogen receiver through the manifold equipped with a high-speed pneumatic valve. The manifold entered the RDE through the tail tube.
The data acquisition system included ISs, low-frequency (~1 kHz) static and total PSs at the combustor inlet and outlet, strain gauges for thrust measurements, Schlieren photography, and high-speed digital video cameras. The ISs with high heat resistance (see Section 2.6) and response time 2 μs intended for measuring the conduction current in hot combustion products were introduced into the combustor in such a way that the distance between the thin bare end of the sensor and the combustor wall was about 1 mm. Twelve ISs were installed in the central body of the combustor (see Figure 15): 6 ISs were placed evenly around the circumference at a distance of 40 mm downstream from the hydrogen supply nozzles, and 7 ISs (1 sensor was common with the sensors located in the circumferential direction) were placed evenly along the generatrix of the central body with a pitch of 30 mm. From now on, these two lines of ISs will be referred to as the circumferential and axial lines, respectively. The numbering of the sensors starts from the common sensor and proceeds counterclockwise for the circumferential line and downstream for the axial line. Such a measuring system allowed us to identify the mode of detonative combustion and to measure the characteristic frequency of the operation process, as well as the velocity and direction of detonation propagation. Moreover, it allowed distinguishing between detonative and deflagrative combustion. However, under the conditions considered herein, deflagrative combustion of hydrogen was not observed at all.
To start the operation process in the combustor, a hydrogen–oxygen detonator was used. The detonator was mounted on the outer wall of the combustor. After the control signal was applied to trigger the detonator, the generated detonation wave entered the annular gap of the combustor. The time of detonator triggering was properly synchronized with the opening of the fast-response shutter of the wind tunnel and with the opening of the hydrogen supply valve in the combustor. The operation process in the combustor was initiated once the flow rates of air and hydrogen reached the constant values preset by the program of the experiment. Hydrogen was supplied to the combustor during the time interval of 150 ms: the operation process was examined during just such an interval. The operation modes and features of these modes were described in detail in [49,50]. We show herein how the conductivity changes when the detonation wave rotates in the annular gap at different values of the inlet total pressure (Table 5) and at different air-to-fuel ERs (from 0.5 to 1.5). The stagnation temperature in all tests was 300 K. As seen from Table 5, the mass flow rate of air at the inlet to the combustor was changed almost four times. The ADC signal was recorded at a sampling rate of 100,000 samples per second, i.e., with a resolution of 10 μs.
The records of ISs were analyzed using a code for automatic data processing. The algorithm of processing such records included:
1. Selection of a block of experimental record with a duration of 100 ms in the steady-state mode of combustor operation
2. Determination of the frequency of the operation process using the selection of the characteristic frequency by the Fourier transform
3. Determination of the maximum amplitude of the signal at each period of the operation
4. Determination of the average parameters of the sensor signal (amplitude, signal growth rate)
5. Determination of the average parameters of the sensor signals for each operating point in the tests.
An example of a single IS record is shown in Figure 16. The part of the record marked in red corresponds to the steady-state mode of combustor operation. Figure 17 shows a fragment of the records of six ISs in the circumferential line, indicating the rotation of a detonation wave at a tangential velocity approximately corresponding to the slope of the dashed lines (about 1100 m/s). According to the Fourier transforms of all ISs readings, the rotation frequency of the detonation wave measured by the ISs was 1130 Hz. The same rotation frequency was registered by high-frequency pressure transducers installed at the outer combustor wall. It is worth mentioning that the IS-based measurements of the detonation rotation frequency correlated well not only with pressure–pulsation frequencies but also with acoustic pulsations measured by microphones installed remotely at the combustor exit [26].
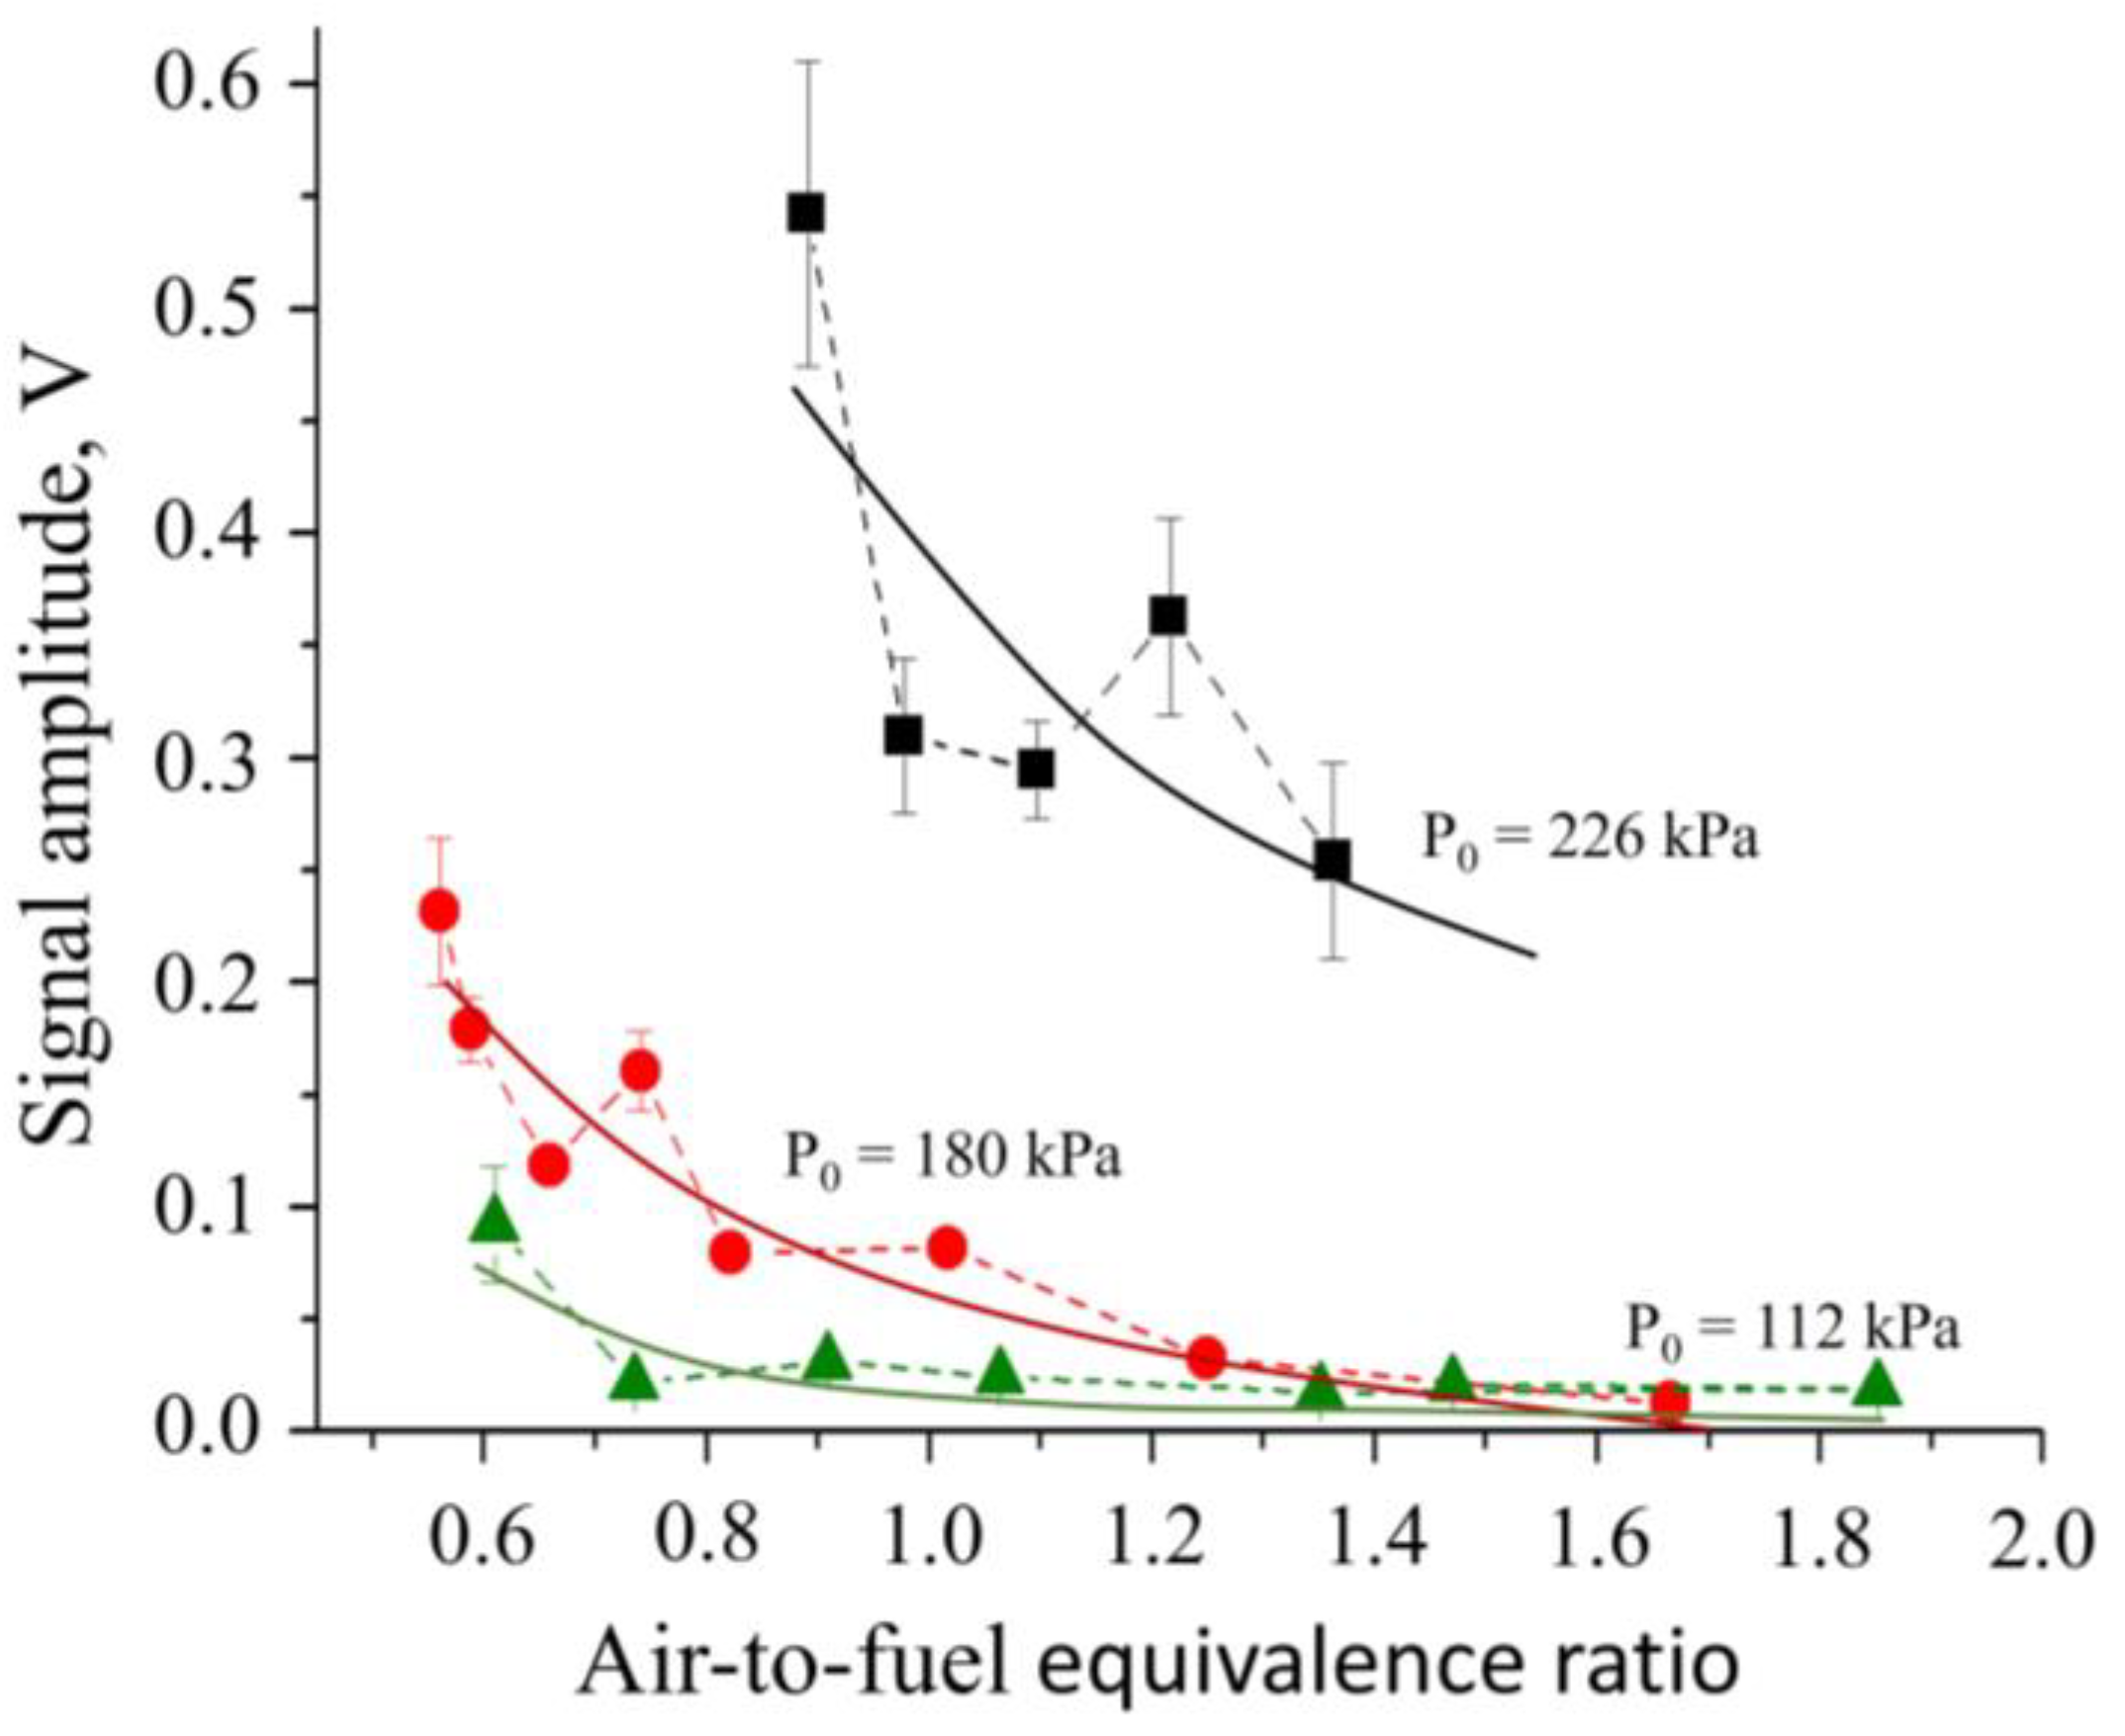
Figure 18 shows the obtained dependences of the average signal amplitude on the air-to-fuel ER for combustor operation in a detonation mode at total pressures 226, 180, and 112 kPa. As a measurement error, the RMS deviation of the signal from the mean value was used. The curves in Figure 18 show a significant nonlinear dependence of the signal amplitude on the stagnation pressure of the air entering the RDE combustor. As the composition of the fuel–air mixture approaches the lean limit, the signal amplitude drops significantly. The conductivity of detonation products of near-stoichiometric hydrogen–air mixtures changes drastically from about at a total pressure of 226 kPa to at 180 kPa, and to at 112 kPa.
4. Conclusions
The emerging propulsion technology utilizing controlled detonations of gaseous or liquid fuels needs robust sensors for control systems. The use of conventional sensors for chemically aggressive high-temperature high-velocity gas-dynamic flows (thermocouples, high-frequency pressure transducers, optical sensors, photomultipliers, laser detectors, etc.) is either problematic or requires special adaptation. To ensure the reliable sensing of the operation process parameters in continuous and pulsed detonation power plants, the efficient method based on the formation of charged particles during combustion/detonation of gases and liquid sprays (chemical ionization) can be applied. Charged particles can be detected by ion sensors, which are widely used in spark-ignition piston engines for detecting knock, misfire, flame flashback, etc. The ion sensor appears as a needle made from a refractory metal and insulated from the housing. One of the ends (stripped one) of the needle is introduced into the combustor. The other end of the needle is soldered to a shielded cable connected through electrical resistance to an analog-to-digital converter of the data acquisition system. Distributed ion sensors are intended for detecting the combustion mode (deflagration or detonation), apparent propagation velocity of the reaction front (subsonic or supersonic), duration of heat release, etc., by measuring the conduction current in the medium. The manuscript presents the design and operation principle of ion sensors, as well as examples of sensor applications in sensing deflagration-to-detonation transition in pulsed detonation engines and developed detonations in rotating detonation engines. The electrical circuits for ion sensors without and with intermediate amplifiers, with short response time and high sensitivity, as well as with the very wide dynamic range of operation in the reactive media with highly variable temperature and pressure are provided and discussed. The main advantages of ion sensors are their very short response time of about 1 μs, versatility of design, and capability of detecting and monitoring reaction fronts of different intensities directly in combustion chambers.
Author Contributions
Conceptualization, S.M.F.; methodology, I.O.S. and V.S.A.; software, I.O.S. and V.S.I.; formal analysis, I.O.S. and V.S.I.; investigation, I.O.S., V.S.A. and V.S.I.; data curation, I.O.S. and V.S.I.; writing—original draft preparation, S.M.F. and I.O.S.; writing—review and editing, S.M.F. and P.A.V.; supervision, S.M.F.; project administration, S.M.F.; funding acquisition, S.M.F. All authors have read and agreed to the published version of the manuscript.
Funding
This research was supported by a subsidy given to Semenov Federal Research Center for Chemical Physics of the Russian Academy of Sciences to implement the state assignment with registration number 122040500073-4.
Data Availability Statement
The data will be available on request.
Conflicts of Interest
The authors declare no conflict of interest.
Abbreviations
| ADC | Analog-to-digital converter |
| CE | Closed end |
| CJ | Chapman–Jouguet |
| DC | Direct current |
| DDT | Deflagration-to-detonation transition |
| ER | Equivalence ratio |
| HCCI | Homogeneous charge compression ignition engine |
| IS | Ion sensor |
| OE | Open end |
| PDE | Pulsed detonation engine |
| PDT | Pulsed detonation tube |
| RDE | Rotating detonation engine |
| SI | Spark ignition |
| SP | Spark position |
References
- Calcote, H.F. Electric properties of flames: Burner flames in transverse electric fields. Proc. Combust. Inst. 1949, 3, 245–253. [Google Scholar] [CrossRef]
- Pergament, H.S.; Calcote, H.F. Thermal and chemi-ionization processes in afterburning rocket exhausts. Proc. Combust. Inst. 1967, 11, 597–611. [Google Scholar] [CrossRef]
- Semenov, E.S.; Sokolik, A.S. Thermal and chemical ionization in flames. Combust. Explos. Shock Waves 1970, 6, 33–43. [Google Scholar] [CrossRef]
- Berry, R.S. The theory of penning ionization. Radiation Res. 1974, 59, 367–375. [Google Scholar] [CrossRef] [PubMed]
- Fialkov, A.B. Investigations on ions in flames. Prog. Energy Combust. Sci. 1997, 23, 399–528. [Google Scholar] [CrossRef]
- Jones, D.; Kaufman, M. Combustion of hydrocarbons in purified fluorine. Combust. Flame 1987, 67, 217–221. [Google Scholar] [CrossRef]
- Davidchuk, E.L.; Mal’tsev, V.M.; Rogachev, A.S. Ionization mechanism in ethylene-nitrogen oxide flames. Combust. Explos. Shock Waves 1980, 16, 630–633. [Google Scholar] [CrossRef]
- Kern, R.D.; Singh, H.J.; Xie, K. Identification of chemi-ions formed by reactions of deuterated fuels in the reflected shock zone. J. Phys. Chem. 1990, 94, 3333–3335. [Google Scholar] [CrossRef]
- Vlasov, P.A.; Zhiltsova, I.V.; Smirnov, V.N.; Tereza, A.M.; Agafonov, G.L.; Mikhailov, D.I. Chemical ionization of n-hexane, acetylene, and methane behind reflected shock waves. Combust. Sci. Techn. 2018, 190, 57–81. [Google Scholar] [CrossRef]
- Bulewicz, E.M. Correlation between chemi-ionization in flames containing organic fuels and the heat of oxidation of the carbon in the fuel molecule. Nature 1966, 211, 961–963. [Google Scholar] [CrossRef]
- Bertrand, C.; van Tiggelen, P.J. Ions in ammonia flames. J. Phys. Chem. 1974, 78, 2320–2326. [Google Scholar] [CrossRef]
- Lawton, J.; Weinberg, F.J. Electrical Aspects of Combustion; Clarendon Press: Oxford, UK, 1969. [Google Scholar]
- Chung, P.M.; Talbot, L.; Touryan, K.J. Electric Probes in Stationary and Flowing Plasmas: Theory and Application; Springer: Berlin/Heidelberg, Germany, 1975. [Google Scholar]
- Dev, S.; Sandhu, N.S.; Ives, M.; Yu, S.; Zheng, M.; Tjong, J. Ion Current Measurement of Diluted Combustion Using a Multi-Electrode Spark Plug; SAE Technical Paper 2018-01-1134; SAE International: Warrendale, PA, USA, 2018. [Google Scholar] [CrossRef]
- Naoumov, V.; Krioukov, V.; Abdullin, A.; Demin, A. Combustion and ionization in spark ignition engines. In Chemical Kinetics in Combustion and Reactive Flows: Modeling Tools and Applications; Cambridge University Press: Cambridge, UK, 2019; pp. 380–396. [Google Scholar] [CrossRef]
- Wang, J.; Shi, J.; Deng, J.; Miao, X.; Liu, Y.; Pan, S.; Li, L. Misfire and knock detection based on the ion current inside a passive pre-chamber of gasoline engine. Fuel 2022, 311, 122528. [Google Scholar] [CrossRef]
- Gao, Z.; Li, B.; Li, C.; Liu, B.; Liu, S.; Wu, X.; Huang, Z. Investigation on characteristics of ion current in a methanol direct-injection spark-ignition engine. Fuel 2015, 141, 185–191. [Google Scholar] [CrossRef]
- Wang, X.; Zhou, T.; Dong, Q.; Cheng, Z.; Yang, X. A Virtual combustion sensor based on ion current for lean-burn natural gas engine. Sensors 2022, 22, 4660. [Google Scholar] [CrossRef]
- Henein, N.A.; Badawy, T.; Rai, N.; Bryzic, W. Ion current, combustion and emission characteristics in an automotive common rail diesel engine. J. Eng. Gas Turbines Power 2012, 134, 042801. [Google Scholar] [CrossRef]
- Badawy, T.; Shrestha, A.; Henein, N. Detection of combustion resonance using an ion current sensor in diesel engines. J. Eng. Gas Turbines Power 2012, 134, 052802. [Google Scholar] [CrossRef]
- Mehresh, P.; Souder, J.; Flowers, D.; Riedel, U.; Dibble, R.W. Combustion timing in HCCI engines determined by ion-sensor: Experimental and kinetic modeling. Proc. Combust. Inst. 2005, 30, 2701–2709. [Google Scholar] [CrossRef]
- Ogata, K. Investigation of Robustness Control for Practical Use of Gasoline HCCI Engine—An Investigation of a Detecting Technology of Conditions of HCCI Using an Ion Current Sensor; SAE Technical Paper 2014-01-1279; SAE International: Warrendale, PA, USA, 2014. [Google Scholar] [CrossRef]
- Guangyu, D.; Yulin, C.; Wu, Z.; Li, L.; Dibble, R. Study on the phase relation between ion current signal and combustion phase in an HCCI combustion engine. Proc. Combust. Inst. 2015, 35, 3097–3105. [Google Scholar] [CrossRef]
- Liu, Y.; Li, L.; Ye, J.; Deng, J.; Wu, Z. Ion current signal and characteristics of ethanol/gasoline dual fuel HCCI combustion. Fuel 2016, 166, 42–50. [Google Scholar] [CrossRef]
- Addabbo, T.; Fort, A.; Landi, E.; Mugnaini, M.; Parri, L.; Vignoli, V.; Zucca, A.; Romano, C. Ion current sensor for gas turbine condition dynamical monitoring: Modeling and characterization. Sensors 2021, 21, 6944. [Google Scholar] [CrossRef] [PubMed]
- Frolov, S.M.; Aksenov, V.S.; Dubrovskii, A.V.; Zangiev, A.E.; Ivanov, V.S.; Medvedev, S.N.; Shamshin, I.O. Chemiionization and acoustic diagnostics of the process in continuous- and pulse-detonation combustors. Dokl. Phys. Chem. 2015, 465, 273–278. [Google Scholar] [CrossRef]
- Frolov, S.M.; Aksenov, V.S.; Ivanov, V.S.; Shamshin, I.O. Large-scale hydrogen-air continuous detonation combustor. Int. J. Hydrogen Energy 2015, 40, 1616–1623. [Google Scholar] [CrossRef]
- Saxena, S.; Chen, J.-Y.; Dibble, R.W. Increasing the signal-to-noise ratio of sparkplug ion sensors through the addition of a potassium acetate fuel additive. Proc. Combust. Inst. 2011, 33, 3081–3088. [Google Scholar] [CrossRef]
- Mack, J.H.; Butt, R.H.; Chen, Y.; Chen, Y.; Chen, J.-Y.; Dibble, R.W. Experimental and numerical investigation of ion signals in boosted HCCI combustion using cesium and potassium acetate additives. J. Energy Convers. Manag. 2016, 108, 181–189. [Google Scholar] [CrossRef] [Green Version]
- Prager, J.; Riedel, U.; Warnatz, J. Modeling ion chemistry and charged species diffusion in lean methane–oxygen flames. Proc. Combust. Inst. 2007, 31, 1129–1137. [Google Scholar] [CrossRef]
- Aithal, S.M. Analysis of the current signature in a constant-volume combustion chamber. Combust. Sci. Techn. 2013, 185, 336–349. [Google Scholar] [CrossRef]
- Dong, G.; Lu, H.; Wu, Z.; Dibble, R.; Li, L. Effect of electric fields on the ion current signals in a constant volume combustion chamber. Proc. Combust. Inst. 2018, 37, 4865–4873. [Google Scholar] [CrossRef]
- Song, Z.; Zhang, X.; Hou, X.; Hu, S. Relationship of the combustion characteristics of natural gas-hydrogen/carbon dioxide mixtures with the ion current and pressure parameters. J. Energy Inst. 2019, 92, 1014–1022. [Google Scholar] [CrossRef]
- Song, Z.; Zhang, X.; Zhang, J.; Cao, J. Predicting the heat release rate of ion current combustion process fuelled with hydrogen/carbon dioxide and natural gas. J. Energy Eng. 2019, 145, 04018068. [Google Scholar] [CrossRef]
- Huang, Y.; Tang, H.; Li, J.; Wang, J. Deflagration-to-detonation transition of kerosene–air mixtures in a small-scale pulse detonation engine. Proc. Inst. Mech. Eng. Part G J. Aerospace Eng. 2011, 225, 441–448. [Google Scholar] [CrossRef]
- Chin, H.M.; Cuppoletti, D.R.; Ombrello, T.M.; Ahmed, K.A.; Rein, K.D. Energy deposition characteristics of a pulsed detonation igniter through geometric manipulation. Combust. Flame 2021, 229, 111384. [Google Scholar] [CrossRef]
- Wu, Y.-W.; Han, Q.-X.; Zhao, W. Experimental research on a rotary-valved air-breathing pulse detonation engine. Proc. Inst. Mech. Eng. Part G J. Aerosp. Eng. 2016, 230, 1325–1333. [Google Scholar] [CrossRef]
- Ma, J.Z.; Luan, M.-Y.; Xia, Z.-J.; Wang, J.-P.; Zhang, S.; Yao, S.; Wang, B. Recent progress, development trends, and consideration of continuous detonation engines. AIAA J. 2020, 58, 4976–5035. [Google Scholar] [CrossRef]
- Plouraboué, F. Flying with ionic wind. Nature 2018, 563, 476–477. [Google Scholar] [CrossRef] [PubMed] [Green Version]
- Schefer, R.W.; Kulatilaka, W.D.; Patterson, B.D.; Settersten, T.B. Visible emission of hydrogen flames. Combust. Flame 2009, 156, 1234–1241. [Google Scholar] [CrossRef] [Green Version]
- Egolfopoulos, F.N.; Law, C.K. An experimental and computational study of the burning rates of ultra-lean to moderately-rich H2/O2/N2 laminar flames with pressure variations. Proc. Combust. Inst. 1990, 23, 333–340. [Google Scholar] [CrossRef]
- Krejci, M.C.; Mathieu, O.; Vissotski, A.J.; Ravi, S.; Sikes, T.G.; Petersen, E.L.; Kérmonès, A.; Metcalfe, W.; Curran, H.J. Laminar flame speed and ignition delay time data for the kinetic modeling of hydrogen and syngas fuel blends. ASME J. Eng. Gas Turbines Power 2013, 135, 021503. [Google Scholar] [CrossRef]
- Shamshin, I.O.; Kazachenko, M.V.; Frolov, S.M.; Basevich, V.Y. Deflagration-to-detonation transition in stochiometric mixtures of the binary methane–hydrogen fuel with air. Int. J. Hydrogen Energy 2021, 46, 34046–34058. [Google Scholar] [CrossRef]
- Shamshin, I.O.; Kazachenko, M.V.; Frolov, S.M.; Basevich, V.Y. Deflagration-to-detonation transition in stochiometric propane–hydrogen–air mixtures. Fuels 2022, 3, 667–681. [Google Scholar] [CrossRef]
- Shamshin, I.O.; Kazachenko, M.V.; Frolov, S.M.; Basevich, V.Y. Transition of deflagration to detonation in ethylene-hydrogen-air mixtures. Int. J. Hydrogen Energy 2022, 47, 16676–16685. [Google Scholar] [CrossRef]
- Frolov, S.M.; Aksenov, V.S.; Basevich, V.Y. Decreasing the predetonation distance in a drop explosive mixture by combined means. Dokl. Phys. Chem. 2005, 401, 28–31. [Google Scholar] [CrossRef]
- Lee, J.H.S. The Detonation Phenomenon; Cambridge University Press: Cambridge, UK, 2008. [Google Scholar]
- Frolov, S.M.; Aksenov, V.S.; Ivanov, V.S.; Medvedev, S.N.; Smetanyuk, V.A.; Avdeev, K.A.; Frolov, F.S. Pulse-detonation burner unit operating on natural gas. Rus. J. Phys. Chem. B 2011, 5, 625–627. [Google Scholar] [CrossRef]
- Frolov, S.M.; Zvegintsev, V.I.; Ivanov, V.S.; Aksenov, V.S.; Shamshin, I.O.; Vnuchkov, D.A.; Nalivaichenko, D.G.; Berlin, A.A.; Fomin, V.M. Wind tunnel tests of a hydrogen-fueled detonation ramjet model at approach air stream Mach numbers from 4 to 8. Int. J. Hydrogen Energy 2017, 42, 25401–25413. [Google Scholar] [CrossRef]
- Frolov, S.M.; Zvegintsev, V.I.; Ivanov, V.S.; Aksenov, V.S.; Shamshin, I.O.; Vnuchkov, D.A.; Nalivaichenko, D.G.; Berlin, A.A.; Fomin, V.M.; Shiplyuk, A.N.; et al. Hydrogen-fueled detonation ramjet model: Wind tunnel tests at approach air stream Mach number 5.7 and stagnation temperature 1500 K. Int. J. Hydrogen Energy 2018, 43, 7515–7524. [Google Scholar] [CrossRef]
Figure 1.
Ion probe design in the form of a (a) needle and (b) spark plug.

Figure 2.
Ion sensors with (a) removed ground electrode; (b) elongated ground and central electrodes; (c) elongated central electrode; and (d) elongated casing and central electrode.
Figure 2.
Ion sensors with (a) removed ground electrode; (b) elongated ground and central electrodes; (c) elongated central electrode; and (d) elongated casing and central electrode.

Figure 3.
Electrical circuit of the simplest ion sensor.

Figure 4.
For the calculation of the ion sensor internal resistance, Rz.

Figure 5.
Electrical circuit of the ion sensor with external divider.

Figure 6.
The design of external divider for the ion sensor.

Figure 7.
Electrical circuit of the active logarithmic ion sensor.

Figure 8.
Electrical circuit of an active twin ion sensor.

Figure 9.
Schematic of the ion sensor for registering detonation waves in RDEs.

Figure 10.
(a) Signals of nine ISs in one of seven experiments with fuel-lean 12%vol. hydrogen–air mixture, (b) the time–distance diagram of flame propagation, and (c) the mean flame velocity along the tube.
Figure 10.
(a) Signals of nine ISs in one of seven experiments with fuel-lean 12%vol. hydrogen–air mixture, (b) the time–distance diagram of flame propagation, and (c) the mean flame velocity along the tube.

Figure 11.
Schematic of the pulsed detonation tube used for systematic experimental studies of DDT in stoichiometric methane–air, propane–air, and ethylene–air mixtures diluted with hydrogen with the hydrogen dilution ratio changing from 0 to 1.
Figure 11.
Schematic of the pulsed detonation tube used for systematic experimental studies of DDT in stoichiometric methane–air, propane–air, and ethylene–air mixtures diluted with hydrogen with the hydrogen dilution ratio changing from 0 to 1.

Figure 12.
The internal view on the tube section with a Shchelkin spiral and ion sensors mounted between spiral turns.
Figure 12.
The internal view on the tube section with a Shchelkin spiral and ion sensors mounted between spiral turns.

Figure 13.
(a) Lead shock wave (closed symbols) and reaction front (open symbols) velocities vs. the distance along the pulsed detonation tube and (b) the corresponding time-distance diagram for two experiments (529#2 and 529#5) with the same stoichiometric methane–hydrogen–air mixture at normal initial conditions. Fuel: 65%vol. methane + 35%vol. hydrogen.

Figure 14.
Pressure (black curves, left scale) and conductivity (red curves, right scale) records of pressure and ion sensors installed in measuring ports from 10 to 17 in two experiments: (a) 529#2 and (b) 529#5 with the same stoichiometric methane–hydrogen–air mixture at normal initial conditions. Conductivity plots are obtained by processing voltage signals from ion sensors. Fuel: 65%vol. methane + 35%vol. hydrogen. Time is counted from ignition triggering.

Figure 15.
Schematic of the RDE.

Figure 16.
An example of the IS record during RDE operation.

Figure 17.
A fragment of the records of 6 ISs in the circumferential line, indicating the rotation of a detonation wave in the annular RDE combustor at a tangential velocity approximately corresponding to the slope of the dashed lines (about 1100 m/s).
Figure 17.
A fragment of the records of 6 ISs in the circumferential line, indicating the rotation of a detonation wave in the annular RDE combustor at a tangential velocity approximately corresponding to the slope of the dashed lines (about 1100 m/s).

Figure 18.
The signal amplitude of the ion sensor vs. the air-to-fuel equivalence ratio in the RDE combustor at different values of total pressure. Solid lines approximate experimental points.
Figure 18.
The signal amplitude of the ion sensor vs. the air-to-fuel equivalence ratio in the RDE combustor at different values of total pressure. Solid lines approximate experimental points.


Table 1.
The list of reactions with charged particles [31].
Table 1.
The list of reactions with charged particles [31].
| No. | Reaction |
|---|---|
| 1 | |
| 2 | |
| 3 | |
| 4 | |
| 5 | |
| 6 |
Table 2.
Measuring segments and ion sensor locations.
| Description | OE | SP | IS1 | IS2 | IS3 | IS4 | IS5 | IS6 | IS7 | IS8 | IS9 | CE |
|---|---|---|---|---|---|---|---|---|---|---|---|---|
| Meas. segment, mm | 0 | 28 | 39 | 100 | 100 | 100 | 100 | 100 | 100 | 100 | 100 | 105 |
| Distance, mm | −28 | 0 | 39 | 139 | 239 | 339 | 439 | 539 | 639 | 739 | 839 | 944 |
Remark: CE = closed end of the tube; SP = spark position (ignition point); OE = open end of the tube.
Table 3.
Data for the time–distance diagram.
| Description | SP | IS1 | IS2 | IS3 | IS4 | IS5 | IS6 | IS7 | IS8 | IS9 |
|---|---|---|---|---|---|---|---|---|---|---|
| Distance, mm | 0 | 39 | 139 | 239 | 339 | 439 | 539 | 639 | 739 | 839 |
| Mean time, ms | 0 | 100 | 264 | 429 | 636 | 805 | 960 | 1122 | 1304 | 1545 |
| RMS, ms | 0 | 9 | 42 | 53 | 57 | 55 | 42 | 29 | 29 | 28 |
Table 4.
Mean flame velocities at measuring segments.
| Measuring Segment | SP–IS1 | IS1–IS2 | IS2–IS3 | IS3–IS4 | IS4–IS5 | IS5–IS6 | IS6–IS7 | IS7–IS8 | IS8–IS9 |
|---|---|---|---|---|---|---|---|---|---|
| Distance, mm | 19.5 | 89.0 | 189 | 289 | 389 | 489 | 589 | 689 | 789 |
| Mean velocity, cm/s | 39.2 | 64.7 | 61.1 | 48.5 | 59.2 | 65.6 | 62.5 | 55.0 | 41.6 |
| RMS, cm/s | 3.7 | 12.4 | 7.0 | 2.2 | 2.1 | 8.1 | 7.1 | 2.9 | 2.1 |
Remark: Estimated error in calculating the mean flame velocity is 1%.
Table 5.
RDE operation parameters.
| No. | Air Mass Flow Rate, kg/s | Inlet Total Pressure, kPa |
|---|---|---|
| 1 | 11.0 | 226 |
| 2 | 8.5 | 180 |
| 3 | 3.4 | 112 |
Disclaimer/Publisher’s Note: The statements, opinions and data contained in all publications are solely those of the individual author(s) and contributor(s) and not of MDPI and/or the editor(s). MDPI and/or the editor(s) disclaim responsibility for any injury to people or property resulting from any ideas, methods, instructions or products referred to in the content. |
© 2023 by the authors. Licensee MDPI, Basel, Switzerland. This article is an open access article distributed under the terms and conditions of the Creative Commons Attribution (CC BY) license (https://creativecommons.org/licenses/by/4.0/).
Share and Cite
MDPI and ACS Style
Frolov, S.M.; Shamshin, I.O.; Aksenov, V.S.; Ivanov, V.S.; Vlasov, P.A. Ion Sensors for Pulsed and Continuous Detonation Combustors. Chemosensors 2023, 11, 33. https://doi.org/10.3390/chemosensors11010033
AMA Style
Frolov SM, Shamshin IO, Aksenov VS, Ivanov VS, Vlasov PA. Ion Sensors for Pulsed and Continuous Detonation Combustors. Chemosensors. 2023; 11(1):33. https://doi.org/10.3390/chemosensors11010033
Chicago/Turabian StyleFrolov, Sergey M., Igor O. Shamshin, Viktor S. Aksenov, Vladislav S. Ivanov, and Pavel A. Vlasov. 2023. "Ion Sensors for Pulsed and Continuous Detonation Combustors" Chemosensors 11, no. 1: 33. https://doi.org/10.3390/chemosensors11010033
Note that from the first issue of 2016, this journal uses article numbers instead of page numbers. See further details here.