Article

Microfluidic Electronic Tongue Applied to Soil Analysis

by
Maria L. Braunger
1,
Flávio M. Shimizu
2,
Mawin J. M. Jimenez
1,
Lucas R. Amaral
3,
Maria H. de Oliveira Piazzetta
4,
Ângelo L. Gobbi
4,
Paulo S. G. Magalhães
3,
Varlei Rodrigues
1,
Osvaldo N. Oliveira
2 and
Antonio Riul
1,*
1
Department of Applied Physics, “Gleb Wataghin” Institute of Physics, University of Campinas—UNICAMP, 13083-859 Campinas, SP, Brazil
2
São Carlos Institute of Physics (IFSC), University of São Paulo (USP), P.O. Box 369, 13566-590 São Carlos, SP, Brazil
3
School of Agricultural Engineering, University of Campinas—UNICAMP, 13083-875 Campinas, SP, Brazil
4
Brazilian Nanotechnology National Laboratory (LNNano), Brazilian Center for Research in Energy and Materials (CNPEM), 13083-970 Campinas, SP, Brazil
*
Author to whom correspondence should be addressed.
Chemosensors 2017, 5(2), 14; https://doi.org/10.3390/chemosensors5020014
Submission received: 24 February 2017 / Revised: 21 April 2017 / Accepted: 25 April 2017 / Published: 27 April 2017
(This article belongs to the Special Issue Bioinspired Chemical Sensing)

Abstract

:
Precision agriculture is crucial for increasing food output without expanding the cultivable area, which requires sensors to be deployed for controlling the level of nutrients in the soil. In this paper, we report on a microfluidic electronic tongue (e-tongue) based on impedance measurements which is capable of distinguishing soil samples enriched with plant macronutrients. The e-tongue setup consisted of an array of sensing units made with layer-by-layer films deposited onto gold interdigitated electrodes. Significantly, the sensing units could be reused with adequate reproducibility after a simple washing procedure, thus indicating that there is no cross-contamination in three independent sets of measurements. A high performance was achieved by treating the capacitance data with the multidimensional projection techniques Principal Component Analysis (PCA), Interactive Document Map (IDMAP), and Sammon’s Mapping. While an optimized performance was demonstrated with IDMAP and feature selection, during which data of a limited frequency range were used, the distinction of all soil samples was also possible with the well-established PCA analysis for measurements at a single frequency. The successful use of a simple microfluidic e-tongue for soil analysis paves the way for enhanced tools to support precision agriculture.

1. Introduction

The growing world demand for food without increasing the productive area requires a better use of agricultural and natural resources, which implies that the development of better tools for precision agriculture should avoid an excessive use of pesticides and fertilizers [1,2,3]. Within this context, high-detailed information for soil characterization is important for soil management and crop productivity when dealing with precision agriculture. However, traditional soil chemical analysis is expensive and time-consuming, which motivates the development of alternative approaches for sensing in agricultural practices [4]. Optical spectroscopy has been widely used for this purpose because it requires only one measurement (spectrum) to infer several soil properties [5]; however, this kind of technology presents some limitations due to the non-specific spectral bands related to the concentration of nutrients in the soil, leading to models with a relatively high prediction error. Other methods include soil analysis using a microfluidic chip based on capillary electrophoresis that is sensitive to plant macro-nutrients (NO3, NH4, K, and PO4) in liquid samples [3].
In this work, a microfluidic electronic tongue (e-tongue) device [6] was applied to analyze soil samples using statistical tools, which allows for samples enriched with nitrogen (N), phosphorus (P), potassium (K), calcium (Ca), magnesium (Mg), and sulfur (S) to be discriminated. No pre-processing was required, as the soil samples were simply diluted in water. An e-tongue is a multisensory system that can classify liquid samples using statistical tools [6], and various e-tongues have been reported [7,8] in numerous applications [9,10,11,12]. Recently, an electrochemical e-tongue has been successfully applied in the qualitative and quantitative analysis of distinct soil types based on their extractable components [13]. The microfluidic concept was incorporated in this sort of device, resulting in the benefits of a small size, and reduced volume and waste, in addition to an overall cost reduction [14,15]. Microfluidics, e-tongues, and soil analysis are well-established research lines, but their integration does not appear to have been made in the literature. Here, sensing units were fabricated with Layer-by-layer (LbL) films of organic and inorganic materials [16] with impedance measurements acquired for seven soil samples in different compositions diluted in distilled water. Principal Component Analysis and information visualization methods provided a clear distinction of all samples tested.

2. Materials and Methods

The microfluidic system used here comprises an array of four sensing units made with LbL films deposited onto gold interdigitated electrodes (IDEs) inside a polydimethylsiloxane (PDMS) microchannel, fabricated by the authors at the Brazilian Nanotechnology National Laboratory (LNNano). IDEs with 30 pairs of digits, each having a 3 mm length, 40 μm width, and being separated by a distance of 40 μm from each other, were photolithographically patterned onto glass slides. The adhesion layer for gold on glass was a 20 nm thick chromium layer. A PDMS microchannel which was 490 μm wide, 50 μm high, and 12.5 mm long was sealed onto the IDEs using plasma oxygen, as reported in [16]. Copper phthalocyanine-3,4′,4″,4″′-tetrasulfonic acid tetrasodium salt (CuTsPc), montmorillonite K (MMt-K), poly(3,4-ethylenedioxythiophene)-poly(styrenesulfonate) (PEDOT:PSS), and poly(diallyldimethylammonium chloride) solution (PDDA) were purchased from Sigma-Aldrich and used as received. The e-tongue system was composed by one bare electrode and three IDEs covered with (PDDA/CuTsPc)n, (PDDA/MMt-K)n, and (PDDA/PEDOT:PSS)n LbL films, where n is the number of deposited bilayers, similarly to what was reported in [17]. The average thickness of a deposited layer in an LbL film is ~2 nm. Since each sensing unit had three-bilayers, the film thickness is estimated to be ~12 nm. LbL films were deposited onto the IDEs by alternating aqueous solutions of the materials during 10 min inside the microchannels, as described in [16,18]. All polyelectrolytes were prepared using ultrapure water acquired from an Arium comfort Sartorius system. An aqueous solution of CuTsPc at 0.5 mg/mL, pH 8 was used. For MMt-K, the aqueous solution was comprised of 1 mg/mL at pH = 3, and that for PEDOT:PSS constituted 0.2 mg/mL at pH = 3. PDDA aqueous solutions at 10 μL/mL were used at pH = 8 with CuTsPc and at pH = 3 when alternated with MMt-K and PEDOT:PSS. The LbL technique is based on intermolecular non-covalent interactions of oppositely charged polyelectrolytes to promote surface modification at the nanoscale. It is a robust, simple, and flexible method to fabricate multilayered nanostructures with excellent control over the thickness and morphology using wide-ranging building blocks (polymers, enzymes, proteins, DNA, carbon-based materials, dendrimers, metal nanoparticles, etc) for numerous applications [18].
The e-tongue system was tested for its capability in differentiating soil samples individually enriched with N, P, K, Ca, Mg, and S. These are primary nutrients demanded by plants (macronutrients), which frequently have to be delivered to the soil via chemical fertilizers. The source of these nutrients was chosen for their purity and form of the molecule when interacting with the soil, respectively, NH4NO3, NH4H2PO4, KCl, CaCl2(H2O)2, MgCl2(H2O)6, and (NH4)2SO4. The soil samples were extracted from a single location (Table S1 in Supplementary Materials) and the above mentioned compounds were then separately deposited into six pots with a 1 L capacity (Table S2 in Supplementary Materials). The chemical compounds were mixed with the soil of each pot. The pots were maintained for 40 days in a greenhouse with dairy irrigation to allow chemical reactions between the compounds and the soil. Thus, seven soil samples were obtained, six enriched with the different macronutrients and one without fertilizer, representing the control sample (low fertility levels). A percentage of each sample was sent to a commercial laboratory in order to quantify the amount of nutrients available to the plants through traditional soil chemical analysis (Tables S1 and S2 in Supplementary Materials); the other part was tested with the microfluidic e-tongue system. All soil samples were solubilized in distilled water acquired from the Sartorius system at 1 mg/mL, driven inside the microchannels using a New Era NE-1000 syringe pump (Farmingdale, NY, USA). Impedance measurements were performed with samples injected inside the microchannels at 5000 μL/h.
Electrical measurements were made using 25 mV of amplitude in the frequency range 1–106 Hz using a Solartron 1260 A impedance/gain-phase analyzer coupled to a 1296 A dielectric interface. This frequency region was chosen as it receives contributions from the electrostatic double-layer formed at the electrode/electrolyte interface (<100 Hz), the solution conductance and ultrathin film coating of the electrodes ruling the total impedance response at intermediate frequencies (kHz region), and the geometric capacitance that is most relevant at higher frequencies [19]. The choice of flow instead of static measurements was made to avoid a possible soil decantation inside the microchannel with the contamination of the sensing units, which would compromise the reusability of the device. Three independent sets of measurements were performed for each soil sample at each sensing unit, and the capacitance data was dimensionally reduced by the Fastmap and Principal Component Analysis (PCA) techniques employing Euclidean distances [20]. Interactive Document Map (IDMAP), Sammon’s Mapping (SAMMON), and PCA projection techniques are available in the PEx-Sensors suite of software tools [21], which projects multidimensional data into a 2D space. Moreover, it also contains the Parallel Coordinate technique that allows for a frequency selection to exclude the dimensions hampering the discrimination of the data, leading to an improved quality of the projection. This ability is measured through the Silhouette Coefficient (S) [22], whose values range between −1 to 1. Values below 0 mean that classification is poor or no distinguishing occurred, while coefficients above 0 help in the distinction of different samples. Briefly, the following interpretation has been reported for positive values of S: (i) strong (0.71–1.0); (ii) reasonable (0.51–0.70); (iii) weak (0.26–0.50); and (iv) no substantial classification has been found (≤0.25) [23].

3. Results and Discussion

The impedance spectra for the four sensing units in distilled water displayed the most pronounced differences for (PDDA/MMt-K)3 when compared to the sensing units with the other LbL films (Figure S2 in Supplementary Materials). This can probably be explained by the insulating nature of montmorillonite clays [24], since CuTsPc and PEDOT:PSS exhibit semiconducting behavior [25,26]. Figure 1 shows the relative capacitance spectra, i.e., the ratio between capacitance with (C) and without (C0) added nutrients (N, P, K, Ca, Mg, and S), where larger differences are observed at mid frequency ranges. The electrical response in mid frequencies is dominated by interactions between the film and analyte, without charge transfer or diffusion-driven processes [7]. The sensing units were sensitive to all soil samples, though no clear correlation could be established with the size or ionic mobility of the nutrients. Indeed, one should not expect a simple correlation considering the complex nature of the soil samples that contain inorganic and organic materials.
Figure 2 displays the capacitance (C) versus frequency plots for the bare electrode, (PDDA/CuTsPc)3, (PDDA/MMt-K)3, and (PDDA/PEDOT:PSS)3 devices exposed to aliquots from soil samples (control and enriched with N, P, K, Ca, Mg, and S). Since all three independent measurements for each sample at the sensing units have shown similar behavior, only one set is presented in Figure 2. There is a shift in all spectra between 102 and 104 Hz for all sensing units and the response at these mid-frequency is generally attributed to effects from interactions between the thin films deposited onto the IDEs with liquid media [19], with a higher capacitance at lower frequencies. For the (PDDA/MMt-K)3 sensing unit, samples could also be distinguished by the capacitance at low frequencies where double-layer effects dominate, and this can be ascribed to the more insulating nature of the clay [17,27].
Distilled water was thoroughly passed through the microchannels between each soil measurement during ca. 15 min to avoid cross-contamination, extending the possibility of reuse of the sensing units [19]. Figure 3 shows the capacitance spectra obtained after the washing procedure for the four sensing units. The absence of significant displacements excludes a possible cross-contamination, which confirms the reusability of the sensor array for other analytes.
Linear and non-linear statistical techniques were used to analyze the raw data in an attempt to establish a “finger print” for each soil sample tested. The multidimensional projection techniques used are the linear PCA method and the non-linear IDMAP and Sammon’s mapping, with capacitance soil data shown in Figure 4. The normalized capacitance data were used in the frequency range from 1 Hz to 1 MHz, and the black bar helps to measure the distances between data points. A visual inspection may point to a better discrimination of the samples in Figure 4a for IDMAP. However, the quantitative silhouette coefficient S is 0.730, 0.857, and 0.667 for IDMAP, PCA, and SAMMON, respectively. Therefore, PCA provided the most efficient distinguishing ability, which is unexpected because the non-linear methods for complex samples are usually better. A possible explanation may be the relatively small dispersion of the data for distilled water in PCA analysis.
One of the most important advantages in the use of information visualization methods to analyze sensing data is the possible optimization of the performance. This can be done by choosing the most appropriate multidimensional projection method or by doing feature selection, in which only part of the data is used for discrimination. Here, we applied the Parallel Coordinates technique to select frequencies from 79 Hz up to 25 kHz as the most useful frequency range to discriminate the samples (Figure S3 in Supplementary Materials). The plots of the new projections considering only the optimized frequency range (i.e., with feature selection) are shown in Figure 5. Clear benefits can be inferred from this feature selection procedure: (i) decrease in the dispersion of the data points; (ii) graphs are in the same scale; (iii) distribution of data points is easier to discriminate; and (iv) enhanced S values, with all correlations indicating a clear distinction among all soil samples. A comparison of S values before and after the feature selection procedure is presented in Table 1. It is worth noting that IDMAP and SAMMON (non-linear techniques) achieved an increment of 25% and 27%, respectively, when compared to the results obtained with no frequency selection, while for PCA (linear technique), there was an improvement of only 3%. From the S values, one infers that an optimized performance was achieved with feature selection and IDMAP, which is consistent with the recent literature, according to which IDMAP has been proven superior for analyzing sensing and biosensing data [28].
Generally, impedance analysis as a function of frequency allows the identification of potential interactions at the electrode/electrolyte interface through equivalent electrical circuits [7,17,19,29]. However, it is known that interactions between the nanostructured thin films forming the sensing units deposited onto the IDEs with the liquid systems are reflected in the electrical response at the kHz region [7,17,19]. This allows for the construction of simple, inexpensive equipment for on-site measurements. To demonstrate this idea, we show the well-established PCA plot at a fixed frequency (1 kHz) in Figure 6, where the electrical response is dominated by film/liquid interactions [29]. Though the distinguishing ability is not as good as with IDMAP and feature selection in Figure 5, it is indeed possible to distinguish the samples with this much simpler procedure with a measurement at only one frequency. Note that the use of only two Principal Components already led to 99.6% (PC1 + PC2) of the total information collected by the array, with 96.02% being concentrated in the first Principal Component (PC1).

4. Conclusions

A microfluidic e-tongue using impedance spectroscopy was successfully applied to identify soil samples enriched with plant macronutrients. A simple rinsing of the sensing units with distilled water brought the sensing units back to their initial conditions, thus indicating an absence of cross-contamination in three independent sets of measurements. This implies that the sensing units may be reused with good reproducibility. IDMAP, PCA, and SAMMON techniques indicated that an adequate choice of frequencies allows for the discrimination of soil samples using raw data without any sort of pre-treatment. Among the three projection techniques, the best result was achieved using IDMAP for the selected frequencies. Nevertheless, we have shown that using just one selected frequency and a simple analysis allowed the distinction of all samples in a complex liquid system. The results presented here indicated a clear distinction of soil samples using this methodology, thus encouraging further investigations on the development of microfluidic e-tongues for soil analysis, paving the way for future precision agriculture developments. Future advances may include the integration of the sensing units in a single monolithic block, the use of emerging technologies such as 3D printing for microfluidic devices, and the possible identification of macronutrients in soil samples during data acquisition.

Supplementary Materials

The following are available online at https://www.mdpi.com/2227-9040/5/2/14/s1, Figure S1: Scheme of the whole setup used for the soil measurement zooming at one sensing unit; Figure S2: Capacitance spectra for the bare electrode, PDDA/CuTsPc, PDDA/MMt-K, and PDDA/PEDOT:PSS sensing units in distilled water at 5000 μL/h flow; Figure S3: Parallel coordinate visualization of the capacitance data collected with 4 sensing units for the soil samples: (a) all frequencies and (b) with frequency selection, Table S1: The overall characteristics of the original soil collected to be used in the study; Table S2: Nutrients available to the plants according to traditional soil chemical analysis for the seven soil samples used.

Acknowledgments

Authors are grateful for the financial support by the Brazilian agencies FAPESP (Grants No. 2012/15543-7, 2013/50942-2, 2013/14262-7, 2014/03691-7 and 2015/14836-9), CAPES and CNPq. They also thank LNNano/CNPEM (LMF project No. 19984).

Author Contributions

Maria L. Braunger: Growth of the LbL films, impedance spectroscopy measurements on the soil samples using the electronic tongue sensor and PCA analysis of the obtained data. Flávio M. Shimizu: Analysis and writing of the capacitance data through PEx-Sensors software tools. Mawin J. M. Jimenez, Maria H. de Oliveira Piazzetta and Ângelo L. Gobbi: Fabrication and description of the IDEs/microfluidic devices. Lucas R. Amaral and Paulo S. G. Magalhães: Preparation of the soil samples and analysis of the results associated with soil in the manuscript. Varlei Rodrigues: discussions during the writing and revision of the manuscript. Osvaldo N. Oliveira Jr.: responsible for the statistical analysis and revision of the manuscript. Antonio Riul Jr.: Is the principal investigator in this subject.

Conflicts of Interest

The authors declare no conflict of interest.

References

  1. Bindraban, P.S.; Stoorvogel, J.J.; Jansen, D.M.; Vlaming, J.; Groot, J.J.R. Land quality indicators for sustainable land management: Proposed method for yield gap and soil nutrient balance. Agric. Ecosyst. Environ. 2000, 81, 103–112. [Google Scholar]
  2. Roberts, D.C.; Brorsen, B.W.; Solie, J.B.; Raun, W.R. Is data needed from every field to determine in-season precision nitrogen recommendations in winter wheat? Precis. Agric. 2013, 14, 245–269. [Google Scholar] [CrossRef]
  3. Smolka, M.; Puchberger-Enengl, D.; Bipoun, M.; Klasa, A.; Kiczkajlo, M.; Śmiechowski, W.; Sowiński, P.; Krutzler, C.; Keplinger, F.; Vellekoop, M.J. A mobile lab-on-a-chip device for on-site soil nutrient analysis. Precis. Agric. 2017, 18, 152–168. [Google Scholar]
  4. Viscarra Rossel, R.A.; McBratney, A.B.; Minasny, B. Proximal Soil Sensing; Springer: Dordrecht, The Netherlands, 2010. [Google Scholar]
  5. Soriano-Disla, J.M.; Janik, L.J.; Viscarra Rossel, R.A.; Macdonald, L.M.; McLaughlin, M.J. The performance of visible, near-, and mid-infrared reflectance spectroscopy for prediction of soil physical, chemical, and biological properties. Appl. Spectrosc. Rev. 2014, 49, 139–186. [Google Scholar]
  6. Vlasov, Y.; Legin, A.; Rudnitskaya, A.; Natale, C.D.; D’Amico, A. Nonspecific sensor arrays (“electronic tongue”) for chemical analysis of liquids. Pure Appl. Chem. 2005, 77, 1965–1983. [Google Scholar] [CrossRef]
  7. Riul, A., Jr.; Dantas, C.A.R.; Miyazaki, C.M.; Oliveira, O.N., Jr. Recent advances in electronic tongues. Analyst 2010, 135, 2481–2495. [Google Scholar] [CrossRef] [PubMed]
  8. Toko, K. Taste sensor with global selectivity. Mater. Sci. Eng. C 1996, 4, 69–82. [Google Scholar] [CrossRef]
  9. Legin, A.; Rudnitskaya, A.; Vlasov, Y.; Di Natale, C.; Mazzone, E.; D’Amico, A. Application of electronic tongue for quantitative analysis of mineral water and wine. Electroanalysis 1999, 11, 814–820. [Google Scholar]
  10. Krantz-Rülcker, C.; Stenberg, M.; Winquist, F.; Lundström, I. Electronic tongues for environmental monitoring based on sensor arrays and pattern recognition: A review. Anal. Chim. Acta 2001, 426, 217–226. [Google Scholar] [CrossRef]
  11. Gutiérrez, M.; Alegret, S.; Cáceres, R.; Casadesús, J.; Marfà, O.; Del Valle, M. Nutrient solution monitoring in greenhouse cultivation employing a potentiometric electronic tongue. J. Agric. Food Chem. 2008, 56, 1810–1817. [Google Scholar] [PubMed]
  12. Oliveira, O.N., Jr.; Pavinatto, F.J.; Constantino, C.J.L.; Paulovich, F.V.; de Oliveira, M.C.F. Information visualization to enhance sensitivity and selectivity in biosensing. Biointerphases 2012, 7, 1–15. [Google Scholar] [CrossRef] [PubMed]
  13. Mimendia, A.; Gutiérrez, J.M.; Alcañiz, J.M.; del Valle, M. Discrimination of soils and assessment of soil fertility using information from an ion selective electrodes array and artificial neural networks. Clean Soil Air Water 2014, 42, 1808–1815. [Google Scholar] [CrossRef]
  14. Jacesko, S.; Abraham, J.K.; Ji, T.; Varadan, V.K.; Cole, M.; Gardner, J.W. Investigations on an electronic tongue with polymer microfluidic cell for liquid sensing and identification. Smart Mater. Struct. 2005, 14, 1010–1016. [Google Scholar] [CrossRef]
  15. Whitesides, G.M. The origins and the future of microfluidics. Nature 2006, 442, 368–373. [Google Scholar] [CrossRef] [PubMed]
  16. Daikuzono, C.M.; Dantas, C.A.R.; Volpati, D.; Constantino, C.J.L.; Piazzetta, M.H.O.; Gobbi, A.L.; Taylor, D.M.; Oliveira, O.N., Jr.; Riul, A., Jr. Microfluidic electronic tongue. Sens. Actuators B Chem. 2015, 207, 1129–1135. [Google Scholar] [CrossRef]
  17. Riul, A., Jr.; dos Santos, D.S., Jr.; Wohnrath, K.; Di Tommazo, R.; Carvalho, A.C.P.L.F.; Fonseca, F.J.; Oliveira, O.N., Jr.; Taylor, D.M.; Mattoso, L.H.C. Artificial taste sensor: Efficient combination of sensors made from Langmuir-Blodgett films of conducting polymers and a ruthenium complex and self-assembled films of an azobenzene-containing polymer. Langmuir 2002, 18, 239–245. [Google Scholar] [CrossRef]
  18. Richardson, J.J.; Björnmalm, M.; Caruso, F. Technology-driven layer-by-layer assembly of nanofilms. Science 2015, 348, 2491. [Google Scholar] [CrossRef] [PubMed]
  19. Riul, A., Jr.; Soto, A.M.G.; Mello, S.V.; Bone, S.; Taylor, D.M.; Mattoso, L.H.C. An electronic tongue using polypyrrole and polyaniline. Synth. Met. 2003, 132, 109–116. [Google Scholar] [CrossRef]
  20. Rencher, A.C. Methods of Multivariate Analysis, 2nd ed.; John Wiley & Sons: New York, NY, USA, 2002. [Google Scholar]
  21. Paulovich, F.V.; Moraes, M.L.; Maki, R.M.; Ferreira, M.; Oliveira, O.N., Jr.; de Oliveira, M.C.F. Information visualization techniques for sensing and biosensing. Analyst 2011, 136, 1344–1350. [Google Scholar] [CrossRef] [PubMed]
  22. Pang-Ning, T.; Steinbach, M.; Kumar, V. Introduction to Data Mining; Pearson Addison-Wesley: Essex, UK, 2006; p. 165. [Google Scholar]
  23. Rousseeuw, P.J. Silhouettes: A graphical aid to the interpretation and validation of cluster analysis. J. Comput. Appl. Math. 1987, 20, 53–65. [Google Scholar] [CrossRef]
  24. Kato, C.; Kuroda, K.; Takahara, H. Preparation and electrical properties of quaternary ammonium montmorillonite-polystyrene complexes. Clays Clay Miner. 1981, 29, 294–298. [Google Scholar] [CrossRef]
  25. Bao, Z.; Lovinger, A.J.; Dodabalapur, A. Organic field-effect transistors with high mobility based on copper phthalocyanine. Appl. Phys. Lett. 1996, 69, 3066–3068. [Google Scholar] [CrossRef]
  26. Nardes, A.M.; Kemerink, M.; Janssen, R.A.J.; Bastiaansen, J.A.M.; Kiggen, N.M.M.; Langeveld, B.M.W.; van Breemen, A.J.J.M.; de Kok, M.M. Microscopic understanding of the anisotropic conductivity of PEDOT:PSS thin films. Adv. Mater. 2007, 19, 1196–1200. [Google Scholar] [CrossRef]
  27. Electroanalytical Methods—Guide to Experiments and Applications, 2nd ed.; Scholz, F. (Ed.) Springer: Berlin/Heidelberg, Germany, 2010. [Google Scholar]
  28. Soares, J.C.; Soares, A.C.; Pereira, P.A.R.; Rodrigues, V.D.C.; Shimizu, F.M.; Melendez, M.E.; Scapulatempo Neto, C.; Carvalho, A.L.; Leite, F.L.; Machado, S.A.S.; et al. Adsorption according to the Langmuir–Freundlich model is the detection mechanism of the antigen p53 for early diagnosis of cancer. Phys. Chem. Chem. Phys. 2016, 18, 8412–8418. [Google Scholar] [CrossRef] [PubMed]
  29. Olivati, C.A.; Riul, A., Jr.; Balogh, D.T.; Oliveira, O.N., Jr.; Ferreira, M. Detection of phenolic compounds using impedance spectroscopy measurements. Bioprocess Biosyst. Eng. 2009, 32, 41–46. [Google Scholar] [CrossRef] [PubMed]
Figure 1. Relative capacitance (C/C0) versus frequency for the soil samples in aqueous solutions using (a) bare electrode; (b) (PDDA/CuTsPc)3; (c) (PDDA/MMt-K)3 and (d) (PDDA/PEDOT:PSS)3 sensing units. C0 is related to the control sample and C is associated with samples containing N, P, K, Ca, Mg, and S.
Chemosensors 05 00014 g001
Figure 2. Capacitance versus frequency spectra obtained for seven soil samples (control, N, P, K, Ca, Mg, and S) in aqueous solutions using (a) bare electrode; (b) (PDDA/CuTsPc)3; (c) (PDDA/MMt-K)3 and (d) (PDDA/PEDOT:PSS)3 sensing units. Note that the capacitance for the control sample was C0 in Figure 1.
Chemosensors 05 00014 g002
Figure 3. Capacitance spectra obtained during washing procedure within the microchannels using distilled water flow after analyzing all the soil samples (control, N, P, K, Ca, Mg, and S) with (a) bare electrode; (b) (PDDA/CuTsPc)3; (c) (PDDA/MMt-K)3 and (d) (PDDA/PEDOT:PSS)3. Since the spectra were not affected by the previous measurements and by the washing procedure, the sensing units can be reused.
Chemosensors 05 00014 g003
Figure 4. (a) IDMAP; (b) PCA and (c) SAMMON plots of capacitance data using the whole spectra for the detection of soil samples enriched with N, P, K, Ca, Mg, and S. The black scale bar at the bottom is equivalent to 0.1 in Euclidean distance and can be used to measure the distance between the clusters formed.
Chemosensors 05 00014 g004
Figure 5. (a) IDMAP; (b) PCA and (c) SAMMON plots of capacitance data with selected frequencies for detection of soil samples enriched with N, P, K, Ca, Mg, and S. The black scale bar at the bottom of graph is equivalent to 0.1 in Euclidean metrics and can be used to measure the distance between the clusters formed.
Chemosensors 05 00014 g005
Figure 6. Principal component analysis (PCA) of the microfluidic e-tongue applied to liquid aliquots of soil samples (control, N, P, K, Ca, Mg, and S) under flow conditions.
Chemosensors 05 00014 g006
Table 1. Silhouette coefficient values for all multidimensional projection data.
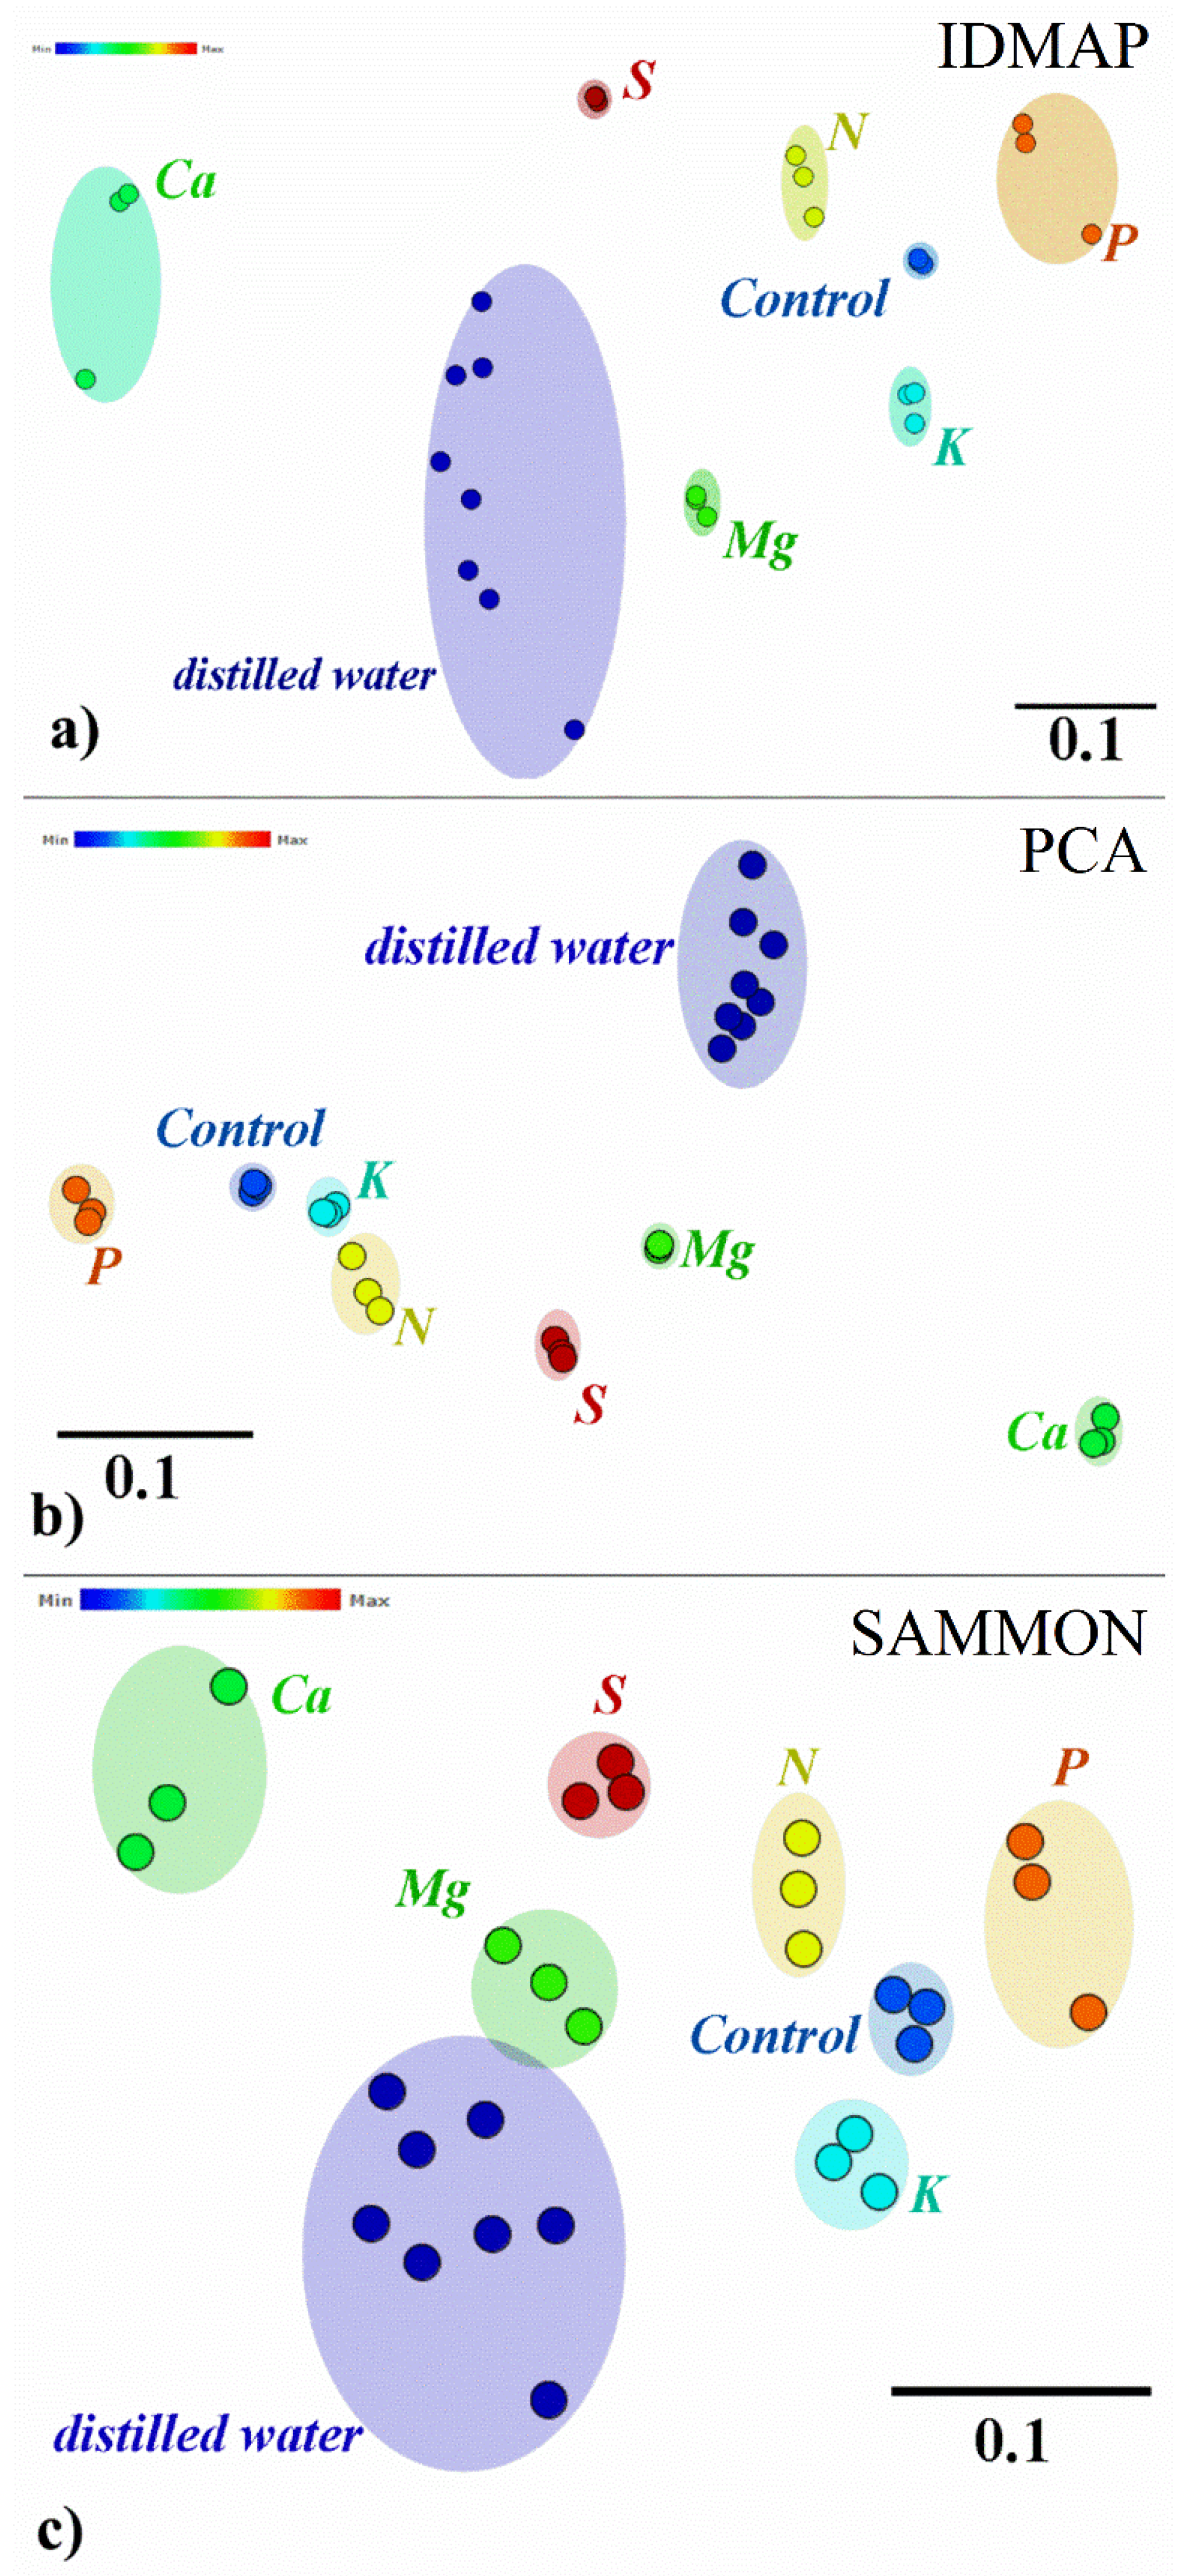
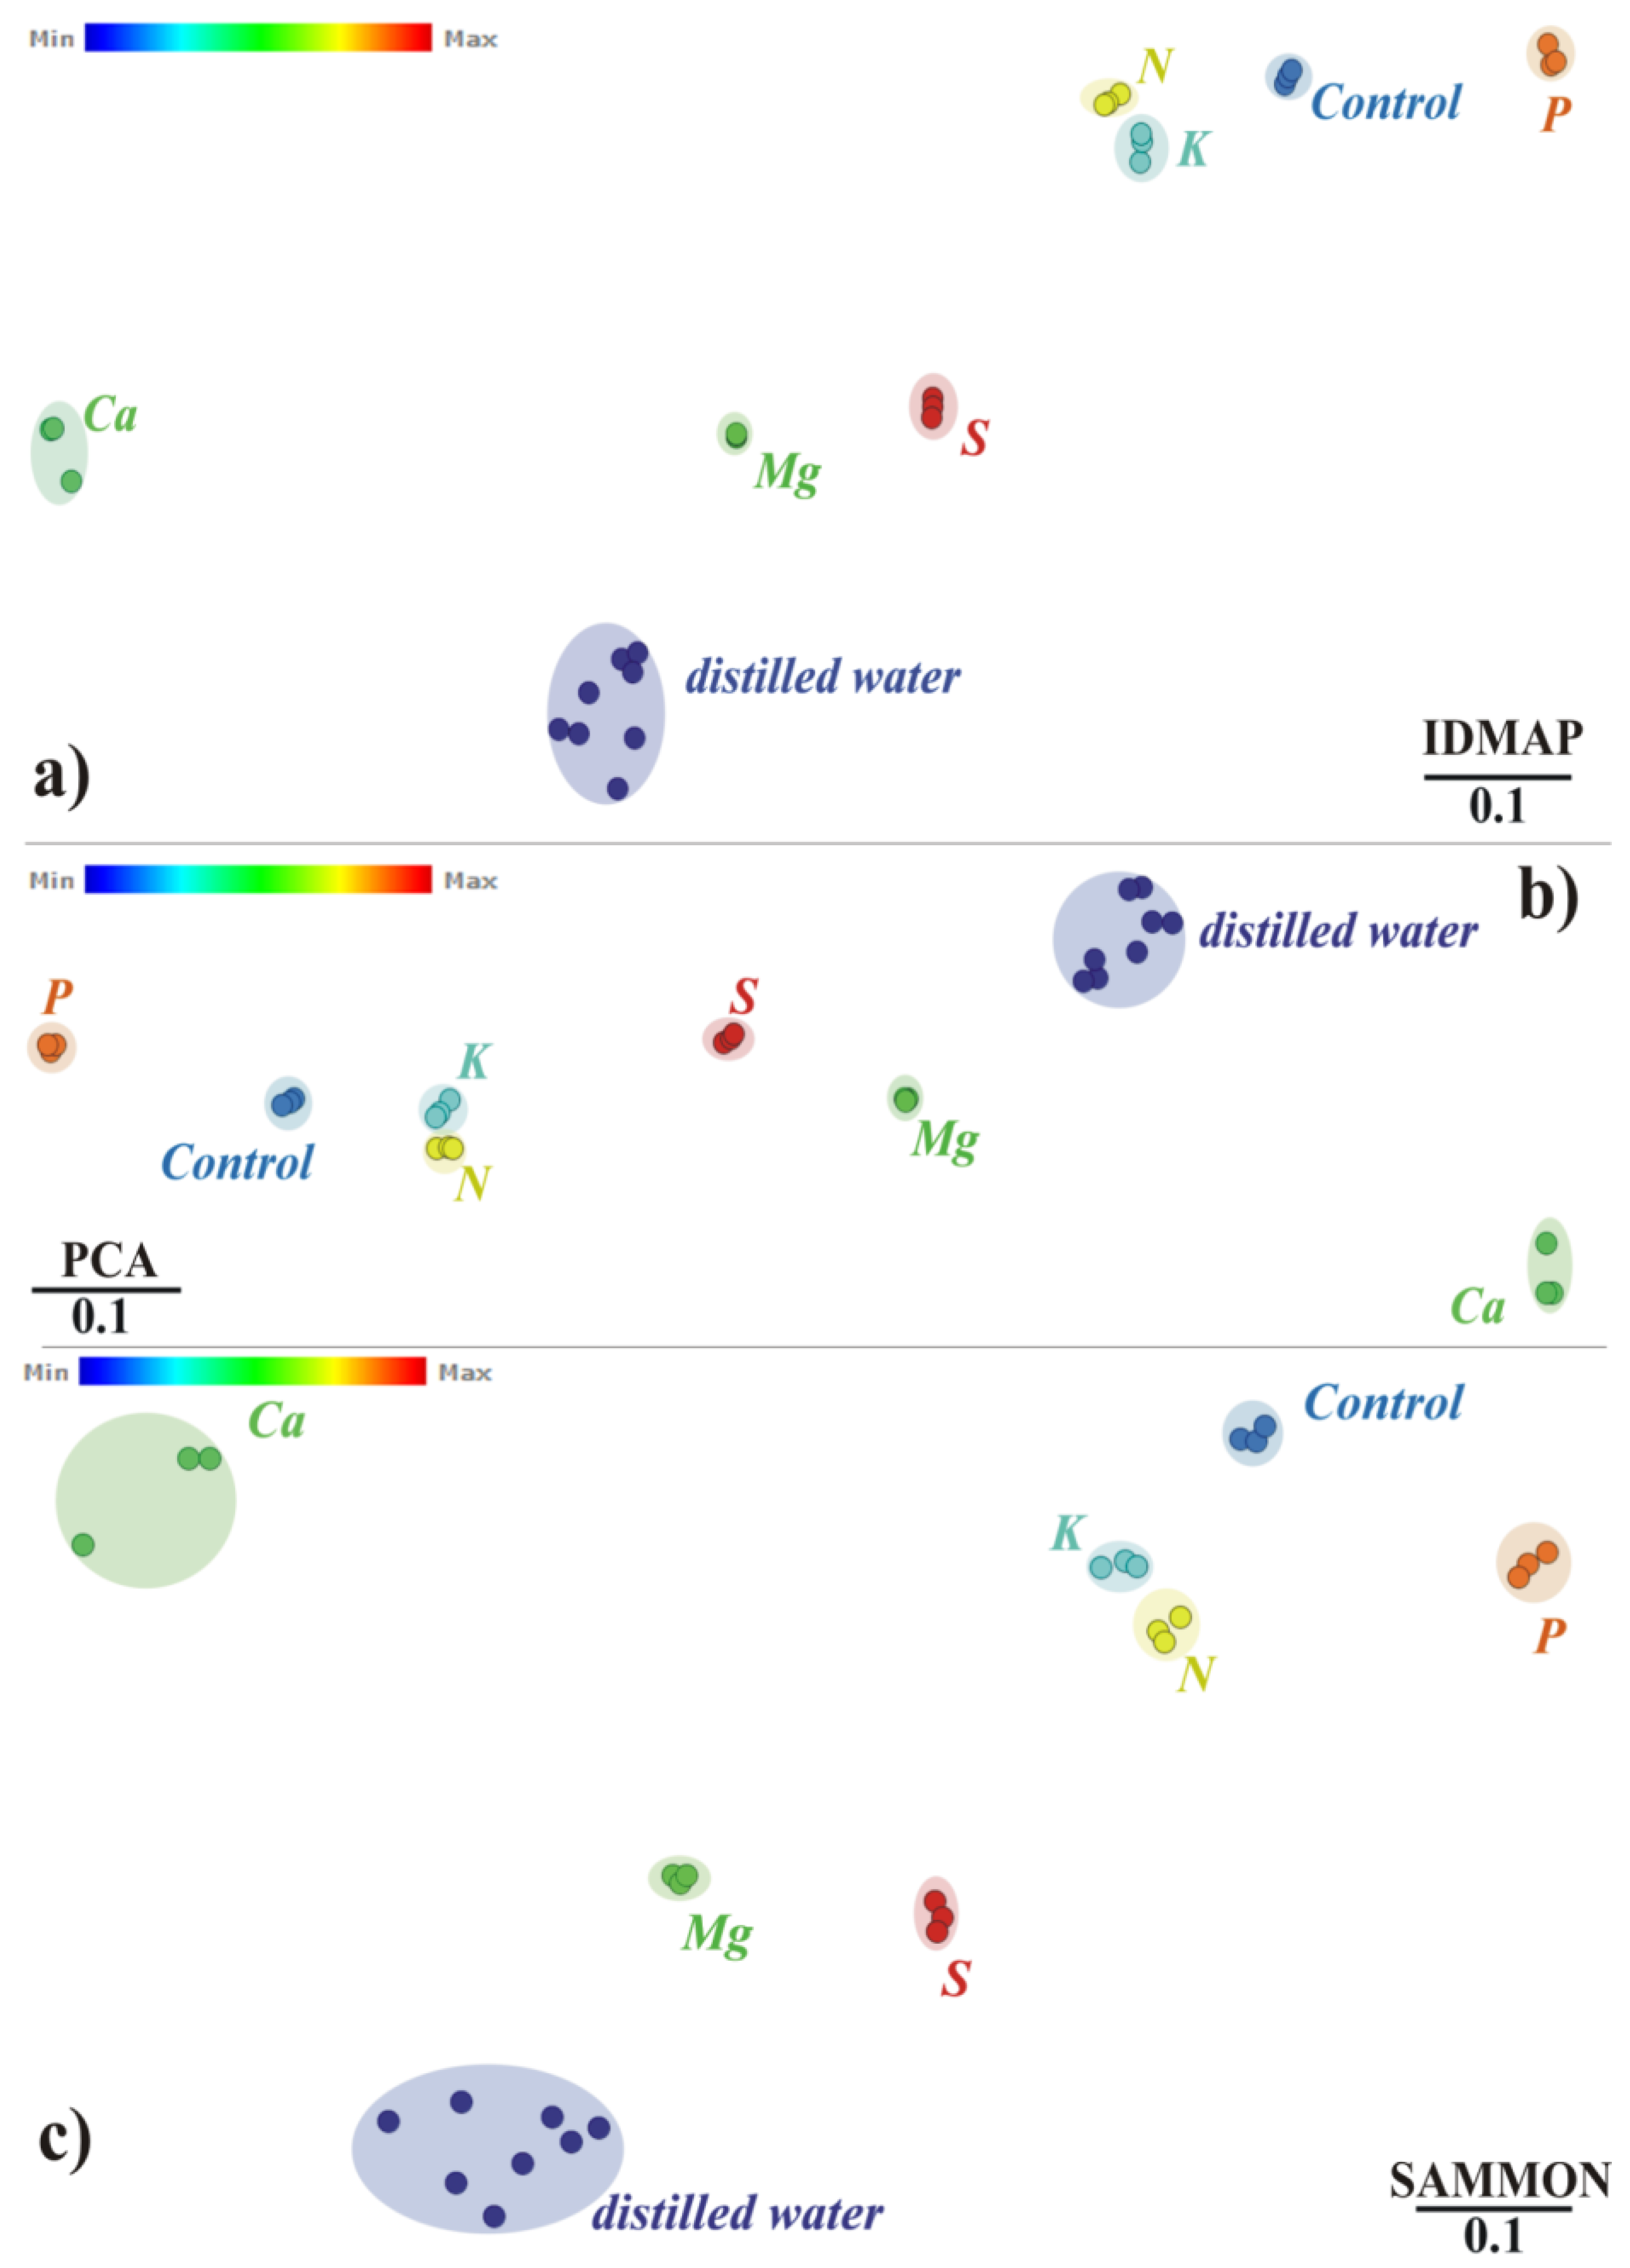
Silhouette Coefficient Values
All FrequenciesSelected FrequenciesIncrement (%)
IDMAP0.7300.91024.65
PCA0.8570.8843.15
SAMMON0.6670.84827.13

