SnSe2-Zn-Porphyrin Nanocomposite Thin Films for Threshold Methane Concentration Detection at Room Temperature

 , , ,
, , , 
Abstract
:
1. Introduction
2. Materials and Methods
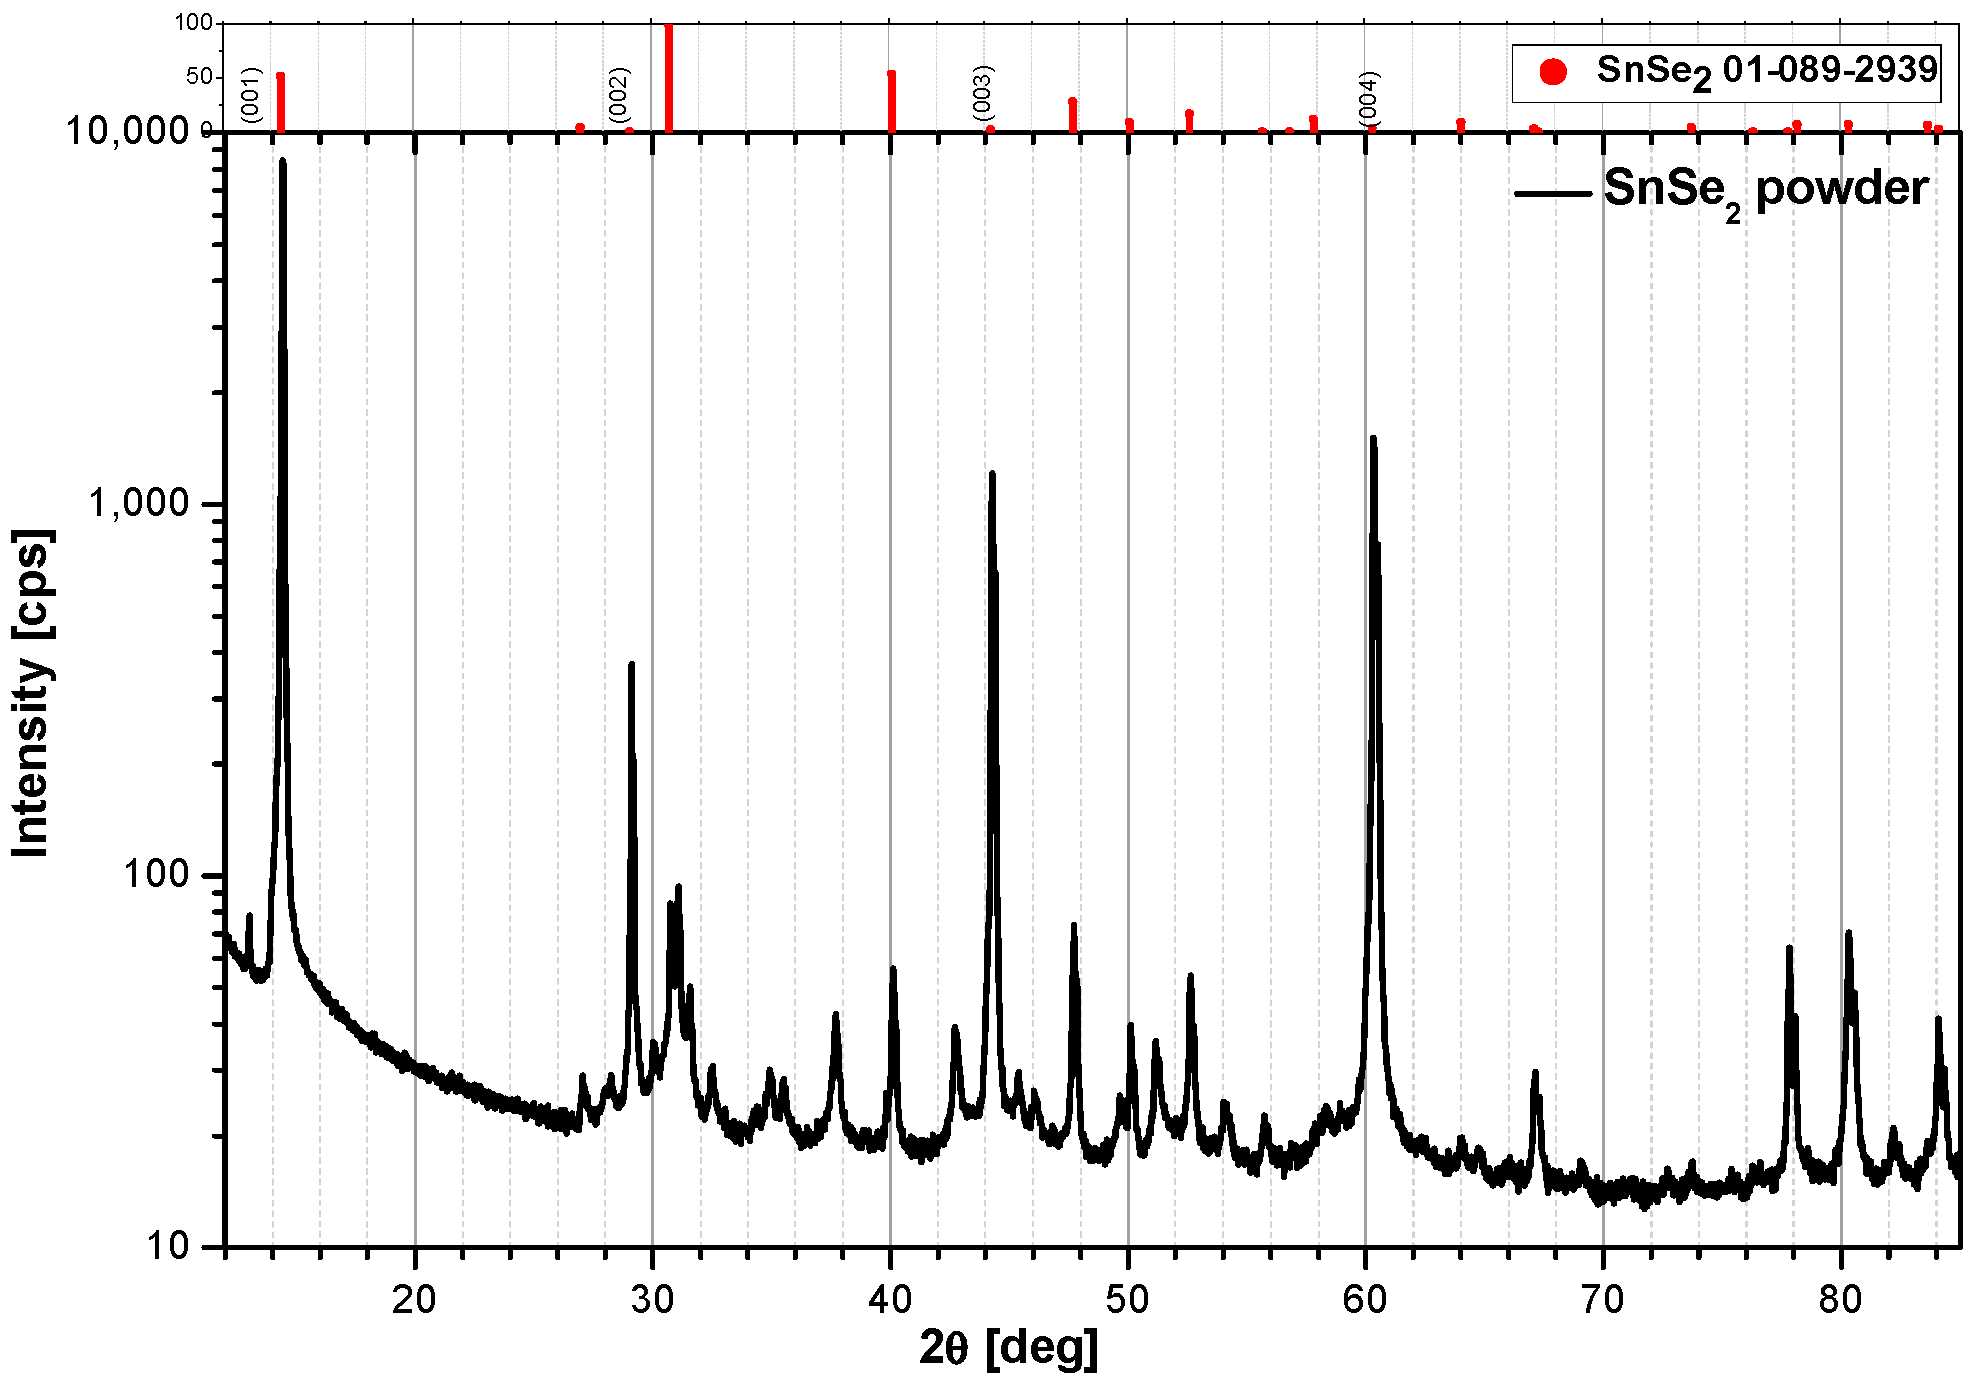
2.1. Snse2 Preparation and X-ray Testing
2.2. Zn-Porphyrin Synthesis
2.2.1. Obtaining of 5,10,15,20-Meso-Tetrakis-(p-nitrophenyl)-Porphyrin
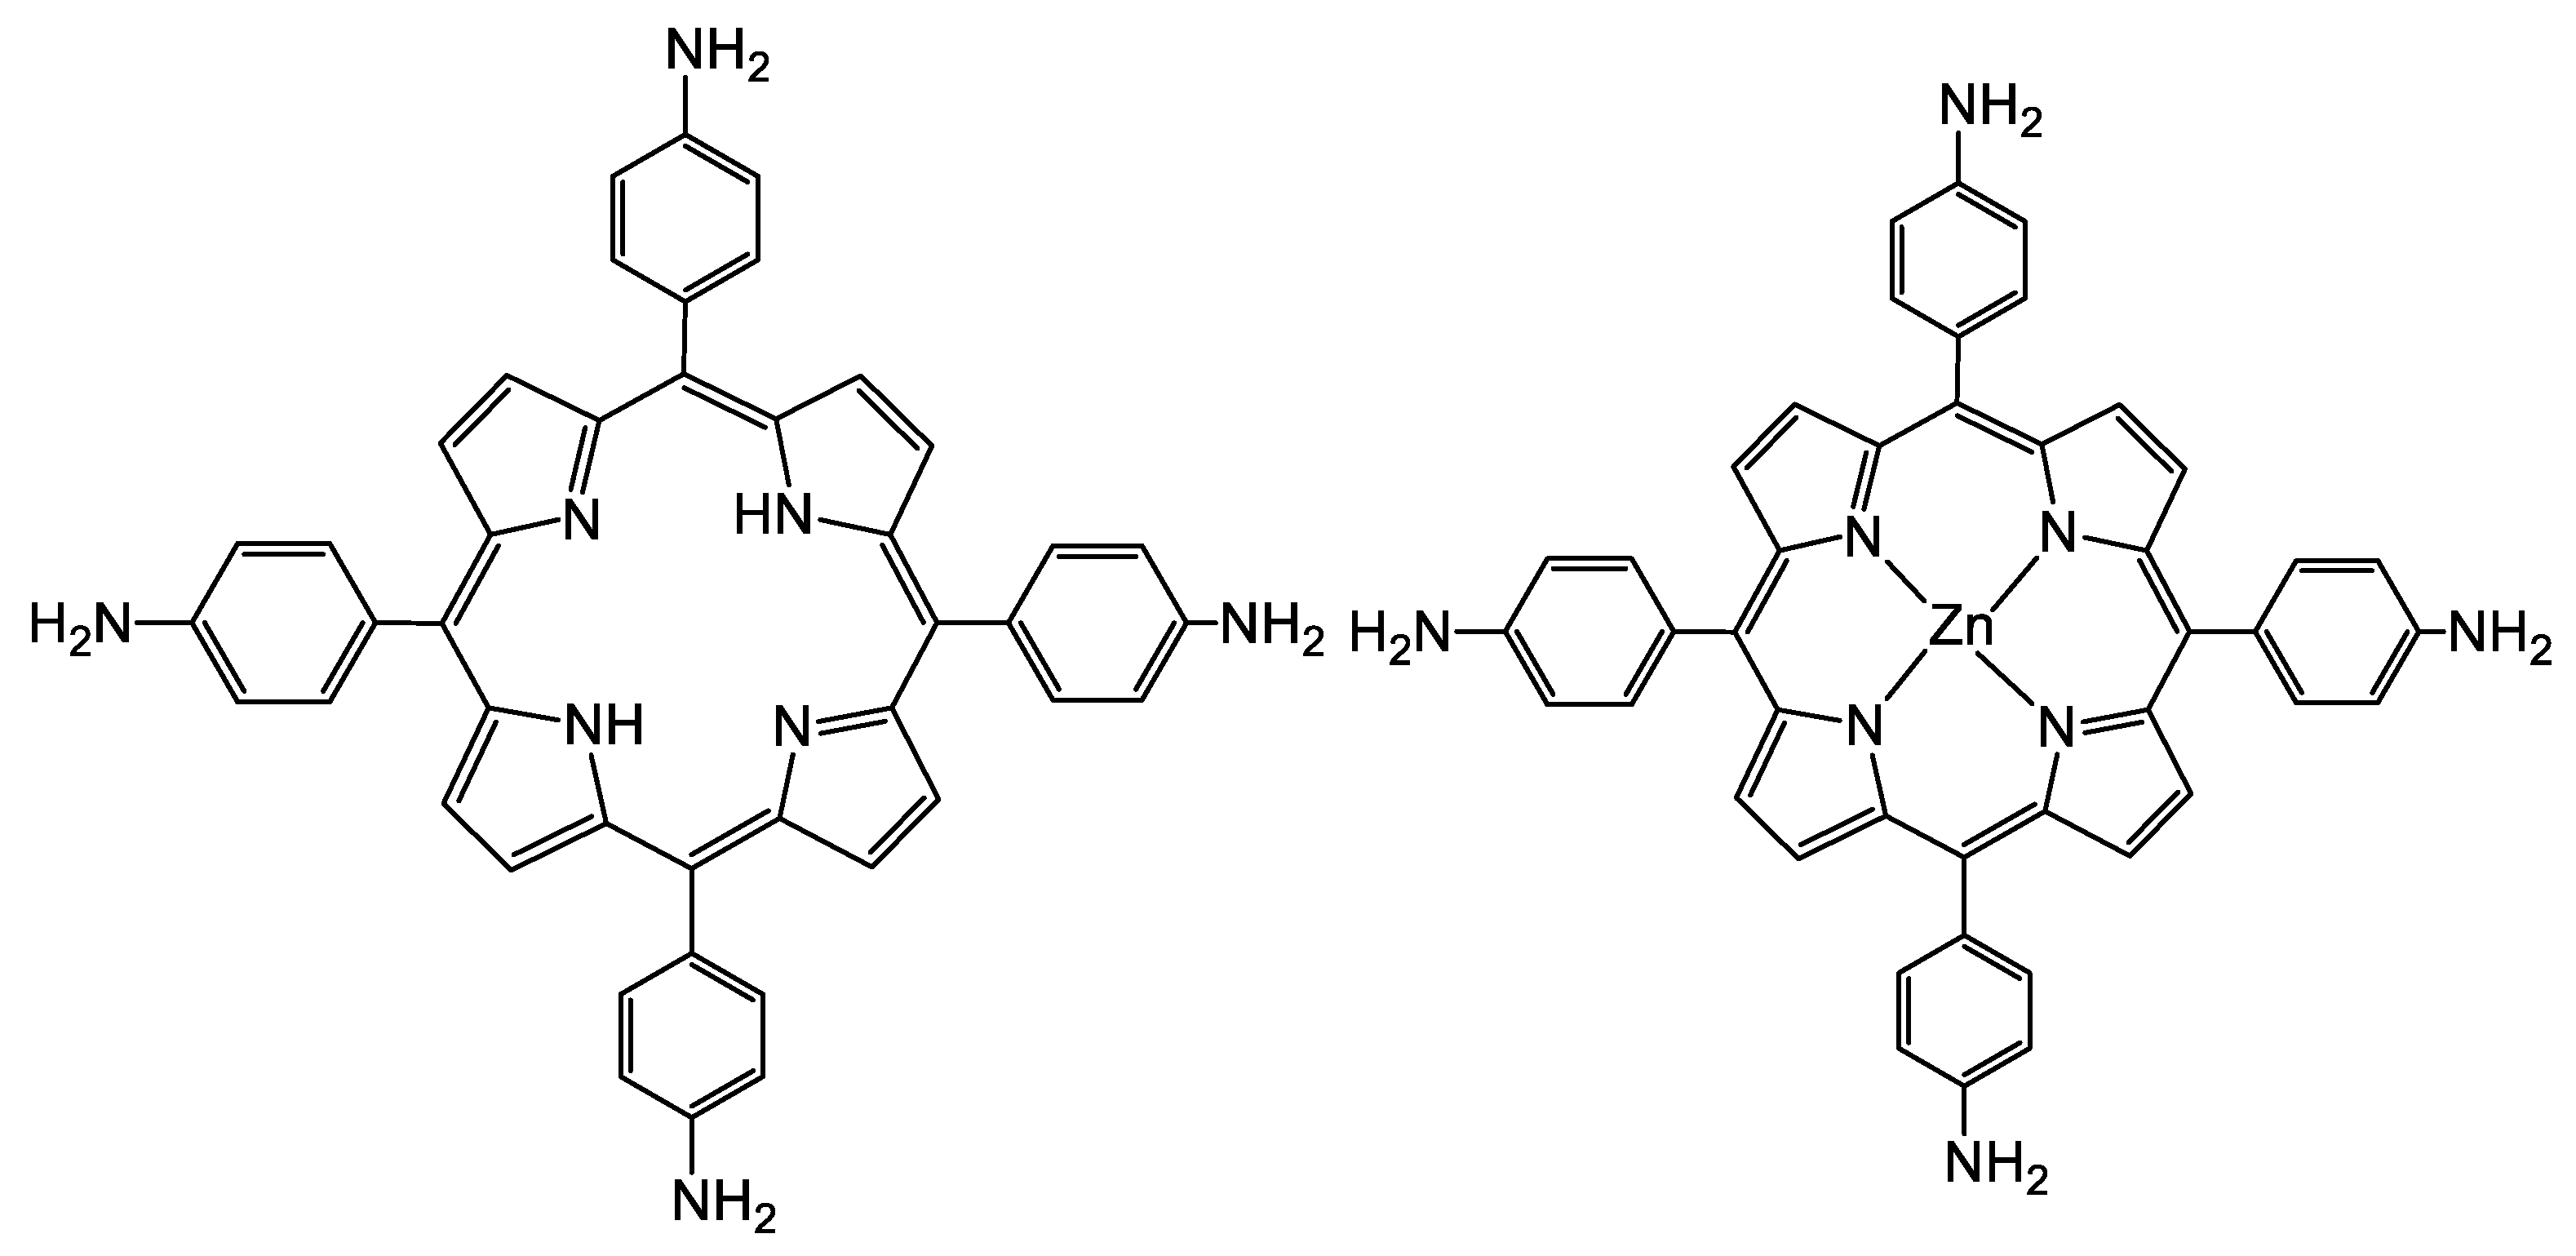
2.2.2. Obtaining of 5,10,15,20-Meso-Tetrakis-(p-aminophenyl)-Porphyrin (TAPP)
2.2.3. Synthesis of ZnTAPP
2.3. Characterization of the Synthesized Tapp and Zntapp Porphyrins
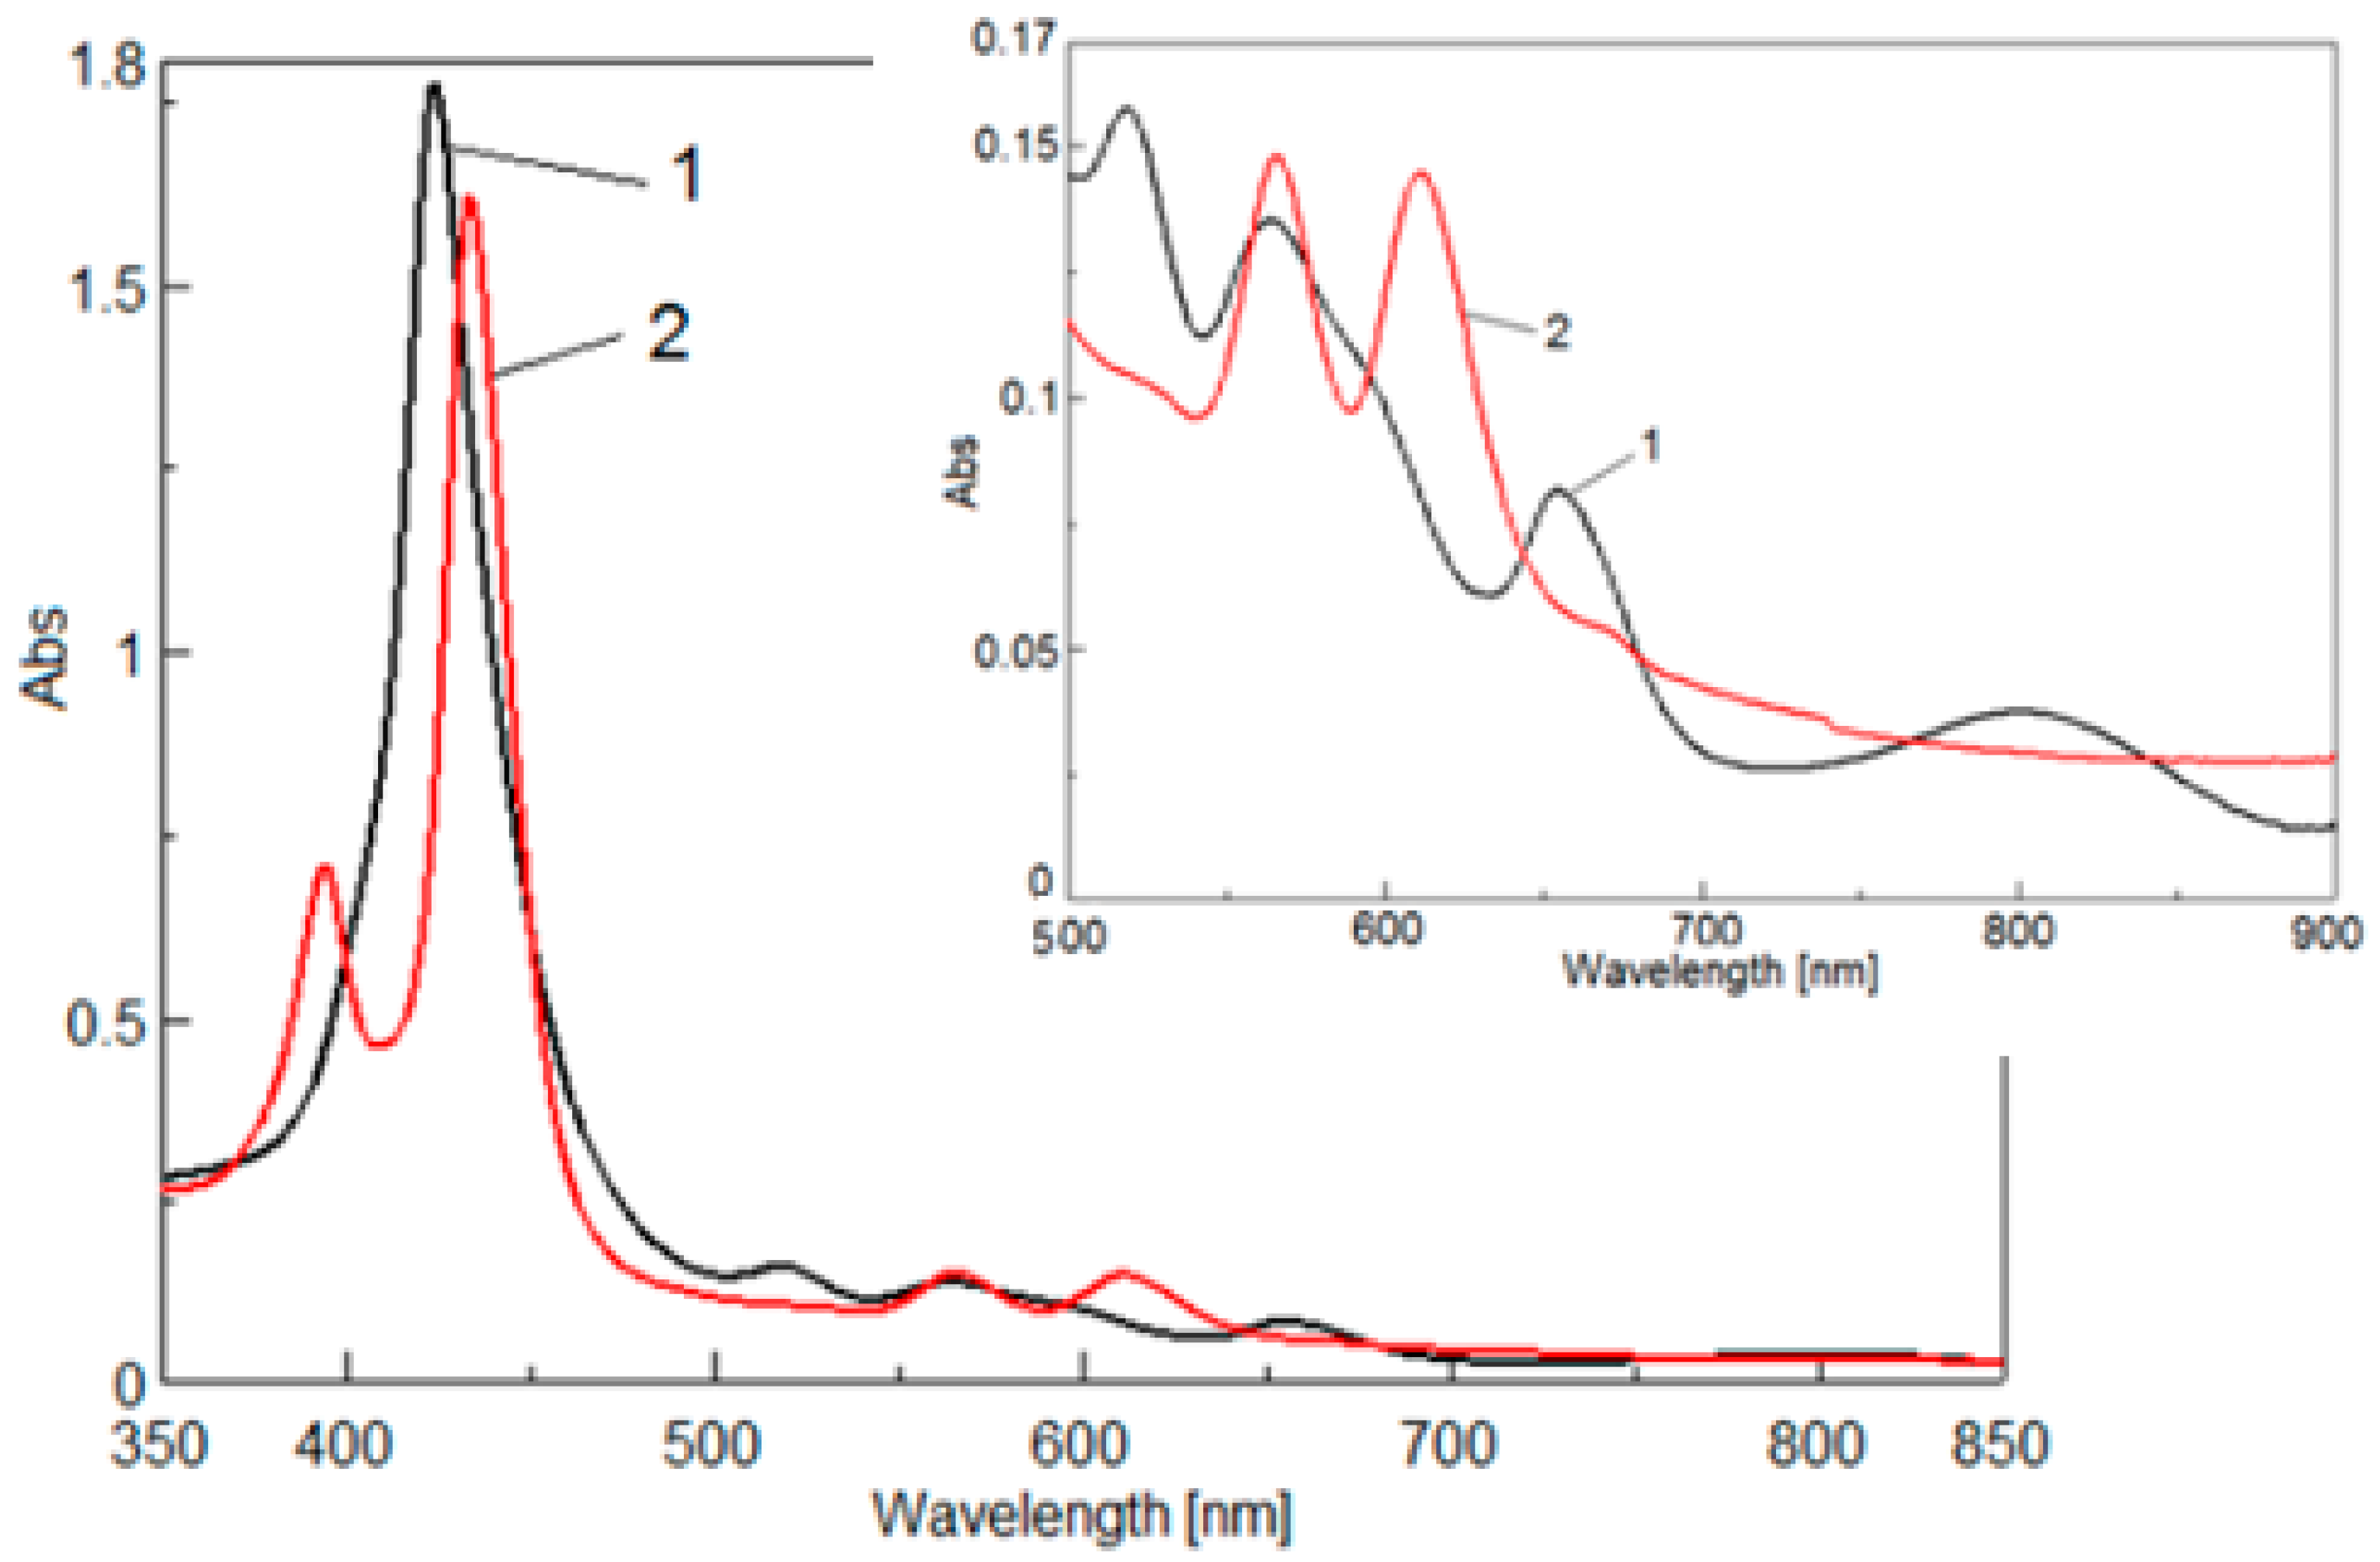
2.3.1. UV-VIS Spectroscopy
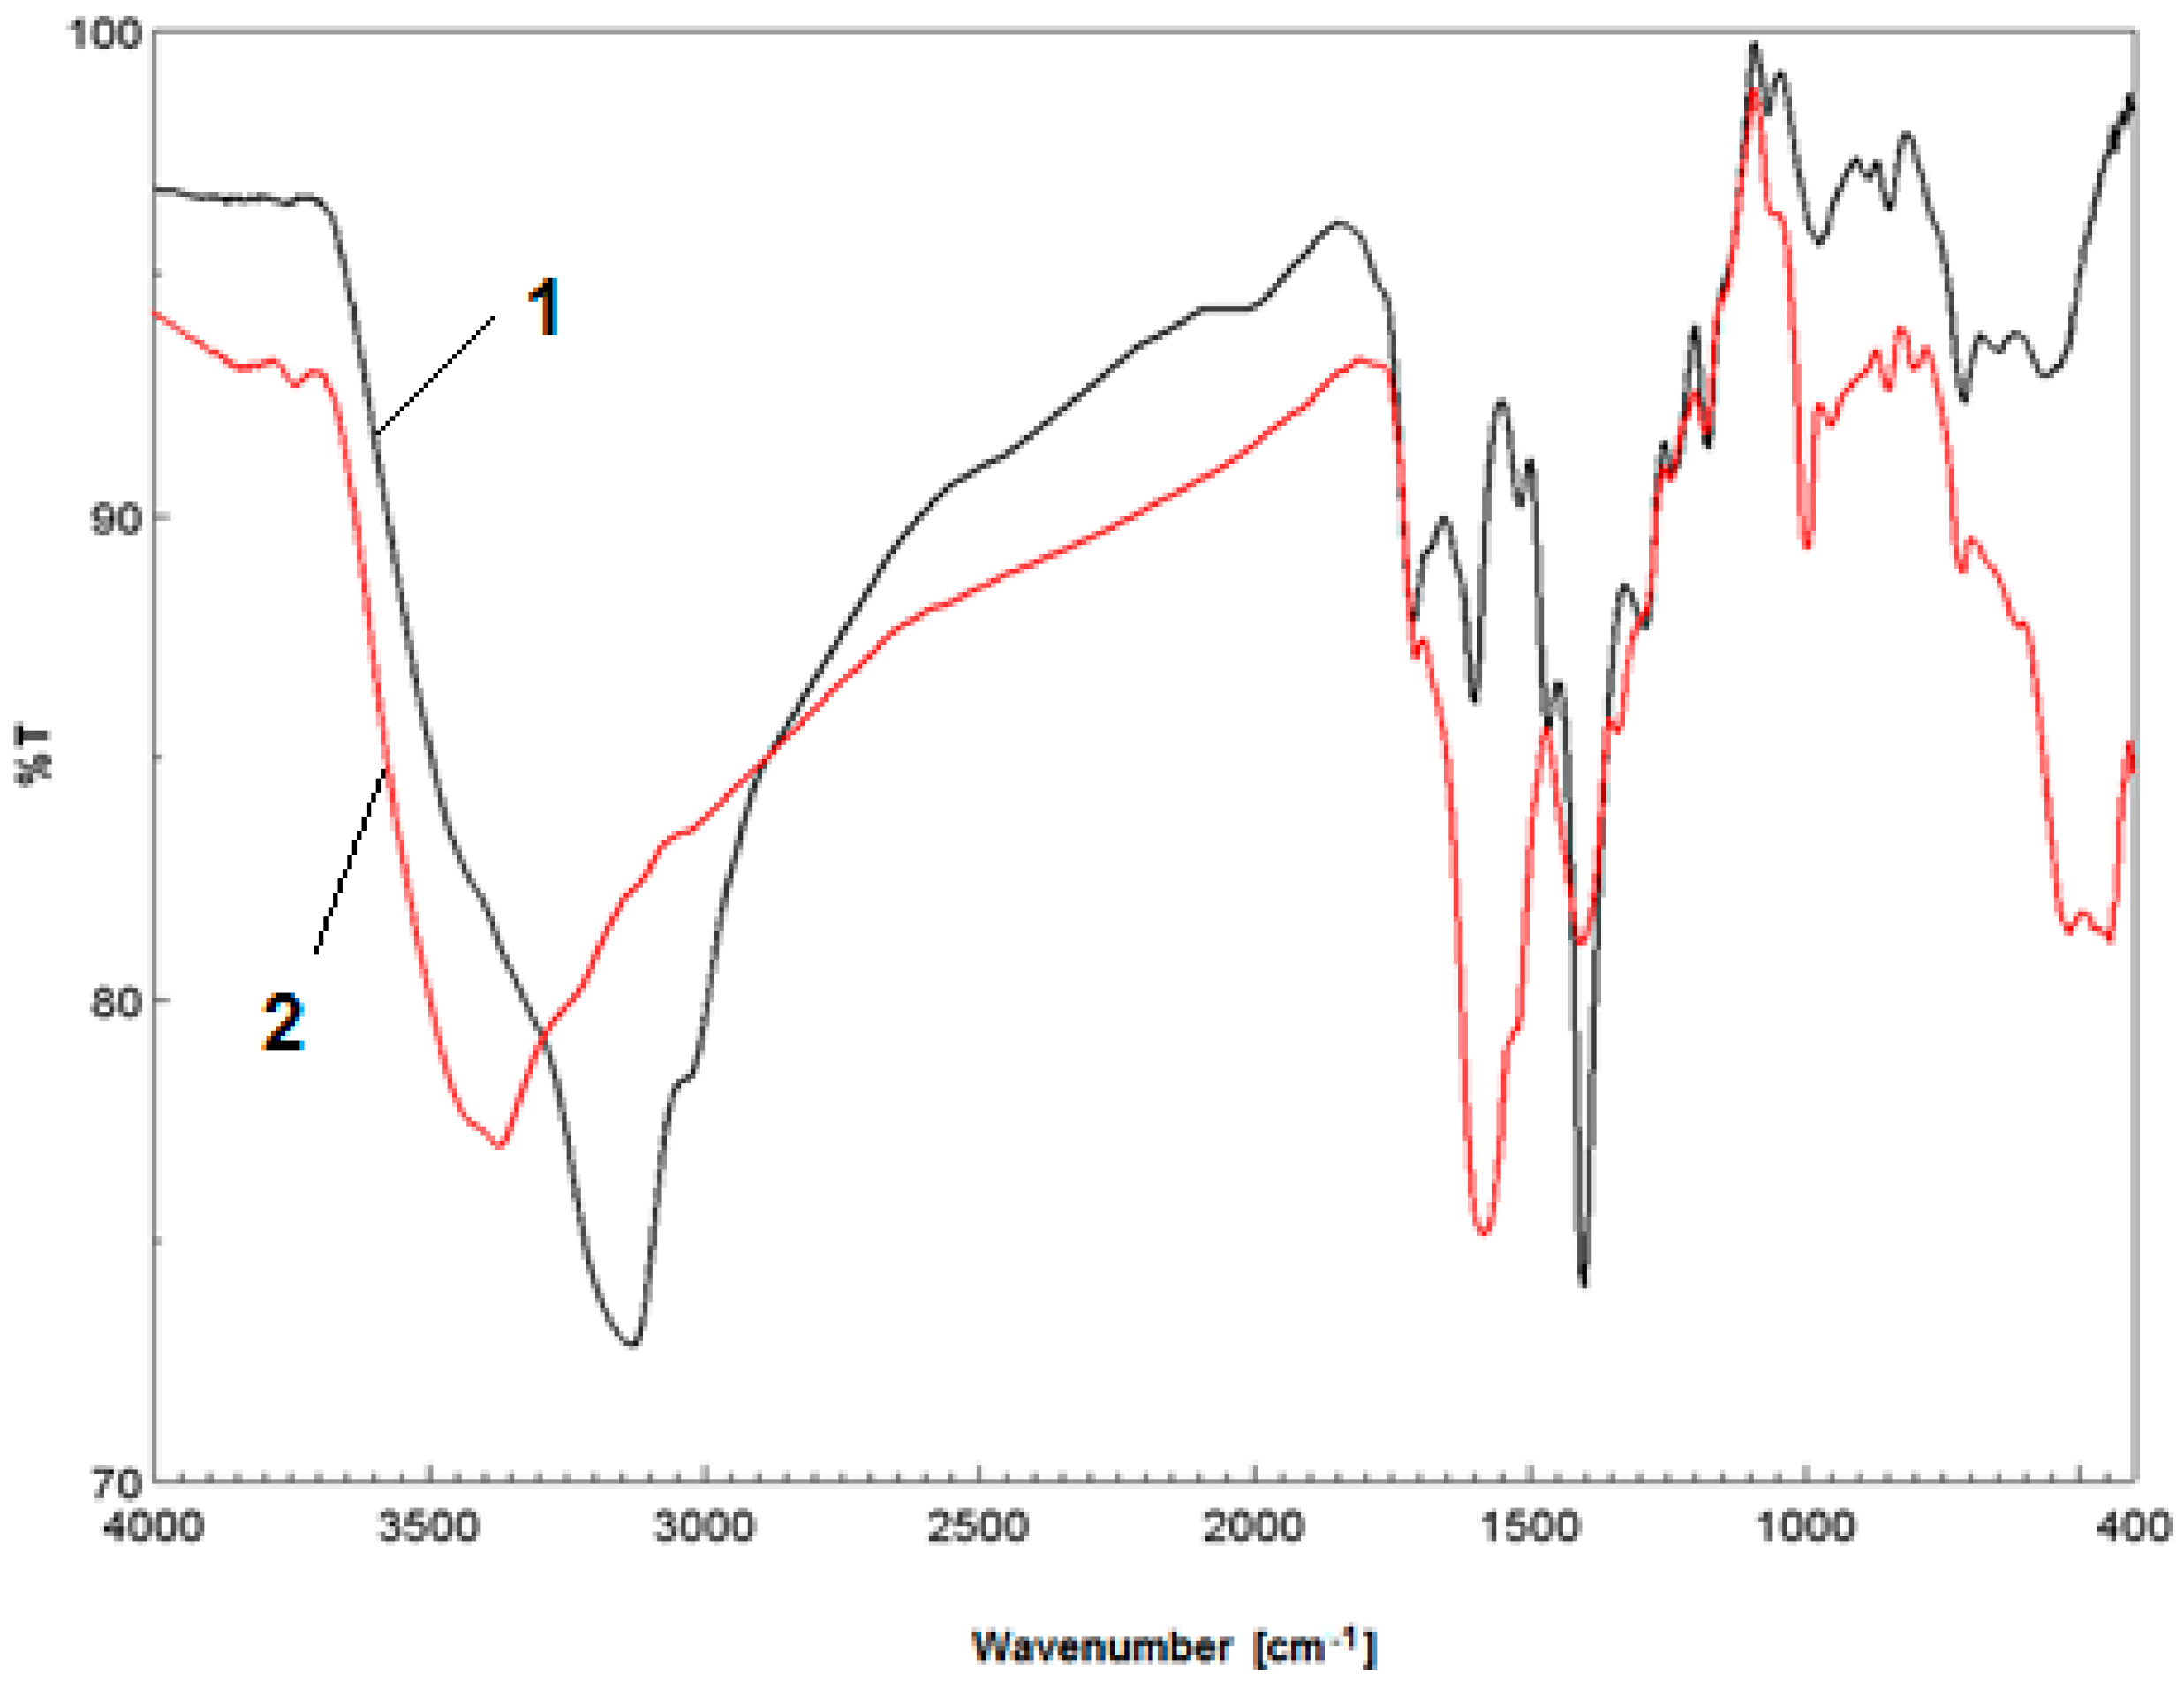
2.3.2. FT-IR Spectroscopy
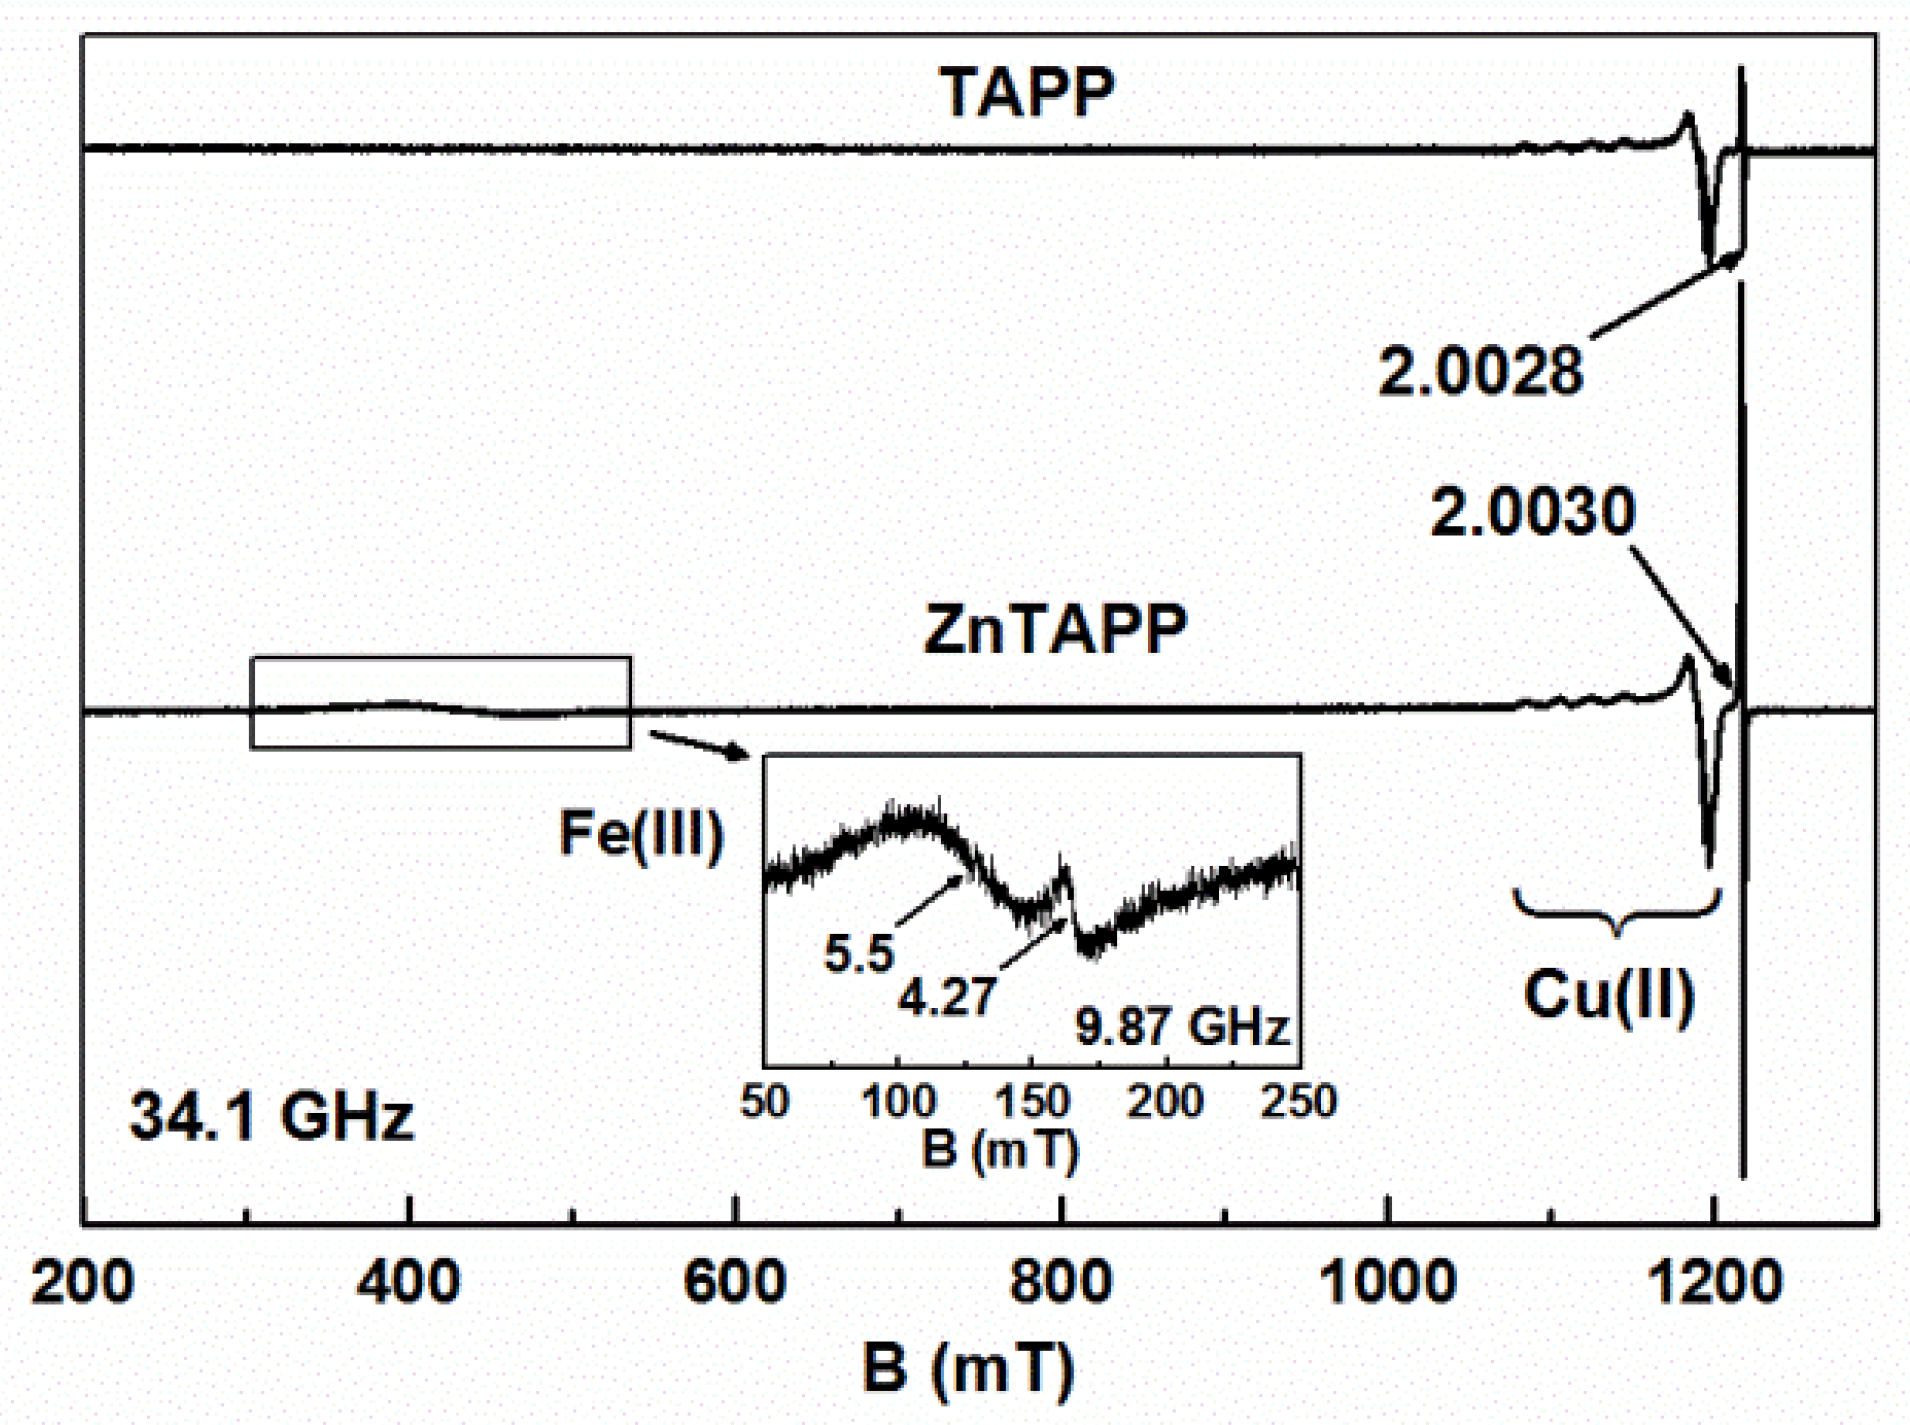
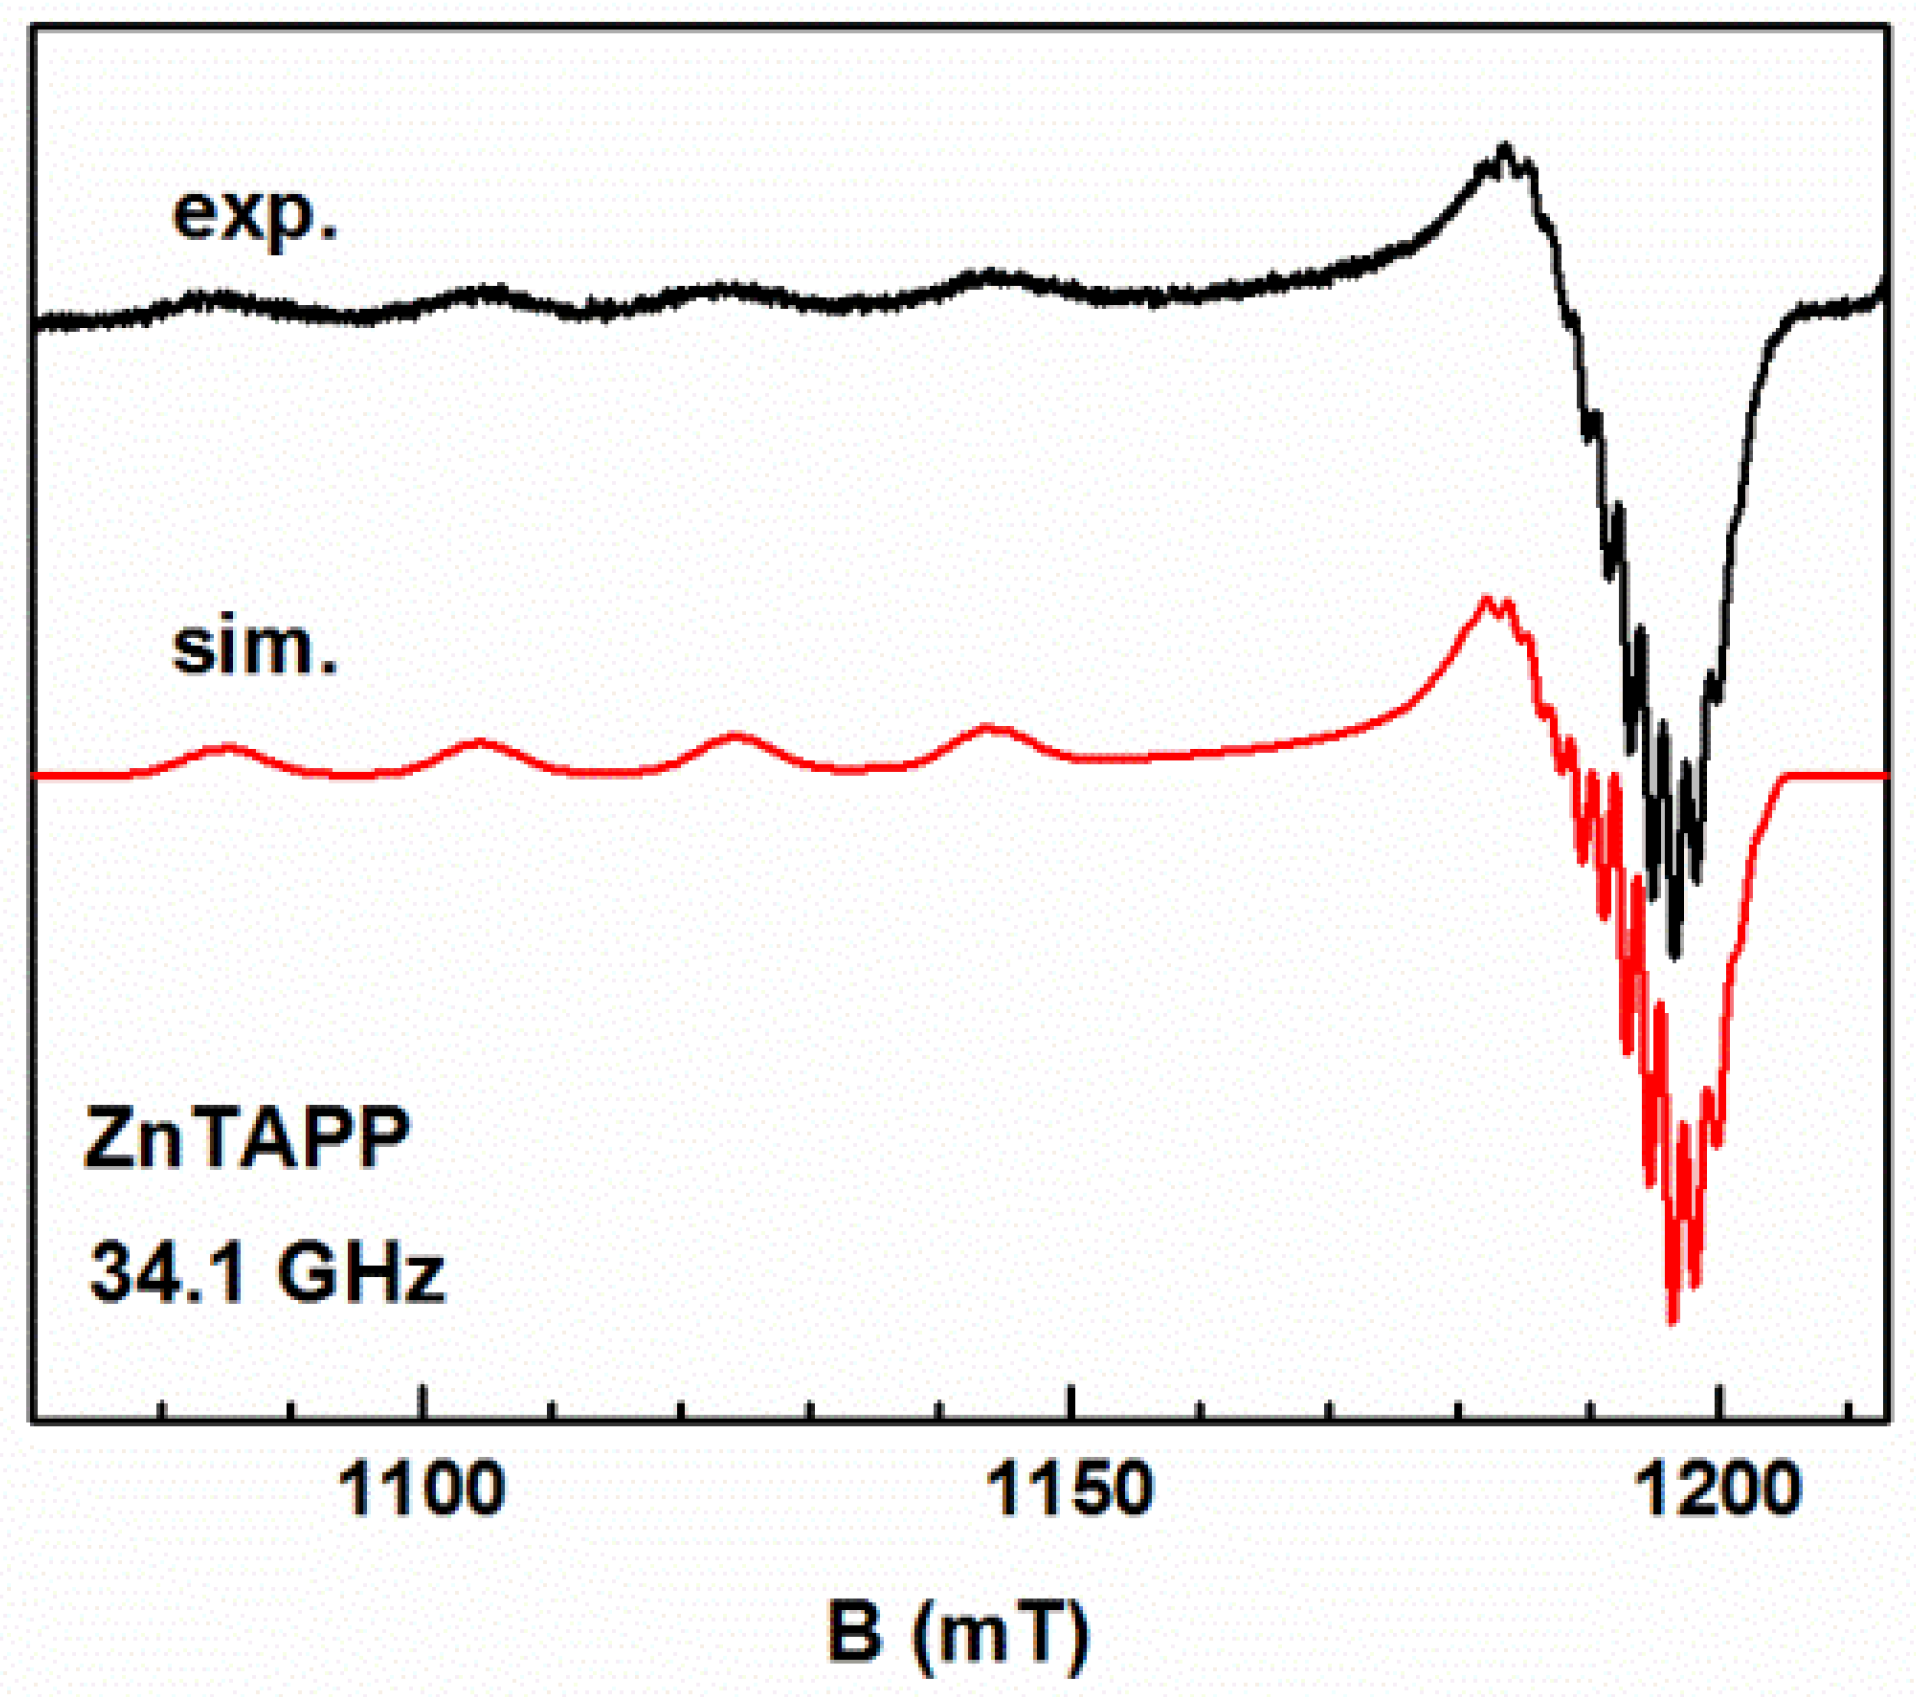
2.3.3. EPR Spectroscopy
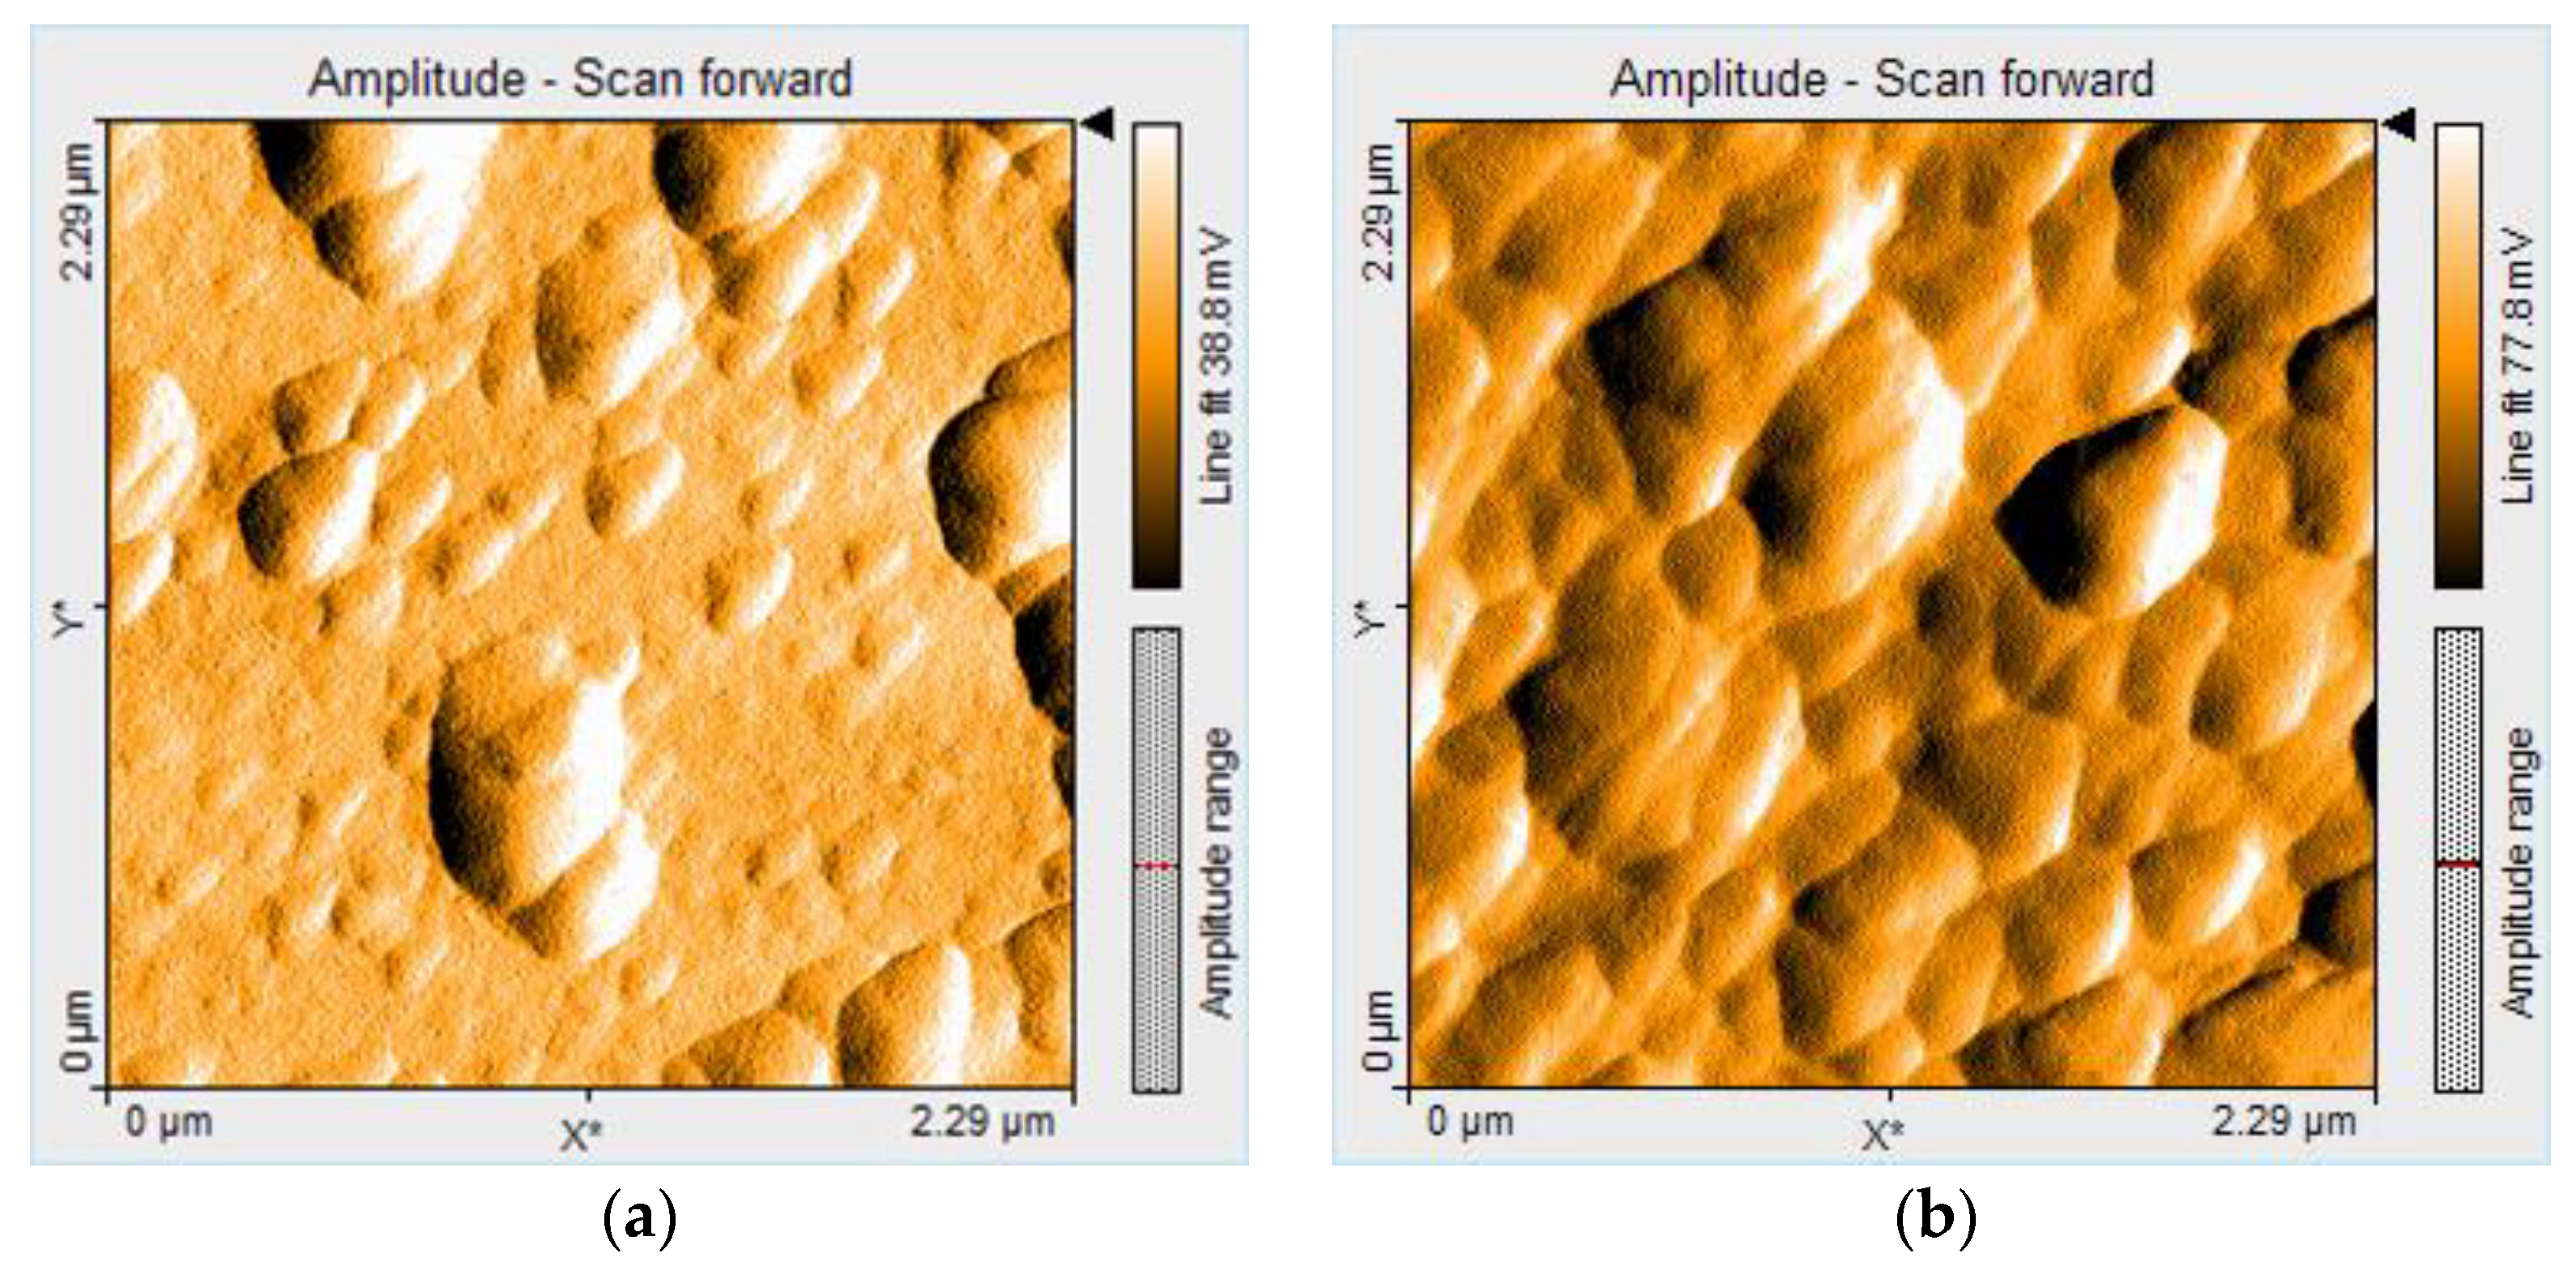
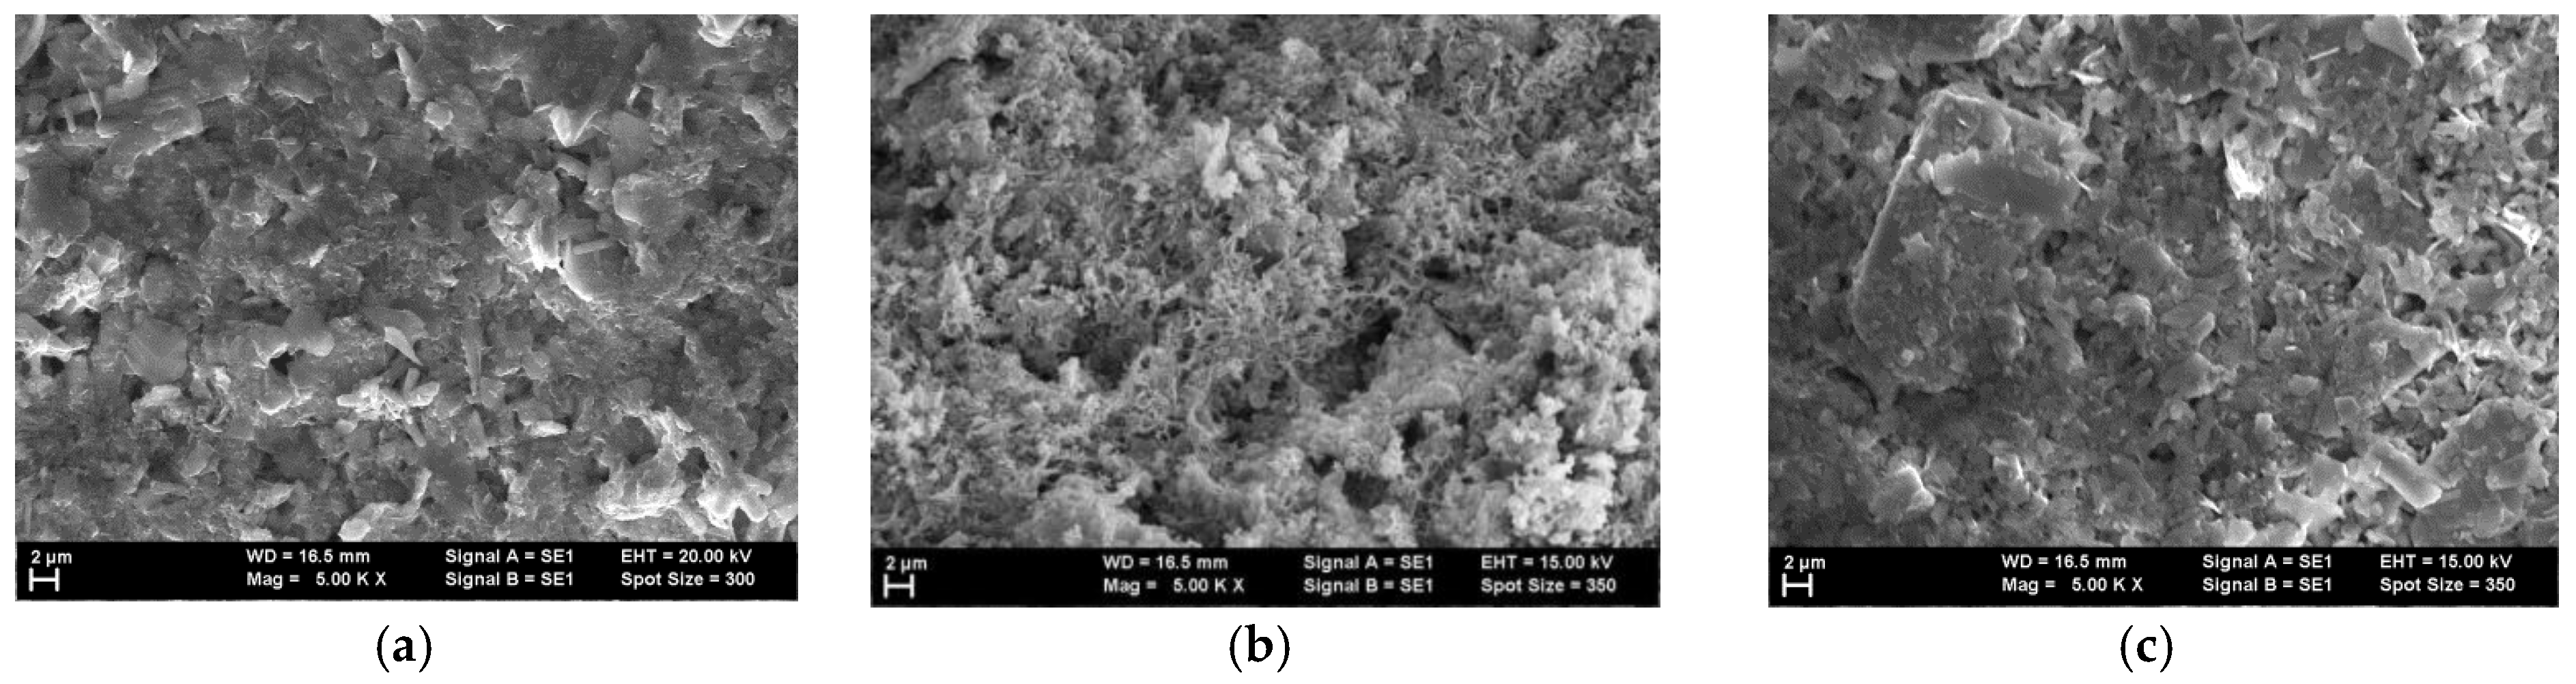
2.3.4. Surface Morphology Characterization by AFM Microscopy
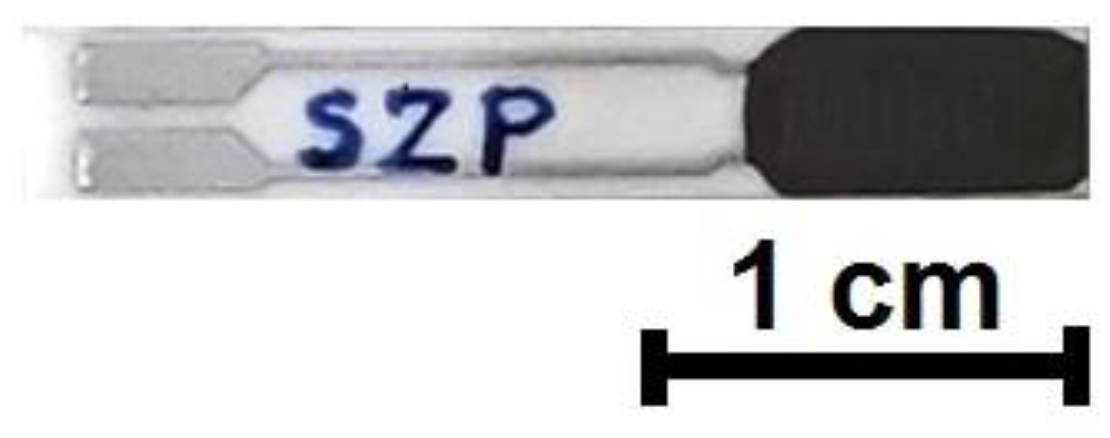
2.4. Nano-Ccomposite Thin Film Preparation
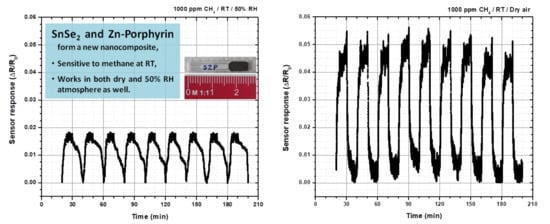
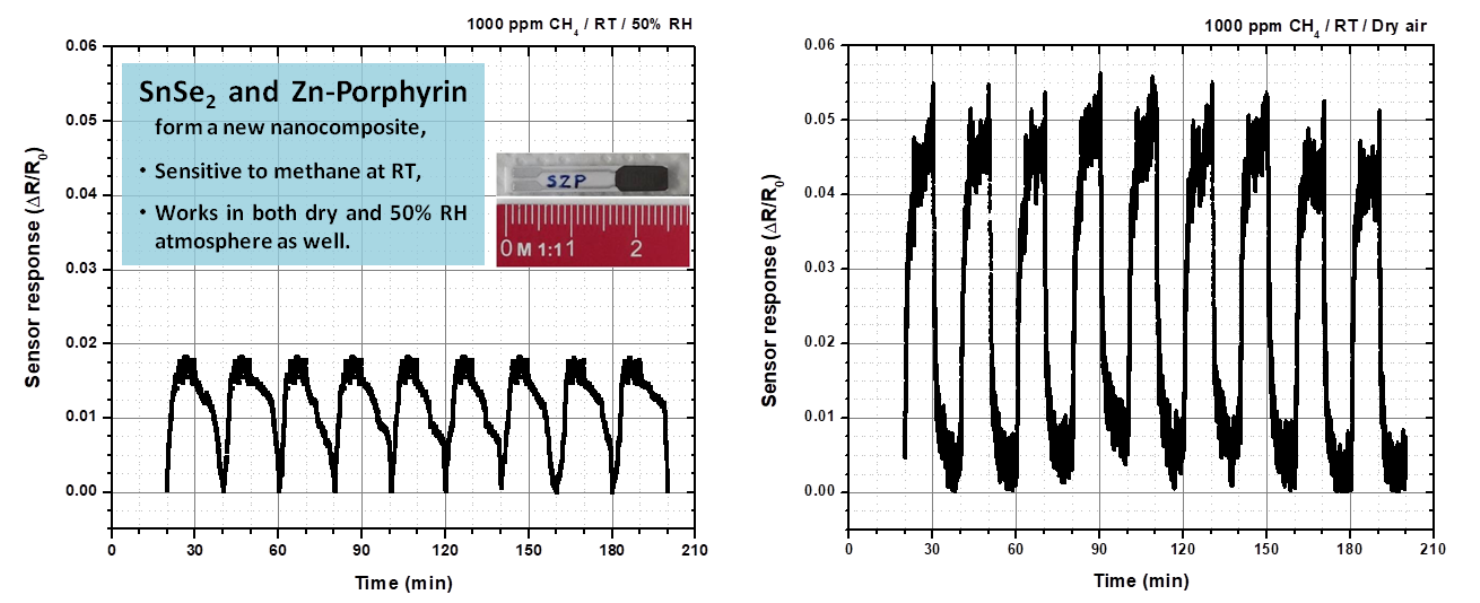
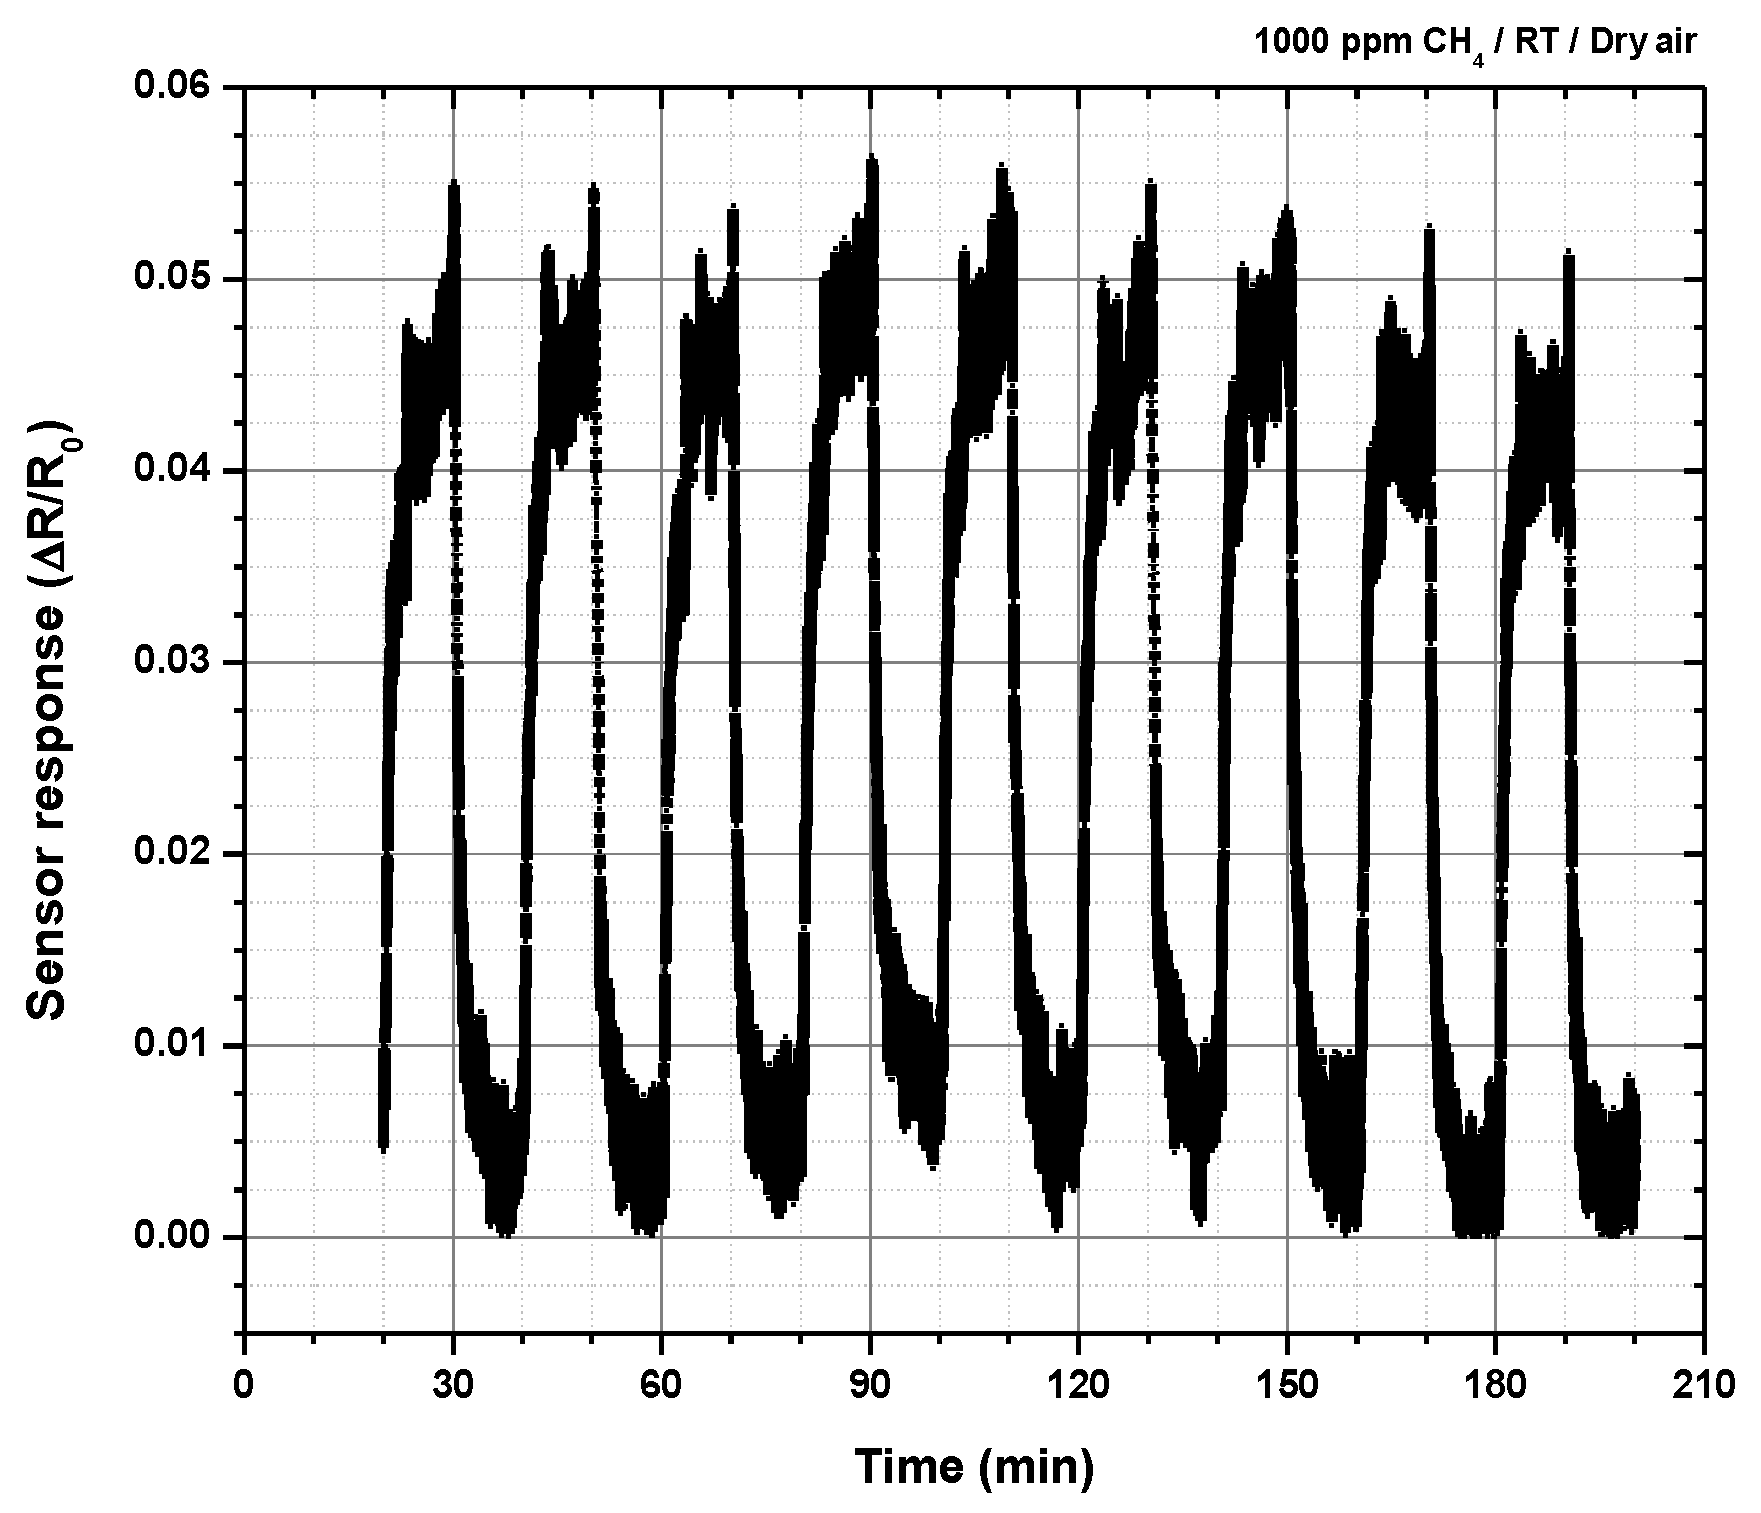
2.5. Testing The Sensor Material for Methane at Room Temperature
3. Discussion
4. Conclusions
Author Contributions
Funding
Conflicts of Interest
References
- Seiyama, T.; Kato, A.; Fujiishi, K.; Nagatani, M. A new detector for gaseous components using semiconductive thin films. Anal. Chem. 1962, 34, 1502–1503. [Google Scholar] [CrossRef]
- Yamazoe, N. New approaches for improving semiconductor gas sensors. Sens. Actuators B Chem. 1991, 5, 7–19. [Google Scholar] [CrossRef]
- Marian, S.; Potje-Kamloth, K.; Tsyulyanu, D.; Liess, H.D. Dimorphite based gas sensitive thin films. Thin Solid Films 2000, 359, 108. [Google Scholar] [CrossRef]
- Tsiuleanu, D.; Marian, S.; Potje-Kamloth, K.; Liess, H.D. Verwendung von Chemisch Sensitiven Chalkogenen und Chalkogeniden zur Detektion von gas- und Dampfförmigen Analyten in Gasen. DE Patent No. DE 100 19010 A1, 25 October 2001. [Google Scholar]
- Mitzi, D.B. Solution Deposition of Chalcogenide Films. U.S. Patent No. 6,875,661, 4 May 2005. [Google Scholar]
- Liu, H.F.; He, Q.X.; Zheng, C.T.; Wang, Y.D. Development of a portable mid-infrared methane detection device. Optoelectron. Lett. 2017, 13, 100–103. [Google Scholar] [CrossRef]
- Ma, H.Y.; Qin, S.L.; Wang, L.Y.; Wang, G.; Zhao, X.H.; Ding, E.J. The study on methane sensing with high-temperature low-power CMOS compatible silicon microheater. Sens. Actuators B Chem. 2017, 244, 17–23. [Google Scholar] [CrossRef]
- Bârsan, N.; Tomescu, A. The temperature dependence of the response of SnO2-based gas sensing layers to O2, CH4 and CO. Sens. Actuators B Chem. 1995, 26, 45–48. [Google Scholar] [CrossRef]
- Sberveglieri, G. (Ed.) Gas Sensors; Kluwer Academic Publishers: Dordrecht, The Netherlands, 1992. [Google Scholar]
- Schierbaum, K.D.; Weimar, U.; Gopel, W. Comparison of ceramic thick-film and thin-film chemical sensors based upon SnO2. Sens. Actuators B Chem. 1992, 7, 709–716. [Google Scholar] [CrossRef]
- Amutha, A.; Amirthapandian, S.; Prasad, A.K.; Panigrahi, B.K.; Thangadurai, P. Methane gas sensing at relatively low operating temperature by hydrothermally prepared SnO2 nanorods. J. Nanopart. Res. 2015, 17, 289. [Google Scholar] [CrossRef]
- Fedorenko, G.; Oleksenko, L.; Maksymovych, N.; Skolyar, G.; Ripko, O. Semiconductor gas sensors based on Pd/SnO2 nanomaterials for methane detection in air. Nanoscale Res. Lett. 2017, 12, 329. [Google Scholar] [CrossRef] [Green Version]
- Mitra, P.; Mukhopadhyay, A.K. ZnO thin film as methane detection sensor. Bull. Pol. Acad. Tech. 2007, 55, 281–285. Available online: http://cgcri.csircentral.net/id/eprint/510 (accessed on 16 November 2020).
- Bhattacharyya, P.; Basu, P.K.; Lang, C.; Saha, H.; Basu, S. Noble metal catalytic contacts to sol-gel nanocrystalline zinc oxide thin films for sensing of methane. Sens. Actuators B Chem. 2008, 129, 551–557. [Google Scholar] [CrossRef]
- Ghosh, S.; RoyChaudhury, C.; Bhattacharyya, R.; Saha, H.; Mukherjee, N. Palladium-Silver-Activated ZnO surface: Highly selective methane sensor at reasonably low operating temperature. ACS Appl. Mater. Interfaces 2014, 6, 3879–3887. [Google Scholar] [CrossRef]
- Wu, Z.; Chen, X.; Zhu, S.; Zhou, Z.; Yao, Y.; Quan, W.; Liu, B. Room temperature methane sensor based on graphene nanosheets/polyaniline nanocomposite thin film. IEEE Sens. J. 2013, 13, 777–782. [Google Scholar] [CrossRef]
- Ghanbari, R.; Safaiee, R.; Sheikhi, M.H.; Golshan, M.M.; Karami Horastani, Z. Graphene decorated with silver nanoparticles as a low-temperature methane gas sensor. ACS Appl. Mater. Interfaces 2019, 11, 21795–21806. [Google Scholar] [CrossRef]
- Lam, K.C.; Huang, B.; Shi, S.Q. Room-temperature methane gas sensing properties based on in situ graphene oxide incorporated with tin oxide. J. Mater. Chem. A 2017, 5, 11131–11142. [Google Scholar] [CrossRef]
- Wang, T.; Huang, D.; Yang, Z.; Xu, S.; He, G.; Li, X.; Hu, N.; Yin, G.; He, D.; Zhang, L. A review on graphene-based gas/vapor sensors with unique properties and potential applications. Nano Micro Lett. 2016, 8, 95–119. [Google Scholar] [CrossRef] [Green Version]
- Yang, N.; Yang, D.; Chen, L.; Liu, D.; Cai, M.; Fan, X. A novel interconnected structure of graphene-carbon nanotubes for the application of methane adsorption. IEEE Sens. J. 2018, 18, 1555–1561. [Google Scholar] [CrossRef]
- Devkota, J.; Kim, K.J.; Ohodnicki, P.R.; Culp, J.T.; Greve, D.W.; Lekse, J.W. Zeolitic imidazolate framework-coated acoustic sensors for room temperature detection of of CO2 and CH4. Nanoscale 2018, 10, 8075–8087. [Google Scholar] [CrossRef] [Green Version]
- Cao, R.; Ding, H.; Peng, Z.; Kim, K.J.; Ohodnicki, P.; Yan, A.; Chen, K.P. Fiber optical sensor for methane detection based on metal-organic framework/silicone polymer coating. In Proceedings of the IEEE Xplore, Conference on Lasers and Electro-Optics (CLEO), San Jose, CA, USA, 13–18 May 2018; p. 8427422. [Google Scholar]
- Cardenas, J.C.; Castillo, L.A.; Molano, W.; Reiber, A.; Sierra, C.A. Flurescent post-synthetic modified MOFs for methane sensing. TechConnect Briefs 2016, 2, 88–91. [Google Scholar]
- Tian, T.; Zeng, Z.; Vulpe, D.; Casco, M.E.; Divitini, G.; Midgley, P.A.; Silvestre-Albero, J.; Tan, J.C.; Moghadam, P.Z.; Fairen-Jimenez, D. A sol-gel monolithic metal-organic framework with enhanced methane uptake. Nat. Mater. 2017, 17, 174–179. [Google Scholar] [CrossRef]
- Zeitler, T.R.; Allendorf, M.D.; Greathouse, J.A. Grand canonical Monte Carlo simulation of low pressure methane adsorption in nanoporous framework materials for sensing applications. J. Phys. Chem. C 2012, 116, 3492–3502. [Google Scholar] [CrossRef]
- Lőrinczi, A.; Făgădar-Cosma, E.; Socol, G.; Mihăilescu, A.; Matei, E.; Ştefan, M.; Logofătu, C. Methane Sensitive Material at Room Temperature. RO Patent Request No. A/00621/29.08.2018. Available online: https://osim.ro/wp-content/uploads/Publicatii-OSIM/BOPI-Inventii/2019/bopi_inv_01_2019.pdf (accessed on 15 December 2020).
- Camargo Moreira, Ó.L.; Cheng, W.-Y.; Fuh, H.-R.; Chien, W.-C.; Yan, W.; Fei, H.; Xu, H.; Zhang, D.; Chen, Y.; Zhao, Y.; et al. High Selectivity Gas Sensing and Charge Transfer of SnSe2. ACS Sens. 2019, 4, 2546–2552. [Google Scholar] [CrossRef] [PubMed]
- Paolucci, V.; D’Olimpio, G.; Kuo, C.-N.; Lue, C.S.; Boukhvalov, W.; Cantalini, C.; Politano, A. Self-Assembled SnO2/SnSe2 Heterostructures: A Suitable Platform for Ultrasensitive NO2 and H2 Sensing. ACS Appl. Mater. Interfaces 2020, 12, 34362–34369. [Google Scholar] [CrossRef] [PubMed]
- Popescu, M.; Sava, F.; Lőrinczi, A.; Socol, G.; Mihăilescu, I.N.; Tomescu, A.; Simion, C. Structure, properties and gas sensing effect of SnSe2 films, prepared by pulsed laser deposition method. J. Non-Cryst. Solids 2007, 353, 1865–1869. [Google Scholar] [CrossRef]
- Popescu, M.; Sava, F.; Lőrinczi, A.; Tomescu, A.; Simion, C.; Socol, G.; Mihailescu, I.N.; Miclos, S.; Savastru, D. Methane-Sensitive Material and Threshold Sensor for Methane Detection. RO Patent No. RO 123461-B1, 29 June 2012. [Google Scholar]
- Assili, K.; Gonzalez, O.; Alouani, K.; Vilanova, X. Structural, morphological, optical and sensing properties of SnSe and SnSe2 thin films as a gas sensing material. Arab. J. Chem. 2020, 13, 1229–1246. [Google Scholar] [CrossRef]
- Chen, M.; Li, Z.; Li, W.; Shan, C.; Li, W.; Li, K.; Gu, G.; Feng, Y.; Zhong, G.; Wei, L.; et al. Large-scale synthesis of single-crystalline self-standing SnSe2 nanoplate arrays for wearable gas sensors. Nanotechnology 2018, 29, 455501. [Google Scholar] [CrossRef]
- Di Natale, C.; Monti, D.; Paolesse, R. Chemical sensitivity of porphyrin assemblies. Mater. Today 2010, 13, 46–52. [Google Scholar] [CrossRef]
- Lvova, L.; Di Natale, C.; Paolesse, R. Porphyrin-based chemical sensors and multisensor arrays operating in the liquid phase. Sens. Actuators B Chem. 2013, 179, 21–31. [Google Scholar] [CrossRef]
- Paolesse, R.; Lvova, L.; Nardis, S.; Di Natale, C.; D’Amico, A.; Lo Castro, F. Chemical images by porphyrin arrays of sensors. Microchim. Acta 2008, 163, 103–112. [Google Scholar] [CrossRef]
- Monti, D.; Nardis, S.; Stefanelli, M.; Paolesse, R.; Di Natale, C.; D’Amico, A. Porphyrin-Based Nanostructures for Sensing Applications. J. Sens. 2009, 2009, 856053. [Google Scholar] [CrossRef] [Green Version]
- Paolesse, R.; Nardis, S.; Monti, D.; Stefanelli, M.; Di Natale, C. Porphyrinoids for Chemical Sensor Applications. Chem. Rev. 2017, 117, 2517–2583. [Google Scholar] [CrossRef] [PubMed] [Green Version]
- Ngo, H.T.; Minami, K.; Imamura, G.; Shiba, K.; Yoshikawa, G. Effects of Center Metals in Porphines in Nanomechanical Gas Sensing. Sensors 2018, 18, 1640. [Google Scholar] [CrossRef] [PubMed] [Green Version]
- Osica, I.; Imamura, G.; Shiba, K.; Ji, Q.; Shrestha, L.K.; Hill, J.P.; Kurzydłowski, K.J.; Yoshikawa, G.; Ariga, K. Highly Networked Capsulled Silica-Porphyrin Hybrid Nanostructures as Efficient Materials for Acetone Vapor Sensing. ACS Appl. Mater. Interfaces 2017, 9, 9945–9954. [Google Scholar] [CrossRef] [PubMed]
- Lascu, A.; Palade, A.; Fagadar-Cosma, G.; Creanga, I.; Ianasi, C.; Sebarchievici, I.; Birdeanu, M.; Fagadar-Cosma, E. Mesoporous manganese-porphyrin-silica hybrid nanomaterial sensitive to H2O2 fluorescent detection. Mater. Res. Bull. 2016, 74, 325–332. [Google Scholar] [CrossRef]
- Popescu, M.; Simandan, I.D.; Sava, F.; Velea, A.; Fagadar-Cosma, E. Sensor of Nitrogen Dioxide Based on Single Wall Carbon Nanotubes and Manganese-Porphyrin. Dig. J. Nanomater. Biostruct. 2011, 6, 1253–1256. [Google Scholar]
- Wang, Y.; Akhigbe, J.; Ding, Y.; Brueckner, C.; Lei, Y. Meso-Tritolylcorrole-Functionalized Single-walled Carbon Nanotube Donor-Acceptor Nanocomposites for NO2 Detection. Electroanalysis 2012, 24, 1348–1355. [Google Scholar] [CrossRef]
- Liu, S.F.; Moh, L.C.H.; Swager, T.M. Single-Walled Carbon Nanotube–Metalloporphyrin Chemiresistive Gas Sensor Arrays for Volatile Organic Compounds. Chem. Mater. 2015, 27, 3560–3563. [Google Scholar] [CrossRef] [Green Version]
- Penza, M.; Rossi, R.; Alvisi, M.; Signore, M.A.; Serra, E.; Paolesse, R.; D’Amico, A.; Di Natale, C. Metalloporphyrins-modified carbon nanotubes networked films-based chemical sensors for enhanced gas sensitivity. Sens. Actuators B Chem. 2010, 144, 387–394. [Google Scholar] [CrossRef]
- Penza, M.; Alvisi, M.; Rossi, R.; Serra, E.; Paolesse, R.; D’Amico, A.; Di Natale, C. Carbon nanotube films as a platform to transduce molecular recognition events in metalloporphyrins. Nanotechnology 2011, 22, 125502. [Google Scholar] [CrossRef]
- Saxena, S.; Verma, A.L. Metal-tetraphenylporphyrin functionalized carbon nanotube composites as sensor for benzene, toluene and xylene vapors. Adv. Mater. Lett. 2014, 5, 472–478. [Google Scholar] [CrossRef]
- Saxena, S.; Saini, G.S.S.; Verma, A.L. Co-TPP functionalized carbon nanotube composites for detection of nitrobenzene and chlorobenzene vapours. Bull. Mater. Sci. 2015, 38, 443–449. [Google Scholar] [CrossRef] [Green Version]
- Shirsat, M.D.; Sarkar, T.; Kakoullis, J.; Myung, N.V.; Konnanath, B.; Spanias, A.; Mulchandani, A. Porphyrin-Functionalized Single-Walled Carbon Nanotube Chemiresistive Sensor Arrays for VOCs. J. Phys. Chem. C 2012, 116, 3845–3850. [Google Scholar] [CrossRef] [PubMed] [Green Version]
- Rushi, A.; Datta, K.; Ghosh, P.; Mulchandani, A.; Shirsat, M.D. Iron tetraphenylporphyrin functionalized single wall carbon nanotubes for the detection of benzene. Mater. Lett. 2013, 96, 38–41. [Google Scholar] [CrossRef]
- Sarkar, T.; Srinives, S.; Sarkar, S.; Haddon, R.C.; Mulchandani, A. Single-Walled Carbon Nanotube-Poly(porphyrin) Hybrid for Volatile Organic Compounds Detection. J. Phys. Chem. C 2014, 118, 1602–1610. [Google Scholar] [CrossRef]
- Fagadar-Cosma, E.; Tarabukina, E.; Zakharova, N.; Birdeanu, M.; Taranu, B.; Palade, A.; Creanga, I.; Lascu, A.; Fagadar-Cosma, G. Hybrids formed between poly-vinylpyrrolidone and an A3B porphyrin dye: Behaviour in aqueous solutions and chemical response to CO2 presence. Polym. Int. 2016, 65, 200–209. [Google Scholar] [CrossRef]
- Mak, C.A.; Pericas, M.A.; Fagadar-Cosma, E. Functionalization of A3B-type porphyrin with Fe3O4 MNPs. Supra-molecular assemblies, gas sensor and catalytic applications. Catal. Today 2018, 306, 268–275. [Google Scholar] [CrossRef]
- Fagadar-Cosma, E.; Vlascici, D.; Fagadar-Cosma, G.; Palade, A.; Lascu, A.; Creanga, I.; Birdeanu, M.; Cristescu, R.; Cernica, I. A Sensitive A3B Porphyrin Nanomaterial for CO2 Detection. Molecules 2014, 19, 21239–21252. [Google Scholar] [CrossRef] [Green Version]
- Fagadar-Cosma, E.; Badea, V.; Fagadar-Cosma, G.; Palade, A.; Lascu, A.; Fringu, I.; Birdeanu, M. Trace Oxygen Sensitive Material Based on Two Porphyrin Derivatives in a Hetereodimeric Complex. Molecules 2017, 22, 1787. [Google Scholar] [CrossRef] [Green Version]
- Garg, K.; Singh, A.; Debnath, A.K.; Nayak, S.K.; Chattopadhyay, S.; Aswal, D.K.; Hayakawa, Y.; Gupta, S.K.; Yakhmi, J.V. Bis-porphyrin films as ppb level chemiresistive sensors. Chem. Phys. Lett. 2010, 488, 27–31. [Google Scholar] [CrossRef]
- Garg, K.; Singh, A.; Majumder, C.; Nayak, S.K.; Aswal, D.K.; Gupta, S.K.; Chattopadhyay, S. Room temperature ammonia sensor based on jaw like bis-porphyrin molecules. Org. Electron. 2013, 14, 1189–1196. [Google Scholar] [CrossRef]
- Park, J.H.; Ko, J.H.; Hong, S.; Shin, Y.J.; Park, N.; Kang, S.; Lee, S.M.; Kim, H.J.; Son, S.U. Hollow and Microporous Zn-Porphyrin Networks: Outer Shape Dependent Ammonia Sensing by Quartz Crystal Microbalance. Chem. Mater. 2015, 27, 5845–5848. [Google Scholar] [CrossRef]
- Colombelli, A.; Manera, M.G.; Borovkov, V.; Giancane, G.; Valli, L.; Rella, R. Enhanced sensing properties of cobalt bis-porphyrin derivative thin films by a magneto-plasmonic-opto-chemical sensor. Sens. Actuators B Chem. 2017, 246, 1039–1048. [Google Scholar] [CrossRef]
- Çapan, I.; Ozkaya, C. Characterization of Octaethyl Porphyrin Thin Films with Application to Determination of Volatile Organic Compounds. Anal. Lett. 2016, 49, 423–432. [Google Scholar] [CrossRef]
- Çapan, İ.; Erdoğan, M.; Güner, B.; İlhan, B.; Stanciu, S.G.; Hristu, R.; Stanciu, G.A. Gas Sensing Properties of Porphyrin Thin Films Influenced by Their Surface Morphologies. Sens. Lett. 2014, 12, 1218–1227. [Google Scholar] [CrossRef]
- Guillen, M.G.; Gamez, F.; Roales, J.; Lopes-Costa, T.; Pinto, S.M.A.; Calvete, M.J.F.; Pereira, M.M.; Pedrosa, J.M. Molecular-based selection of porphyrins towards the sensing of explosives in the gas phase. Sens. Actuators B Chem. 2018, 260, 116–124. [Google Scholar] [CrossRef]
- Garcia-Berrios, E.; Theriot, J.C.; Woodka, M.D.; Lewis, N.S. Detection of ammonia, 2,4,6-trinitrotoluene, and common organic vapors using thin-film carbon black-metallo-porphyrin composite chemiresistors. Sens. Actuators B Chem. 2013, 188, 761–767. [Google Scholar] [CrossRef]
- Bettelheim, A.; White, B.A.; Raybuck, S.A.; Murray, R.W. Electrochemical polymerization of amino-, pyrrole-, and hydroxy- substituted tetraphenylporphyrins. Inorg. Chem. 1987, 26, 1009–1017. [Google Scholar] [CrossRef]
- Araghi, M.; Mirkhani, V.; Moghadam, M.; Tangestaninejad, S.; Mohammdpoor-Baltork, I. Synthesis and characterization of a new porphyrin-polyoxomometalate hybrid material and investigation of its catalytic activity. Dalton Trans. 2012, 41, 3087–3094. [Google Scholar] [CrossRef] [Green Version]
- Stoll, S.; Schweiger, A. EasySpin, a comprehensive software package for spectral simulation and analysis in EPR. J. Magn. Reson. 2006, 178, 42–55. [Google Scholar] [CrossRef]
- Vhadlure, A.N.; Rohikar, R.V.; Kulkarni, G.A.; Suryavanshi, A.W.; Mathkari, S.S.; Mathapati, S.R. Synthesis and Spectral Characterization of Substituted Tetraphenylporphyrin Iron Chloride Complexes. Int. J. Chem. Tech. Res. 2013, 5, 522–527. [Google Scholar]
- Nguyen, T.N.; Håkansson, P.; Edge, R.; Collison, D.; Goodman, B.A.; Burns, J.R.; Stulz, E. EPR based distance measurement in Cu-porphyrin-DNA. New J. Chem. 2014, 38, 5254–5259. [Google Scholar] [CrossRef]
- McQuarters, A.B.; Goodrich, L.E.; Goodrich, C.M.; Lehnert, N. Disproportionation of O-Benzylhydroxylamine Catalyzed by a Ferric Bis-Picket Fence Porphyrin Complex. Z. Anorg. Allg. Chem. 2013, 639, 1520–1526. [Google Scholar] [CrossRef] [Green Version]
- Askhabov, A.M.; Yushkin, N.P. The kvataron mechanism responsible for the genesis of noncrystalline forms of nanostructures. Doklady Earth Sci. 1999, 368, 940–942. [Google Scholar]
- Sakka, S.; Kozuka, H. (Eds.) Handbook of Sol-Gel Science and Technology. 1. Sol-Gel Processing; Kluwer Academic Publishers: Osaka, Japan, 2005; p. 228. [Google Scholar]
- Nardis, S.; Pomarico, G.; Tortora, L.; Capuano, R.; D’Amico, A.; Di Natale, C.; Paolesse, R. Sensing mechanisms of supramolecular porphyrin aggregates: A teamwork task for the detection of gaseous analytes. J. Mater Chem. 2011, 21, 18638–18644. [Google Scholar] [CrossRef]
- Magna, G.; Dinc Zor, S.; Catini, A.; Capuano, R.; Basoli, F.; Martinelli, E.; Paolesse, R.; Di Natale, C. Surface arrangement dependent selectivity of porphyrins gas sensors. Sens. Actuators B Chem. 2017, 251, 524–532. [Google Scholar] [CrossRef]
- Lower and Upper Explosive Limits forFlammable Gases and Vapors (LEL/UEL). Available online: https://www.mathesongas.com/pdfs/products/Lower-(LEL)-&-Upper-(UEL)-Explosive-Limits-.pdf (accessed on 25 October 2020).
- Zeng, J.; Liu, E.; Fu, Y.; Chen, Z.; Pan, C.; Wang, C.; Wang, M.; Wang, Y.; Xu, K.; Cai, S.; et al. Gate-Induced Interfacial Superconductivity in 1T-SnSe2. Nano Lett. 2018, 18, 1410–1415. [Google Scholar] [CrossRef] [Green Version]
- Rushi, D.; Datta, K.P.; Ghosh, P.; Mulchandani, A.; Shirsat, M.D. Exercising substituents in porphyrins for real time selective sensing of volatile organic compounds. Sens. Actuators B Chem. 2018, 257, 389–397. [Google Scholar] [CrossRef]
- Favereau, L.; Cnossen, A.; Kelber, J.B.; Gong, J.Q.; Oetterli, R.M.; Cremers, J.; Herz, L.M.; Anderson, H.L. Six-Coordinate Zinc-Porphyrins for Template-Directed Synthesis of Spiro-Fused Nanorings. J. Am. Chem. Soc. 2015, 137, 14256–14259. [Google Scholar] [CrossRef]
- Schalk, O.; Liang, Y.; Unterreiner, A.N. On Ligand Binding Energies in Porphyrinic Systems. Z. Phys. Chem. 2013, 227, 35–47. [Google Scholar] [CrossRef]
- Pearson, R.G. Hard and Soft Acids and Bases. J. Am. Chem. Soc. 1963, 85, 3533. [Google Scholar] [CrossRef]
- Zhuo, C.-C.; Li, L.; Hu, C.-J.; Lang, J.-P. Host-guest assembly for highly sensitive probing of a chiral mono-alcohol with a zinc trisphorphyrinate. Sci. Rep. 2017, 7, 3829. [Google Scholar] [CrossRef] [Green Version]
- Ray, P.C.; Leszczynski, J. Nonlinear optical properties of highly conjugated push-pull porphyrin aggregates: Role of intermolecular interaction. Chem. Phys. Lett. 2006, 419, 578. [Google Scholar] [CrossRef]
- Tracy, B.D.; Li, X.; Liu, X.; Furdyna, J.; Dobrowolska, M.; Smith, D.J. Characterization of structural defects in SnSe2 thin films grown by molecular beam epitaxy on GaAs (111)B substrates. J. Cryst. Growth 2016, 453, 58–64. [Google Scholar] [CrossRef] [Green Version]
- Yu, P.; Yu, X.C.; Lu, W.L.; Lin, H.; Sun, L.F.; Du, K.; Liu, F.; Fu, W.; Zeng, Q.; Shen, Z.; et al. Fast Photoresponse from 1T Tin Diselenide Atomic Layers. Adv. Funct. Mater. 2016, 26, 137–145. [Google Scholar] [CrossRef]
- Busch, G.; Fröhlich, C.; Hulliger, F.; Steigmeier, E. Struktur, elektrische und thermoelektrische Eigenschaften von SnSe2. Helv. Phys. Acta 1961, 34, 359–368. [Google Scholar] [CrossRef]
- Bletskan, D.I. Phase Equilibrium in Binary Systems AIVBVI. J. Ovonic Res. 2005, 1, 61–69. Available online: https://chalcogen.ro/Bletskan2.pdf (accessed on 29 October 2020).
- Tsiulyanu, D. Gas-sensing features of nanostructured tellurium thin films. Beilstein J. Nanotechnol. 2020, 11, 1010–1018. [Google Scholar] [CrossRef]
- Elefante, A.; Giglio, M.; Sampaolo, A.; Menduni, G.; Patimisco, P.; Passaro, V.M.N.; Wu, H.; Rossmadl, H.; Mackowiak, V.; Cable, A.; et al. Dual-Gas Quartz-Enhanced Photoacoustic Sensor for Simultaneous Detection of Methane/Nitrous Oxide and Water Vapor. Anal. Chem. 2019, 91, 12866–12873. [Google Scholar] [CrossRef] [PubMed]
- Dosi, M.; Lau, I.; Zhuang, Y.; Simakov, D.S.A.; Fowler, M.W.; Pope, M.A. Ultrasensitive Electrochemical Methane Sensors Based on Solid Polymer Electrolyte-Infused Laser-Induced Graphene. ACS Appl. Mater. Interfaces 2019, 11, 6166–6173. [Google Scholar] [CrossRef]
- Ravikumar, A.P.; Wang, J.; Brandt, A.R. Are Optical Gas Imaging Technologies Effective for Methane Leak Detection? Environ. Sci. Technol. 2017, 51, 718–724. [Google Scholar] [CrossRef]
- Gross, P.-A.; Jaramillo, T.; Pruitt, B. Cyclic-Voltammetry-Based Solid-State Gas Sensor for Methane and Other VOC Detection. Anal. Chem. 2018, 90, 6102–6108. [Google Scholar] [CrossRef] [PubMed]
- Tang, C.; Ku, K.H.; Lennon Luo, S.-X.; Concellón, A.; Wu, Y.-C.M.; Lu, R.-Q.; Swager, T.M. Chelating Phosphine Ligand Stabilized AuNPs in Methane Detection. ACS Nano 2020, 14, 11605–11612. [Google Scholar] [CrossRef] [PubMed]
- Cui, R.; Dong, L.; Wu, H.; Ma, W.; Xiao, L.; Jia, S.; Chen, W.; Tittel, F.K. Three-Dimensional Printed Miniature Fiber-Coupled Multipass Cells with Dense Spot Patterns for ppb-Level Methane Detection Using a Near-IR Diode Laser. Anal. Chem. 2020, 92, 13034–13041. [Google Scholar] [CrossRef] [PubMed]


| Sensitive Material | Detection Method | Linear Concentration Range (ppm) | Detection Limit (ppm, ppb) | Reference |
|---|---|---|---|---|
| Dual-gas quartzenhanced photoacoustic (QEPAS) sensor | Diode laser and a quantum cascade laser | - | 18 ppb for CH4, 5 ppb for N2O and 20 ppm for water vapor | [85] |
| Graphene electrodes decorated with palladium NPs | Electrooxidation of methane to CO2 | 1 to 50 ppm | 9 ppm | [86] |
| Optical Gas Imaging Technologies | Passive infrared (IR) imaging | 1 g/s to 21 g/s Leak size | - | [87] |
| A reference Ag layer, adhesion layer, a Nafion layer and two interdigitated Pt electrodes all on top of a Si/SiO2 substrate. | Cyclic Voltammetry | Detect methane dissolved in N2 from 10% to 50% | 10% CH4 in N2 | [88] |
| Chelating Phosphine Ligand Stabilized AuNPs | Chemiresistive methane detection | 200 ppm to 1000 ppm | 100 ppm at 80 °C | [89] |
| Mini-multi-pass cell with a 4.2 m optical path length using two common spherical mirrors | Tunable diode laser absorption spectroscopy | 1.98 to 9.28 ppm | 117 ppb | [90] |
| Graphene Decorated with Silver Nanoparticles | Electrical resistance measurements | 400−20000 ppm at room temperature | - | [91] |
| PdPt Bimetal-Functionalized SnO2 Nanosheets | Electrical resistance measurements | - | 500 ppm of CH4 at 320 °C | [17] |
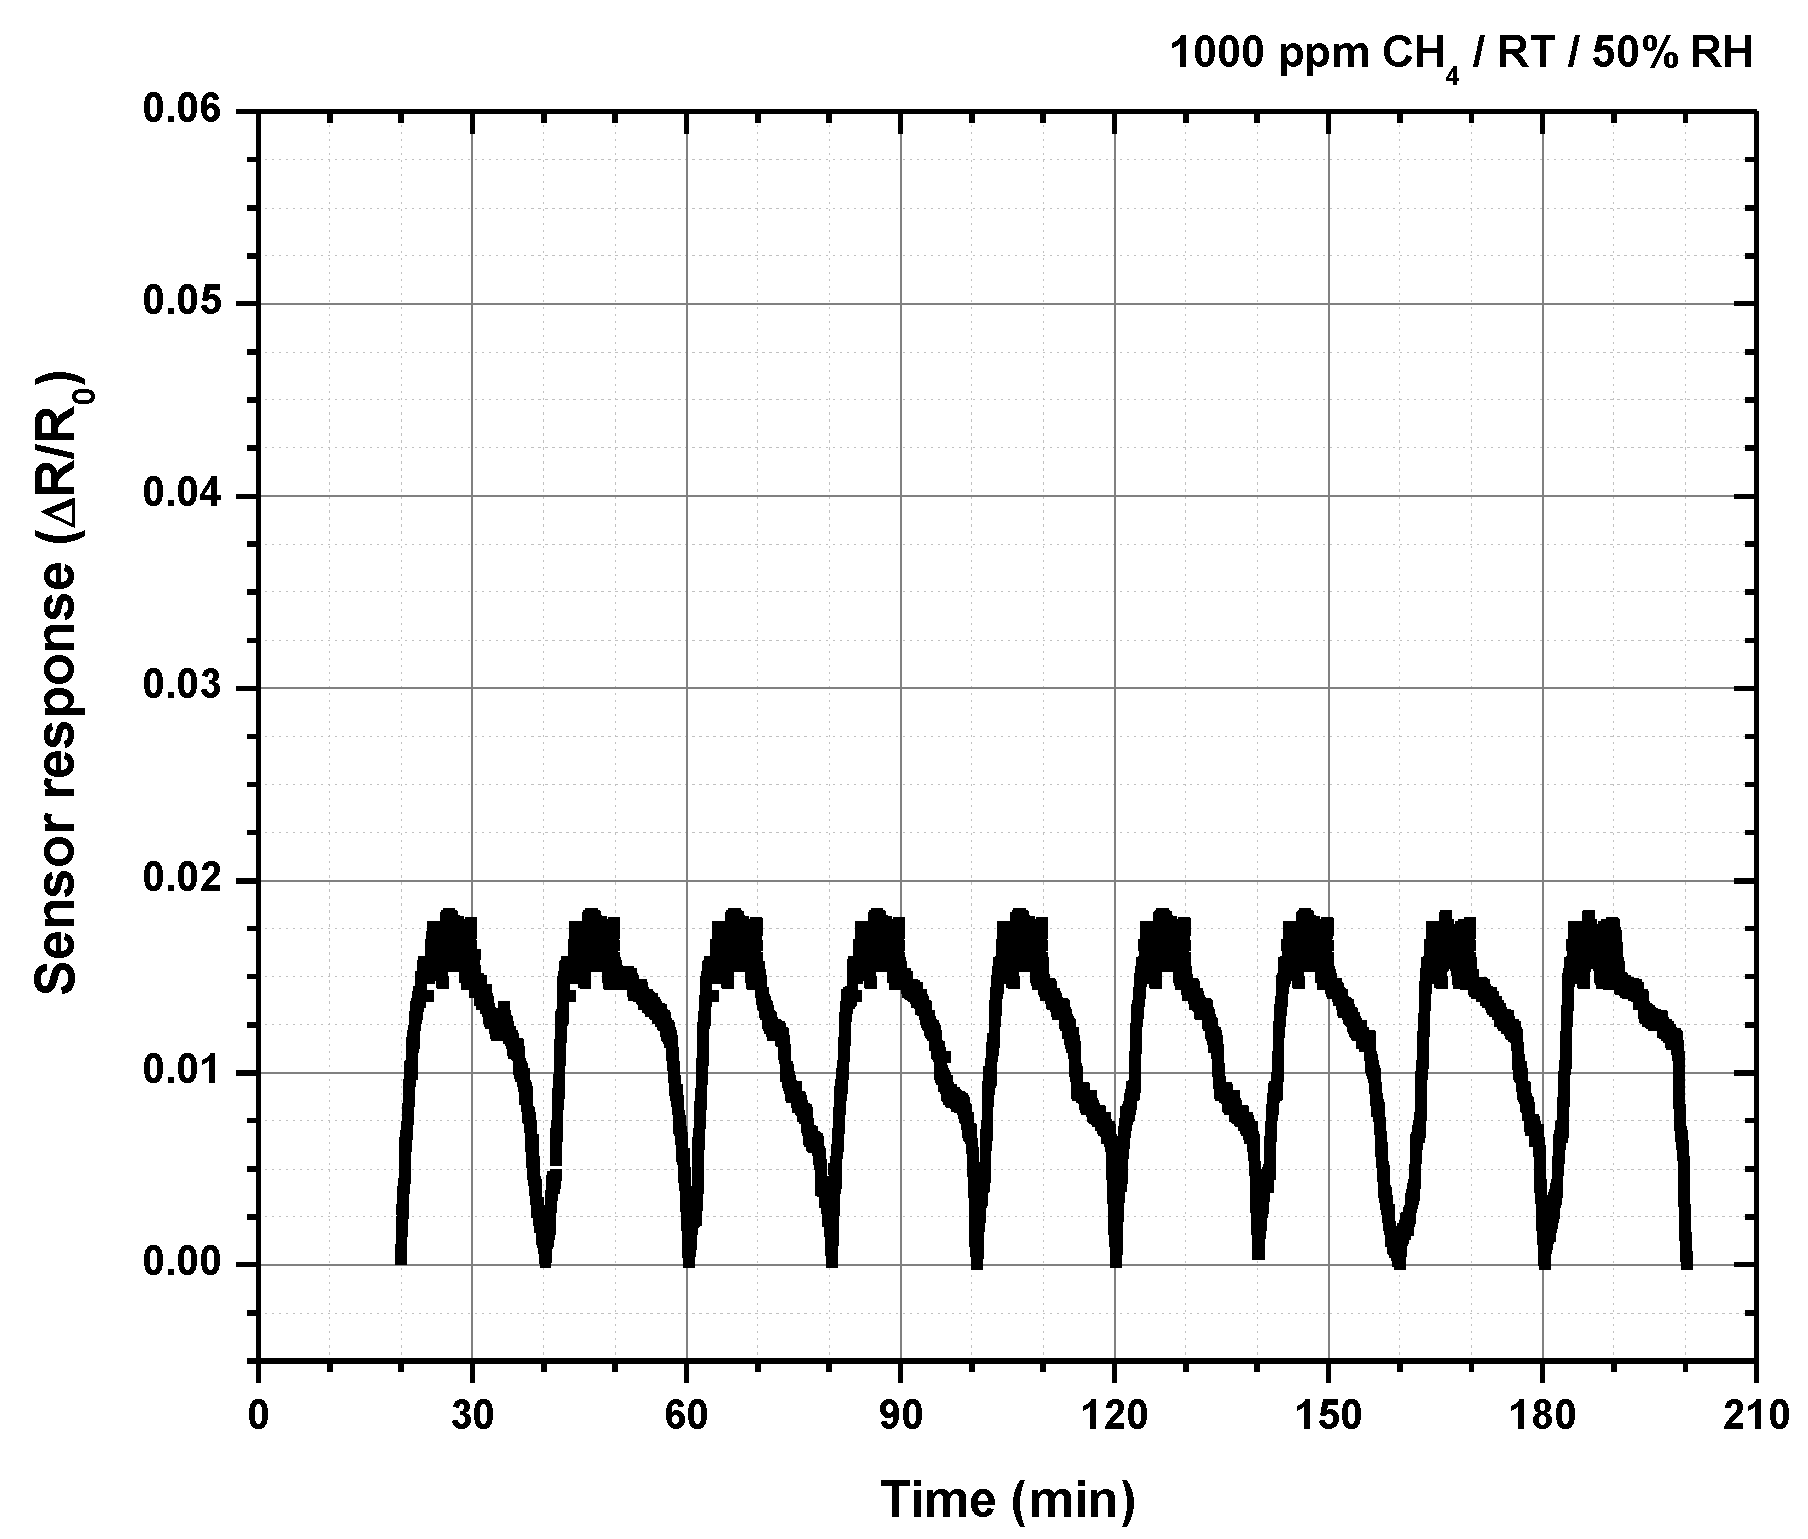
| Thin films of SnSe2-Zn-porphyrin | Electrical resistance measurements | 1000 ppm at room temperature 23–28 °C | This work |
Publisher’s Note: MDPI stays neutral with regard to jurisdictional claims in published maps and institutional affiliations. |
© 2020 by the authors. Licensee MDPI, Basel, Switzerland. This article is an open access article distributed under the terms and conditions of the Creative Commons Attribution (CC BY) license (http://creativecommons.org/licenses/by/4.0/).
Share and Cite
Lőrinczi, A.; Fagadar-Cosma, E.; Socol, G.; Mihăilescu, A.; Matei, E.; Sava, F.; Ştefan, M. SnSe2-Zn-Porphyrin Nanocomposite Thin Films for Threshold Methane Concentration Detection at Room Temperature. Chemosensors 2020, 8, 134. https://doi.org/10.3390/chemosensors8040134
Lőrinczi A, Fagadar-Cosma E, Socol G, Mihăilescu A, Matei E, Sava F, Ştefan M. SnSe2-Zn-Porphyrin Nanocomposite Thin Films for Threshold Methane Concentration Detection at Room Temperature. Chemosensors. 2020; 8(4):134. https://doi.org/10.3390/chemosensors8040134
Chicago/Turabian StyleLőrinczi, Adam, Eugenia Fagadar-Cosma, Gabriel Socol, Andreea Mihăilescu, Elena Matei, Florinel Sava, and Mariana Ştefan. 2020. "SnSe2-Zn-Porphyrin Nanocomposite Thin Films for Threshold Methane Concentration Detection at Room Temperature" Chemosensors 8, no. 4: 134. https://doi.org/10.3390/chemosensors8040134