
Sensing Properties of NiO Loaded SnO2 Nanoparticles—Specific Selectivity to H2S
by
 ,
,
Adelina Stanoiu
1, 
Andrei C. Kuncser
1,
Daniela Ghica
1,
Ovidiu G. Florea
1,
Simona Somacescu
2 and
Cristian E. Simion
1,*
1
National Institute of Materials Physics, Atomistilor 405A, 077125 Magurele, Romania
2
“Ilie Murgulescu” Institute of Physical Chemistry, Romanian Academy, Spl. Independentei 202, 060021 Bucharest, Romania
*
Author to whom correspondence should be addressed.
Chemosensors 2021, 9(6), 125; https://doi.org/10.3390/chemosensors9060125
Submission received: 18 April 2021
/
Revised: 26 May 2021
/
Accepted: 27 May 2021
/
Published: 1 June 2021
(This article belongs to the Collection Sustainable Metal Oxide Materials for Sensing Applications)
Abstract
:NiO-loaded SnO2 powders were prepared involving two chemical procedures. The mesoporous SnO2 support was synthesized by a hydrothermal route using Brij 35 non-ionic surfactant as a template. The nickel loadings of 1 and 10 wt.%. NiO were deposited by the wet impregnation method. The H2S sensing properties of xNiO-(1-x)SnO2 (x = 0, 1, 10%) thick layers deposited onto commercial substrates have been investigated with respect to different potential interfering gases (NO2, CO, CO2, CH4, NH3 and SO2) over a wide range of operating temperatures and relative humidity specific for in-field conditions. Following the correlation of the sensing results with the morphological ones, 1wt.% NiO/SnO2 was selected for simultaneous electrical resistance and work function investigations. The purpose was to depict the sensing mechanism by splitting between specific changes over the electron affinity induced by the surface coverage with hydroxyl dipoles and over the band bending induced by the variable surface charge under H2S exposure. Thus, it was found that different gas-interaction partners are dependent upon the amount of H2S, mirrored through the threshold value of 5 ppm H2S, which from an applicative point of view, represents the lower limit of health effects, an eight-hour TWA.
1. Introduction
Semiconducting metal oxide (SMOX)-based gas sensors are one of the widest spread devices for the detection of different explosive and toxic gases, mainly due to their high sensitivity and low manufacturing costs [1]. When targeting applicative demands, properties such as sensitivity and selectivity should be enhanced to boost the potential development. Thus, one of the currently used strategies consists of developing heterojunctions aimed to improve the gas sensing performances of p-type SMOX sensors [2].
One of the most important aspects in preparing a heterojunction resides in the inner electrical properties of the materials involved, ready to take part in an equilibrium process after the junction. Thus, each part comes with a well-defined Fermi level which upon contact will be subject to a subsequent charge transfer through the interface in order to establish an energetic equilibrium. Consequently, a potential barrier will be formed at the interface between the involved SMOX materials. The appearance of either oxidizing or reducing gases in the surrounding atmosphere will lead to the modulation of the p−n junction directly reflected in the sensor signal of the heterojunction materials [3].
Under the real operating conditions (i.e., in-field conditions) moisture and interfering gases are always present and relevant for developing realistic gas sensing applications. Such aspects should be considered with respect to today’s challenges [4]. The role of water vapor is a complex and actual issue, being frequently left aside by the scientific publications in the field. It is known that p-type materials possess an advantage in interacting with the water vapors. When moisture interacts with the metal oxide surface, it will split into OH- and H+ ions [5]. From the phenomenological point of view, the OH- groups are willing to bond to the cationic sites, thus leaving the proton H+ ready for reaction with the lattice oxygen [6]. Consequently, at the surface of the investigated material the coverage with hydroxyl groups will increase. One has to keep in mind that the aforementioned process is accompanied also by a charge transfer from the SMOX material to the already built surface hydroxyl species. Even if the water interaction process with most of the SMOX materials is still a matter of debate, the lack of humidity sensing with p-type materials has been reported. One of the reasons resides in the electronic surface-to-bulk interplay between electrons (trapped on the surface sites) and the hole concentration in the valence band [7,8]. Such recombination processes are about to cancel the global charge exchange, thus expressing a low humidity impact on the electrical resistance of the investigated p-type material [9].
Several reports have discussed the advantages of using p−n heterojunctions in different configurations, for the detection of different gas species, a few of them have leaned towards the involved gas sensing mechanism with the realistic link between functional structure and application relationship [10]. For instance, Han et al. discussed the sensing mechanism of a MoS2/ZnO p–n heterojunction based on the schematic diagram of the energetic band structures [11]. The determined conduction pathway resides in the coverage area difference between the aforementioned materials present in the heterostructure devices.
In the report of H. Tian et al. [12] p−n type heterostructures have been developed via a hydrothermal route and further investigated for their sensing performances. Although 10% NiO/ZnO structures exposed to different C2H5OH concentrations at 200 °C as an operating temperature exhibit fast response (6 s) and recovery (12 s) transients, a log−log linear dependence and about 85% response stability after two months, their drawbacks lie in the lack of RH influence beside the static method of gas sensing evaluation.
According to C. P. Goyal et al. [13], heterojunction-like sensors made of ZnO-CuO have been fabricated using a hydrothermal procedure followed by a dip-coating method targeting H2S detection, using a static evaluation approach. It has been demonstrated that the sensor with 1.26% Cu showed the highest sensor signal towards 10 ppm of H2S when operated at 150 °C. A subsequent gas sensing mechanism was developed based on the formation of metallic CuS at the surface upon H2S exposure.
H. Xuemi et al. [14] have reported a p−n gas sensing structure made of NiO-In2O3 semiconducting metal oxide materials developed via a hydrothermal chemical route. The optimum response towards formaldehyde (HCHO) was attained at 260 °C, also showing a negligible cross-sensitivity to ethanol, benzene, toluene, ammonia and chloroform. The proposed gas sensing mechanism involve direct reaction between HCHO and the pre-adsorbed oxygen species at the surface of NiO-In2O3 based gas sensors. As such, after surface oxygen reduction, CO2 and H2O are released in the downstream gas as reaction products. The role of RH was not considered in this study.
Recently, S. Dey et al. [15] have proposed a NiO/ZnO heterojunction ready for the selective detection of propanol, toluene and formaldehyde as volatile organic compounds (VOCs) with fast response and recovery transients. A liquid exfoliation method was used for NiO fabrication, followed by a ZnO growing process via a hydrothermal procedure. After establishing the optimum detection temperature at 300 °C, various concentrations of VOCs have been delivered to the sensors using a dedicated dynamic gas-flow system. The depicted gas sensing mechanism was developed according to the gas modulation phenomena of the p−n interface beside different applied potential biases. The study has revealed the major role played by the applied bias in a diode-like structure for selective sensitivity towards different VOCs.
The H2S gas is seldom used to investigate the selectivity of the NiO-SnO2 systems. One of the reasons lies in the fact that hydrogen sulfide is a highly flammable, irritating, corrosive and extremely toxic gas. The toxicity of H2S can be comparable with that of hydrogen cyanide, as a broad-spectrum poison and most of the SMOX materials suffer from the slow recovery transients in spite of higher sensitivity [16]. Because of their low fabrication costs and low level of H2S detection, SMOX based gas sensors have gained the attention of the scientific community as promising future monitoring systems. It was demonstrated that p−n heterojunctions act better towards H2S detection than simple single metal oxide components. Usually the base matrix material consists of a well-known n-type SnO2 in combination with different p-type materials, such as CuO. One of the reasons resides in the complexity of the roles played by these two oxides towards sensing and transduction phenomena. However, one of their major drawbacks resides in the strong interference by moisture, downgrading the overall sensor signal. Therefore, NiO is considered a promotor in taking the role of RH upon itself, thus leaving the H2S reaction to its n-type SMOX partner. This is the main reason why the NiO-SnO2 heterojunction was chosen for H2S detection under real operating conditions.
In this paper, an enhancement of the H2S gas response in the presence of moisture using xNiO-(1-x) SnO2 (x = 0, 1, 10%) based gas sensors is reported and the associated gas sensing mechanism is described throughout via phenomenological investigations involving simultaneous electrical resistance and work function measurements.
2. Materials and Methods
2.1. Materials Preparation and Sensors Fabrication
SnO2 sensing powders, 1 and 10 wt.% NiO loaded, were prepared with mesoporous SnO2 support involving two preparation procedures. The SnO2 support was obtained by a hydrothermal method using Brij 35 non-ionic surfactant as template. In the first step the surfactant was dissolved in water under vigorous stirring for 2h. An aqueous solution of tin (IV) chloride pentahydrate (SnCl4 5H2O) 98% was added dropwise. The pH was adjusted to 2, using nitric acid (HNO3). The mixture was loaded into an autoclave equipped with Teflon liner and heat treated at 180 °C for 24 h. The autogenous pressure was ~25 atm. The precipitate was washed with water, dried at 80 °C and finally calcined to 550 °C in air. The desired nickel loadings of 1 and 10 wt.%. NiO were deposited by wetness impregnation method. The corresponding amount of Ni(NO3)2 hydrate was dissolved in deionized water and added dropwise over support, followed by ultrasonication for 5 min, drying at room temperature for 24 h and thermal treatment at 400 °C, in air, for the nitrate decomposition leading to NiO formation.
In order to deposit the active material on top of the commercial alumina sensors, screen printing technique has been used. Thus, the powders were mixed with 1,2 propanediol and the obtained paste was deposited onto commercial alumina (Al2O3) substrates provided with Pt electrodes and backside heater. The substrates consisted of nine interdigitated Pt fingers (with 200 µm in between) displayed in a 7 × 3.5 mm aspect ratio on the front side, being necessary for the measurement of the sensor electrical resistance changes. On the other side, a Pt heater was designed in order to keep the sensor at the desired operating temperature. The obtained sensors were labeled: SnO2, SnO2-1%NiO and SnO2-10%NiO.
2.2. Materials Characterization
2.2.1. Structural, Morphological and Surface Chemistry Investigations
X-ray diffraction (XRD) patterns of the powdery samples were recorded with the Bruker D8 Advance X-ray diffractometer (λ = 0.154184 nm) in Bragg−Brentano configuration. All XRD measurements were performed with the same experimental parameters in a wide 2θ range (10–140°) for a high accuracy of the structural data (lattice parameters, average crystallite size) obtained by Rietveld refinement (Topas v.3 software).
A JEOL2100 instrument equipped with JEOL EDS (energy dispersive X-ray) detector was used for CTEM (conventional transmission electron microscopy), SAED (selected area diffraction), HRTEM (high resolution transmission electron microscopy) and STEM (scanning transmission electron microscopy) investigations, regarding morphological, structural and chemical properties of NiO loaded SnO2 systems.
X-ray photoelectron spectroscopy (XPS) was carried out on PHI Quantera equipment with a base pressure in the analysis chamber of 10−9 Torr and the monochromatized Al Kα radiation (1486.6 eV). For calibration, we used C1s line (BE = 284.8 eV) characteristic for the adsorbed hydrocarbon on the surface sample (C−C or (CH)n bonding). A dual beam (electrons and Ar ions) was used as neutralizer in order to overcome the charging effect.
2.2.2. Gas Sensing Investigations
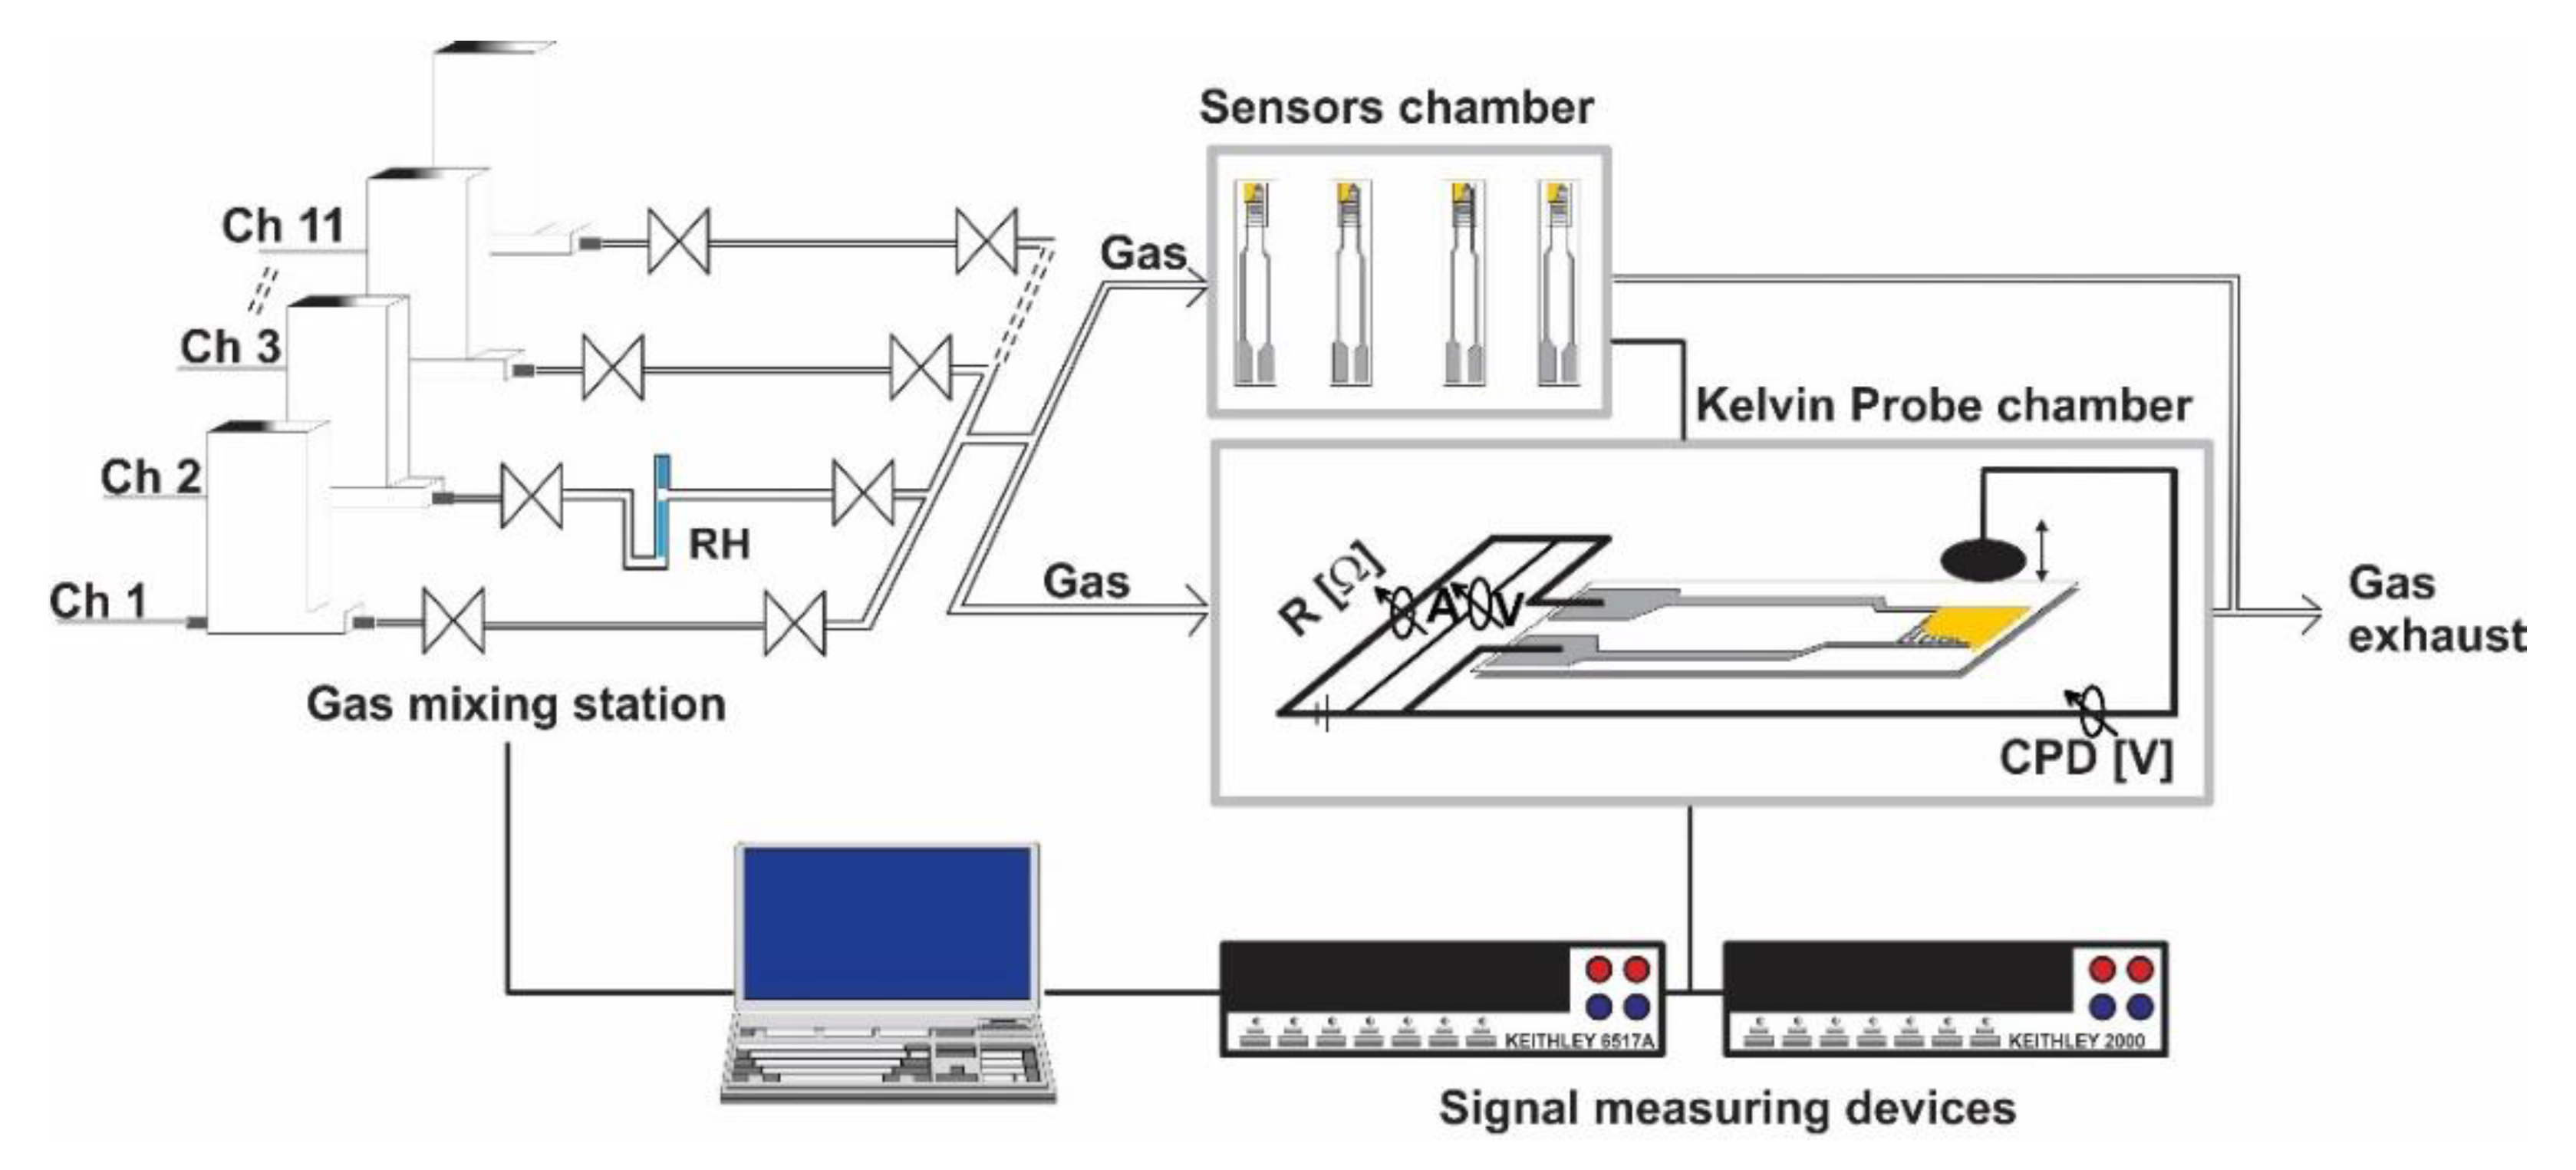
In order to characterize the electrical resistance changes of the gas sensors, a special computer-controlled gas mixing system (GMS) for delivering the target gas concentrations in a reproducible way was used. Gas sensors have been mounted into a four-socket Teflon (PTFE) gas cell provided with stainless-steel electrical connections and Viton sealing in order to prevent possible outgassing. The computer-controlled mass-flow meters and electrovalves allowed the desired concentrations of the H2S and other potential interfering gases to be obtained under constant gas flow, miming the in-field working conditions. The general scheme for the GMS is presented in Figure 1.
The gas flow throughout the system was kept constant for all measurements at 200 mL/min. The GMS operated with high purity gases (5.0) from cylinders while the relative humidity (RH) was generated by passing the carrier gas (dry synthetic air) through a vaporizer. By adjusting the air flow, the desired RH level was attained. In order to gain insights about the possible gas sensing mechanism towards H2S detection, electrical resistance and work function changes were recorded simultaneously with a Keithley 6517A electrometer (DC) and McAllister KP 6500 Kelvin Probe (ΔCPD). The Kelvin Probe (KP) measured the contact potential difference (CPD) established between the sensitive layer and KP metallic tip. While the latter is gas inert, the changes in CPD induced by the variations in the test gas atmosphere represents the layer’s relative work function modifications according to the relation (1).
where: ΔΦ represents the work function changes; ΔCPD represents the contact potential difference and q is the elementary charge.
3. Results
3.1. XRD Results
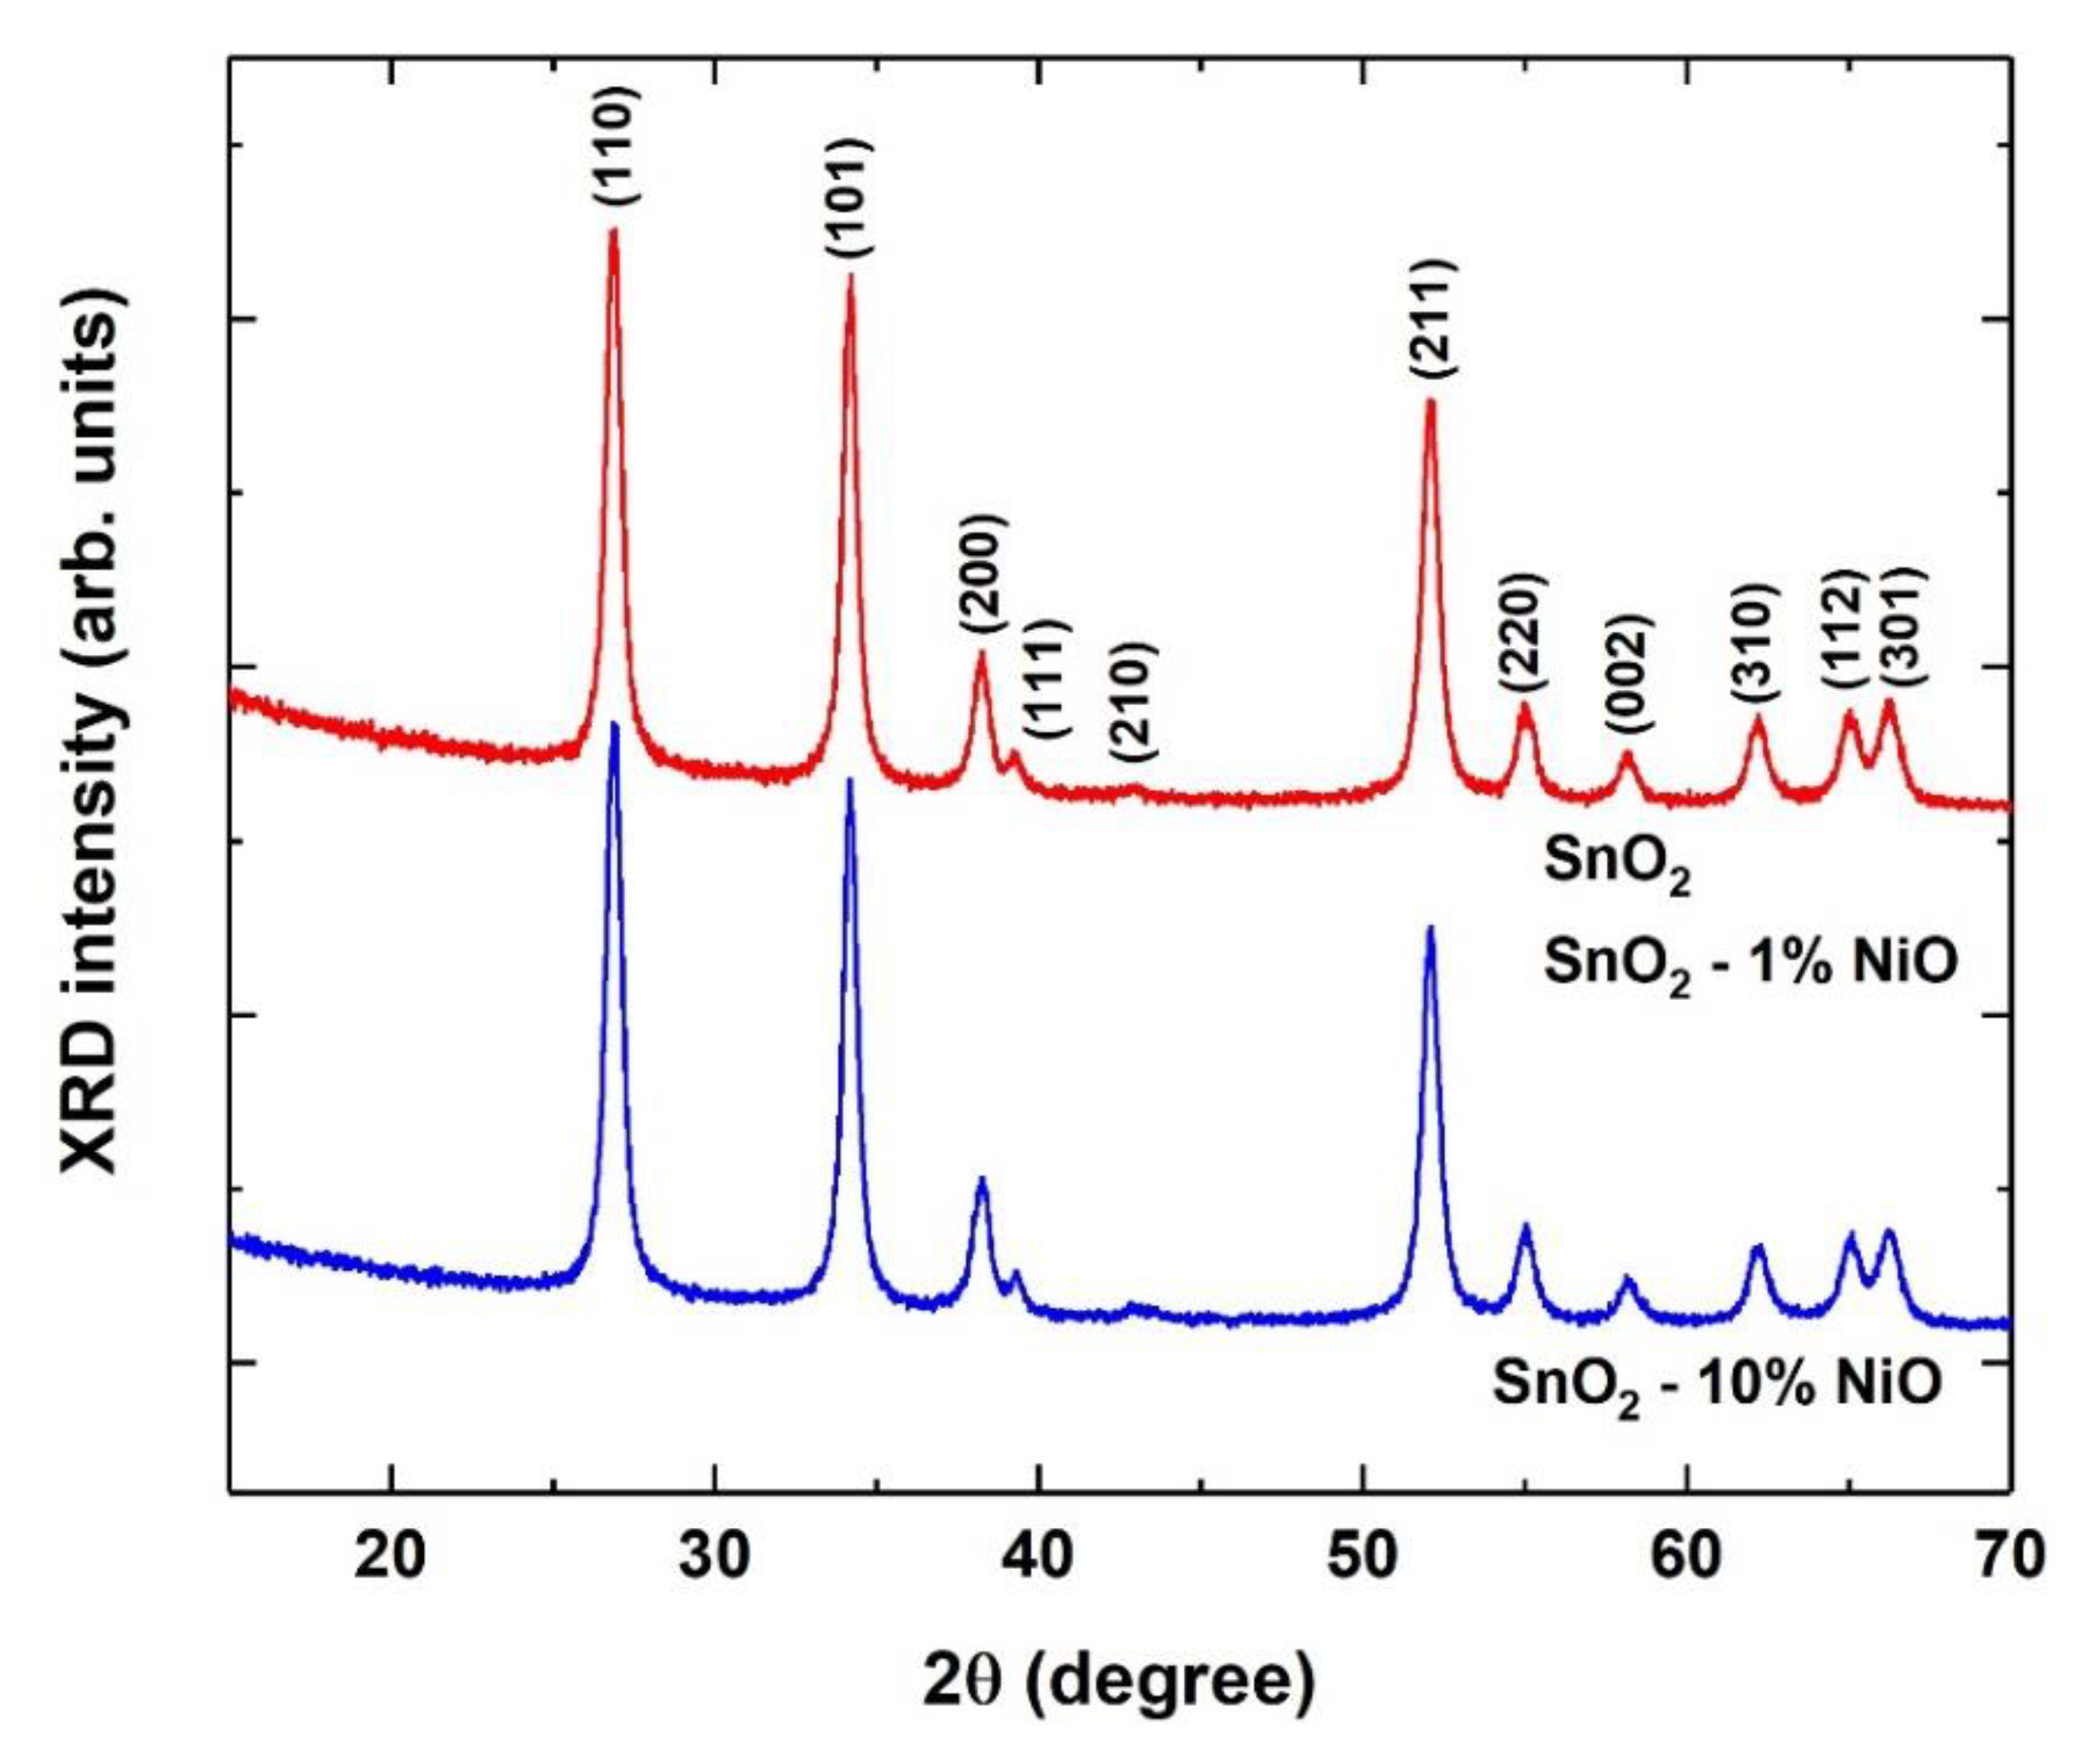
Figure 2 shows the XRD patterns of the samples, highlighting the absence of any secondary phase up to the highest doping level, in the detection limit of 1–2%. All three samples presented similar XRD patterns, indexed as tetragonal SnO2, space group: P42/mnm (136), ICDD-04-014-0193. The XRD pattern for undoped SnO2 was identical to the pattern of the 1% NiO doped SnO2 sample.
The calculated lattice parameters were identical for all the samples: a = 0.4739 ± 0.0001 nm and c = 0.3186 ± 0.0001 nm. This result is expected when Ni2+ ions substitute Sn4+ ions, as the effective ionic radii of Sn4+ and Ni2+ are equal (0.069 nm) in octahedral coordination [17]. The average crystallite size was similar in the unloaded and 1% NiO loaded SnO2 samples: d = 21.5 ± 0.5 nm, slightly decreasing to d = 20.5 ± 0.5 nm in the 10% NiO loaded SnO2 sample. Such a variation is practically within the errors limit, being smaller than expected for the 10% loading level.
3.2. Morphological Results
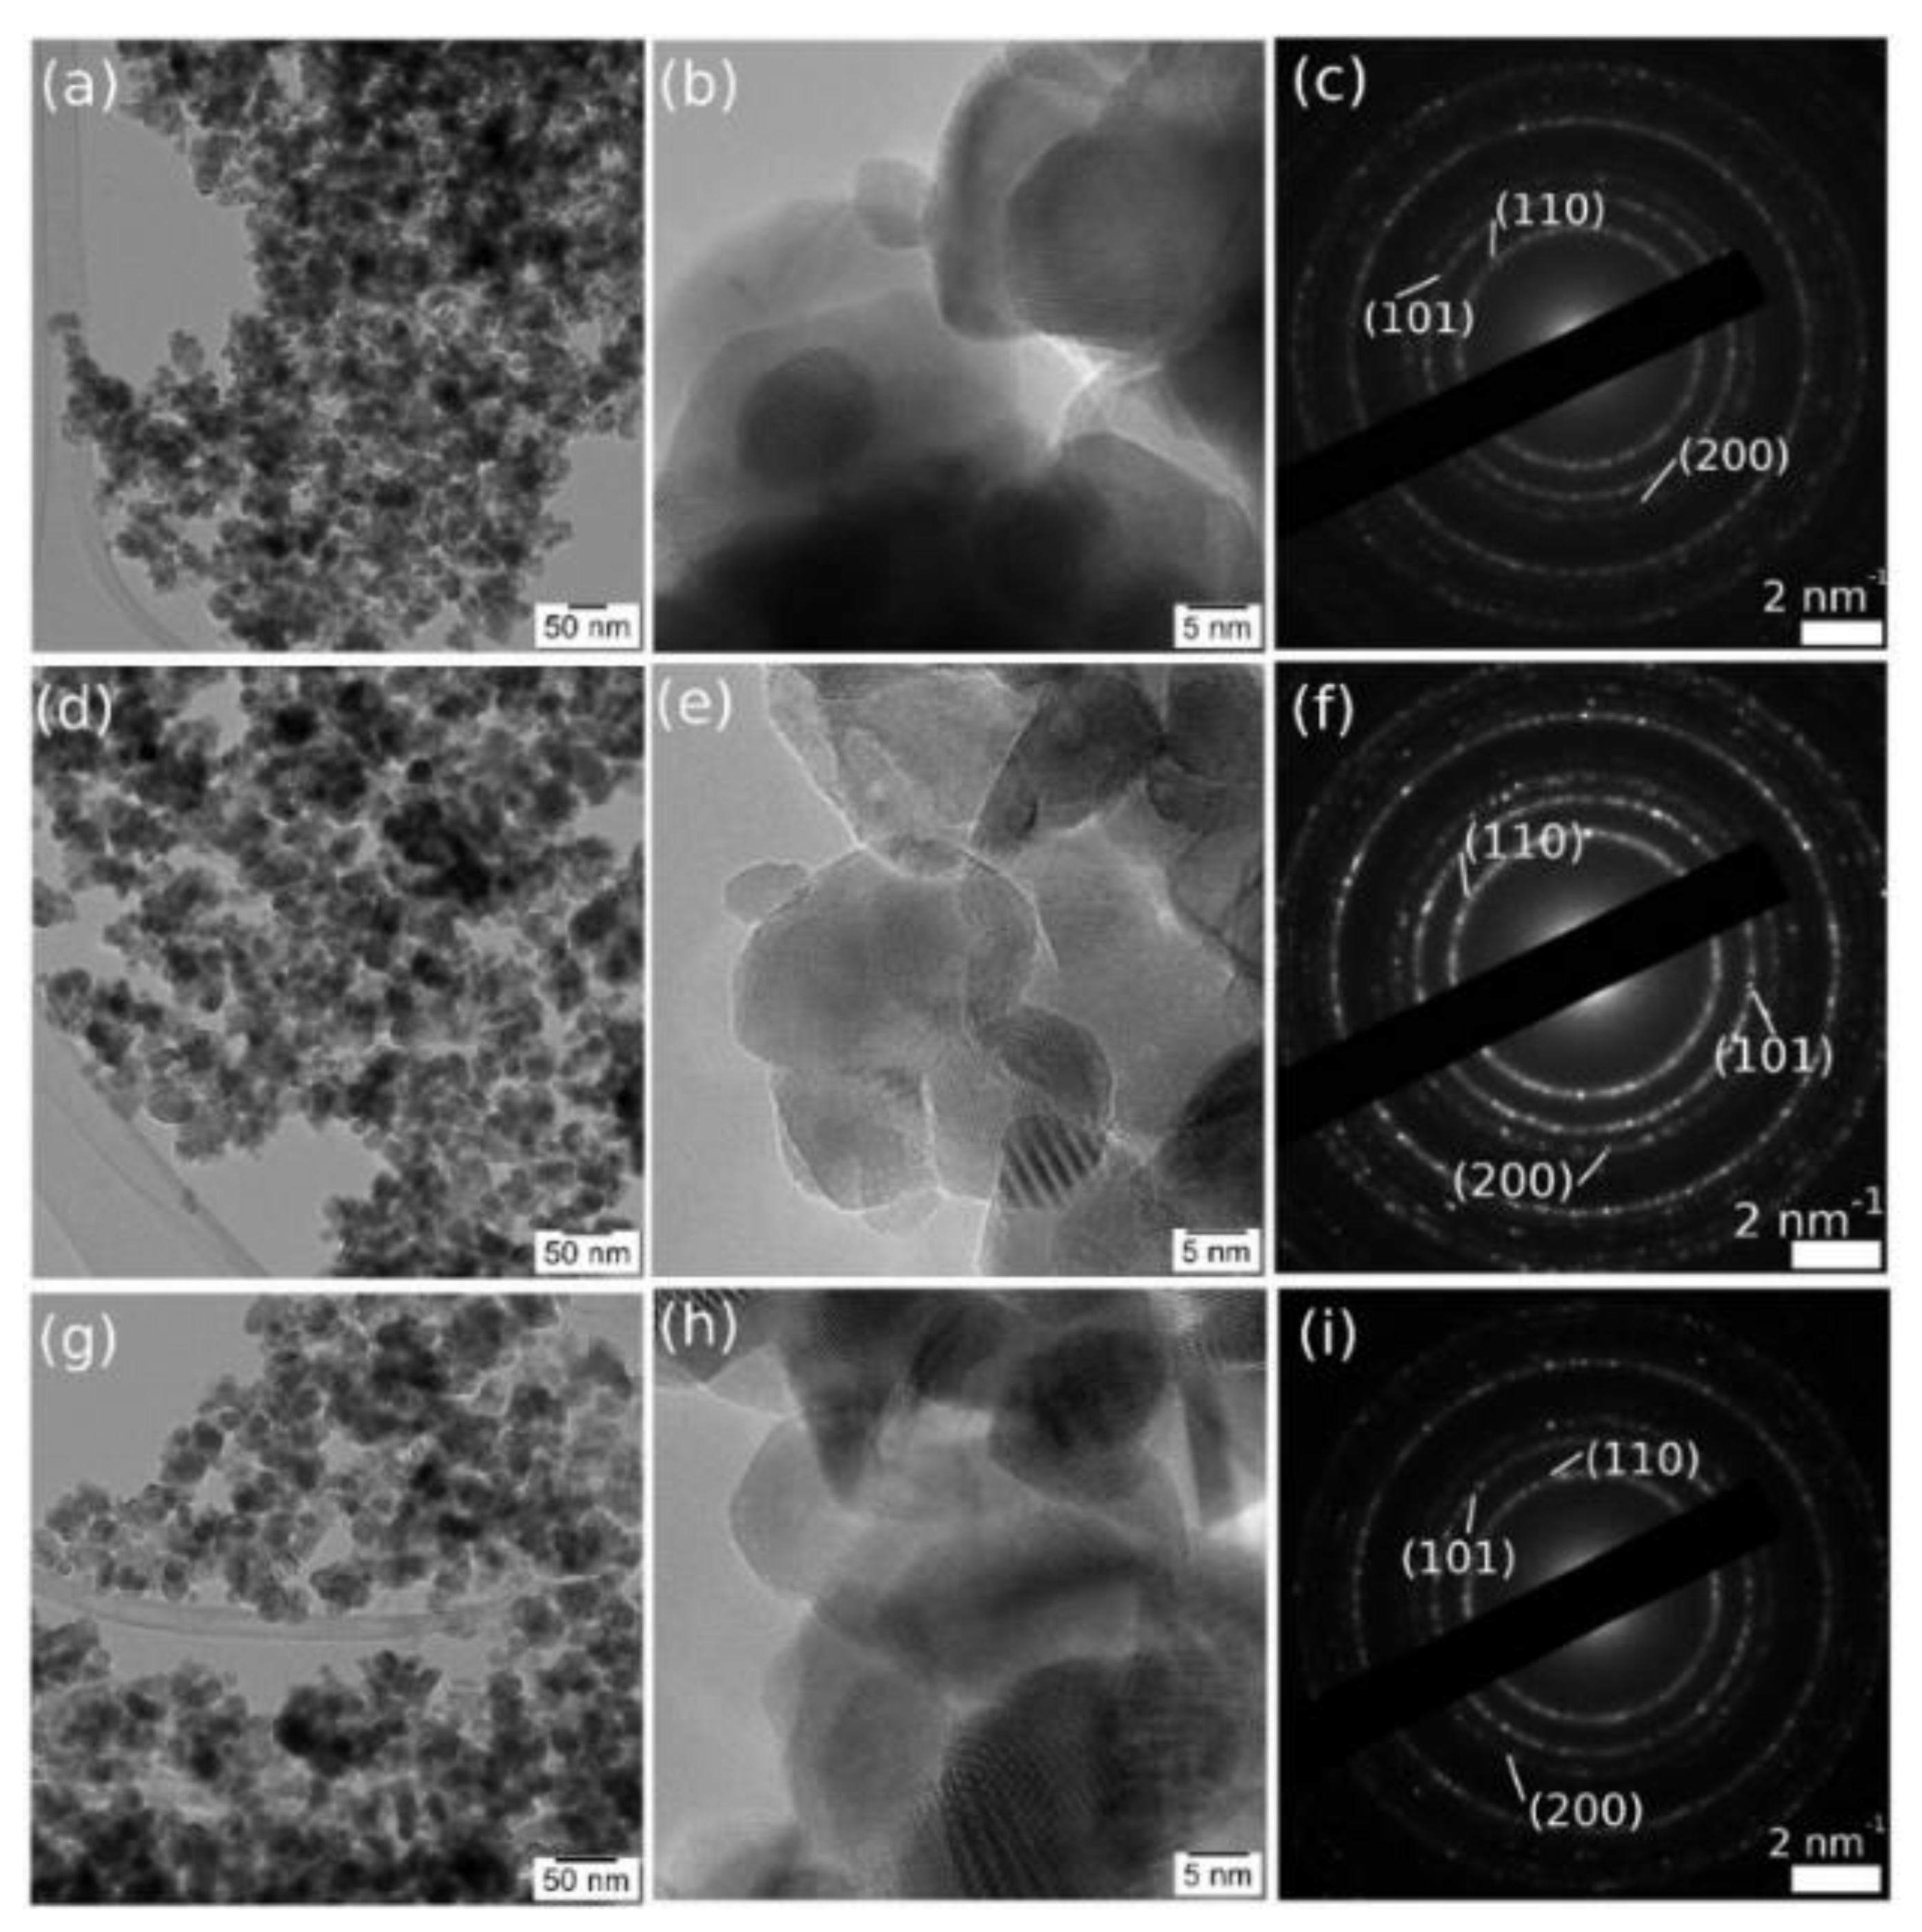
The images in Figure 3 show, for all the samples, mono-crystalline grains in the 20 nm range, some of them with extended defects. The SAED pattern revealed the tetragonal SnO2 structure, with no observable reflections from other crystal structures.
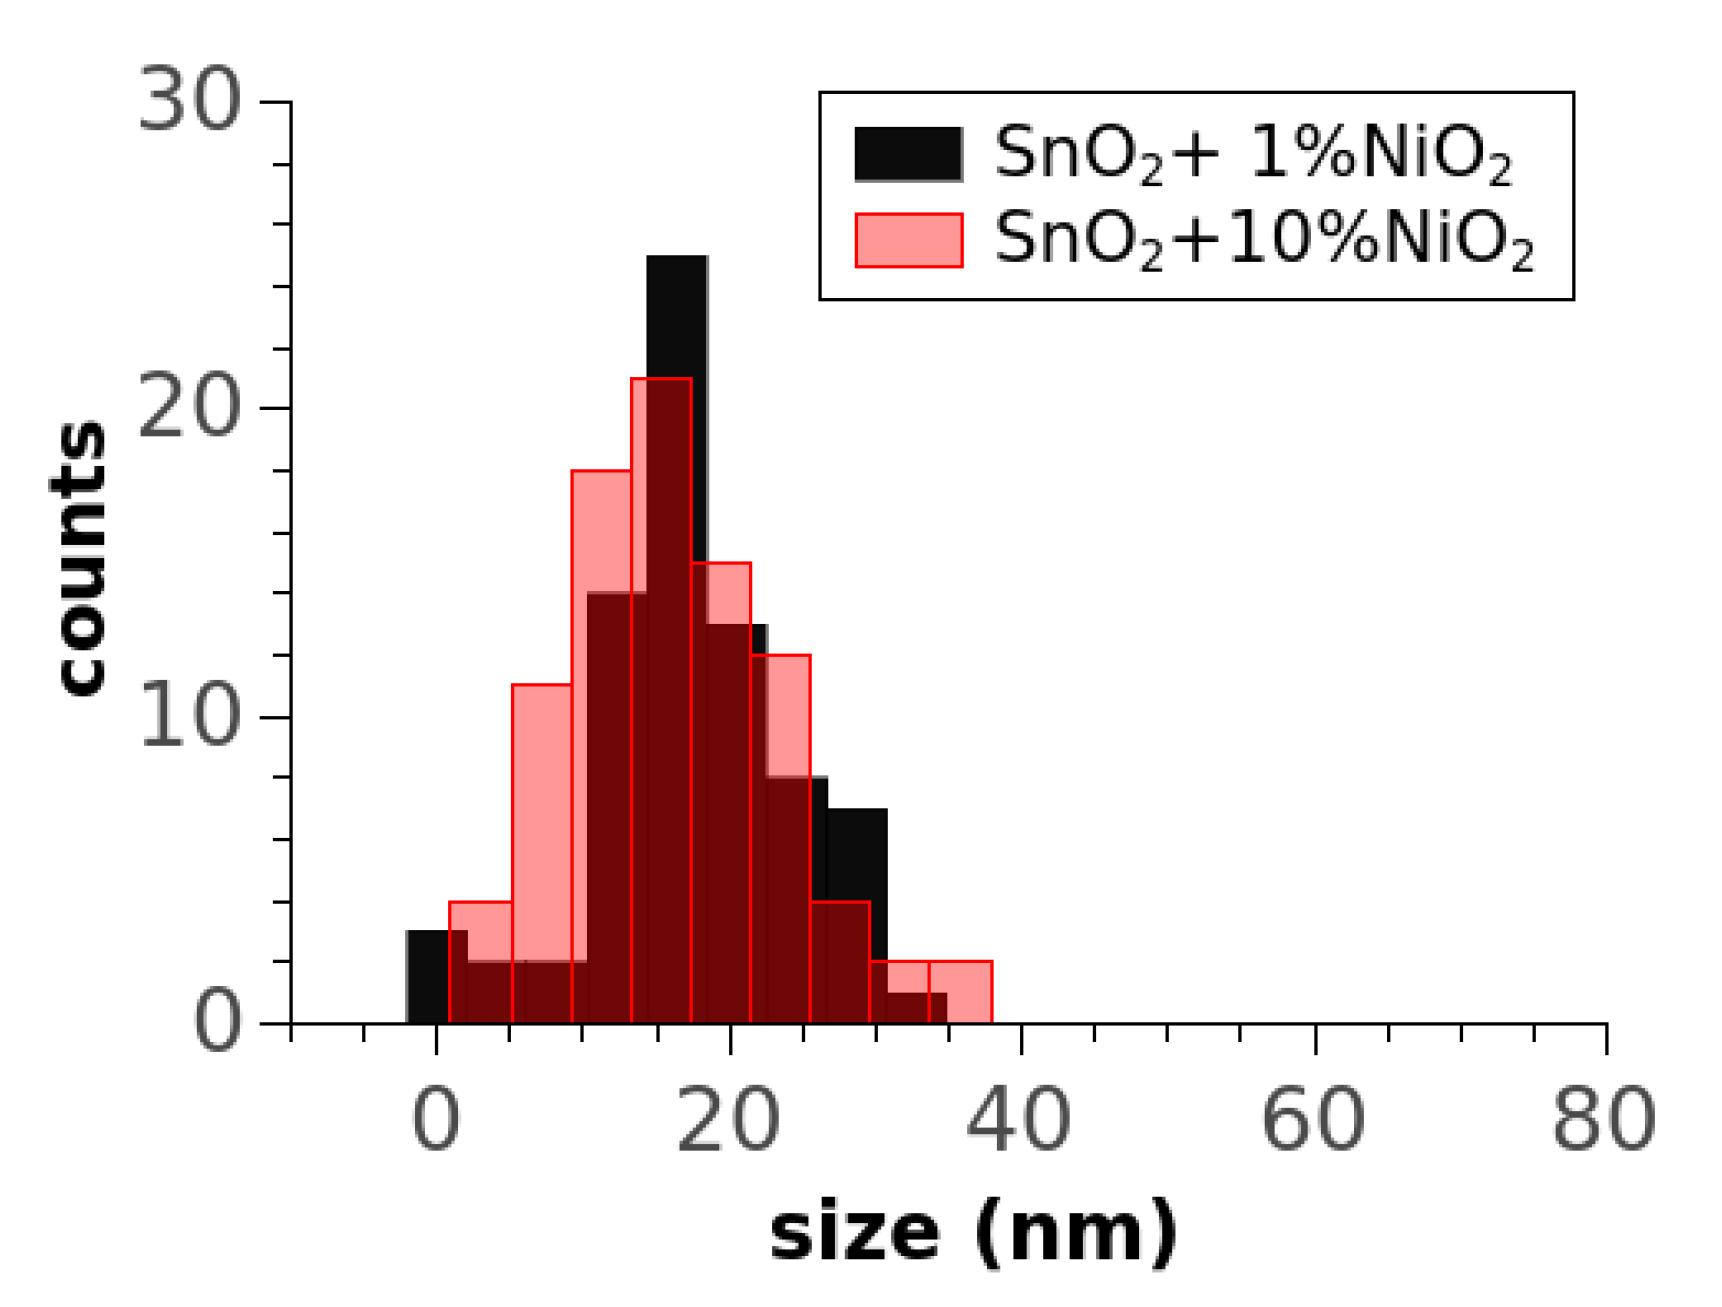
Size distributions (Figure 4) provided more quantitative information regarding the morphology, i.e., the SnO2+1%NiO sample had a mean crystal size of 20.5 nm with a standard deviation of 6.7 nm while the other had a mean crystal size of 18 nm with a standard deviation of 7.1 nm. A statistic for more than 150 NPs performed on the unloaded SnO2 sample (histogram not shown) indicated a mean crystal size of ~20.7 with a standard deviation of 7.28.
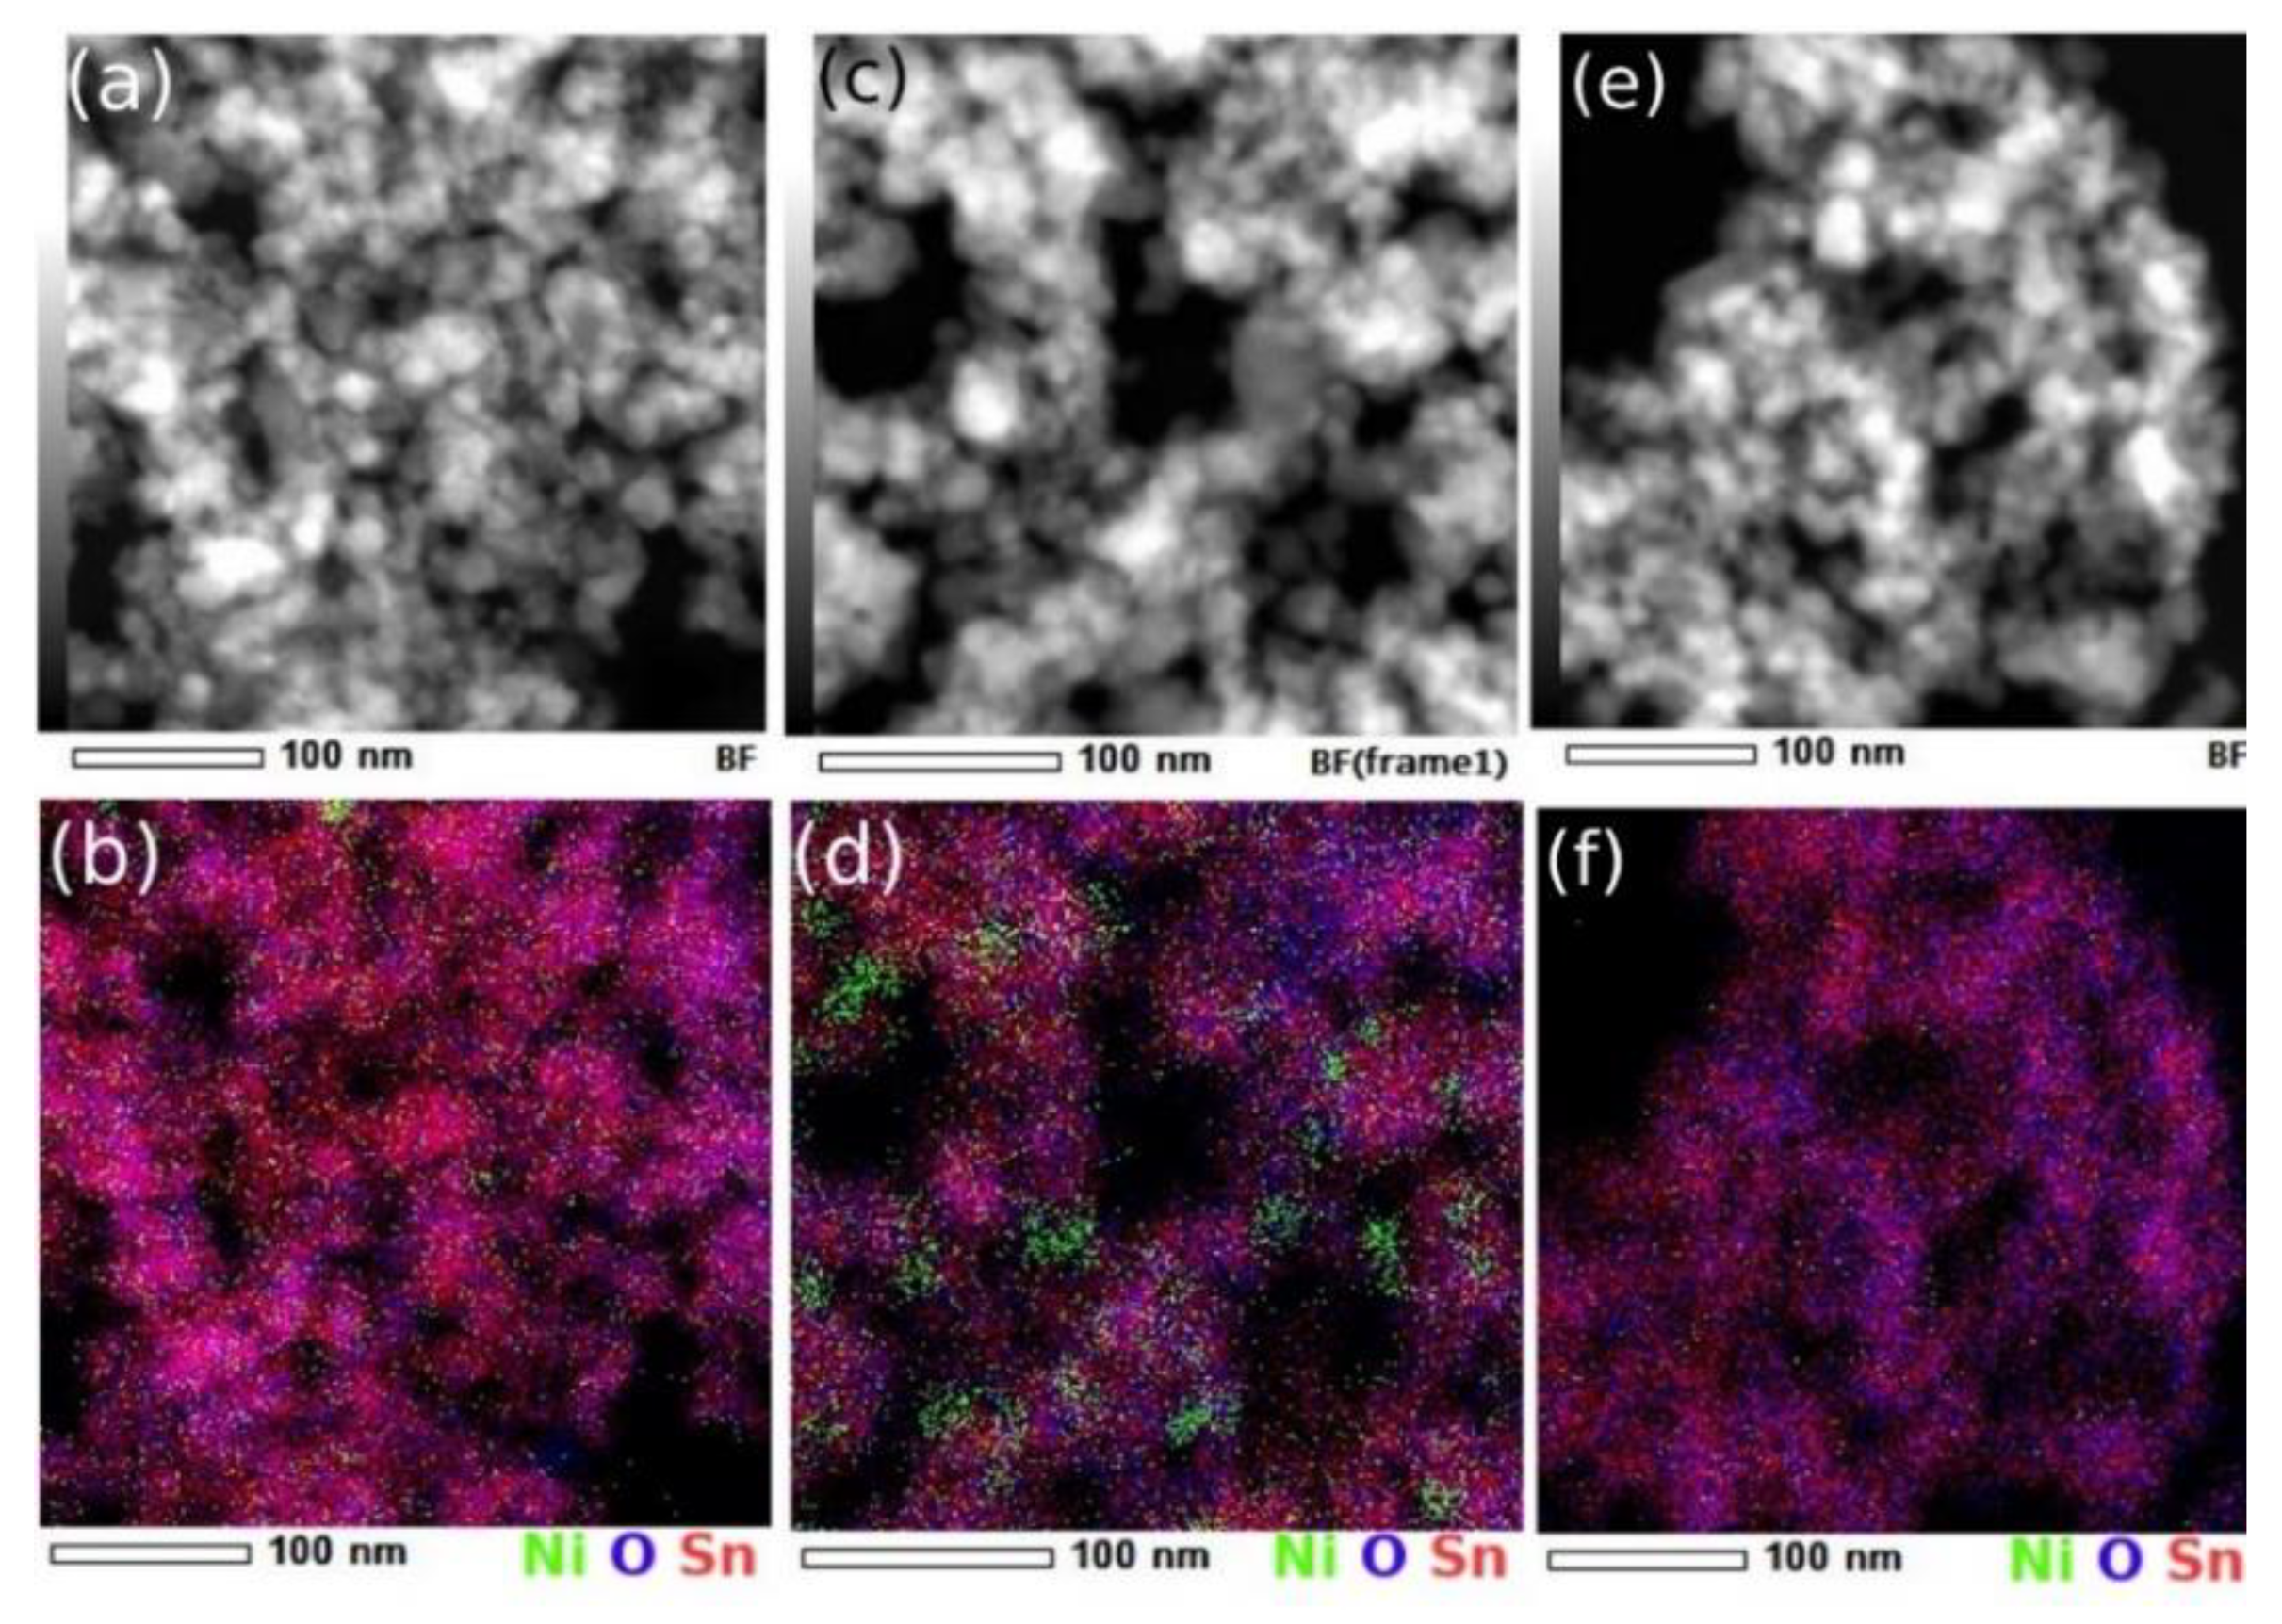
The chemical composition as obtained by EDS spectra (Figure 5) provided a %at. Sn:O:Ni stoichiometry of ~29:61:0.13 for SnO2+1%NiO and of ~34:63.5:2.3 for SnO2+10%NiO. In the reference sample, the EDS provided a %at. Sn:O ratio of ~33.3:66.6, very close to the SnO2 stoichiometry, with no Ni signal present in the spectra.
While the inherent EDS error can be significant and most of the time increased by imperfect acquisition conditions, the NiO loading was significantly lower than its nominal value. It is worth mentioning that the experimental conditions were optimized, as observed from the spectroscopic analysis on pure SnO2.
The spatial distribution of elements as provided by EDS coupled STEM analysis, showed that in the case of highest doped sample, a certain segregation of Ni-rich entities (whether it was Ni or NiO was difficult to tell) took place. Correlated with the size distributions, a natural decrease of the mean crystal size with the increase of the loading could be observed. While the decrease was still uncertain for the case of SnO2+1%NiO, for the higher doping where segregation appeared, it became noticeable. Consequently, even though not observed in the diffraction patterns, the potential formation of N-rich secondary crystalline phases (which may contribute to the crystal size evaluations) needs to be considered for further investigations.
3.3. Surface Chemistry Results
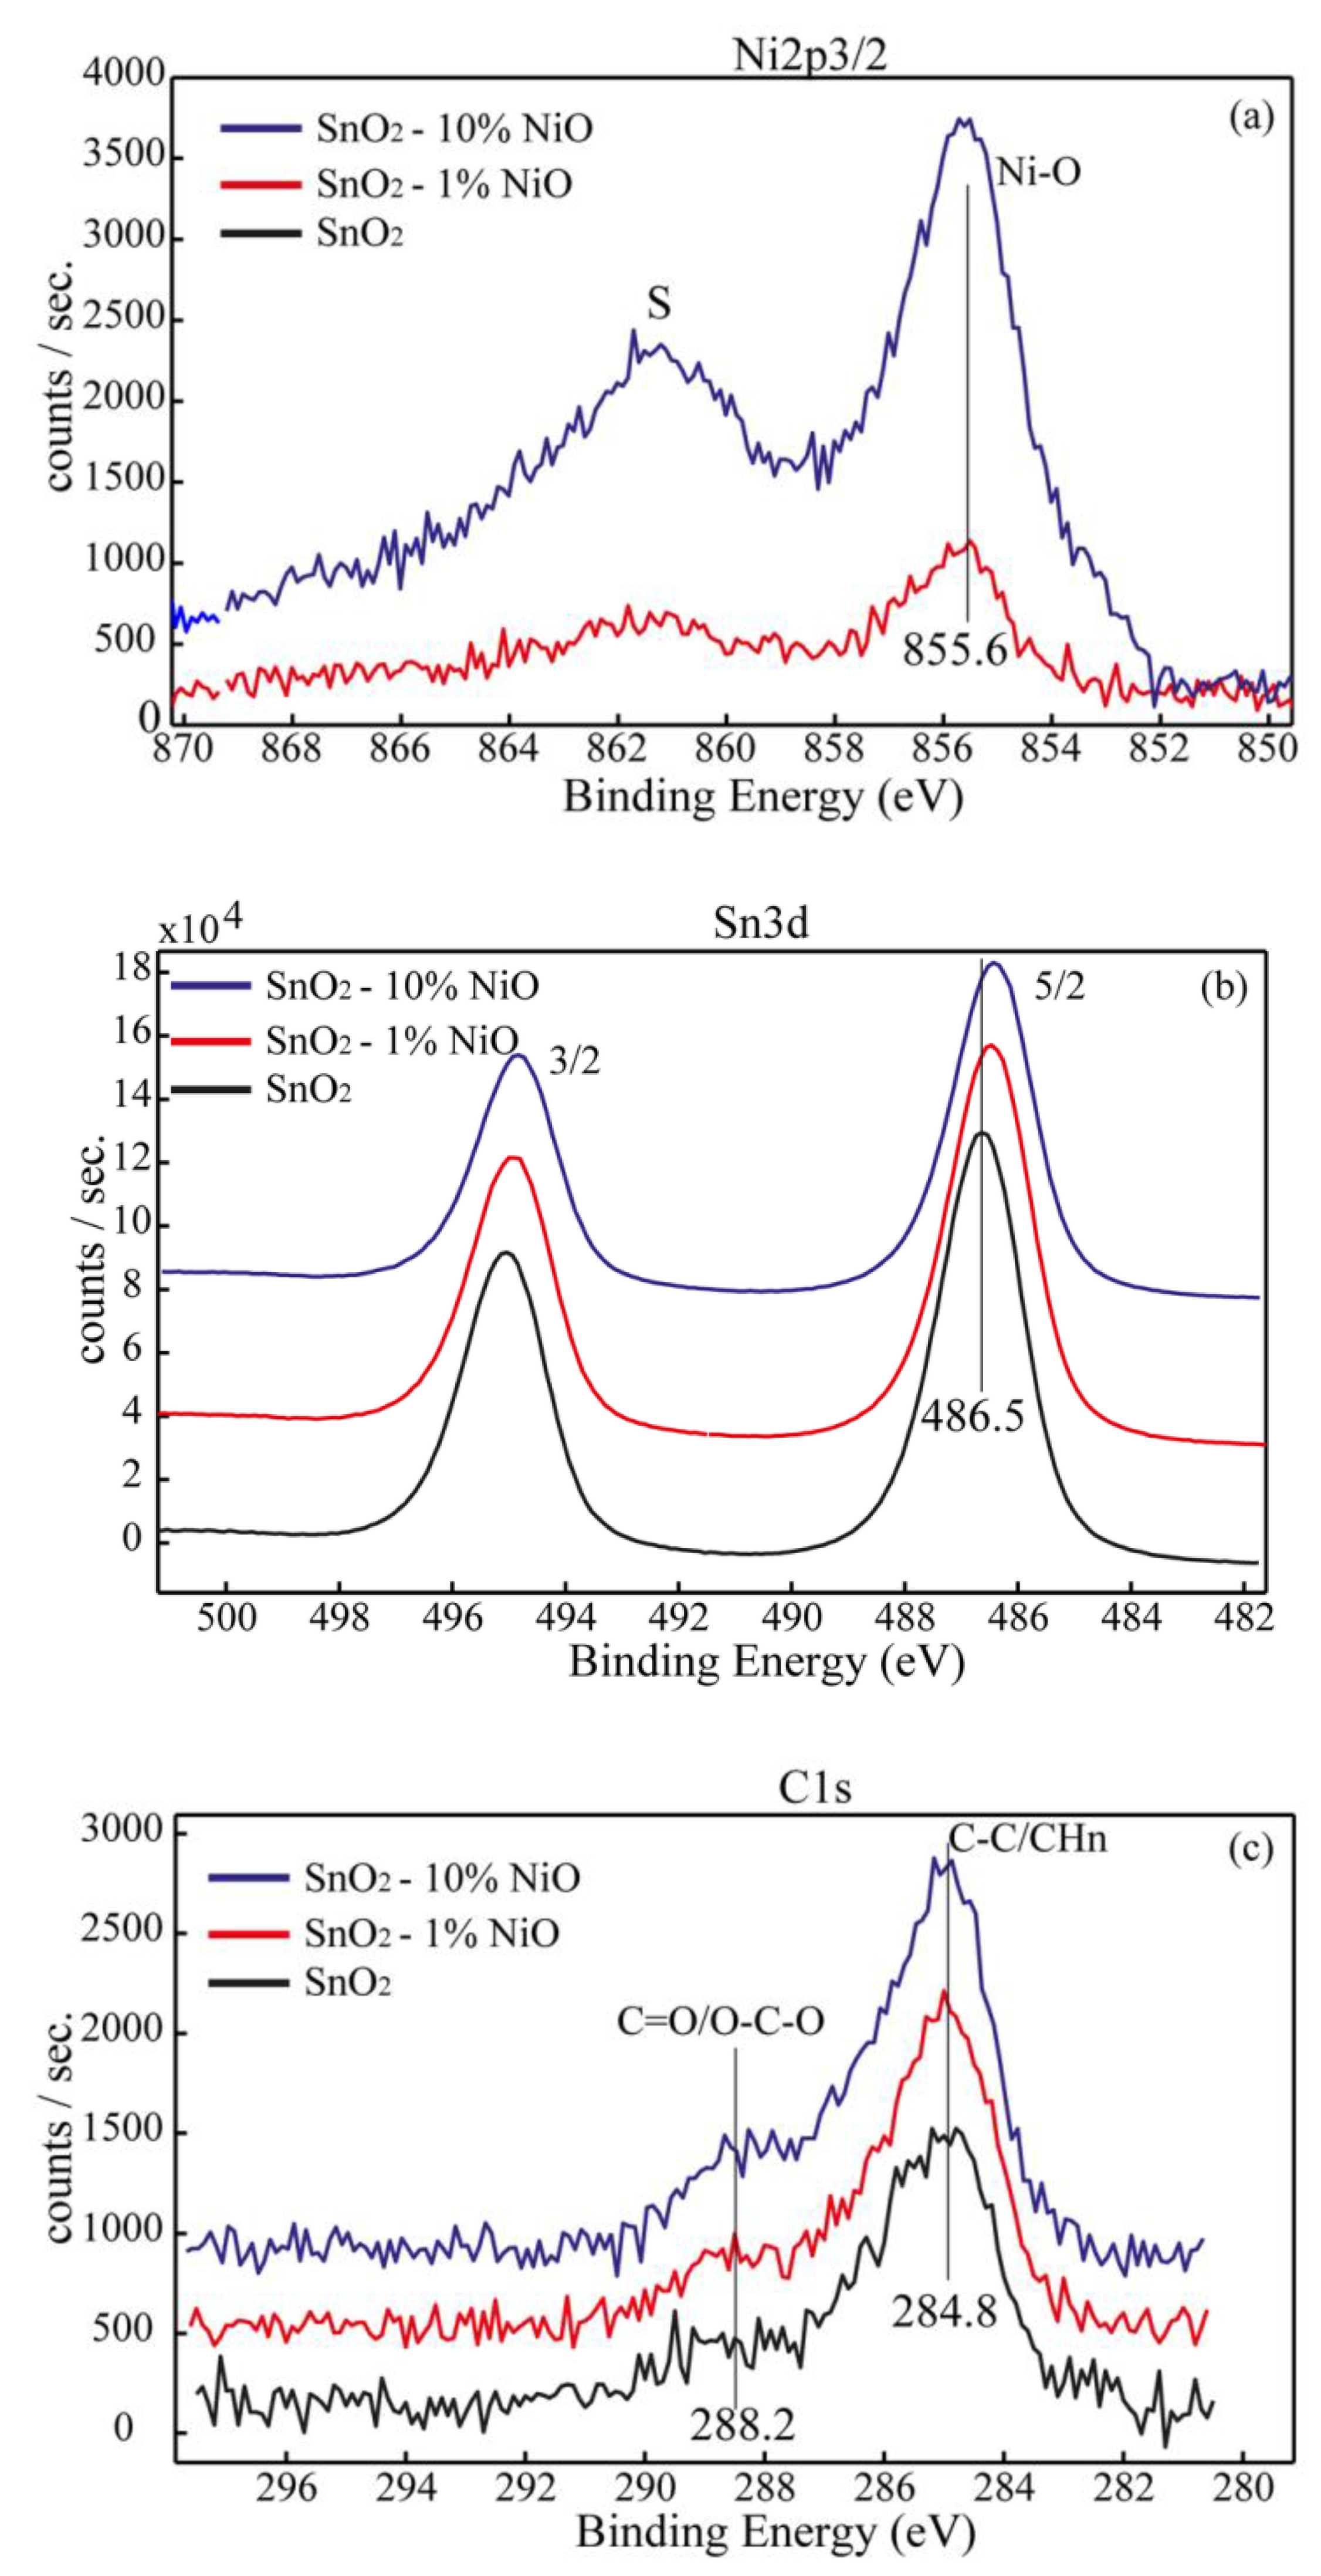
The surface chemistry of the sensors was investigated by X-ray photolectron spectroscopy (XPS). Thus, in the Figure 6a−c and Figure 7a,b are shown the high-resolution spectra recorded for the most prominent transitions of the elements detected on the surface, as follows: Ni2p3, Sn3d, C1s and O1s, respectively. Ni was detected on the surface as Ni2+ at BE ~855.6 eV. It is worth mentioning that the BE shifted toward higher BE compared with the standard NiO (BE in the range 854–855 eV according to NIST XPS databases) [18] is attributed to the interaction of the NiO cu SnO2 lattice. Sn was detected on the surface as Sn4+ characteristic to SnO2, for the BE of Sn3d5/2 at ~486.4 eV. We assessed the surface contamination by recording the C1s HR spectra for all sensors by superimposed C1s spectra as shown in Figure 6c. We found out that the surface of the sensitive layers was not contaminated except for an unavoidable, low amount of carbon which was attributed mainly to the adventitious carbon adsorbed from the atmosphere (C-C and CHn). This finding clearly proves that the organic part from both synthesis routes and the deposition procedure of the sensitive layers was completely removed by the thermal treatment.
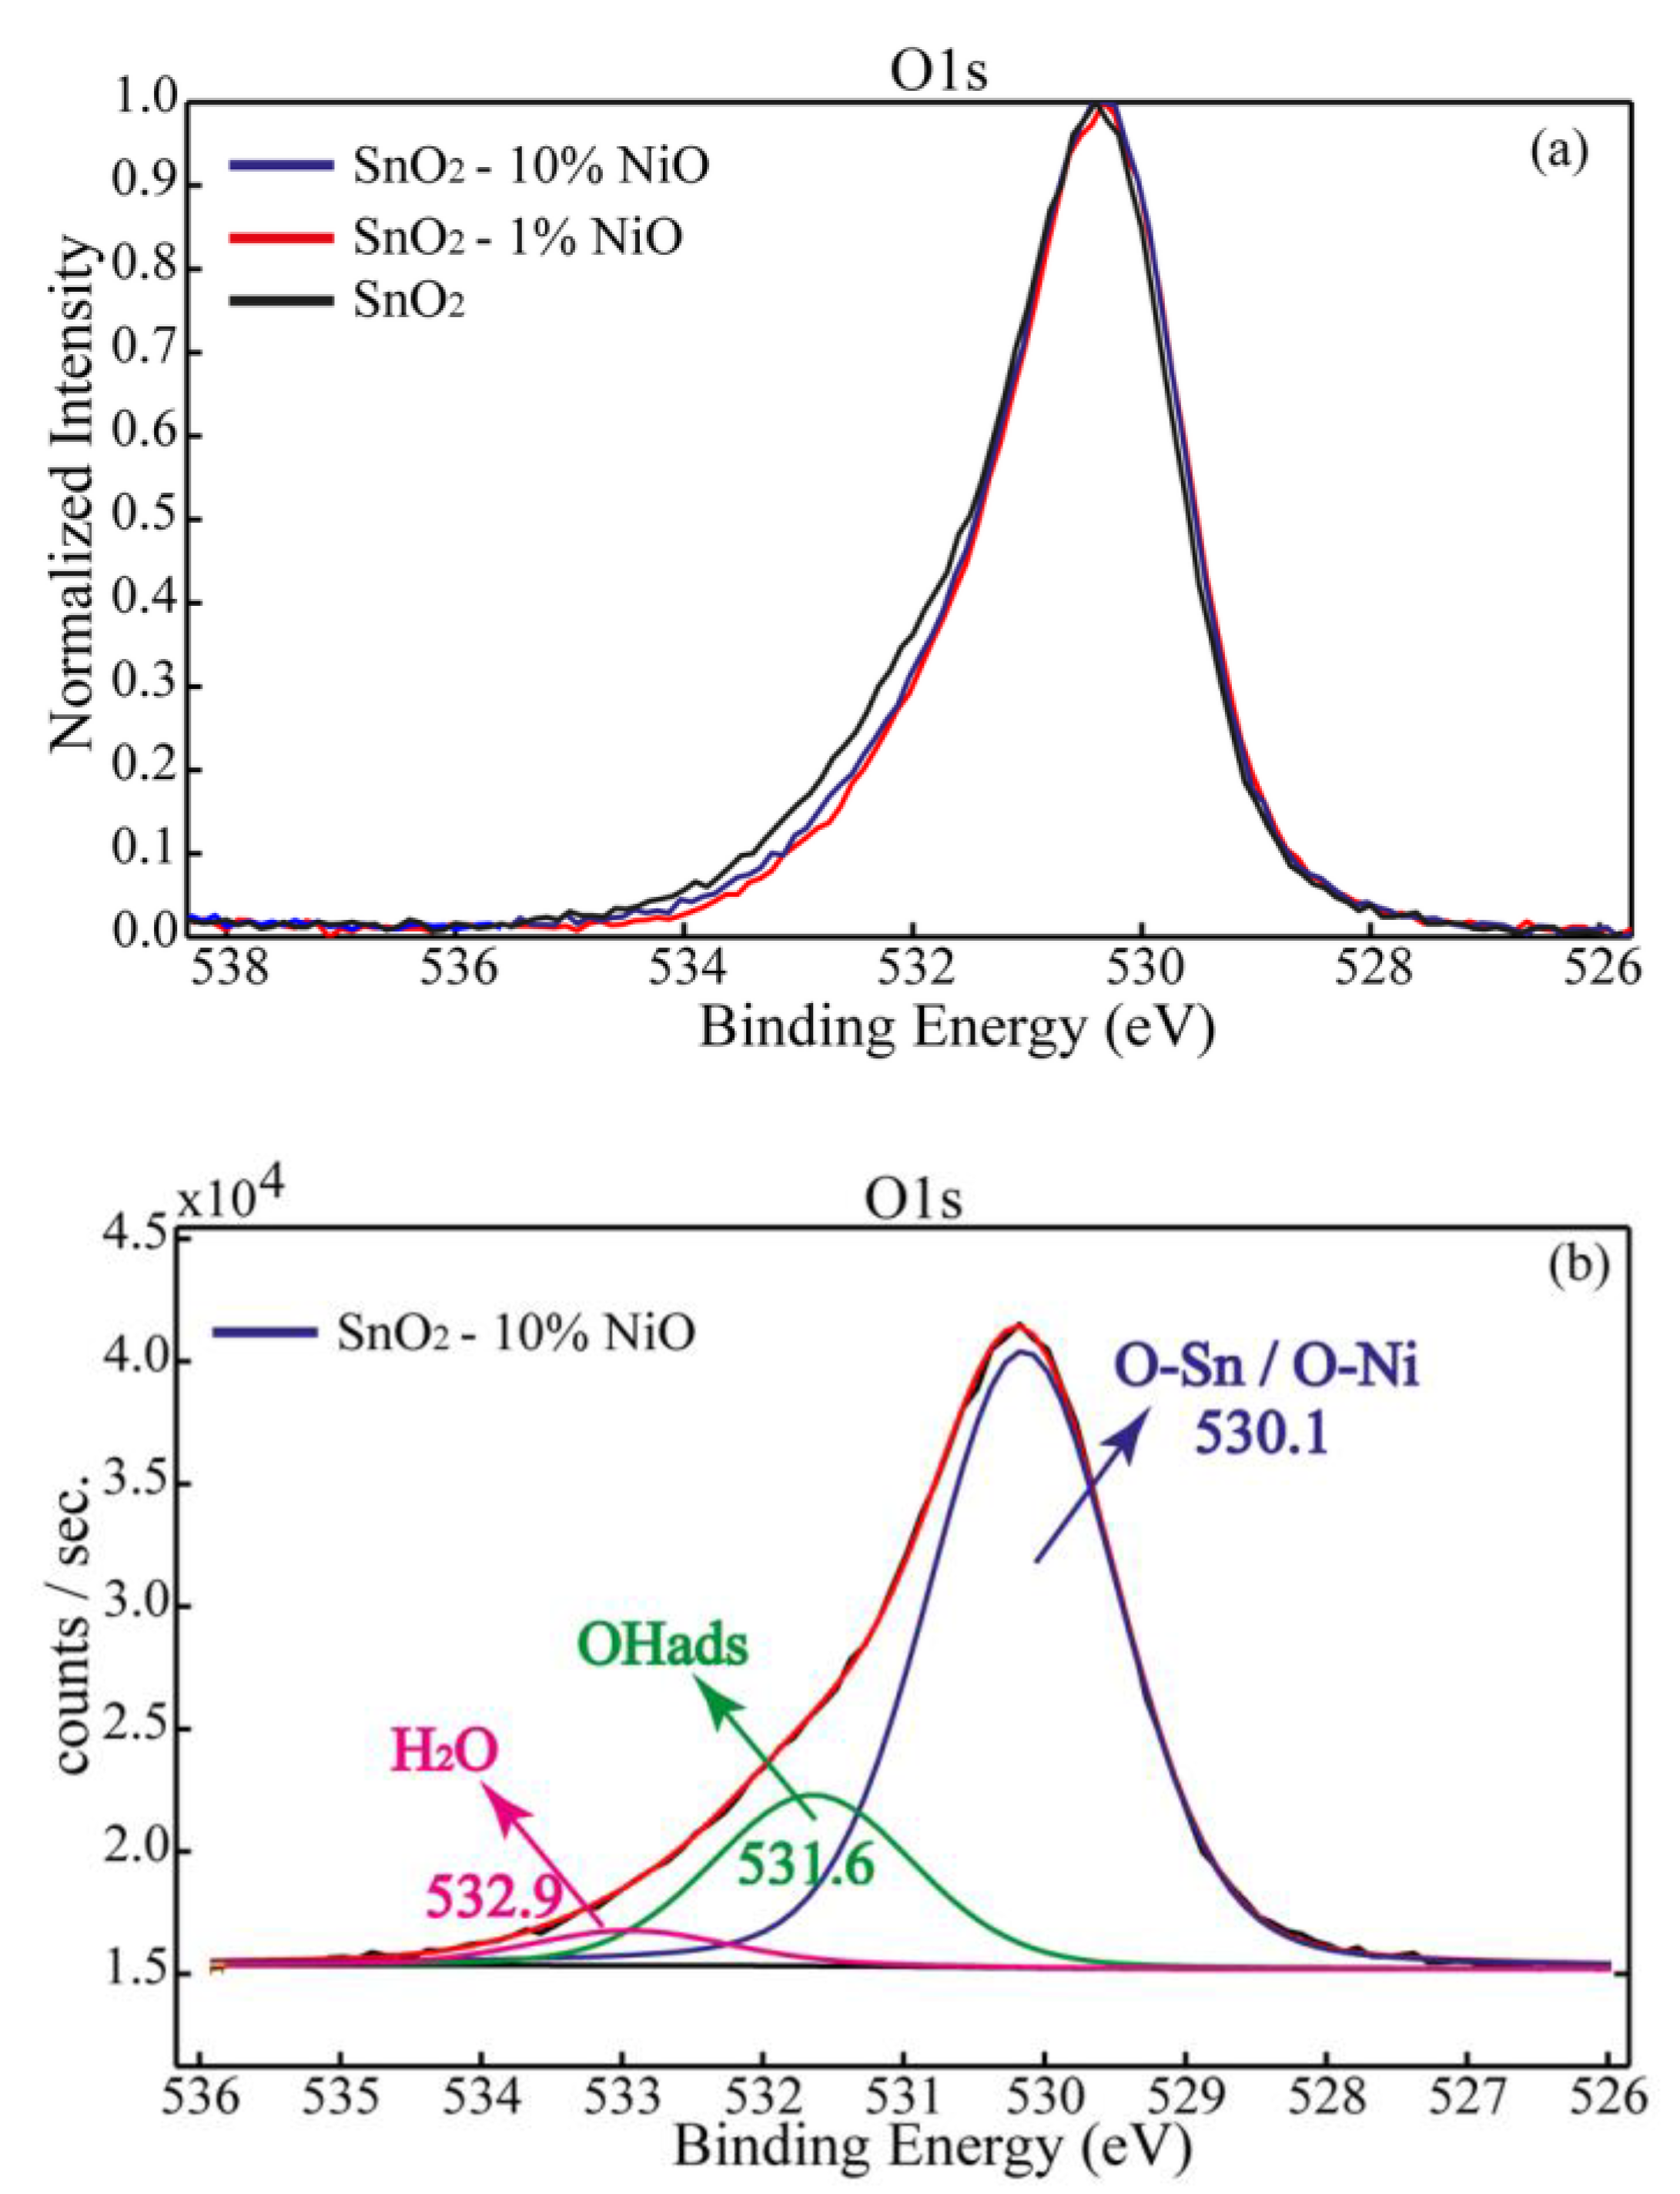
In Figure 7a are depicted the normalized O1s spectra for SnO2, SnO2-1%NiO and SnO2-10%NiO. The oxygen chemistry highlighted by O1s analysis revealed no significant changes to the surface after NiO deposition. By the deconvolution process, we found the largest amount of oxygen bound in the SnO2 lattice (~75%), OH adsorbed groups (~21%), as well as a tiny amount of water (~4%) (Figure 7b). It can be seen that SnO2 exhibited a slightly more hydroxylated surface.
Table 1 shows the XPS data which comprise the surface composition and the corresponding BEs (eV) assessed by X-ray photoelectron spectroscopy, from the HR spectra. The Ni content was found to be close to the nominal value percentage as follows: ~0.95 atom %, equivalent to ~1.2 wt.% for SnO2-1%NiO and ~5.2 atom %, equivalent to ~6.5 wt.%. The experimental errors in the XPS data quantification are in the range of ±10%, while for the BEs values of ±0.2 eV.
3.4. Gas Sensing Properties
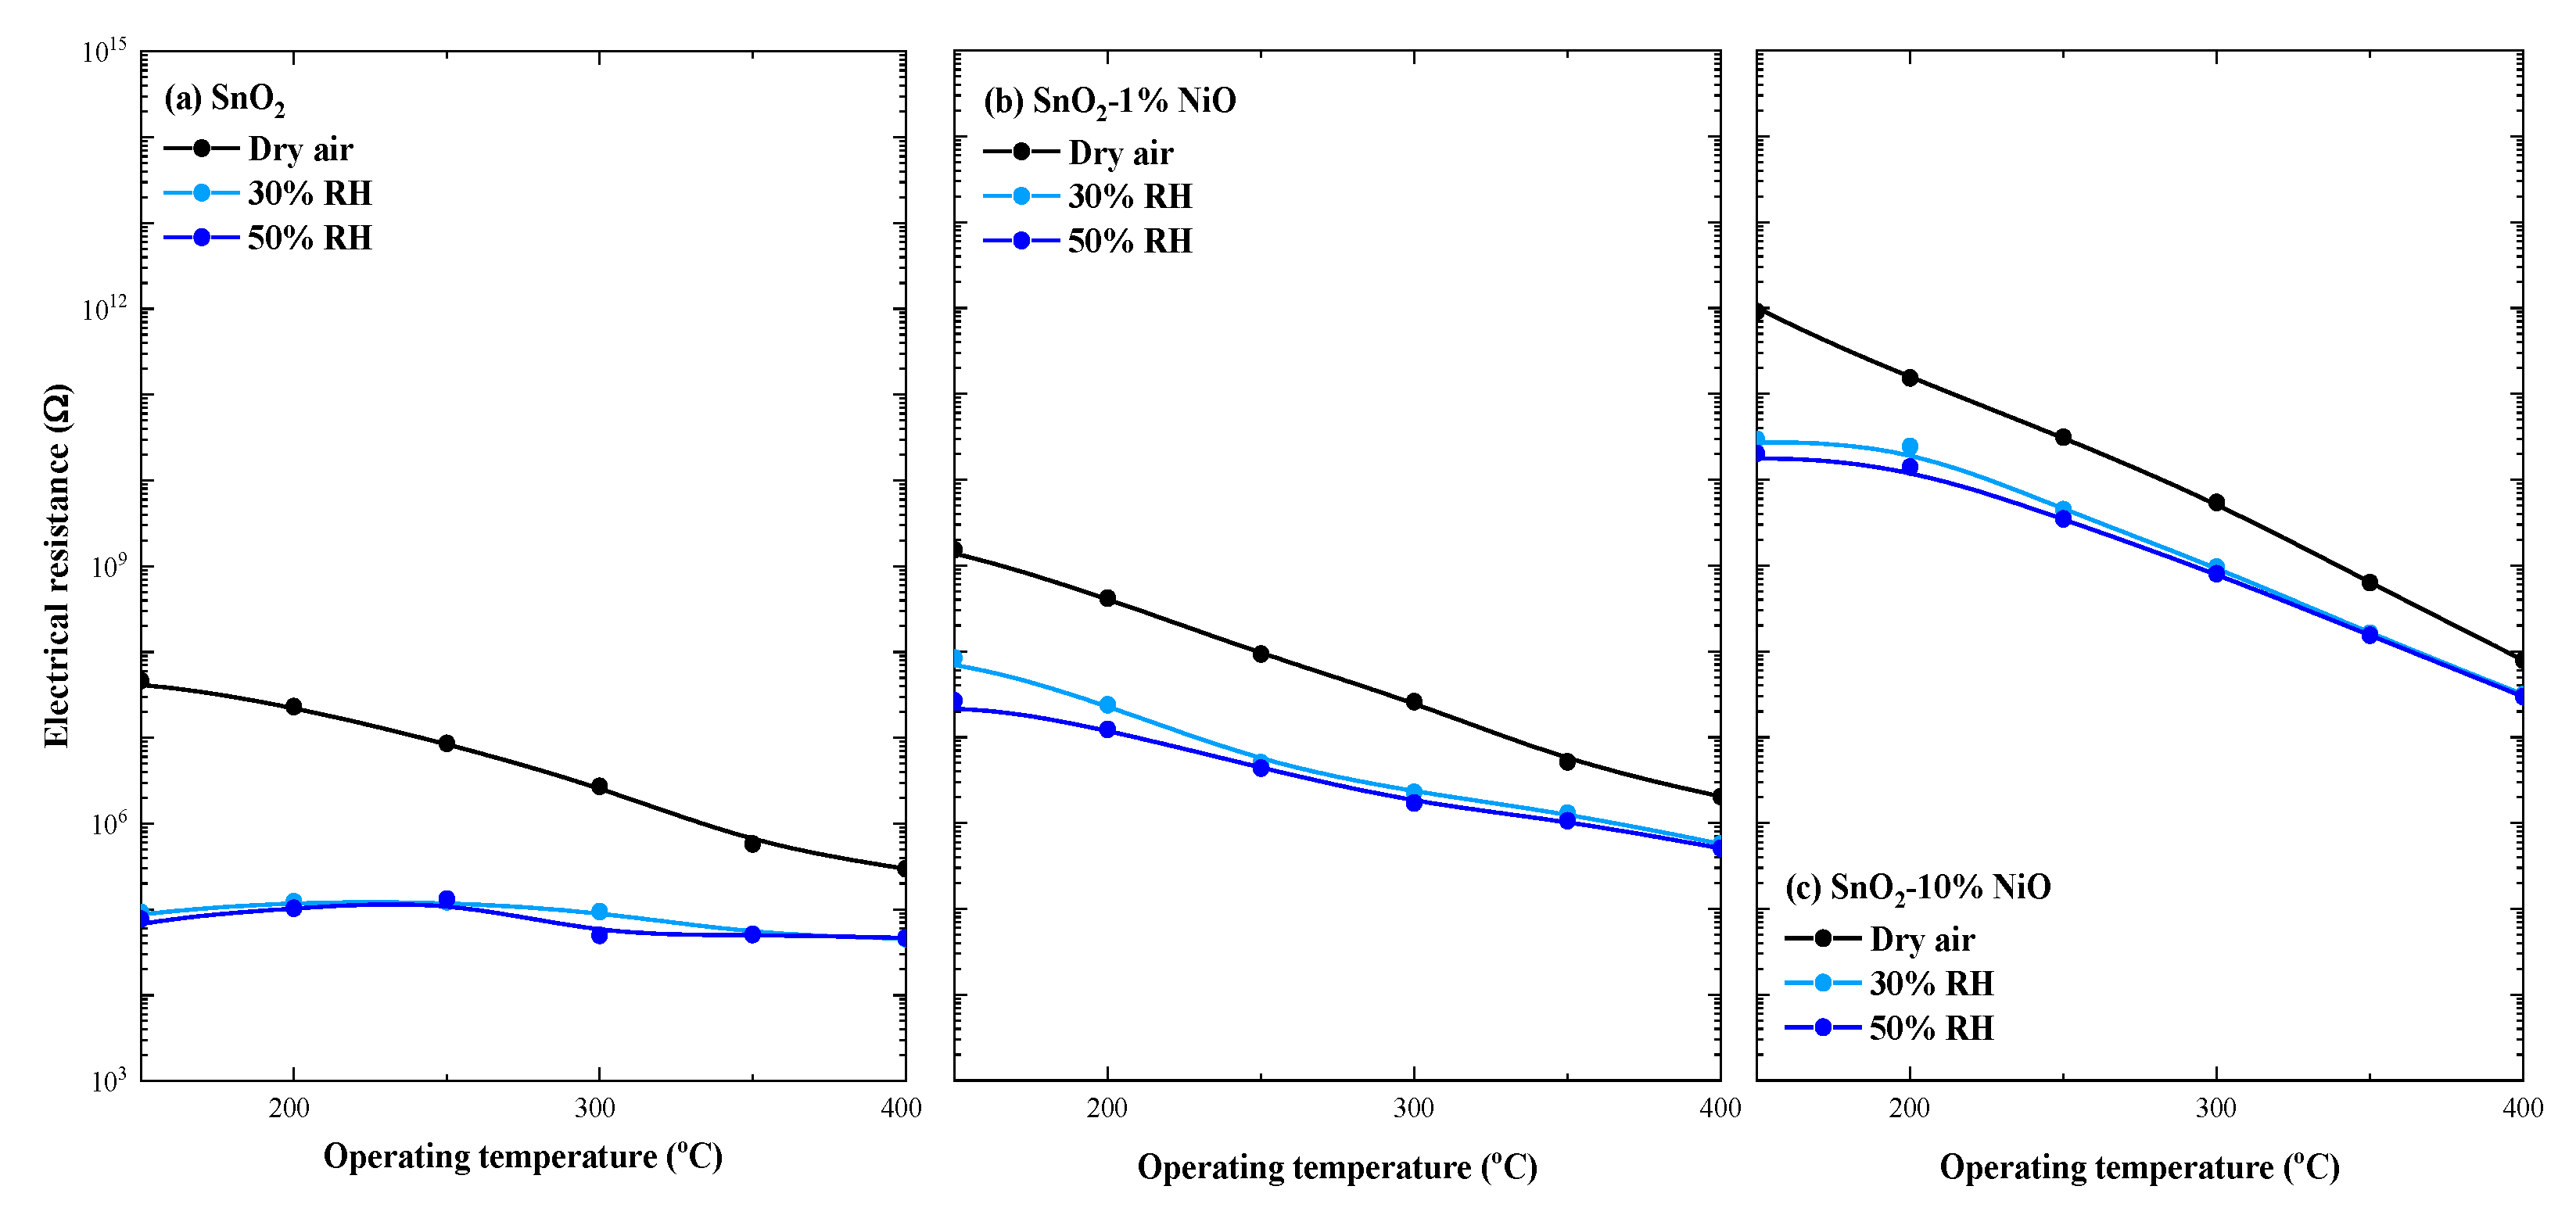
It is known [19,20] that the gas sensing properties of a sensitive material are strongly related to the operating temperature through the nature of the surface adsorbed species further involved in the gas detection processes. The changes in the surrounding relative humidity (%RH) must be considered when an applicative potential is demanded [21]. Therefore, we pursued the evaluation of the relative humidity influence upon the electrical resistance of xNiO-(1-x)SnO2 (x = 0, 1, 10%) through the whole range of operating temperatures, directly linked to the specific surface interactions involving free charge carrier exchange. As such, the corresponding difference between dry air atmosphere and air with 50% RH (as the accepted average value for in-field conditions) has been evaluated. On the other hand, the differences induced by the various RH levels were considered to be references for the following changes induced by the gas−surface interactions with different gas noxes, potentially present in the surrounding atmosphere (see Figure 8).
The doping level with a p-type MOX material (NiO) of the base n-type SnO2 is reflected through its electrical resistance dependence with respect to the operating temperature. Accordingly, one can see that the electrical resistance increases with the increase in the amount (%) of NiO loading, independent of the RH level. Moreover, the RH influence decreases with the increase in the amount of NiO loading, while the influence of RH level is negligible over the whole range of operating temperatures. A possible explanation is related to the fact that the presence of moisture in the surrounding atmosphere decreases the electrical resistance of the base SnO2 material as a consequence of hemolytic dissociation [22] in a hydroxyl group OH- which can share its electronic pair with the lattice cation (usually Snlatt) and in a weakly bounded proton H+ that may easily react with the lattice oxygen according to the following relation:
Herein, the presence of Ni2+ cations are responsible for OH group trapping, leaving Sn2+ available for subsequent gas surface interaction.
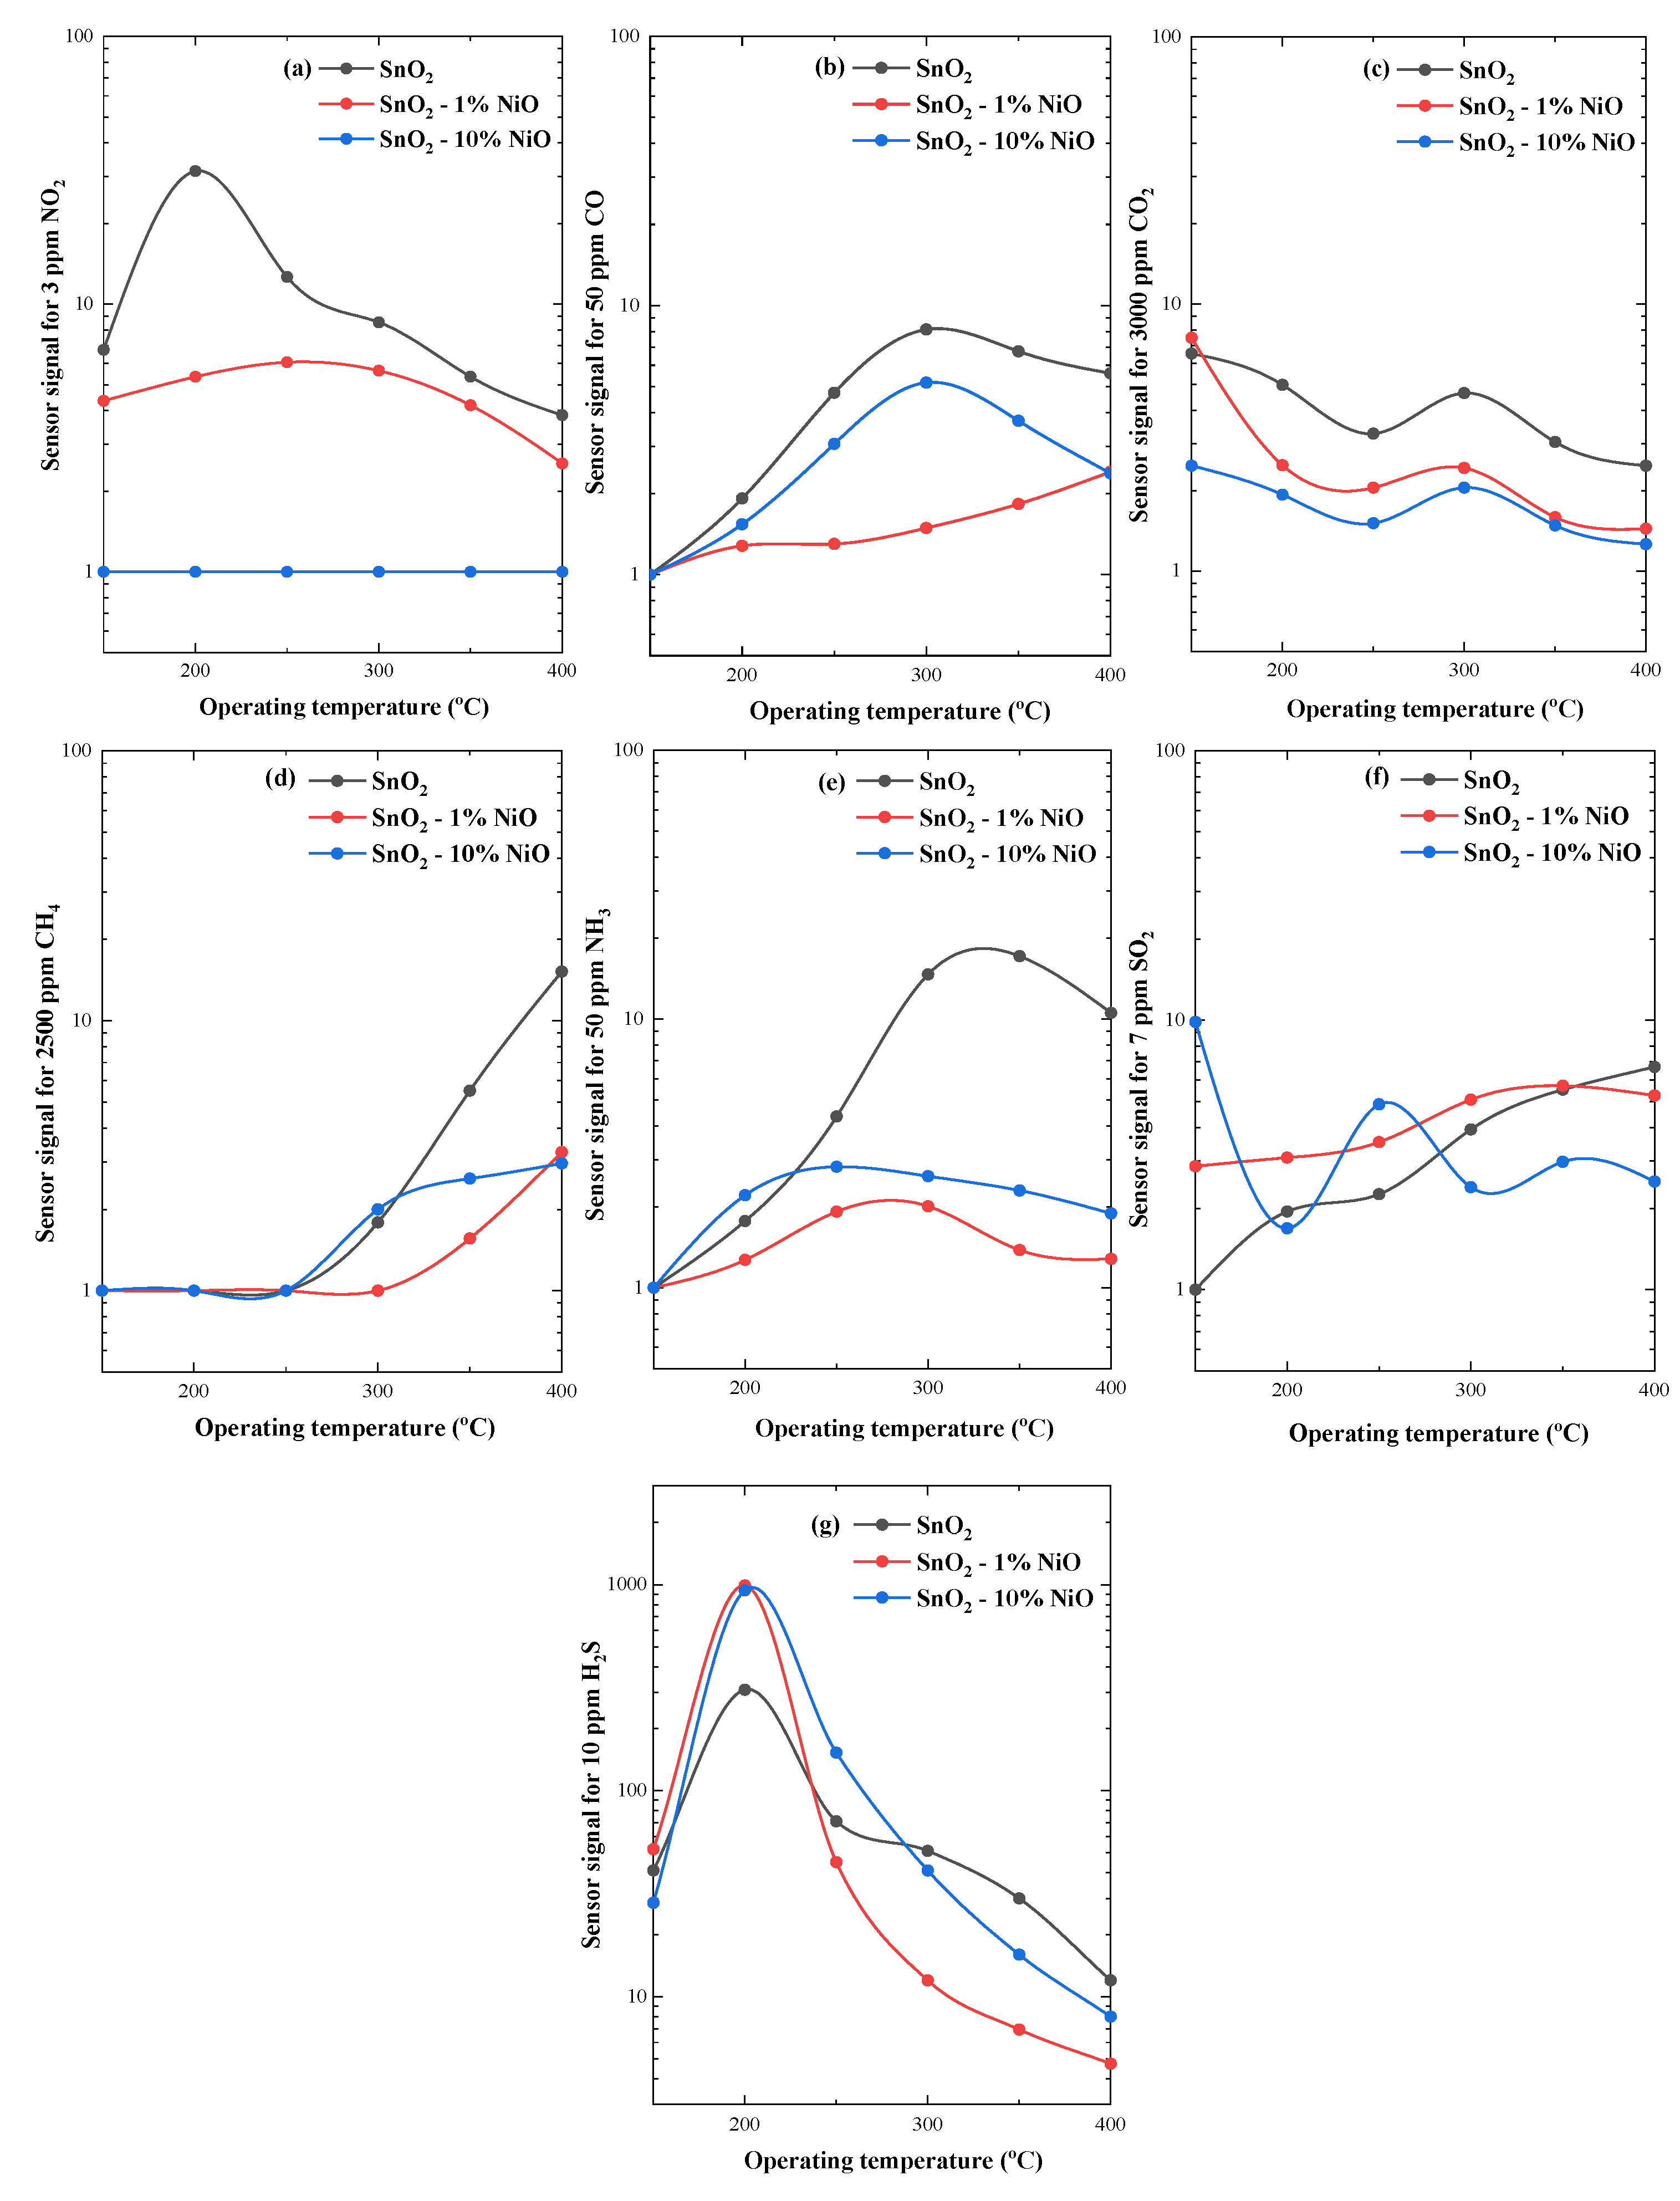
In order to identify the gas-specific finger print of (1-x) SnO2 - xNiO (x = 0, 1, 10%) a common gas testing protocol involving different gases (NO2, CO, CO2, CH4, NH3, SO2 and H2S) was addressed over the whole range of operating temperatures (Figure 9). All the concentrations of the specific interfering gases were chosen according to the EU exposure limits. The sensor signal was defined as:
and
where Rair is the electrical resistance under reference atmosphere and Rgas is the electrical resistance under test gas conditions.
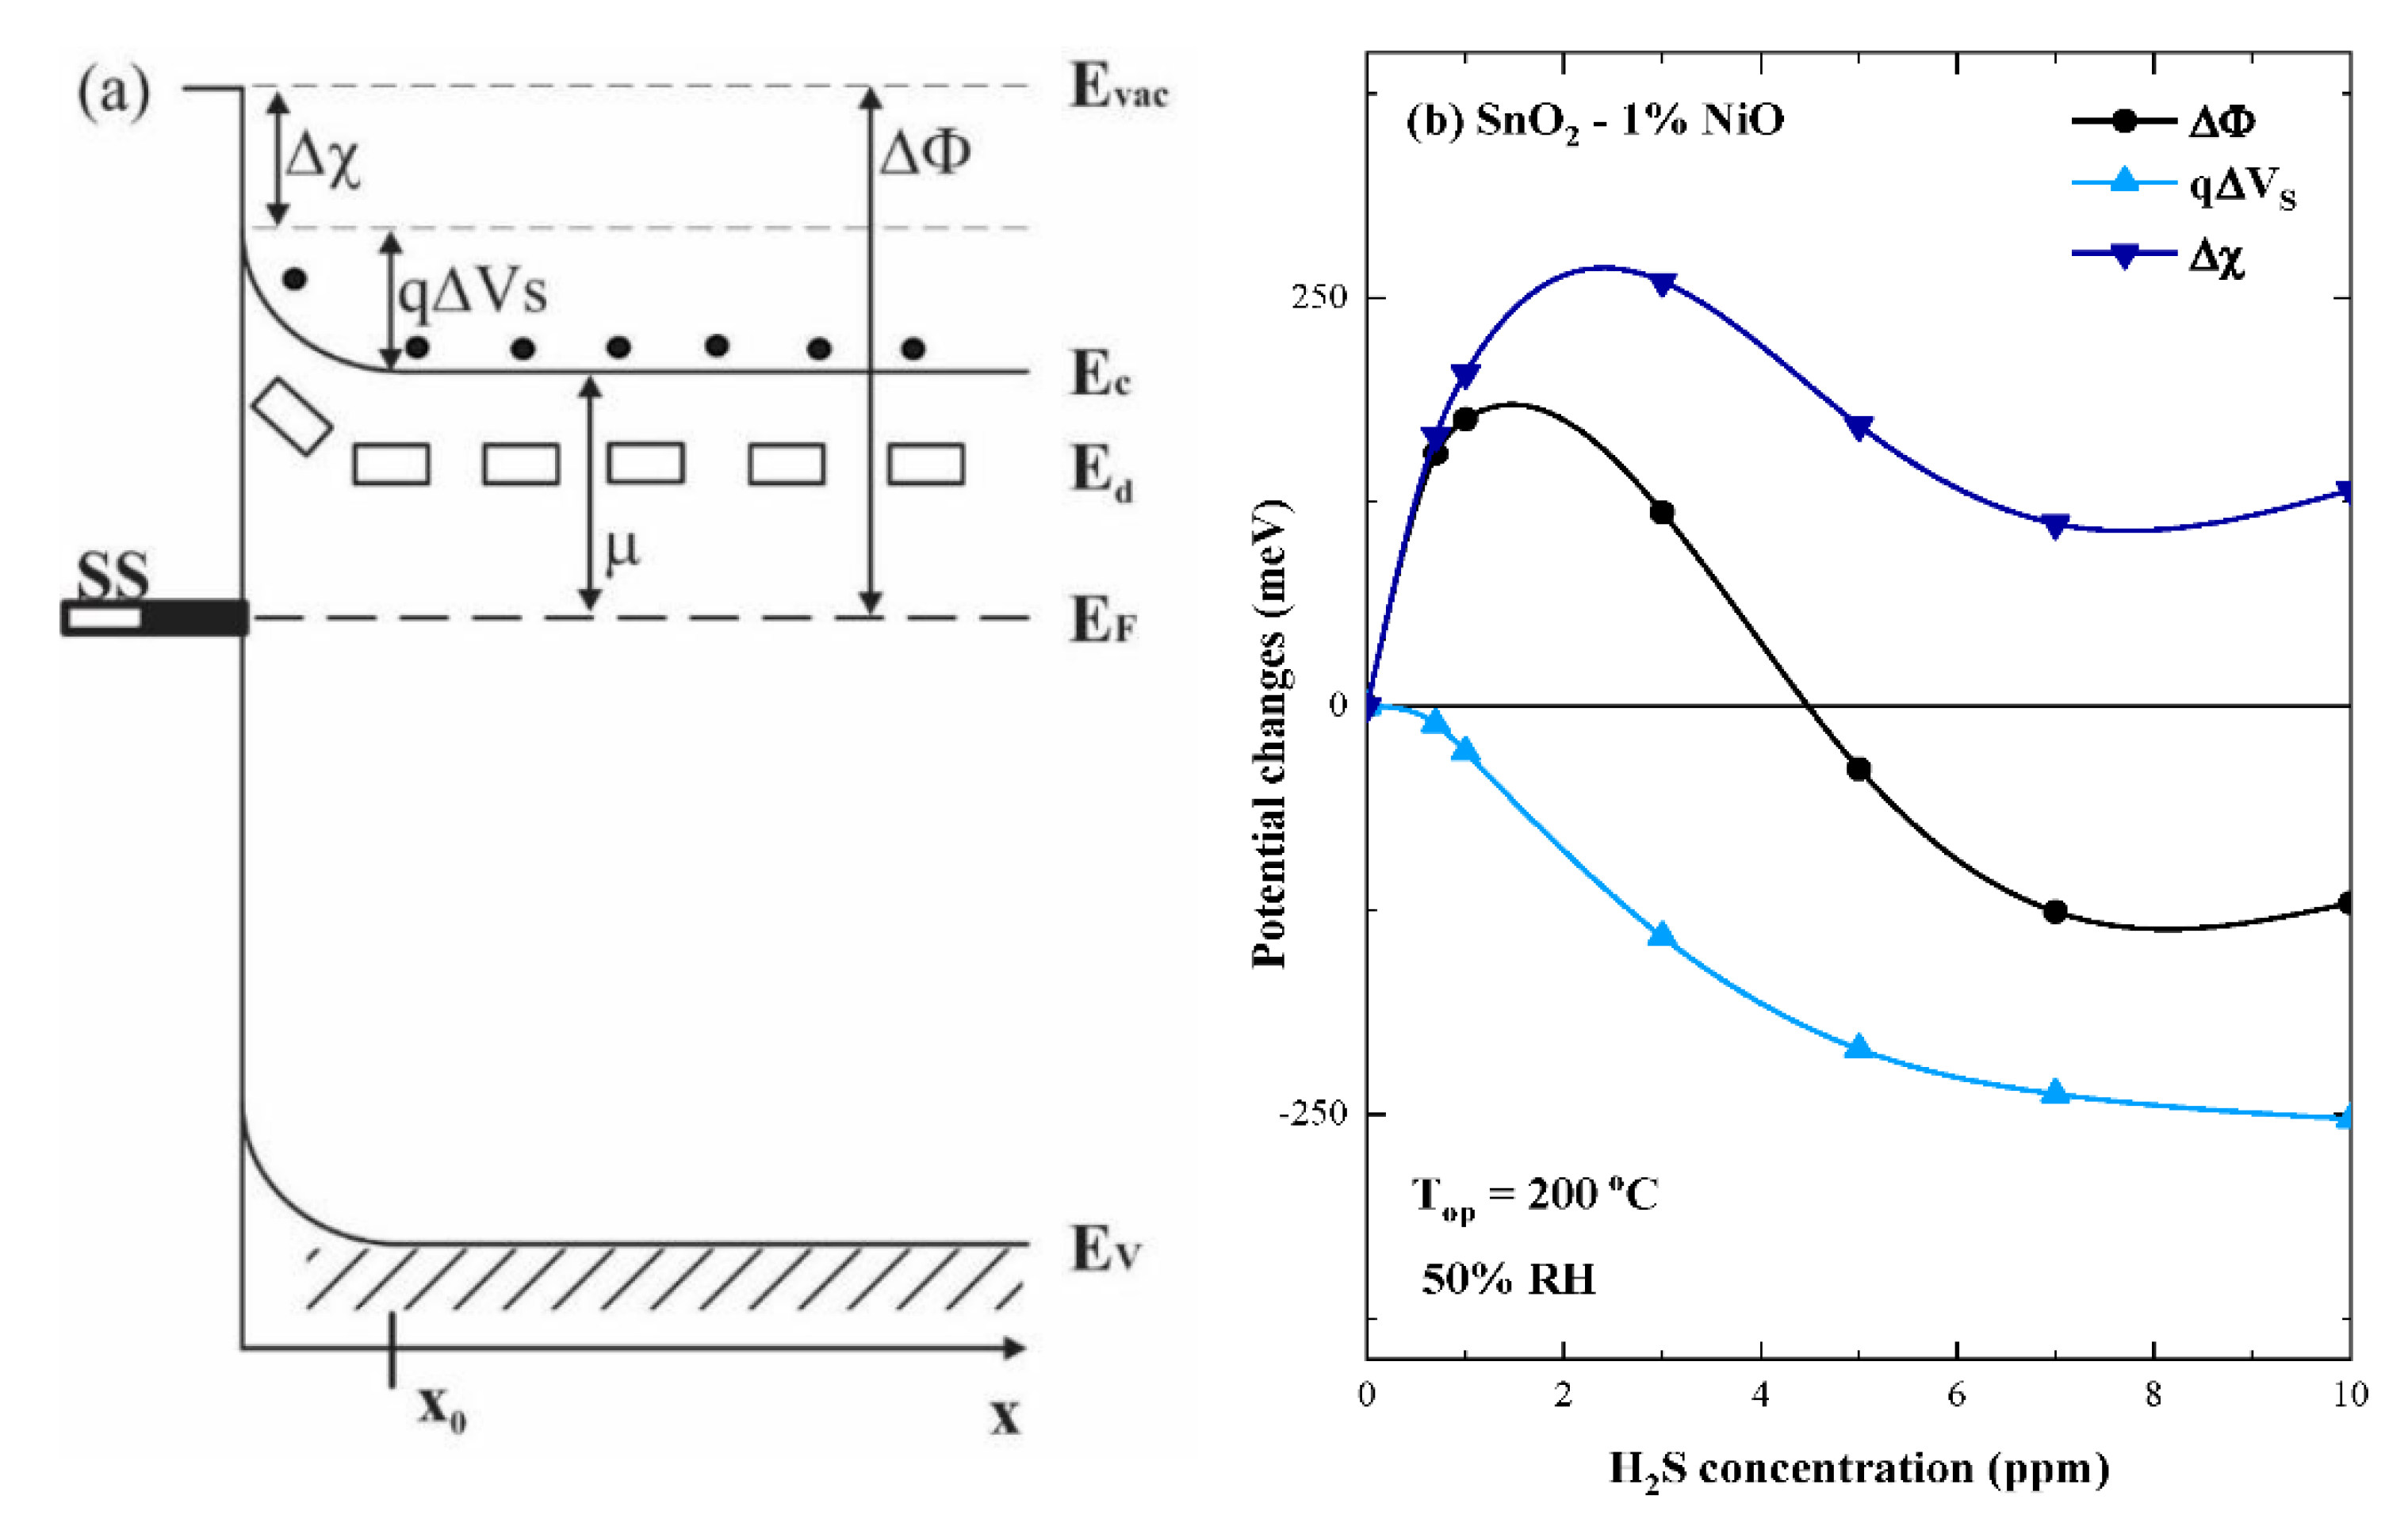
Depending on the nature of the target gas (reducing or oxidizing), the calculated sensor signals varied with respect to the operating temperature in the range of 1 to 30 for all investigated gas types, except for H2S. In this case, the maximum signal occurred at 200 °C for SnO2-1%NiO (S~1000) and SnO2-10%NiO (S~940) and highlighted the specific selectivity to H2S of both NiO loaded materials. Correlating the sensing results with the morphological ones that highlighted the appearance of segregation for the highest doped NiO based SnO2 material, SnO2-1%NiO was selected for supplementary investigations involving simultaneous electrical resistance and work function measurements under H2S exposure [23]. Thus, the surface contact potential differences (ΔCPD) of SnO2-1%NiO exposed to different H2S concentrations under 50% RH and operated at 200 °C, bring insights about the surface adsorbed species, which may or may not exchange free charge carriers with the investigated material but in turn contribute to the coverage of the surface with specific dipolar species. Accordingly, the change in the work function (∆Φ) has two components, which are directly influenced by the gas−surface interactions, i.e., electron affinity (Δχ) and band bending (qΔVs) changes while the electrochemical potential (µ) remains constant (Figure 10a). The former is influenced by the net coverage in surface with dipoles while the latter is influenced by the changes in the net surface charge [24].
With the above-mentioned discussion one can write the following relation:
where:
Experimentally, the contact potential difference (ΔCPD) and subsequently the changes between Rair and RH2S were measured, thus allowing quantitative information to be obtained about the changes in electron affinity (Δχ) (see Figure 10b).
The work function behavior with respect to the H2S concentration resembles the one of electron affinity, i.e., with an abrupt increase for the first two gas concentrations, reaching maximum, then followed by a monotonous decrease (crossing the abscissa) until a steady state is accomplished for the last concentrations. Considering the operating temperature of 200 °C, a possible explanation is given by the interplay between the hydroxyl groups and surface oxygen species, the role of Ni2+ cations being to take over the additional surface hydroxylation. As depicted from the XPS investigations (Figure 7b) the largest amount of oxygen is bound in the SnO2 lattice being available for H2S interaction with respect to the following equation:
Accordingly, for H2S concentrations below 5 ppm, the surface hydroxylation dominates, reflected by increasing electronic affinity. As H2S concentration increases, the (Δχ) slightly decreases indicating a change in the reaction partners until a steady state is obtained, strengthening the idea of having different interaction mechanisms. The changes occurring in the potential barrier (qΔVs) are described by a monotonous decrease up to 5 ppm of H2S concentration, followed by a turning point of the slope for the highest concentrations. Such behavior can be attributed to the strong reducing potential of H2S over the preadsorbed oxygen species, with the release of free charge carriers in the conduction band.
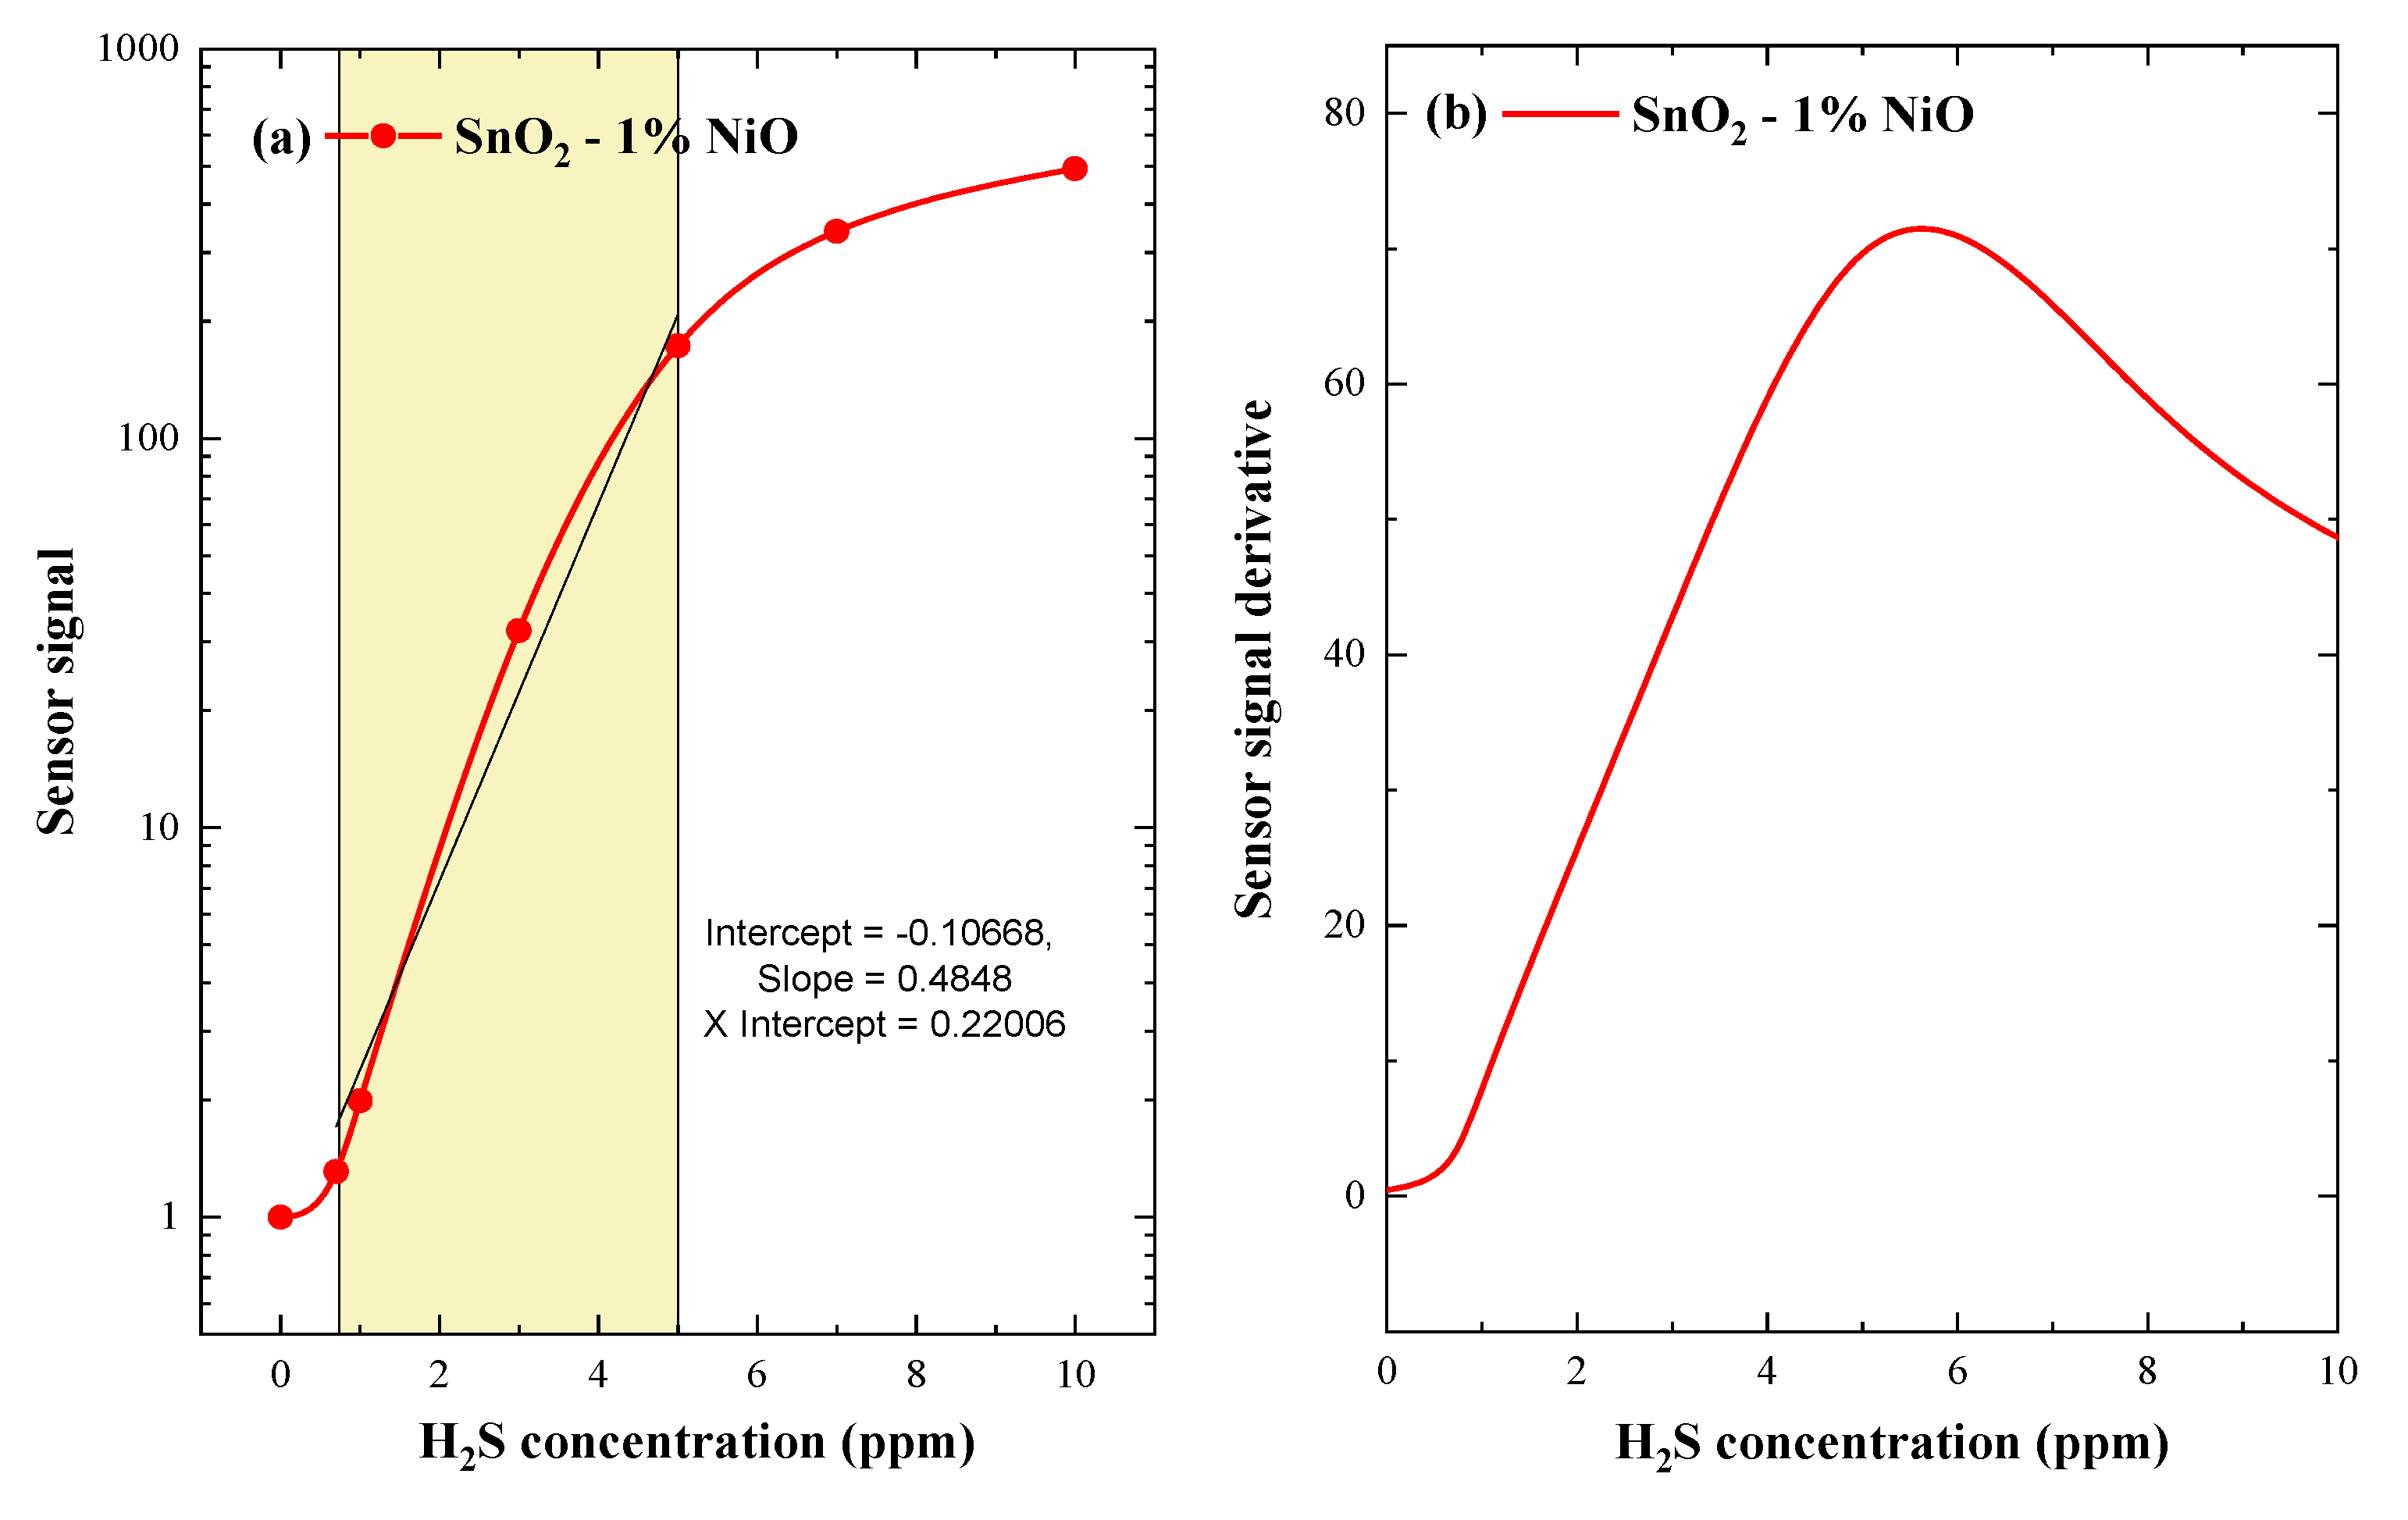
As mentioned before (5), there is a direct relationship between the surface band bending (qΔVs) and sensor signal via: allowing the calculation of the sensor signal dependencies with respect to the H2S concentrations.
As can be observed in Figure 11a, the sensor signal of the investigated material shows a good linear relationship for the lowest H2S concentrations, indicating promising involvement towards applicative potential with H2S gas sensors. It should be noted that the threshold value of 5 ppm H2S represents, from the application point of view, the lower limit of health effects, an eight-hour TWA.
On the other hand, we call the first derivative of the sensor signal in order to enhance the resolution of possible inflection points. As illustrated in Figure 11b, the peak center of the derivative matched with the 5 ppm of H2S concentration, indicating a turning point in the detection mechanism as seen through the simultaneous electrical resistance and work function measurements.
Additionally, in order to compare the results for H2S detection with different types of SMOX gas sensors, we have proceeded to a literature review (Table 2).
As can be observed, the interest has been focused on low operating temperature and high sensitivity to H2S, involving different types of heterostructures, but all the investigations were performed under ideal laboratory conditions. From an applicative perspective, the right solution is to address different gas sensing approaches by attempting to exploit the sensitive materials’ performances close to the in-field conditions. Therefore, the take-off herein depicted, was to highlight the novelty of nickel impregnation of base SnO2 as main mediator within the oxygen−water interplay. In addition to the moisture influence over the sensing performances, the present work also considered the possible cross-sensitivity issues with other potential interfering gases present in the surrounding atmosphere.
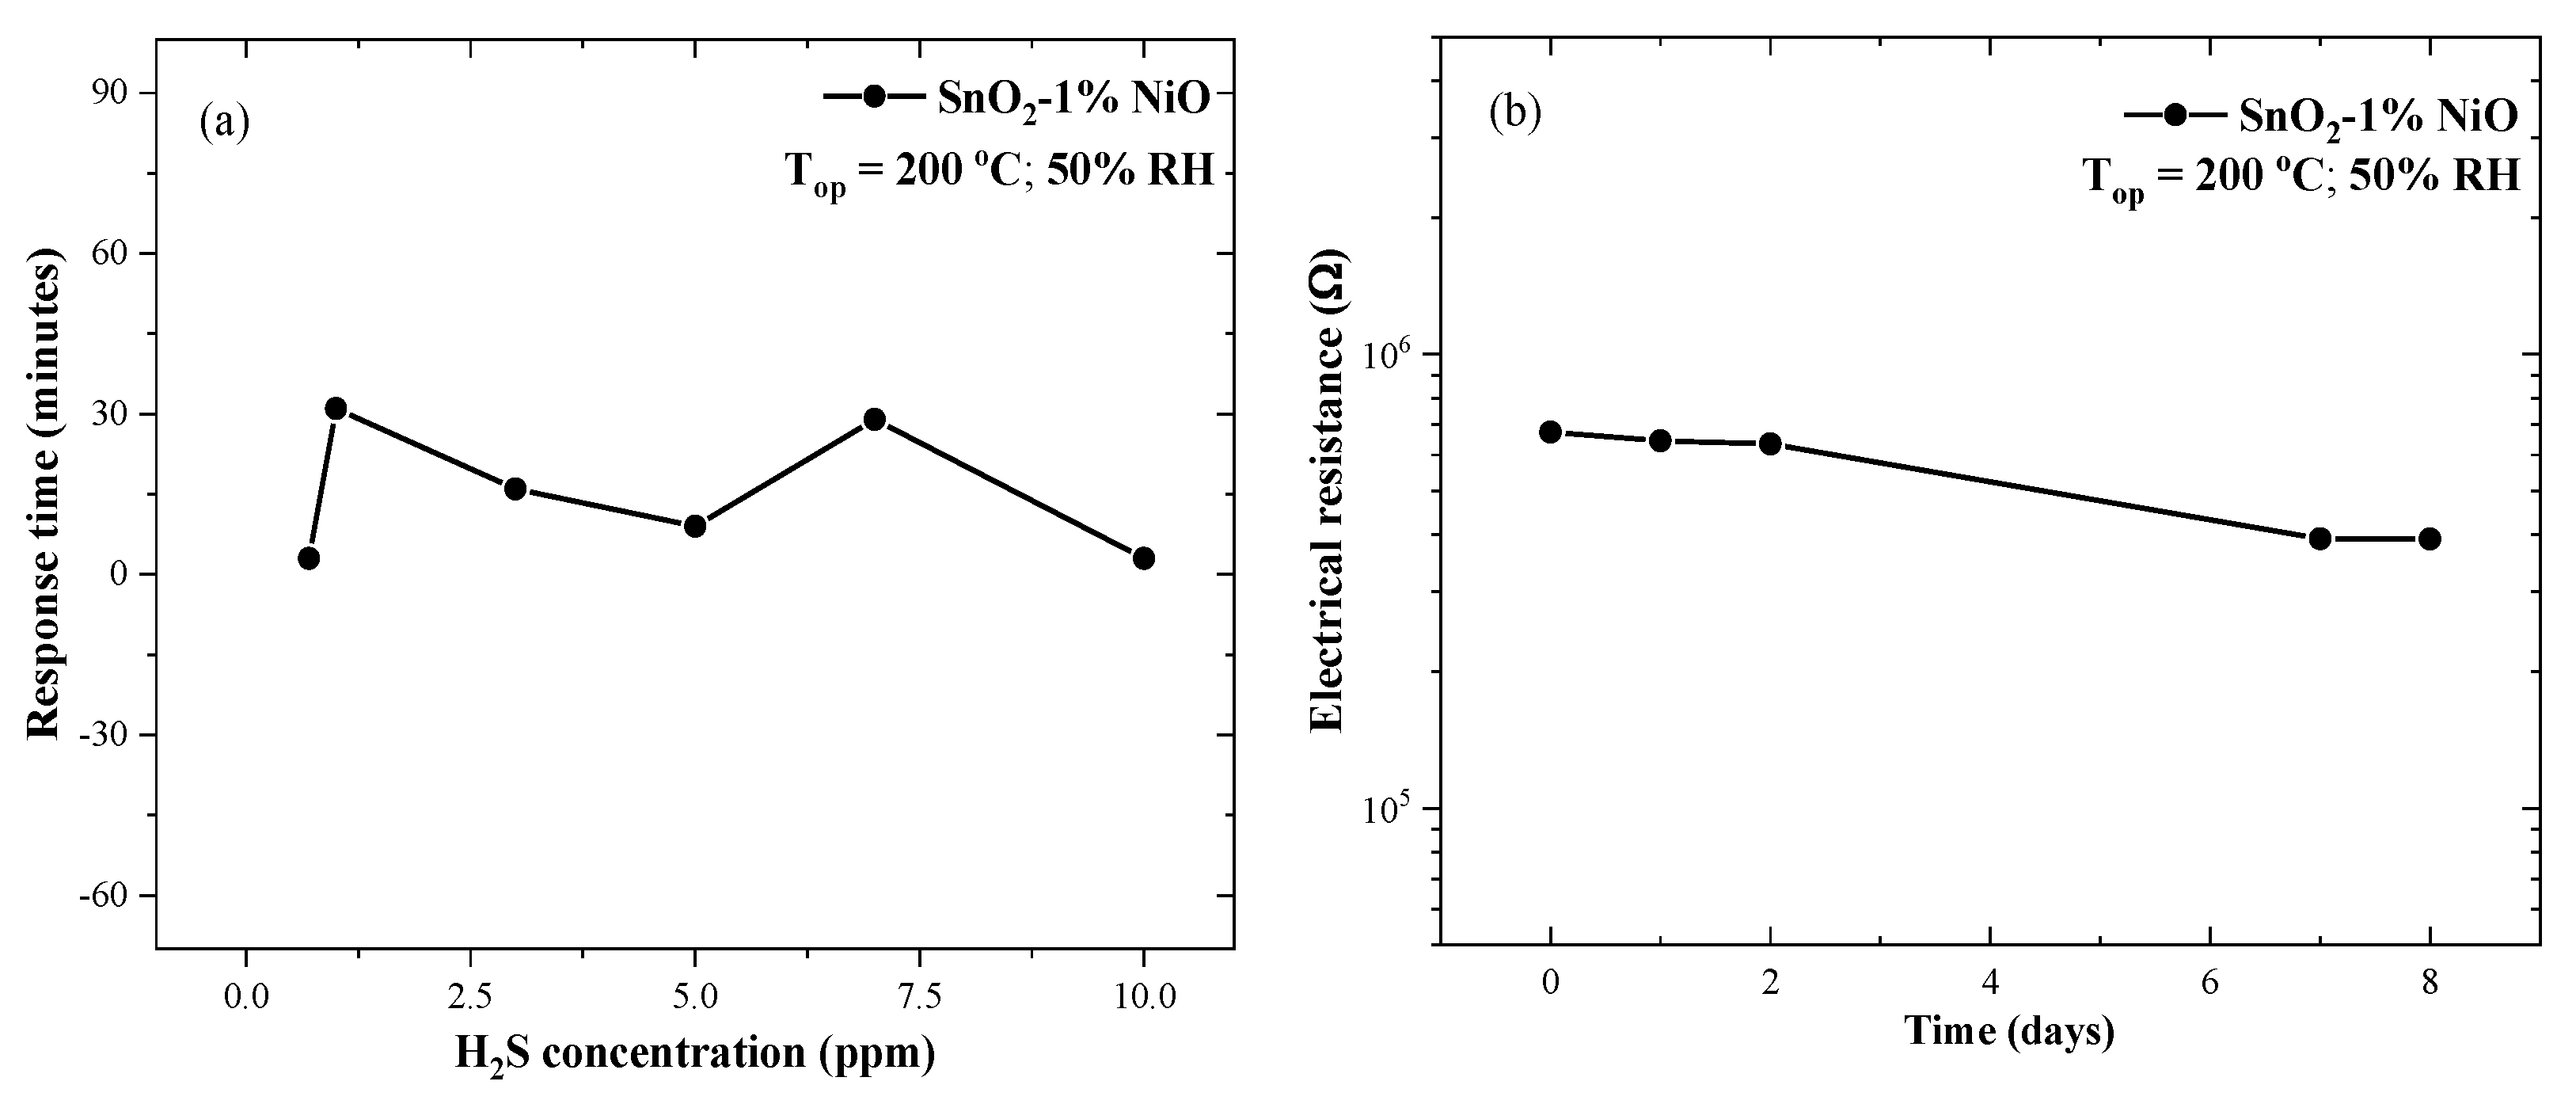
Transients and stability have been also evaluated. The response time is defined as the time necessary for the electrical resistance of the sensor to attain a threshold level of 90% from the steady state conditions in a test gas situation and the recovery time is defined as the time necessary to return to 90% from the steady state conditions after the gas stimulus has ended. By considering the fact that the gas flow conditions and test chamber volume are constant during the measurements, the aforementioned characteristics strongly depend on the surface equilibria where the gas interaction takes place [30]. As for the investigated SnO2-1%NiO sensitive material, the response times were found to vary between 3 and 31 min with minima for the lowest and the highest concentrations, as well as for the turning point at 5 ppm of H2S. The recovery time was found to be around 30 min (Figure 12a).
Aiming to find an explanation for such behavior, in the case of thick, porous films is not an easy task. Therefore, most probably the interaction mechanism involves either different percolation paths or various reaction partners for H2S detection [31].
It is known that the stability of a sensitive material is an important parameter when targeting a potential application. Herein, the base line resistance was monitored under dynamic air flow conditions with 50% RH at the optimum operating temperature. Figure 12b shows the electrical resistance changes during several periods of time when the sensor was operated under normal in-field conditions. The sensor’s resistance slightly decreased over eight days of investigation. Such an aspect is quite normal for a SMOX-based gas sensor when operated against a humid background and can be attributed both to the surface bonded hydroxyl species and to the common aging effect.
4. Conclusions
Sensitive materials based on xNiO-(1-x)SnO2 (x = 0, 1, 10%) have been prepared by NiO wet impregnation of SnO2 obtained by a hydrothermal chemical route assisted by Brij 35 as non-ionic surfactant. An operating temperature screening was performed in order to establish the electrical resistance behavior of said materials, relative to the amount (%) of NiO and to the RH level of the simulated in-field atmosphere. Thus, it was possible to identify the role of NiO loading over the RH influence for the whole range of operating temperatures. The specific selectivity to H2S was demonstrated by using a general gas sensing protocol involving other potential interfering gases such as: NO2, CO, CO2, CH4, NH3 and SO2 over the whole range of operating temperatures with specific concentrations in accordance with the European exposure limits. The selected 1 wt.% NiO/SnO2 was subjected to simultaneous electrical resistance and work function investigations. Thus, we could understand the way in which different concentrations of H2S induced different reaction mechanisms with a turning point at the threshold limit of 5 ppm H2S. The good linear relationship for lower H2S concentrations under in-field conditions indicates a promising applicative potential.
Author Contributions
Conceptualization, A.S. and C.E.S.; materials preparation, S.S.; sensor fabrication and electrical investigations, O.G.F.; XRD investigations, D.G.; morphological investigations, A.C.K.; writing—original draft preparation, A.S.; writing—review and editing, all authors. All authors have read and agreed to the published version of the manuscript.
Funding
This work was funded by a grant of the Ministry of Research, Innovation and Digitization CNCS/CCDI-UEFISCDI through the project PN-III-P4-ID-PCE-2020-0506 (contract no. 116/2021) within PNCDI III and by Romanian National Authority for Scientific Research through the Core Program PN19-03 (contract no. 21 N/8 February 2019).
Conflicts of Interest
The authors declare no conflict of interest. The funders had no role in the design of the study; in the collection, analyses, or interpretation of data; in the writing of the manuscript, or in the decision to publish the results.
References
- Moseley, P.T. Progress in the development of semiconducting metal oxide gas sensors: A review. Meas. Sci. Technol. 2017, 28, 082001. [Google Scholar] [CrossRef]
- Miller, D.R.; Akbar, S.A.; Morris, P.A. Nanoscale metal oxide-based heterojunctions for gas sensing: A review. Sens. Actuators B Chem. 2014, 204, 250–272. [Google Scholar] [CrossRef]
- Nikolic, M.V.; Milovanovic, V.; Vasiljevic, Z.Z.; Stamenkovic, Z. Semiconductor Gas Sensors: Materials, Technology, Design, and Application. Sensors 2020, 20, 6694. [Google Scholar] [CrossRef] [PubMed]
- Wang, C.; Yin, L.; Zhang, L.; Xiang, D.; Gao, R. Metal Oxide Base Sensors: Sensitivity and Influencing Factors. Sensors 2010, 10, 2088–2106. [Google Scholar] [CrossRef] [PubMed] [Green Version]
- Fine, G.F.; Cavanagh, L.M.; Afonja, A.; Binions, R. Metal Oxide Semi-Conductor Gas Sensors in Environmental Monitoring. Sensors 2010, 10, 5469–5502. [Google Scholar] [CrossRef] [Green Version]
- Heiland, G.; Kohl, D. Chemical Sensor Technology; Seiyama, T., Ed.; Kodansha: Japan, Tokyo, 1988; Volume 1, pp. 15–38. [Google Scholar]
- Kim, H.-J.; Lee, J.-H. Highly sensitive and selective gas sensors using p-type oxide semiconductors: Overview. Sens. Actuators B Chem. 2014, 192, 607–627. [Google Scholar] [CrossRef]
- Hübner, M.; Simion, C.E.; Tomescu-Stanoiu, A.; Pokhrel, S.; Barsan, N.; Weimar, U. Influence of humidity on CO sensing with p-type CuO thick film gas sensors. Sens. Actuators B Chem. 2011, 153, 347–353. [Google Scholar] [CrossRef]
- Arshaka, K.; Twomey, K.; Egan, D. A Ceramic Thick Film Humidity Sensor Based on MnZn Ferrite. Sensors 2002, 2, 50–61. [Google Scholar] [CrossRef]
- Hashtroudi, H.; Mackinnon, I.D.R.; Shafiei, M. Emerging 2D hybrid nanomaterials: Towards enhanced sensitive and selective conductometric gas sensors at room temperature. J. Mater. Chem. C 2020, 8, 13108–13126. [Google Scholar] [CrossRef]
- Han, Y.; Huang, D.; Ma, Y.; He, G.; Hu, J.; Zhang, J.; Hu, N.; Su, Y.; Zhou, Z.; Zhang, Y.; et al. Design of Hetero-Nanostructures on MoS2 Nanosheets to Boost NO2 room-temperature sensing. ACS Appl. Mater. Interfaces 2018, 10, 22640–22649. [Google Scholar] [CrossRef]
- Tian, H.; Fan, H.; Dong, G.; Ma, L.; Ma, J. NiO/ZnO p-n heterostructures and their gas sensing properties for reduced operating temperature. RSC Adv. 2016, 6, 109091–109098. [Google Scholar] [CrossRef]
- Goyal, C.P.; Goyal, D.; Ramgir, N.S.; Navaneethan, M.; Hayakawa, Y.; Muthamizhehelvan, C.; Ikeda, H.; Ponnusamy, S. Surface Modification of ZnO Nanowires with CuO: A tool to realize Highly-Sensitive H2S sensor. Phys. Solid State 2021, 63, 460–467. [Google Scholar] [CrossRef]
- Xuemei, H.; Yukun, S.; Bo, B. Fabrication of Cubic p-n Heterojunction-Like NiO/In2O3 Composite Microparticles and their enhanced gas sensing characteristics. J. Nanomater. 2016, 2016, 7589028. [Google Scholar] [CrossRef]
- Dey, S.; Nag, S.; Santra, S.; Ray, S.K.; Guha, P.K. Voltage-controlled NiO/ZnO p–n heterojunction diode: A new approach towards selective VOC sensing. Microsyst. Nanoeng. 2020, 6, 35. [Google Scholar] [CrossRef]
- Ali, F.I.M.; Awwad, F.; Greish, Y.E.; Mahmoud, S.T. Hydrogen Sulfide (H2S) Gas Sensor: A review. IEEE Sens. J. 2019, 19, 2394–2407. [Google Scholar] [CrossRef]
- Shannon, R.D. Revised effective ionic radii and systematic studies of interatomic distances in halides and chalcogenides. Acta Cryst. A 1976, 32, 751–767. [Google Scholar] [CrossRef]
- Naumkin, A.V.; Kraut-Vass, A.; Gaarenstroom, S.W.; Powell, C.J. NIST X-ray Photoelectron Spectroscopy Database; NIST Standard Reference Database 20, Version 4.1; National Institute of Standards and Technology: Gaithersburg, MD, USA, 2012. [Google Scholar] [CrossRef]
- Ji, H.; Zeng, W.; Li, Y. Gas sensing mechanisms of metal oxide semiconductors: A focus review. Nanoscale 2019, 11, 22664. [Google Scholar] [CrossRef] [PubMed]
- Soleimanpour, A.M.; Jayatissa, A.H.; Sumanasekera, G. Surface and gas sensing properties of nanoscrystalline nickel oxide thin films. Appl. Surf. Sci. 2013, 276, 291–297. [Google Scholar] [CrossRef]
- Yamazoe, N.; Sakai, G.; Shimanoe, K. Oxide semiconductor gas sensors. Catal. Surv. Asia 2003, 7, 63–75. [Google Scholar] [CrossRef]
- Gercher, V.A.; Cox, D.F. Water adsorption on stoichiometric and defective SnO2 (110) surfaces. Surf. Sci. 1995, 322, 177–184. [Google Scholar] [CrossRef]
- Oprea, A.; Barsan, N.; Weimar, U. Work function changes in gas sensitive materials: Fundamentals and applications. Sens. Actuators B Chem. 2009, 142, 470–493. [Google Scholar] [CrossRef]
- Barsan, N.; Koziej, D.; Weimar, U. Metal oxide-based gas sensor research: How to? Sens. Actuators B Chem. 2007, 121, 18–35. [Google Scholar] [CrossRef]
- Boroun, Z.; Ghorbani, M.; Mohammadpour, R.; Moosavi, A. Importance of N-P-N Junction in H2S Sensing Process of SnO2-CuO Heterostructures: A Theoretical Macroscopic Approach. IEEE Sens. J. 2021, 21, 7123–7129. [Google Scholar] [CrossRef]
- Shanmugasundaram, A.; Kim, D.S.; Hou, T.F.; Lee, D.W. Facile in situ Formation of CuO/ZnO p-n Heterojunction for Improved H2S-sensing Applications. J. Sens. Sci. Technol. 2020, 29, 156–161. [Google Scholar] [CrossRef]
- Ao, D.; Li, Z.; Fu, Y.; Tang, Y.; Yan, S.; Zu, X. Heterostructured NiO/ZnO Nanorod Arrays with Significantly Enhanced H2S Sensing Performance. Nanomaterials 2019, 9, 900. [Google Scholar] [CrossRef] [Green Version]
- Zhang, P.; Zhu, H.; Xue, K.; Chen, L.; Shi, C.; Wang, D.; Li, J.; Wang, X.; Cui, G. H2S detection at low temperatures by Cu2O/Fe2O3 heterostructure ordered array sensors. RSC Adv. 2020, 10, 8332. [Google Scholar] [CrossRef] [Green Version]
- Wang, X.; Li, S.; Xie, L.; Li, X.; Lin, D.; Zhu, Z. Low-temperature and highly sensitivity H2S gas sensor based on ZnO/CuO composite derived from bimetal metal-organic frameworks. Ceram. Int. 2020, 46, 15858–15866. [Google Scholar] [CrossRef]
- Muezzinoglu, M.K.; Vergara, A.; Huerta, R.; Rulkov, N.; Rabinovich, M.I.; Selverston, A.; Abarbanel, H.D.I. Acceleration of chemo-sensory information processing using transients features. Sens. Actuators B Chem. 2009, 137, 507–512. [Google Scholar] [CrossRef]
- Ulrich, M.; Bunde, A.; Kohl, C.D. Percolation and gas sensitivity in nanocrystalline metal oxide films. Appl. Phys Lett. 2004, 85, 242–244. [Google Scholar] [CrossRef]
Figure 1.
GMS with accessories for phenomenological evaluation of the gas sensing properties.

Figure 2.
XRD patterns of the SnO2 and NiO loaded SnO2 samples indexed with the SnO2 tetragonal structure. The X-ray diffractograms are vertically shifted for clarity.
Figure 2.
XRD patterns of the SnO2 and NiO loaded SnO2 samples indexed with the SnO2 tetragonal structure. The X-ray diffractograms are vertically shifted for clarity.

Figure 3.
CTEM-HRTEM and large area SAED, respectively, of SnO2+1%NiO (a–c), SnO2+10%NiO (d–f) as compared with SnO2 reference (g–i).
Figure 3.
CTEM-HRTEM and large area SAED, respectively, of SnO2+1%NiO (a–c), SnO2+10%NiO (d–f) as compared with SnO2 reference (g–i).

Figure 4.
Size distribution of the doped SnO2 samples.

Figure 5.
Dark-field STEM and EDS chemical map for SnO2+1%NiO (a,b), SnO2+10%NiO (c,d) as compared with SnO2 reference (e,f).
Figure 5.
Dark-field STEM and EDS chemical map for SnO2+1%NiO (a,b), SnO2+10%NiO (c,d) as compared with SnO2 reference (e,f).

Figure 6.
Ni2p3/2 (a), Sn3d (b) and C1s (c) superimposed spectra for SnO2, SnO2-1%NiO and SnO2-10%NiO.
Figure 6.
Ni2p3/2 (a), Sn3d (b) and C1s (c) superimposed spectra for SnO2, SnO2-1%NiO and SnO2-10%NiO.

Figure 7.
O1s superimposed spectra for SnO2, SnO2-1%NiO and SnO2-10%NiO (a) and O1s deconvoluted spectrum for SnO2-10%NiO (b).
Figure 7.
O1s superimposed spectra for SnO2, SnO2-1%NiO and SnO2-10%NiO (a) and O1s deconvoluted spectrum for SnO2-10%NiO (b).

Figure 8.
Humidity influences over the electrical resistance over a wide range of operating temperatures for SnO2 (a), SnO2-1%NiO (b) and SnO2-10%NiO (c).
Figure 8.
Humidity influences over the electrical resistance over a wide range of operating temperatures for SnO2 (a), SnO2-1%NiO (b) and SnO2-10%NiO (c).

Figure 9.
Sensor signal of (1-x) SnO2 - xNiO (x = 0, 1, 10%) for: 3 ppm NO2 (a); 50 ppm CO (b); 3000 ppm CO2 (c); 2500 ppm CH4 (d); 50 ppm NH3 (e); 7 ppm SO2 (f) and 10 ppm H2S (g), over a wide range of operating temperatures and fixed 50%RH.
Figure 9.
Sensor signal of (1-x) SnO2 - xNiO (x = 0, 1, 10%) for: 3 ppm NO2 (a); 50 ppm CO (b); 3000 ppm CO2 (c); 2500 ppm CH4 (d); 50 ppm NH3 (e); 7 ppm SO2 (f) and 10 ppm H2S (g), over a wide range of operating temperatures and fixed 50%RH.

Figure 10.
Band energy diagram valid for an n-type SMOX sensitive material (a) and experimental surface potential changes for SnO2-1%NiO at fixed operating temperature and RH, over a wide range of H2S concentrations (b).
Figure 10.
Band energy diagram valid for an n-type SMOX sensitive material (a) and experimental surface potential changes for SnO2-1%NiO at fixed operating temperature and RH, over a wide range of H2S concentrations (b).

Figure 11.
Sensor signal of SnO2-1%NiO operated at 200 °C under 50% RH with respect to the H2S concentration (a) and the first derivative of the sensor signal versus H2S concentrations (b).
Figure 11.
Sensor signal of SnO2-1%NiO operated at 200 °C under 50% RH with respect to the H2S concentration (a) and the first derivative of the sensor signal versus H2S concentrations (b).

Figure 12.
Response time with respect to the H2S concentration (a) and base line electrical resistance stability of SnO2-1%NiO operated at 200 °C under 50% RH (b).
Figure 12.
Response time with respect to the H2S concentration (a) and base line electrical resistance stability of SnO2-1%NiO operated at 200 °C under 50% RH (b).


Table 1.
XPS data of the investigated samples.
| Sample | Binding Energies (eV) | Atomic Relative Concentrations (atom %) | |||||
|---|---|---|---|---|---|---|---|
| Ni2p3/2 | Sn3d5/2 | O1s | C | O | Ni | Sn | |
| SnO2 | - | 486.5 | 530.3-Olattice 531.6-OHads 532.9-H2O | 8.0 | 61.4 | - | 30.6 |
| - | 66.8 | 33.2 | |||||
| SnO2-1%NiO | 855.6 | 486.3 | 530.2-Olattice 531.5-OHads 532.8-H2O | 8.9 | 60.6 | 0.95 (~1.2 wt.%) | 29.6 |
| 66.4 | 1.04 | 32.5 | |||||
| SnO2-10%NiO | 855.6 | 486.1 | 530.1-Olattice 531.6-OHads 5.2.9-H2O | 11.7 | 57.8 | 4.6 | 25.9 |
| - | 65.5 | 5.2 (~6.5 wt.%) | 29.3 | ||||
Table 2.
Literature review of various sensing materials towards H2S detection.
| Material | H2S Concentration | Sensor Signal | Presence of Moisture | Reference |
|---|---|---|---|---|
| SnO2-CuO | 1 ppm | 8 × 10³@150 °C | No | [25] |
| CuO-ZnO | 120 ppb | 344@150 °C | No | [26] |
| NiO-ZnO | 20 ppm | 21.3@160 °C | No | [27] |
| Cu2O-Fe2O3 | 10 ppm | 4.8 × 10³@5 °C | No | [28] |
| ZnO-CuO | 10 ppm | 23.03@40 °C | No | [29] |
| NiO-SnO2 | 5 ppm | 1 × 10³@200 °C | Yes | This work |
Publisher’s Note: MDPI stays neutral with regard to jurisdictional claims in published maps and institutional affiliations. |
© 2021 by the authors. Licensee MDPI, Basel, Switzerland. This article is an open access article distributed under the terms and conditions of the Creative Commons Attribution (CC BY) license (https://creativecommons.org/licenses/by/4.0/).
Share and Cite
MDPI and ACS Style
Stanoiu, A.; Kuncser, A.C.; Ghica, D.; Florea, O.G.; Somacescu, S.; Simion, C.E. Sensing Properties of NiO Loaded SnO2 Nanoparticles—Specific Selectivity to H2S. Chemosensors 2021, 9, 125. https://doi.org/10.3390/chemosensors9060125
AMA Style
Stanoiu A, Kuncser AC, Ghica D, Florea OG, Somacescu S, Simion CE. Sensing Properties of NiO Loaded SnO2 Nanoparticles—Specific Selectivity to H2S. Chemosensors. 2021; 9(6):125. https://doi.org/10.3390/chemosensors9060125
Chicago/Turabian StyleStanoiu, Adelina, Andrei C. Kuncser, Daniela Ghica, Ovidiu G. Florea, Simona Somacescu, and Cristian E. Simion. 2021. "Sensing Properties of NiO Loaded SnO2 Nanoparticles—Specific Selectivity to H2S" Chemosensors 9, no. 6: 125. https://doi.org/10.3390/chemosensors9060125
Note that from the first issue of 2016, this journal uses article numbers instead of page numbers. See further details here.