Article

Insights about CO Gas-Sensing Mechanism with NiO-Based Gas Sensors—The Influence of Humidity

1
National Institute of Materials Physics, Atomistilor 405A, 077125 Magurele, Romania
2
Faculty of Physics, University of Bucharest, Atomistilor 405, 077125 Magurele, Romania
3
“Ilie Murgulescu” Institute of Physical Chemistry, Romanian Academy, Spl. Independentei 202, 060021 Bucharest, Romania
*
Author to whom correspondence should be addressed.
Chemosensors 2021, 9(9), 244; https://doi.org/10.3390/chemosensors9090244
Submission received: 11 August 2021 / Revised: 26 August 2021 / Accepted: 29 August 2021 / Published: 1 September 2021
(This article belongs to the Special Issue Emerging Applications of Gas Sensors Based on Metal Oxides)

Abstract

:
Polycrystalline NiO thick film-based gas sensors have been exposed to different test gas atmospheres at 250 °C and measured via simultaneous electrical resistance and work function investigations. Accordingly, we decoupled different features manifested toward the potential changes, i.e., work function, band-bending, and electron affinity. The experimental results have shown that the presence of moisture induces an unusual behavior toward carbon monoxide (CO) detection by considering different surface adsorption sites. On this basis, we derived an appropriate detection mechanism capable of explaining the lack of moisture influence over the CO detection with NiO-sensitive materials. As such, CO might have both chemical and dipolar interactions with pre-adsorbed or lattice oxygen species, thus canceling out the effect of moisture. Additionally, morphology, structure, and surface chemistry were addressed, and the results have been linked to the sensing properties envisaging the role played by the porous quasispherical–hollow structures and surface hydration.

1. Introduction

Metal oxide-based gas sensors (MOX) are among the foremost versatile type of sensors, being capable of detecting a wide variety of gases under in-field operating conditions [1,2,3,4]. The operating principle of MOX gas sensors relies on the electrical resistance changes with respect to the gas-surface interaction processes. When operated at the optimum gas detection temperature, the appearance of a reducing gas (such as carbon monoxide—CO) leads to an increase in the electrical conductivity in the case of n-type MOX, while an opposite effect is recorded for p-type ones [5]. In contrast to n-type MOX sensors, the p-type materials show low moisture influence over the sensor signal together with a good catalytic effect [6,7,8]. However, it was demonstrated that the sensor signal of p-type MOX-based gas sensors is equal to the square root of that of n-type ones when they are operated under the same conditions with similar morphological aspects [9]. In order to boost the sensing performances of p-type-based gas sensors, the efforts should be oriented toward a fundamental understanding of their detection mechanisms under real operating conditions, involving phenomenological insights [10,11,12].
Nickel oxide (NiO) belongs to the class of transition semiconducting metal oxides with applications in electrochromic windows, gas sensing, catalytic oxidation of CO, and fuel cells [13,14,15,16]. Being an insulator due to the wide band gap of 3.6–4.0 eV, its electrical resistance can be reduced through the addition of specific atoms or via inducing nickel vacancies into the NiO lattice. In most situations, the NiO p-type conductivity is related to the vacancies occurring in the cationic sites [17]. Thus, when NiO is exposed to air, at different operating temperatures, oxygen species start to be adsorbed in the form of O 2 , O , and O 2 . Accordingly, this process ends up in electron trapping from the valence band, which successively increases the concentration of holes near the surface. This explains why, in general, p-type materials exhibit lower electrical resistance in air when compared to n-type ones [18]. In spite of the technological importance of NiO material, the understanding of the gas-sensing mechanism involved in the detection of different types of gases continues to be in progress. For instance, thanks to its simple detection mechanism, carbon monoxide represents one of the main target gases when decoupling the sensing and transducing phenomena are the main tasks. Extensive studies have been performed on SnO2 toward CO detection [19], while only on CuO p-type material CO, interaction was analyzed from the perspective of in-field conditions, where water interference in the detection process occurs [9]. It was demonstrated (using simultaneous electrical resistance and work function measurements) that besides CO–O interaction, carbon monoxide can interact with the hydroxyl surface groups, resulting in moisture interaction [20].
Herein, we focused on a fundamental understanding of the insights about the CO sensing mechanism under different humidity levels sustained by simultaneous electrical resistance and work function measurements.

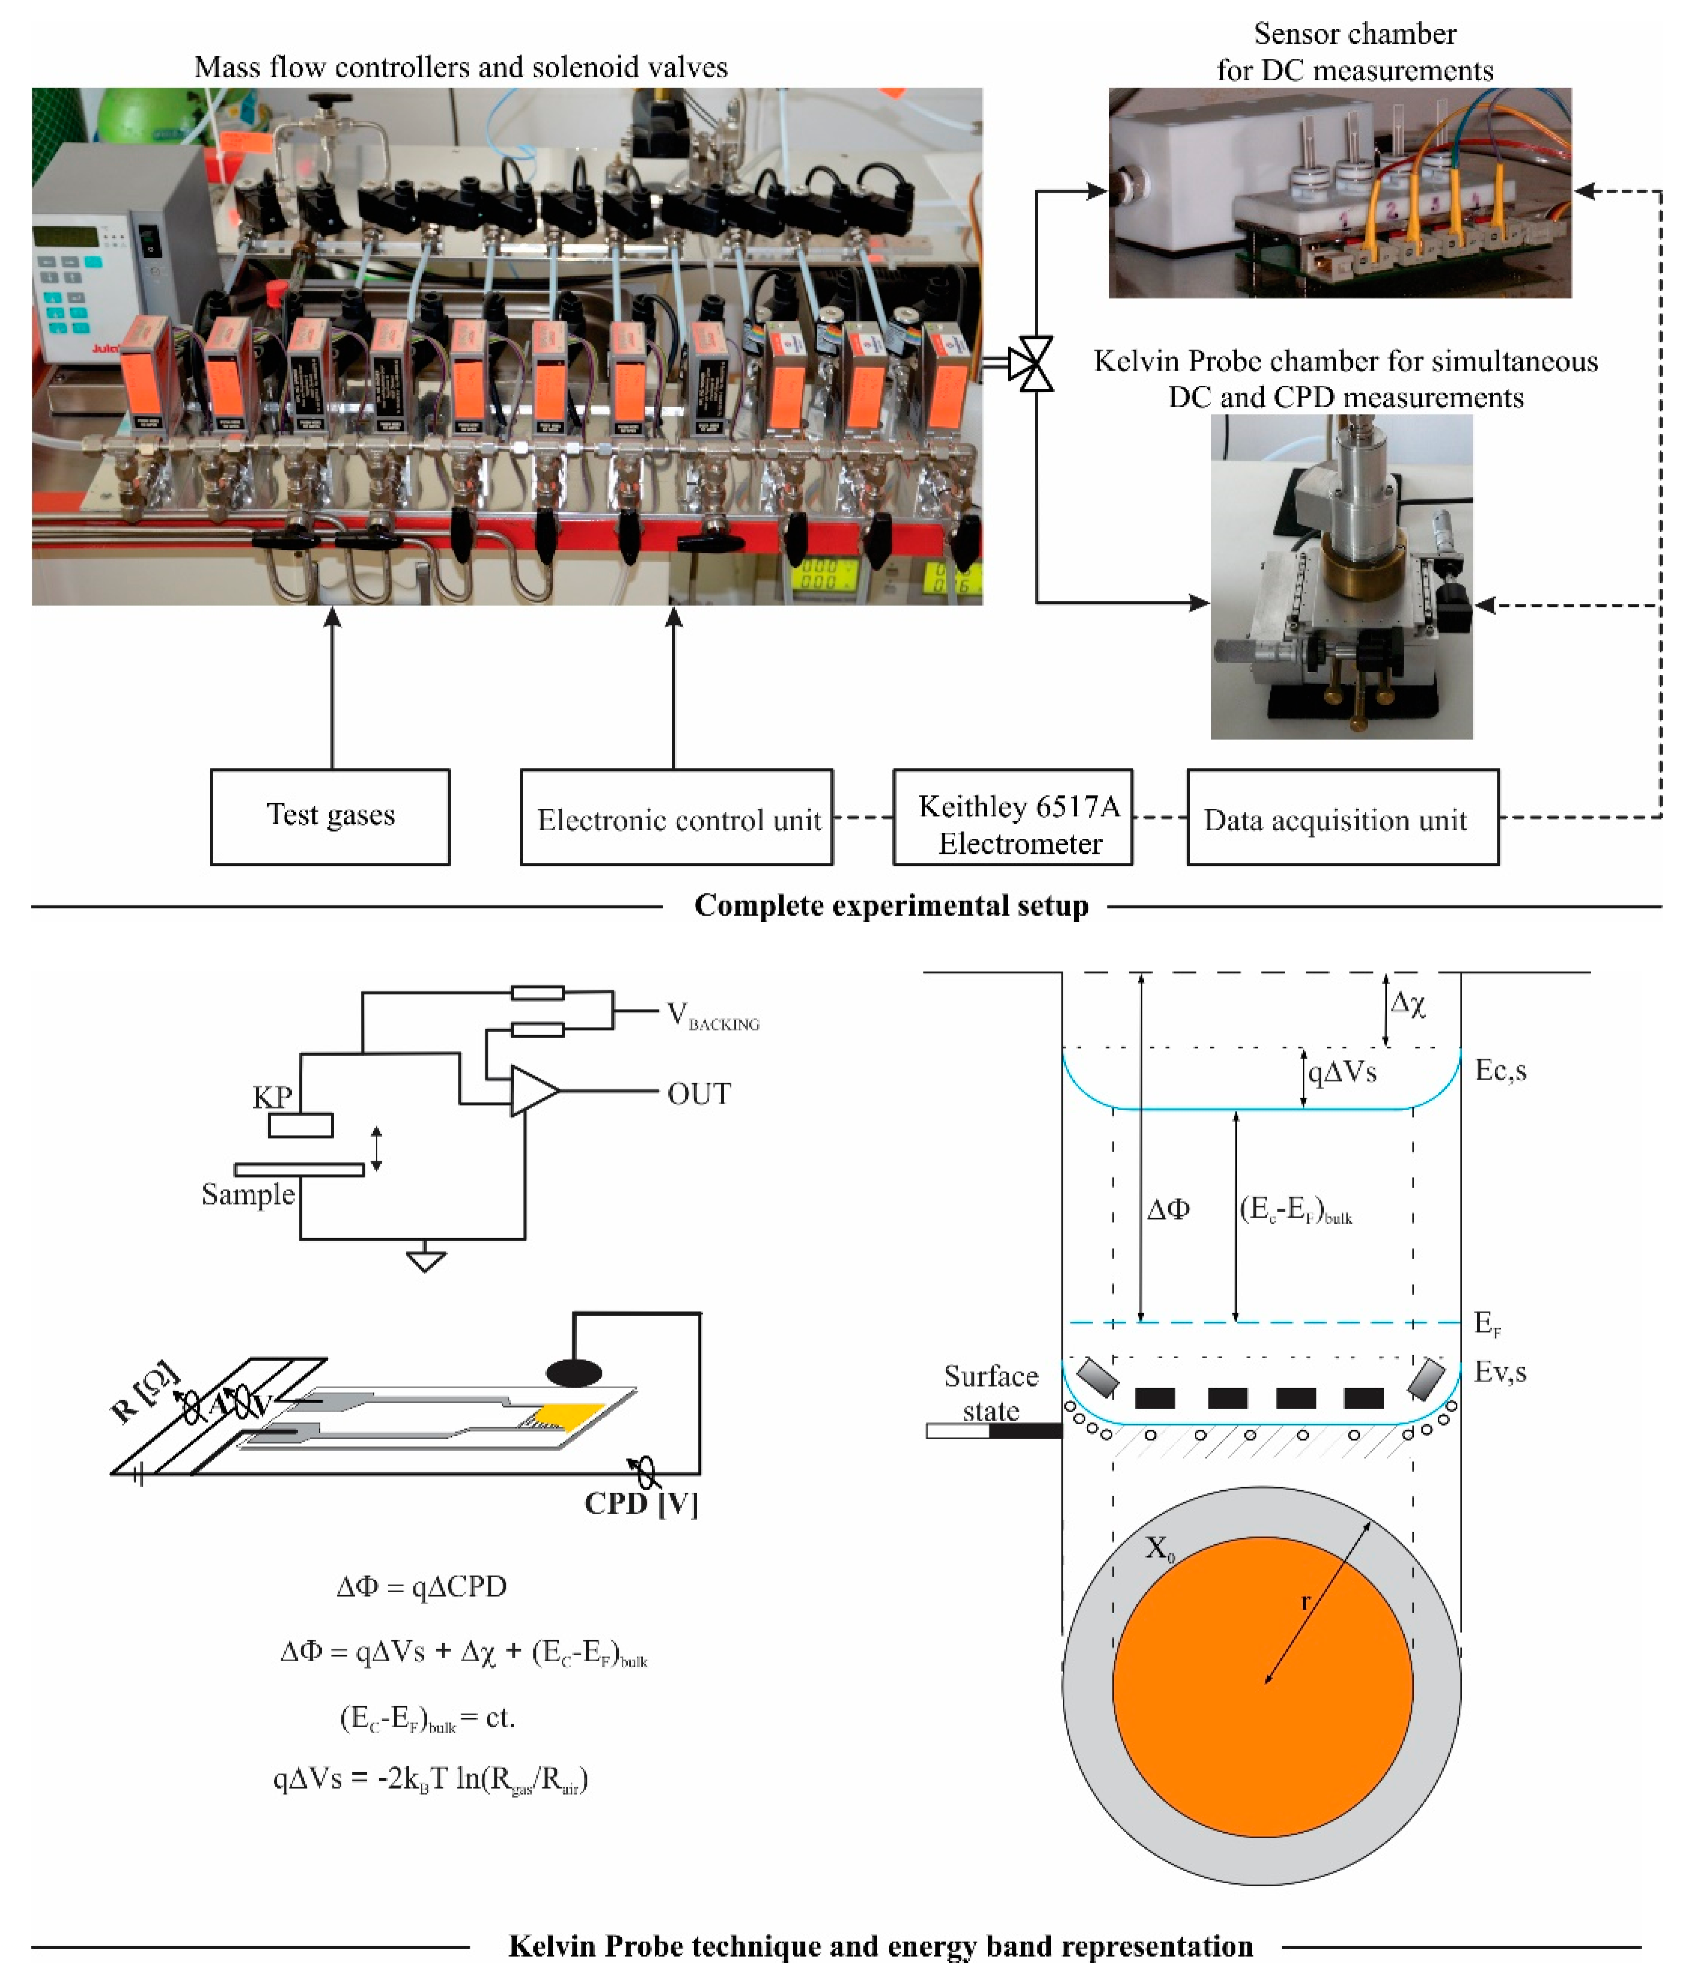
2. Materials and Methods

2.1. Powder Synthesis and Sensors Fabrication

NiO was obtained by a hydrothermal synthesis method starting from Ni(NO3)2 hydrated as inorganic precursors, water as the solvent, ethylene glycol (EG) as the template, and ethylenediaminetetraacetic acid (EDTA) as the complexing agent. The mixture obtained by dissolving the above-mentioned reagents in water was maintained under a stirring condition for 24 h, at room temperature, followed by a hydrothermal treatment at 180 °C for 24 h. The resulting precipitate was filtered and washes with water and ethanol, dried, and thermally treated in air at 400 °C for 8 h.
The as-obtained NiO powder was mixed with 1,2 propanediol as an organic binder and afterward deposited using the screen-printing method onto commercial alumina (Al2O3) substrates provided with platinum (Pt) electrodes on one side and a Pt heater on the opposite side. In order to remove all traces of the organic binder and ensure a good adherence of the sensitive layer to the Al2O3 substrates, the as-prepared sensors were subject to the two stages of heat treatment. Firstly, the NiO sensors have been dried for 24 h at 60 °C followed by a gradually final temperature treatment at 400 °C in air for 1 h.

2.2. Materials Characterization

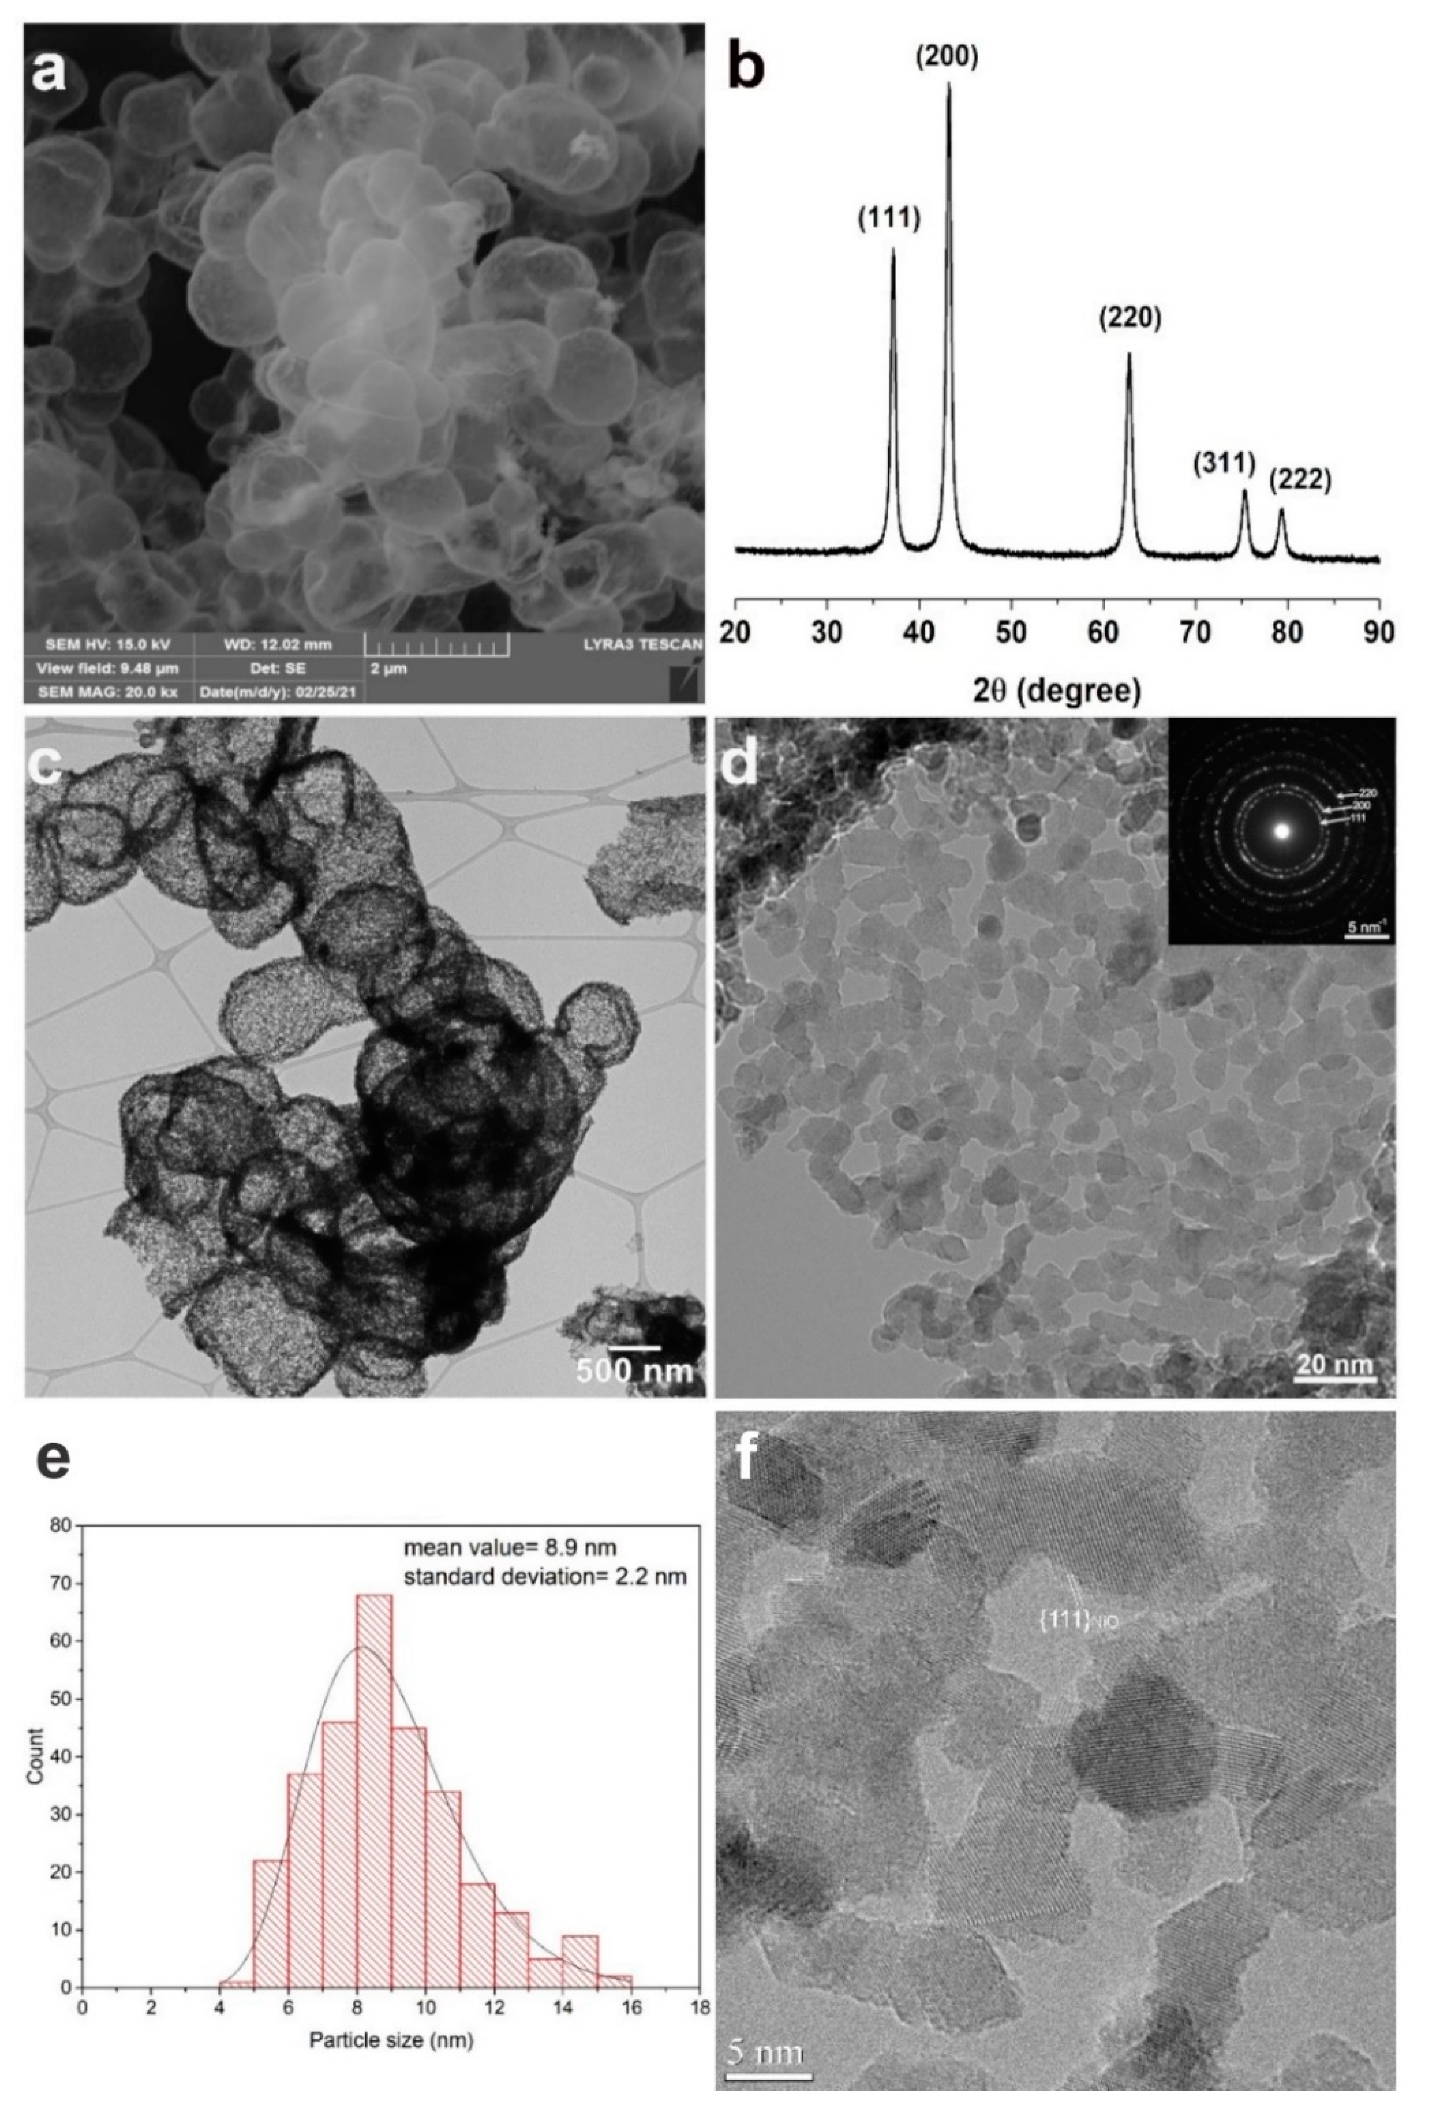
2.2.1. Structural and Morphological Investigations

The structural composition of the as-prepared samples has been determined by X-ray diffraction (XRD) using a Bruker D8 Advance X-ray diffractometer (Cu anode and Ni filter, λ = 0.154184 nm) in a Bragg–Brentano configuration. The samples’ micromorphology was analyzed using scanning electron microscopy (SEM) on a Tescan Lyra III FEG-SEM operated at 15 kV acceleration voltage. The SEM samples have been prepared by spreading a small amount from the as-prepared powder onto SEM stubs provided with a carbon adhesive disc. The nanoscale morphology and crystalline structure were investigated by transmission electron microscopy using a JEM-2100 instrument operated ad 200 kV. The TEM samples have been prepared by powder-crushing and drop-casting on the TEM grids provided with a lacey carbon membrane.

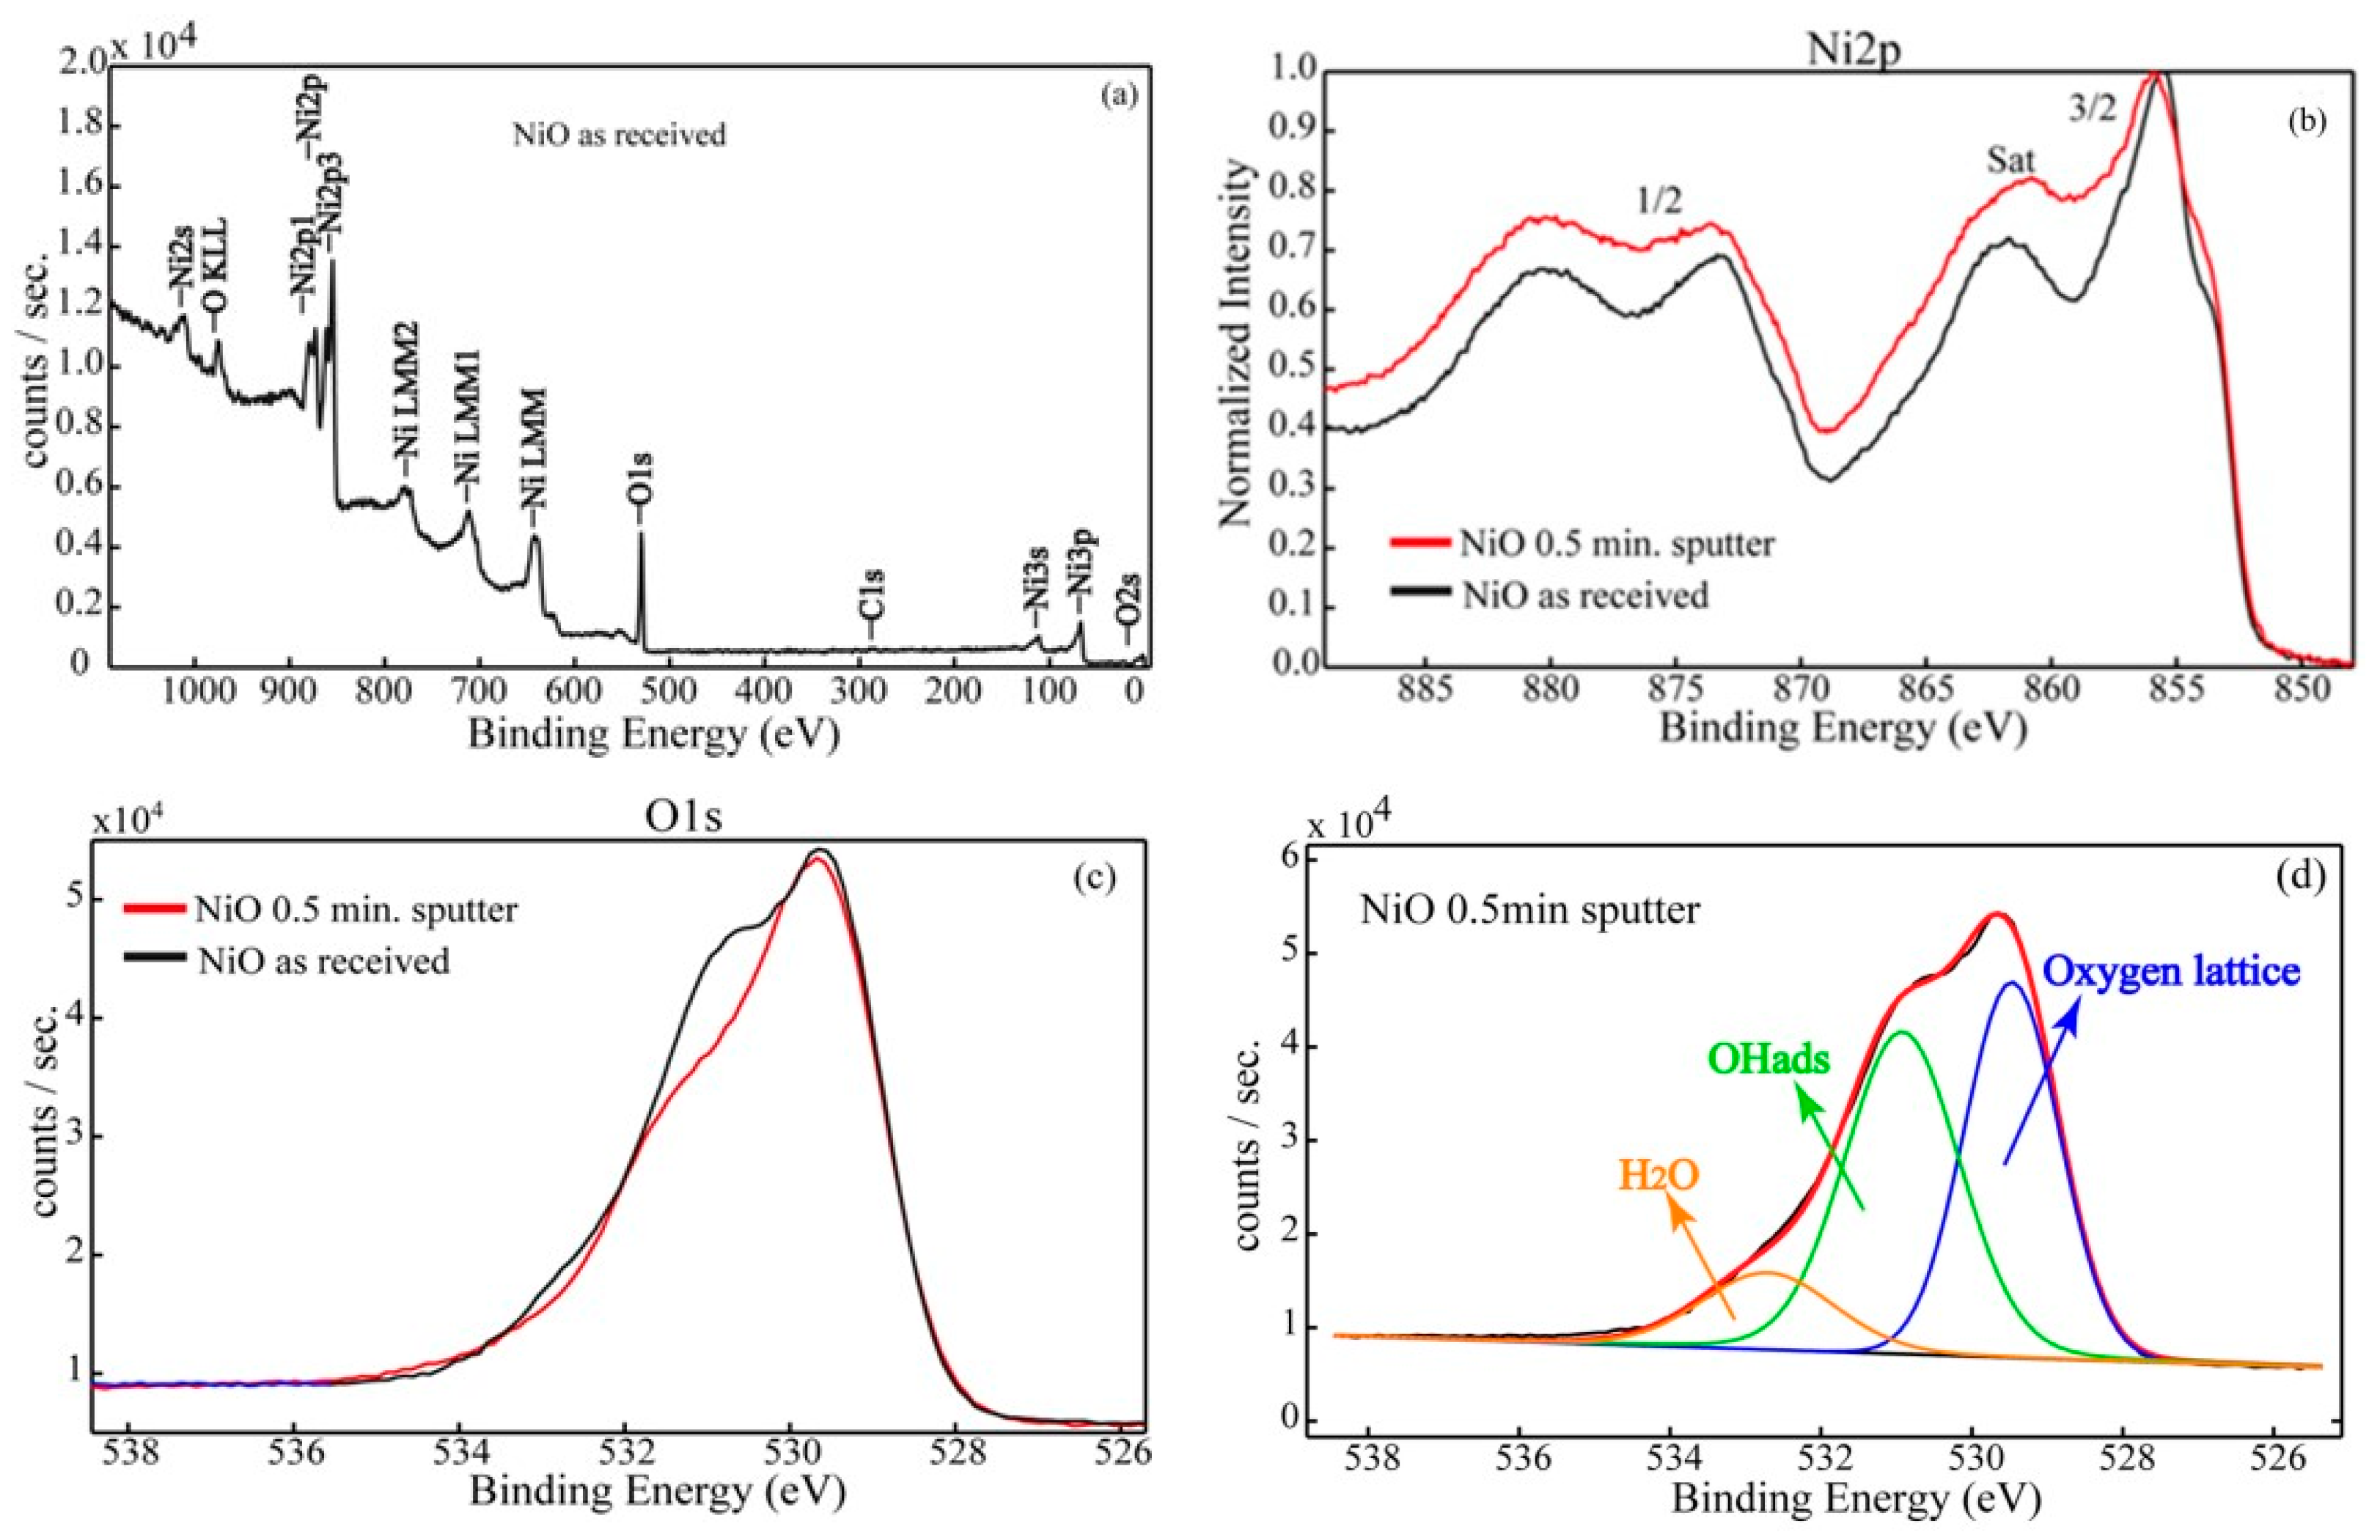
2.2.2. Surface Chemistry Investigations

The surface chemistry analysis was performed by X-ray photoelectron spectroscopy (XPS). The XPS spectra were recorded on PHI Quantera equipment with a base pressure in the analysis chamber in the range of 10−7 Pa. The X-ray source was monochromatized Al Kα radiation (1486.6 eV). The internal energy calibration was made by considering the C1s reference binding energy (BE = 284.8 eV).

2.2.3. Gas-Sensing Investigations and Experimental Chronology

All the gas-sensing investigations have been performed using a computer-controlled gas-mixing station equipped with Bronkhorst mass flow controllers (MFCs) and electrovalves. The electrical parameters in terms of electrical resistance measurements and contact potential differences (CPD) have been acquired via Keithley 6517A and McAllister KP 6500 Kelvin probe. A detailed description of the full measurements set-up and the working principle of the Kelvin probe were thoroughly described in Figure 1.
Such a gas-mixing system allows the obtaining of reproducible and controlled target gas concentrations with variable relative humidity (%RH@25 °C) similar to the in-field conditions. Accordingly, the desired target gas concentration was adjusted by means of fully computer-controlled MFCs. These allow fine adjustment of the test gas concentration through the system being connected via a high-grade PTFE tube to the CO and synthetic air cylinders.
In order to reproduce the ambient conditions with different RH levels, the dry synthetic air (a mixture of 21 vol% oxygen and 78 vol% nitrogen) has been driven via a vaporized filled with high-density gas-inert chromosorb material completely saturated with water at room temperature (25 °C). The upstream gas flow pressure to the MFCs was set to 2 bar, while the downstream gas pressure was set to 1 bar. By using a flow splitter, MFCs provide a laminar gas flow to the sensor chamber, avoiding any turbulence effects that may affect the overall gas sensing performances.
The experimental chronology with NiO-based gas sensors pursued the following sequences:
-
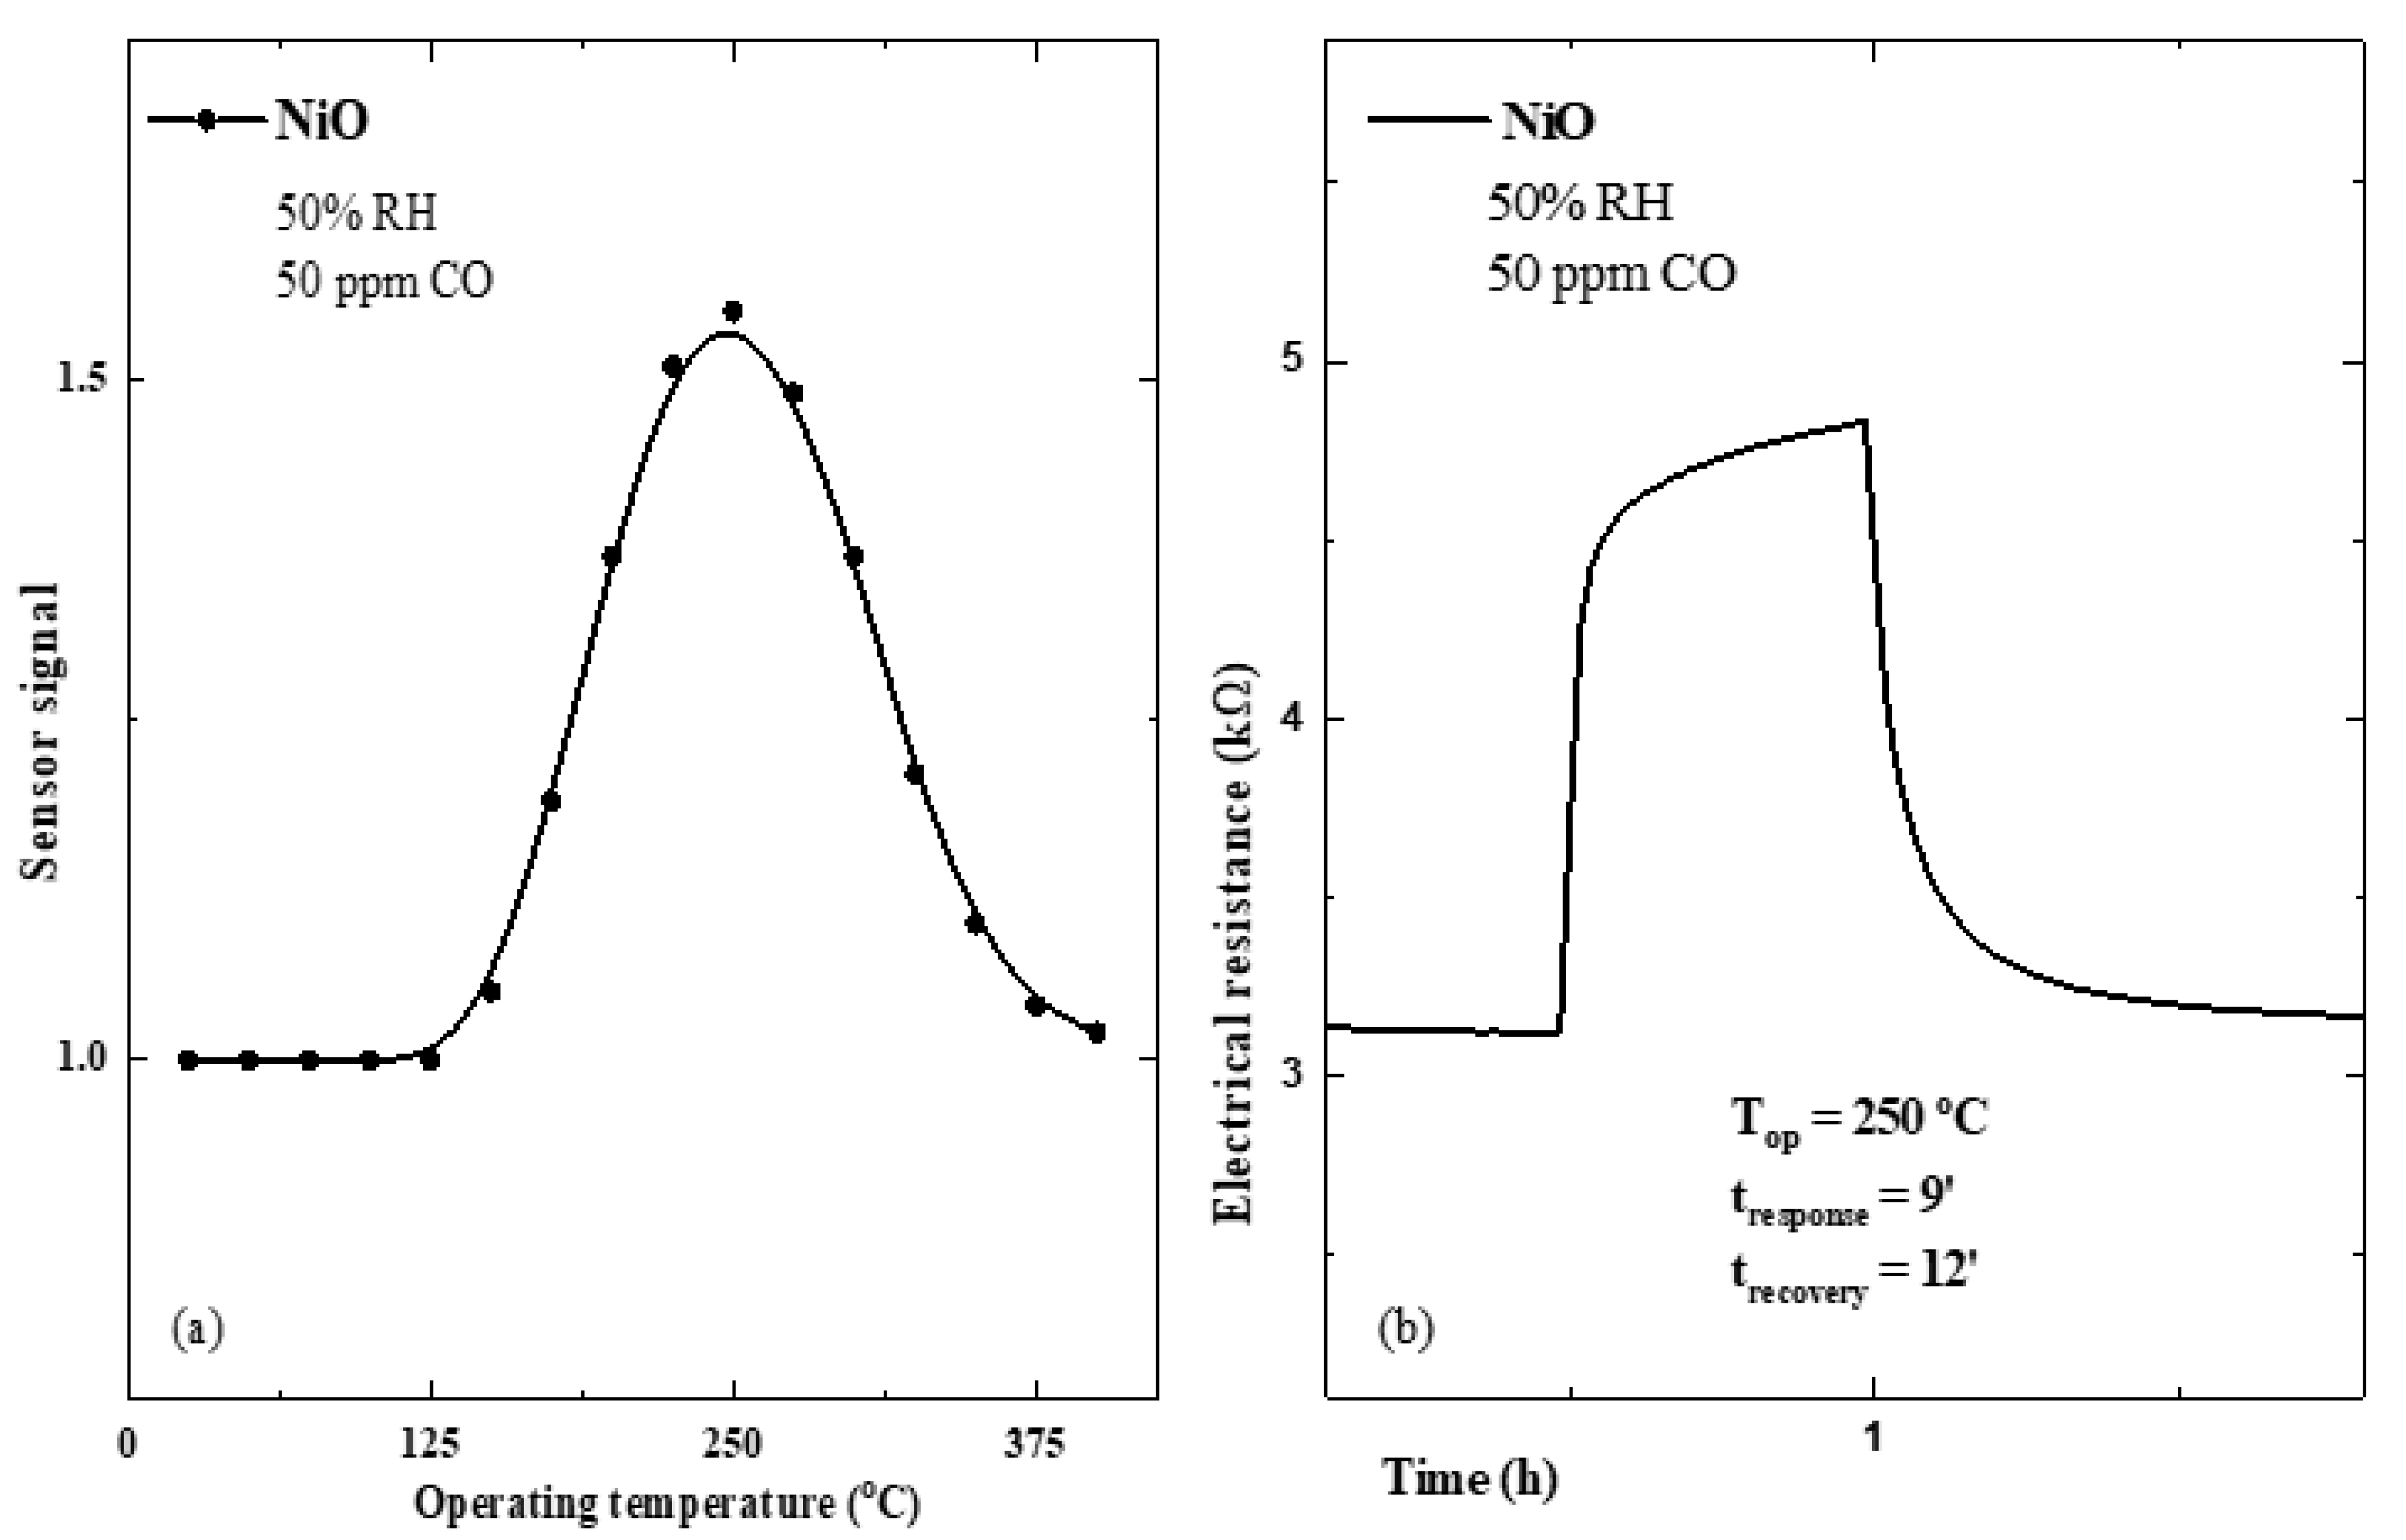
Fine-tuning toward 50 ppm of CO under ambient conditions (50% RH@25 °C) was performed with respect to the operating temperature as a way to determine where the maximum CO detection takes place.
-
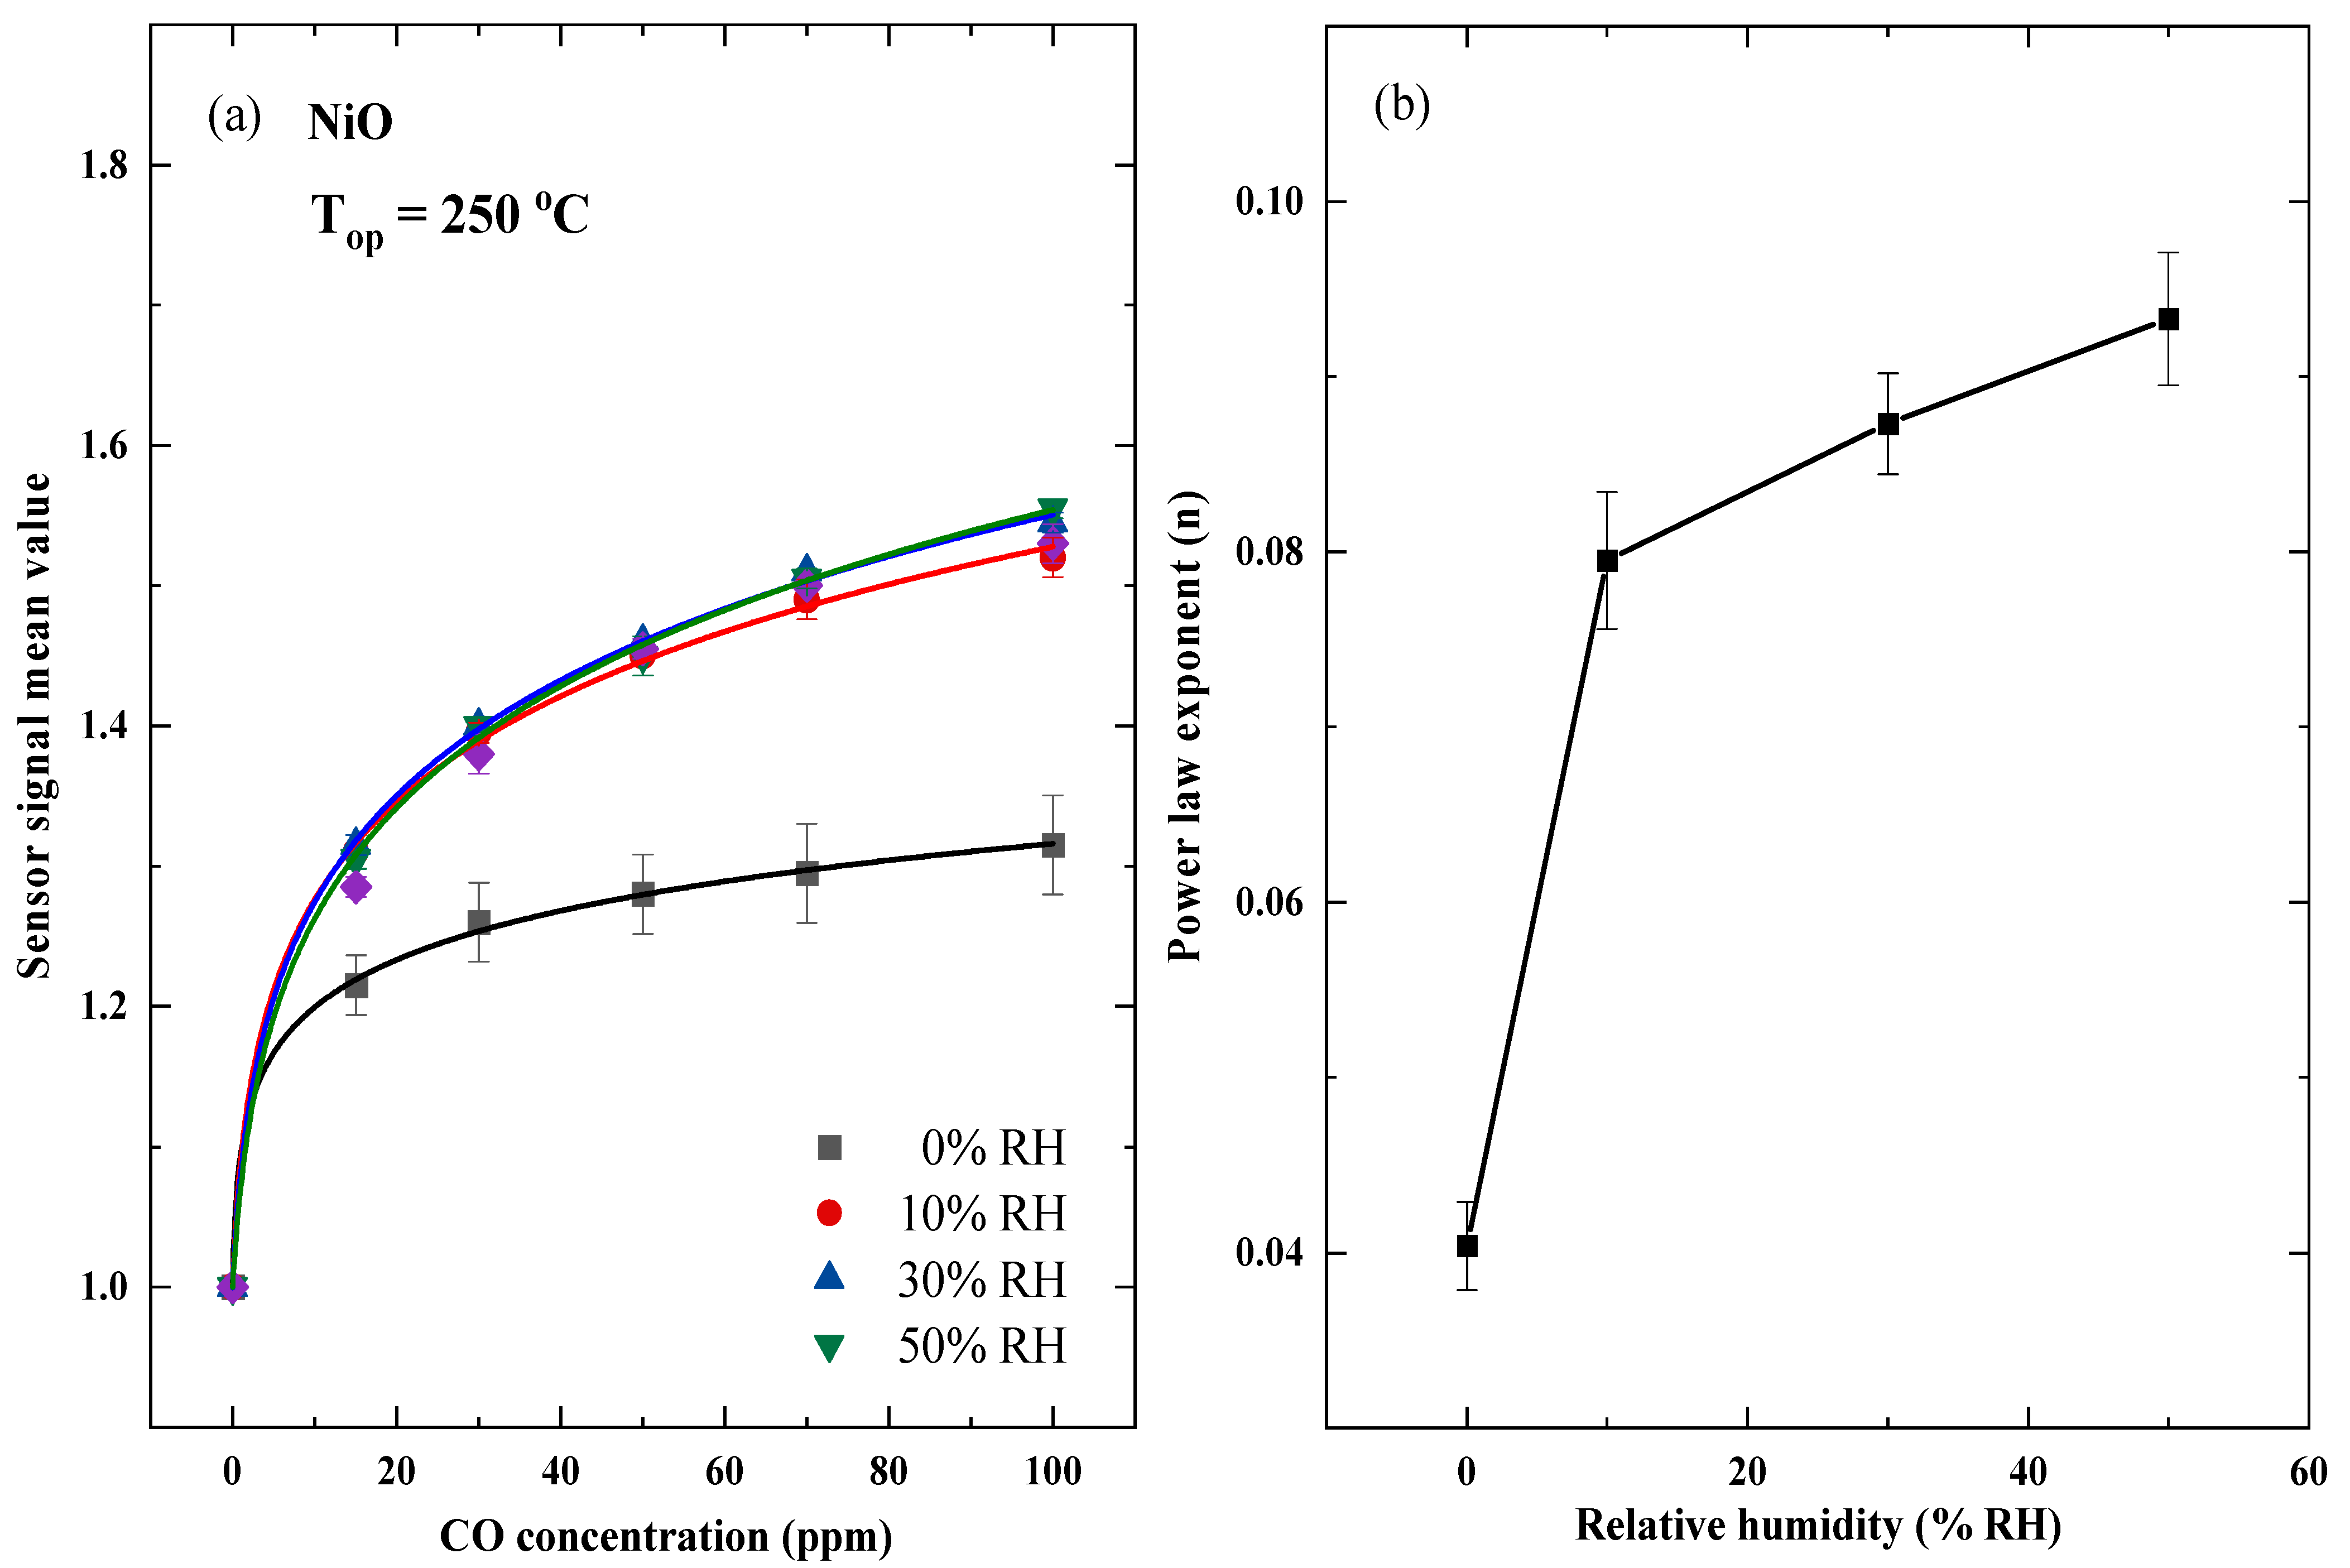
The mean values of the sensor signal dependence with respect to different CO concentrations were investigated for different RH levels at sensors operating at a temperature of 250 °C.
-
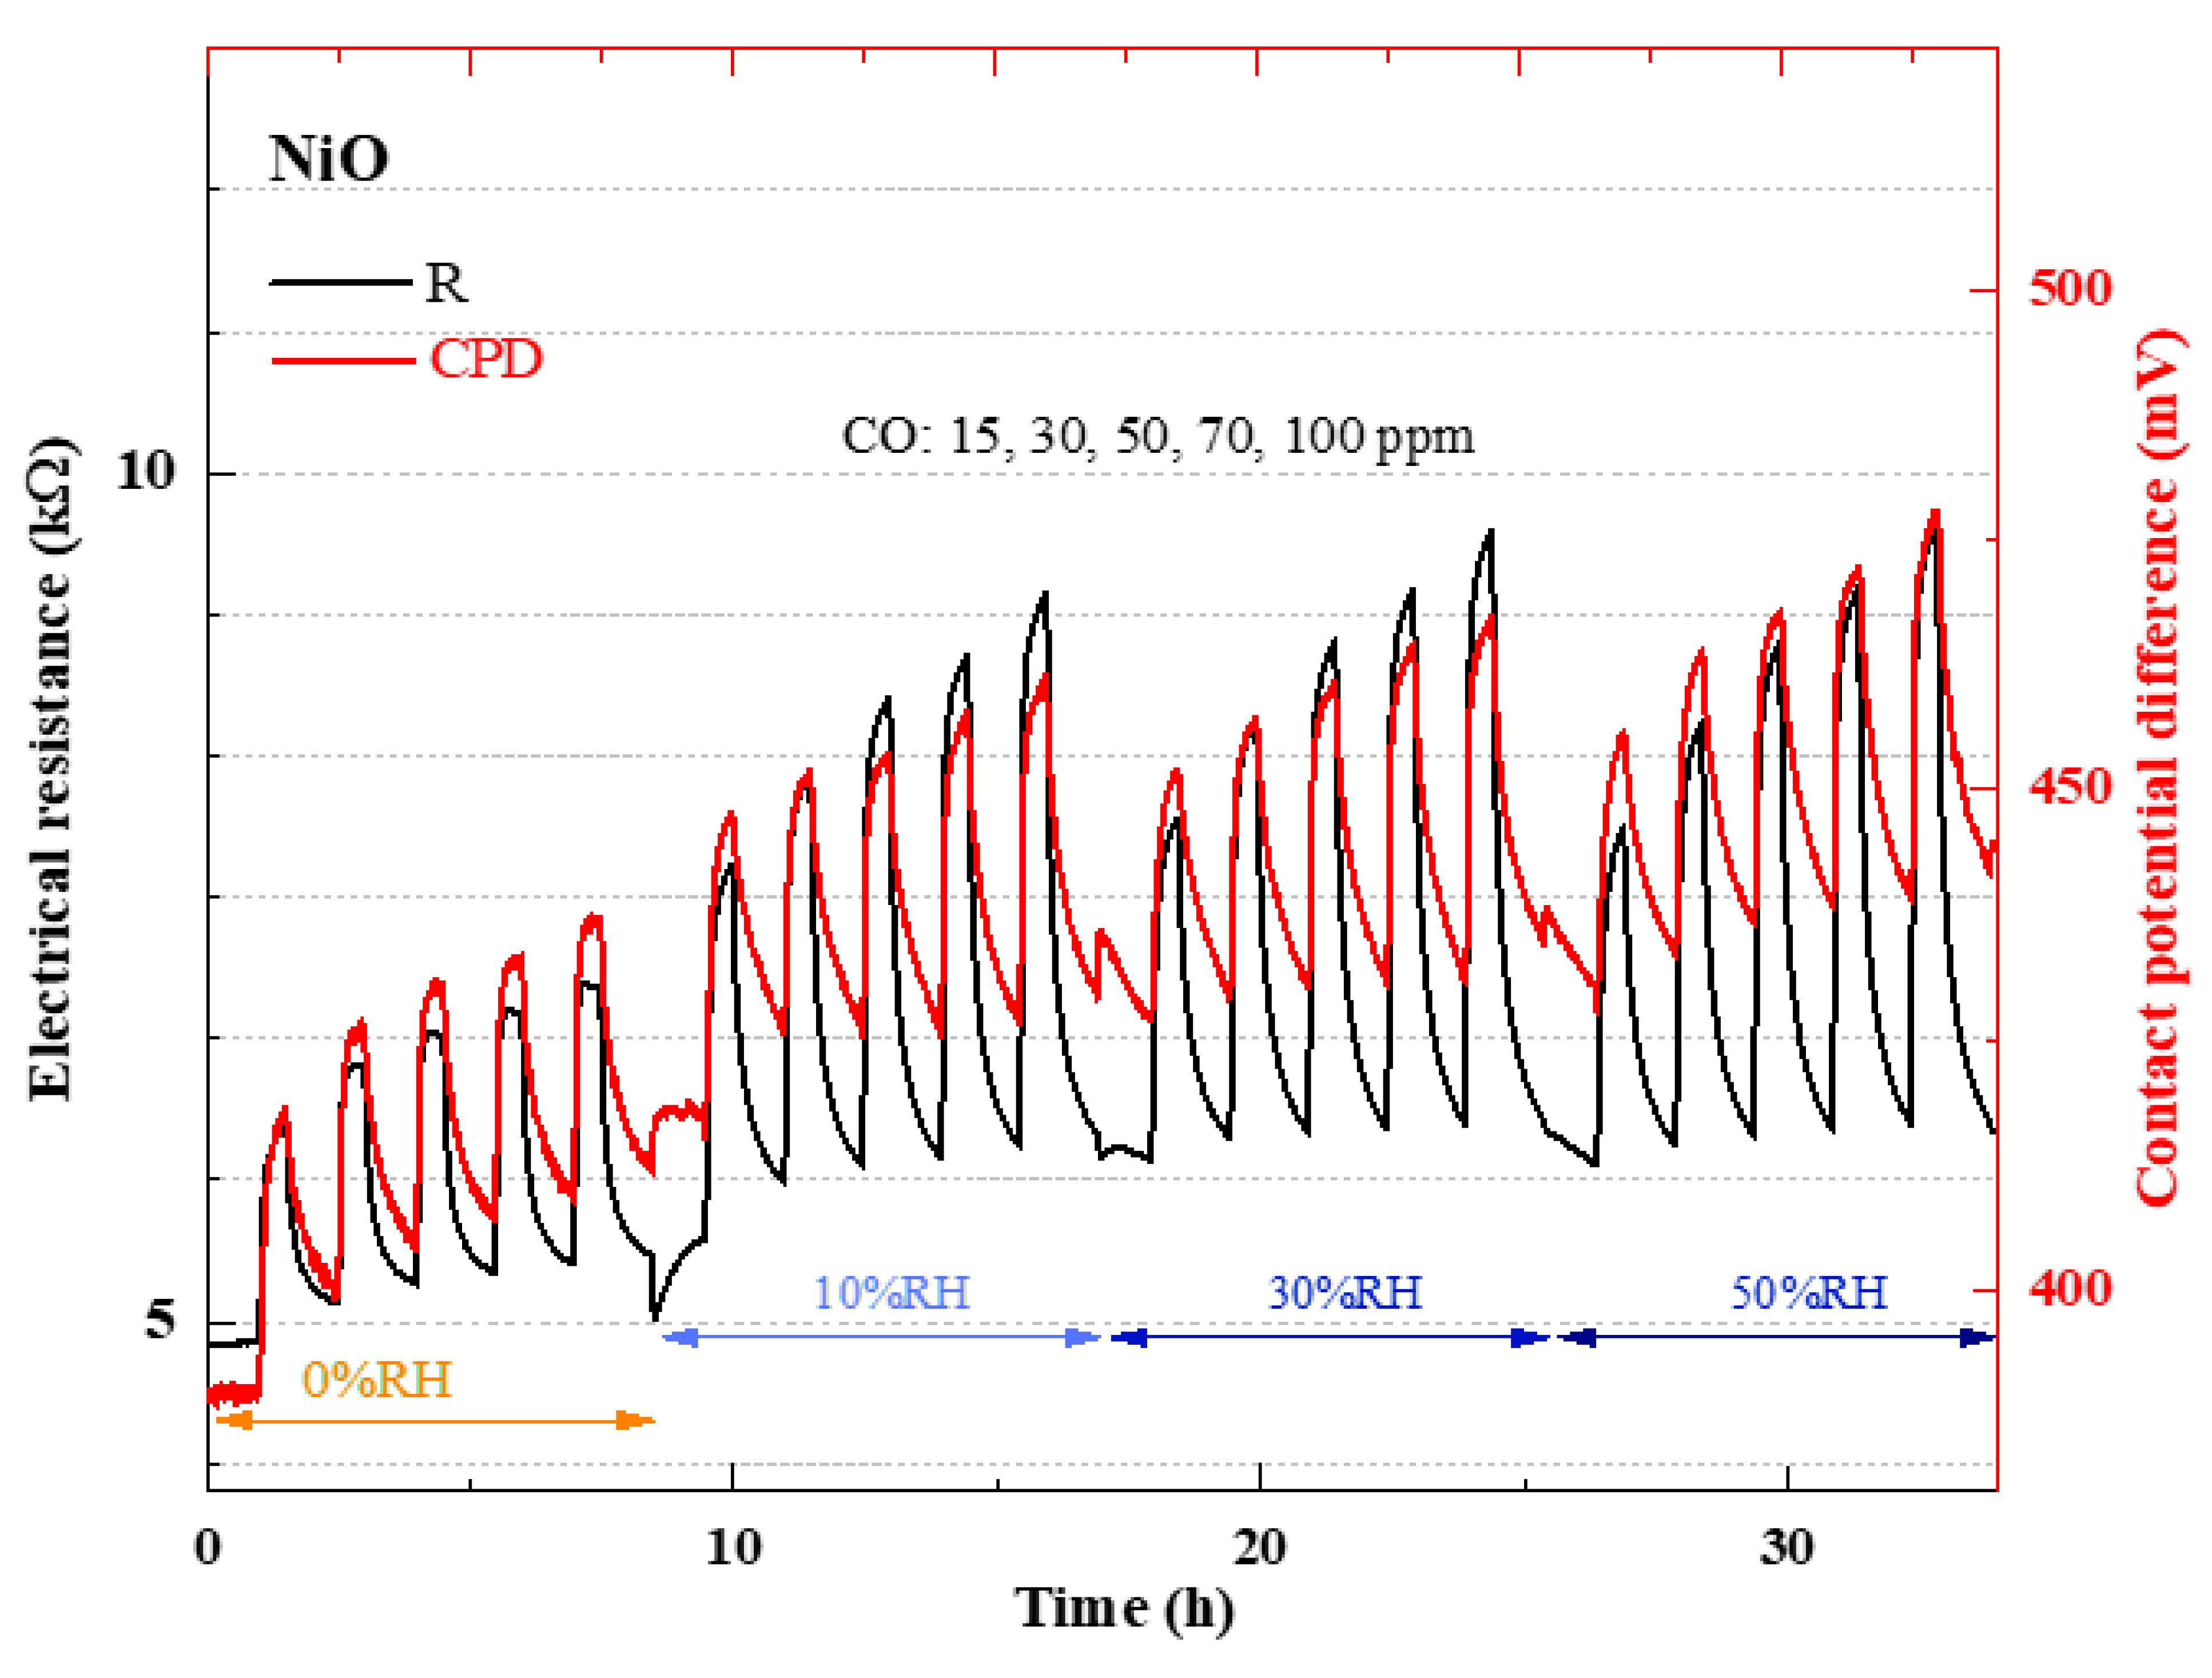
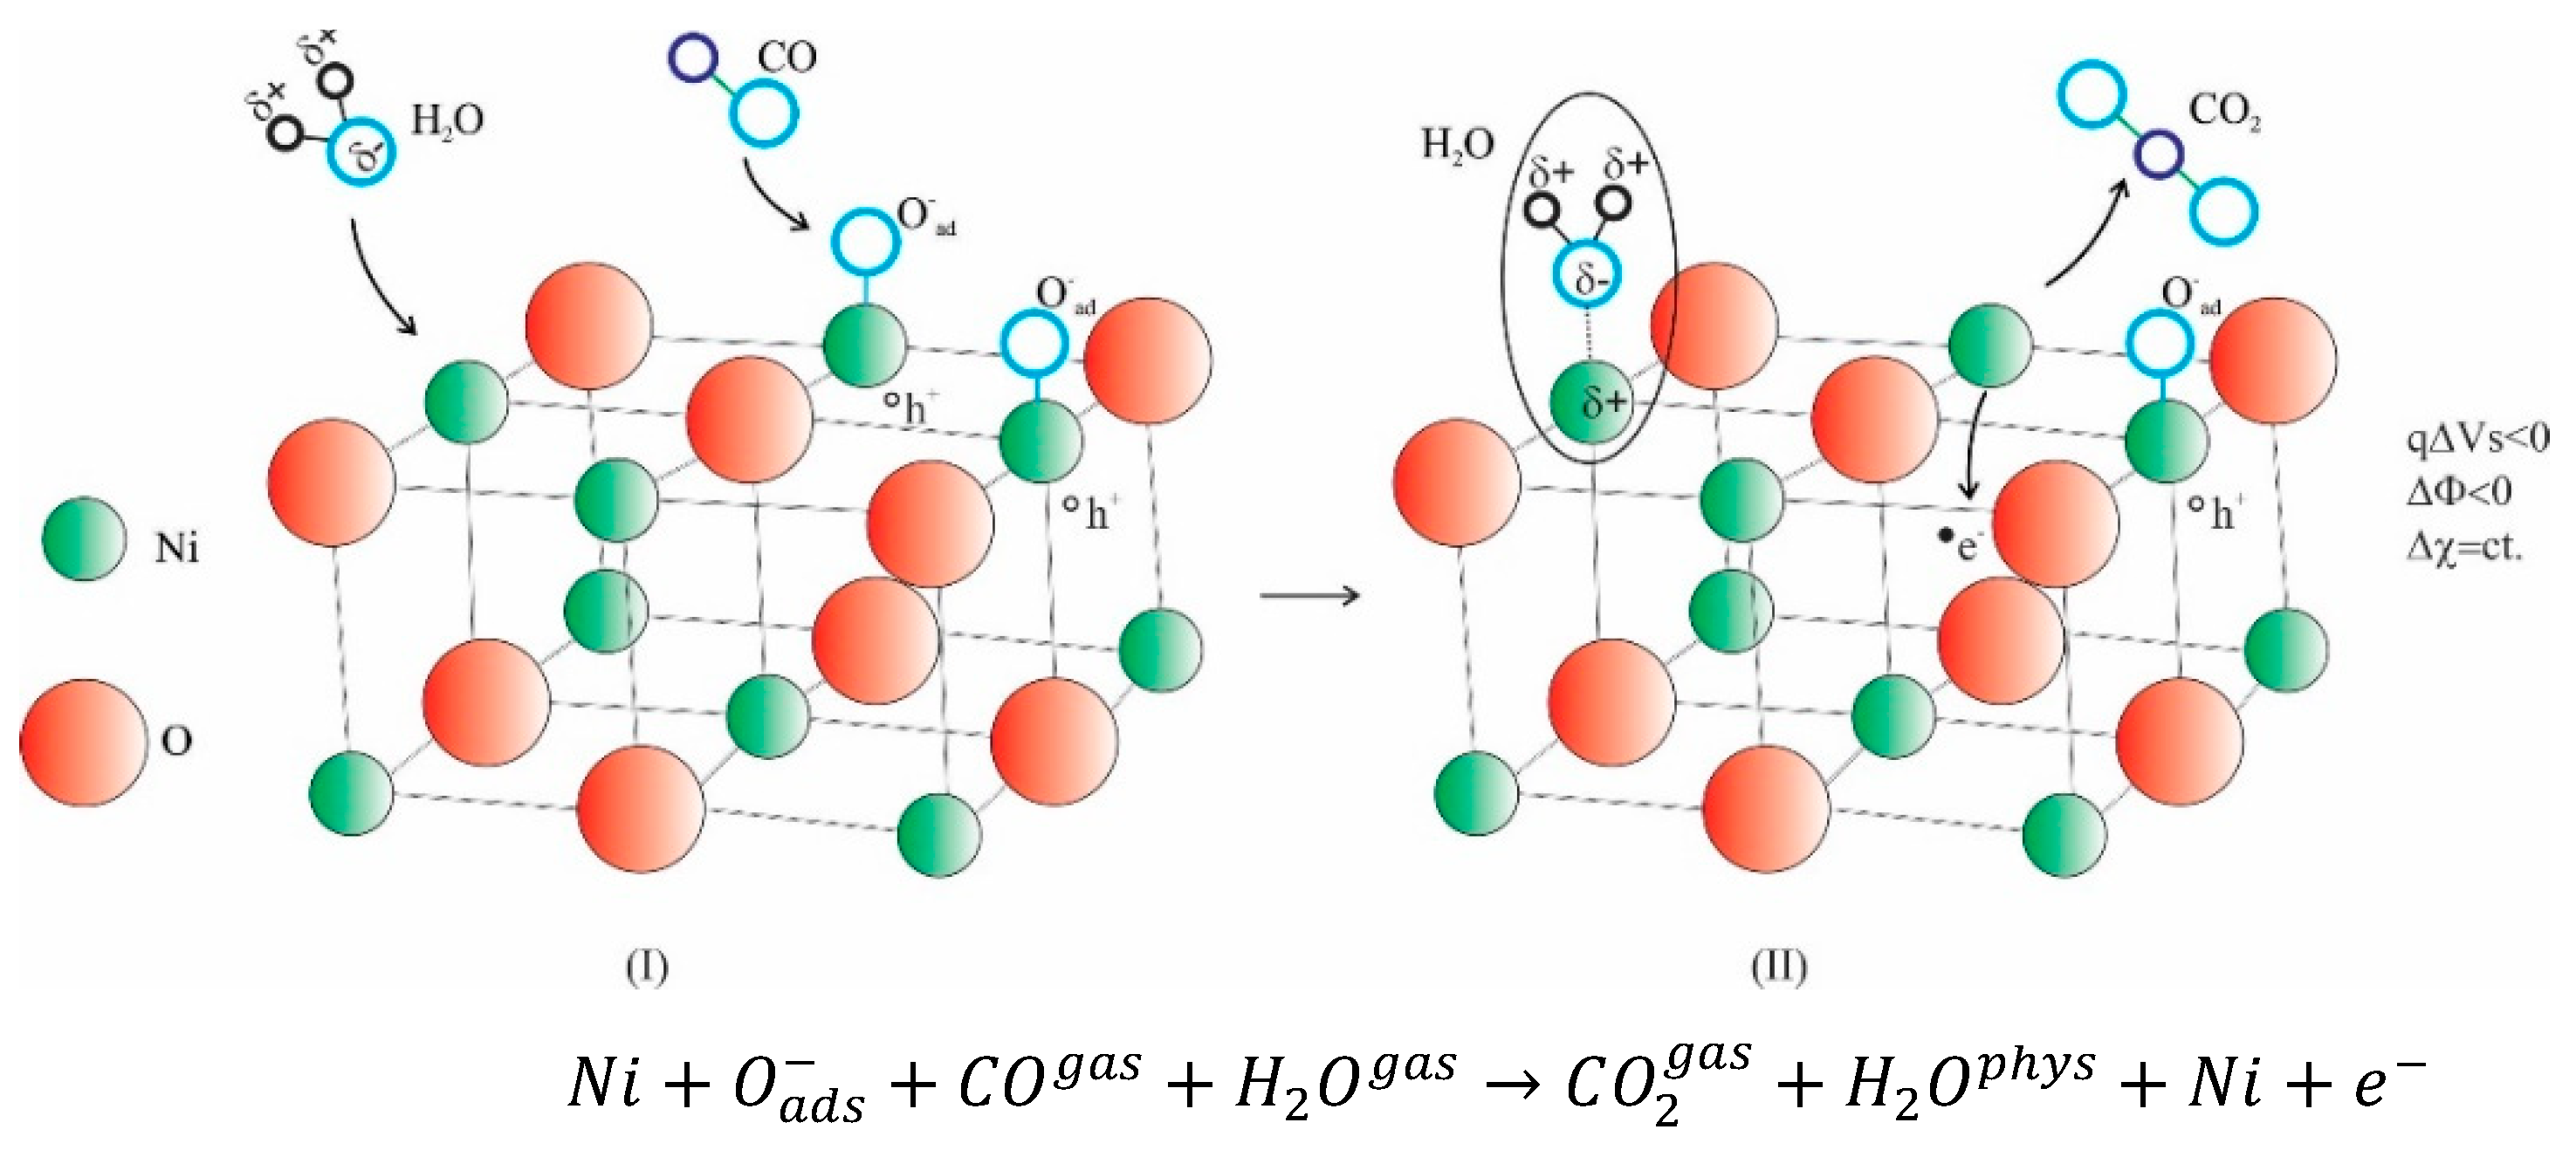
Simultaneous electrical resistance and contact potential difference with respect to the CO concentrations under different RH levels when sensors operated at 250 °C.
-
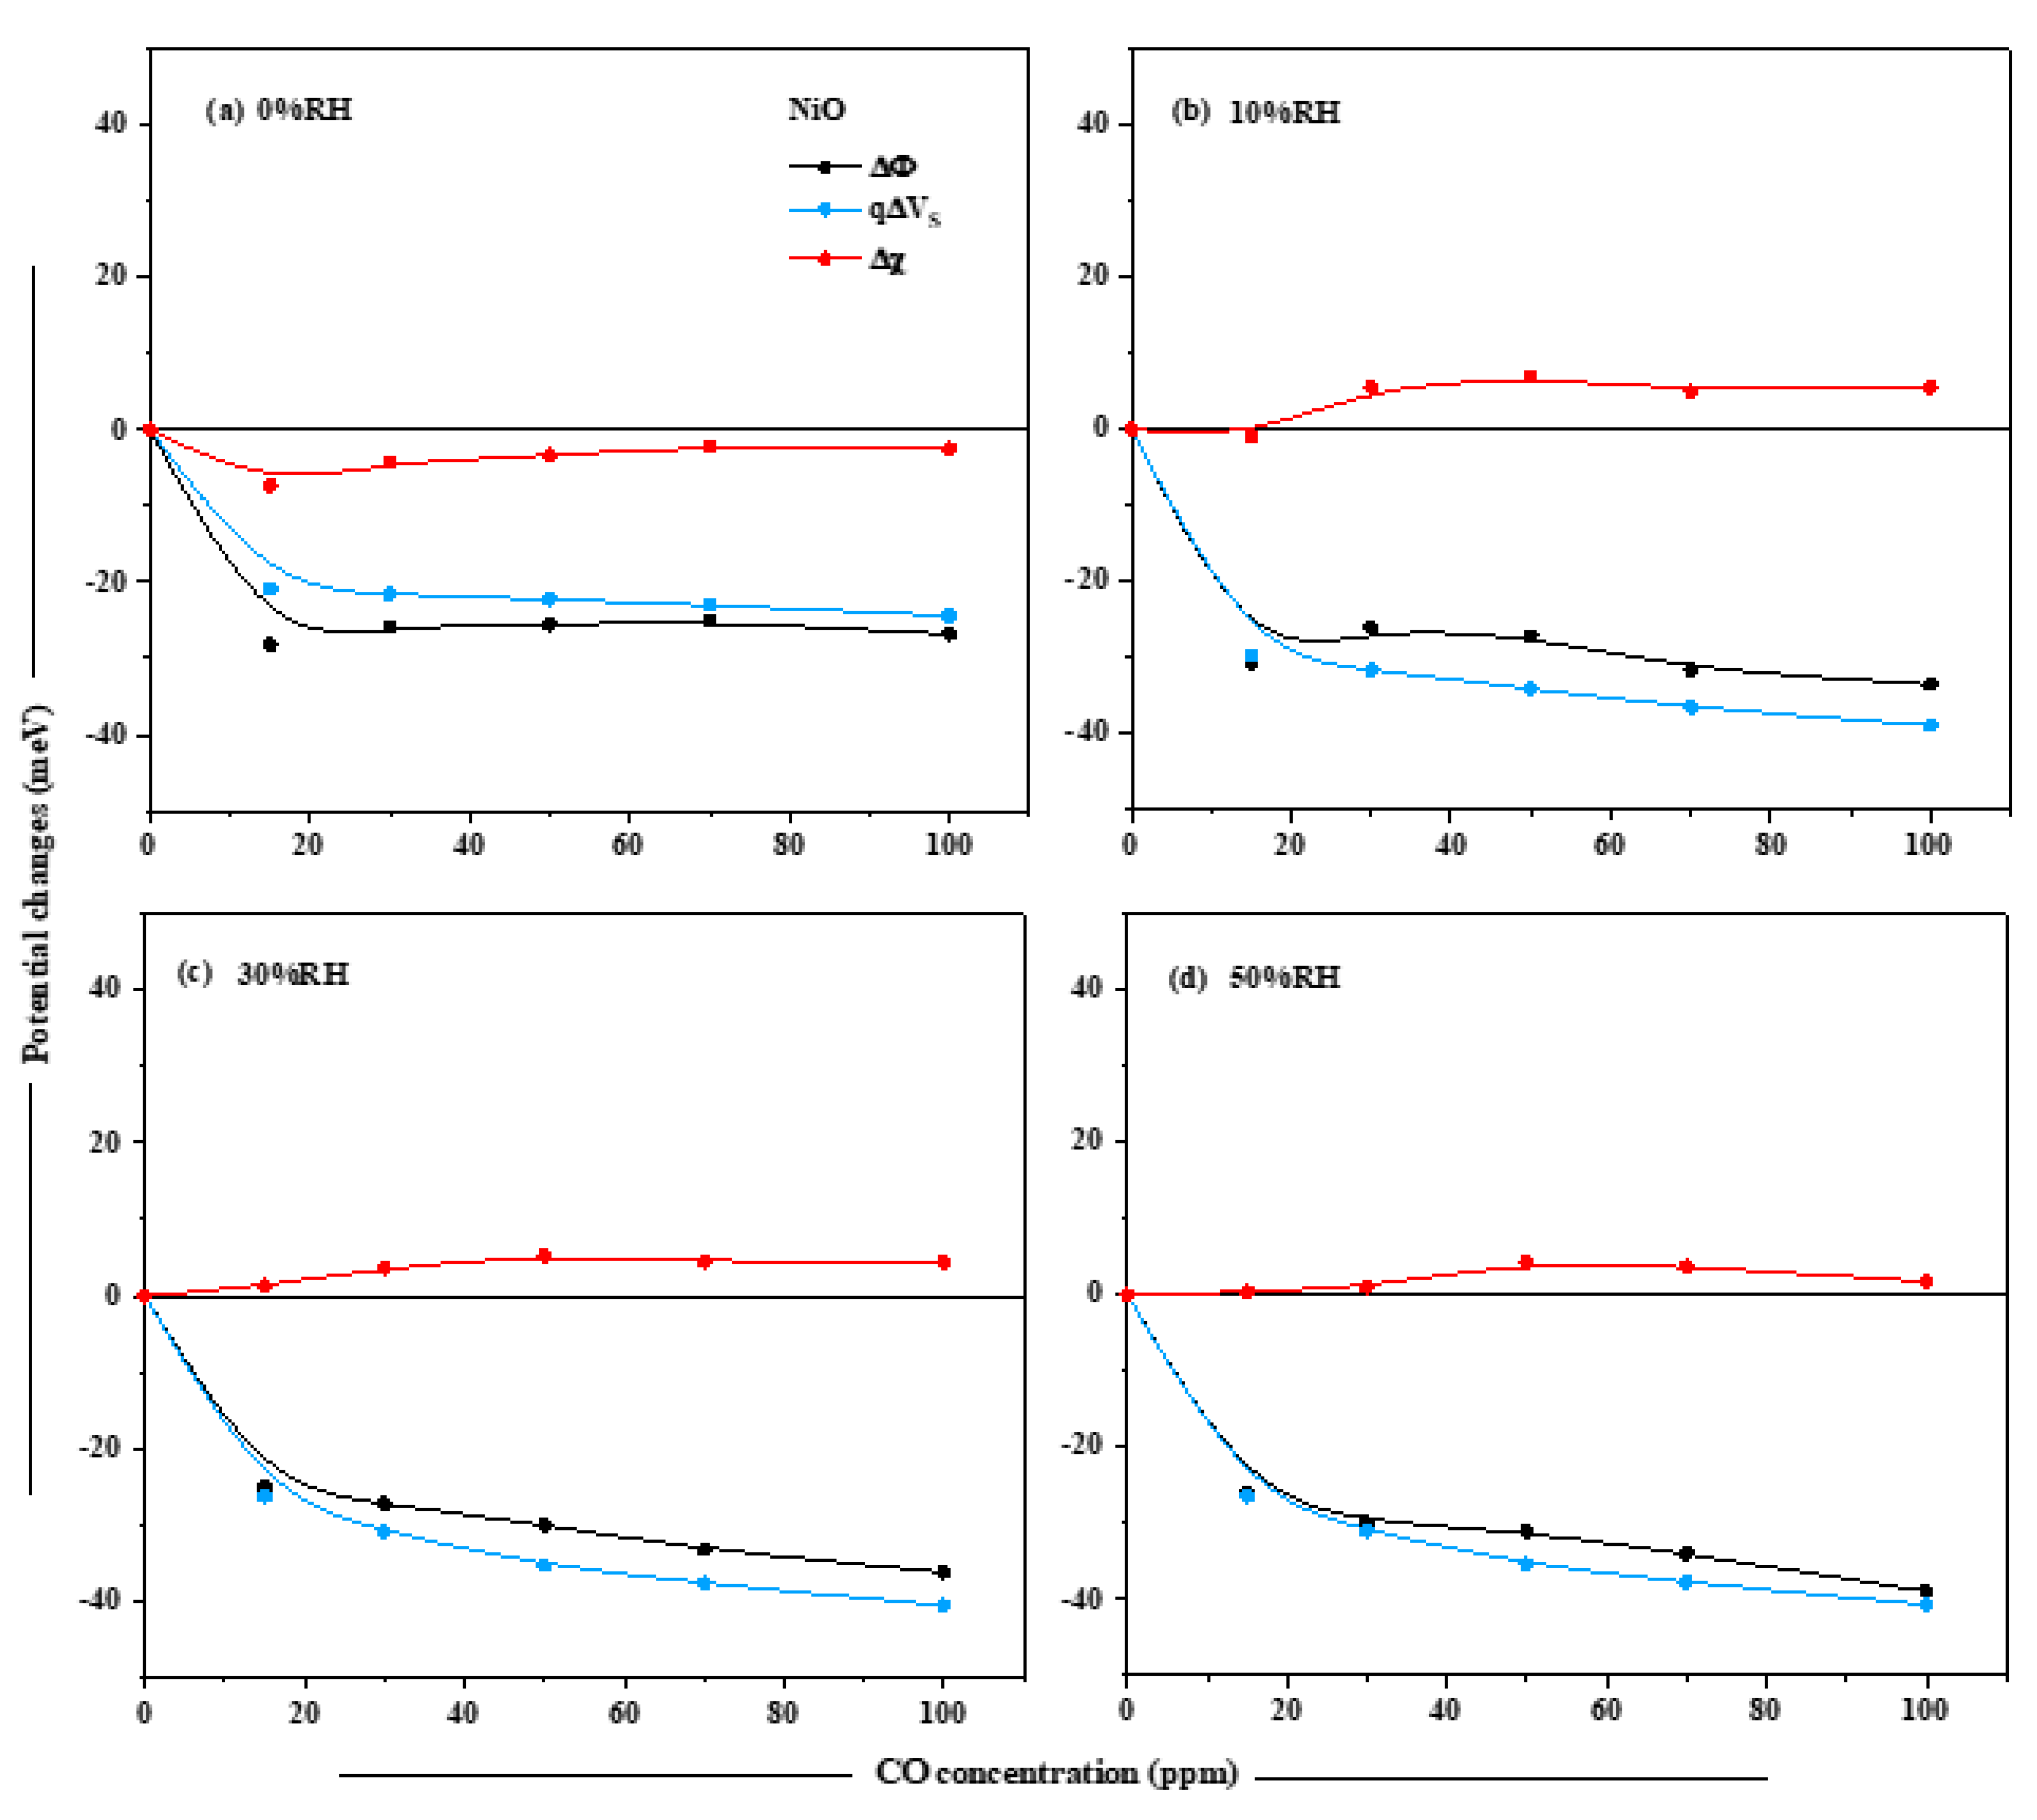
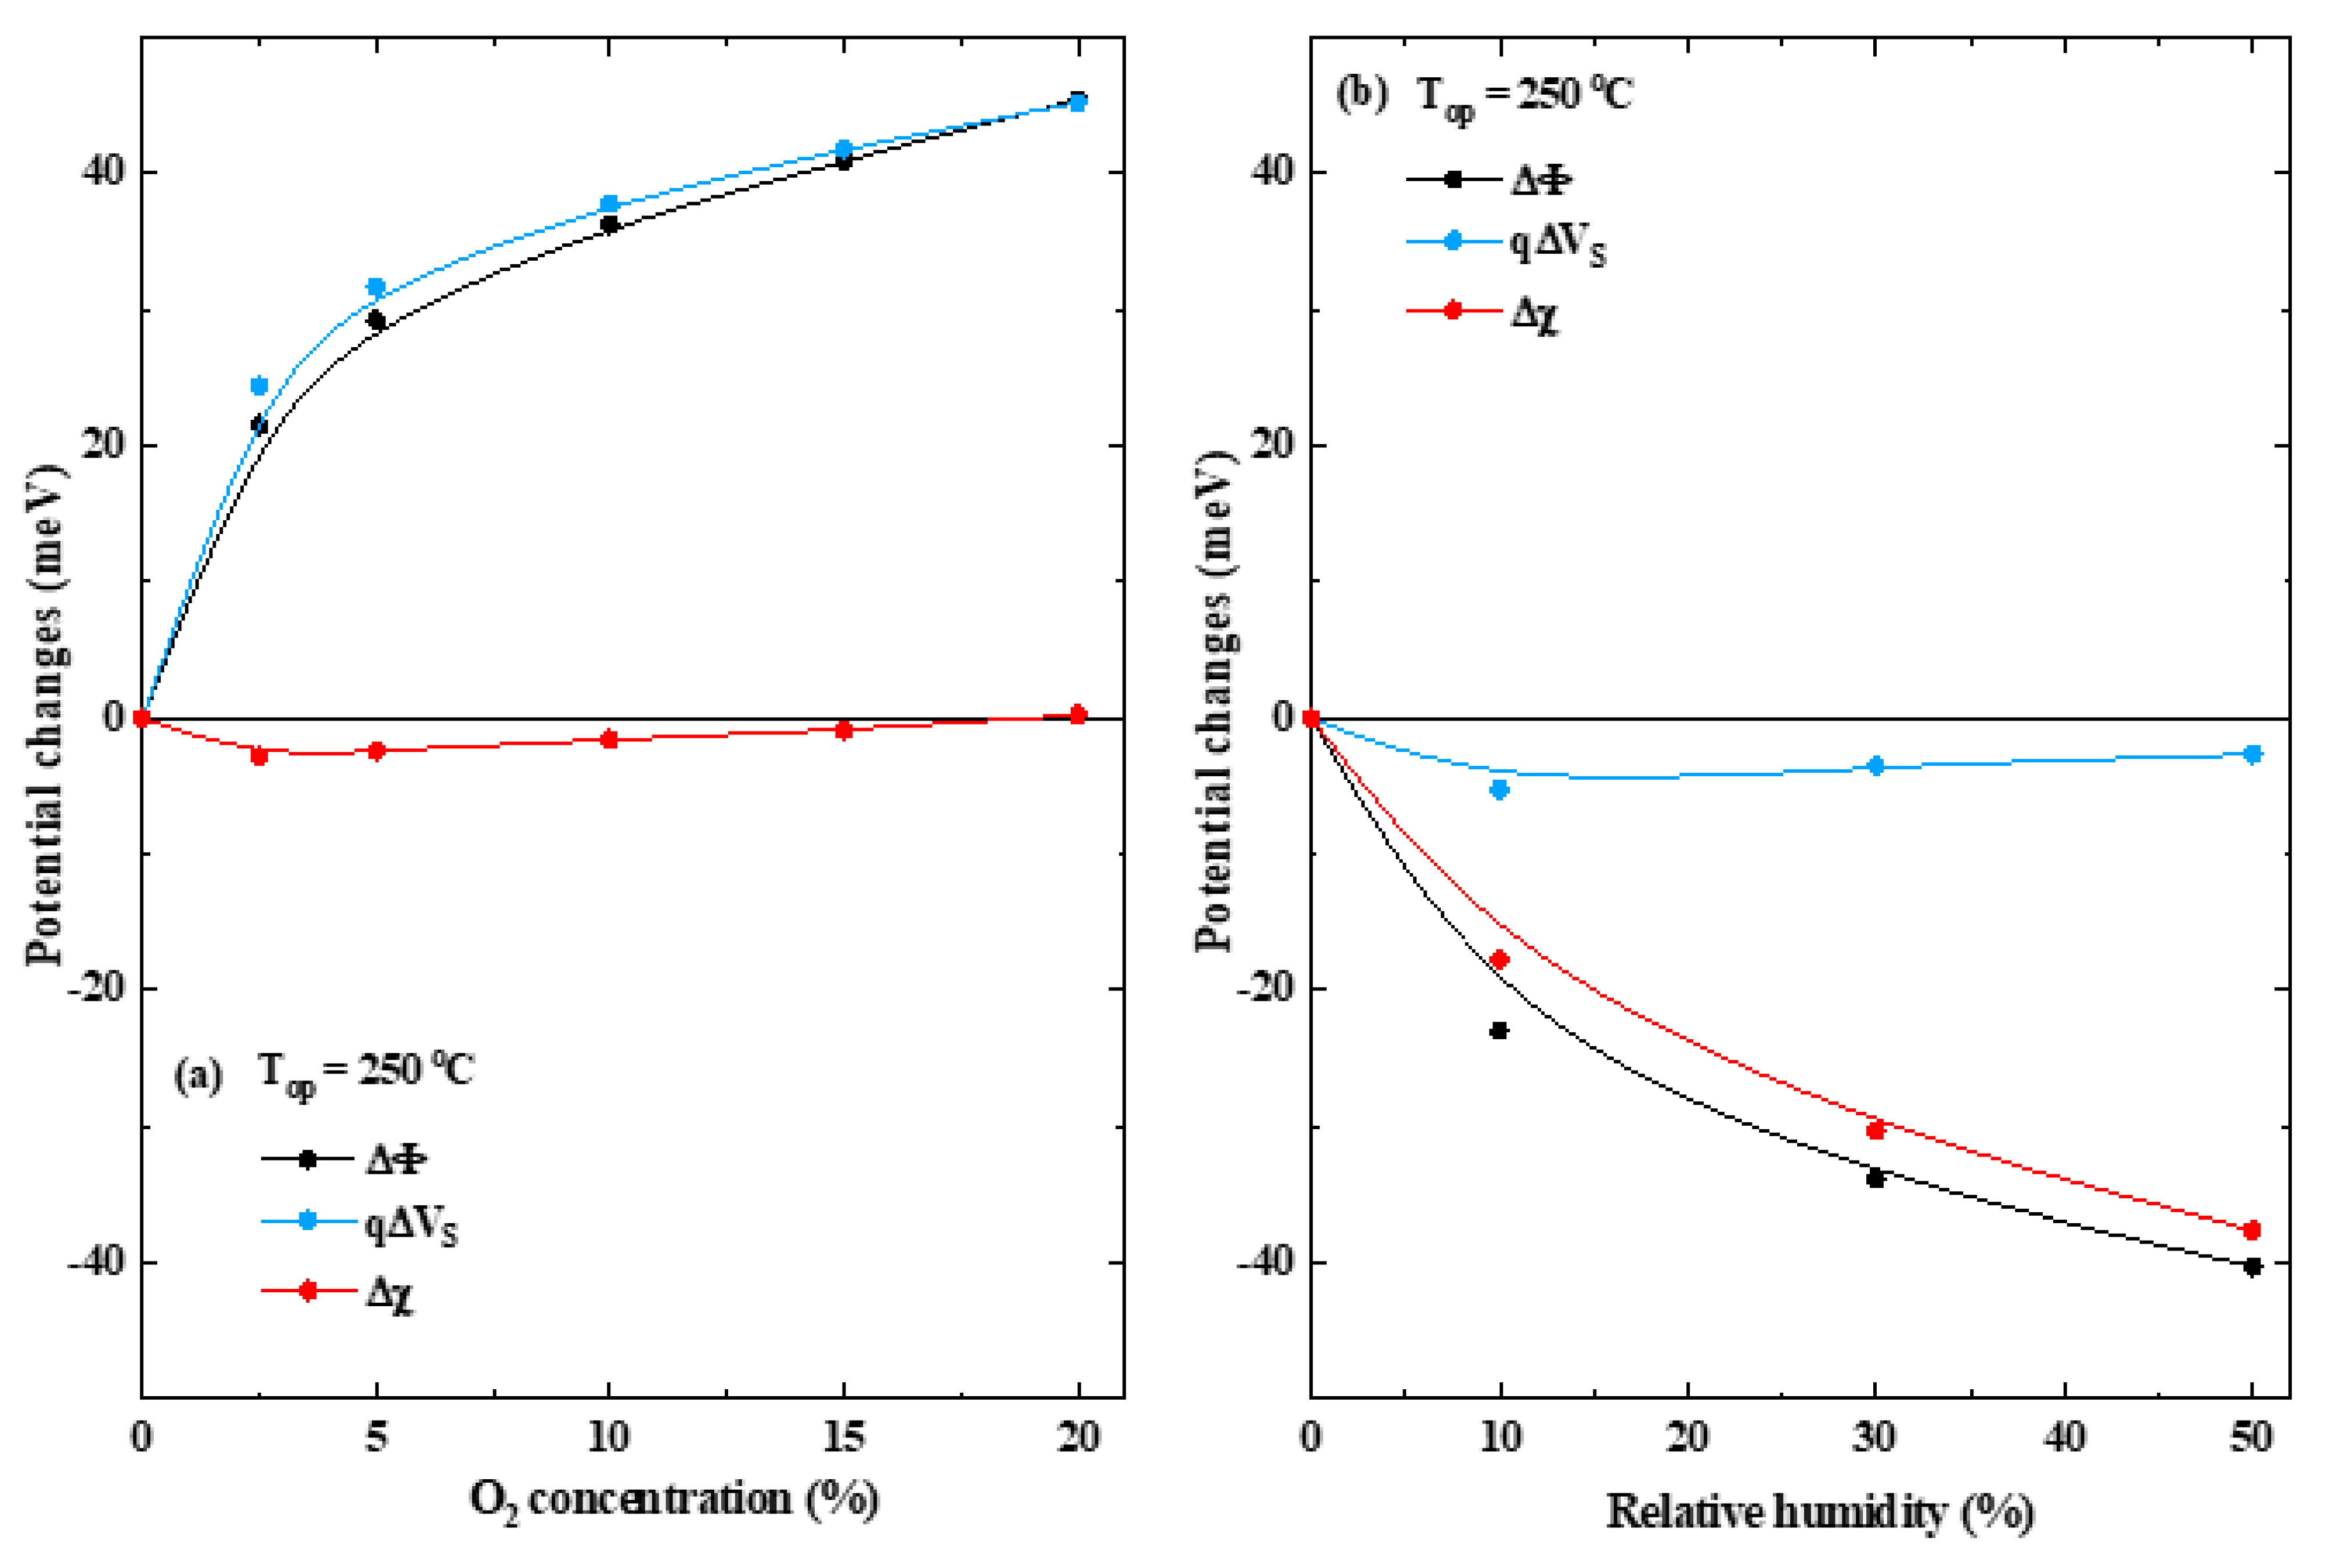
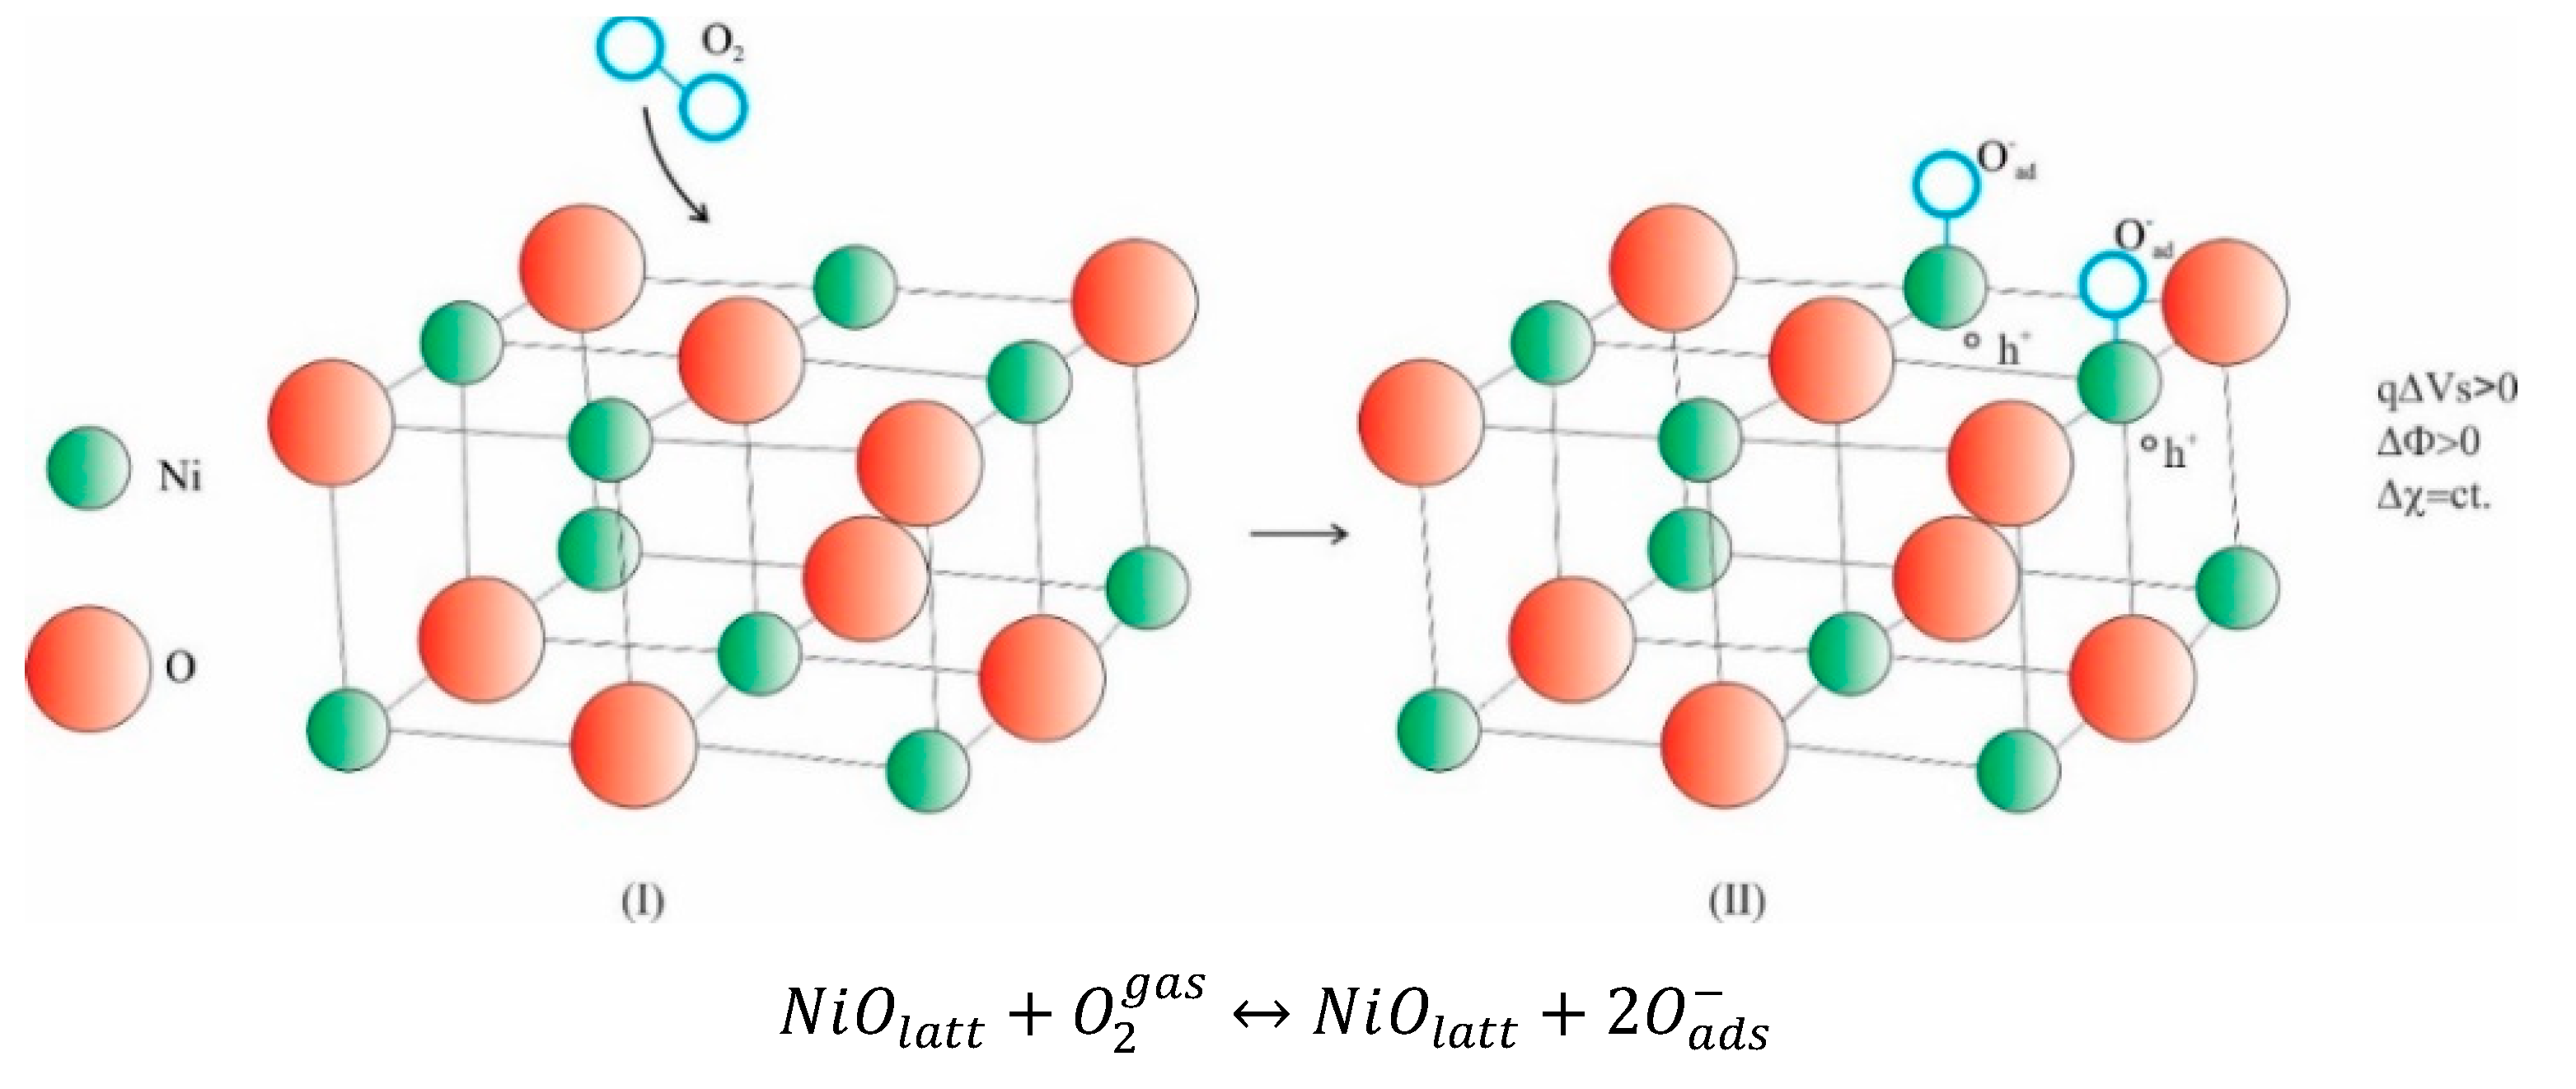
Dependences of the potential energetic changes with respect to different ox ygen concentrations and RH levels for NiO-based gas sensors operated at 250 °C.

3. Results

3.1. Morphological and Structural Results

Figure 2 shows the morphological and structural results obtained for the as-prepared NiO powder. The SEM image in Figure 2a reveals the growth morphology as quasispherical formations, having dimensions of ~1 μm. The brighter SE contrast at their border, as is visible in the SEM image, suggests that the observed quasispherical formations are actually hollow structures.
The crystalline structure of the as-prepared powder has been analyzed by XRD. The pattern in Figure 2b has been recorded in a wide 2θ range (10–140°) and indexed according to cubic NiO as a unique phase, space group Fm-3m (225), ICDD-01-071-1179, with the lattice parameter α = 0.4178 nm. No secondary phase has been observed in the XRD pattern, within the detection limit of 1–2%.
The low-magnification TEM image in Figure 2c confirms the quasi-spherical micrometrical formations observed by SEM and also their empty ball-like morphology. Moreover, even at low magnification, one can notice that the membrane shaping these globular bodies is not continuous, but it has a certain nanoscale structure. The high-magnification TEM image in Figure 2d has been recorded from a broken globular micro-object, showing that the membrane consists of self-assembled nanoparticles. As the constituting nanoparticles are not closely packed, the membrane has a porous aspect, with pore size comparable to the nanoparticles’ size and a filling factor around 75%. The crystalline structure was analyzed by selected area electron diffraction (SAED) confirming the formation of face-centered cubic NiO as a unique phase, as determined by XRD. A typical SAED pattern is inserted in Figure 2d, indicating the most intense NiO diffraction rings: (111), (200), and (220).
The average size of NiO nanoparticles measures 10 ± 2 nm, as determined from TEM measurements, in agreement with the crystallite size measured from the XRD pattern. A histogram was built up from the nanoparticles size measurements performed on the TEM images from which we determined an average size of 9 ± 2 nm (Figure 2e). A close value, 11 ± 2 nm, has been obtained for the crystallite size by Rietveld refinement of the XRD pattern, which means that most of the nanoparticles are actually single-crystal domains. A typical HRTEM image shows the absence of extended structural defects inside the nanoparticles (Figure 2f).

3.2. Surface Chemistry Results

We investigated the sensors’ surface chemistry by X-Ray Photoelectron Spectroscopy (XPS). Thus, the surveys (wide scan) spectra were recorded, followed by the high-resolution photoelectron spectra for the most prominent transitions: C1s, O1s, and Ni2p in the “as received stage” as well as after a gentle Ar ion sputtering (0.5 min sputter time, 1 KeV incident energy, and 3 × 3 mm scanned area) in order to remove the surface contaminants, mainly the adsorbed hydrocarbon from the environment. Under these experimental conditions, mainly the valence state of Ni, found on the sample surface (<10 nm), was not significantly altered.
The Ni2p3/2 binding energy (BE) at 855.2 eV together with the BE of the associated satellite (~861 eV) clearly show the presence of Ni2+ (Figure 3a), coordinated in the NiO symmetry in agreement with XRD and TEM results. A slight modification of the spectrum shape toward lower BEs should be the result of the sputtering-induced effect, despite our fully understood awareness.
The oxygen chemistry investigated from the O1s high-resolution transition is shown in Figure 3b. The spectra asymmetry, more pronounced on the higher BEs side, suggests a higher degree of surface hydroxylation. Thus, one can notice the main contribution from the lattice oxygen (BE 529.6 eV) accompanied by the adsorbed OH groups (531.2 eV) and adsorbed water (532.8 eV), as well (Figure 3c). It is worth noting that even if a number of OH groups and water were removed from the top of the surface layer, as an unavoidable result of Ar ion etching, the surface remains strongly hydrated. Following the quantification standard assessment, the amount of adsorbed water is roughly constant before and after Ar ion etching (~13%), while the percentage of adsorbed OH decreases from ~45% to ~29%.
In Table 1, the detailed XPS data are presented. Thus, we found the atomic ratio Ni:O = 1.3:1, in both working stages, compared with 1:1, according to the nominal stoichiometry. Moreover, by the quantification of the oxygen chemical species, we highlight the presence of a large number of OHads groups and water. We emphasize that after removing the surface contaminants, the water content remains constant. These findings suggest that the sensor exhibits a nonstoichiometric surface with a deficiency of the oxygen lattice and a very strongly hydroxylated surface.

3.3. Gas-Sensing Results

The chronology of the work previously presented envisages the role played by oxygen and water vapors toward CO detection with NiO-based gas sensors. The starting point is related to the fine-tuning sensitivity to 50 ppm CO under ambient conditions (50% RH). This aspect is important since, in most of the cases, humidity is considered to be the main issue from the applicative point of view. Although it is known that p-type MOX-based gas sensors exhibit low sensor signal due to their transducing mechanism, this aspect can be counteracted by using various sensitization elements such as appropriate doping elements [21,22]. As such, by using the following formula (Equation (1)) to calculate the sensor signal, specific to p-type MOX, we establish that the maximum in CO detection takes place at 250 °C (Figure 4a) with reasonable response and recovery transients (Figure 4b).
S = R g a s / R a i r = R C O / R a i r
where Rgas is the electrical resistance in the presence of target gas (CO) and Rair is the electrical resistance under the reference atmosphere (synthetic air purity 5.0 with 50%RH). While the transients tresponse and trecovery were calculated as time necessary to reach 90% from the steady-state value before CO in and after CO out.
The operating temperature represents an important parameter for all types of MOX-based gas sensors due to its activation role played during surface gas-sensing phenomena. The bell-like behavior depicted in Figure 4a can be explained by the balance between the activation energy required to oxidize CO to CO2 versus the fast desorption rate of weakly bonded CO at the surface of NiO [23,24]. Generally, the presence of moisture in the ambient atmosphere has a strong influence on the CO detection.
It has been observed [25] that the presence of RH may either enhance or downgrade the subsequent CO detection. Two models have been proposed, which may account for this observation. For instance, Koziej et al. reported that an increase in humidity leads to an increase in the number of oxygen vacancies [26]. The oxygen vacancies enhance the chemisorption of oxygen and form specific oxygen sites [27]. The increase in the number of available oxygen reaction partners for CO leads to an enhancement of the sensor signal.
In Figure 5a, one can observe that the sensor signal with respect to CO concentration is higher in the presence of humidity being independent on the RH level without reaching saturation. A possible explanation for the unsaturated sensor signal might be given according to the highly porous ball-like morphology revealed through TEM investigations, exhibiting a filling factor of 75%. As such, CO molecules of 1.34 Å can reach the inner side of the NiO structure contributing to the overall sensing effect. The CO exposure has been repeated, demonstrating good reproducibility of the sensor signal under the same working conditions.
Since the sensor signal under dry air conditions follows a saturation trend, such dependence gives rise to the assumption that CO–O interaction most likely obeys a Weisz limitation based on the electrostatic reasons [28], while the power-law equation S = a + b   · P C O n was used for fitting the sensor response (where S represents the sensor signal, a and b are fitting constants, PCO is the partial pressure of CO and n represents the power-law exponent), we proceed to the representation of power-law(n) with respect to the RH levels as a way to explore the slight differences that may occur in the reactive surface species (Figure 5b). As a general trend, the power-law exponent of the sensor signal increases with the increase in the RH level.
However, a closer inspection reveals the fact that between dry and humid background, there is a difference of a factor of 2, whereas the changes occurred under RH conditions are mainly negligible, being in the error level. The observed difference in the power-law exponent could be related to a change in the surface species reactivity [29,30], and at this level, it is important to involve complementary phenomenological investigations in order to understand the fundamental aspects of the of the gas–surface interactions.
The need to perform such experiments (i.e., simultaneous electrical resistance, R, and contact potential changes, CPD) resides in the capability to decouple strong physisorption (surface ionosorption) and localized physisorption (in terms of dipolar surface interaction). While the former induces changes in the surface potential barrier (qVs), the latter affects the surface electron affinity χ. The experimental setup through the following relations (Equations (2) and (3)) allows tracking changes in the electron affinity. Thus, at the operating temperature of 250 °C where maximum CO detection occurs, R and CPD have been evaluated with respect to different CO concentrations and RH levels.
Δ Φ = q Δ C P D = q Δ V S + Δ χ + E c E F b u l k )
where ∆Φ is the work function variation, q is the electron charge, ∆CPD is the measured variation of contact potential changes, ∆Vs is the variation of surface band-bending and is calculated by electrical resistance measurements, ∆χ is the electron affinity variation, and E c E F b u l k is constant.
q Δ V S = 2 k B T l n R g a s R a i r
where kB is Boltzmann constant; T is the operating temperature.
Hence, the work function is an extremely sensitive indicator of surface condition, which is affected by the adsorbed molecules, surface reconstruction, and more. By far, the most relevant changes in the work function are encountered in the case of in-field gas-like conditions. Most relevant situations for chemical sensing involve the changes of surface band-bending and electronic affinity, as they are linked to the work function dependencies, as depicted in Equation (2) This type of study has the benefit of unwrapping the insight aspects of MOX-based gas sensors as long as they reveal the realistic pathways of sensing performances.
As can be seen in Figure 6, the electrical resistance increases when switching from dry to humid air, attenuating with the increase in RH level.
On the other hand, the electrical resistance increases with the increase in CO concentration, revealing a typical p-type behavior of the investigated NiO-sensitive material. This phenomenon can be explained by the reduction effect of CO over the pre-adsorbed surface oxygen species, releasing electrons in the valence band, thus decreasing the overall concentration of holes as main free charge carriers.
Moreover, the negative charge carriers trapped at the surface (due to the pre-adsorbed oxygen species) are fully electrically balanced by the holes located in the nearby region within the accumulation layer, satisfying the electro-neutrality condition.
In order to determine how the electrical conduction controls either the shift in the Fermi level (Debye length > grain radius) or, respectively, the change in the potential barrier height (Debye length < grain radius) for the case of NiO, the Debye length (Ld) with respect to a typical carrier concentration of holes of 1020 cm−3 [31] and for a dielectric constant of 12 [32] must be evaluated using the following equation:
L d = ε ε 0 k B T q 2 p b
where ε is the NiO dielectric constant, ε0 is the vacuum permittivity, kB is the Boltzmann constant, T is the absolute temperature (523K), q is the electric charge, and pb is the free hole concentration.
Thus, it is worth mentioning that for the obtained Debye length value of 5.4 nm and taking into account the morphological aspects of non-completely sintered grain-to-grain-like material, we are in the situation of Ld < r.
In terms of potential changes, the quantitative analysis (∆Φ; qVs and ∆χ) depicted in Figure 7a–d gives clear evidence that CO exposure induces a decrease in both ∆Φ and qVs, slightly pronounced under humid conditions, while the electron affinity ∆χ remains almost unchanged. This peculiar aspect amplifies the idea of reaction yield between CO, either with the pre-adsorbed oxygen species or with the lattice oxygen, rather than direct interaction with the physisorbed water [33].
According to the potential changes during CO exposure under humid conditions, one can observe the unchanged ∆χ, most likely due to the interaction between polar molecules of water and CO. More specifically, depending on their orientation, the surface dipoles induced by the presence of moisture hinder or facilitate the charge carrier current, causing the decrease or increase in ∆χ. In our case, this effect is canceled by the presence of CO. The argument is given by the fact that the CO molecule has also a polar nature [34] due to the electronegativity difference between carbon (2.55) and oxygen (3.44) atoms [35].
On the other hand, the presence of CO additionally determines the chemical interaction with surface-adsorbed oxygen species ( O   or   O 2 when operated at 250 °C,) determining the decrease in band-bending. The associated cartoons illustrating these possible interaction mechanisms for CO are depicted in Figure 8 (revealing the CO–Olatt interaction) and Figure 9 (depicting the CO–Oads interaction).
These experimental findings require additional analysis of NiO behavior in the presence of only oxygen and water molecules, constituting the background of CO interaction (Figure 10a,b).
Changes in the surface band-bending and electron affinity are often encountered in gas sensing, as MOX-based gas sensors rely on these phenomena. Moreover, surface ionosorption of oxygen is of particular importance for gas sensors due to its effect on the charge carrier concentration.
As depicted in Figure 10a, oxygen interaction induces an upward in both work function and band-bending, reflecting that these two features are solely linked together. This behavior is normal for a p-type MOX material since depending on temperature, oxygen molecules are ionosorbed on the NiO surface as O 2 ,   O ,   or   O 2 by capturing electrons from the valence band, thus forming an accumulation layer of holes nearby the surface [36]. Since surface oxygen uptake represents a de-localized chemisorption process, the electron affinity changes remain unchanged, which is in line with the report of Sham et al. [37].
The associated cartoon illustrating the possible interaction mechanism is depicted in Figure 11.
The effect of moisture as dipolar molecule (Figure 10b) and its subsequent interaction mechanisms proposed by Heiland and Kohl [38] can be highlighted by the following two-fold phenomena: (i) reducing agent manifested through the changes in the surface potential barrier and (ii) formation of surface dipoles, inducing variations in its electron affinity. Herein, while the former does not resemble the findings that occurred on NiO-RH exposure (i.e., qVs = ct.), the latter might vary depending on the orientation of the surface dipoles (i.e., ∆χ < 0).
Thiel et al. [39] have described this decrease in the electron affinity in terms of an acid–base relationship. According to the observations that the effects of humidity on the electrical resistance are almost negligible, this process suggests that the reaction between NiO and RH has an electroneutral nature. The associated XPS investigations are to the benefit of the phenomenological insights, underlining the strong surface hydration (adsorbed water) on one hand and the weakly bonded hydroxyl groups on the other side. Upon Ar etching, the former remains almost constant, while the latter decreases from 45% to 29%.
Wicker et al. gave a possible explanation for the aforementioned behavior [40], envisaging a reduction followed by fast reoxidation, or the as-formed surface OH groups have no implication for the conduction mechanism. The associated cartoon illustrating the possible interaction mechanism is depicted in Figure 12.

4. Conclusions

In this work, we have unwrapped the gas-sensing mechanism toward CO detection with NiO-based gas sensors operated under in-field conditions. NiO-sensitive materials were obtained via hydrothermal synthesis revealing quasi-spherical self-assembled nanoparticles with a high degree of surface hydration. It is likely that, due to the highly porous structure with pore size comparable to the nanoparticles’ size, CO molecules can reach the inner side of the NiO structure, bringing a net contribution to the sensing effect.
According to the intrinsic properties expressed through the Debye length (Ld) and compared to the TEM and XRD average size measurements, the case herein presented is related to the non-completely sintered, grain-to-grain-sensitive material with Ld smaller than grain radius. The role played by moisture over CO detection was revealed by means of simultaneous electrical resistance and contact potential changes.
By decoupling the energetic contributions, one could see that while both work function and surface potential barrier decrease with respect to CO concentration, the electron affinity remains almost constant. This can be explained by the dual role of CO, the chemical interaction with the lattice or pre-adsorbed oxygen species, and the dipolar interaction with the physisorbed water. The assumption of physisorbed water at the NiO surface is supported by the electroneutral activity of RH (no change in the surface potential barrier) in conjunction with the decrease in both work function and electron affinity. The aforementioned results forecast new reaction pathways for CO detection under in-field conditions with NiO-based gas sensors.

Author Contributions

Conceptualization, A.S. and C.E.S.; materials preparation, S.S.; sensors fabrication and electrical investigations, O.G.F.; XRD investigations, D.G.; TEM investigations, C.G. and C.G.M.; SEM investigations, I.M.; writing—original draft preparation, C.E.S.; writing—review and editing, all authors. All authors have read and agreed to the published version of the manuscript.

Funding

This work was funded by a grant of Ministry of Research, Innovation, and Digitization CNCS/CCDI-UEFISCDI through the project PN-III-P4-ID-PCE-2020-0506 (contract no. 116/2021) within PNCDI III and by Romanian National Authority for Scientific Research through the Core Program PN19-03 (contract no. 21 N/08.02.2019).This work is part of the PhD “Nanostructured materials for gas sensing: correlations between functional, electronic and microstructural properties” supported by CERIC-ERIC.

Institutional Review Board Statement

Not applicable.

Informed Consent Statement

Not applicable.

Conflicts of Interest

The authors declare no conflict of interest. The funders had no role in the design of the study; in the collection, analyses, or interpretation of data; in the writing of the manuscript; or in the decision to publish the results.

References

  1. Guan, W.; Tang, N.; He, K.; Hu, X.; Li, M.; Li, K. Gas-sensing performances of metal oxide nanostructures for detecting dissolved gases: A mini review. Front. Chem. 2020, 8, 76. [Google Scholar] [CrossRef]
  2. Nikolic, M.V.; Milovanovic, V.; Vasilevic, Z.Z.; Stamenkovic, Z. Semiconductor Gas Sensors: Materials, Technology, Design and Application. Sensors 2020, 20, 6694. [Google Scholar] [CrossRef]
  3. Malik, R.; Tomer, V.K.; Misha, Y.K.; Lin, L. Functional gas sensing nanomaterials: A panoramic view. Appl. Phys. Rev. 2020, 7, 021301. [Google Scholar] [CrossRef] [Green Version]
  4. Xiong, H.; Fu, J.; Li, J.; Ali, R.; Wang, H.; Liu, Y.; Su, H.; Li, Y.; Lau, W.-M.; Mahmood, N.; et al. Strain-regulated sensing properties of α-Fe2O3 nano-cylinders with atomic carbon layers for ethanol detection. J. Mater. Sci. Technol. 2021, 68, 132–139. [Google Scholar] [CrossRef]
  5. Zhang, J.; Qin, Z.; Zeng, D.; Xie, C. Metal-oxide-semiconductor based gas sensors: Screening, preparation, and integration. Phys. Chem. Chem. Phys. 2017, 19, 6313–6329. [Google Scholar] [CrossRef]
  6. Tyagi, P.; Sharma, A.; Tomar, M.; Gupta, V. SnO2 thin film sensor having NiO catalyst for detection of SO2 gas with improved response characteristics. Sens. Actuators B Chem. 2017, 248, 998–1005. [Google Scholar] [CrossRef]
  7. Morsbach, E.; Kunz, S.; Baümer, M. Novel nanoparticle catalysts for catalytic gas sensing. Catal. Sci. Technol. 2016, 6, 339–348. [Google Scholar] [CrossRef]
  8. Kim, H.-R.; Haensch, A.; Kim, I.-D.; Barsan, N.; Weimar, U.; Lee, J.-H. The role of NiO doping in reducing the impact of humidity on the performance of SnO2-based gas sensors: Synthesis strategies, and phenomenological and spectroscopic studies. Adv. Funct. Mater. 2011, 21, 4456–4463. [Google Scholar] [CrossRef]
  9. Hübner, M.; Simion, C.E.; Tomescu-Stanoiu, A.; Pokhrel, S.; Barsan, N.; Weimar, U. Influence of humidity on CO sensing with p-type CuO thick film gas sensors. Sens. Actuators B Chem. 2011, 153, 347–353. [Google Scholar] [CrossRef]
  10. De Lima, B.S.; Martinez-Alanis, P.R.; Güell, F.; dos Santos Silva, W.A.; Bernardi, M.I.B.; Marana, N.; Longo, E.; Sambrano, J.R.; Mastelaro, V.R. Experimental and Theoretical Insights into the Structural Disorder and Gas Sensing Properties of ZnO. ACS Appl. Electron. Mater. 2021, 3, 1447–1457. [Google Scholar] [CrossRef]
  11. Hozak, P.; Vorokhta, M.; Khalakhan, I.; Jarkovska, K.; Cibulkova, J.; Fitl, P.; Vlcek, J.; Fara, J.; Tomecek, D.; Novotnz, M.; et al. New Insight into the Gas-Sensing Properties of CuOx Nanowires by Near-Ambient Pressure XPS. J. Phys. Chem. C 2019, 123, 29739–29749. [Google Scholar] [CrossRef]
  12. Degler, D. Trends and Advances in the Characterization of Gas Sensing Materials Based on Semiconducting Oxides. Sensors 2018, 18, 3544. [Google Scholar] [CrossRef] [PubMed] [Green Version]
  13. Liu, Y.; Gao, C.; Li, Q.; Pang, H. Nickel oxide/Graphene Composites: Synthesis and Applications. Chem. Eur. J. 2019, 25, 2141–2160. [Google Scholar] [CrossRef] [PubMed]
  14. Fominykh, K.; Feckl, J.M.; Sicklinger, J.; Doeblinger, M.; Böcklein, S.; Ziegler, J.; Peter, L.; Rathousky, J.; Scheidt, E.-W.; Bein, T.; et al. Water Splitting: Ultrasmall Dispersible Crystalline Nickel Oxide Nanoparticles as High-Performance Catalysts for Electrochemical Water Splitting. Adv. Funct. Mater. 2014, 24, 3123–3129. [Google Scholar] [CrossRef]
  15. Danjumma, S.G.; Abubakar, Y.; Suleiman, S. Nickel Oxide (NiO) Devices and Applications: A review. Int. J. Eng. Res. Technol. 2019, 8, 12–21. [Google Scholar] [CrossRef]
  16. Dey, S.; Mehta, N.S. Oxidation of carbon monoxide over various nickel oxide catalysts in different conditions: A review. Chem. Eng. J. Adv. 2020, 1, 100008. [Google Scholar] [CrossRef]
  17. Park, S.; Ahn, H.-S.; Lee, C.-K.; Kim, H.; Jin, H.; Lee, H.-S.; Seo, S.; Yu, J.; Han, S. Interaction and ordering of vacancy defects in NiO. Phys. Rev. B 2008, 77, 134103. [Google Scholar] [CrossRef] [Green Version]
  18. Saruhan, B.; Fomekong, R.L.; Nahirniak, S. Review: Influences of Semiconductor Metal Oxide Properties on Gas Sensing Characteristics. Front. Sens. 2021, 20. [Google Scholar] [CrossRef]
  19. Barsan, N.; Weimar, U. Understanding the fundamental principles of metal oxide based gas sensors; the example of CO sensing with SnO2 sensors in the presence of humidity. J. Phys. Condens. Matter 2003, 15, R813. [Google Scholar] [CrossRef]
  20. Koziej, D.; Barsan, N.; Shimanoe, K.; Yamazoe, N.; Szuber, J.; Weimar, U. Spectroscopic insights into CO sensing of undoped and palladium doped tin dioxide sensors derived from hydrothermally treated tin oxide sol. Sens. Actuators B Chem. 2006, 118, 98–104. [Google Scholar] [CrossRef]
  21. Kim, H.-J.; Lee, J.-H. Highly sensitive and selective gas sensors using p-type oxide semiconductors: Overview. Sens. Actuators B Chem. 2014, 192, 607–627. [Google Scholar] [CrossRef]
  22. Yuan, Z.; Li, R.; Meng, F.; Zhang, J.; Zuo, K.; Han, E. Approaches to Enhancing Gas Sensing Properties: A Review. Sensors 2019, 19, 1495. [Google Scholar] [CrossRef] [Green Version]
  23. Wagner, R.; Kamin, D.S.; Moos, R. Novel Operation Strategy to Obtain a fast Gas Sensor for Continuous ppb-Level NO2 Detection at Room Temperature Using ZnO—A Concept Study with Experimental Proof. Sensors 2019, 19, 4104. [Google Scholar] [CrossRef] [PubMed] [Green Version]
  24. Kumar, M.; Bhati, V.S.; Ranwa, S.; Singh, J.; Kumar, M. Pd/ZnO nanorods based sensor for highly selective detection of extremely low concentration hydrogen. Sci. Rep. 2017, 7, 236. [Google Scholar] [CrossRef] [PubMed]
  25. Großmann, K.; Wicker, S.; Weimar, U.; Barsan, N. Impact of Pt additives on the surface reaction between SnO2, water vapour, CO and H2; an operando investigation. Phys. Chem. Chem. Phys. 2013, 15, 19151–19158. [Google Scholar] [CrossRef] [PubMed]
  26. Koziej, D.; Barsan, N.; Weimar, U.; Szuber, J.; Shimanoe, K.; Yamazoe, N. Water-oxygen interplay on tin dioxide surface: Implication on gas sensing. Chem. Phys. Lett. 2005, 410, 321–323. [Google Scholar] [CrossRef]
  27. Barsan, N.; Hübner, M.; Weimar, U. Conduction mechanisms in SnO2 based polycrystalline thick film gas sensors exposed to CO and H2 in different oxygen backgrounds. Sens. Actuators B Chem. 2011, 157, 510–517. [Google Scholar] [CrossRef]
  28. Weisz, P.B. Effects of electronic charge transfer between adsorbate and solid on chemisorption and catalysis. J. Chem. Phys. 1953, 21, 1531–1538. [Google Scholar] [CrossRef]
  29. Hua, Z.; Li, Y.; Zeng, Y.; Wu, Y. A theoretical investigation of the power-law response of metal oxide semiconductor gas sensors I: Schottky barrier control. Sens. Actuators B Chem. 2018, 255, 1911–1919. [Google Scholar] [CrossRef]
  30. Hua, Z.; Tian, C.; Huang, D.; Yuan, W.; Zhang, C.; Tian, X.; Wang, M.; Li, E. Power-law response of metal oxide semiconductor gas sensors to oxygen in presence of reducing gases. Sens. Actuators B Chem. 2018, 267, 510–518. [Google Scholar] [CrossRef]
  31. Nachman, M.; Cojocaru, L.N.; Ribco, L.V. Electrical Properties of Non-Stoichiometric Nickel Oxide. Phys. Stat. Sol. 1965, 8, 773–783. [Google Scholar] [CrossRef]
  32. Gielisse, P.J.; Plendl, J.N.; Mansur, L.C.; Marshall, R.; Mitra, S.S.; Mykolajewycz, R.; Smakula, A. Infrared Properties of NiO and CoO and their Mixed Crystals. J. Appl. Phys. 1965, 36, 2446. [Google Scholar] [CrossRef]
  33. Marikutsa, A.; Rumyantseva, M.; Konstantinova, E.A.; Gaskov, A. The Key Role of Active Sites in the Development of Selective Metal Oxide Sensor Materials. Sensors 2021, 21, 2554. [Google Scholar] [CrossRef] [PubMed]
  34. Politzer, P.; Kammeyer, C.W.; Bauer, J.; Hedges, W.L. Polar properties of carbon monoxide. J. Phys. Chem. 1981, 85, 4057–4060. [Google Scholar] [CrossRef]
  35. Tantardini, C.; Oganov, A.R. Thermochemical electronegativities of the elements. Nat. Commun. 2021, 12, 2087. [Google Scholar] [CrossRef] [PubMed]
  36. Cho, S.-Y.; Yoo, H.-W.; Kim, J.Y.; Jung, W.-B.; Jin, M.L.; Kim, J.-S.; Jeon, H.-J.; Jung, H.-T. High-Resolution p-Type Metal Oxide Semiconductor Nanowire Array as an Ultrasensitive Sensor for Volatile Organic Compounds. Nano Lett. 2016, 16, 4508–4515. [Google Scholar] [CrossRef] [PubMed]
  37. Sahm, T.; Gurlo, A.; Barsan, N.; Weimar, U.; Mädler, L. Fundamental studies on SnO2 by means of simultaneous work function change and conduction measurements. Thin Solid Films 2005, 490, 43–47. [Google Scholar] [CrossRef]
  38. Heiland, G.; Kohl, D.; Seiyama, T. (Eds.) Chemical Sensor Technology; Kodansha: Tokyo, Japan, 1988; Volume 1, pp. 15–38. [Google Scholar] [CrossRef]
  39. Thiel, P.A.; Madey, T.E. The interaction of water with solid surfaces: Fundamental aspects. Surf. Sci. Rep. 1987, 7, 211–385. [Google Scholar] [CrossRef]
  40. Wicker, S.; Guilat, M.; Weimar, U.; Hemeryck, A.; Barsan, N. Ambient Humidity Influence on CO Detection with SnO2 Gas Sensing Materials. A Combined DRIFT/DFT Investigation. J. Phys. Chem. C 2017, 121, 25064–25073. [Google Scholar] [CrossRef] [Green Version]
Figure 1. Comprehensive view of the experimental setup on the top part of the image and details of the Kelvin Probe technique involved in the phenomenological investigations on the bottom part of the image.
Chemosensors 09 00244 g001
Figure 2. SEM image revealing the growth morphology as micrometric quasi-spherical formations (a); XRD pattern proving the synthesis of single-phase cubic NiO (b); low-magnification TEM image confirming the quasi-spherical formations (c); high-magnification TEM image and inserted SAED pattern showing the nanostructure of the quasi-spherical formations (d); nanoparticle size distribution from TEM imaging on the NiO sample (e); HRTEM image of the NiO nanoparticles, showing the lack of structural defects and the single-domain nature for most of them (f).
Chemosensors 09 00244 g002
Figure 3. Survey spectrum in the “as-received” stage (a); the superimposed high-resolution spectra for Ni2p (b) and O1s (c) in the “as-received” stage and after a gentle Ar ion etch, as well as the O1s deconvoluted spectrum in the “as-received” stage (d).
Chemosensors 09 00244 g003
Figure 4. Sensor signal for NiO toward 50 ppm CO under 50% RH with respect to the operating temperature (a) and transients (b).
Chemosensors 09 00244 g004
Figure 5. The mean value of the sensor signal dependence with respect to the CO concentration when operated under different %RH (a); the influence of the RH on the power-law exponents (b).
Chemosensors 09 00244 g005
Figure 6. Electrical resistance and contact potential difference with respect to the CO concentration under different RH levels for the NiO sensor operated at 250 °C.
Chemosensors 09 00244 g006
Figure 7. Dependence of the potential changes with respect to CO concentration for NiO-based gas sensor operated at 250 °C and different background humidity: 0%RH (a); 10%RH (b); 30%RH (c); 50%RH (d).
Chemosensors 09 00244 g007
Figure 8. Cartoon revealing the interaction between CO and lattice oxygen for NiO-sensitive surface under RH background.
Chemosensors 09 00244 g008
Figure 9. Cartoon revealing the interaction between CO and pre-adsorbed oxygen for NiO-sensitive surface under RH background.
Chemosensors 09 00244 g009
Figure 10. Dependence of the potential changes with respect to O2 concentration (a) and RH level (b) for NiO-based gas sensor operated at 250 °C.
Chemosensors 09 00244 g010
Figure 11. Cartoon revealing the interaction between atmospheric oxygen and NiO-sensitive surface. Consequently, both band bending and work function exhibit a positive increase while the elec-tron affinity remains constant.
Chemosensors 09 00244 g011
Figure 12. Cartoon revealing the interaction between atmospheric moisture and NiO surface. Due to molecular water physisorption, the band-bending remains constant while a strong decrease in the electronic affinity and work function was recorded.
Chemosensors 09 00244 g012
Table 1. XPS data: photoelectron lines, binding energies (BEs—eV), chemical species, atomic relative concentrations (atom%).
SampleBinding Energy (eV)Atomic Relative Concentrations (atom%)
with and without C
Ni2p3/2O1s (Chemical Species and Their Percentages)NiOC
NiO
As received
855.2529.5 Olatt (41.9%)55.242.02.8
530.8 OHads (45.6%)56.843.2-
532.7 H2O (12.5%)
NiO
0.5 min Ar ion etching
855.3529.6 Olatt (57.9%)55.342.91.8
531.3 OHads (29.5%)56.343.7-
532.9 H2O (12.6%)
Publisher’s Note: MDPI stays neutral with regard to jurisdictional claims in published maps and institutional affiliations.

