Particle Characterisation and Depletion of Li2CO3 Inhibitor in a Polyurethane Coating
by

Anthony Hughes
1,2,*, 
James Laird
1,
Chris Ryan
1,
Peter Visser
3,4,
Herman Terryn
3,5 and
Arjan Mol
3 1
CSIRO Minerals Resources Flagship, Clayton, Victoria 3169, Australia
2
Institute for Frontier Materials, Deakin University, Waurn Ponds, Geelong, Victoria 3216, Australia
3
Department of Materials Science and Engineering, Delft University of Technology, Mekelweg 2, 2628 CD Delft, The Netherlands
4
AkzoNobel Specialty Coatings, Rijksstraatweg 31, 2171 AJ Sassenheim, The Netherlands
5
Department of Materials and Chemistry, Research Group Electrochemical and Surface Engineering, Vrije Universiteit Brussel, Pleinlaan 2, 1050 Brussels, Belgium
*
Author to whom correspondence should be addressed.
Coatings 2017, 7(7), 106; https://doi.org/10.3390/coatings7070106
Submission received: 30 May 2017
/
Revised: 3 July 2017
/
Accepted: 14 July 2017
/
Published: 21 July 2017
(This article belongs to the Special Issue New Generation Coatings for Metals)
Abstract
:The distribution and chemical composition of inorganic components of a corrosion-inhibiting primer based on polyurethane is determined using a range of characterisation techniques. The primer consists of a Li2CO3 inhibitor phase, along with other inorganic phases including TiO2, BaSO4 and Mg-(hydr)oxide. The characterisation techniques included particle induced X-ray and γ-ray emission spectroscopies (PIXE and PIGE, respectively) on a nuclear microprobe, as well as SEM/EDS hyperspectral mapping. Of the techniques used, only PIGE was able to directly map the Li distribution, although the distribution of Li2CO3 particles could be inferred from SEM through using backscatter contrast and EDS. Characterisation was also performed on a primer coating that had undergone leaching in a neutral salt spray test for 500 h. Overall, it was found that Li2CO3 leaching resulted in a uniform depletion zone near the surface, but also much deeper local depletion, which is thought to be due to the dissolution of clusters of Li2CO3 particles that were connected to the external surface/electrolyte interface.
1. Introduction
Over recent decades, there has been a widespread search for alternatives to chromate inhibitors in paints for many applications where corrosion is a threat to aesthetic and structural quality. Many new inhibitor systems have been the subject of extensive research, including rare earths [1,2,3,4,5,6,7,8,9,10,11,12,13,14], vanadates [15,16], organic compounds [17,18,19,20,21,22,23], sacrificial particles or functional properties in coatings [24,25,26,27,28], double-layered hydroxides containing inhibitors [29,30,31,32,33,34,35,36,37,38,39,40,41] and, in many cases, combinations of these. The search for alternatives is probably most intense for aerospace applications, where chromate inhibitors have been the mainstay of corrosion prevention for many decades. This is because chromate has a proven performance, particularly in the parts of aerostructures that are difficult to access, where many years may pass between inspections. It is in these applications that chromate has demonstrated its reliability [42].
Recently, Visser et al. reported on the promising potential of Li-based inhibitors as chromate replacements for application to aluminium alloys used in the aerospace industry [43]. The successful inhibition of Al, exposed at defects through a primer by Li inhibitors, was proposed to be due to the formation of a hydrated aluminium oxide incorporating Li [44,45,46]. The source of the Li was from Li2CO3 particles added as a leachable inhibitor to the paint system. The successful application of Li-based inhibitors in coatings, however, requires a detailed knowledge of how to incorporate the inhibitor into a primer formulation, as well as an understanding of the mechanism of leaching. Thus, detailed characterisation of the coating in the as-formulated state, as well as after exposure to conditions where inhibitor leaching occurs, is required.
The objective of this work is to characterise a polyurethane primer, particularly its inorganic components (Li2CO3 inhibitor, TiO2, BaSO4 and Mg-(hydr)oxide) in the as-formulated state, as well as after neutral salt spray (NSS) exposure. Comparing the primer without NSS exposure to that after NSS exposure will provide important insights into changes in the primer chemistry, including changes to the inorganic components, particularly the Li2CO3 inhibitor, resulting from NSS exposure. From a characterisation perspective, Li is one of the more difficult elements to detect in the periodic table. This is due both to the small number of electrons as well as the low interaction cross section for techniques based on electron or photon interaction. On the other hand, the Li nucleus has a relatively high cross section for proton interaction (depending on the proton energy) resulting in γ-ray emission. The method that utilises this interaction is called particle-induced γ-ray emission (PIGE), and a preceding paper on the application of this technique on the Li2CO3-loaded primer studied here has recently been reported [47]. Both PIGE and X-ray emission (PIXE) occur using proton beams, with the X-ray emission resulting from the same transitions as can be seen using energy-dispersive X-ray spectroscopy, but with proton excitation rather than electron excitation. The use of these techniques is not widespread in the corrosion and coatings communities, since nuclear microprobes using MeV ion beams from particle accelerators are rare compared to standard instruments available to research and industry. However, PIXE has been used for corrosion studies [48,49], as well as studies into inhibitor depletion at defects in coatings [50]. In this study, PIGE, supported by PIXE and SEM/EDS has been used to characterise the inorganic components of the primer system, including the Li2CO3, Mg-(hydr)oxides, BaSO4 and TiO2 particles. Of course, after NSS, the focus is on the change in the Li distribution, since this is the leachable component of the system.
2. Experimental
2.1. Materials and Sample Preparation
The primer (coating) was a high-solids formulation based on a polyurethane resin with polyisocynate crosslinker, and formulated to a pigment volume concentration (PVC) of 30%, as described elsewhere [43]. The inorganic pigments included Li2CO3, Mg-(hydr)oxide and BaSO4 fillers and TiO2. Trace element analyses of the various inorganic components of the paint indicated that the BaSO4 contained 0.9%m/m Sr, and small amounts of Si, Ca, Al and Ti. The MgO contained 1500–1900 ppm by weight of Ca, 400–700 ppm by weight K and lesser amounts of other elements (Table 1). The Li2CO3 contained alkali metals (Na, K) in the range 400–800 ppm by weight. Particle size distributions for these additives were determined by dispersing in a solvent, which was methylethylketone for Mg-(hydr)oxide, TiO2 and Li2CO3, where water was used for the BaSO4. The BaSO4 particles had the largest particles (up to 50 μm) and the largest spread in particles size. The TiO2 particles were the smallest (up to 14 μm) and slightly smaller than the Mg-(hydr)oxide. The Li2CO3 had the largest size at the lowest end of the distribution and ranged up to 18 μm.
AA2024-T3 was used as a substrate for coating; typical breakdown for this alloy is reported elsewhere [51]. The AA2024-T3 was prepared by standard anodising according to aerospace requirements (AIPI 02-01-003) at Premium AEROTEC, Bremen Germany. This included the following steps: degrease, alkaline clean, acid desmutting followed by anodising in tartaric-sulphuric acid to produce a 2–3 μm thick oxide layer. Subsequently, the primer was applied by spraying using a high-volume, low-pressure (HVLP) spray gun in a single pass to achieve a dry film thickness of approximately 30 μm. In practice, the coating was typically 30 to 40 μm. Finally, the primer was cured for 16 h at 23 °C/55% RH, followed by a 30 min baking cycle at 80 °C.
2.2. NSS Exposure
The primer was exposed to neutral salt spray (NSS) for 500 h in a test chamber operated according to ASTM B117 [52].
2.3. Particle Induced ϒ (PIGE) and X-ray Emission (PIXE)
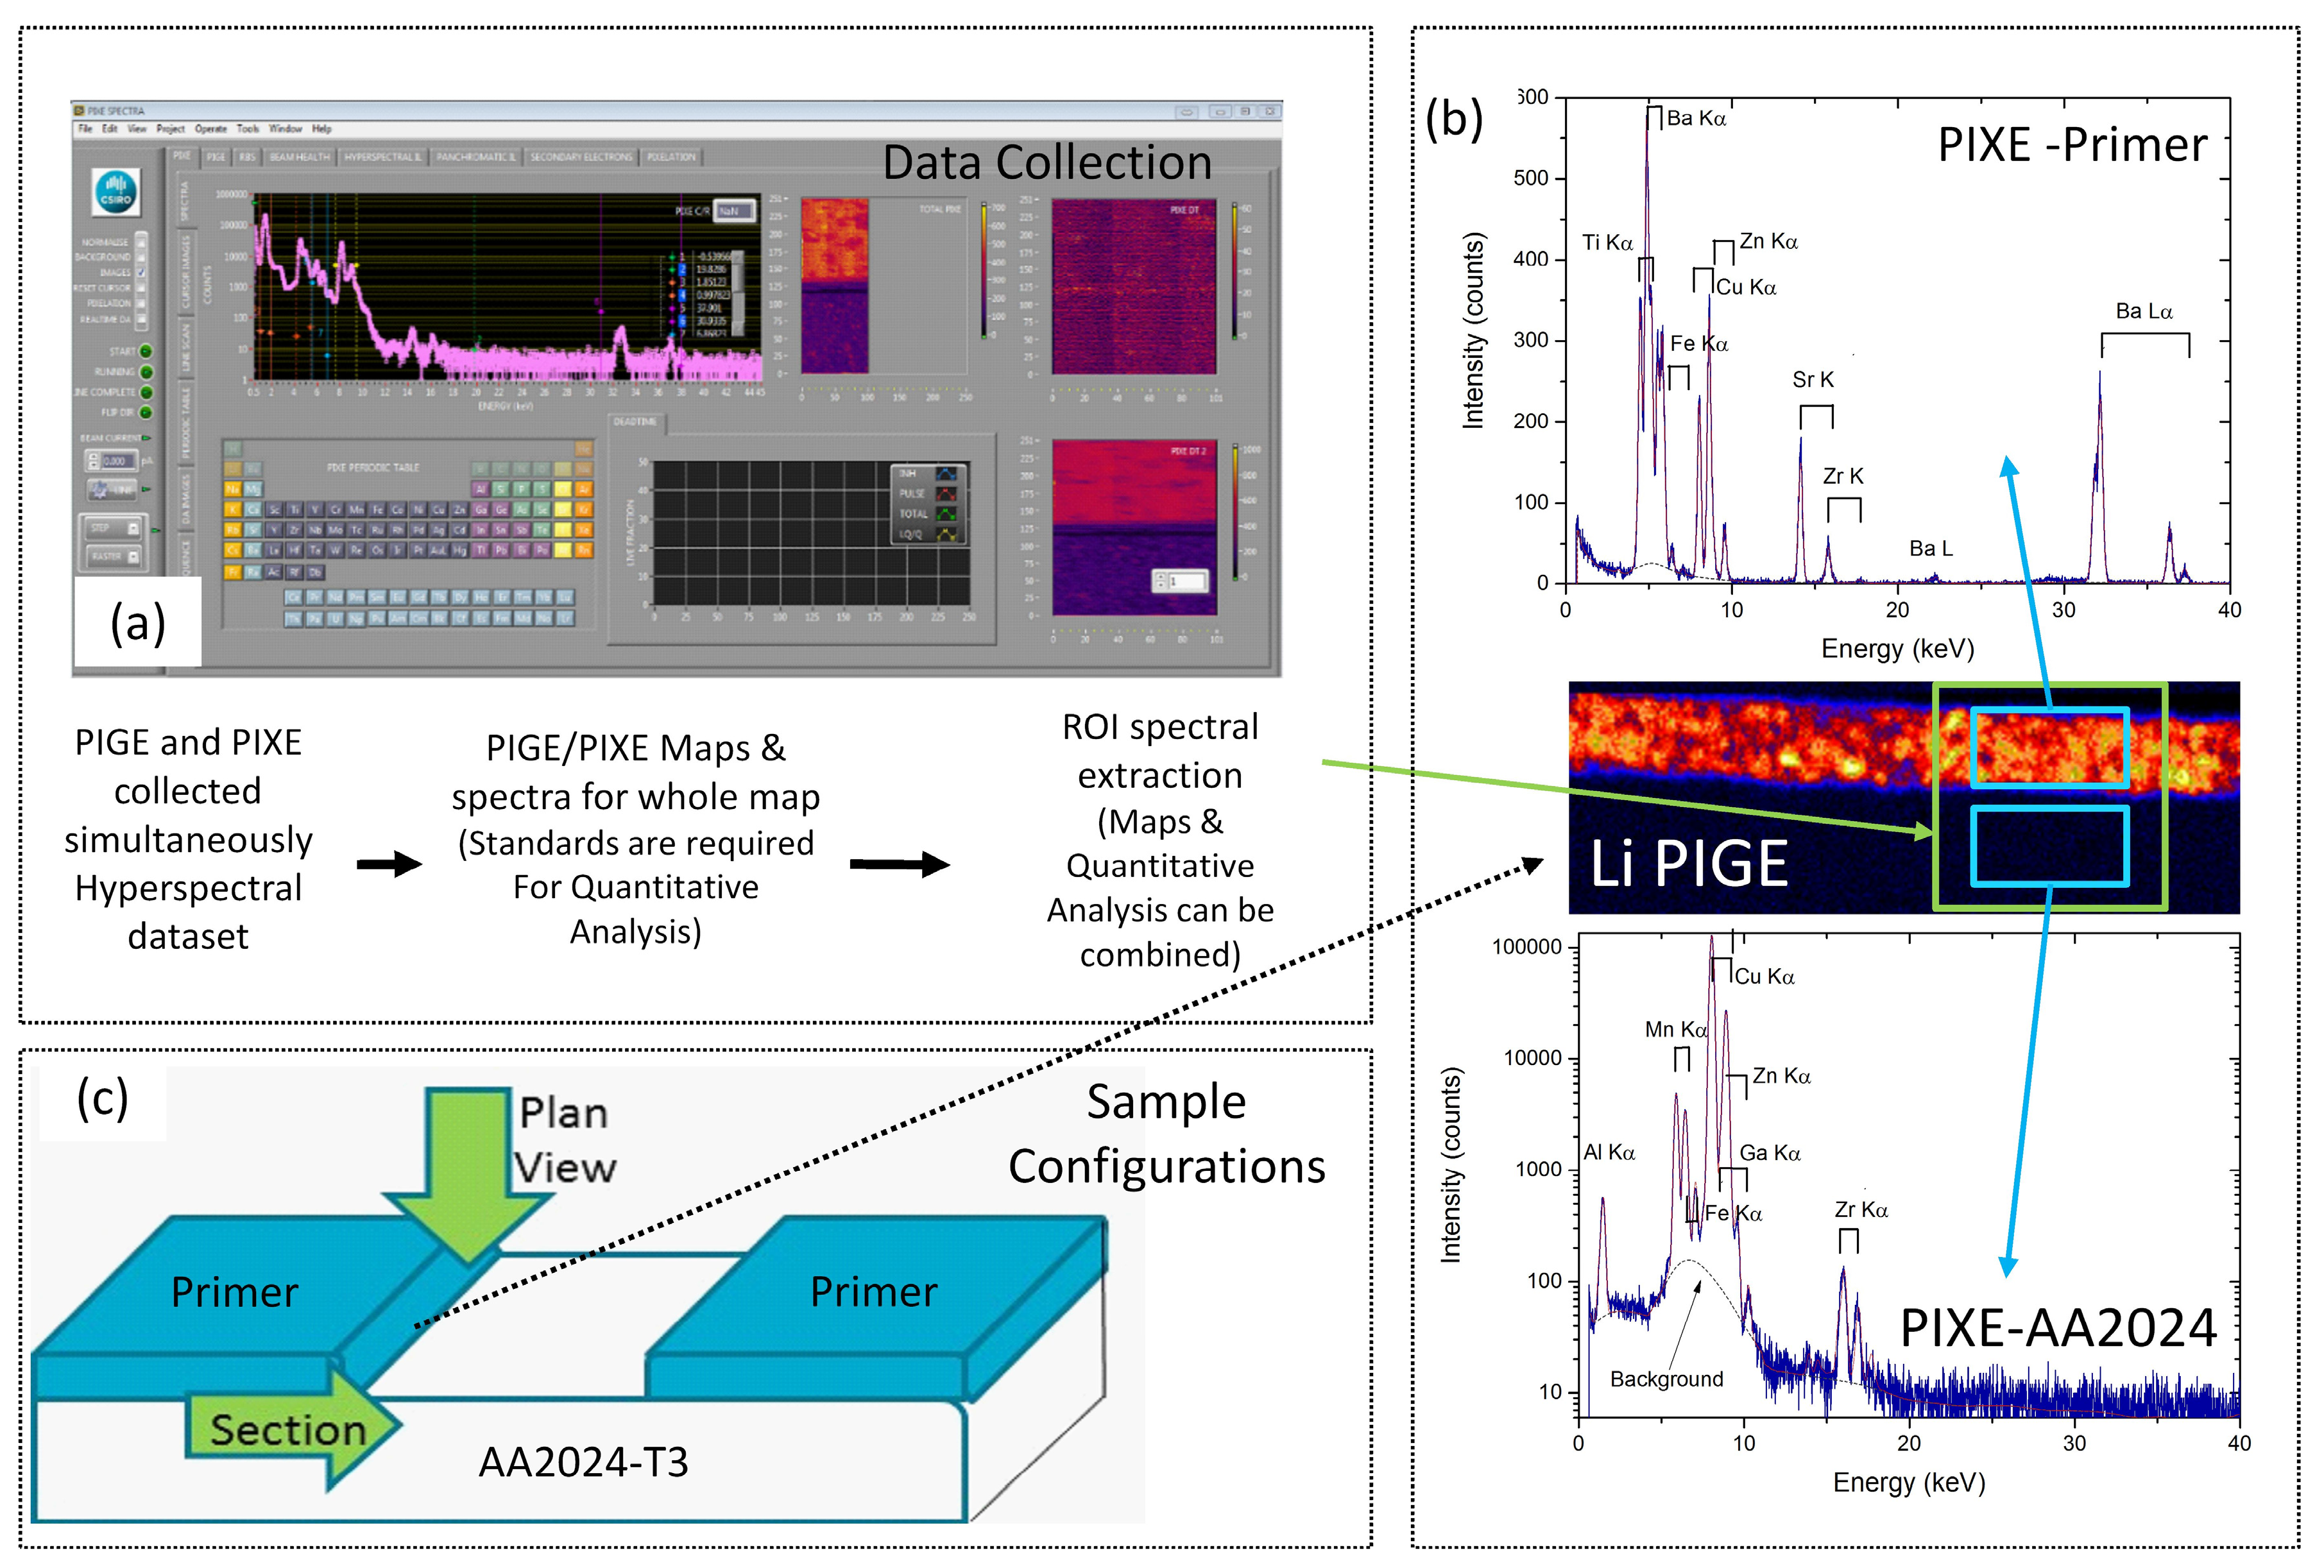
PIXE and PIGE were performed on the CSIRO beamline attached to a pelletron at the University of Melbourne [53]. Three MeV protons were focussed at the target plane to around 2 μm using a separated quintuplet lens designed for optimal balance between high spatial resolution and maximum beam current. For this work, beam currents were typically in the 0.5–1.0 nA range. A large area Ge(Li) γ-ray detector was placed approximately 5 mm directly behind the sample for a maximum acceptance solid angle. A LiF crystal and pure Al were used for the calibration of the γ-ray detector energy axis. For PIXE, the 100 mm2 Ge(Li) detector was mounted at 45° to the incident proton beam, and around 3 to 4 mm from the sample. A 100 μm thick pure Al filter was placed in front of the detector to accommodate trace level heavy element detection limits. Scan areas chosen for analysis varied, but generally ranged from 10 to 50 μm × 200 μm. The analysis depth was approximately 10–20 μm for both methods. A schematic for data collection using MicroDAQ [54] is presented in Figure 1. For data collection, the sample is moved in a grid of points under the proton beam. At each point, PIGE and PIXE spectra were collected, forming a pixel in a map and making a hyperspectral data set.
After collection, further data analysis was performed using GeoPIXE [55] where regions of interest (ROI) such as the primer, aluminium alloy or depletion zones were examined in more detail by extracting spectra from each of these ROIs. Both the Li 429 and 478 keV lines were considered for PIGE Li analysis, but only the 429 keV peak was employed due to its greater surface sensitivity [47]. In this case, inelastic proton scattering from the nucleus (written 7Li(p, p’, γ) generates a clear 429 keV γ-ray signature, making PIGE an excellent technique for following changes in the Li distribution, since Li comes only from the primer in this study [56]. For PIXE, the signature K and L-series X-ray emission lines were used for element identification.
2.4. Scanning Electron Microscopy
Scanning electron microscopy was performed on a FEI Quanta 400 field emission, environmental SEM (ESEM) under high vacuum conditions. The samples were examined in a number of configurations. All samples were coated with around 200 Å of carbon. Samples examined in sections were first cut using sheet metal cutters, mounted in conducting bakerlite ground, and then polished. Grinding started with SiC papers (320 through to 2400 SiC), followed by polishing on diamond (8, 3, 1, 0.25 μm) under a non-aqueous medium. Secondary electron and backscattered electron imaging were performed using beam energies of 10 kV, and probe currents of approximately 140–145 pA. Some additional imaging was performed at higher energies to obtain information on subsurface particles, as described in the Results section. Quantmaps were generated using standardless approaches; however, the quantmaps were only used to separate the overlapping signals of the Ti K-series lines from the Ba L-series lines by curve fitting rather than for quantitative analysis.
3. Results
The results section of this paper is divided into the characterisation of the inorganic components in a polyurethane coating without exposure to NSS and after 500 h NSS exposure. Of particular interest is the Li distribution in the coating, since this is the active inhibitor component that is expected to leach out of the coating during NSS exposure.
3.1. Characterisation of the Primer Prior to Leaching
3.1.1. SEM/EDS
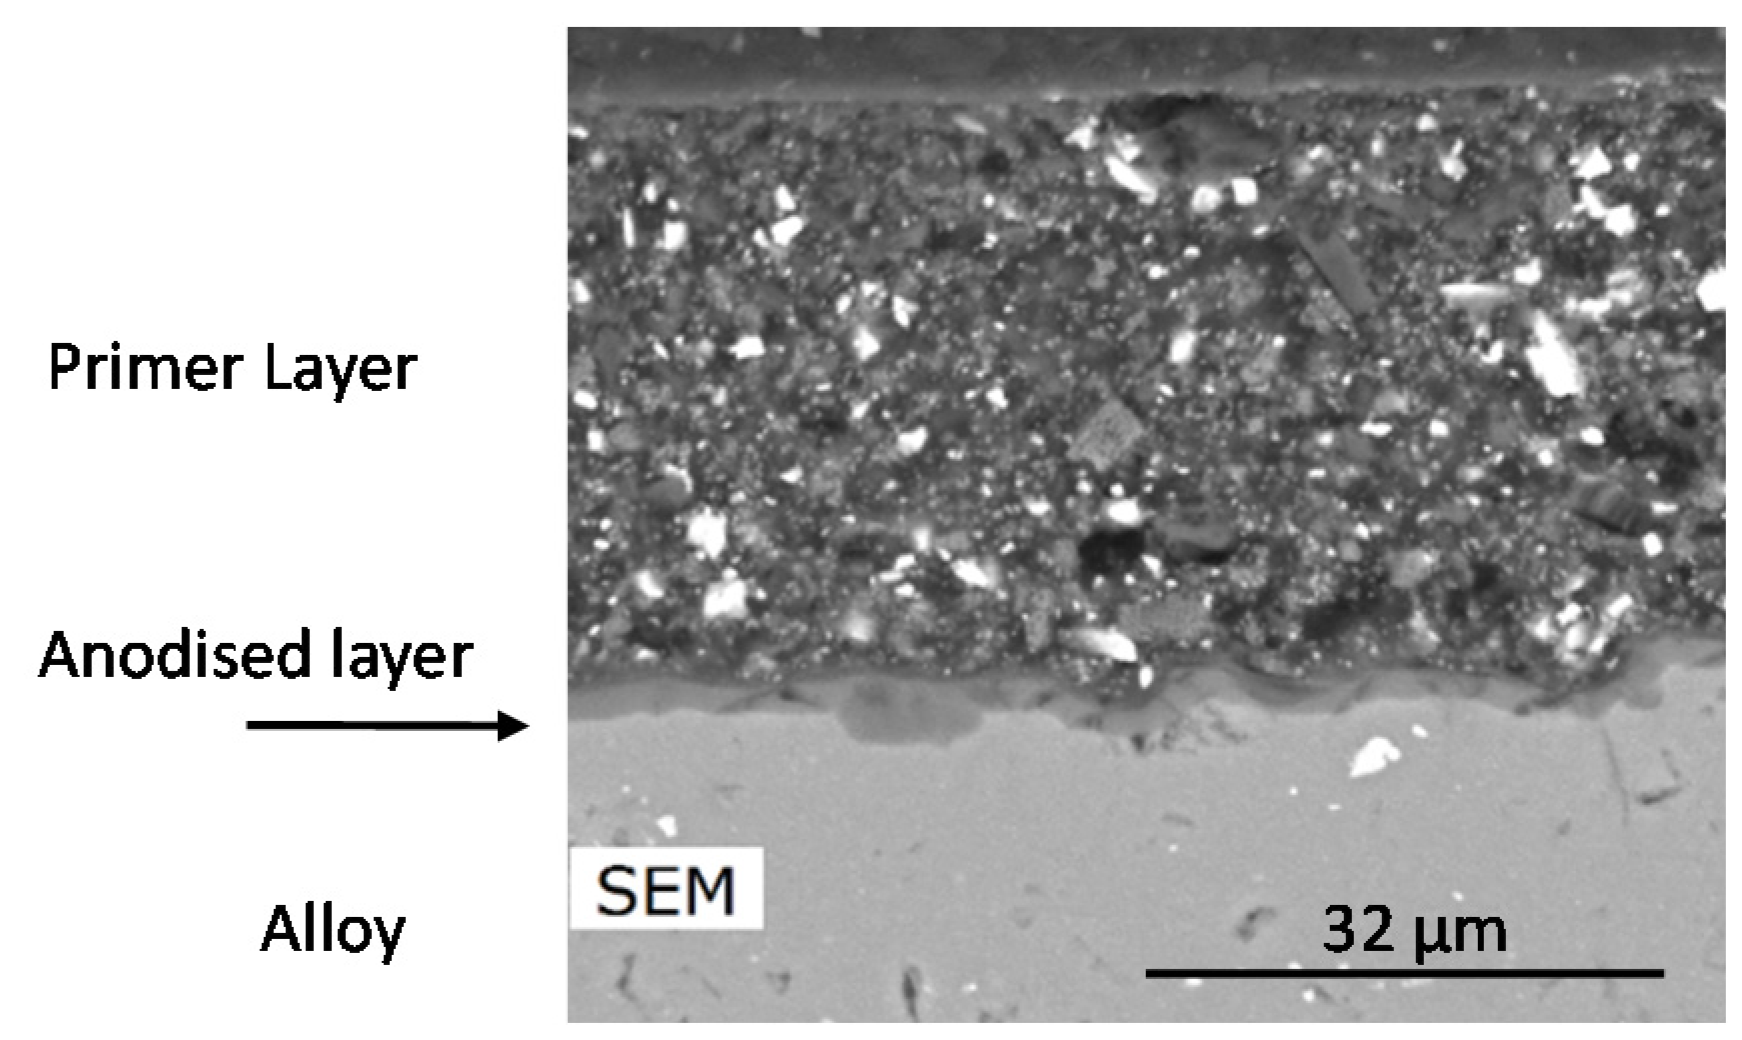
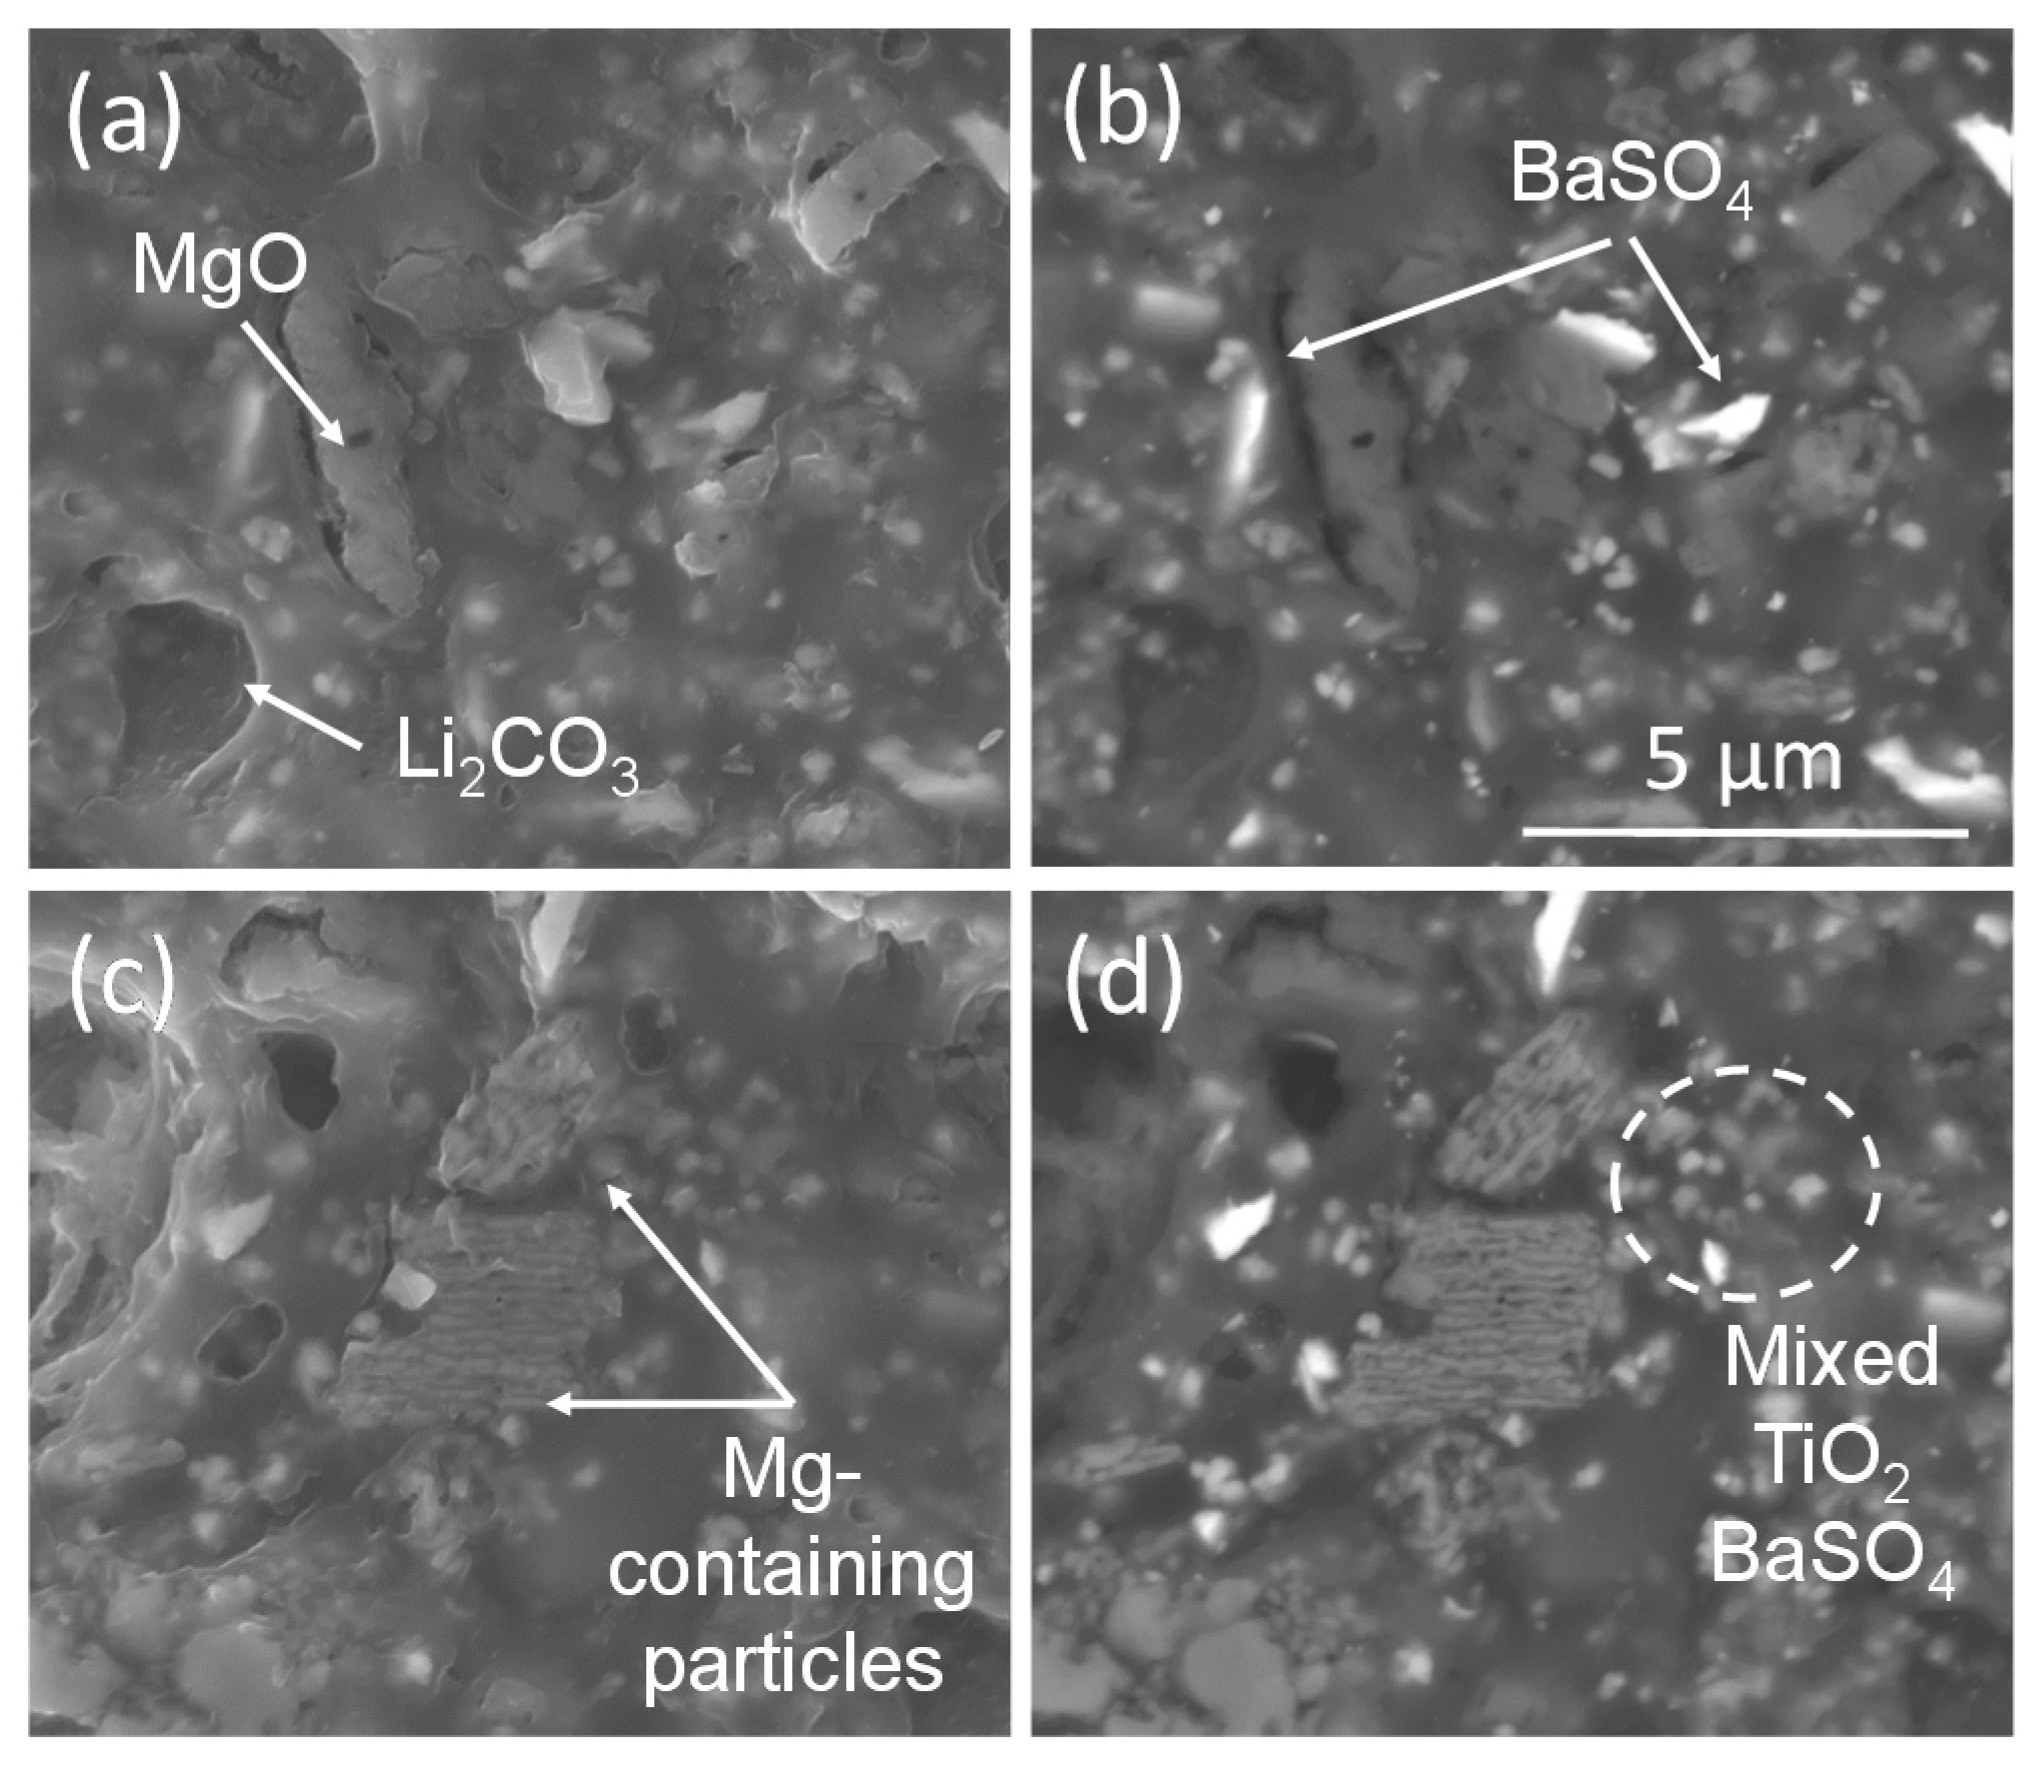
Figure 2 gives an overview of a section through the primer. In this section, the primer had a thickness in the vicinity of 35 ± 5 μm, contained a high level of solids and was applied to an anodised layer that was around 2–3 μm, as described in the Experimental section. The primer itself had a high level of inorganics (PVC was approximately 30%), which is reflected in the high density of particles in Figure 2. The brightest particles in the backscatter image are BaSO4, which are the easiest inorganic components to identify. They are generally angular with a range of sizes (slightly less than 1 μm to over 10 μm, which is consistent with around 90% of the particle sizes for this additive (Table 2)), and an aspect ratio slightly larger than one (Figure 3b). There were another group of particles with very little contrast difference from the polyurethane containing Mg, which were assumed to be a mixture of Magnesium oxides and hydroxides, and will be referred to as Mg-(hydr)oxide in the rest of the paper. In many instances, they appeared to have a layered structure where the layers had a thickness typically 250 nm and lengths with a minimum size of around 1 μm, and typically 5–10 μm (Figure 3c), which was again consistent with the particle size distribution determined from the dispersed particles (Table 2). Mg-(hydr)oxide particles without this structure were assumed to be rotated so that the layers were viewed from the top (Figure 3a). The TiO2 was not easily distinguished on the basis of backscatter contrast, as it was similar to the smaller particles of BaSO4. Finally, there are dark particles (indicated in Figure 3a) in the film that show C and O peaks, but no significant levels of Ba (from BaSO4), Mg (from Mg(hydr)oxide) or Ti (from TiO2), implying that they are probably the Li2CO3 particles (Li cannot be detected in standard EDS). The sizes of these particles were similar to those of the free particle size distribution for the Li2CO3 particles (Table 2). This last category of particles has similar greyscale contrast to voids in the coating, making it difficult to distinguish the two without closer examination.
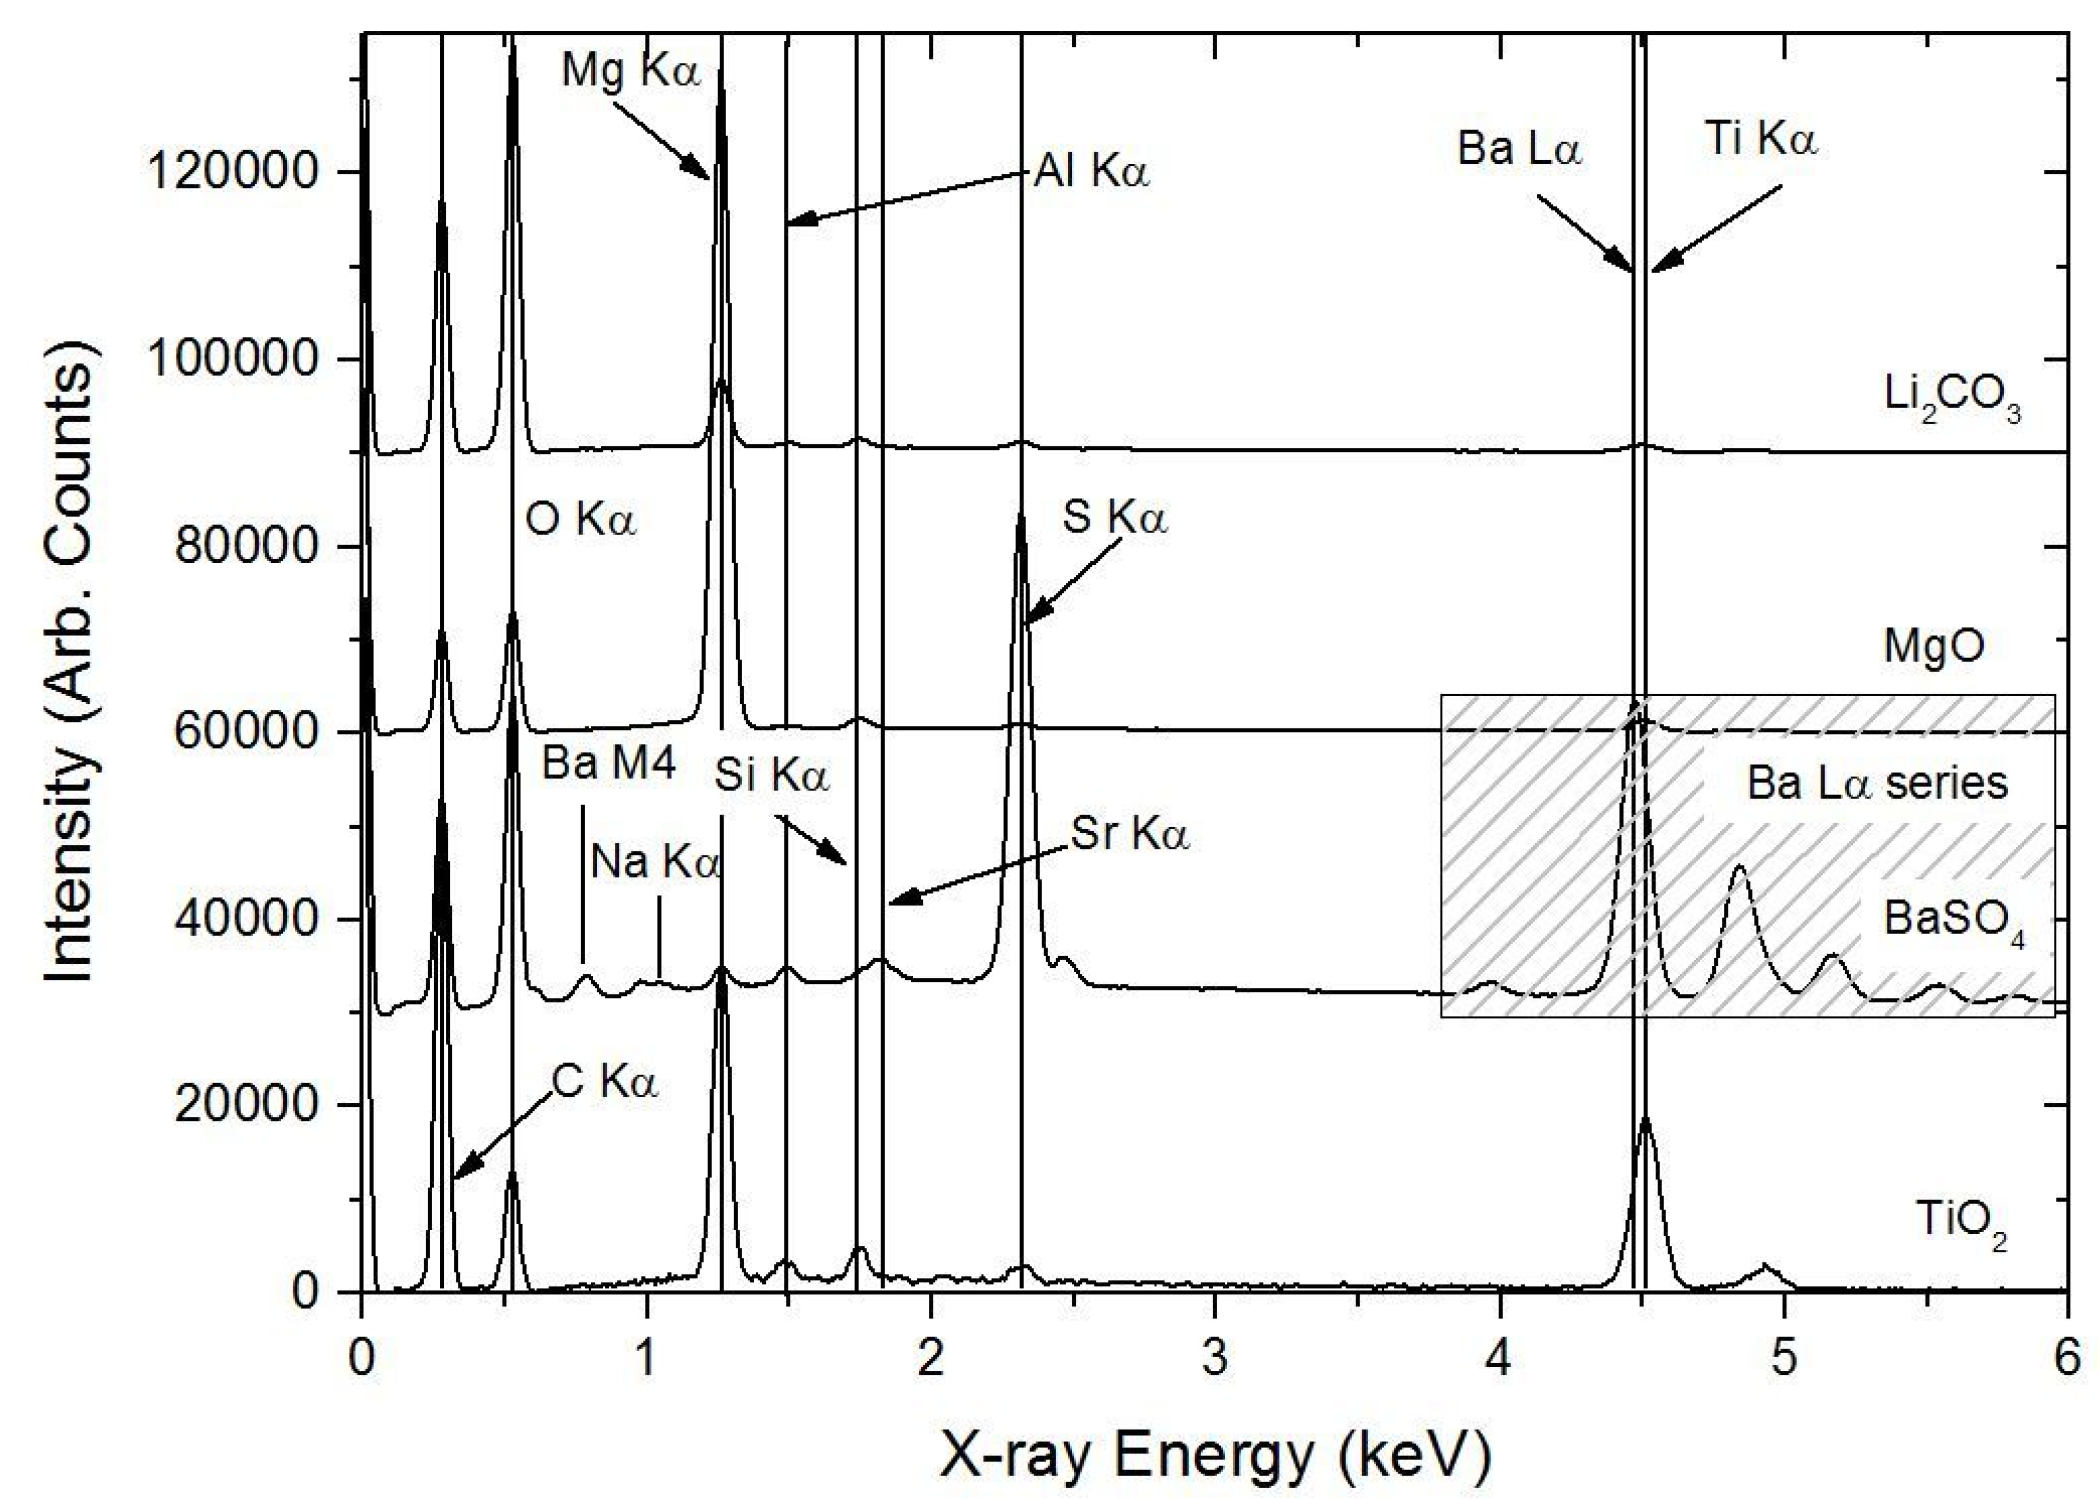
Positive identification of each of the inorganic phases using EDS alone is not straightforward. The inorganic particles sizes ranged from less than a micron up to 10 μm for larger particles, which meant that only the large particles could be sampled using EDS, with some certainty that interaction volume effects had been minimised. This can be seen in their respective spectra, where each type of particle typically contains some signal from other particles due to the interaction volume effect (Figure 4). This effect is largest for the smallest particles, which are the TiO2 particles. Compositions (expressed as ratios of major elements) for the larger BaSO4 and Mg-(hydr)oxide particles are presented in Table 3. The analyses indicate for BaSO4 that the composition is close to stoichiometric, with perhaps a small underestimation of O. For Mg-(hydroxyl)oxide, the data indicates a mixture of MgO and Mg(OH)2. Only C and O were detected in any significant amount for the particles thought to be Li2CO3, but, given that the samples were carbon-coated prior to analysis, it was not possible to conclude anything definitive from the quantitative analyses of these particles. It was not possible to determine the composition of the TiO2 particles because of their small size (Figure 3d). This was not just due to the sampling volume containing some of the polymer matrix, but it might also contain other subsurface inorganic particles (see Appendix).
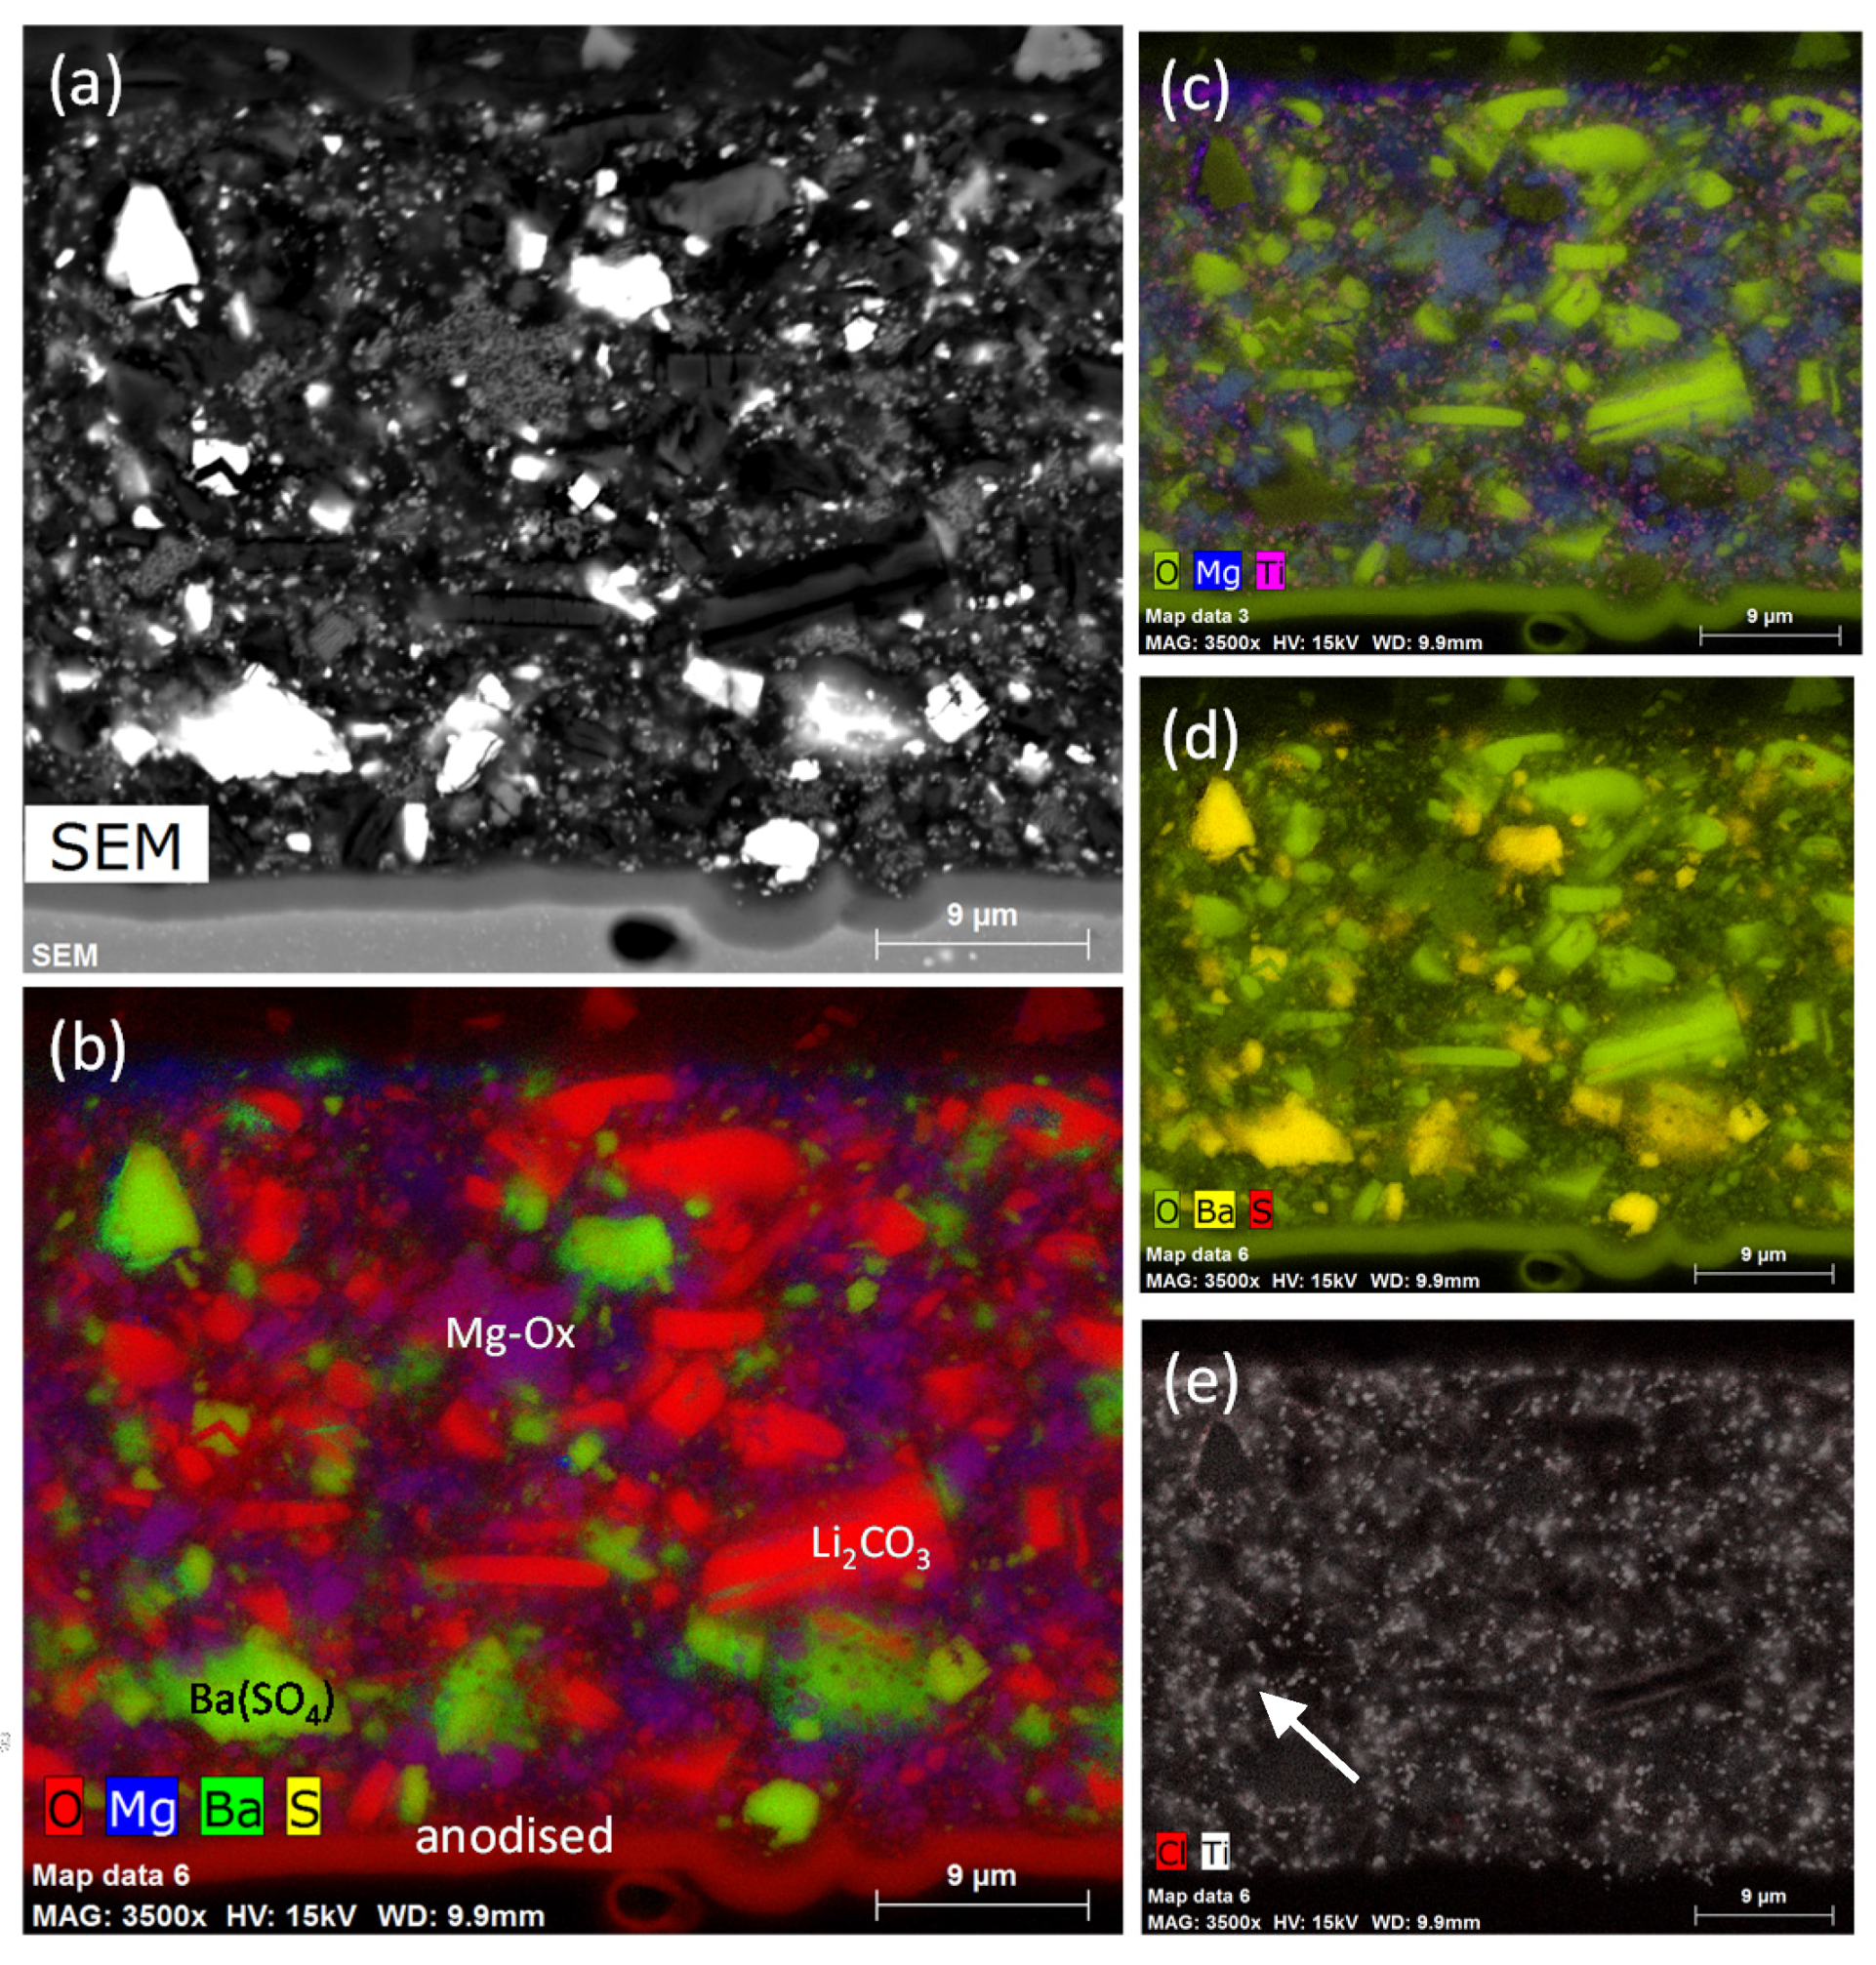
Therefore, as discussed in the appendix, quantitative mapping derived from standardless fitting of the EDS spectra from hyperspectral data was used to generate elemental maps (Figure 5). The backscatter electron contrast shows several different types of particles in the primer cross section in Figure 5a, and the phases are identified in Figure 5b, which is a four-colour map of O (red) Mg (blue), Ba (green) and S (yellow). Figure 5c shows the Ti-containing particles (pink), the BaSO4 particles, and highlights the Mg-(hydr)oxide particles. In both Figure 5c,d, there are particles containing O, but none of Ti, Mg or Ba; these particles are attributed to Li2CO3. Figure 5a–d all show an oxide at the interface, which is the anodised coating. S was detected in this layer, presumably due to the incorporation of SO42− ions from the anodising process (Figure 5c) [57].
From Figure 5c, it can be seen that there was a homogeneous distribution of Mg-(hydr)oxide particles in the coating, with larger particles appearing to be randomly distributed throughout the coating. The smaller Mg-(hydr)oxide particles also appear homogenously distributed within the coating. Similarly, Figure 5c suggests a homogeneous distribution of TiO2 particles. The large BaSO4 particles tend to be present as small clusters of two or three particles, which are randomly distributed throughout the coating, whereas the smaller BaSO4 particles appear more evenly distributed. Finally, Figure 5e is a map showing the Ti and Cl distribution. There is only one region where a very small Cl signal was detected (in the vicinity of the tip of the white arrow in Figure 5e at the periphery of a BaSO4 particle). The rest of the contrast is due to the presence of Ti. This image is included for later comparison with the samples that had undergone 500 h exposure to NSS, and is discussed later.
3.1.2. PIXE/PIGE
As reported in the experimental section for the PIXE and PIGE, data analysis begins with the summed spectrum for the complete mapped region. In PIXE, maps are generated by fitting the X-ray spectrum, removing the background, and mapping the net counts under the peaks for the elements of interest. In PIGE, elemental maps were generated by determining the net counts under respective peaks after a local linear background subtraction.
A typical X-ray spectrum (PIXE) extracted for the primer is presented in Figure 6a. The position of the X-ray peaks are the same as in normal EDS, since they involve normal K- and L-series lines; however, the lines are generated by proton interaction rather than electron interaction as in normal EDS. The PIXE spectrum of the AA2024-T3 is shown in Figure 6b. In the spectrum from the primer (Figure 6a), the major peaks are Ti, Ba, Fe, Cu, Zn and Zr. Since the primer includes additives such as TiO2, BaSO4 (and SrSO4 as impurity) and Li2CO3, the Ti, Sr and Ba peaks can be attributed to these species. The Zr may arise from a coating applied to the TiO2, since Al and Zr compounds are used to stabilise the TiO2 particles (Table 1). While the Ba and Ti signals overlap in EDS spectra and maps from the SEM, this effect is considerably reduced in PIXE, because the Ba Kα lines dictate the intensity in the Ba Lα lines in the 5.0–7.5 keV region of the spectrum. Thus, there is only a small residual signal of Ba in the Ti map arising from residual fitting errors.
Individual PIGE spectra for the primer and the AA2024-T3 can be extracted from the maps, and typical examples are shown in Figure 6c,d, respectively. The ϒ-ray spectrum (PIGE) shows Li (peak positions), Al and Mg. Peaks labelled “back” arise from laboratory background signals and are not part of the sample. The Li peak at 429 keV was used for the determination of the Li distribution. For the AA2024, Figure 6d only shows the Al and Mg signals.
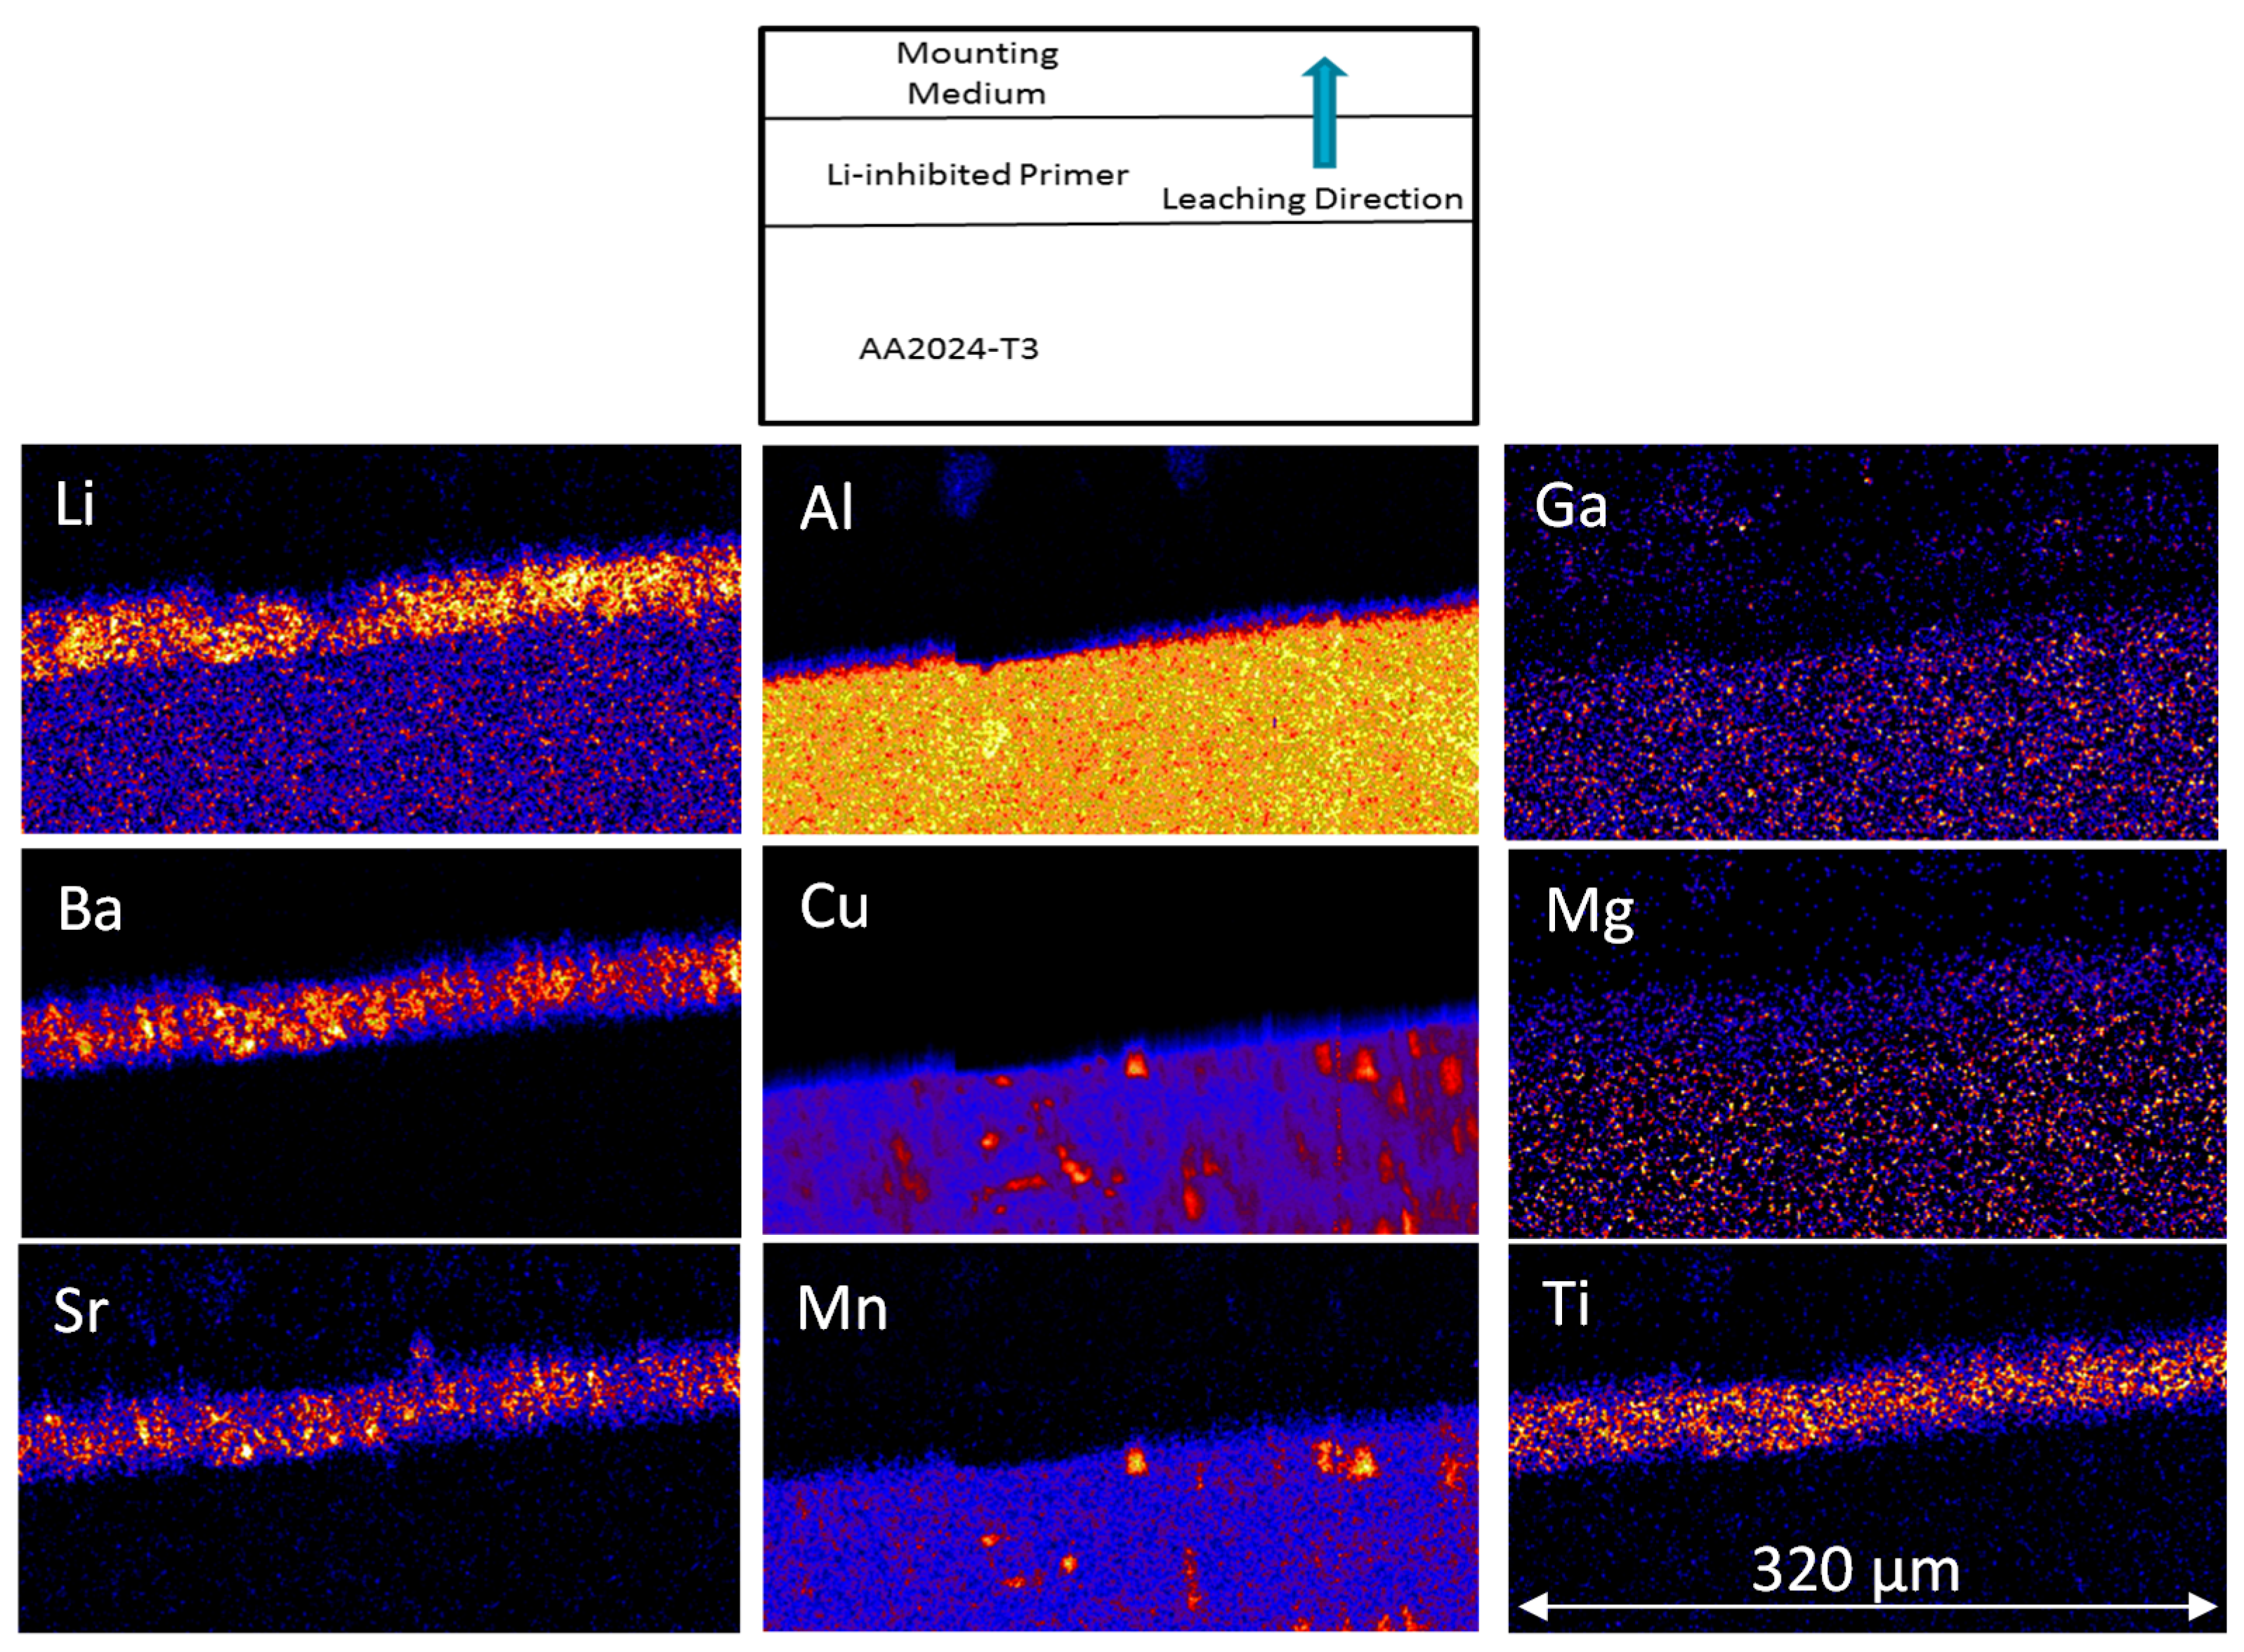
The combined PIXE and PIGE maps for a region of a sample prior to leaching is shown in Figure 7. The Li, Ba, Sr and Ti maps clearly show that these elements are present in the coating. Sr is an impurity in the BaSO4, and is probably present as SrSO4 (Table 1). It should be pointed out that some of these elements are present in very low levels, and it is only through the sensitivity of PIXE that they are detected at all.
With respect to the AA2024-T3, the PIXE spectrum of the AA2024-T3 substrate (Figure 6b) shows Al, Cu, Mn, Fe, Zn, Ga and Zr. The Zr may be an additive used in the formation of ZrAl3 used for grain refining [58]. Cu and Mn were detected both in the matrix and constituent IM particles, and Fe only in the constituent particles [59,60,61,62,63,64,65,66,67]. The presence of Cu and Mn in the matrix can be explained by a small but significant solubility of Cu in Al, as well as Cu and Mn being present in a number of IM particles (hardening precipitates (Cu) and dispersoids (Al20Mn3Cu2)), which are much smaller than the resolution of the technique [68]. Elements such as Ga have been reported before when using Rutherford Backscattering spectroscopy (RBS) to examine aluminium alloys [69]. In some Al-alloys, Zn is used for precipitate hardening using the ƞ-phase (Zn2Mg) in 7xxx series alloys [70] but, again, it is not expected as an alloy addition here, even though Zn is detected in the AA2024-T3 sheet product [60]. In this study, it is associated with Cu-containing constituent particles, and may be present as an impurity from a mixed stock starting material used to manufacture the AA2024.
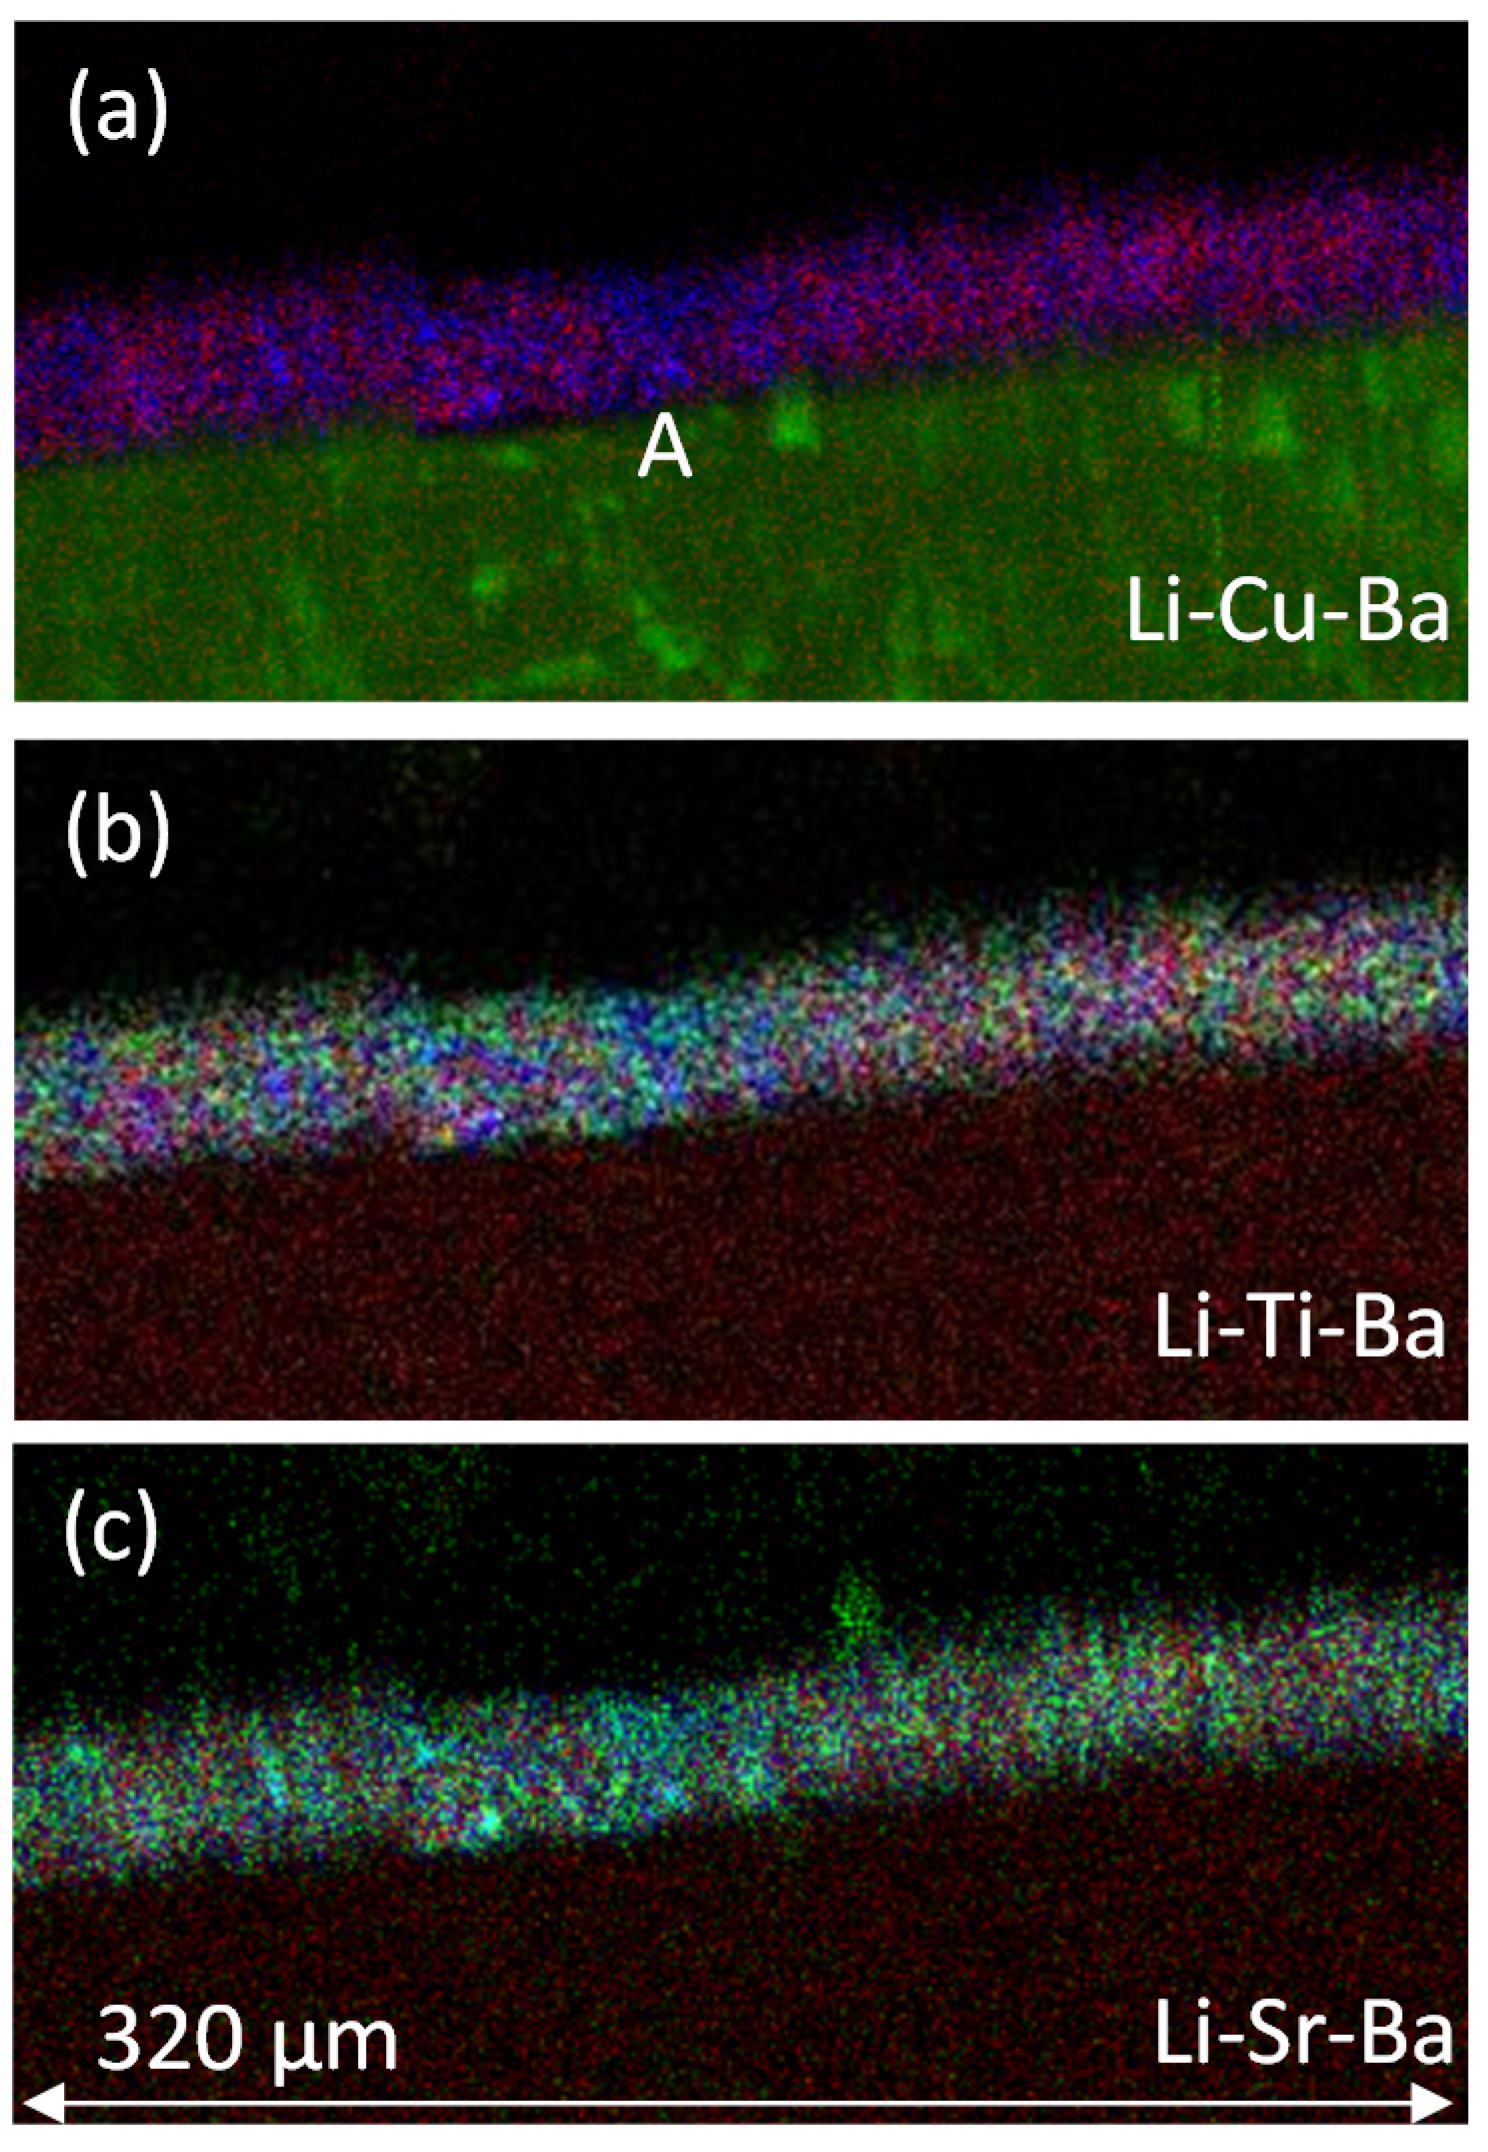
Figure 8 shows three-colour maps of the primer region, where Li is in red and Ba is in blue for all these maps, and green reflects the changing element. The Li-Cu-Ba map indicates the distribution of the Li2CO3 (red) and BaSO4 (green) particle distributions within the primer, and the Cu (green) reveals relationship of the primer to the AA2024-T3 substrate. The dark band separating the AA2024-T3 from the primer in the Cu map coincides with a purple strip in the Al map on top of the metal. In the middle and top maps, blue is the anodised layer. In the Li-Sr-Ba map, Ba-containing particles are light blue, indicating a mixing of the colours associated with the Sr (green) with the Ba (blue), which confirms the presence of SrSO4 in the BaSO4. From these maps, it is clear that there are regions that are rich and poor in Li2CO3 particles. These regions can be as deep as the coating itself (e.g., point A in Figure 8a) and 20–30 μm wide. There was no suggestion of layering in these maps.
3.2. NSS Exposure and Li Depletion in the Primer
3.2.1. SEM/EDS
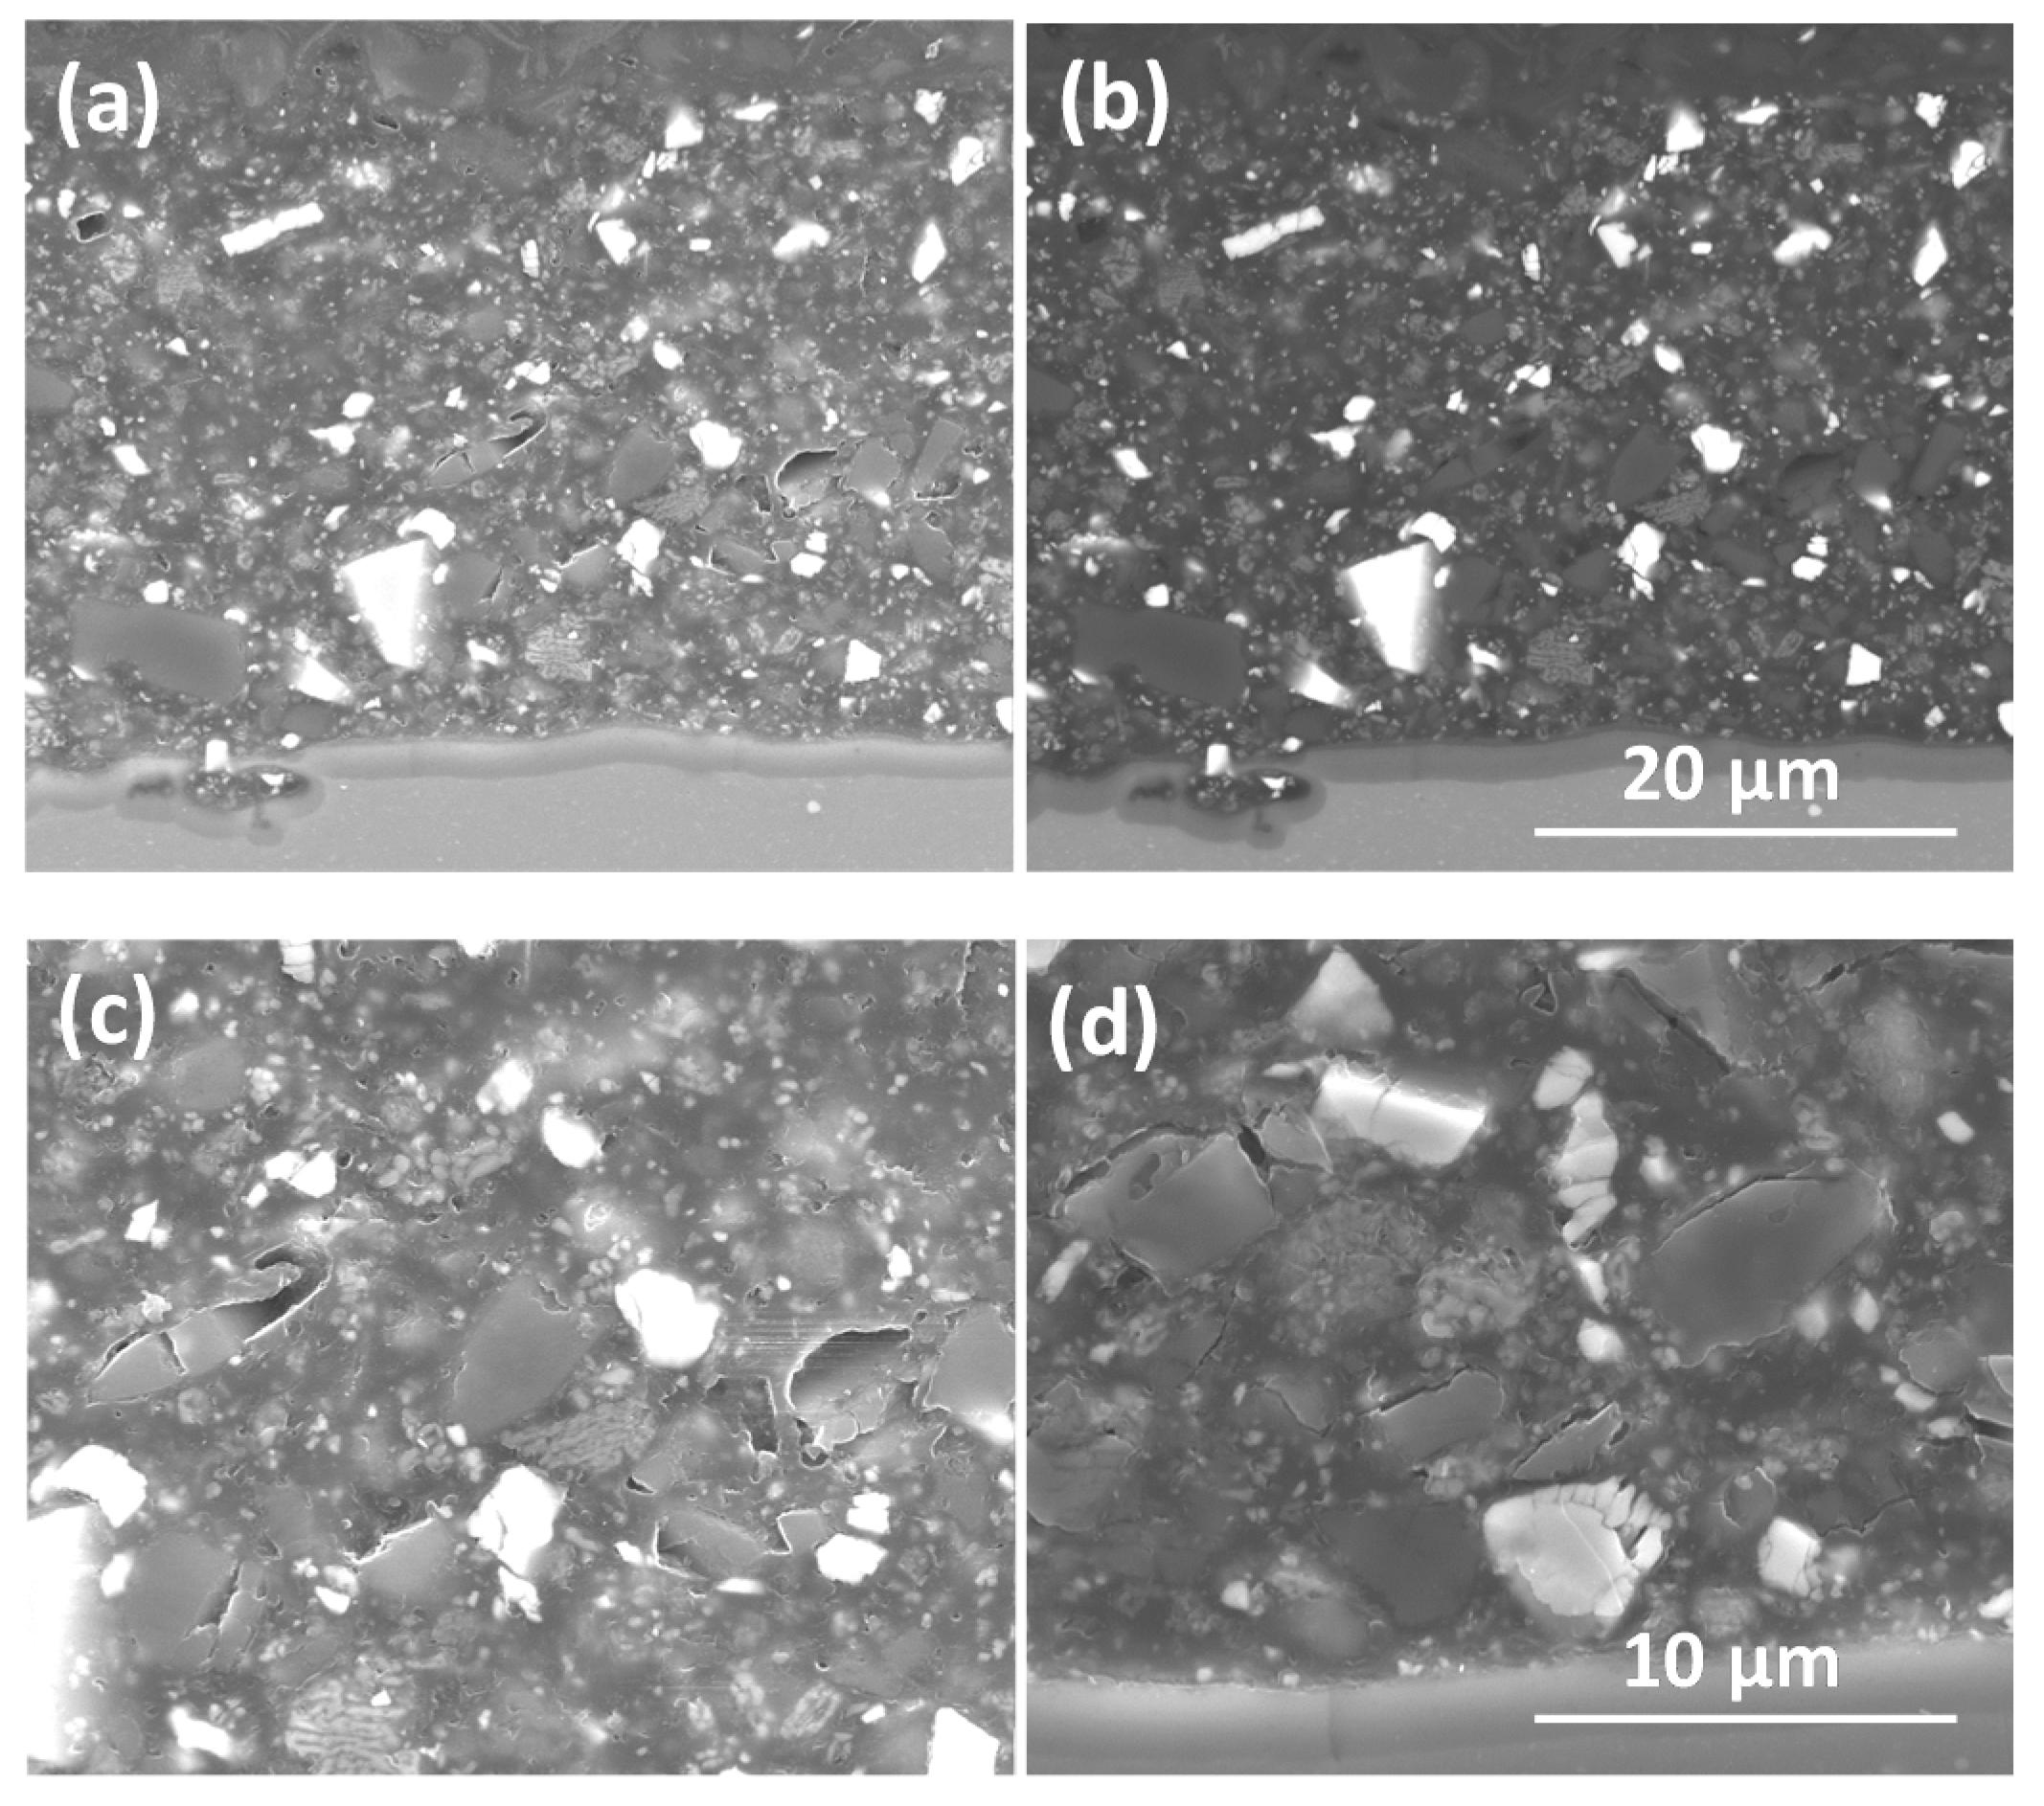
As can be seen from Figure 9, exposure to NSS for 500 h resulted in the generation of voids in the primer, which is assumed to be due to the loss of Li2CO3 particles. At low magnification, it is difficult to determine the depth of depletion due to the contrast similarity between the Li2CO3 particles and voids created by their dissolution. On closer examination of individual sites, however, it was clear that the depth of Li2CO3 depletion varied considerably from place to place along the section of the primer. In some places, the removal of Li2CO3 particles was from quite deep into the primer to near the metal/primer interface. Examples in Figure 9a shows the presence of voids due to partial/complete dissolution of particles, and is magnified in Figure 9c. These voids appear approximately halfway through the depth of the coating. Figure 9d shows the development of interfacial voids between the Li2CO3 particles and the polyurethane matrix, in this instance near the primer/anodised/metal interface. Moreover, channels were often observed at the base of some of these voids, suggesting that they are not isolated, but connected to other voids. The delamination between the inhibitor particles and the polyurethane indicates the possible development of further transport networks within the coating system, as well as changes in chemistry at the interface between these particles and the polyurethane.
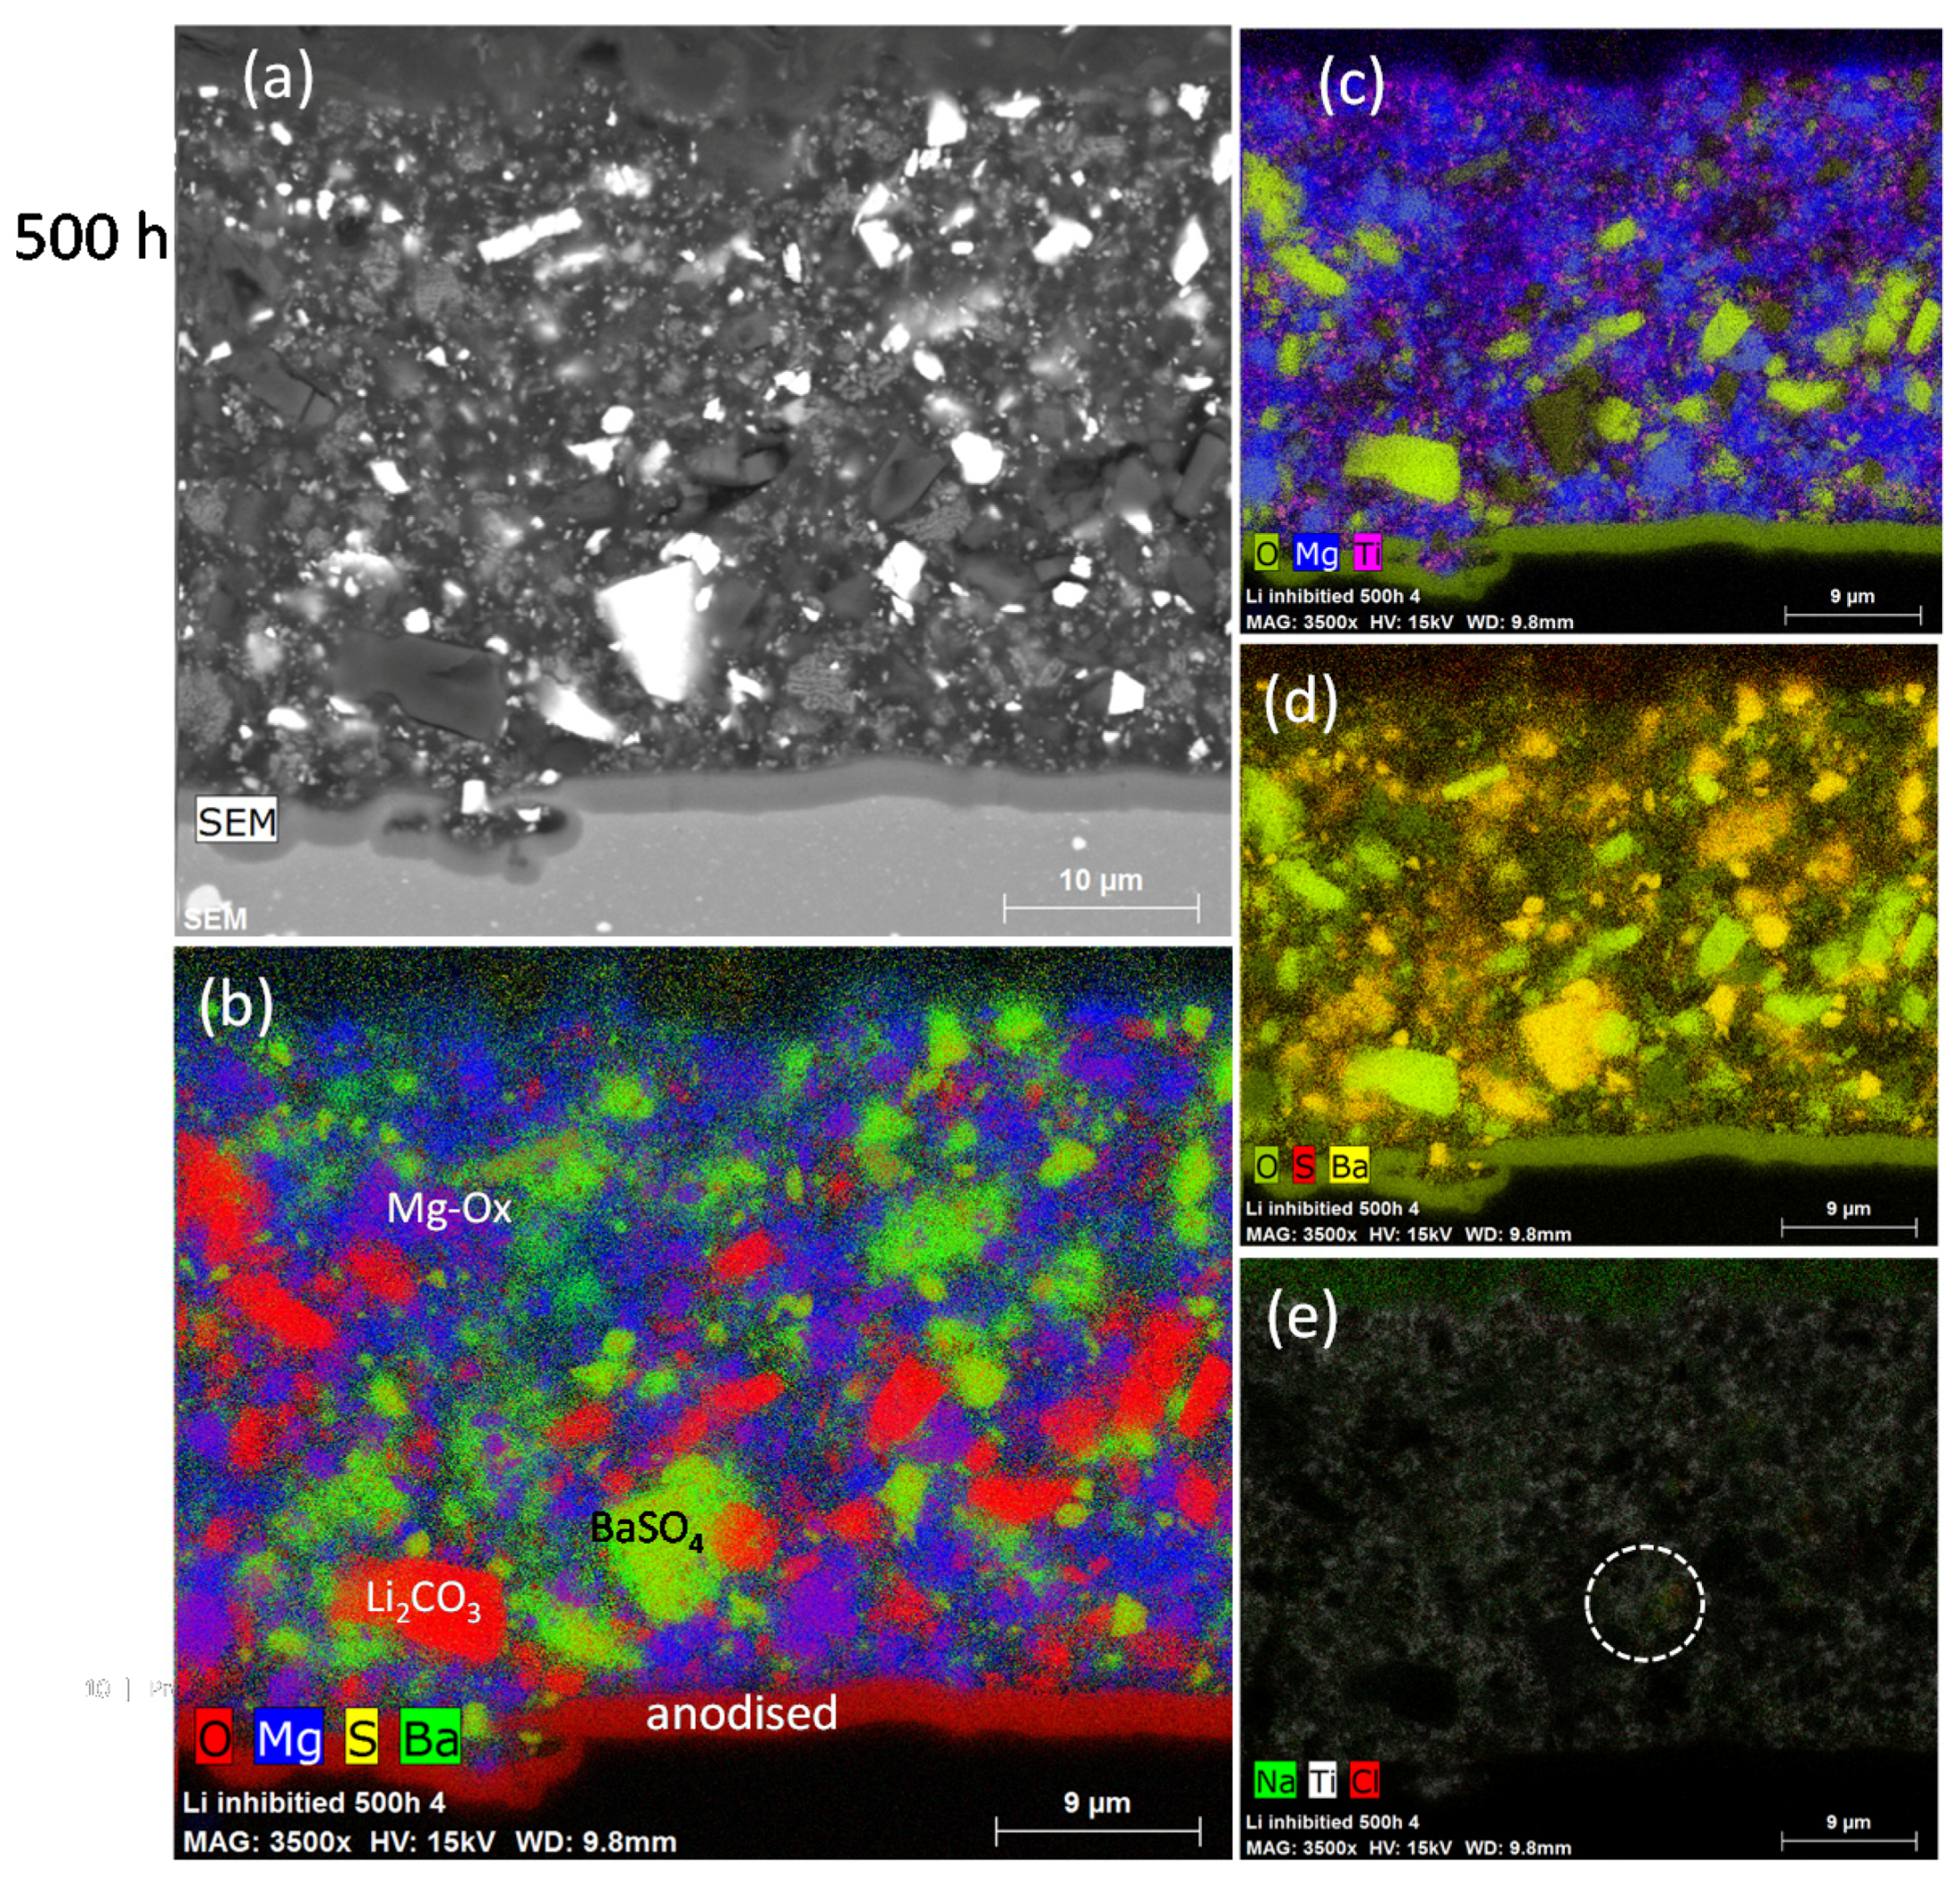
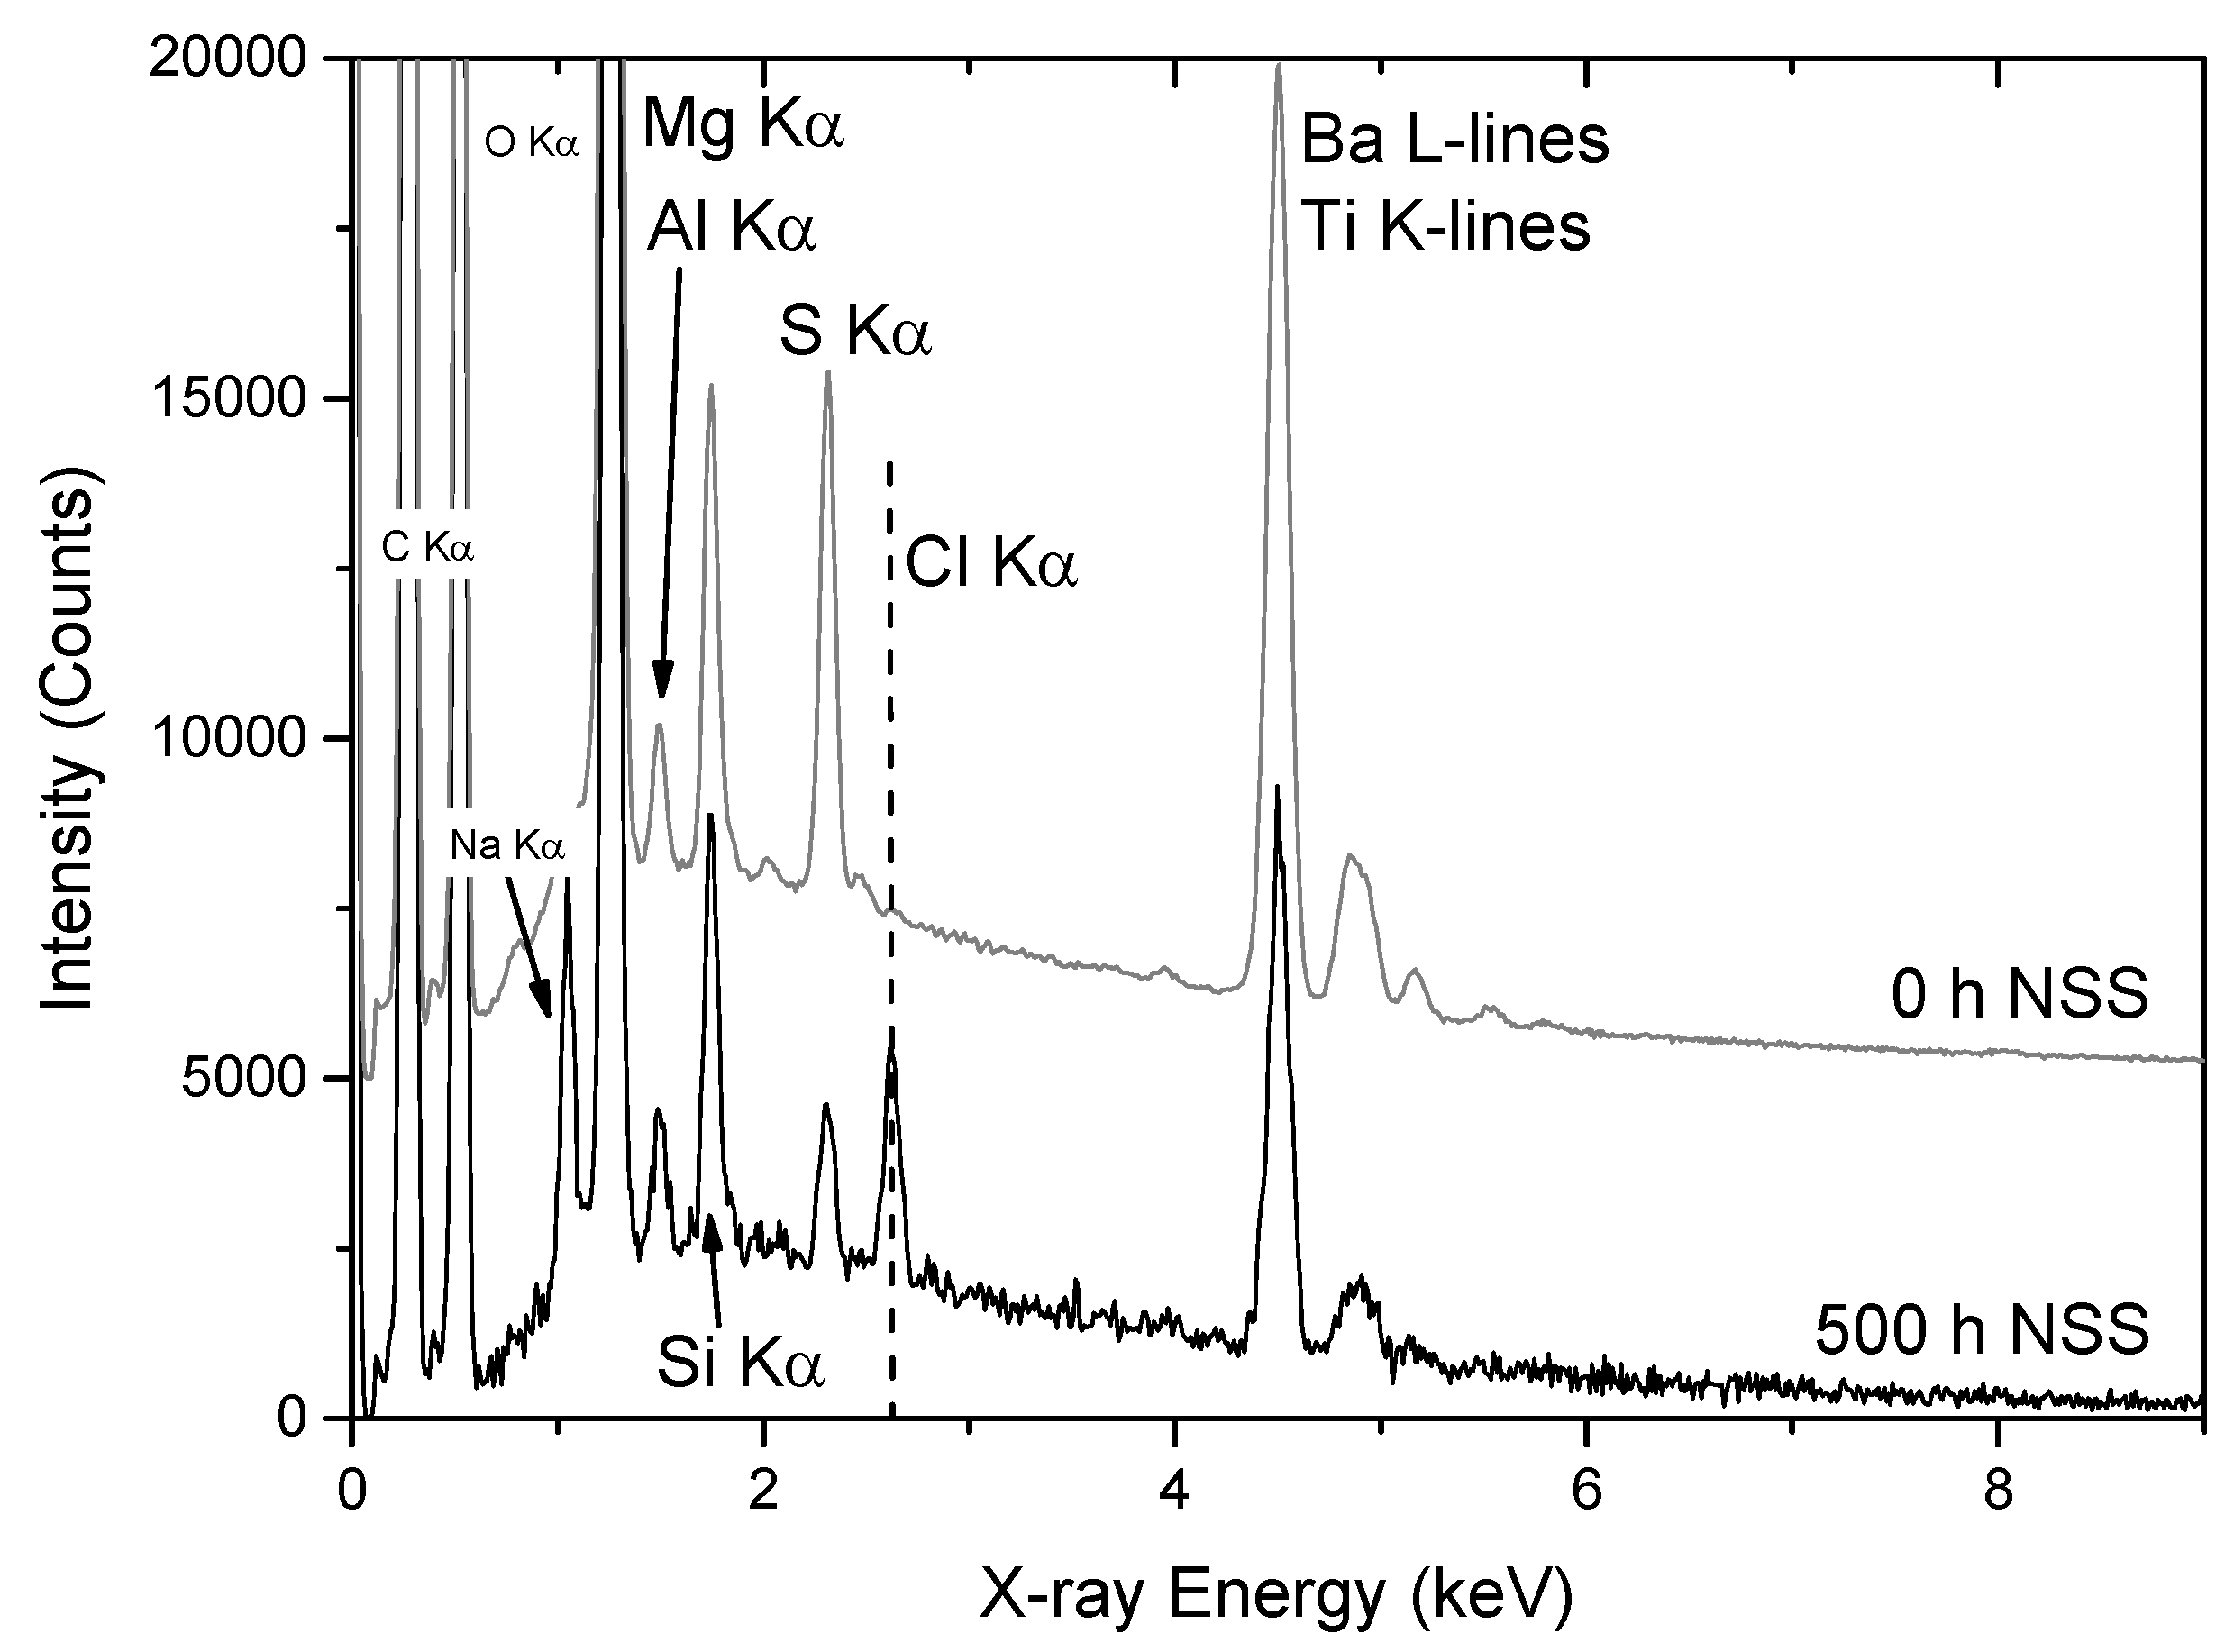
Figure 10a shows a backscatter image of a section of the primer with the various inorganic additives as discussed above. The quantitative maps in Figure 10b and c show that there is an absence of large particles near the surface, which only have an oxygen (and carbon) signal and inferred to be Li2CO3. The Mg-(hydr)oxide, TiO2 and BaSO4 distributions appear to be similar to those of the primer without NSS. However, the quantitative analyses show that S and O decrease after NSS exposure of the BaSO4, perhaps suggesting a loss of sulphate ions (the loss of S is roughly 25% the reduction of O) (Table 3). The Mg-(hydr)oxide data shows that the Mg:O ratio has decreased from 1:1.6 to 1:1, suggesting that a mixture of MgO and Mg(OH)2, present prior to NSS, may have been transformed to MgO after NSS exposure. The origin of this transformation is unclear, since MgO is more soluble than Mg(OH)2 under a range of conditions [70], and it would be expected that exposure to the electrolyte would result in an increase in the hydroxide. Lastly, it is worth noting that Cl was detected in the coating after NSS exposure, whereas it was not detected prior to NSS (Figure 11). In the sample after NSS exposure, the chloride appeared to be confined to the polyurethane and was not in either the voids left by the dissolution of the Li2CO3 particles or delamination around them (Figure 11). As, an example the spectrum from the region indicated by the circle in Figure 10a is shown in Figure 11. The implications of these results will be discussed in more detail below.
3.2.2. PIXE/PIGE
PIXE and PIGE maps are presented in Figure 12 for Li, Sr and Ba sections of the samples prior to NSS and after 500 h NSS. The PIGE results represent an average over approximately 60 μm depth perpendicular to the X-section of the coating, and thus the average over several particle diameters. The maps show that Li is locally concentrated into small regions typically 2–10 μm in size, reflecting the particle size distribution. There is also some suggestion that these features are themselves interconnected, since the smaller features tend to form larger extended structures, suggesting the presence of clusters of Li2CO3 particles [71]. In the sample that has not been exposed to NSS, there is a clean boundary between the primer and the mounting medium. After 500 h NSS exposure, there is a zone completely depleted of Li2CO3 particles in the surface of the primer, as determined by comparing the Li distribution with the Ba distribution, and indicated by the parallel white lines. The depth of this depleted zone is 11 ± 8 μm (Table 4). However, there are also regions where there is a local, selective removal of individual particles or clusters of particles of Li2CO3 that penetrate much deeper into the coating. While this cannot be directly confirmed from the PIXE/PIGE, since the Li2CO3 distribution prior to NSS exposure is unknown for any particular region, the SEM clearly shows voids quite deep within the coating, suggesting selective dissolution paths (Figure 9).
3.3. Measurement of Li-Depletion
The above data show that Li depletion manifests itself in several separate ways, meaning that there isn’t a single metric to describe it. Thus, the depletion depth needs to be determined by inference from the different types of data collected here. In this section, three different approaches to measuring depletion depth are presented.
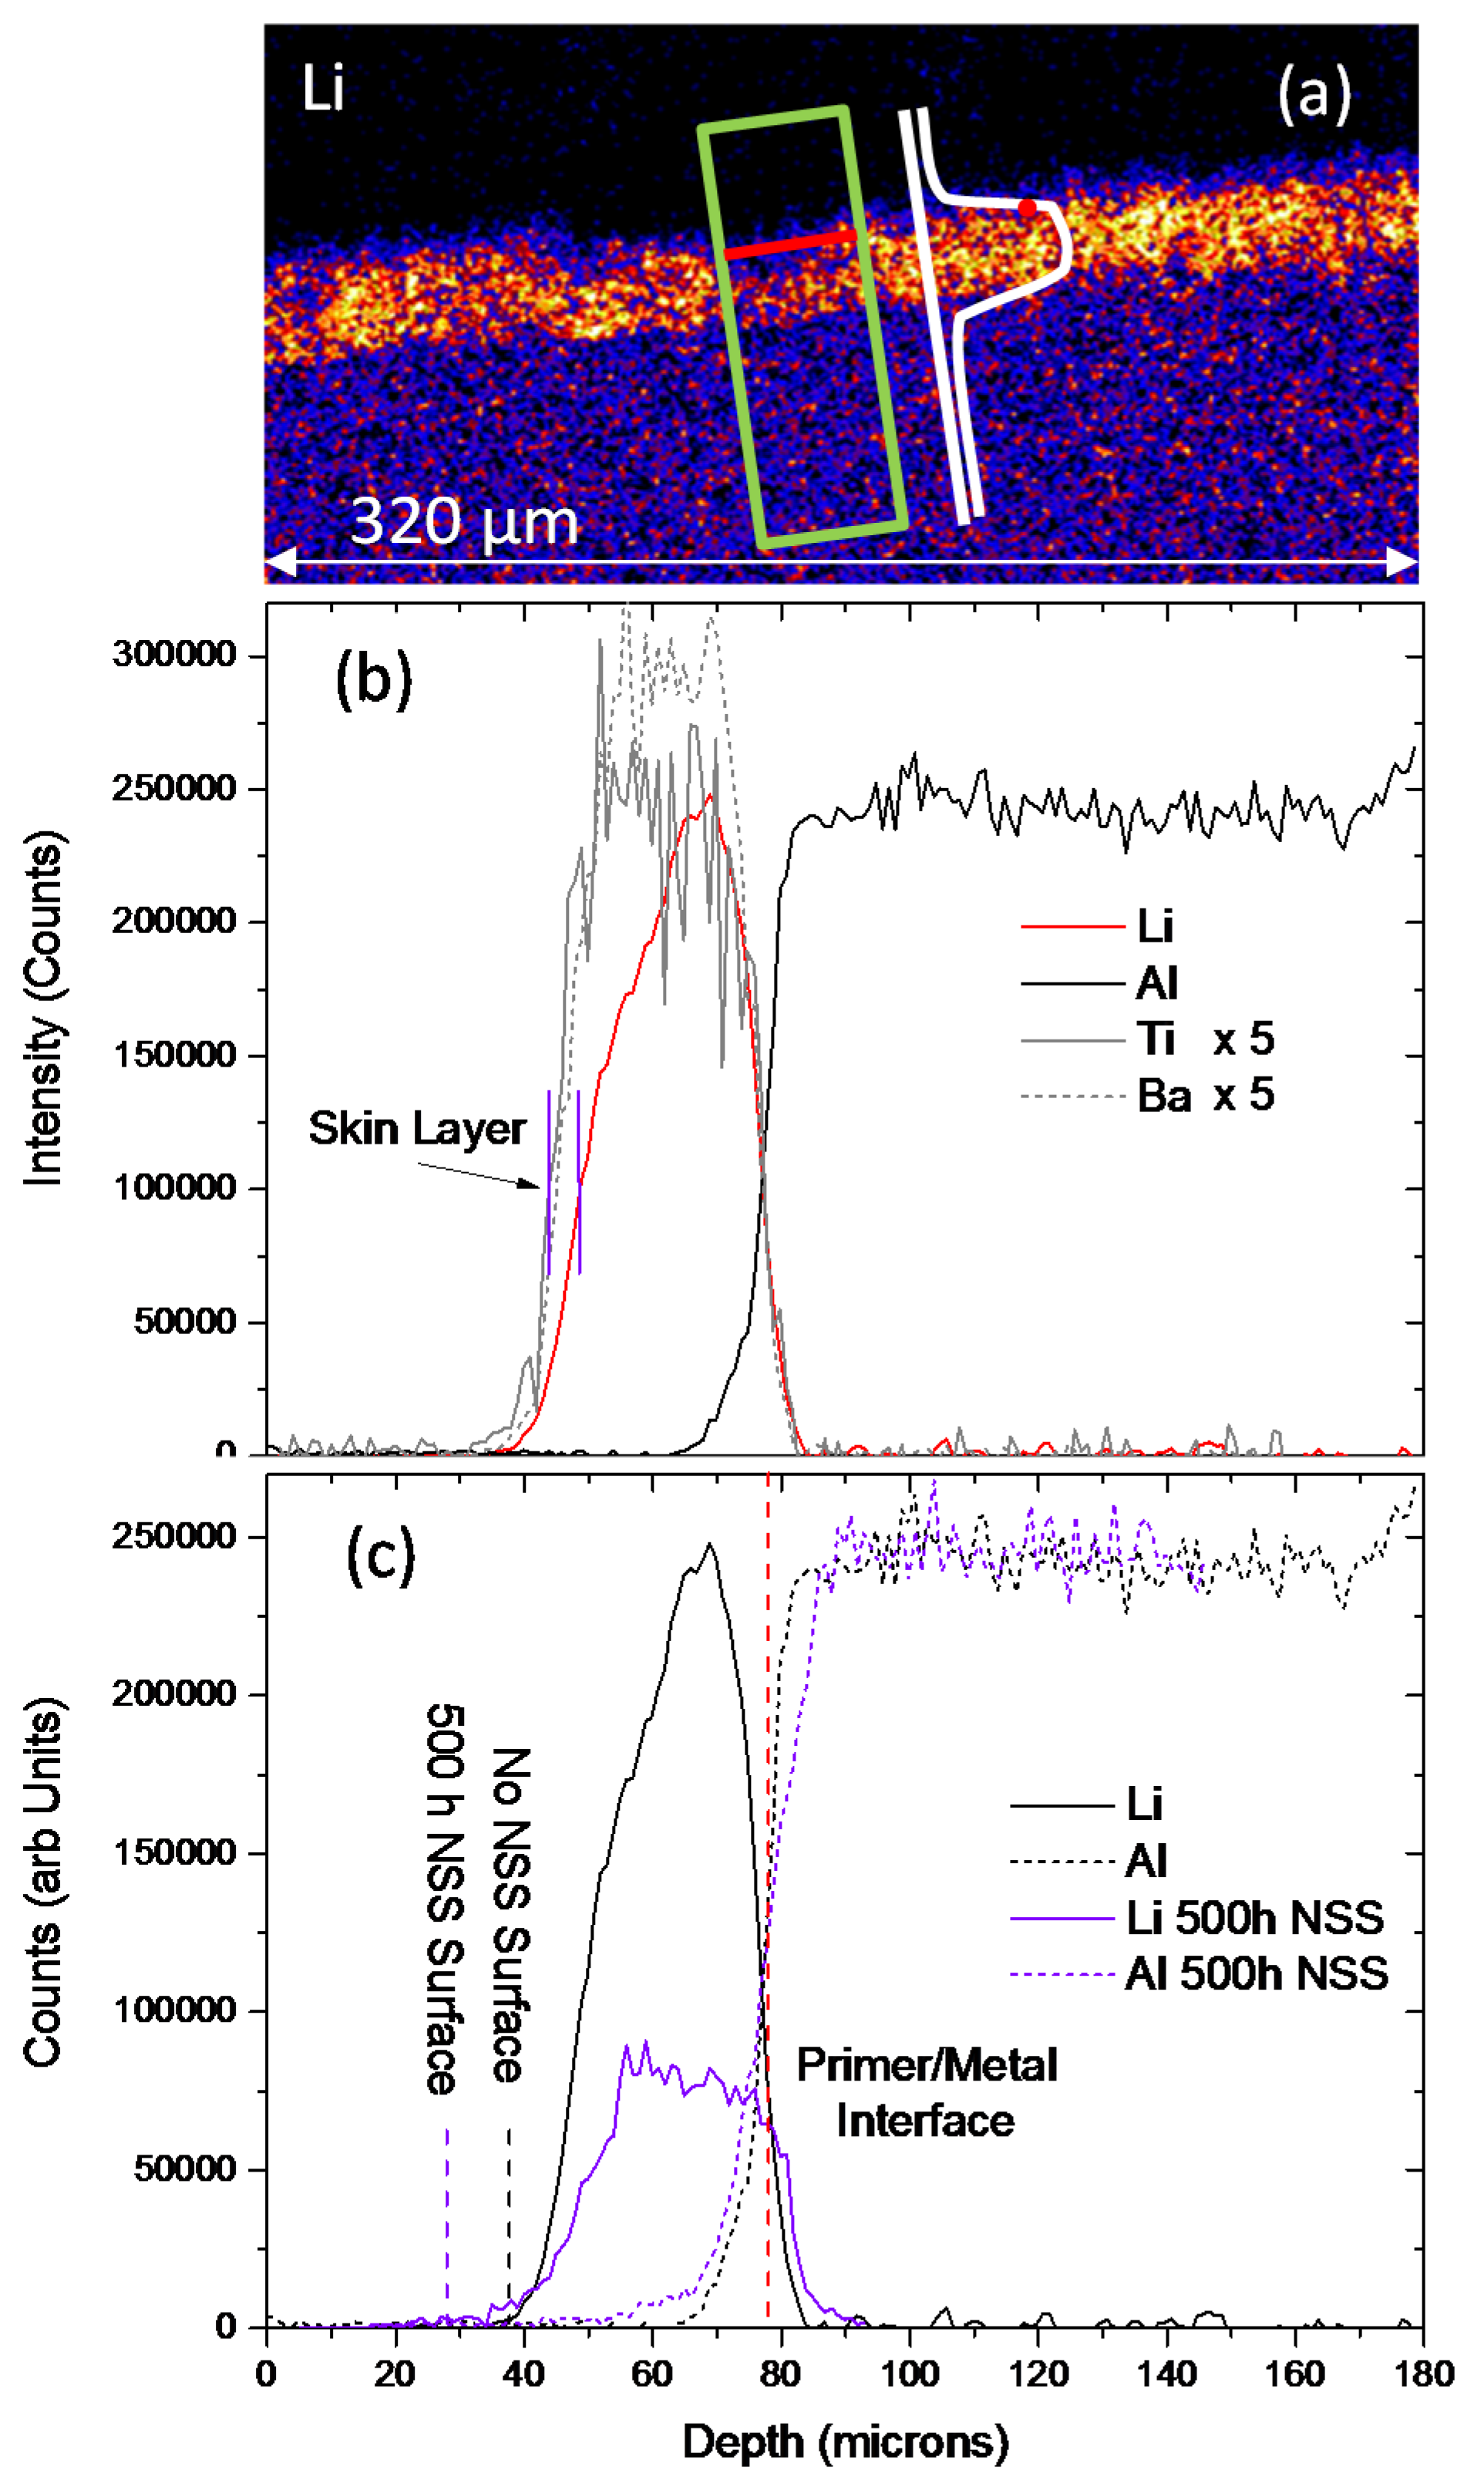
The first method is based on elemental line profiles across the coating using traverse profiles by analysis of the PIXE/PIGE data as displayed in Figure 13. These are constructed by first choosing a region for the profile, as shown by the green box in Figure 13a. The average counts along a number of lines (e.g., the red line) at fixed spacing are then determined to produce a point (red point) in the line profile. Thus integrated elemental profiles for Ti, Ba, Li and Al across sections of the primer are generated and presented in Figure 13b for the sample without exposure to NSS and that exposed for 500 h (Figure 13c). In this case, Ba and Ti profiles were used as indicators of the coating thickness based on the assumption that their distributions were unaffected by NSS exposure. (The thicknesses determined using the Ti maps tended to be slightly larger than those determined from the Ba maps, which may be due to the Ti particles being finer and closer to the surface of the film). The width of the profiles shown in Figure 13 are larger than would be obtained from individual line profiles, because the traverse method averages along a line (red line) at a particular depth through the cross section of the primer, and thus incorporates surface variation, such as roughness. Figure 13b shows Ti, Li, Ba and Al traverse profiles for the sample without NSS exposure. The average thickness was 33.7 ± 2.4 μm, which was determined from five measurements across the coating. (Note: This is different from the SEM measurement since it is a different region of the sample.) In repeated measurements, the Li profiles showed that there was a region near the surface where there was a lower concentration of Li for the sample without NSS exposure. Such a region is indicated in Figure 13b and labelled the “skin layer”. This may be due to fewer smaller Li2CO3 particles compared to the other additives (Table 2). The thickness of this zone of lower concentration (skin layer) appeared to be in the vicinity of 3–5 μm, as determined from line scans (not the traverse method).
The thickness for the sample exposed for 500 h to NSS was 45.4 ± 6.5 μm, which was determined in the same fashion as the sample without NSS exposure. In this instance, the depleted zone near the surface was in the vicinity of 11 μm (Table 4). As stated in the experimental section, the actual Li concentrations are difficult to determine in a complex matrix such as the polyurethane with a heterogeneous distribution of inorganic additives. However, in Figure 13c the Al PIGE profiles have been adjusted to have the same level of counts in the metal, which allows a qualitative comparison of the Li profiles. The position of the surface is indicated for both profiles, remembering that the two samples have different coating thicknesses. It can be seen that there is depletion of Li from a greater depth into the primer for the coating exposed to NSS for 500 h. Moreover, there is significant Li depletion from the body of the coating to around 30% of the level in the sample without NSS, indicating a depletion of Li from within the coating. This is probably due to dissolution of the surface on Li2CO3 particles, which are deeper in the coating.
A second method for determining the depletion depth was applied based on the local absence of Li from the PIGE Li map of the cross section of the film. In this method, the local depletion of Li was assessed compared to the thickness of the primer coating, as shown in Figure 14a (white dashed line). A drawback of this method is that the Li2CO3 distribution prior to the NSS exposure is unknown, so, while the absence Li2CO3 particles in any particular region of the primer coating is assumed to be due to inhibitor loss, in reality it will include regions where there were no Li2CO3 particles to start with. As expected, the depletion measured using this method shows a larger zone of depletion for the 500 h NSS exposure sample than the sample without exposure to NSS (“SEM 500 h NSS” under “Deepest Depletion” Table 4). The absence of Li at the top of the coating with 500 h NSS exposure is inferred from the EDS measurements presented in Figure 10b. This provides the second method for depletion thickness determination being in the region 9–12 μm, which is similar to that measured using the PIGE traverse approach.
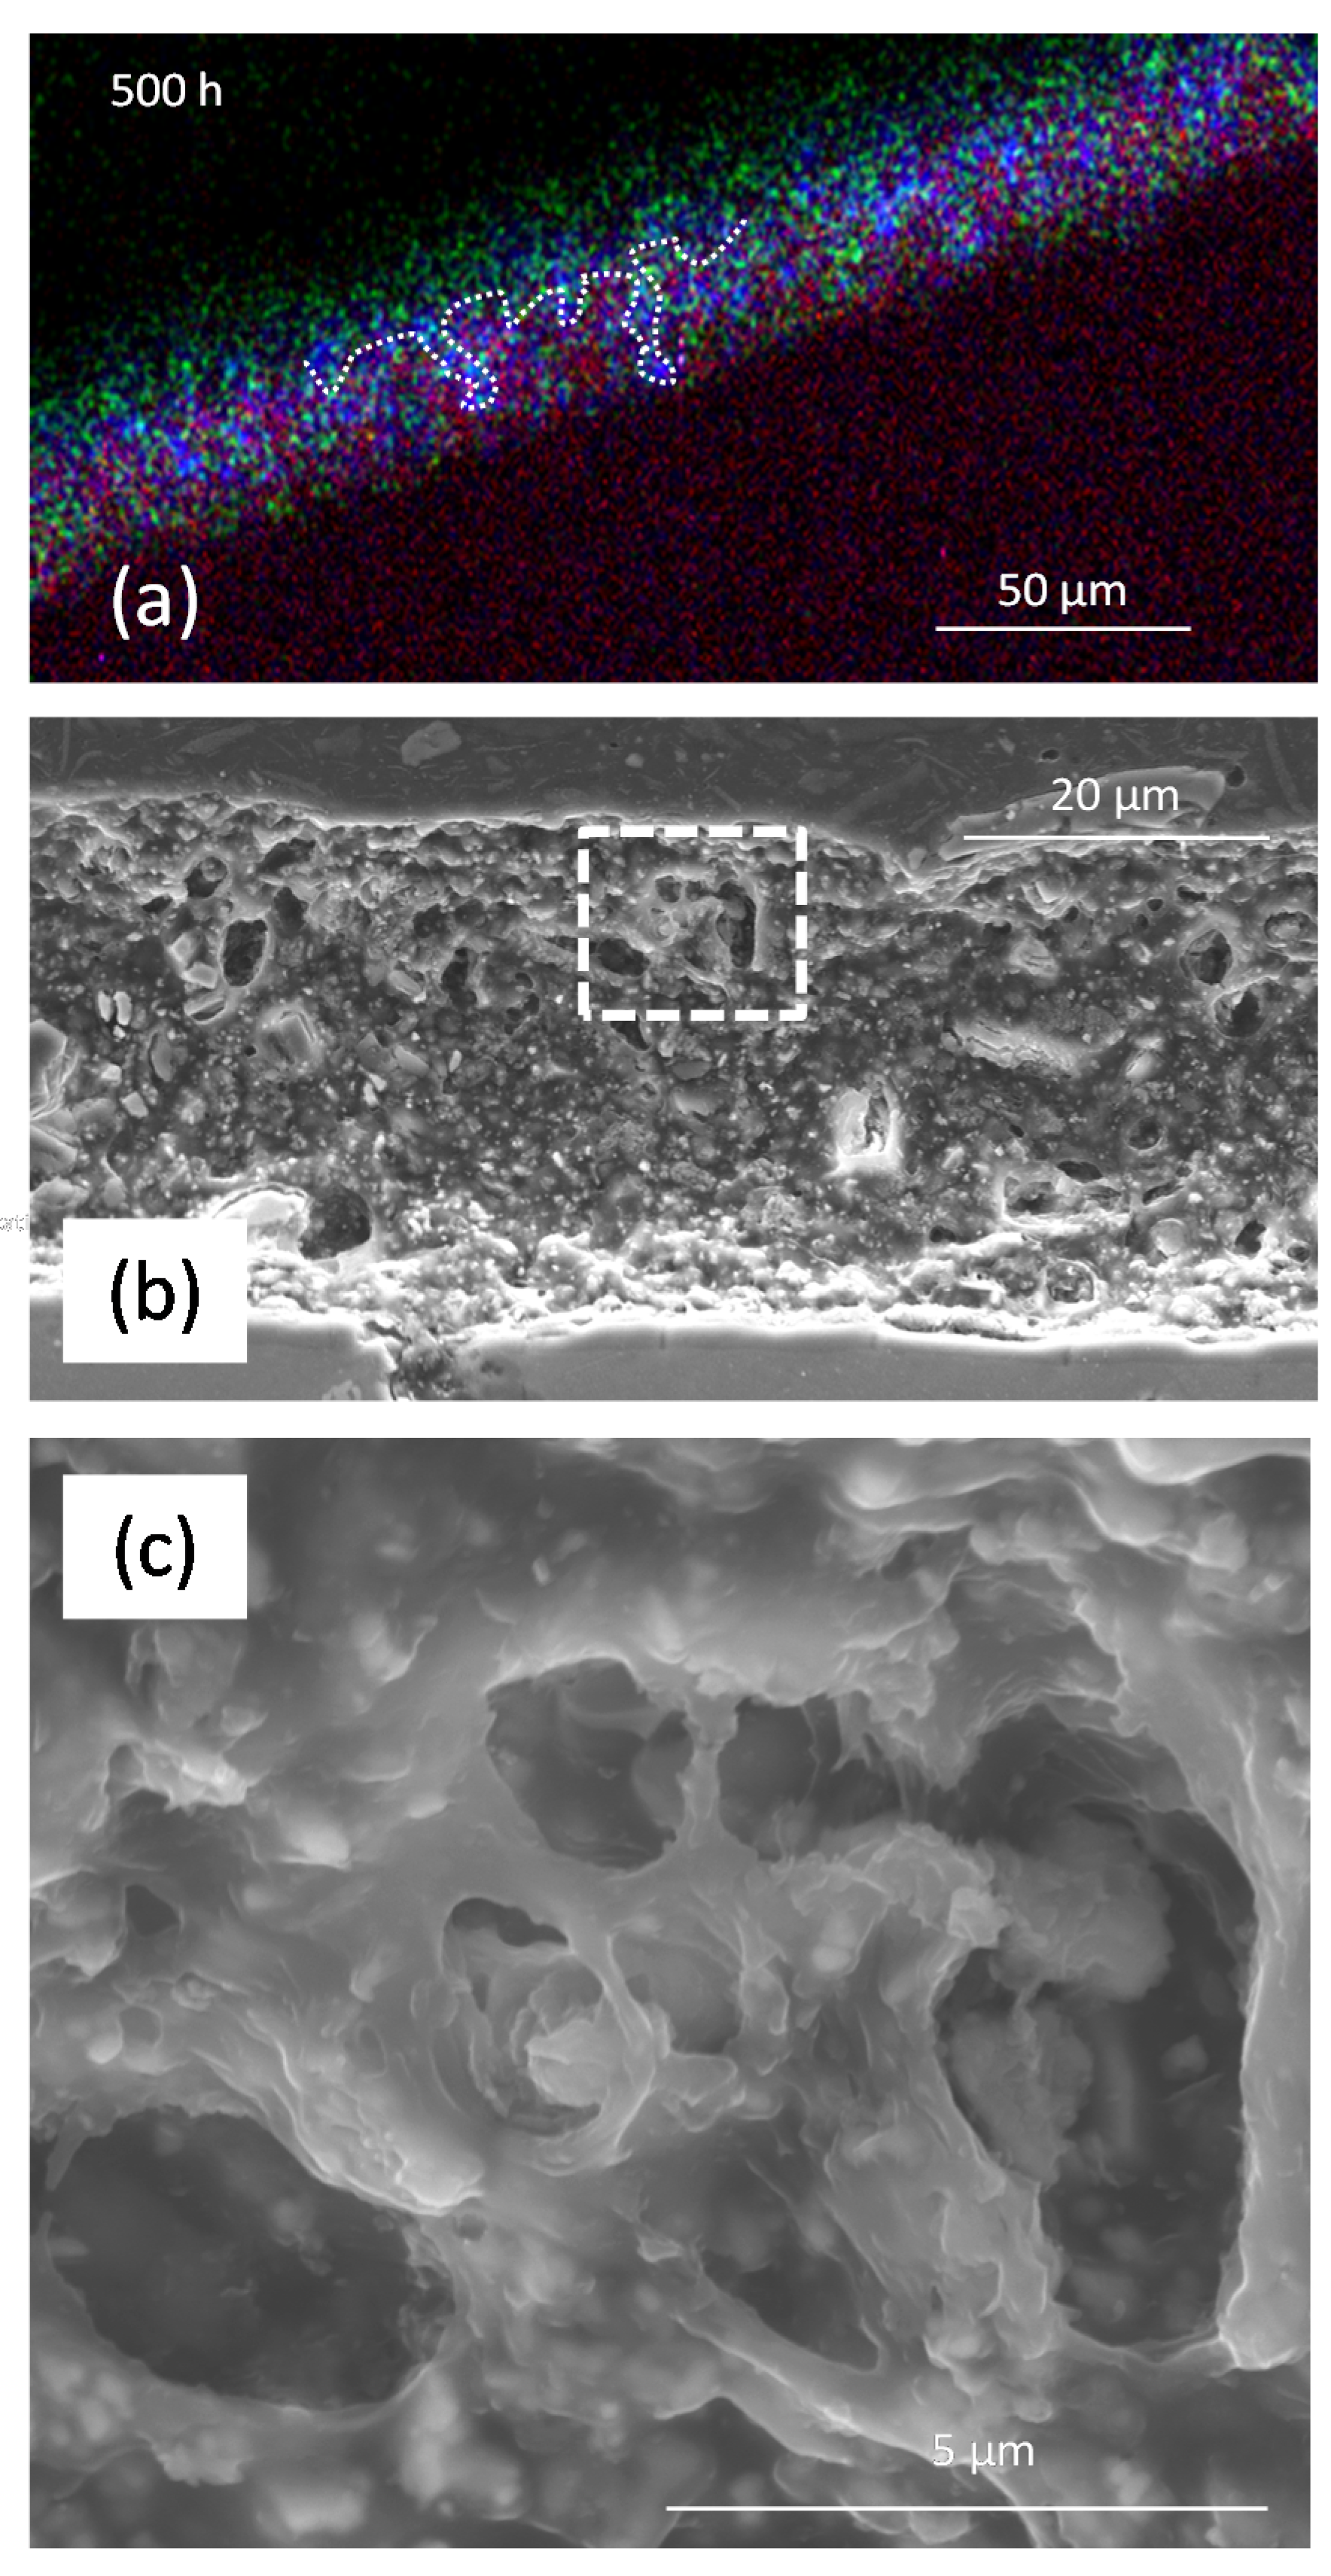
A third approach is to use SEM to determine the deepest point where there are voids (assumed to be due to Li2CO3 dissolution) in the coating. An example of void distribution for the sample exposed for 500 h to NSS is shown in Figure 14b, and voids can also be seen in Figure 10a. Summary depletion depths for the deepest depletion are presented in Table 4. Figure 14c is a higher magnification image of the region near the surface showing the extent of interconnection between the voids, which indicate a cluster formation, as previously reported by Hughes et al. for chromate clusters in an epoxy-based coating [72,73,74]. These data show that local depletion within the coating can be considerably deeper than the homogeneous depletion depth.
4. Discussion
In this paper, the combination of SEM/EDS and PIXE/PIGE have been used to investigate the distribution and chemical composition of inorganic components in a polyurethane coating prior to and after NSS exposure. The SEM/EDS results show that particle sizes observed in the coating are similar to those measured on free particles. They also show that the smaller particles of each type tend to be more homogenously dispersed than the larger particles. In the case of Li2CO3, which has fewer small particles, this appears to result in a “skin layer” near the surface where there are far more smaller TiO2, BaSO4 and Mg(hydr)oxide particles.
It was shown that (semi-) quantitative analysis can be used to separate the distribution of TiO2 from BaSO4 in SEM/EDS, and in PIXE these are separated using the Ba Kα line. PIXE was also able to identify the presence of Sr in BaSO4. Upon exposure to NSS, SEM/EDS was able to provide useful information on the loss of Li2CO3, even though Li could not be directly detected. This was achieved using a combination of PIXE and PIGE to show that there was loss of Li accompanied by a change in the morphology of the coating through the formation of voids via dissolution of Li2CO3 particles. Moreover, there were other changes in the coating, such as the change in the Mg:O ratio of the Mg-(hydr)oxide upon NSS exposure.
The results presented here show that the determination of a Li2CO3 depletion depth in organic coatings is complicated by the types of technique available to detect Li, as well as the morphology of the depletion itself. In the former case, none of the techniques presented here can be individually be used to determine the level of leaching. In the case of the PIGE, while it is possible to map the Li distribution and show that there is a region of homogeneous depletion as well as possible local depletion, this data needs to be supplemented by SEM and PIXE. In the case of SEM, it is necessary to ensure for regions of apparent depletion that voids, which indicate the depletion, have been created through the dissolution of Li2CO3 particles. This is to distinguish leaching phenomena from inhomogeneous distributions of Li2CO3 particles. PIXE is also required to supplement the PIGE results, since other inorganics in the coating act as markers for the coating thickness. Examples include the Ba and Ti distributions, which have been used here to determine the coating thickness.
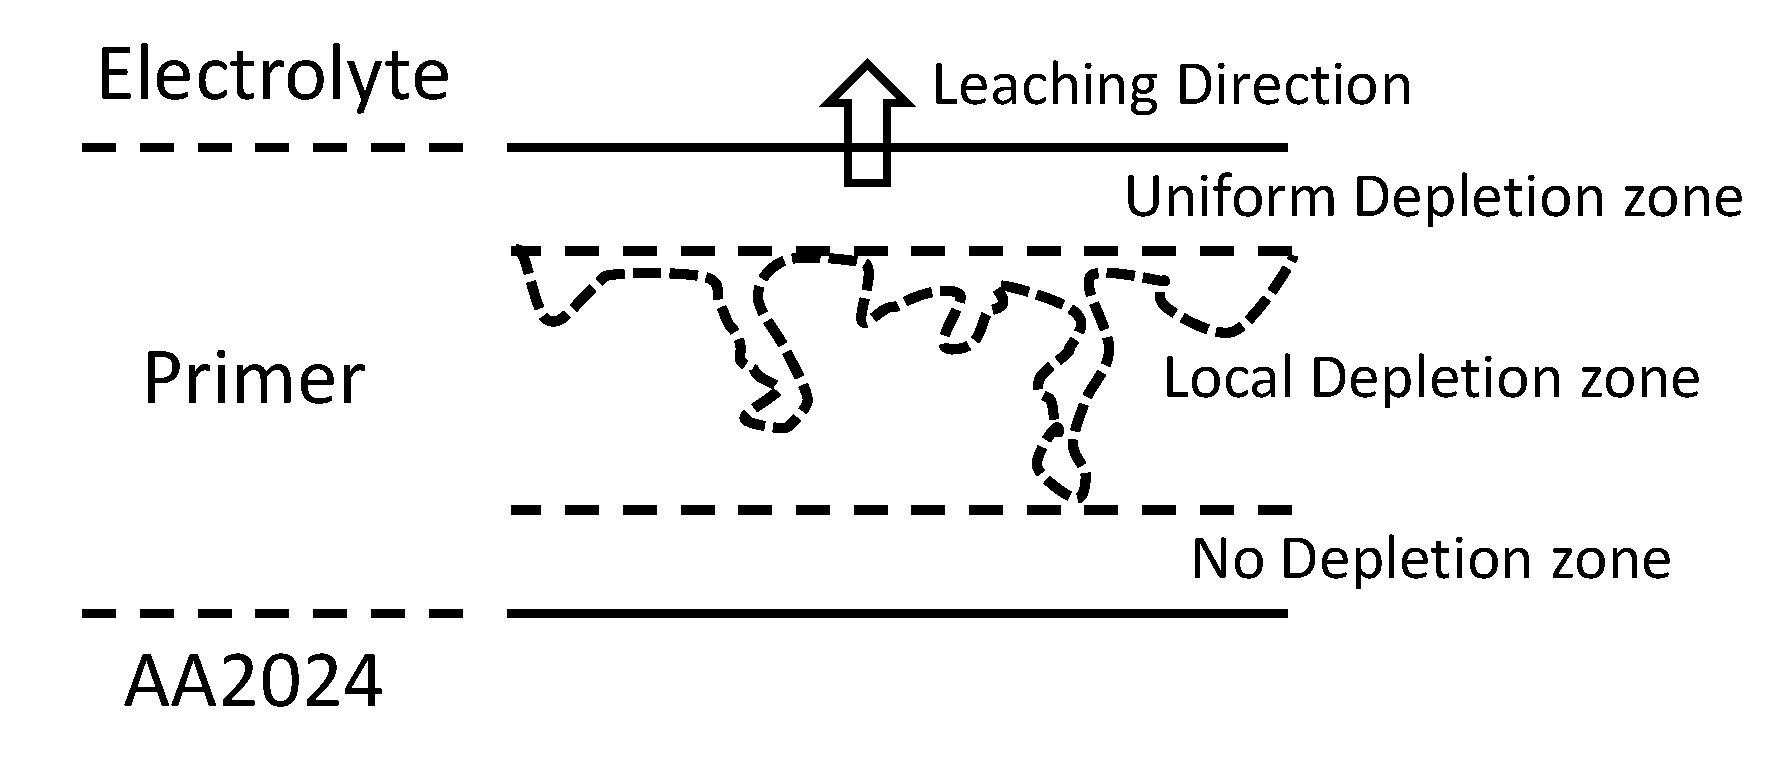
The combination of PIGE/PIXE and SEM/EDS reveal that depletion of Li from the Li2CO3 loaded primer after 500 h NSS exposure is a complex process. First, there is the development of a uniform depletion zone from the surface. The changes to Mg-(hydr)oxide may lead to additional pathways for the release of Li2CO3 that has not been released up to that point. The presence of local depletion of Li2CO3 penetrating further into the coating below this zone, rather than uniform depletion, suggests that clusters of Li2CO3 particles are involved in the release process. Release from a cluster involves (i) direct connection of the cluster to the external electrolyte and (ii) gradual dissolution from the cluster. The gradual dissolution need not necessarily move as a “front” through the cluster (i.e., particles nearer the surface must completely dissolve before the next particles can dissolve), but may occur through the simultaneous dissolution of particles at different depths in the clusters, which is dictated by transport of the inhibitor through the electrolyte in the cluster/void structure. The creation of these voids generates a fractal network that acts a porous medium. Small voids and delamination from the polyurethane observed around Li2CO3 particles support this hypothesis. The detailed dynamics of the release would need to be determined as a function of time and cannot be revealed here, since only two times were examined. These concepts are summarised in Figure 15. It should be noted that in the chromate case, these pathways were important because the size of the chromate ion meant that it could not diffuse through the epoxy, only through channels created by the dissolution of the chromate particles. In the case of Li2CO3 dissolution, while it is possible that the Li ion might be small enough to diffuse through the polyurethane by itself, it is much more likely to diffuse through channels connected to the external electrolyte and created by the dissolution of clusters of Li2CO3 particles themselves.
Finally, Figure 5e and Figure 10e show a Ti-Cl and a Ti-Cl-Na map for 0 h NSS and 500 h NSS, respectively. Neither Na nor Cl was detected in the primer coating without exposure to NSS; however, both were detected in the sample exposed to NSS for 500 h (Figure 10). The intensity of Na and Cl varied across the sample exposed to 500 h NSS, which suggested separate pathways for the diffusion of each of these ions. It was not significant in any of the larger inorganic particles, and only appeared in the polyurethane matrix. Significantly, it was not observed near channels created by the dissolution of the Li2CO3. In a model where the leaching is via transport paths created by the dissolution of the Li2CO3 particles, the role of the external electrolyte needs to be considered. The voids created by the interfacial interaction of inhibitor particles or their complete dissolution appear to be clean in the SEM studies presented here. This suggests that there must be liquid in the voids that is lost during the sample preparation process, for if there were precipitates in these voids, the preparation procedure would capture it (non-polar solvents were used for preparation, so dissolution of precipitates is unlikely). Na and Cl were only detected away from the Li2CO3 particles, either in the polyurethane matrix or in other pathways originating from interfaces between the polyurethane and the non-inhibitor inorganic components. This suggests that only water without the salt components (Na or Cl) diffuses into the inhibitor pathways. This is probably because these pathways, generated by Li2CO3 dissolution, quickly become saturated with ions from the inhibitor phase, providing an ionic barrier to ions of the external electrolyte. It could also be concluded from these observations that the transport of electrolytes through the coating is complex, with multiple and separate pathways for the external electrolytes and the “internal electrolytes” (water with inhibitor ions): an area that warrants further investigation.
5. Conclusions
PIGE, PIXE and SEM/EDS have been used to study the distribution and chemistry of inorganic components in a polyurethane coating prior to and after 500 h NSS exposure. Prior to NSS exposure, the PIGE results revealed that there was a zone (3–4 μm deep) near the surface of the primer that appeared to have less Li2CO3, thus forming a type of “skin” layer. This “skin” layer had smaller particles of TiO2 and BaSO4. After NSS exposure, the PIGE results indicated that there was a homogeneously depleted zone extending from the electrolyte/primer interface into the primer (in this case around 11 μm), plus local depletion penetrating much deeper into the primer with a maximum measured depth of around 25 μm. The deeper local penetration was confirmed using SEM, where voids created by partial and complete dissolution of Li2CO3 particles were observed extending deep into the primer towards the metal/primer interface. Magnesium hydroxide/oxide particles also appeared to undergo some change with exposure to NSS, with the Mg:O ratio moving closer to 1. The other inorganic particles (TiO2 and BaSO4) appeared unchanged upon NSS exposure. There was some evidence of chloride penetration into the polyurethane component of the primer, but not within the channels created around the Li2CO3 particles.
Author Contributions
Peter Visser, Arjan Mol and Herman Terryn conceived and designed the experiments. Peter Visser prepared samples and performed the NSS testing. Herman Terryn, Arjan Mol, Peter Visser and Tony Hughes were involved in the interpretation of data. Jamie Laird performed the nuclear microprobe experiments and was assisted by Tony Hughes and Chris Ryan in data analysis and interpretation. Tony Hughes performed all SEM experiments and interpreted the data. Tony Hughes wrote the paper with input from all other authors.
Conflicts of Interest
There are no conflicts of interest.
Appendix
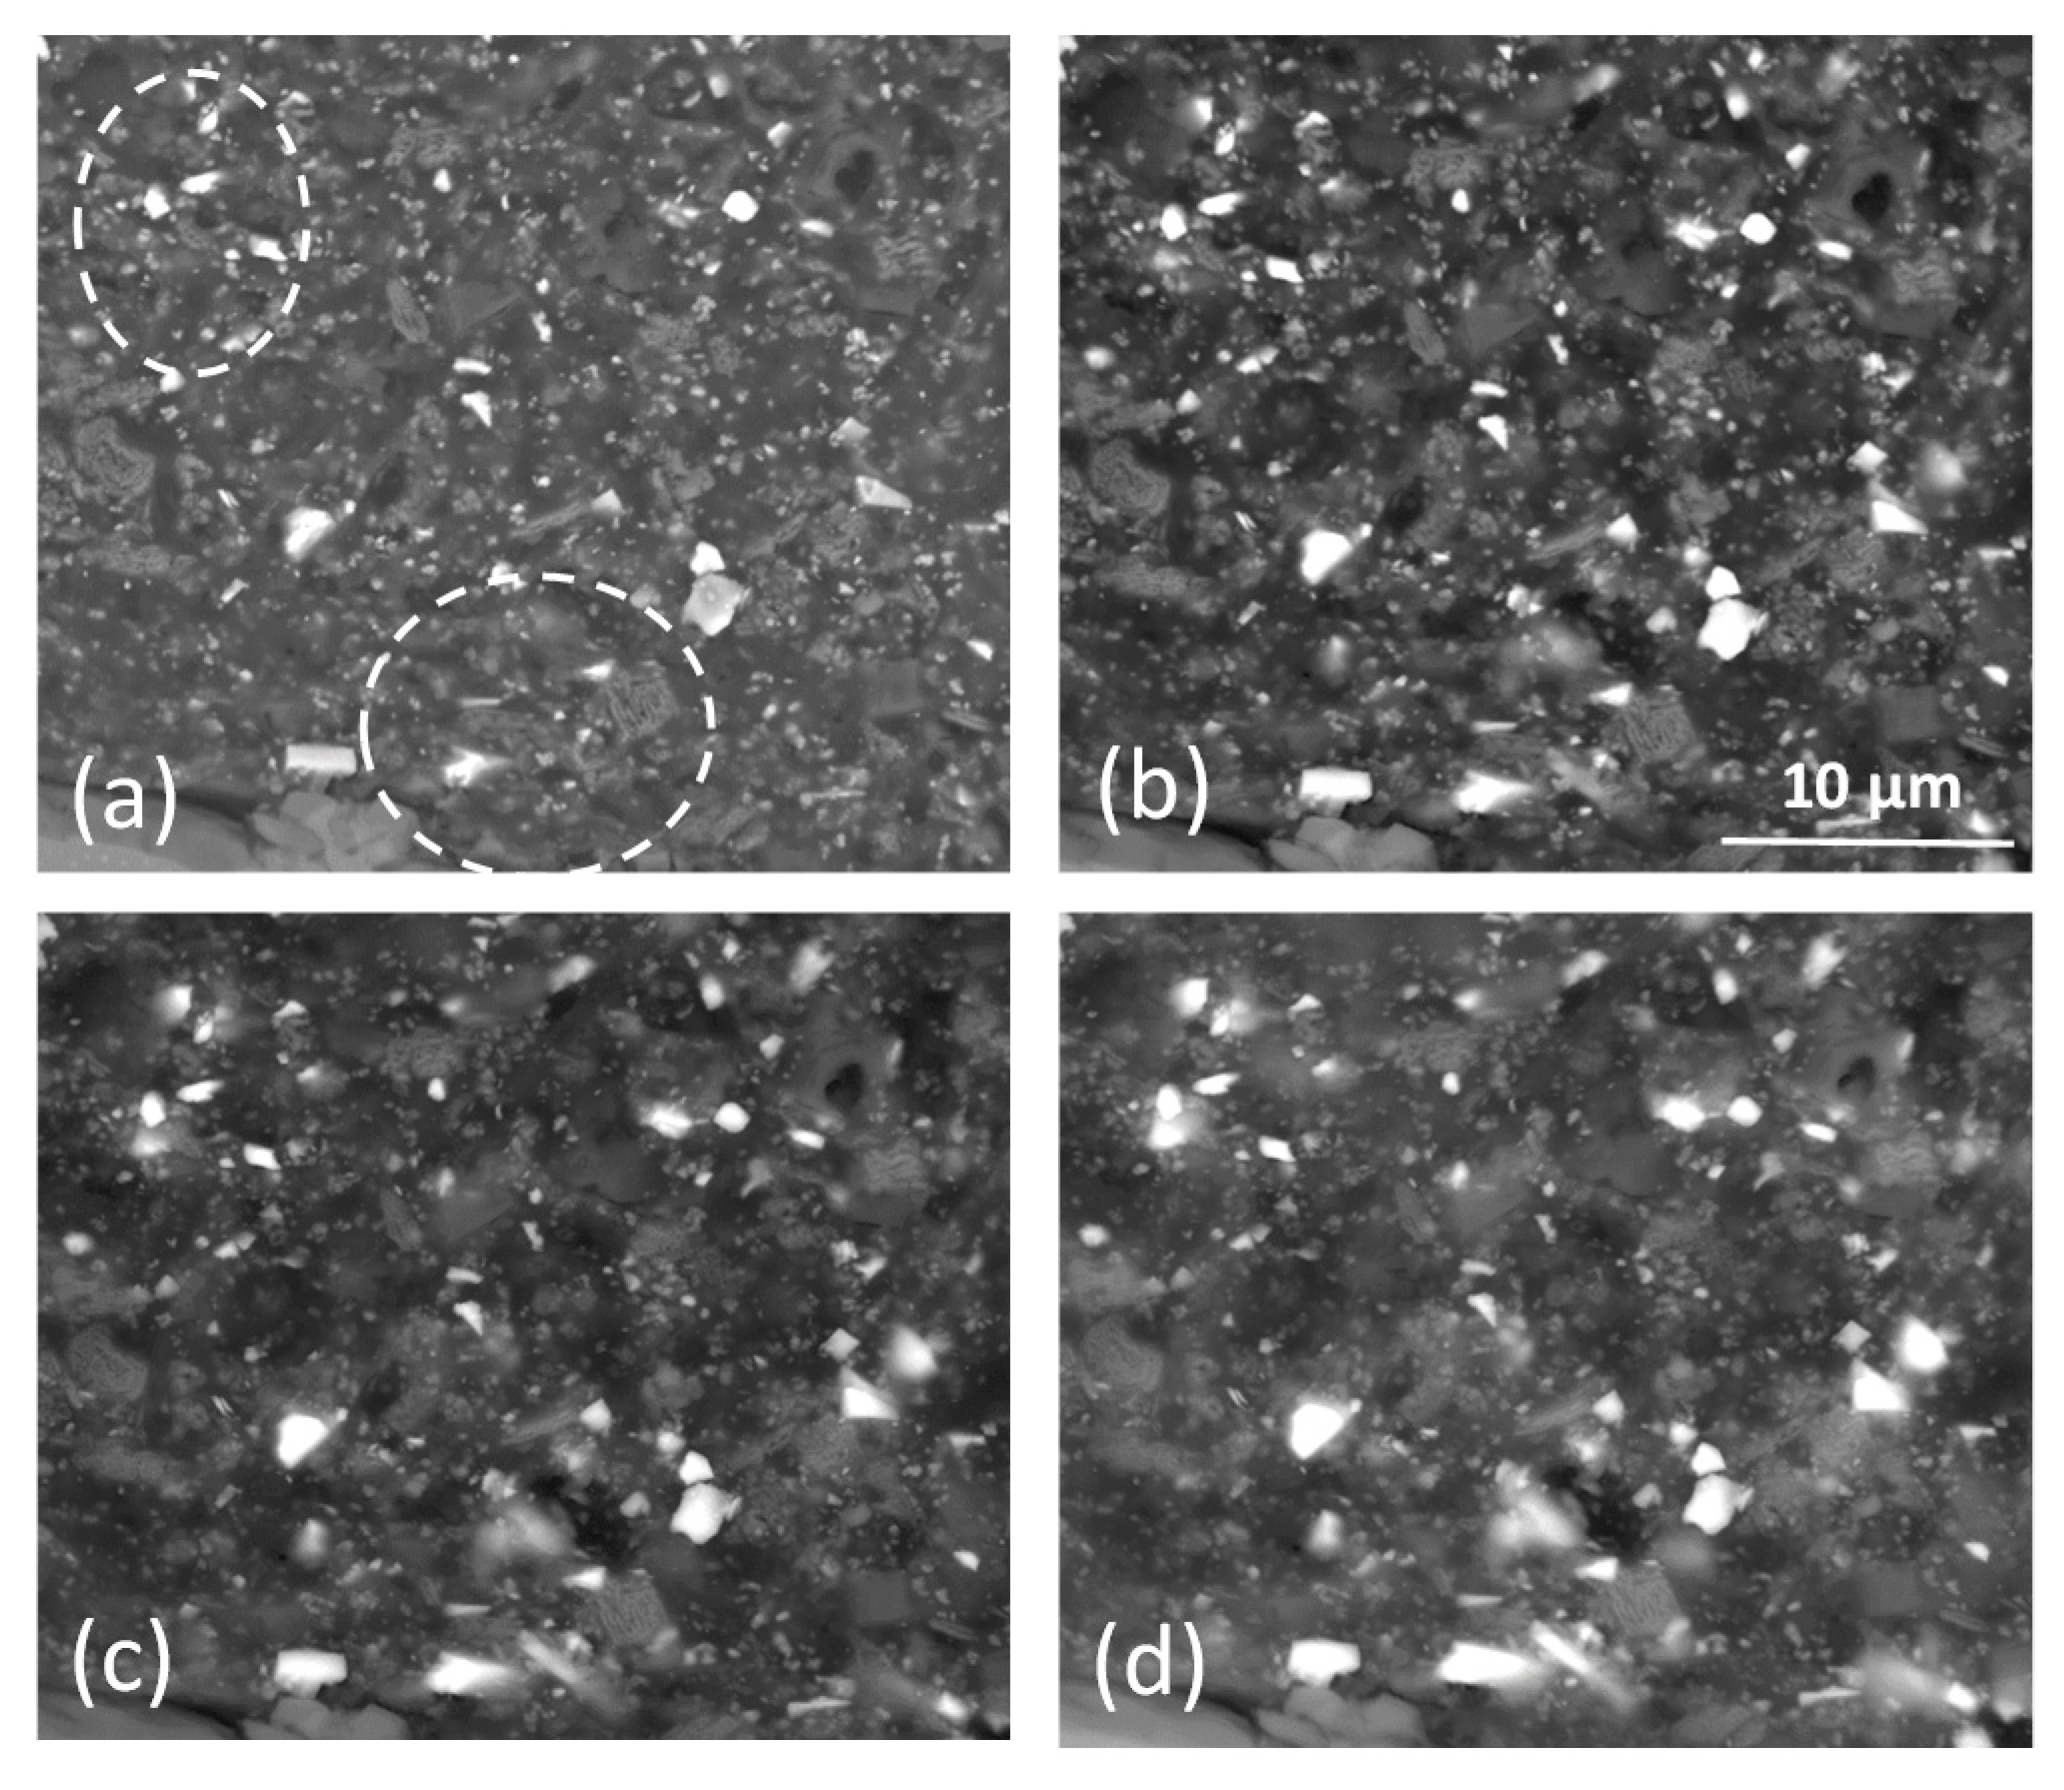
The influence of subsurface particles can be seen in Figure A1, which shows images of the same region collected at different accelerating voltages. The ellipses, highlighted using dashed lines in Figure A1a, show two regions where, with increasing voltage, subsurface BaSO4 particles become evident. Thus, the contribution from subsurface particles may distort the analysis of small particles.
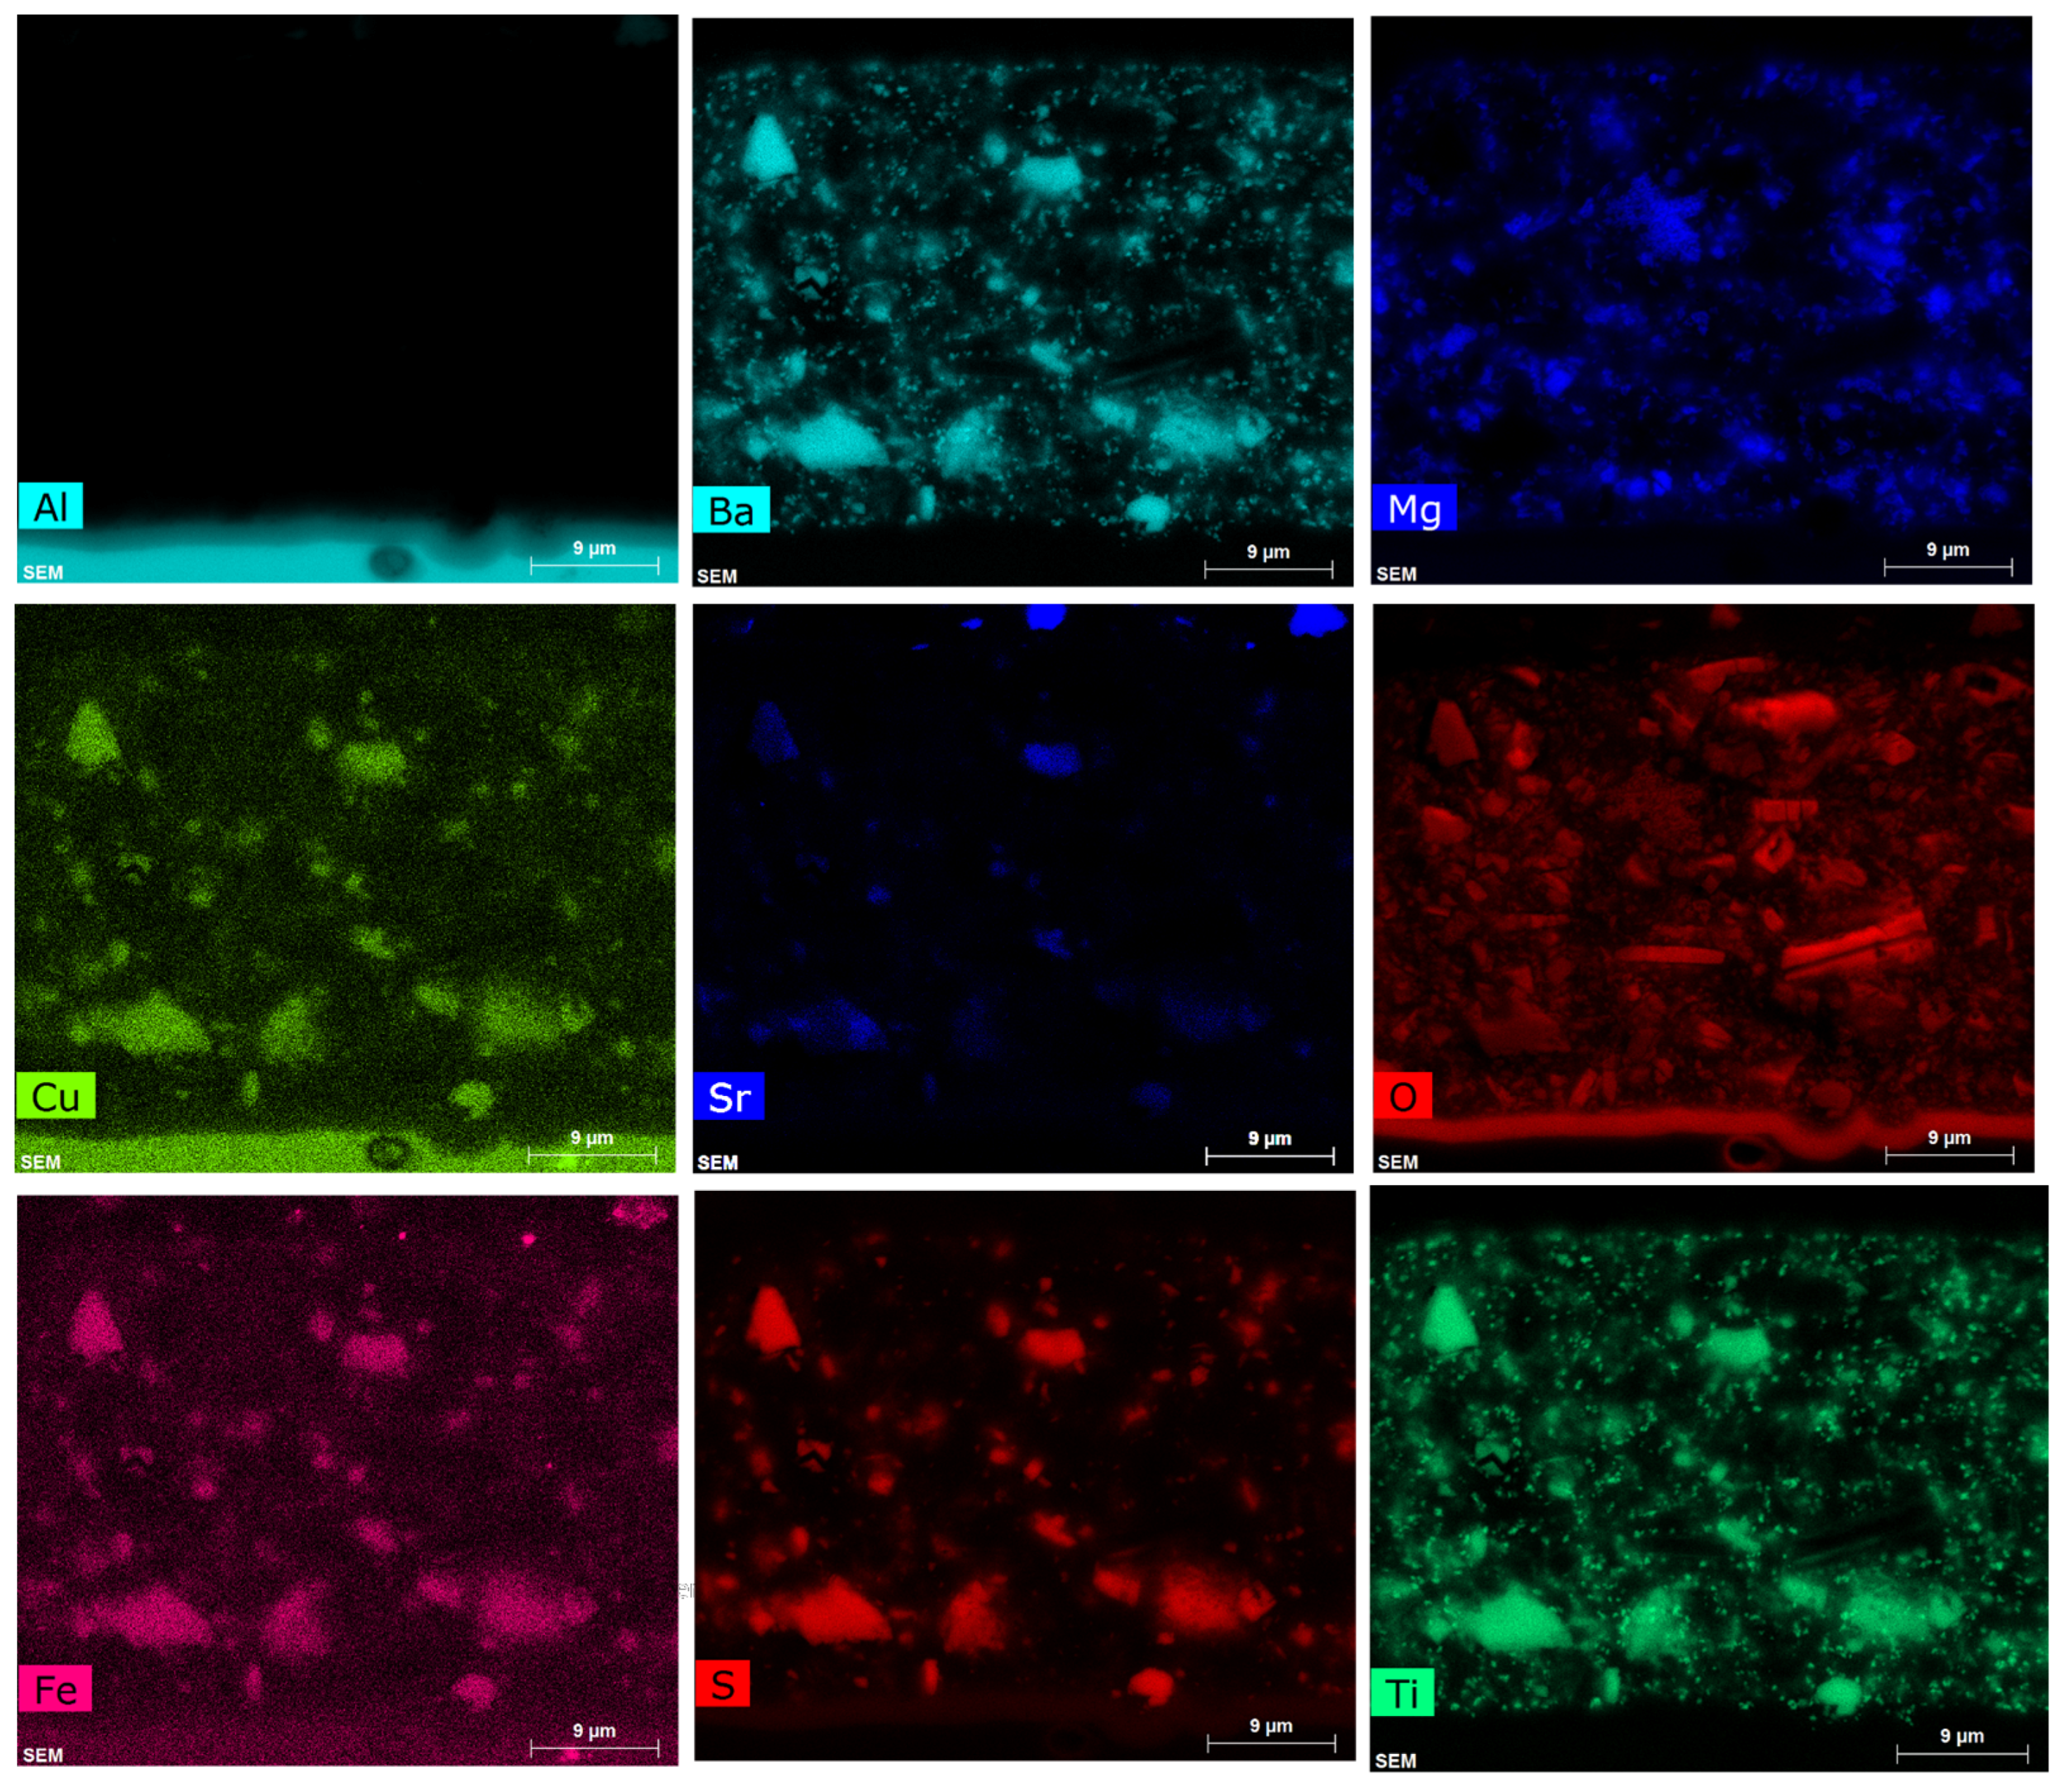
EDS maps for a section of the primer are displayed in Figure A2. These maps highlight the difficulty of using EDS mapping alone to study the distributions (and redistribution after leaching) of all the phases that comprise the primer coating. Elements such as Cu and Fe result from changes in the background level in the spectral region of the Kα lines of these transition metals. Of course, the presence of an element in a particular region of the map can and should be checked using EDS spectra where a change in background is easily distinguished from a peak. However, overlapping lines are a different issue. This is important from the perspective of following the changes in primer additives, such as with Ti and Ba, where overlapping lines give misleading information on the distribution of these particles. In this case, the overlapping lines show a co-incidence of Ti- and Ba-containing particles on their respective maps (Figure A2). The overlap in the X-ray lines themselves is clearly seen in Figure 4, where the Ti Kα lines overlap with the Ba L-series lines, and the Si Kα overlaps with the Sr Kα lines. This can only be resolved using a fitting of the EDS spectra, such as that which is achieved when quantifying the spectra. This approach has been used in this paper.
Figure A1.
Backscatter electron images collected at (a) 10 kV, (b) 15 kV, (c) 20 kV and (d) 25 kV. Dashed ellipses highlight regions where the backscatter contrast changes significantly with accelerating voltage.
Figure A1.
Backscatter electron images collected at (a) 10 kV, (b) 15 kV, (c) 20 kV and (d) 25 kV. Dashed ellipses highlight regions where the backscatter contrast changes significantly with accelerating voltage.

Figure A2.
Elemental maps collected from the section of the primer prior to exposure to NSS.

References
- Catubig, R.; Hughes, A.E.; Cole, I.S.; Hinton, B.R.W.; Forsyth, M. The use of cerium and praseodymium mercaptoacetate as thiol-containing inhibitors for AA2024-T3. Corros. Sci. 2014, 81, 45–53. [Google Scholar] [CrossRef]
- Markley, T.A.; Mardel, J.I.; Hughes, A.E.; Hinton, B.R.W.; Glenn, A.M.; Forsyth, M. Chromate replacement in coatings for corrosion protection of aerospace aluminium alloys. Mater. Corros. Werkstoffe Und Korros. 2011, 62, 836–840. [Google Scholar] [CrossRef]
- Hughes, A.E.; Ho, D.; Forsyth, M.; Hinton, B.R.W. Towards replacement of chromate inhibitors by rare earth systems. Corros. Rev. 2007, 25, 591–605. [Google Scholar] [CrossRef]
- Mardel, J.; Garcia, S.J.; Corrigan, P.A.; Markley, T.; Hughes, A.E.; Muster, T.H.; Lau, D.; Harvey, T.G.; Glenn, A.M.; White, P.A.; et al. The characterisation and performance of Ce(dbp)3-inhibited epoxy coatings. Prog. Org. Coat. 2011, 70, 91–101. [Google Scholar] [CrossRef]
- Hughes, A.E.; Cole, I.S.; Muster, T.H.; Varley, R.J. Combining Green and Self Healing for a new Generation of Coatings for Metal Protection. Nat. Asia Mater. 2010, 2, 143–151. [Google Scholar] [CrossRef]
- Shi, H.; Han, E.-H.; Lamaka, S.V.; Zheludkevich, M.L.; Liu, F.; Ferreira, M.G.S. Cerium cinnamate as an environmentally benign inhibitor pigment for epoxy coatings on AA 2024-T3. Prog. Org. Coat. 2014, 77, 765–773. [Google Scholar] [CrossRef]
- Yasakau, K.A.; Tedim, J.; Zheludkevich, M.L.; Drumm, R.; Shem, M.; Wittmar, M.; Veith, M.; Ferreira, M.G.S. Cerium molybdate nanowires for active corrosion protection of aluminium alloys. Corros. Sci. 2012, 58, 41–51. [Google Scholar] [CrossRef]
- Schem, M.; Schmidt, T.; Gerwann, J.; Wittmar, M.; Veith, M.; Thompson, G.E.; Molchan, I.S.; Hashimoto, T.; Skeldon, P.; Phani, A.R.; et al. CeO2-filled sol-gel coatings for corrosion protection of AA2024-T3 aluminium alloy. Corros. Sci. 2009, 51, 2304–2315. [Google Scholar] [CrossRef]
- Yasakau, K.A.; Zheludkevich, M.L.; Ferreira, M.G.S. Lanthanide salts as corrosion inhibitors for AA5083. Mechanism and efficiency of corrosion inhibition. J. Electrochem. Soc. 2008, 155, C169–C177. [Google Scholar] [CrossRef]
- Montemor, M.F.; Trabelsi, W.; Lamaka, S.V.; Yasakau, K.A.; Zheludkevich, M.L.; Bastos, A.C.; Ferreira, M.G.S. The synergistic combination of bis-silane and CeO2.ZrO2 nanoparticles on the electrochemical behaviour of galvanised steel in NaCl solutions. Electrochim. Acta 2008, 53, 5913–5922. [Google Scholar] [CrossRef]
- Zheludkevich, M.L.; Serra, R.; Montemor, M.F.; Yasakau, K.A.; Salvado, I.M.M.; Ferreira, M.G.S. Nanostructured sol-gel coatings doped with cerium nitrate as pre-treatments for AA2024-T3—Corrosion protection performance. Electrochim. Acta 2005, 51, 208–217. [Google Scholar] [CrossRef]
- Paussa, L.; Andreatta, F.; de Felicis, D.; Bemporad, E.; Fedrizzi, L. Investigation of AA2024-T3 surfaces modified by cerium compounds: A localized approach. Corros. Sci. 2014, 78, 215–222. [Google Scholar] [CrossRef]
- Andreatta, F.; Druart, M.E.; Lanzutti, A.; Lekka, M.; Cossement, D.; Olivier, M.G.; Fedrizzi, L. Localized corrosion inhibition by cerium species on clad AA2024 aluminium alloy investigated by means of electrochemical micro-cell. Corros. Sci. 2012, 65, 376–386. [Google Scholar] [CrossRef]
- Paussa, L.; Rosero-Navarro, N.C.; Andreatta, F.; Castro, Y.; Duran, A.; Aparicio, M.; Fedrizzi, L. Inhibition effect of cerium in hybrid sol-gel films on aluminium alloy AA2024. Surf. Interface Anal. 2010, 42, 299–305. [Google Scholar] [CrossRef] [Green Version]
- Ralston, K.D.; Young, T.L.; Buchheit, R.G. Electrochemical Evaluation of Constituent Intermetallics in Aluminum Alloy 2024-T3 Exposed to Aqueous Vanadate Inhibitors. J. Electrochem. Soc. 2009, 156, C135–C146. [Google Scholar] [CrossRef]
- Ralston, K.D.; Chrisanti, S.; Young, T.L.; Buchheit, R.G. Corrosion inhibition of aluminum alloy 2024-T3 by aqueous vanadium species. J. Electrochem. Soc. 2008, 155, C350–C359. [Google Scholar] [CrossRef]
- Harvey, T.G.; Hardin, S.G.; Hughes, A.E.; Muster, T.H.; White, P.A.; Markley, T.A.; Corrigan, P.A.; Mardel, J.; Garcia, S.J.; Mol, J.M.C.; et al. The effect of inhibitor structure on the corrosion of AA2024 and AA7075. Corros. Sci. 2011, 53, 2184–2190. [Google Scholar] [CrossRef]
- Zheludkevich, M.L.; Tedim, J.; Freire, C.S.R.; Fernandes, S.C.M.; Kallip, S.; Lisenkov, A.; Gandini, A.; Ferreira, M.G.S. Self-healing protective coatings with “green” chitosan based pre-layer reservoir of corrosion inhibitor. J. Mater. Chem. 2011, 21, 4805–4812. [Google Scholar] [CrossRef]
- Raps, D.; Hack, T.; Wehr, J.; Zheludkevich, M.L.; Bastos, A.C.; Ferreira, M.G.S.; Nuyken, O. Electrochemical study of inhibitor-containing organic-inorganic hybrid coatings on AA2024. Corros. Sci. 2009, 51, 1012–1021. [Google Scholar] [CrossRef]
- Montemor, M.F. Fostering green inhibitors for corrosion prevention. In Series in Materials Science; Springer: Berlin, Germany, 2016; pp. 107–137. [Google Scholar]
- El-Faham, A.; Dahlous, K.A.; al Othman, Z.A.; Al-Lohedan, H.A.; El-Mahdy, G.A. sym-Trisubstituted 1,3,5-Triazine Derivatives as Promising Organic Corrosion Inhibitors for Steel in Acidic Solution. Molecules 2016, 21, 436. [Google Scholar] [CrossRef] [PubMed]
- Winkler, D.A.; Breedon, M.; Hughes, A.E.; Burden, F.R.; Barnard, A.S.; Harvey, T.G.; Cole, I. Towards chromate-free corrosion inhibitors: Structure-property models for organic alternatives. Green Chem. 2014, 16, 3349–3357. [Google Scholar] [CrossRef]
- Gonzalez-Olvera, R.; Roman-Rodriguez, V.; Negron-Silva, G.E.; Espinoza-Vazquez, A.; Rodriguez-Gomez, F.J.; Santillan, R. Multicomponent Synthesis and Evaluation of New 1,2,3-Triazole Derivatives of Dihydropyrimidinones as Acidic Corrosion Inhibitors for Steel. Molecules 2016, 21, 250. [Google Scholar] [CrossRef] [PubMed]
- Allahar, K.N.; Wang, D.; Battocchi, D.; Bierwagen, G.P.; Balbyshev, S. Real-Time Monitoring of a United States Air Force Topcoat/Mg-Rich Primer System in ASTM B117 Exposure by Embedded Electrodes. Corros. Sci. 2010, 66, 075003. [Google Scholar] [CrossRef]
- Bierwagen, G.; Brown, R.; Battocchi, D.; Hayes, S. Active metal-based corrosion protective coating systems for aircraft requiring no-chromate pretreatment. Prog. Org. Coat. 2010, 68, 48–61. [Google Scholar] [CrossRef]
- Wang, D.H.; Battocchi, D.; Allahar, K.N.; Balbyshev, S.; Bierwagen, G.P. In situ monitoring of a Mg-rich primer beneath a topcoat exposed to Prohesion conditions. Corros. Sci. 2010, 52, 441–448. [Google Scholar] [CrossRef]
- Xu, H.; Battocchi, D.; Tallman, D.E.; Bierwagen, G.P. Use of Magnesium Alloys as Pigments in Magnesium-Rich Primers for Protecting Aluminum Alloys. Corros. Sci. 2009, 65, 318–325. [Google Scholar] [CrossRef]
- Figueira, R.; Fontinha, I.; Silva, C.; Pereira, E. Hybrid Sol-Gel Coatings: Smart and Green Materials for Corrosion Mitigation. Coatings 2016, 6, 12. [Google Scholar] [CrossRef]
- Kozmel, T.; Vural, M.; Tin, S. EBSD analysis of high strain rate application Al-Cu based alloys. Mater. Sci. Eng. A 2015, 630, 99–106. [Google Scholar] [CrossRef]
- Zheludkevich, M.L.; Poznyak, S.K.; Rodrigues, L.M.; Raps, D.; Hack, T.; Dick, L.F.; Nunes, T.; Ferreira, M.G.S. Active protection coatings with layered double hydroxide nanocontainers of corrosion inhibitor. Corros. Sci. 2010, 52, 602–611. [Google Scholar] [CrossRef]
- Snihirova, D.; Lamaka, S.V.; Taryba, M.; Salak, A.M.; Kallip, S.; Zheludkevich, M.L.; Ferreira, M.G.S.; Montemor, M.F. Hydroxyapatite microparticles as feedback-active reservoirs of corrosion inhibitors. ACS Appl. Mater. Interfaces 2010, 2, 3011–3022. [Google Scholar] [CrossRef] [PubMed]
- Poznyak, S.K.; Tedim, J.; Rodrigues, L.M.; Salak, A.N.; Zheludkevich, M.L.; Dick, L.F.P.; Ferreira, M.G.S. Novel Inorganic Host Layered Double Hydroxides Intercalated with Guest Organic Inhibitors for Anticorrosion Applications. ACS Appl. Mater. Interfaces 2009, 1, 2353–2362. [Google Scholar] [CrossRef] [PubMed]
- Mahajanarn, S.P.V.; Buchheit, R.G. Characterization of inhibitor release from Zn-Al-[V10O28]6− hydrotalcite pigments and corrosion protection from hydrotalcite-pigmented epoxy coatings. Corros. Sci. 2008, 64, 230–240. [Google Scholar] [CrossRef]
- Chrisanti, S.; Buchheit, R.G. Use of Ce-modified bentonite clay as a pigment for corroion inhibition and sensing. In Papers Presented at the Philadelphia, Pennsylvania Meeting; American Chemical Society: Washington, DC, USA, 2004; Volume 45, pp. 148–149. [Google Scholar]
- Mahajanam, S.P.V.; Buchheit, R.G. Characterization of Zn-Al-V10 corrosion-inhibiting hydrotalcite pigments in epoxy resins. In Corrosion and Protection of Light Metal Alloys; Buchheit, R.G., Kelly, R.G., Missert, N.A., Shaw, B.A., Eds.; Electrochemical Society Inc.: Pennington, NJ, USA, 2004; pp. 270–282. [Google Scholar]
- Buchheit, R.G.; Guan, H. Formation and characteristics of Al-Zn hydrotalcite coatings on galvanized steel. JCT Res. 2004, 1, 277–290. [Google Scholar] [CrossRef]
- Kendig, M.; Hon, M. A hydrotalcite-like pigment containing an organic anion corrosion inhibitor. Electrochem. Solid State Lett. 2005, 8, B10–B11. [Google Scholar] [CrossRef]
- McMurray, H.N.; Williams, G. Inhibition of filiform corrosion on organic-coated aluminum alloy by hydrotalcite-like anion-exchange pigments. Corros. Sci. 2004, 60, 219–228. [Google Scholar] [CrossRef]
- Williams, G.; McMurray, H.N. Inhibition of filiform corrosion on polymer coated AA2024-T3 by hydrotalcite-like pigments incorporating organic anions. Electrochem. Solid State Lett. 2004, 7, B13–B15. [Google Scholar] [CrossRef]
- Williams, G.; McMurray, H.N. Anion-exchange inhibition of filiform corrosion on organic coated AA2024-T3 aluminum alloy by hydrotalcite-like pigments. Electrochem. Solid State Lett. 2003, 6, B9–B11. [Google Scholar] [CrossRef]
- Williams, G.; McMurray, H.N.; Worsley, D.A. Cerium(III) inhibition of corrosion-driven organic coating delamination studied using a scanning kelvin probe technique. J. Electrochem. Soc. 2002, 149, B154–B162. [Google Scholar] [CrossRef]
- Visser, P.; Terryn, H.; Mol, J.M.C. Aerospace Coatings. Act. Prot. Coat. 2016, 233, 315–372. [Google Scholar]
- Visser, P.; Liu, Y.; Zhou, X.; Hashimoto, T.; Thompson, G.E.; Lyon, S.B.; van der Ven, L.G.J.; Mol, A.J.M.C.; Terryn, H.A. The corrosion protection of AA2024-T3 aluminium alloy by leaching of lithium-containing salts from organic coatings. Faraday Discuss. 2015, 180, 511–526. [Google Scholar] [CrossRef] [PubMed]
- Visser, P.; Lutz, A.; Mol, J.M.C.; Terryn, H. Study of the formation of a protective layer in a defect from lithium-leaching organic coatings. Prog. Org. Coat. 2016, 99, 80–90. [Google Scholar] [CrossRef]
- Visser, P.; Liu, Y.; Terryn, H.; Mol, J.M.C. Lithium salts as leachable corrosion inhibitors and potential replacement for hexavalent chromium in organic coatings for the protection of aluminum alloys. J. Coat. Technol. Res. 2016, 13, 557–566. [Google Scholar] [CrossRef]
- Liu, Y.; Visser, P.; Zhou, X.; Lyon, S.B.; Hashimoto, T.; Curioni, M.; Gholinia, A.; Thompson, G.E.; Smyth, G.; Gibbon, S.R.; et al. Protective film formation on AA2024-T3 Aluminum Alloy by leaching of lithium carbonate from an organic coating. J. Electrochem. Soc. 2016, 163, C45–C53. [Google Scholar] [CrossRef]
- Laird, J.S.; Hughes, A.E.; Ryan, C.G.; Visser, P.; Terryn, H.; Mol, J.M.C. Particle induced gamma and X-ray emission spectroscopies of lithium based alloy coatings. Nucl. Instrum. Methods Phys. Res. Sect. B Beam Interact. Mater. Atoms 2017, 404, 167–172. [Google Scholar] [CrossRef]
- Boag, A.; Taylor, R.J.; Muster, T.H.; Goodman, N.; McCulloch, D.; Ryan, C.; Rout, B.; Jamieson, D.; Hughes, A.E. Stable pit formation on AA2024-T3 in a NaCl environment. Corros. Sci. 2010, 52, 90–103. [Google Scholar] [CrossRef]
- Boag, A.P.; McCulloch, D.G.; Jamieson, D.N.; Hearne, S.M.; Hughes, A.E.; Ryan, C.G.; Toh, S.K. Combined nuclear microprobe and TEM study of corrosion pit nucleation by intermetallics in aerospace aluminium alloys. Nucl. Instrum. Methods Phys. Res. Sect. B Beam Interact. Mater. Atoms 2005, 231, 457–462. [Google Scholar] [CrossRef]
- Furman, S.A.; Scholes, F.H.; Hughes, A.E.; Jamieson, D.N.; Macrae, C.M.; Glenn, A.M. Corrosion in artificial defects. II. Chromate reactions. Corros. Sci. 2006, 48, 1827–1847. [Google Scholar] [CrossRef]
- Polmear, I.J. Light Allopys: Metallurgy of the Light Metals, 3rd ed.; Arnold: London, UK, 1995. [Google Scholar]
- ASTM B117–16 Standard Practice for Operating Salt Spray (Fog) Apparatus; ASTM International: West Conshohocken, PA, USA, 2016.
- Ryan, C.G.; Jamieson, D.N.; Griffin, W.L.; Cripps, G.; Szymanski, R. The new CSIRO-GEMOC nuclear microprobe: First results, performance and recent applications. Nucl. Instrum. Methods Phys. Res. Sect. B Beam Interact. Mater. Atoms 2001, 181, 12–19. [Google Scholar] [CrossRef]
- Laird, J.S.; Szymanski, R.; Ryan, C.G.; Gonzalez-Alvarez, I. A Labview based FPGA data acquisition with integrated stage and beam transport control. Nucl. Instrum. Methods Phys. Res. Sect. B Beam Interact. Mater. Atoms 2013, 306, 71–75. [Google Scholar] [CrossRef]
- Ryan, C.G.; van Achterbergh, E.; Yeats, C.J.; Tin Win, T.; Cripps, G. Quantitative PIXE trace element imaging of minerals using the new CSIRO-GEMOC Nuclear Microprobe. Nuclear Instrum. Methods Phys. Res. Section B Beam Interact. Mater. Atoms 2002, 189, 400–407. [Google Scholar] [CrossRef]
- Boni, C.; Cereda, E.; Marcazzan, G.M.B.; de Tomasi, V. Prompt gamma emission excitation functions for PIGE analysis. Nucl. Inst. Methods Phys. Res. B 1988, 35, 80–86. [Google Scholar] [CrossRef]
- Abrahami, S.T.; Hauffman, T.; de Kok, J.M.M.; Mol, J.M.C.; Terryn, H. XPS Analysis of the Surface Chemistry and Interfacial Bonding of Barrier-Type Cr(VI)-Free Anodic Oxides. J. Phys. Chem. C 2015, 119, 19967–19975. [Google Scholar] [CrossRef]
- Hatch, J.E. Aluminium: Porperties and Physical Metallurgy; ASM International: Materials Park, OH, USA, 1984. [Google Scholar]
- Ovcharenko, R.E.; Tupitsyn, I.I.; Savinov, E.P.; Voloshina, E.N.; Dedkov, Y.S.; Shulakov, A.S. Calculation of the X-ray emission K and L 2,3 bands of metallic magnesium and aluminum with allowance for multielectron effects. J. Exp. Theor. Phys. 2014, 118, 11–17. [Google Scholar] [CrossRef]
- Hughes, A.E.; Glenn, A.M.; Wilson, N.; Moffatt, A.; Morton, A.J.; Buchheit, R.G. A consistent description of intermetallic particle composition: An analysis of ten batches of AA2024-T3. Surf. Interface Anal. 2013, 45, 1558–1563. [Google Scholar] [CrossRef]
- Hughes, A.E.; Birbilis, N.; Mol, J.M.C.; Garcia, S.J.; Zhou, X.; Thompson, G.E. High Strength Al-Alloys: Microstructure, Corrosion and Principles of Protection. In Recent Trends in Processing and Degradation of Aluminium Alloys; Ahmad, Z., Ed.; Intech Publishing: Rijeka, Croatia, 2011. [Google Scholar]
- Hughes, A.E.; MacRae, C.; Wilson, N.; Torpy, A.; Muster, T.H.; Glenn, A.M. Sheet AA2024-T3: A new investigation of microstructure and composition. Surf. Interface Anal. 2010, 42, 334–338. [Google Scholar] [CrossRef]
- Buchheit, R.G.; Grant, R.P.; Hlava, P.F.; McKenzie, B.; Zender, G.L. Local dissolution phenomena associated with S phase (Al2CuMg) particles in aluminum alloy 2024-T3. J. Electrochem. Soc. 1997, 144, 2621–2628. [Google Scholar] [CrossRef]
- Lacroix, L.; Ressier, L.; Blanc, C.; Mankowski, G. Combination of AFM, SKPFM, and SIMS to study the corrosion behavior of S-phase particles in AA2024-T351. J. Electrochem. Soc. 2008, 155, C131–C137. [Google Scholar] [CrossRef] [Green Version]
- Lacroix, L.; Ressier, L.; Blanc, C.; Mankowski, G. Statistical study of the corrosion behavior of Al2CuMg intermetallics in AA2024-T351 by SKPFM. J. Electrochem. Soc. 2008, 155, C8–C15. [Google Scholar] [CrossRef] [Green Version]
- Ilevbare, G.O.; Schneider, O.; Kelly, R.G.; Scully, J.R. In situ confocal laser scanning microscopy of AA 2024-T3 corrosion metrology—I. Localized corrosion of particles. J. Electrochem. Soc. 2004, 151, B453–B464. [Google Scholar] [CrossRef]
- Schneider, O.; Ilevbare, G.O.; Scully, J.R.; Kelly, R.G. In situ confocal laser scanning microscopy of AA 2024-T3 corrosion metrology—II. Trench formation around particles. J. Electrochem. Soc. 2004, 151, B465–B472. [Google Scholar] [CrossRef]
- Hughes, A.E.; Parvizi, R.; Forsyth, M. Microstructure and corrosion of AA2024. Corros. Rev. 2015, 33, 1–30. [Google Scholar] [CrossRef]
- Wu, X.; Hebert, K. Development of Surface Impurity Segregation during Dissolution of Aluminum. J. Electrochem. Soc. 1996, 143, 83–91. [Google Scholar] [CrossRef]
- Cavanaugh, M.K.; Birbilis, N.; Buchheit, R.G. Modeling pit initiation rate as a function of environment for Aluminum alloy 7075-T651. Electrochim. Acta 2012, 59, 336–345. [Google Scholar] [CrossRef]
- Lide, D.R. CRC Handbook of Chemistry and Physics; CRC Press: Boston, MA, USA, 1990. [Google Scholar]
- Hughes, A.E.; Trinchi, A.; Chen, F.F.; Yang, Y.S.; Cole, I.S.; Sellaiyan, S.; Carr, J.; Lee, P.D.; Thompson, G.E.; Xiao, T.Q. Revelation of Intertwining Organic and Inorganic Fractal Structures in Polymer Coatings. Adv. Mater. 2014, 26, 4504–4508. [Google Scholar] [CrossRef] [PubMed]
- Sellaiyan, S.; Hughes, A.E.; Smith, S.V.; Uedono, A.; Sullivan, J.; Buckman, S. Leaching properties of chromate-containing epoxy films using radiotracers, PALS and SEM. Prog. Org Coat. 2014, 77, 257–267. [Google Scholar] [CrossRef]
- Hughes, A.E.; Trinchi, A.; Chen, F.F.; Yang, Y.S.; Cole, I.S.; Sellaiyan, S.; Carr, J.; Lee, P.D.; Thompson, G.E.; Xiao, T.Q. The application of multiscale quasi 4D CT to the study of SrCrO4 distributions and the development of porous networks in epoxy-based primer coatings. Prog. Org Coat. 2014, 77, 1946–1956. [Google Scholar] [CrossRef]
Figure 1.
(a) Flowchart and schematic representation of the collection and analysis of X-ray emission (PIXE) and γ-ray emission (PIGE) data. The sample is scanned under the beam, and at each step a pixel is generated containing a PIGE and PIXE spectrum, thus forming a hyperspectral dataset; (b) After the end of the data collection, a total spectrum for the sample must be analysed to extract the regions of interest (ROI), from which quantitative analysis can be performed if standards have been collected. Examples of maps, ROI in plan view and PIGE and PIXE spectra from the green region within the primer; (c) Samples can be examined in section or plan view, depending on how they are mounted.

Figure 2.
Backscattered electron images of sections of the primer prior to exposure to NSS. The mounting medium is at the top of the image, the primer is in the centre, and the AA2024-T3 is at the bottom of all images.
Figure 2.
Backscattered electron images of sections of the primer prior to exposure to NSS. The mounting medium is at the top of the image, the primer is in the centre, and the AA2024-T3 is at the bottom of all images.

Figure 3.
Examples of inorganic particles that make up the sample configurations for measuring Li depletion. Examples of (a) MgO and Li2CO3 partticles, (b) BaSO4 particles, (c) Mg-containing particles and (d) mixed TiO2 and BaSO4 particles. The dark areas spots show where point analyses have been performed.

Figure 4.
Typical X-ray spectra for the different inorganic components of the primer system. The arrows either point to that indicated the elements positions or sit above them. It can be seen that for each compound, there is some level of “contamination” due to sampling volume effects or small particles. This is most evident for the small TiO2 particles that show significant Mg levels as well as S, Ba and a little Al.

Figure 5.
EDS mapping results for sample without exposure to neutral salt spray (NSS). (a) Backscattered electron image and maps derived from quantitative analysis, and composite maps for (b) O-Mg-Ba-S with phase labelling (c) O-Mg-Ti, (d) O-Ba-S and (e) Cl-Ti map. (N.B. colour mixing is not the same as three-colour mixing). The Li2CO3 was assigned on the basis that only O and C were detected at any significant levels. The arrow tip in (e) indicates where a very low amount of chlorine was detected.

Figure 6.
PIXE (X-ray) spectra of the (a) primer and (b) AA2024-T3. Corresponding PIGE (γ-ray) spectra of the (c) primer and (d) AA2024-T3. The red lines in (a) and (b) are the fitted curves to the spectra. The dashed lines in (a) and (b) are backgrounds used in the fitting.
Figure 6.
PIXE (X-ray) spectra of the (a) primer and (b) AA2024-T3. Corresponding PIGE (γ-ray) spectra of the (c) primer and (d) AA2024-T3. The red lines in (a) and (b) are the fitted curves to the spectra. The dashed lines in (a) and (b) are backgrounds used in the fitting.

Figure 7.
Combined PIXE and PIGE maps for a sample that has not been exposed to NSS. The PIGE maps (Li-PIGE and Al-PIGE) are labelled as such, and the rest are PIXE maps. The schematic on the top shows the sample configuration and indicates the direction and interface from which leaching has occurred. The colour scale is thermal, with warm colours representing higher concentrations.

Figure 8.
Three-colour maps. (a) Li-Cu-Ba, (b) Li-Ti-Ba and (c) Li-Sr-Ba. In all cases, the Li is red, the barium is blue, the middle element is green; i.e., green changes from top to bottom as Cu, Ti and Sr.
Figure 8.
Three-colour maps. (a) Li-Cu-Ba, (b) Li-Ti-Ba and (c) Li-Sr-Ba. In all cases, the Li is red, the barium is blue, the middle element is green; i.e., green changes from top to bottom as Cu, Ti and Sr.

Figure 9.
(a) Secondary and (b) backscattered electron images of voids resulting from the dissolution of Li2CO3 inhibitor particles after 500 h NSS exposure; (c) Magnification of (b); (d) Interfacial voids between the primer and the Li2CO3 inhibitor particles deep in the primer near the primer/anodised layer interface. Dashed box in (a) indicates the region in (c).

Figure 10.
EDS mapping results for sample with 500 h exposure to NSS. (a) Backscattered electron image and maps derived from quantitative analysis and composite maps for (b) O-Mg-Ba-S with phase labelling (c) O-Mg-Ti, (d) O-S-Ba and (e) Na-Ti-Cl map. (N.B. colour mixing is not the same as three-colour mixing).

Figure 11.
Sample spectra from X-sections of the polyurethane coatings without exposure to (from Figure 5) and 500 h exposure to NSS (Figure 10), respectively. The points from which the spectra have been taken are indicated in each figure by the dashed circle.

Figure 12.
Three-colour maps of sections of the coating prior to NSS exposure and after 500 h exposure to NSS. These maps are combined PIGE (Li–Red) and PIXE, (Sr in Blue and Ba in green). Three colour elemental maps for Li-Cu-Ba (a) without NSS exposure and (b) after 500 h NSS exposure.
Figure 12.
Three-colour maps of sections of the coating prior to NSS exposure and after 500 h exposure to NSS. These maps are combined PIGE (Li–Red) and PIXE, (Sr in Blue and Ba in green). Three colour elemental maps for Li-Cu-Ba (a) without NSS exposure and (b) after 500 h NSS exposure.

Figure 13.
Traverse elemental profiles. (a) Example of a traverse profile where a region is chosen for the profile (green box) and individual elemental intensities are averaged along a line (red line) to produce a point on a line profile (red point); (b) Profiles for Ti (PIXE), Ba (PIXE), Li (PIGE) and Al (PIGE) across the without NSS. Ti and Ba signals are multiplied by five to show the skin layer. (c) PIGE profiles for Al and Li without salt spray and after 500 h NSS. Note the thickness of the coatings are different and the surface is indicated by markers. The 500 h NSS results have been adjusted so that the Al intensity from both conditions is the same, thus allowing qualitative comparison between the two Li profiles.

Figure 14.
(a) Example of the local dissolution front on the three-colour map of the sample exposed to NSS for 500 h; (b) Secondary electron image of the distribution of voids within a region of the sample exposed to NSS for 500 h; (c) Enlargement of the region within the square in (b) showing the connectivity between the voids. The voids are assumed to be due to the dissolution and loss of Li2CO3 particles.

Figure 15.
Model of leaching from the Li2O3-inhibited primer based on the observations for 500 h exposure to NSS. Leaching appears to occur both uniformly as well as locally. The uniform depletion appears to be associated with changes in coating, whereas the local depletion appears to be associated with selective removal of Li2O3 particles.


Table 1.
Chemical composition of inorganic additives used in this study.
| Element | Li2CO3 (mg/kg) | TiO2 (%m/m) | MgO (mg/kg) | BaSO4 (%m/m) |
|---|---|---|---|---|
| Al | 5 | 1.4 | 70–77 | 0.1 |
| Ca | 91–98 | – | 1500–1900 | 0.1 |
| Na | 660–810 | – | 180–210 | 0.4 |
| Ba | 2 | – | 2–5 | res |
| Si | – | – | – | 0.4 |
| Sr | – | – | – | 0.9 |
| Ti | – | – | – | 0.1 |
| Zr | – | 0.4 | – | – |
| Fe | 2 | – | 73–78 | – |
| Mn | – | – | 13–15 | – |
| Ni | – | – | 5–6 | – |
| K | 400–700 | – | 200–300 | – |
| Mg | 39–40 | – | – | 1 |
Table 2.
Inorganic additive size distribution presented as the percentage of particles at a particular size in microns.
Table 2.
Inorganic additive size distribution presented as the percentage of particles at a particular size in microns.
| Additive | 10% | 50% | 90% | 99% |
|---|---|---|---|---|
| MgO | 3.91 | 8.48 | 14.58 | 20.23 |
| Li2CO3 | 4.78 | 8.87 | 13.44 | 18.26 |
| TiO2 | 3.22 | 5.64 | 8.84 | 13.94 |
| BaSO4 | 3.82 | 6.48 | 10.19 | 49.68 |
Table 3.
Composition (at %) from EDS analysis of inorganic particles in the primer. Each datum is an average of five determination on large particles. (Data overaged over four analyses).
Table 3.
Composition (at %) from EDS analysis of inorganic particles in the primer. Each datum is an average of five determination on large particles. (Data overaged over four analyses).
| Particle Type | No NSS | 500 h NSS |
|---|---|---|
| BaSO4 (Ba:S:O) | 1.00:1.04 ± 0.05:3.89 ± 0.71 | 1.00:0.98 ± 0.01:3.51 ± 0.26 |
| Mg-(hydr)oxide (Mg:O) | 1.00:1.64 ± 0.11 | 1.00:0.93 ± 0.15 |
| Li2CO3 (O:C) | 1.72 ± 0.21 | 2.02 ± 0.32 |
Table 4.
Characteristic thickness of Li-depletion zones in microns.
| Sample | Total Thickness (μm) | Skin Layer (μm) | Homogenously Depleted Zone (μm) | Deepest Depletion (μm) |
|---|---|---|---|---|
| SEM No NSS | 33.5 ± 5 | 3–4 | – | – |
| PIXE/PIGE No NSS | 33.7 ± 2.5 | Up to 5 | – | – |
| PIXE/PIGE 500 h NSS | 45.4 ± 6.5 | – | 11 ± 8 | 25 |
| SEM 500 h NSS | 32.6 ± 1.0 | – | 9–12 | Film thickness |
© 2017 by the authors. Licensee MDPI, Basel, Switzerland. This article is an open access article distributed under the terms and conditions of the Creative Commons Attribution (CC BY) license (http://creativecommons.org/licenses/by/4.0/).
Share and Cite
MDPI and ACS Style
Hughes, A.; Laird, J.; Ryan, C.; Visser, P.; Terryn, H.; Mol, A. Particle Characterisation and Depletion of Li2CO3 Inhibitor in a Polyurethane Coating. Coatings 2017, 7, 106. https://doi.org/10.3390/coatings7070106
AMA Style
Hughes A, Laird J, Ryan C, Visser P, Terryn H, Mol A. Particle Characterisation and Depletion of Li2CO3 Inhibitor in a Polyurethane Coating. Coatings. 2017; 7(7):106. https://doi.org/10.3390/coatings7070106
Chicago/Turabian StyleHughes, Anthony, James Laird, Chris Ryan, Peter Visser, Herman Terryn, and Arjan Mol. 2017. "Particle Characterisation and Depletion of Li2CO3 Inhibitor in a Polyurethane Coating" Coatings 7, no. 7: 106. https://doi.org/10.3390/coatings7070106
Note that from the first issue of 2016, this journal uses article numbers instead of page numbers. See further details here.