1. Introduction
Drug development is a long, tedious and expensive process. One of the main factors preventing drug candidates from proceeding to advanced stages of research of their clinical development is their low solubility and low permeability, since they determine absorption and distribution, hence defining the future pharmacokinetic profile and bioavailability of the drug. The Biopharmaceutics Classification System (BCS) differentiates drug candidates into four categories based on their solubility and permeability [
1]. Although ideally drugs on the market should show an optimal combination of both solubility and permeability (BCS I category), around 40% of orally administered drugs belong to BCS class II (low solubility and high permeability) and it is estimated that approximately 70% of the new chemical entities in development have low solubility [
2]. This is because, during drug development, lipophilicity is often increased to gain higher affinity and selectivity, thereby leading to poor solubility and low oral absorption of the final drug candidates [
3]. Hence, improving the physicochemical properties of drugs without altering their molecular structure constitutes a real challenge for the development of new pharmaceuticals.
Most drugs are currently administered in solid state, with many of them having a crystalline nature. An interesting pharmaceutical approach consists in tailoring the physicochemical properties of active pharmaceutical ingredients (APIs) by actually controlling the crystalline structure of such solids [
4]. For instance, cocrystallization has emerged as a powerful crystal engineering tool able to efficiently modulate the physicochemical properties of APIs, without altering their chemical structure [
5,
6,
7,
8,
9]. When all components in the cocrystal are APIs, then a particular type of pharmaceutical cocrystal is yielded, so-called codrug or drug–drug cocrystal [
10]. This interesting approach aims for synergic mechanisms in drug administration that enhance the activity, stability, or delivery properties of such drugs, potentially reducing associated side effects in patients with multimodal therapies [
11,
12].
The selected synthetic method, including variables such as reaction time, temperature, pressure, solvents and stoichiometry, as well as the careful design of synthons, drives the formation of API–API cocrystals. These items are of outmost importance when designing pharmaceutical codrugs since they determine not only the robustness of these systems but also their potential escalation to industry [
13,
14]. We should bear in mind that in biological systems codrugs must preserve their chemical entity to exert their benefits, avoiding dissociation and transformations; not an easy task considering that cocrystals are built by non-covalent intermolecular interactions after all. Likewise, understanding which circumstances can promote conversion phenomena in cocrystals can offer crucial information about the precise role of supramolecular synthons and crystal packing in the design of efficient pharmaceutical codrugs.
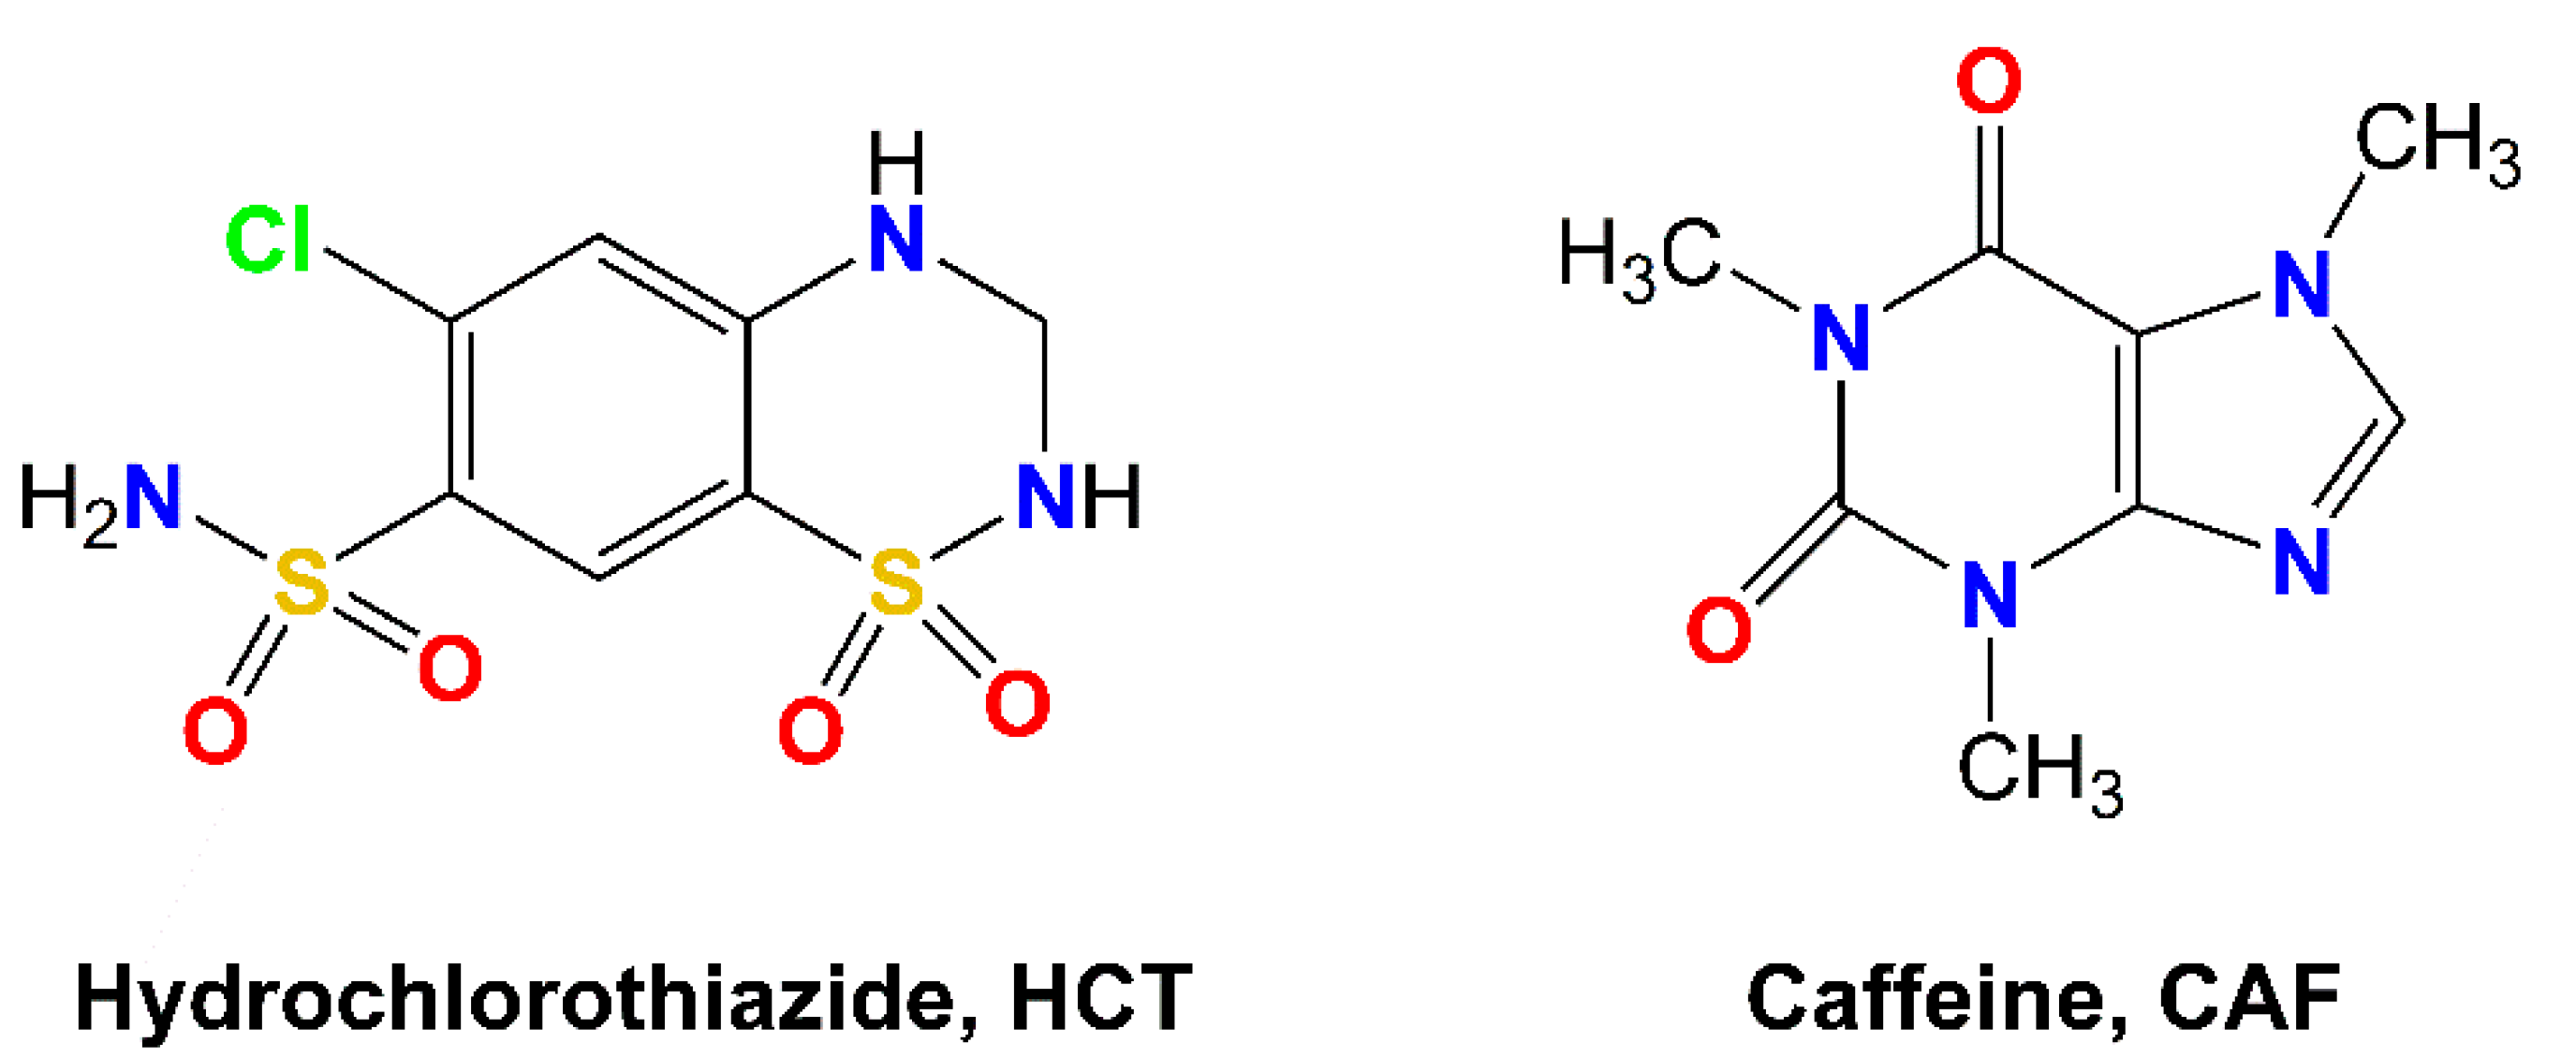
Hydrochlorothiazide (HCT,
Scheme 1) is defined as a diuretic and antihypertensive drug that works increasing urination by affecting the distal renal tubular mechanism of electrolyte reabsorption. In clinics, HCT is prescribed alone or in combination with other drugs to treat high blood pressure, edema or, in general, any fluid retention caused by a secondary medical condition such as heart disease or corticosteroids side-effects. HCT is a BCS class IV drug, thus showing slight solubility in water (0.7 g/L) and low permeability (Caco-2 permeability: −6.06), and therefore exhibiting poor oral absorption and bioavailability [
15]. Cocrystallization studies on HCT have already been reported aiming to improve the solubility and permeability of this drug [
16,
17]. In such cases, the solubility of the drug was increased but modification of the sulfonamide synthon of HCT was requested to observe an improvement in the permeability of the designed cocrystals.
Caffeine (CAF,
Scheme 1) is a natural xanthine-derivative alkaloid present in plants, widely used in the food and pharmaceutical industries. Since CAF has an excellent safety profile, it has also been used in cocrystallization studies as a model to demonstrate the potential for tailoring the physicochemical properties of pharmaceuticals [
18]. Beside the well-known stimulant effects of caffeine, and similar to HCT, chronic CAF intakes also seem to increase urination, although using a different mechanism [
19]. Indeed, high caffeine consumption along with HCT medication is not recommended due to risk of dehydration in patients. However, adequate research on a potential codrug HCT–CAF, looking for a synergic effect between the APIs, might be of interest, since it would allow HCT doses to be reduced while keeping the diuretic function by two different mechanisms, thus improving the safety profile of such diuretic therapy.
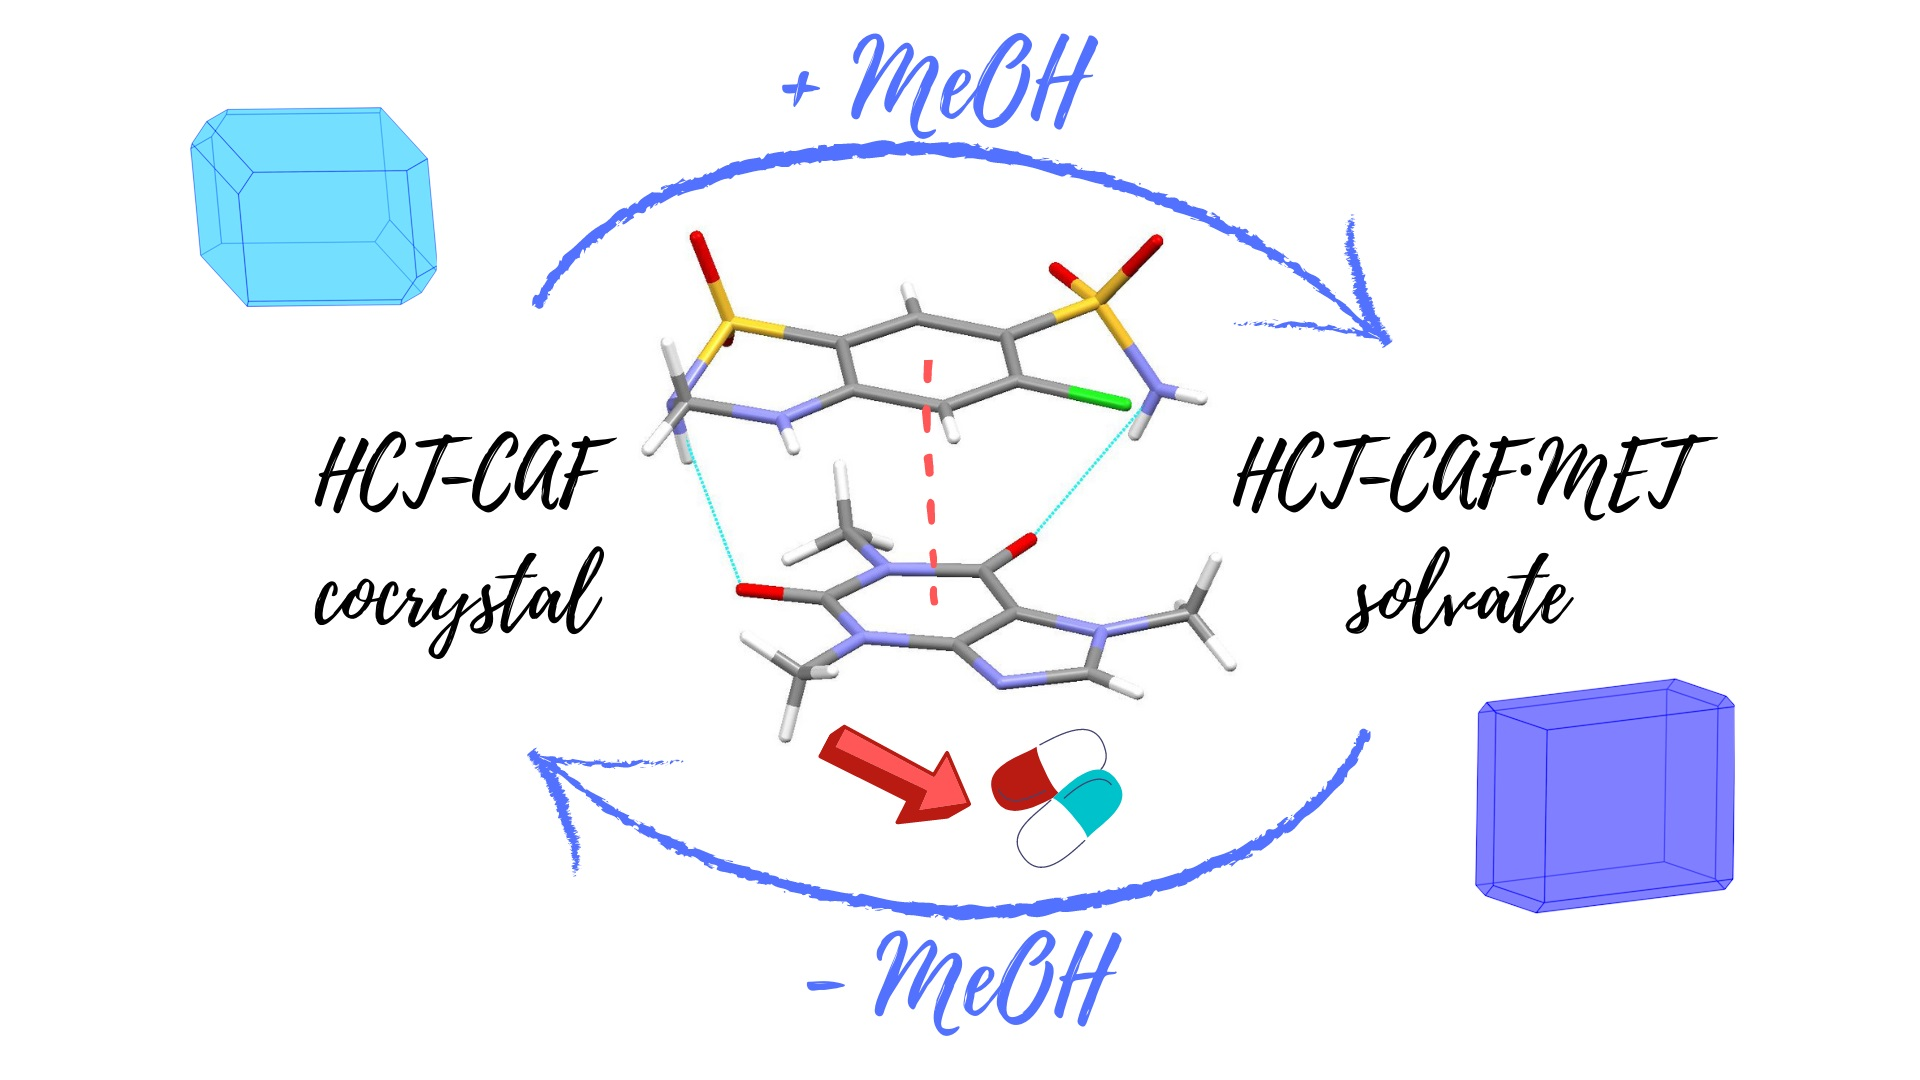
This study reports on the synthesis and physicochemical characterization of two codrug species: the HCT–CAF cocrystal and its MeOH solvate. Interestingly, these structures are readily interconvertible under the appropriate conditions showing very similar molecular structures. Moreover, the molecular electrostatic potential (MEP) surfaces and the intermolecular interactions present at the cocrystal and its methanol solvate have been studied energetically and by means of QTAIM and NCIplot analyses.
2. Experimental Section
2.1. Materials
The hydrochlorothiazide, caffeine and solvents used are commercially available from Sigma-Aldrich. All solvents were used as received without additional purification.
2.2. General Procedure for Mechanochemical Synthesis
Mechanochemical syntheses of cocrystals were conducted by neat or liquid-assisted grinding (LAG) in a Retsch MM200 ball mill operating at 25 Hz frequency using stainless steel jars along with stainless steel balls of 7 mm diameter. All syntheses were repeated to ensure reproducibility. Neat grinding: equal stoichiometric amounts of HCT and CAF were mixed without any solvent and the resulting powder was analyzed by powder X-ray diffraction (PXRD). Liquid-assisted grinding: different molar ratios (1:1, 1:2, and 2:1) of HCT and CAF were mixed and ground to determine the stoichiometry of the cocrystal. For liquid-assisted grinding screening, acetone (ACE), acetonitrile (ACN), ethyl acetate (ETA) and methanol (MET) were used as solvents.
Synthesis of HCT–CAF: a mixture of HCT (74.44 mg, 0.25 mmol) and CAF (97.10 mg, 0.50 mmol) in a 1:2 stoichiometric ratio was placed in a 10 mL stainless steel jar along with 150.0 μL of acetone and two stainless steel balls of 7 mm diameter. The mixture was then milled for 30 min.
Synthesis of HCT–CAF·MET: a mixture of HCT (74.44 mg, 0.25 mmol) and CAF (97.10 mg, 0.50 mmol) in a 1:2 stoichiometric ratio was placed in a 10 mL stainless steel jar along with 150.0 μL of methanol and two stainless steel balls of 7 mm diameter. The mixture was then milled for 30 min.
Cogrinding of the blend of HCT–CAF was monitored. Different samples of the mixture of the components were milled separately for different time periods up to 30 min. Such samples were then analyzed by PXRD to examine changes in crystallinity and evaluate cocrystal formation. The raw data obtained in all these samples were analyzed through the Rietveld method in order to quantify the phases present at each time period.
2.3. Preparation of Single Crystal
Single crystals were grown by solvent evaporation at room temperature using the polycrystalline material obtained from mechanical synthesis. Suitable crystals for X-ray diffraction studies were obtained from recrystallization in saturated solutions after approximately 2 days: ethyl acetate for HCT–CAF and methanol for HCT–CAF·MET.
2.4. Single-Crystal X-ray Diffraction (SCXRD)
Measured crystals were prepared under inert conditions immersed in perfluoropolyether as protecting oil for manipulation. Suitable crystals were mounted on MiTeGen Micromounts™, and these samples were used for data collection. Data for HCT–CAF and HCT–CAF·MET were collected with a Bruker D8 Venture diffractometer (Bruker-AXS, Karlsruhe, Germany) with graphite monochromated MoKα radiation (λ = 0.71073 Å). The data were processed with APEX3 suite [
20]. The structures were solved by intrinsic phasing using the ShelXT program [
21], which revealed the position of all non-hydrogen atoms. These atoms were refined on F
2 by a full-matrix least-squares procedure using the anisotropic displacement parameter [
22]. All hydrogen atoms were located in difference Fourier maps and included as fixed contributions riding on attached atoms with isotropic thermal displacement parameters 1.2 or 1.5 times those of the respective atom. The Olex2 software was used as a graphical interface [
23]. Intermolecular interactions were calculated using PLATON [
24]. Molecular graphics were generated using Olex2 [
23] and Mercury [
25]. The crystallographic data for the reported structures were deposited with the Cambridge Crystallographic Data Center as supplementary publication no. CCDC 2043951 and 2043952. Additional crystal data are shown in
Table 1. Copies of the data can be obtained free of charge at
http://www.ccdc.cam.ac.uk/products/csd/request.
2.5. Powder X-ray Diffraction (PXRD)
Powder X-ray diffraction data were collected using a Bruker D8 Advance Vαrio diffractometer (Bruker-AXS, Karlsruhe, Germany) equipped with a LYNXEYE detector and Cu-Kα
1 radiation (1.5406 Å). All the Rietveld refinements and profile fittings were conducted using the software Diffrac.TOPAS 6.0 [
26]. The bulk phase purity was checked by Rietveld refinement. The refinement was carried out using available structural crystallographic information of the two constitutive phases, namely HCT and CAF, as well as the new reported phases. In these refinements, only the background, unit cell parameters and zero error were refined.
Rwp values obtained in all cases demonstrate an excellent agreement between the structural model and the bulk phase measured by powder diffraction.
2.6. Thermal Analysis
Simultaneous thermogravimetric analysis (TGA) and differential scanning calorimetry (DSC) measurements were performed using a Mettler-Toledo TGA/DSC1 thermal analyzer (Mettler Toledo, Columbus, OH, USA). Samples (3–5 mg) were placed into sealed aluminum pans and heated in a stream of nitrogen (100 mL min−1) from 25 to 400 °C at a heating rate of 10 °C min−1.
2.7. Stability Test
Slurry experiments were conducted using excess powder samples of each phase in 1 mL of water for 24 h at room temperature in a sealed vial containing a magnetic stirrer. The solids in the vials were collected, filtered and dried at 35 °C for subsequent analysis by PXRD.
Stability of all the new phases was also studied at accelerated storage condition; 200 mg of each solid was taken in watch glasses and the physical stability was evaluated at 40 °C in 75% relative humidity using a Memmert HPP110 climate chamber (Memmert, Schwabach, Germany). The samples were subjected to the above accelerated stability conditions for 3 days and weekly intervals from 1 week to 4 weeks. PXRD was used to monitor the stability of the solid forms.
2.8. Solubility Test
Solubility studies for pure HCT and for each new phase were performed using a Varian Cary 50 ultraviolet (UV)−visible spectrophotometer (Agilent Technologies, Santa Clara, CA, USA). The calibration curve was prepared using standard solutions of HCT, which were analyzed at 316 nm to avoid coformer interference. The shake-flask method [
27] was used to determine the solubility of each solid. Saturated solutions were obtained by stirring an excess amount of each sample in 10 mL of pH 7.4 phosphate buffer medium at room temperature for 24 h. The solutions were then centrifuged and filtered to remove the excess of solid, and dilutions were performed until obtaining appropriate absorbance values. The absorbance measurements of the diluted solutions from the saturated ones were used to quantify the amounts of solubilized samples, considering the dilution factor.
2.9. Infrared Spectroscopy
Fourier-transform infrared (FTIR) spectroscopic measurements were performed on a Bruker Tensor 27 FTIR instrument (Bruker Corporation, Billerica, MA, USA) equipped with a single-reflection diamond crystal platinum ATR unit and OPUS data collection program. The scanning range was from 4000 to 400 cm−1 with a resolution of 4 cm−1.
2.10. Computational Methods
The energies of the dimers included in this work were computed at the PBE0-D3/def2–TZVP level of theory by using the program Gaussian-16 [
28]. The interaction energy ΔE, is defined as the energy difference between the dimer and the sum of the energies of both monomers. For the calculations, we have used the X-ray coordinates and optimized only the position of the H-atoms. The basis set superposition error has been corrected using the counterpoise method [
29]. The Weigend def2–TZVP [
30,
31] basis set combined with the PBE0 functional [
32,
33] has been used for the calculations. D3 dispersion correction [
34,
35] has been included to better estimate the π-π interactions. The MEP surface calculations have been computed using the 0.001 isosurface using Gaussian-16 software at the PBE0-D3/def2–TZVP level of theory. The combined NCIPlot [
36,
37] index and QTAIM analyses have been performed using the PBE0-D3/def2–TZVP wave function and the AIMAll program [
38].
3. Results and Discussion
3.1. Mechanochemical Synthesis
Mechanochemistry has proved to be an effective method to prepare multicomponent forms (salts, cocrystals, hydrates/solvates as well as their respective combinations and also polymorphs), particularly in the search of new solids involving pharmaceuticals [
39,
40,
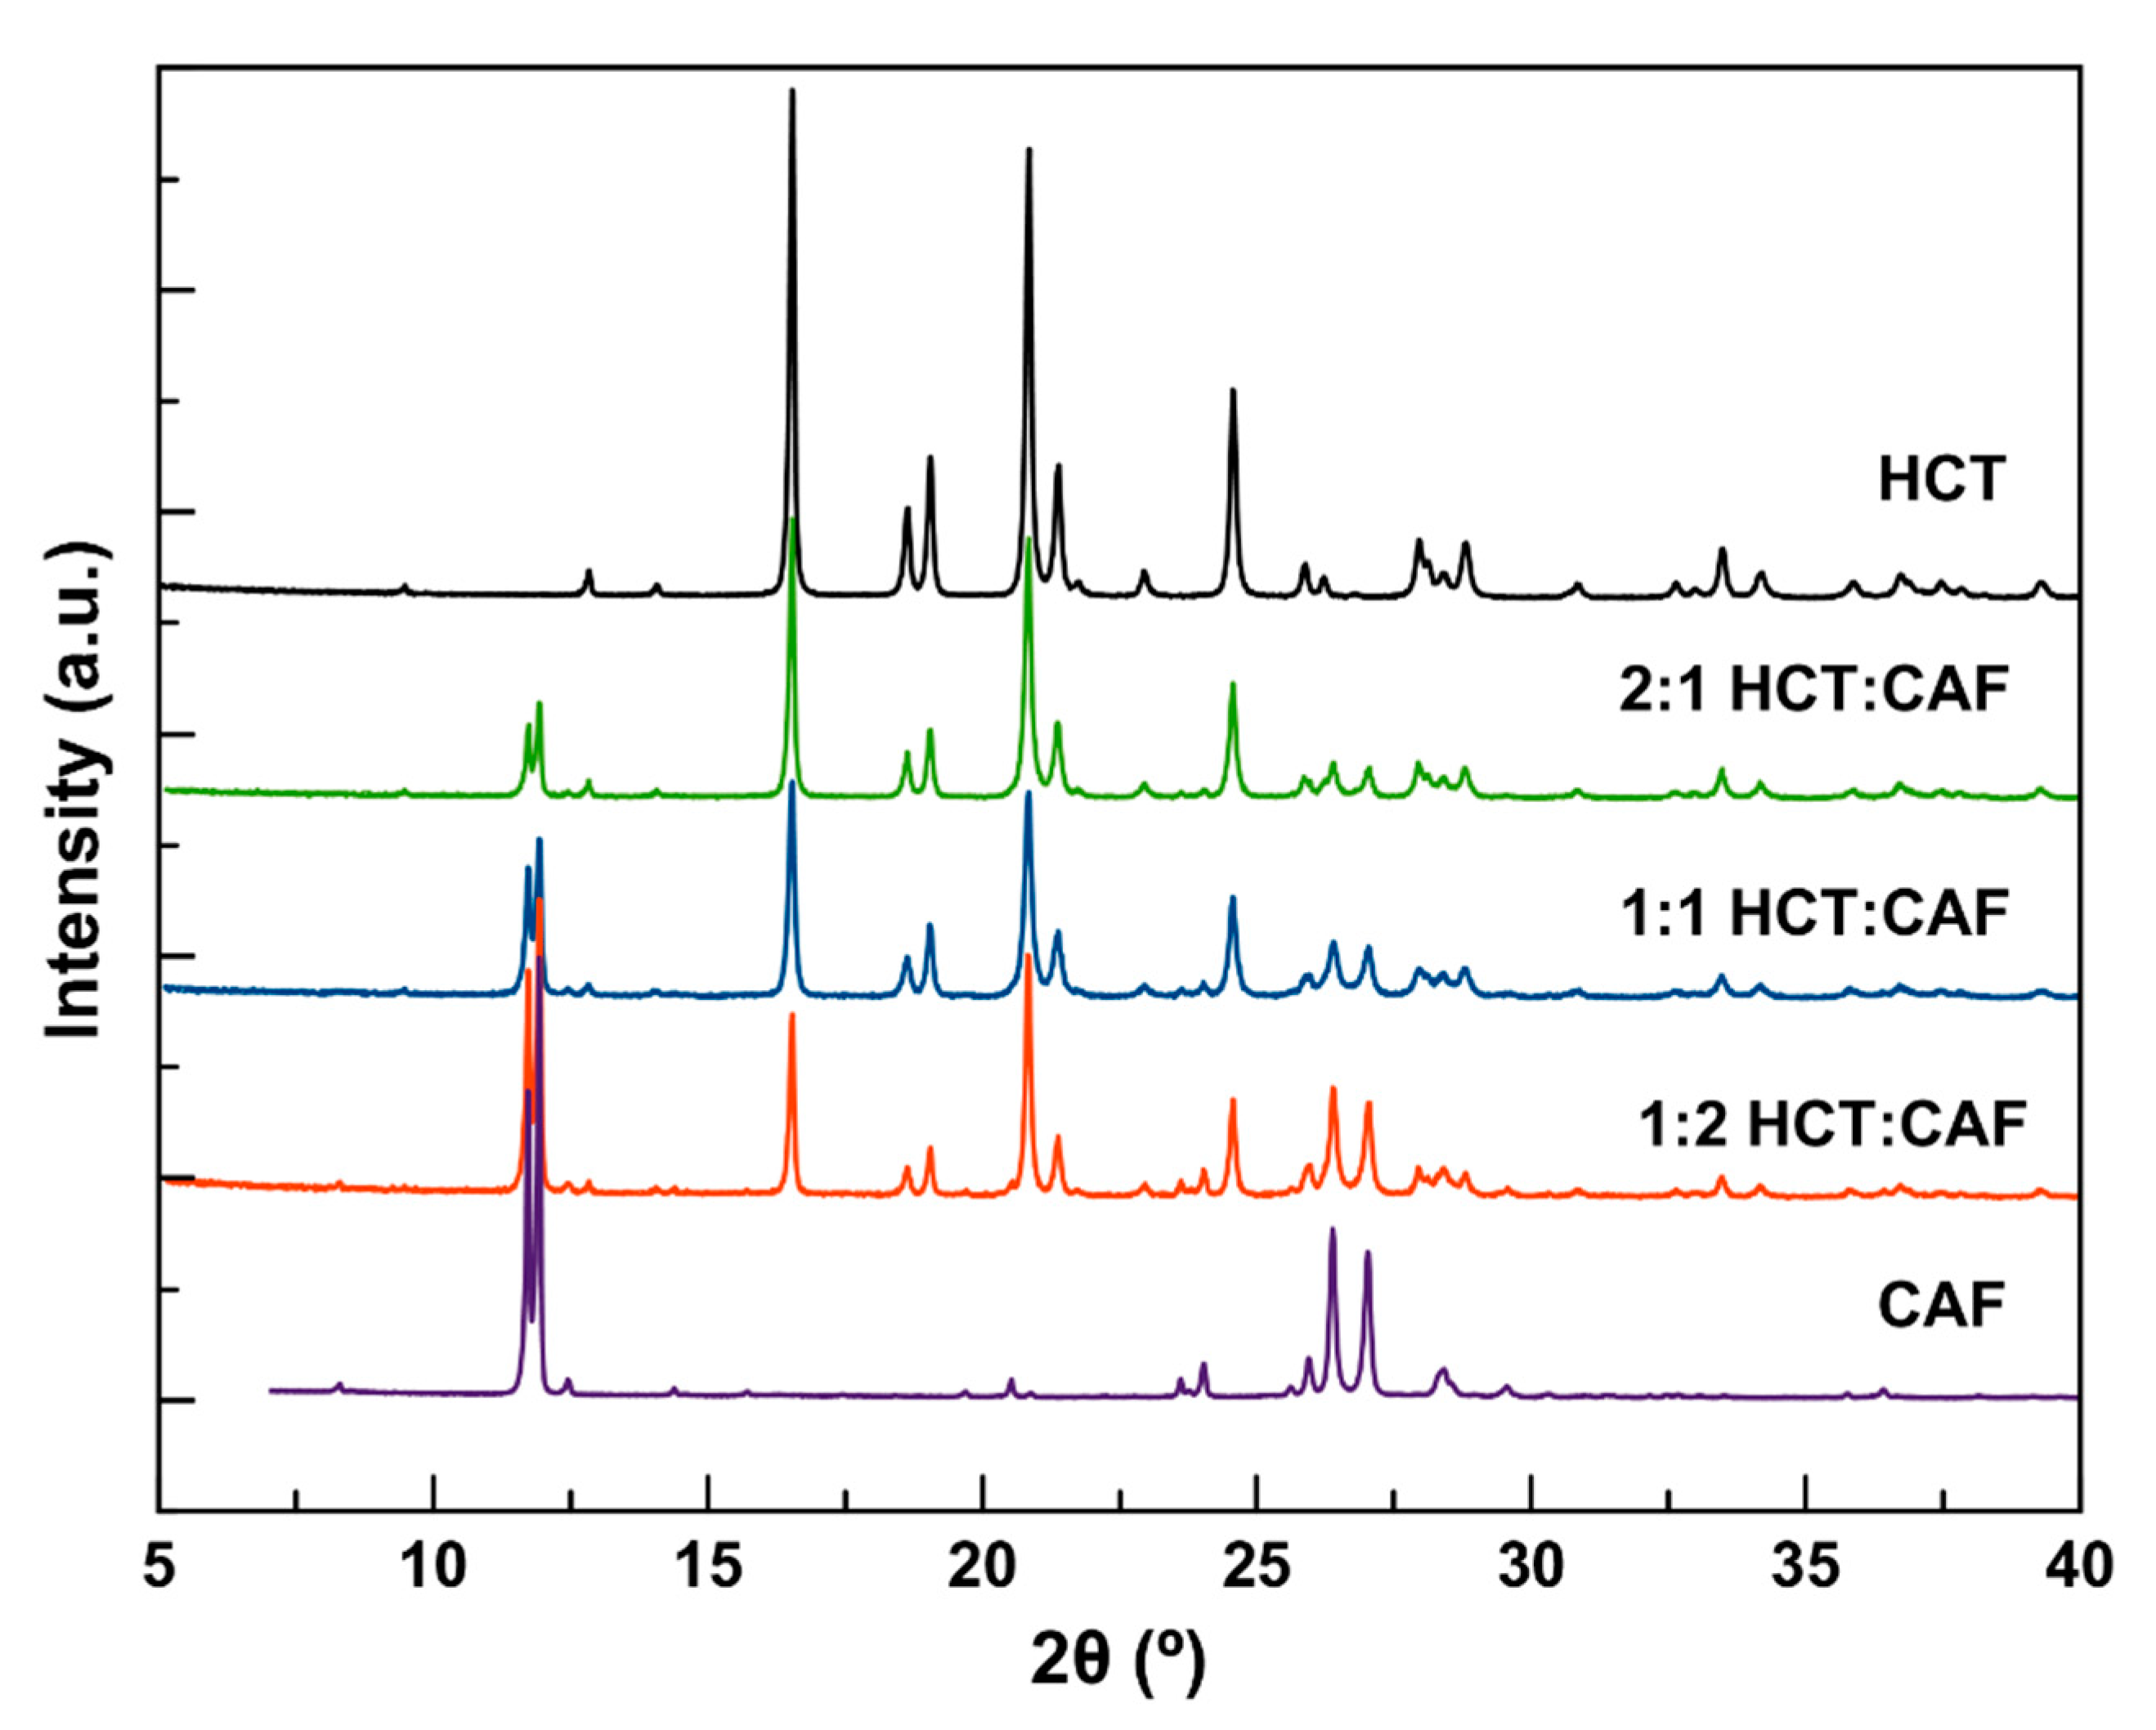
41]. Cocrystallization of HCT with CAF was carried out by neat and LAG using various stoichiometries (1:1, 1:2 and 2:1). Neat grinding resulted in a physical mixture of the APIs in all cases (
Figure 1), meanwhile the solvent screening (acetone, acetonitrile, ethyl acetate, and methanol) resulted in a new cocrystal (HCT–CAF) and its methanol solvate (HCT–CAF·MET). The patterns of HCT–CAF obtained by grinding different molar ratios of the two components were compared with the patterns of isolated HCT and CAF. The comparison shows that all three ratios have common characteristic peaks that were different from the two APIs. The 1:1 and 2:1 HCT:CAF patterns also contained peaks characteristics to HCT. Only the 1:2 products had a completely different pattern and it was exactly the same as that simulated from the crystal structures of the new multicomponent forms reported in this work (
Figure S1, in Supplementary Materials). The analysis by PXRD of the samples generated during LAG experiments of 1:2 blends revealed that ACE, ACN and ETA afforded the same phase, meanwhile MET resulted in a different phase. These two new phases exhibit similar patterns and were used for further recrystallization to obtain suitable crystals for structure determination.
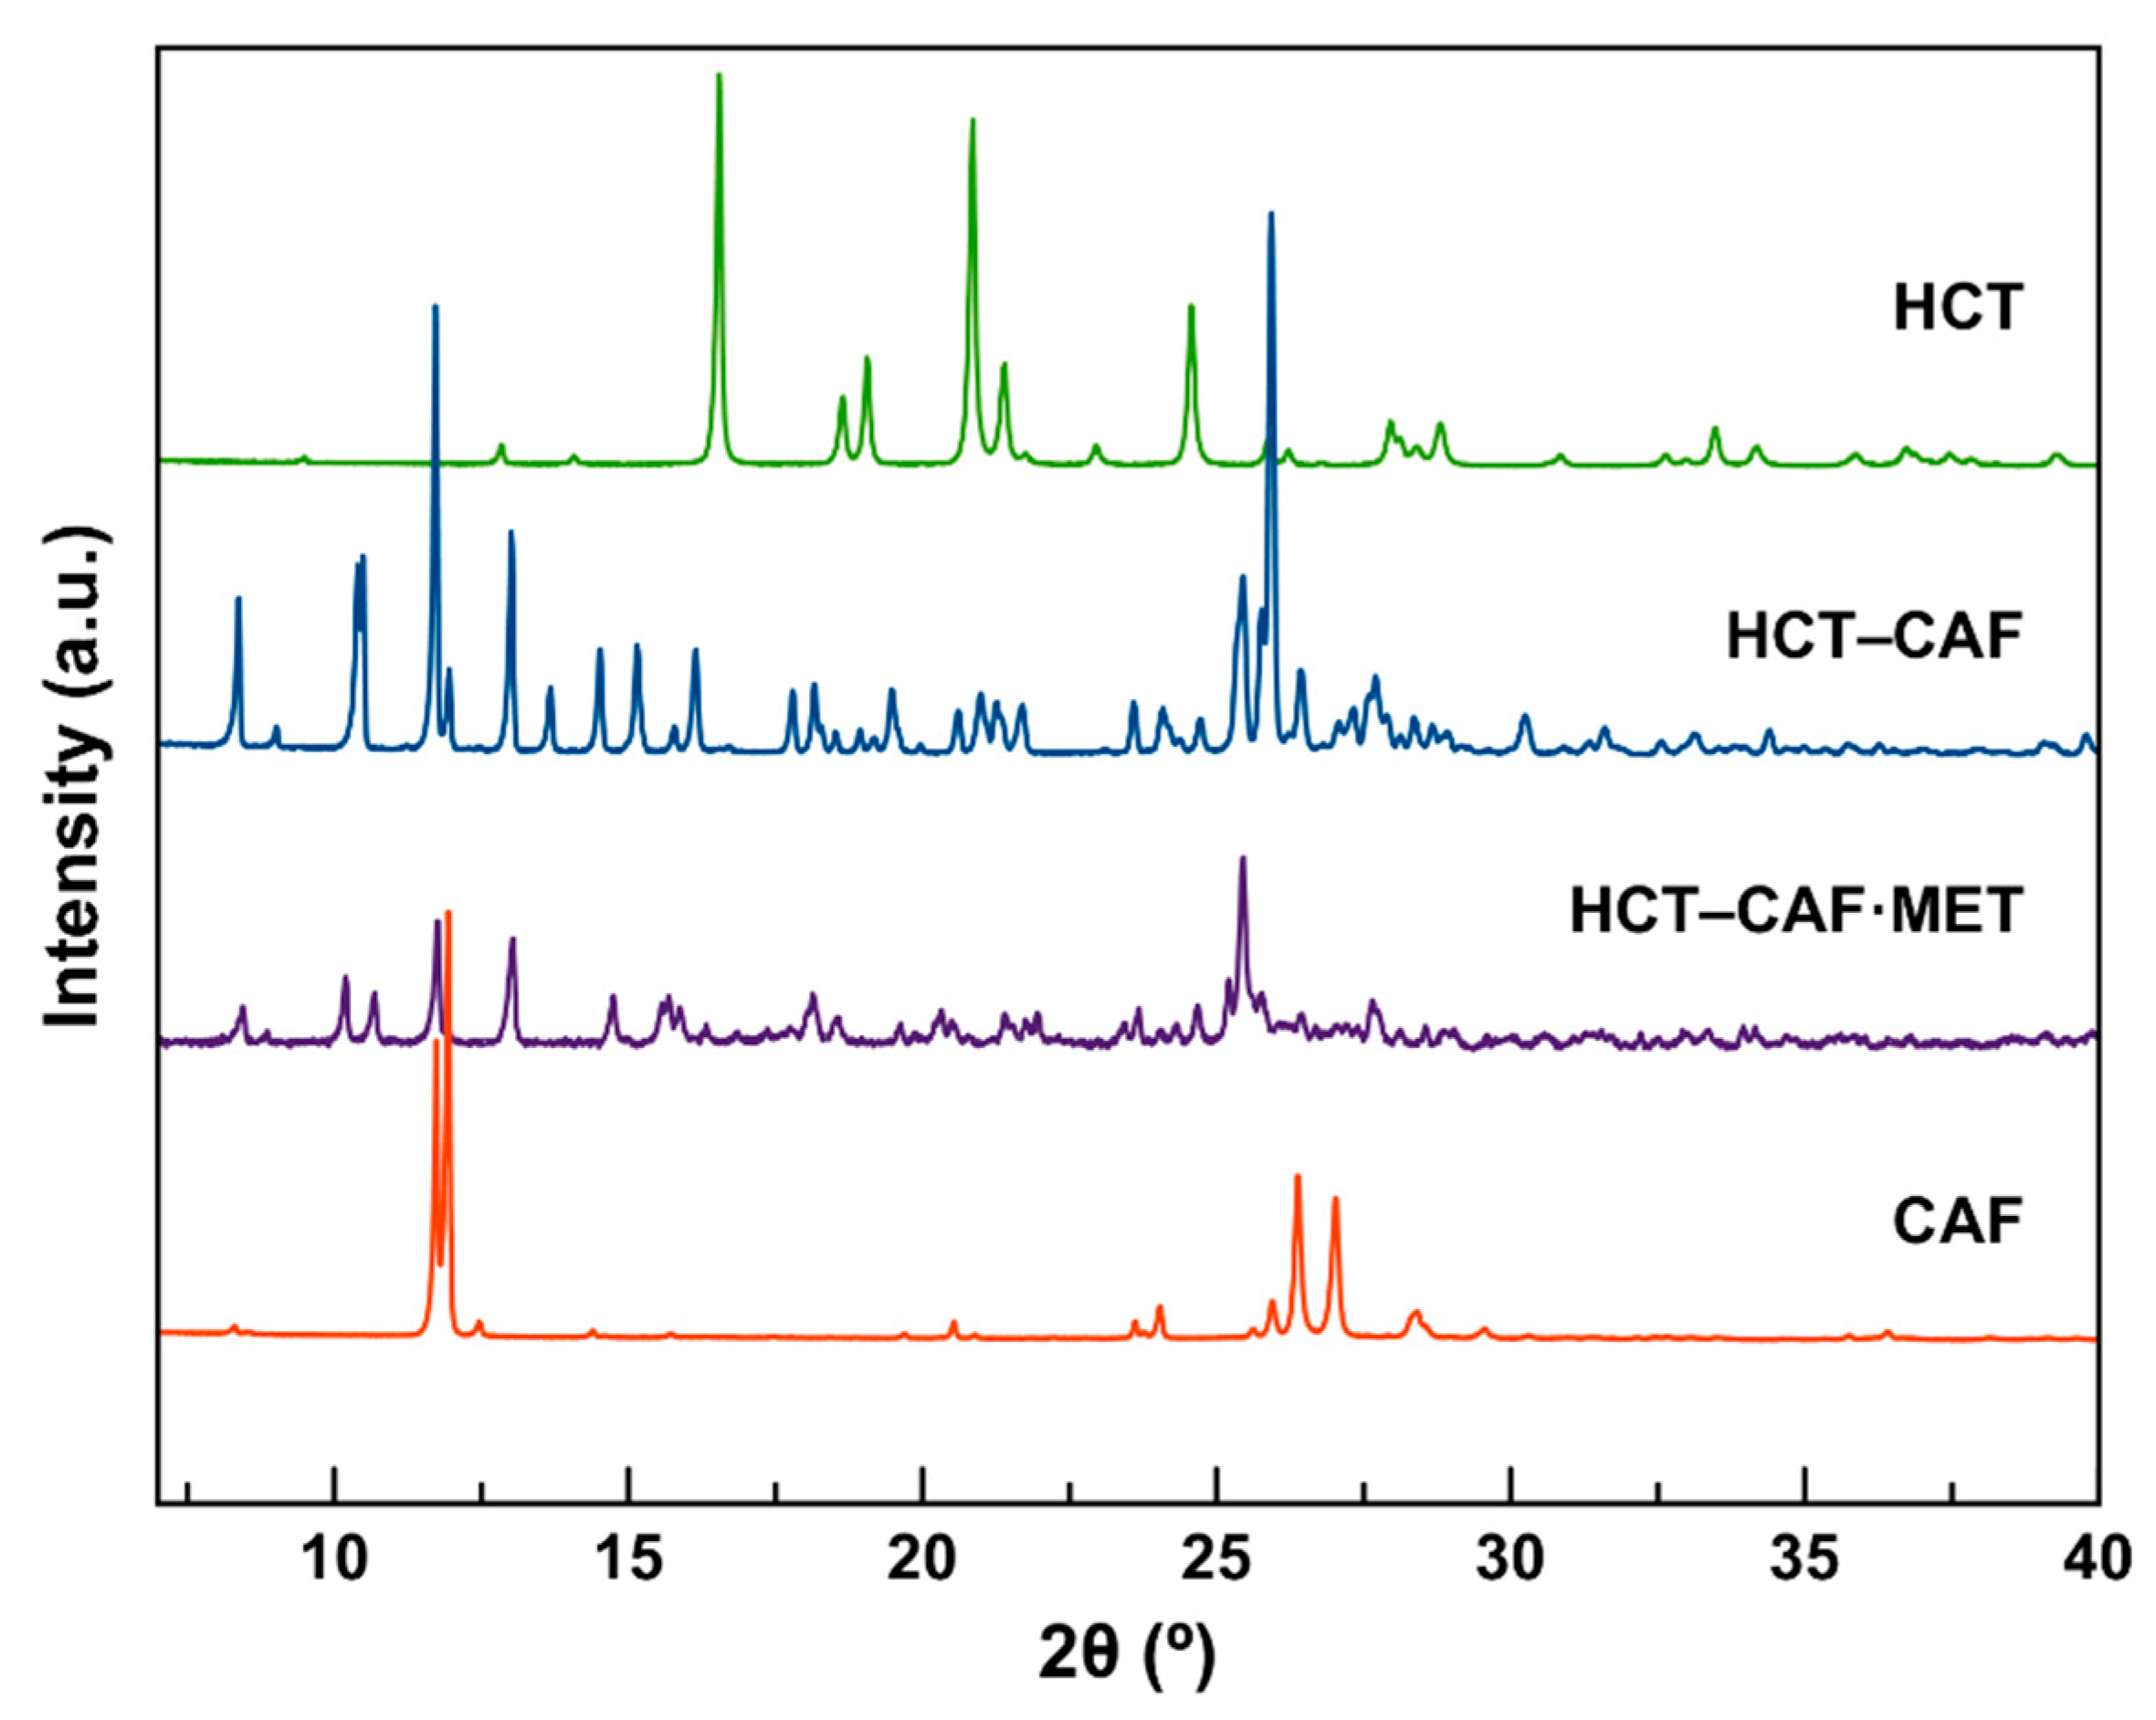
The corresponding PXRD patterns of the new phases are shown in
Figure 2. For both compounds, the PXRD data show that all reflections of the reagents disappeared completely. In addition, in all cases, there is a good agreement between the experimental and the simulated patterns (
Figure S2).
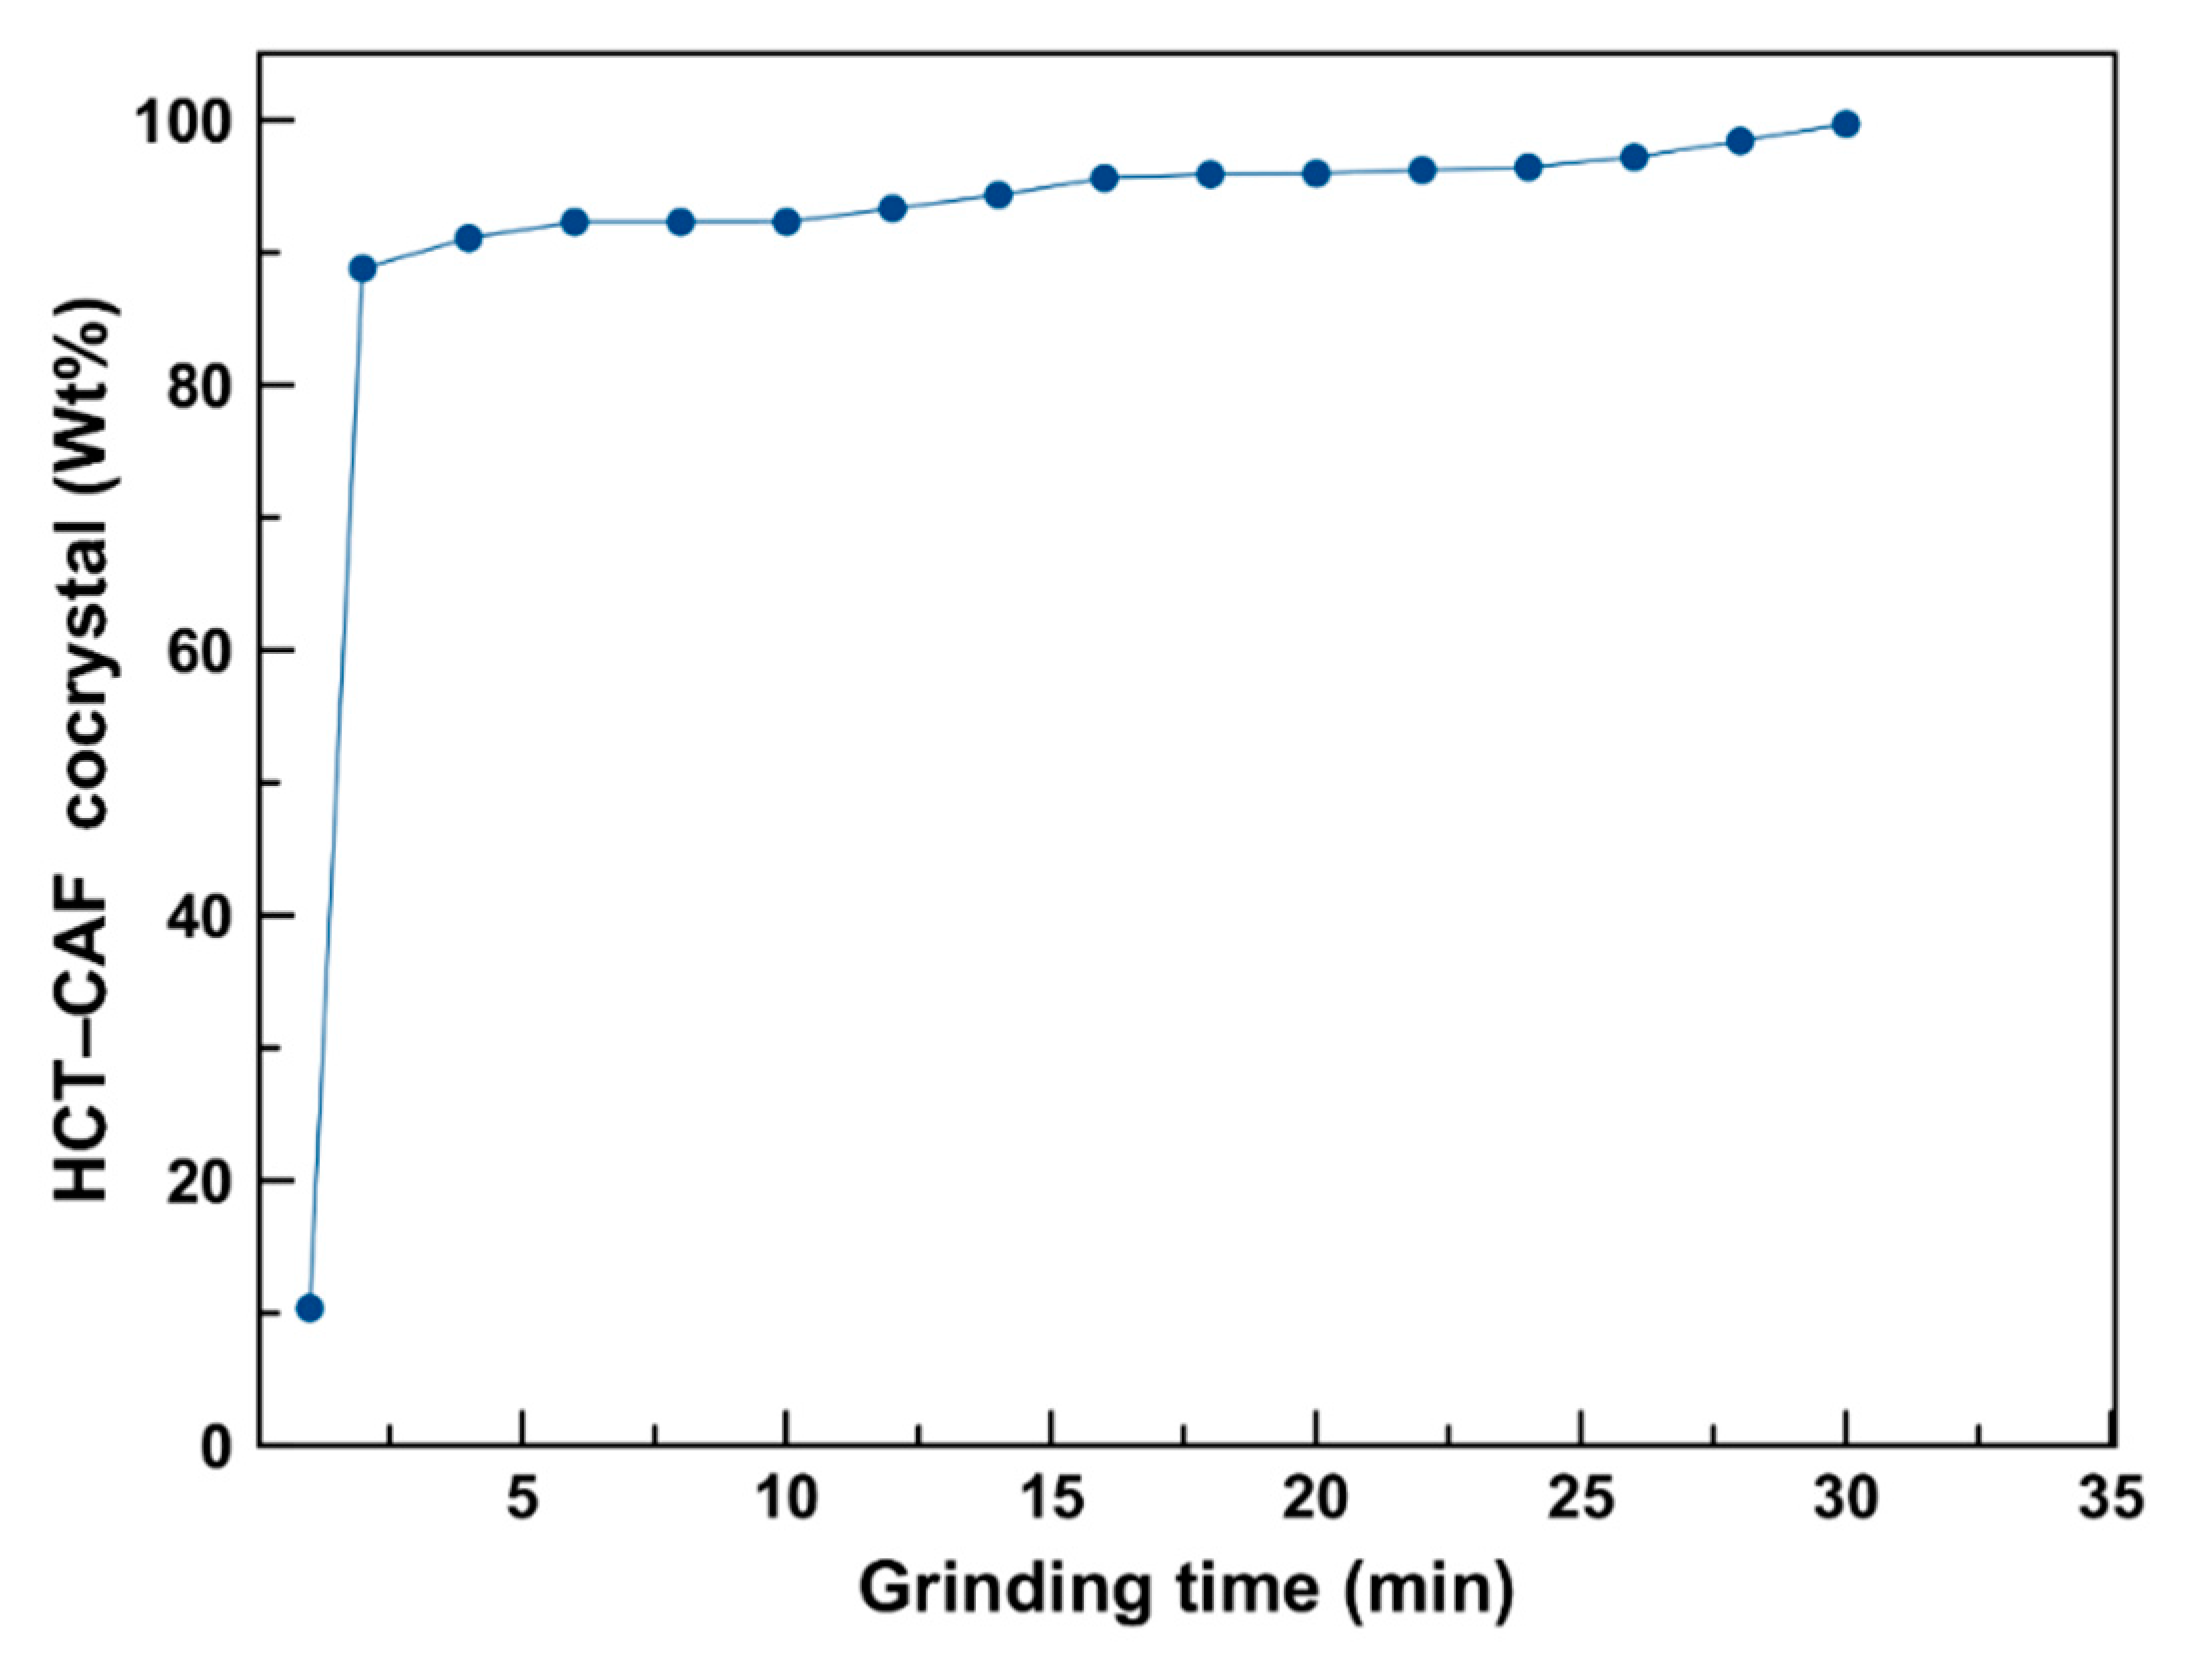
The extent of cocrystalization during cogrinding is shown in
Figure 3. Quantification was undertaken by Rietveld analysis on the obtained X-ray diffraction pattern as described in the experimental section. These results indicate the quick formation of the HCT–CAF cocrystal with a faster rate of cocrystallization in the early stages of the process and approximately 99% cocrystal formed after cogrinding for 30 min.
3.2. Structural Studies of Multicomponent Forms
The conformational flexibility of HCT with respect to the primary sulfonamide group (−SO
2NH
2) has been studied using computational methods [
42,
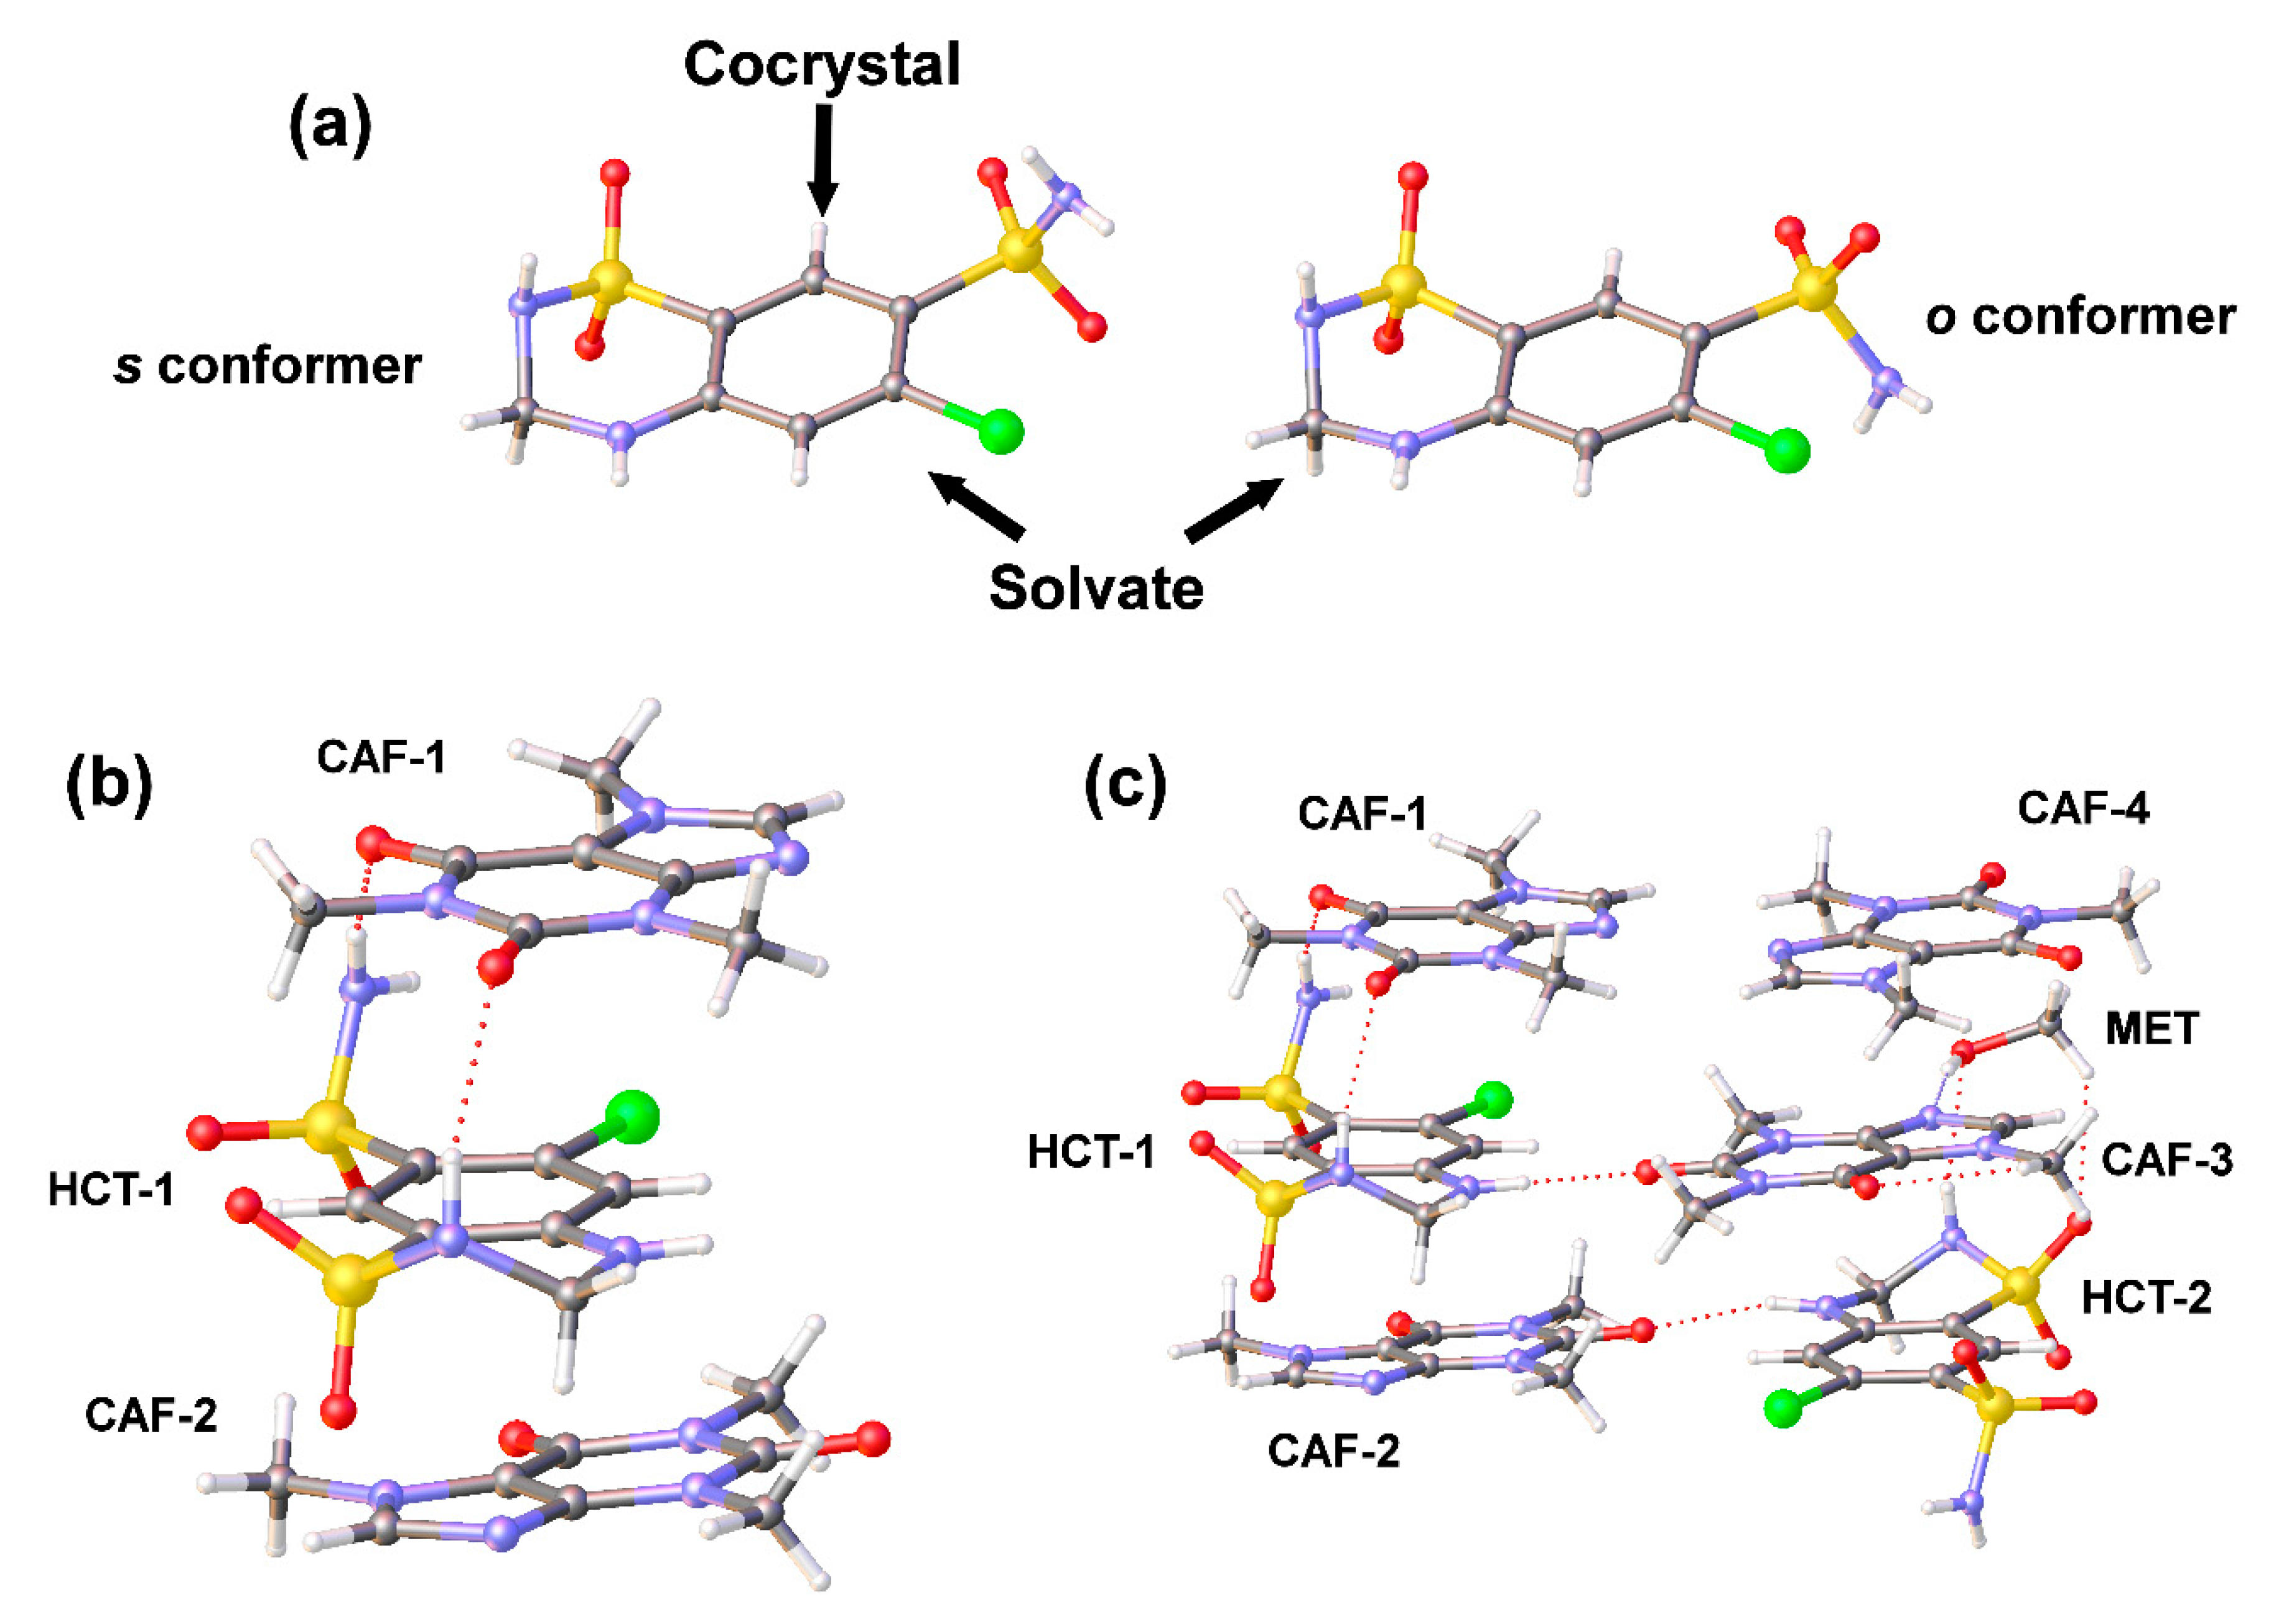
43]. According to the relative position of the amino (secondary sulfonamide) and N−H (primary sulfonamide) groups with respect to the benzothiodiazine ring, three low-energy HCT conformers were reported: (1)
o: opposite sides of the plane; (2)
s: same side of the plane and (3)
p: in the plane; following the conformational energy order:
o <
s << p, with close energy values for
o and
s conformations. A survey of the Cambridge Structural Database (CSD version 5.41, update 3 from August 2020) based on HCT resulted in 40 hits. A search of this dataset for conformers revealed a total of 20 systems where HCT exhibits both amino groups located on the same side (
s conformer), 18 systems with amino groups lying on the opposite side (
o conformer) and 2 systems by both HCT conformations (
o and
s) (refcodes ODATIX and DADMUT).
Single-crystal X-ray diffraction analysis (
Table 1 and
Figures S3 and S4) confirmed the cocrystal nature of HCT–CAF as well as the cocrystal solvate formation of HCT–CAF·MET obtained by LAG of the APIs in methanol. Both
o and
s HCT conformations are observed in the new structures reported in this work (
Figure 4a).
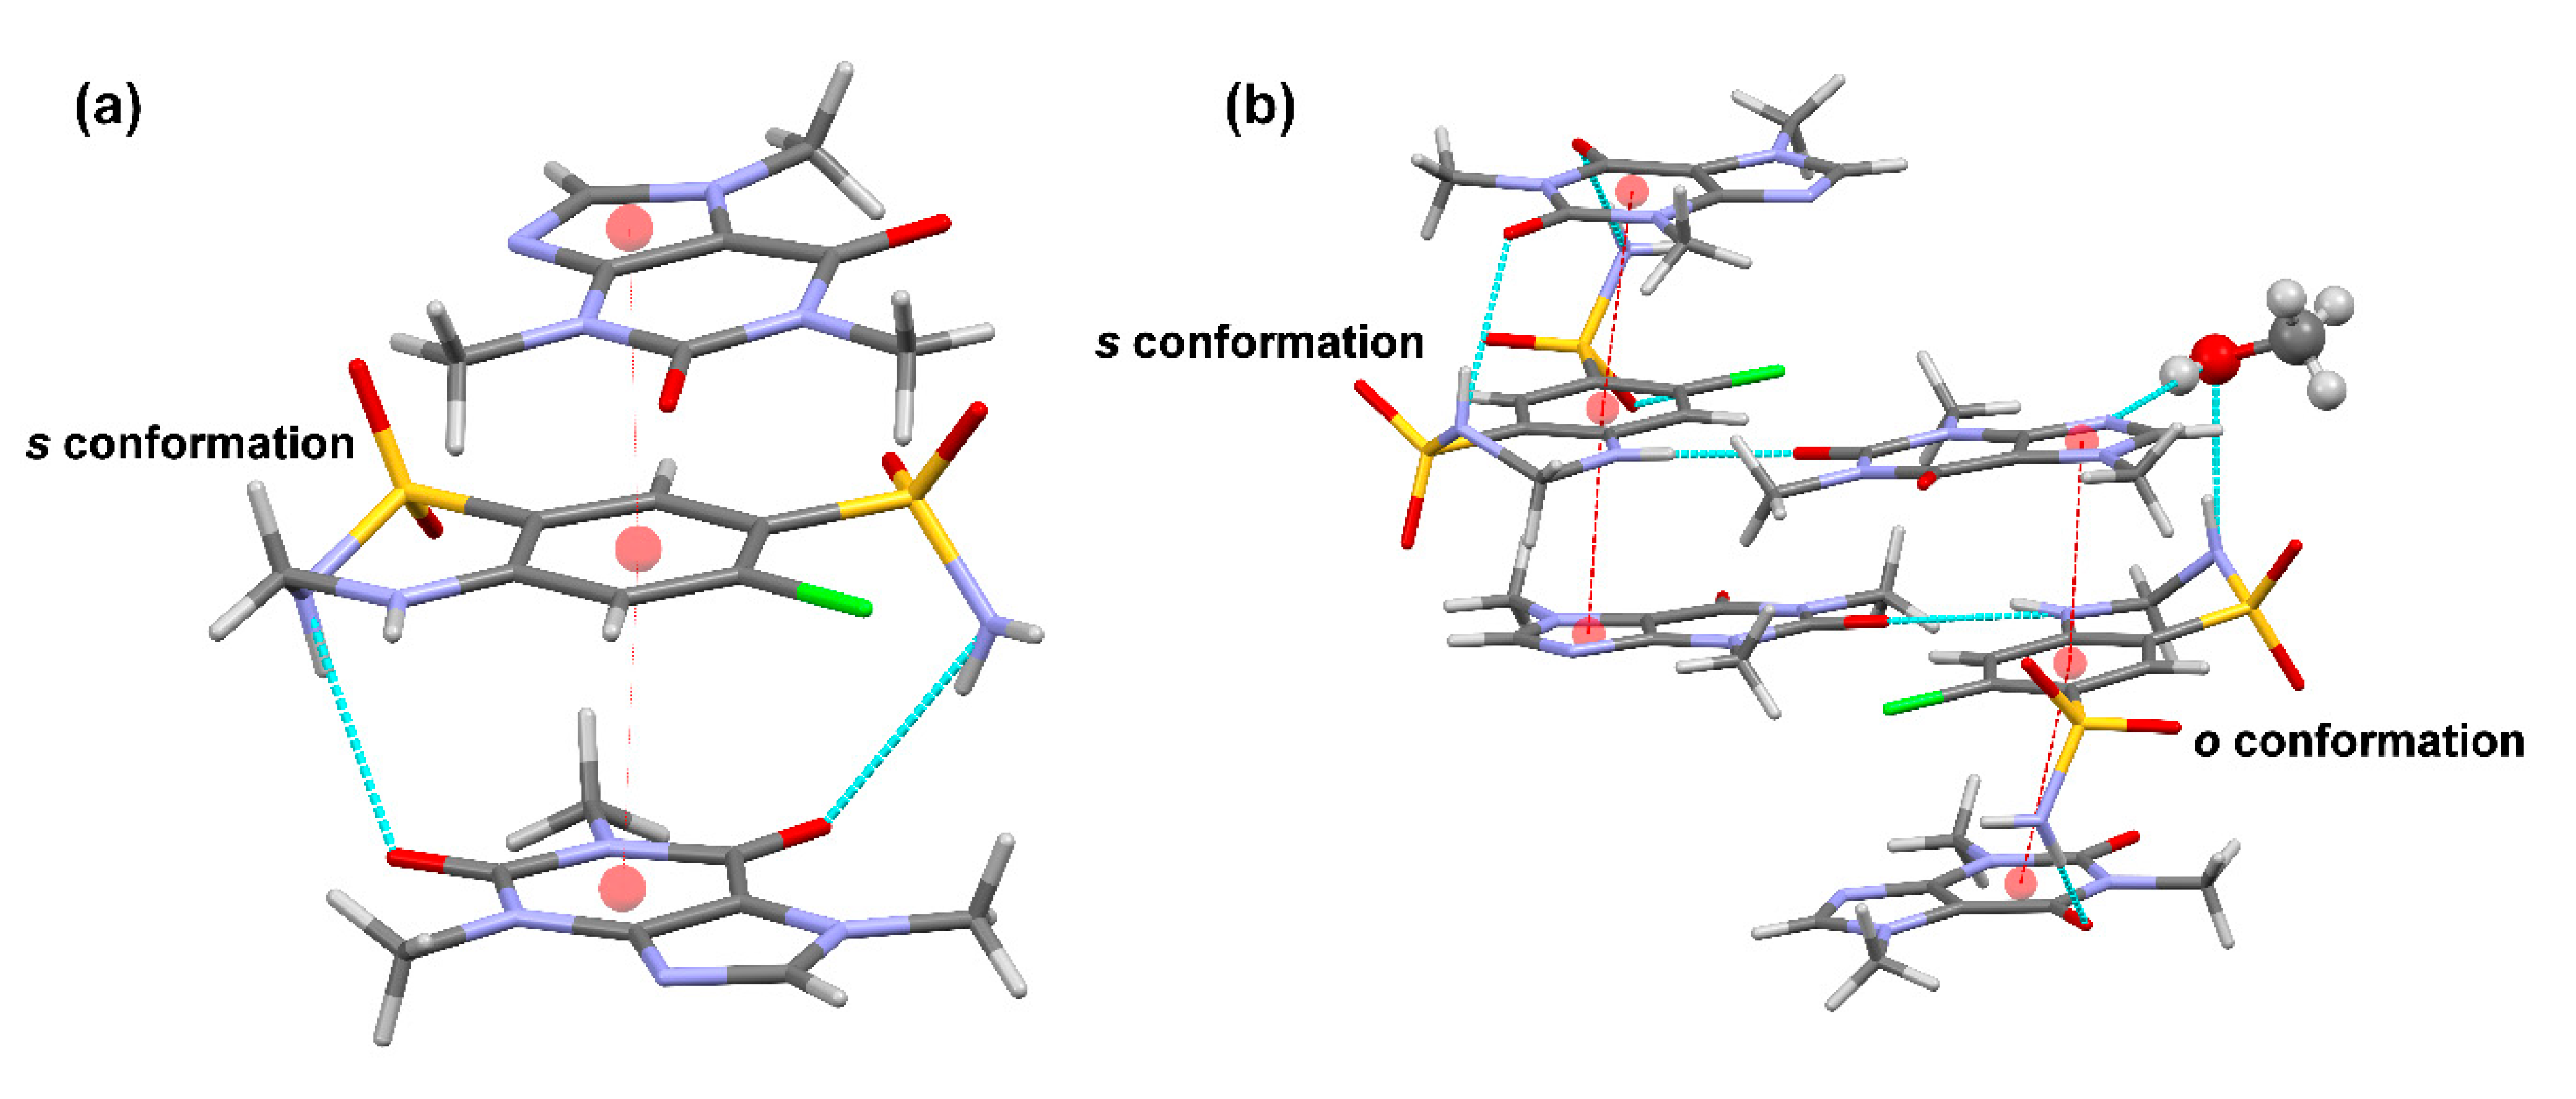
HCT–CAF cocrystal crystallized in the triclinic crystal system with P-1 space group. The asymmetric unit was composed of HCT and CAF in a 1:2 stoichiometric ratio (
Figure 4b and
Figure S3). The centrosymmetric dimeric structure observed in the metastable polymorph II of HCT (s conformer) [
16] remains in the cocrystal and is surrounded by CAF molecules. π–π stacking interactions between HCT and CAF molecules generate a supramolecular unit involving two types of stacking interaction between the six-membered rings of HCT−1 and CAF−1 (inter-centroid distance = 3.6458(19) Å) and between the six-membered ring of HCT−1 and the five-membered ring of CAF−2 (inter-centroid distance = 3.544(2) Å). This CAF−HCT−CAF unit is reinforced by H-bonding interactions involving the primary and secondary sulfonamides of HCT and the carbonyl groups of one of the CAF molecules (
Figure 4b,
Table S1). Additional π–π interactions between inter-unit centrosymmetric CAF molecules build columns extending along the
b axis of the crystal. Further H−bonding interactions involving all donors and acceptors of HCT and CAF molecules connect the columns and build up the 3D structure in the crystal (
Figure 5a,
Table S2).
HCT–CAF·MET crystal was obtained in methanol by a solvent evaporation technique. The crystal adopted the triclinic P-1 space group and the asymmetric unit consisted of two symmetry-independent molecules of HCT, four molecules of CAF and one molecule of methanol in a 1:2:0.5 stoichiometric ratio (
Figure 4c and
Figure S4). Interestingly, crystallographic independent HCT molecules adopt the
s and
o conformations referred above in the asymmetric unit.
Crystal packing was very similar to that of the HCT–CAF cocrystal. Both crystal forms belong to the triclinic system and P-1 space group, and the comparison of their respective unit cell metrics revealed two similar dimensions between both forms whilst the remaining one is almost double in the solvate. Moreover, the packing efficiency between both crystal structures was evaluated using the packing coefficient C
K, defined as (1/V
cell) × ΣV
mol; where ΣV
mol is the sum of the volumes occupied by the molecules in the cell and V
cell is the volume of the cell [
44]. Remarkably, both compounds have the same C
K (0.69).
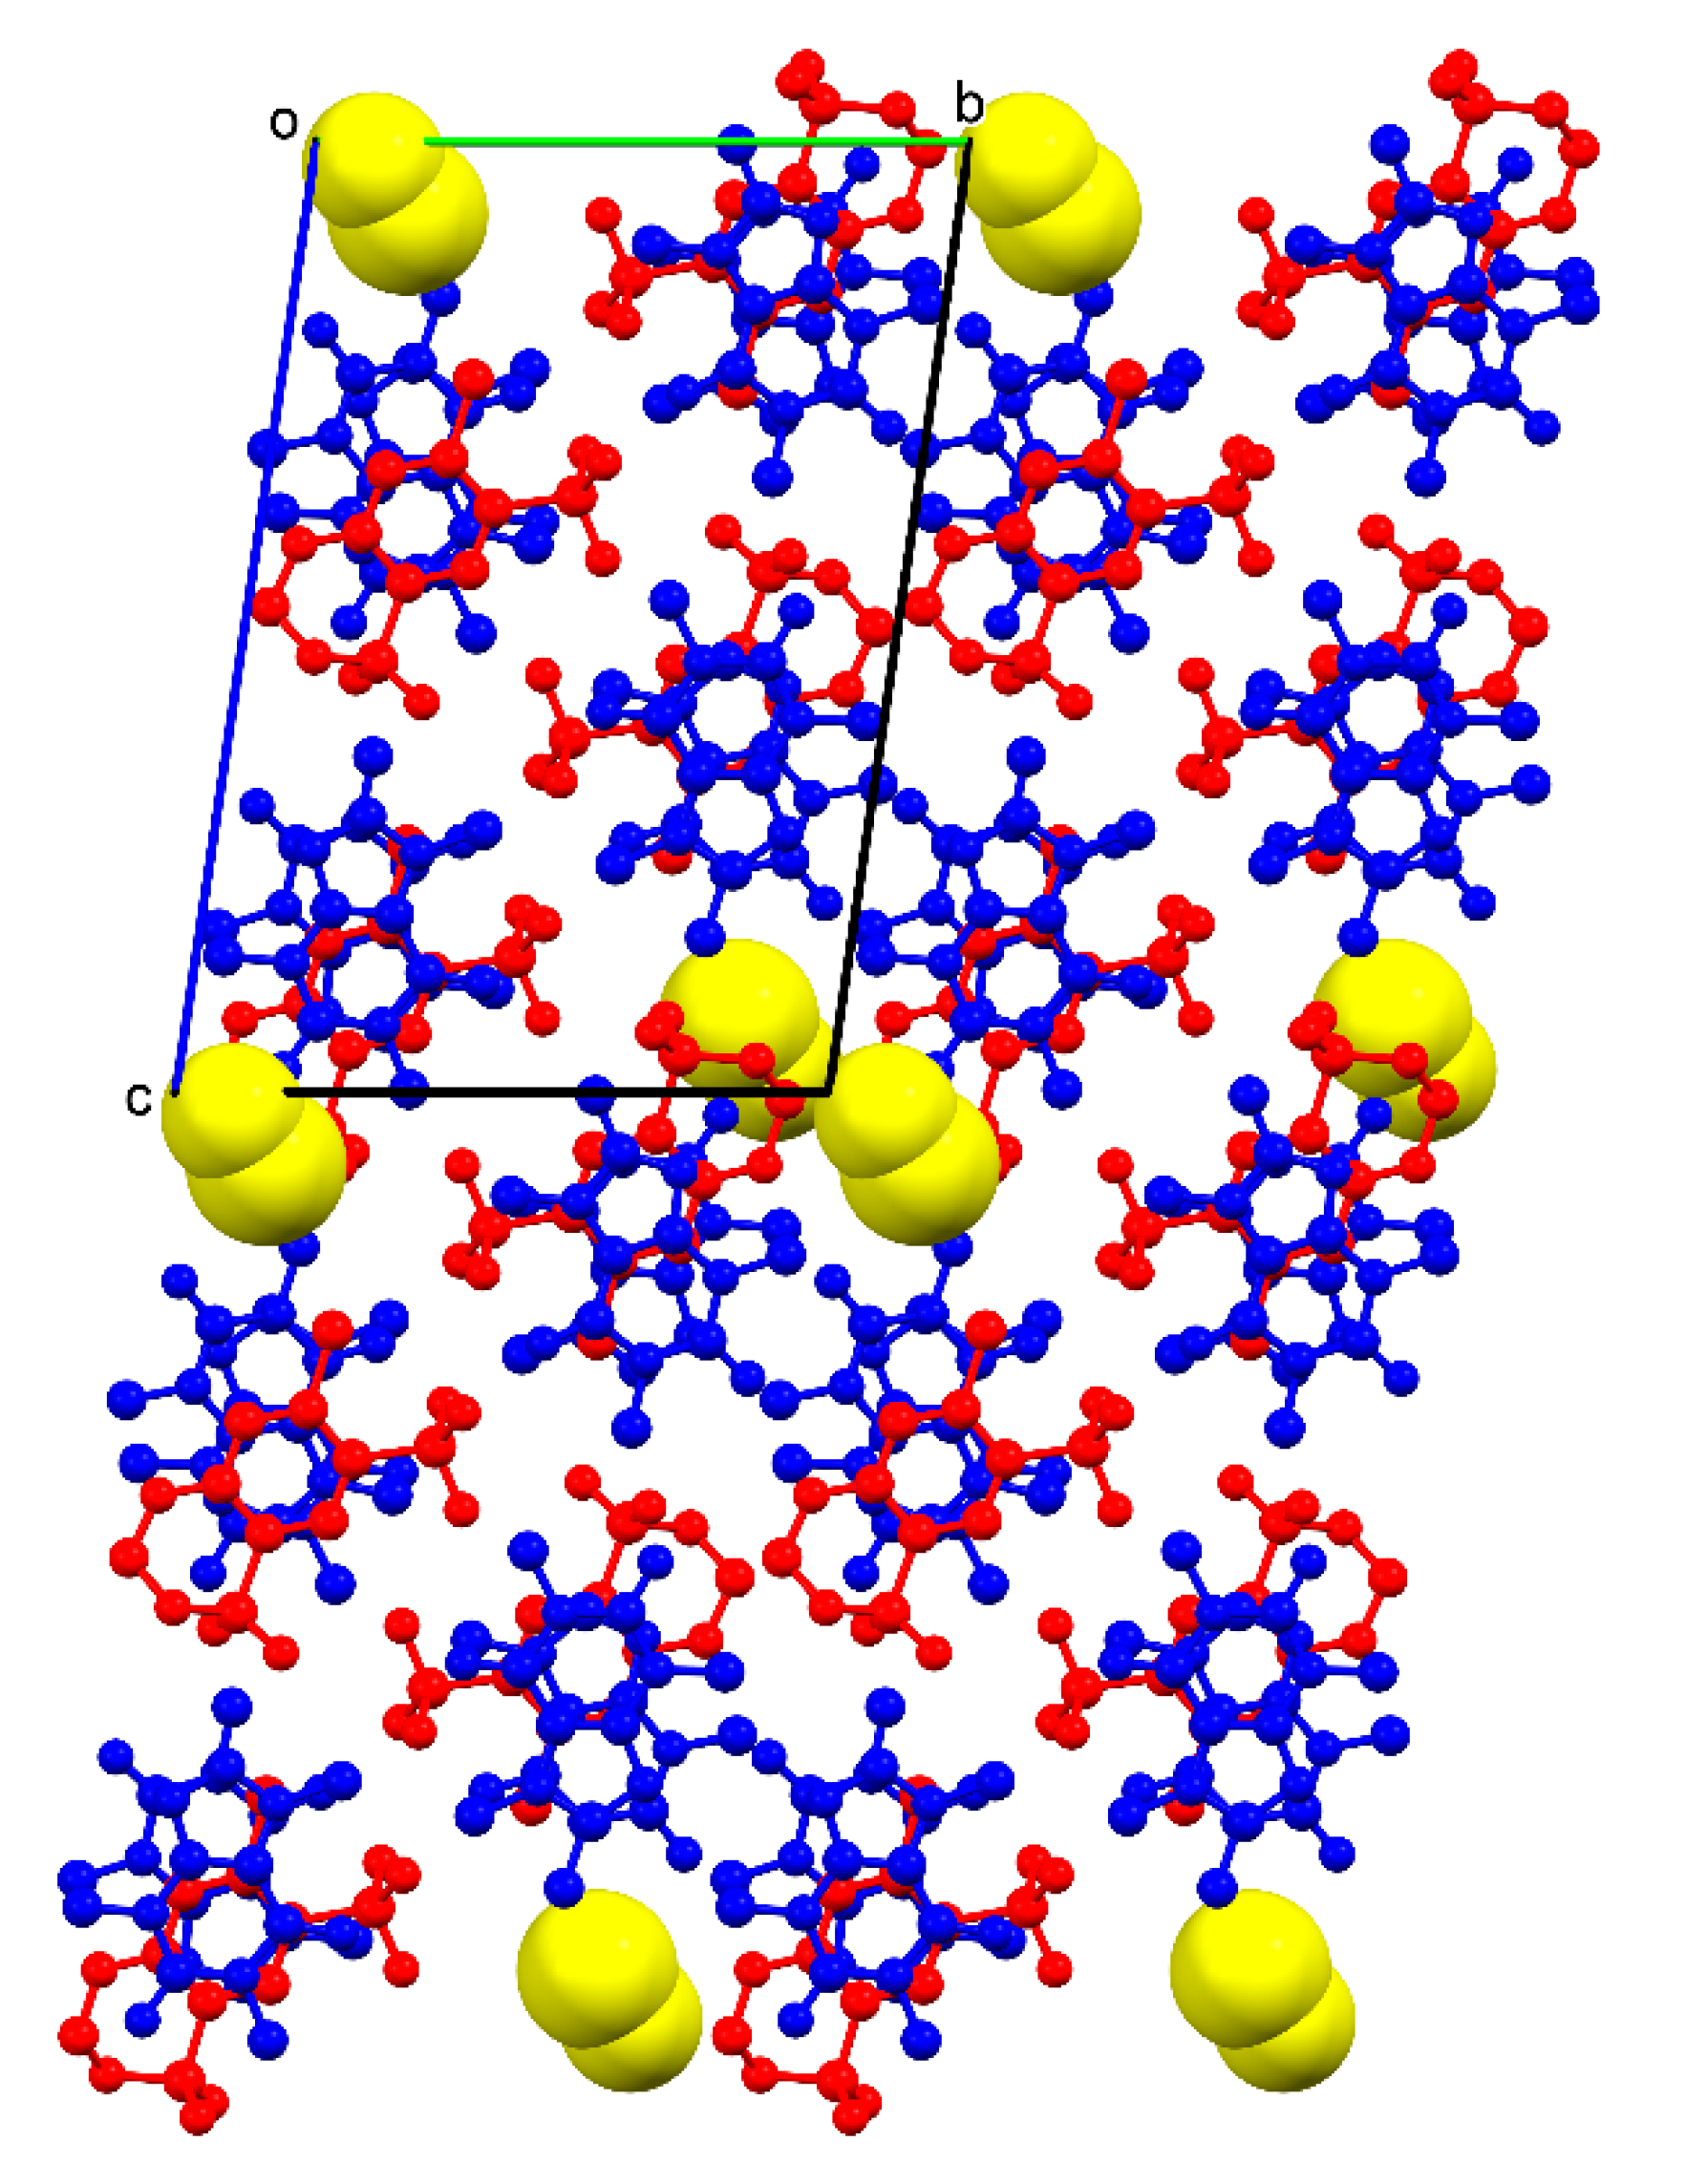
CAF−HCT−CAF supramolecular units are also observed in the solvate structure, generating columns by a combination of π–π-stacking and H-bonding interactions (
Figure 5b,
Tables S3 and S4). As a consequence of the presence of the
o conformation in one of the HCT molecules, the supramolecular unit retains a methanol molecule through H−bonds involving the primary sulfonamide group of HCT and one N-heterocyclic atom of CAF, locating the solvent molecules in non-continuous voids between pillared structures (
Figure 6).
3.3. Thermal Analysis
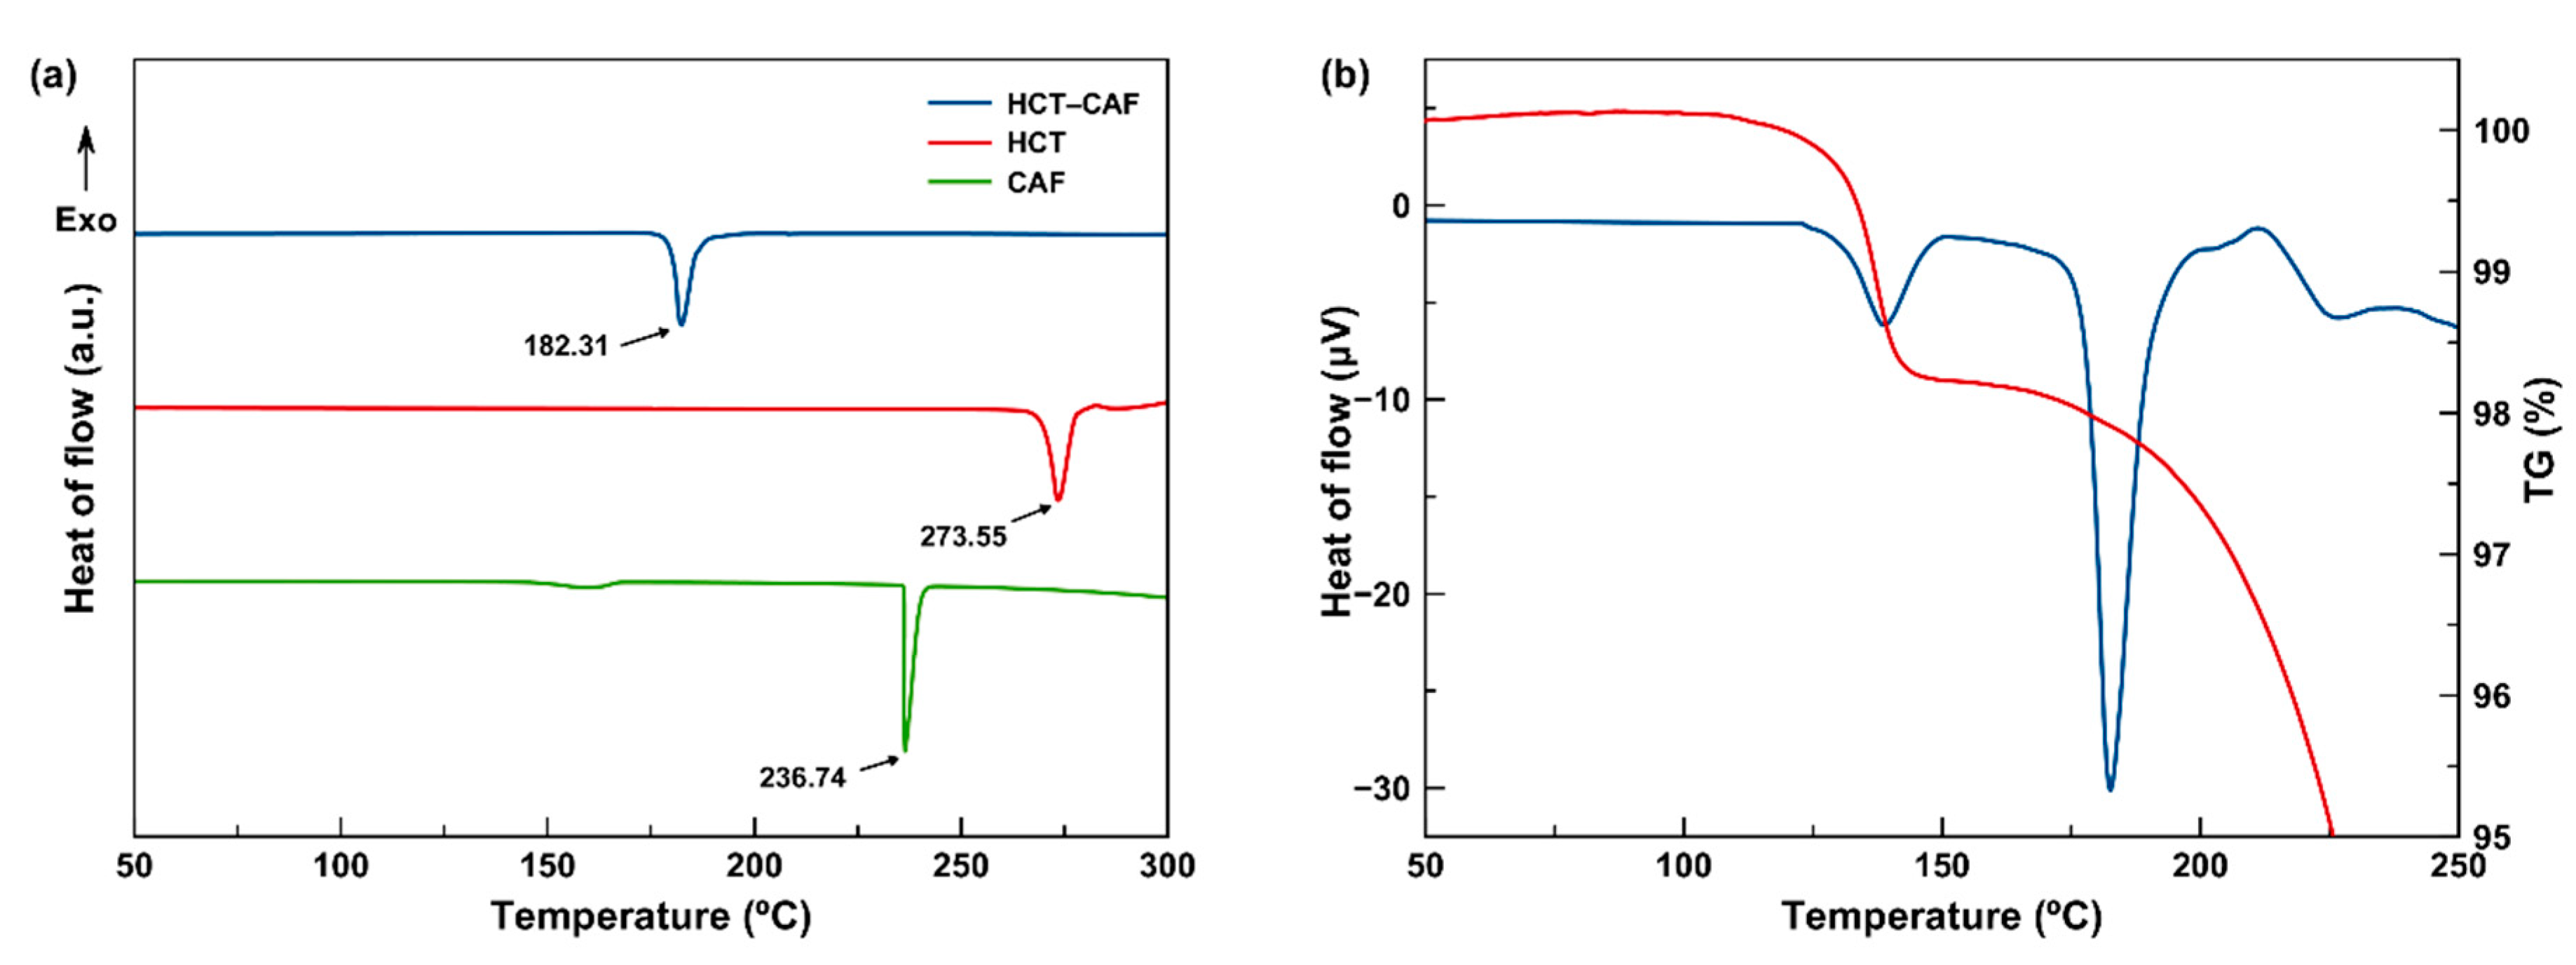
In
Figure 7a, the DSC of the isolated APIs, HCT and CAF, as well as that of the corresponding HCT–CAF cocrystal are reported. Each trace shows one single endothermic event, which represents the melting point of these pure species. Interestingly, the melting point of the HCT–CAF cocrystal is lower than the two reference APIs (HCT: 273.55 °C; CAF: 236.74 °C; HCT–CAF: 182.31 °C). On the other hand, two different thermal events can be observed in the DSC of the HCT–CAF·MET solvate (
Figure 7b). The first endothermic peak certainly reveals MET desolvation between 130 °C and 140 °C. According to the thermogravimetric (TG) measurement (
Figure 7b), the loss mass at this step accounts for ca. 2.0%, which is in agreement with the desolvation of the material in which MET corresponds to ca. 2.3% of the unit-cell mass. The unexpectedly higher T
onset (130 °C), compared to the boiling point of methanol, is attributed to the intense intermolecular H–bonding interactions between the host molecules and methanol molecules. Indeed, MET molecules occupy isolated sites and do not feature open channels, which hampers the solvent release from the crystal structure.
The progressive loss of the solvent occurs before the melting of the HCT–CAF moiety, evidenced by a second endothermic peak at 182.59 °C in DSC, as well as a rapid mass loss in the TG curve because of the decomposition. It is worth noting that the melting point of the HCT–CAF moiety in both the cocrystal and its methanol solvate is almost identical. Therefore, both crystal structures are expected to be very similar, with MET being located in accessible voids.
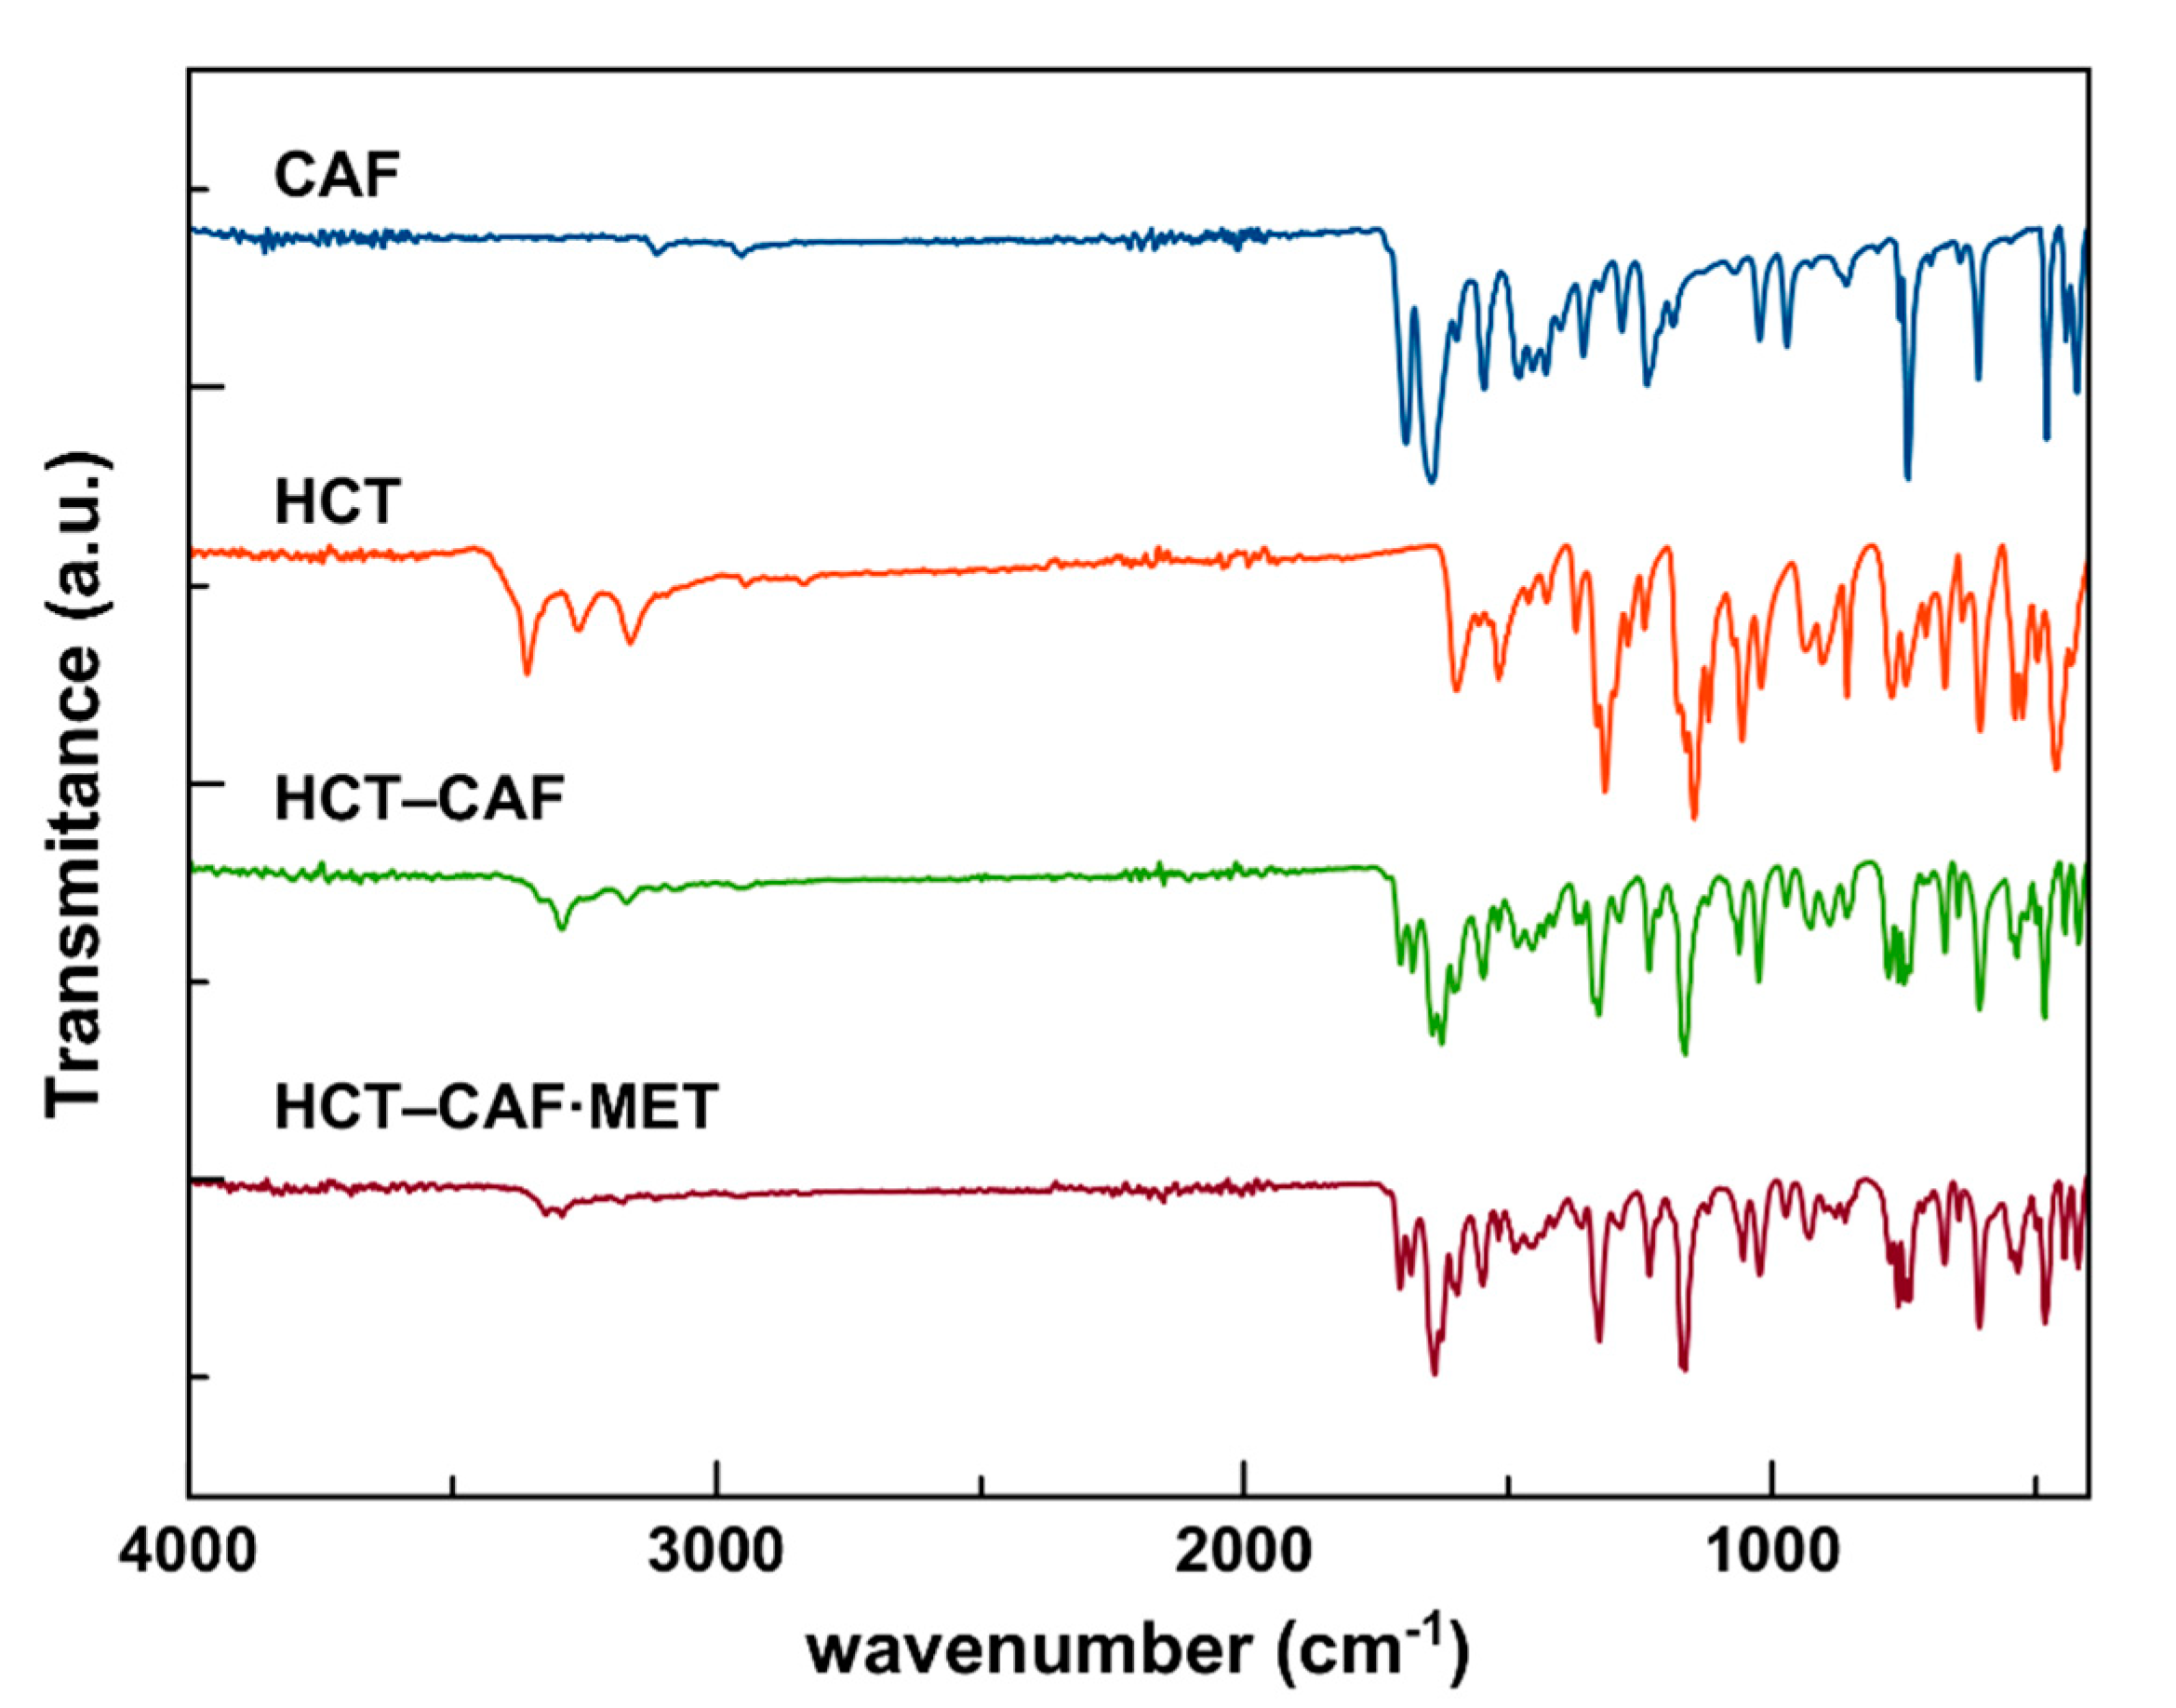
3.4. Fourier Transform Infrared (FTIR) Spectroscopy
In the infrared (IR) spectrum of HCT, the asymmetric and symmetric stretching modes of −NH2 (at 3358 and 3261 cm−1), and the stretching mode of the −NH group (3163 cm−1) are well defined as strong bands. The bending mode of one −NH group can also be identified at 1518 cm−1, with the intense band at 1599 cm−1 probably linked to ν(C=C). The typical two bands corresponding to the ν(S=O) stretching mode of sulfonamide groups are found at 1317 and 1147 cm−1. Both peaks are intense and show a shoulder at 1330 and 1163 cm−1 respectively, indicating the non-equivalent nature of both sulfonamide groups. Finally, the stretching of the C–Cl bond is observed at 600 cm−1.
Regarding the IR spectrum of caffeine, two very intense bands corresponding to the two non-equivalent carbonyl groups of the amide moiety can be observed at 1693 and 1645 cm−1. The latter peak might also show the contribution of the aromatic C=C stretching bands, including the shoulder at 1597 cm−1. On the other hand, those signals corresponding to the methyl groups are negligible, especially those attributed to the stretching modes.
Changes in vibrational frequencies due to cocrystal formation can be easily monitored. When the two APIs are joined together in the cocrystals, the reported IR bands with diagnostic value are expected to be shifted, thus indicating the presence of intermolecular forces, i.e., hydrogen bonds, which build the cocrystal structures [
45]. In fact, in the IR spectrum of the HCT–CAF cocrystal, a clear shift is observed both in the stretching and bending modes of the −NH
2 and NH groups, now at ν
s(NH
2) 3292 cm
−1, ν
s(NH
2) 3171 cm
−1, δ(NH) 1520 cm
−1. The bands corresponding to the stretching of the sulfonamide groups are also shifted [ν(S=O) 1329 and 1338 (sh), and 1165 (shoulder overshadowed) cm
−1]. Interestingly, a shift and a splitting are observed for the, originally, two signals of the amide group of caffeine, corresponding to 1703 and 1682 cm
−1 for the former, and 1643 and 1626 cm
−1 for the latter. Finally, the signal attributed to the ν(C–Cl) is also shifted at 607 cm
−1.
The spectrum of the HCT–CAF methanol solvate actually resembles the solvent-free cocrystal (
Figure 8). Unfortunately, the stretching modes of the amine groups are not clearly visible but the δ(NH) is shifted exactly at the same wavelength: 1520 cm
−1. Likewise, the ν(S=O) mode of the sulfonamide groups are closely shifted at 1327 and 1338 (sh) cm
−1, and 1165 and 1170 (sh) cm
−1, and the splitting of the caffeine amide moiety is also preserved with ν(C=O) being 1705 and 1683 cm
−1 for the former group of peaks, and 1639 and 1626 cm
−1 for the latter. The ν(C–Cl) shift is also in agreement at 607 cm
−1. The FTIR vibrational frequency comparisons are summarized in
Table 2.
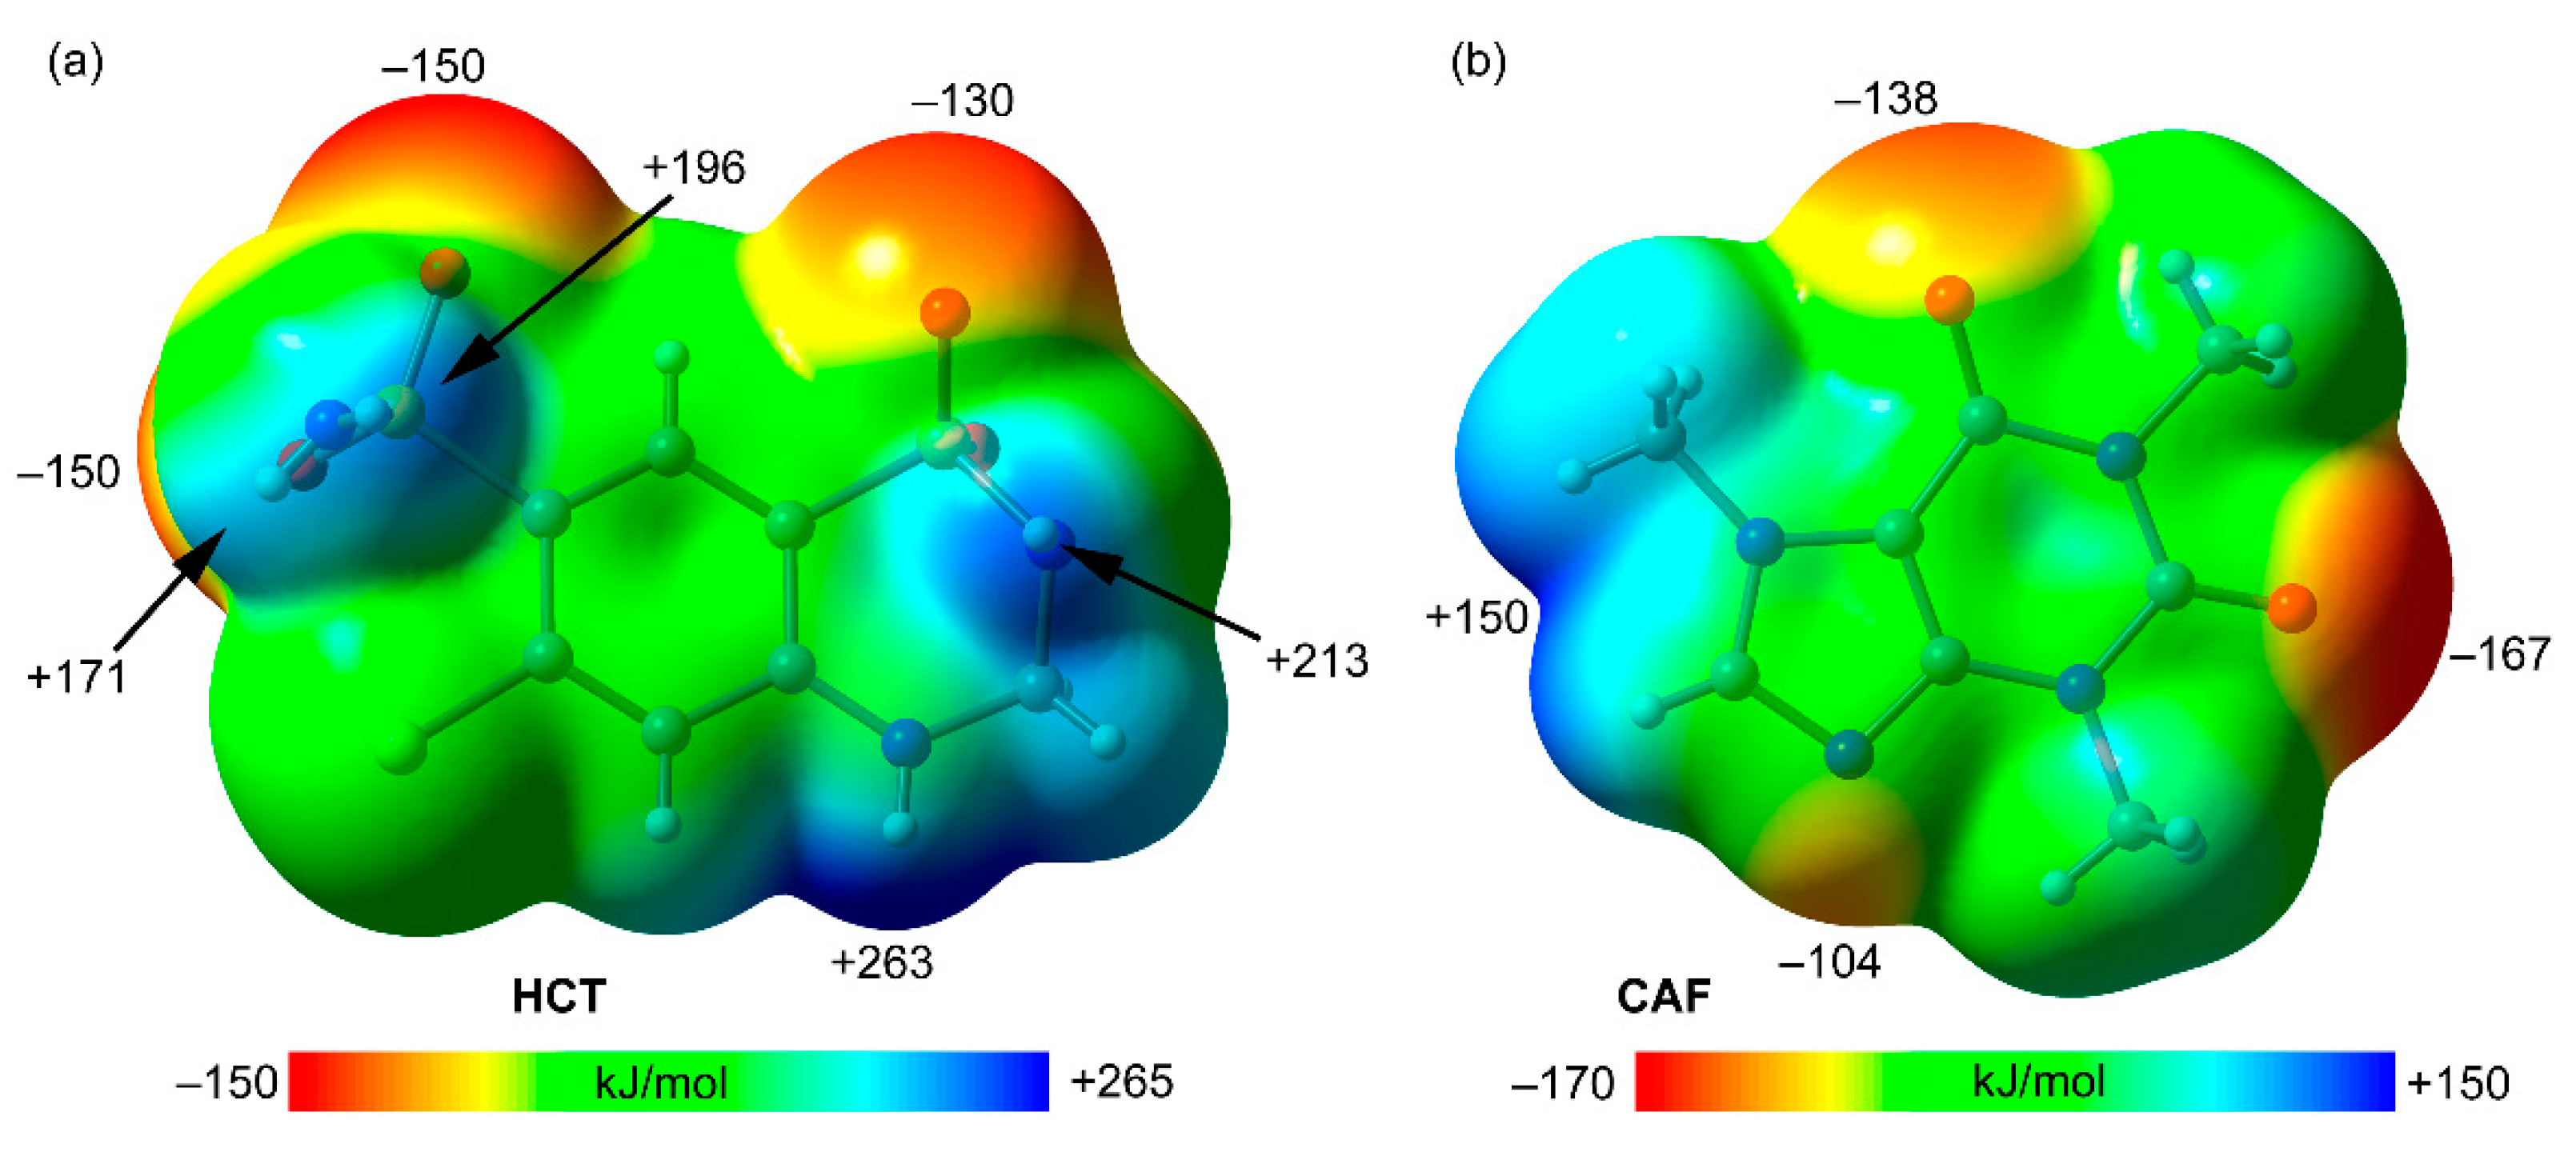
3.5. Theoretical Study
The theoretical study is devoted to analyze several H-bonded and π-π stacking dimers observed in the X-ray solid state structures of compounds HCT–CAF and HCT–CAF·MET, with the intention to compare the formation of homo and heterodimers of hydrochlorothiazide/caffeine units. First of all, MEP surfaces of both co-formers have been obtained and represented in
Figure 9. The surface analysis of hydrochlorothiazide (HCT) reveals the maximum MEP value at the NH group bonded to the aromatic ring (+263 kJ/mol,
Figure 9a), likely due to the strong withdrawing effect of both sulfonamide groups bonded in
ortho and
para positions with respect to the NH group. Several local maxima are situated at the H-atoms of the sulfonamide groups (ranging from +171 to +213 kJ/mol), with that belonging to the six-membered ring being slightly more positive. The MEP minima are located in the O-atoms of the sulfonamide groups ranging from −130 to −150 kJ/mol. This analysis reveals that HCT is very rich in H-bond donor and acceptor groups, being a slightly better H-bond donor than acceptor. The MEP surface of caffeine (CAF) is given in
Figure 9b, showing the MEP minimum at the carbonyl O-atom located in the middle of both N-atoms of the six-membered ring (–167 kJ/mol). The other carbonyl group and the non-substituted N-atom of the five-membered ring also exhibit large MEP negative values (−138 and −104 kJ/mol, respectively). On the other hand, the most positive MEP is located between two C–H bonds (+150 kJ/mol). From an electrostatic point of view, the most favorable interaction between both co-formers should be a N–H···O=C H-bond between the HCT–NH group with higher MEP and the C=O carbonyl group of CAF with lower MEP, which is indeed observed in the solid state of compounds HCT–CAF and HCT–CAF·MET.
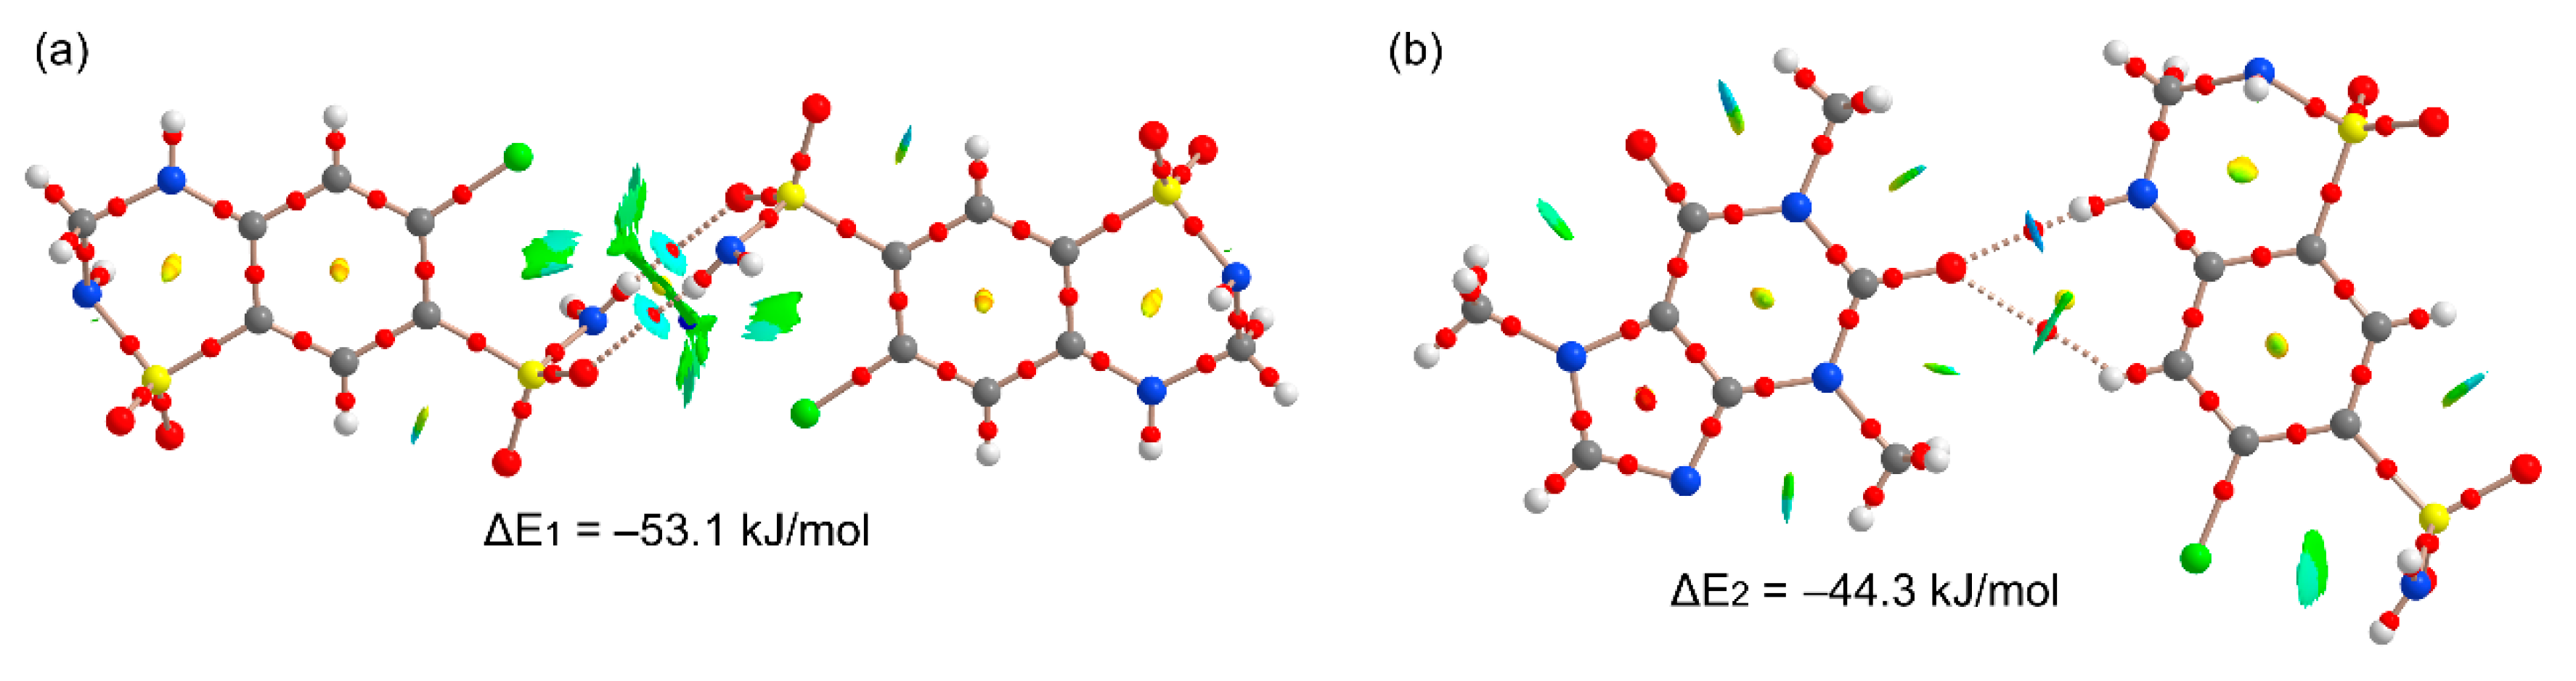
As previously described, HCT forms H-bonded self-assembled homodimers and HCT···CAF heterodimers, which are similar in both compounds (
Figure 10 and
Figure S5). A combination of QTAIM and NCI method analyses of both types of dimers has been performed and is provided in
Figure 10. Moreover, the dimerization energies at the PBE0-D3/def2-TZVP level of theory have also been computed. In the homodimer, two symmetrically equivalent H-bonds are formed (
Figure 10a), which are characterized by the corresponding bond critical points (represented as red spheres) and bond paths interconnecting the H and O-atoms. In the inversion center of the dimer, a ring CP (yellow sphere) emerges upon complexation due to the formation of a supramolecular dimer. Moreover, the NCIplot analysis reveals that these H-bonds are moderately strong, since they are characterized by blue isosurfaces. The NCIplot also evidences the existence of weak long-range van der Waals interactions between the chlorine atom and the SO
2 groups, characterized by green isosurfaces.
Figure 10b shows the QTAIM/NCIplot analysis of the heterodimers where a strong N–H···O H-bond is established as revealed by the strong blue isosurface. This is in quite good agreement with the MEP surface commented above, since both the H-bond donor and acceptor groups correspond to the global maximum and minimum MEP values on the surfaces of HCT and CAF, respectively. The homodimer presents a larger dimerization energy than the heterodimer due to the formation of two N–H···O H-bonds instead of only one strong H-bond. In the heterodimer, an ancillary C–H···O bond is also formed, which is weak taking into consideration the green color of the NCIplot isosurface. The same dimers are observed in the solid state of the HCT–CAF·MET solvate with almost equivalent dimerization energies (
Figure S5). The centrosymmetric N–H···O hydrogen bonded homodimer synthon shown in
Figure 10a has also been observed and described in the cocrystal of HCT with malonamide [
46].
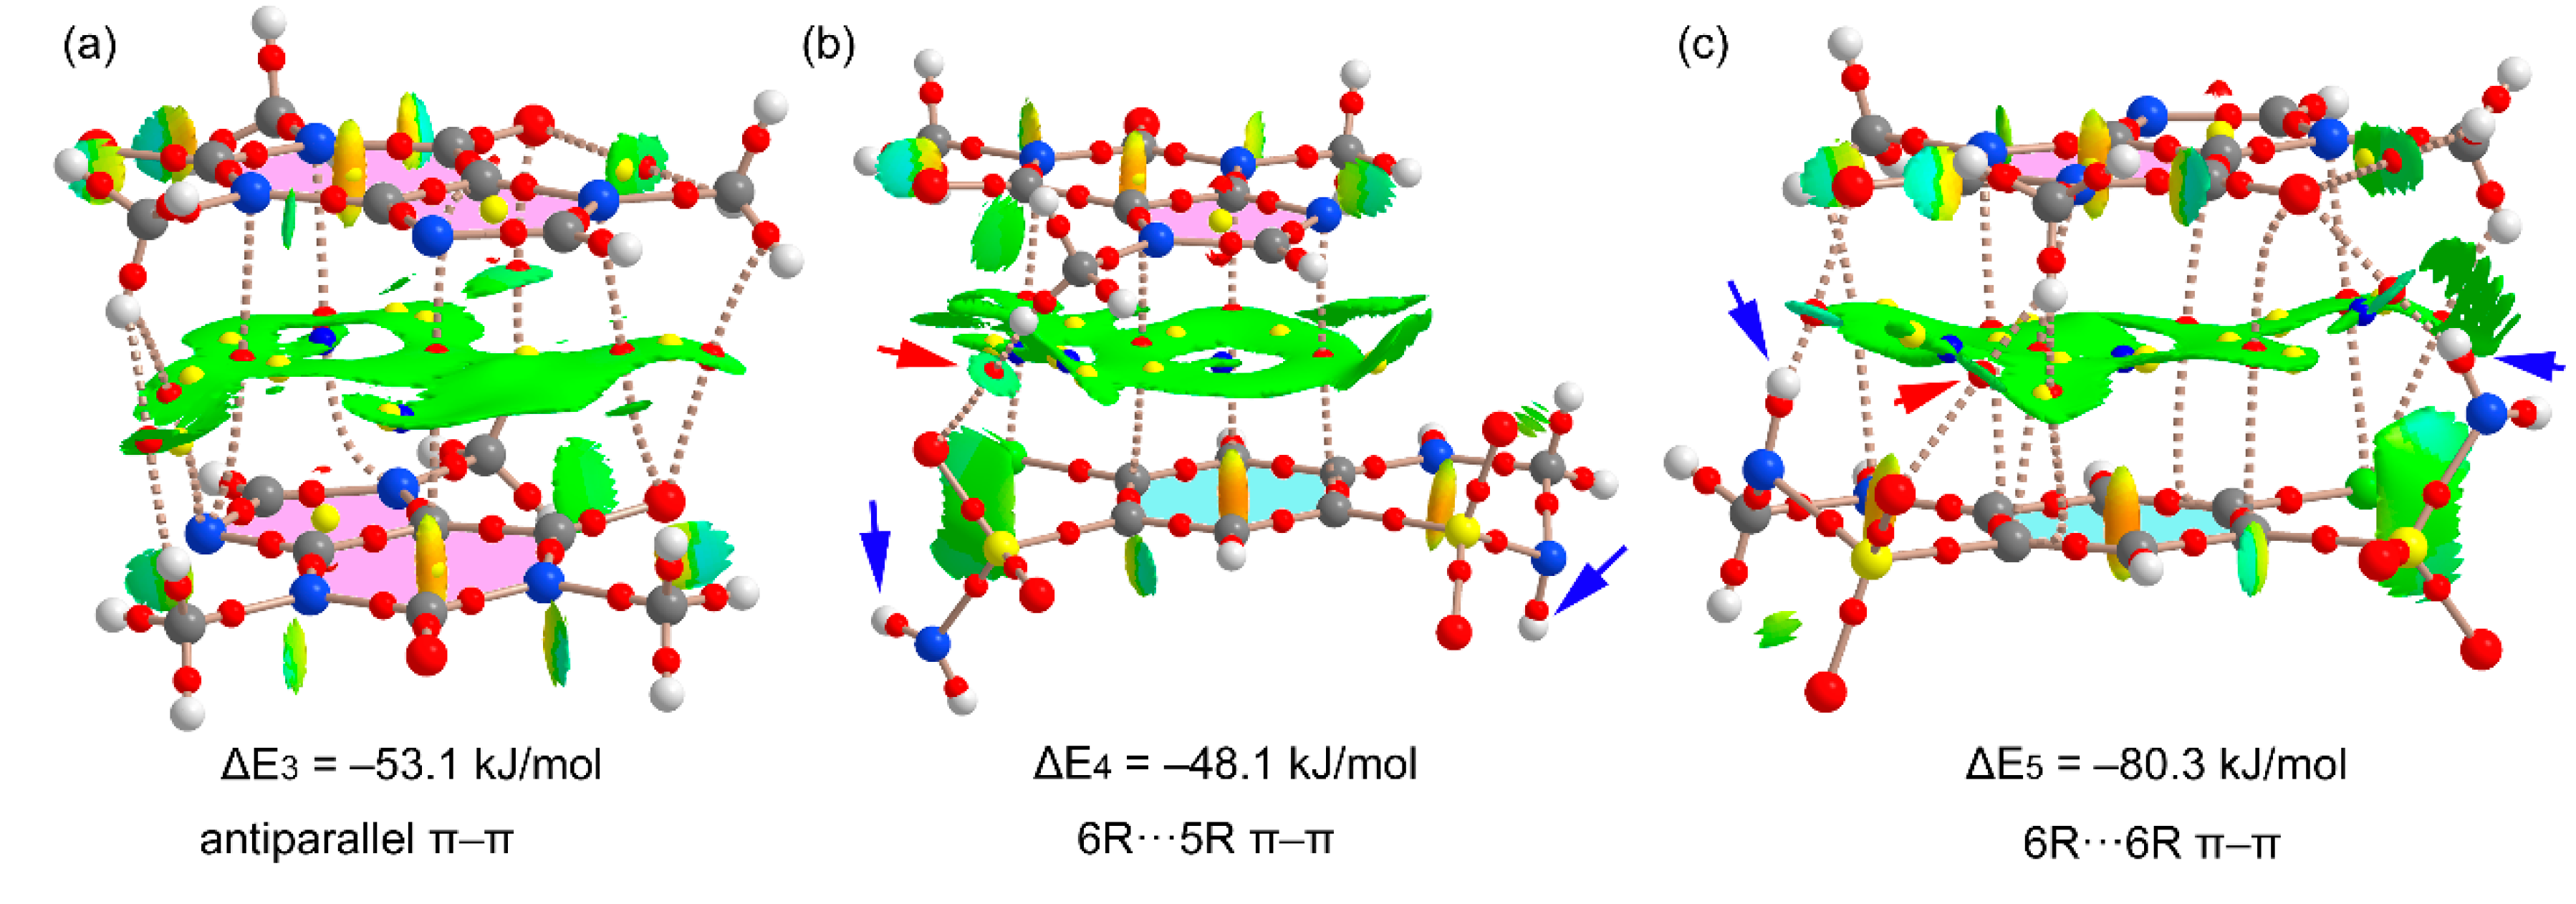
Both compounds also present several types of stacking modes in the solid state. In particular, two different HCT···CAF heterodimers and one CAF···CAF homodimer have been studied energetically and by means of QTAIM and NCIplot analyses.
Figure 11 shows the π-stacking complexes of HCT–CAF and
Figure S6 those of HCT–CAF·MET. All stacked dimers present very large interaction energies (ranging from −48.1 to −80.3 kJ/mol) due to the existence of additional interactions involving the methyl groups of CAF as H-bond donors or the sulfonamide groups as both H-bond donor and acceptor. The carbonyl groups of the CAF six-membered ring also act as H-bond acceptor.
Figure 11a shows the antiparallel π–π CAF···CAF homodimer that exhibits a large overlap of the π-systems, as deduced by the extended green isosurface located between the interacting molecules. The distribution of CPs is complicated and confirms the existence of several contacts involving the methyl groups and the carbonyl O-atoms, which explains the large binding energy. On the other hand, heterodimers present two different binding modes where either the five-membered (5R) or six-membered (6R) rings of CAF are stacked over the aromatic ring of HCT. The first one (
Figure 11b) exhibits weaker interactions because the NH groups of the sulfonamide groups do not point toward the CAF coformer (see small blue arrows in
Figure 11b). In contrast, in the second one, where the 6R is stacked, the NH groups point toward the carbonyl groups of CAF (see small blue arrows in
Figure 11c), thus explaining the large dimerization energy (ΔE = −80.3 kJ/mol). In fact, those groups present large MEP values, thus supporting the strong binding. Moreover, the existence of these N–H···O contacts is further supported by the QTAIM and NCIplot analysis with the presence of the corresponding bond CPs and isosurfaces. The same dimers are also observed in the solid state of HCT–CAF·MET, which are represented in
Figure S6. The interaction energies are also similar in both compounds. It is interesting to highlight that the π-stacking dimers present more favorable binding energies than the H-bonded dimers, thus suggesting that they are more relevant for the solid-state architecture of the cocrystals. Obviously, this is due to the additional interactions that are established between the ring-substituents of both coformers.
3.6. Stability Studies
The stability of cocrystals was studied in this work by performing slurry experiments at 25 °C and storing them at accelerated ageing conditions. HCT was also included in the stability studies for comparison with the multicomponent forms.
The thermodynamic stability of cocrystals was first evaluated by slurry experiments at 25 °C. In these experiments, excess solids of the cocrystal powders were stirred in deionized water for 24 h. The resulting filtered and air-dried samples were analyzed by PXRD to evaluate their phase purity. It was noted that while the HCT–CAF cocrystal was stable upon slurrying, the HCT–CAF·MET completely converted into HCT–CAF after 24 h (
Figure S7). These observations suggest that the cocrystal is thermodynamically stable at room temperature.
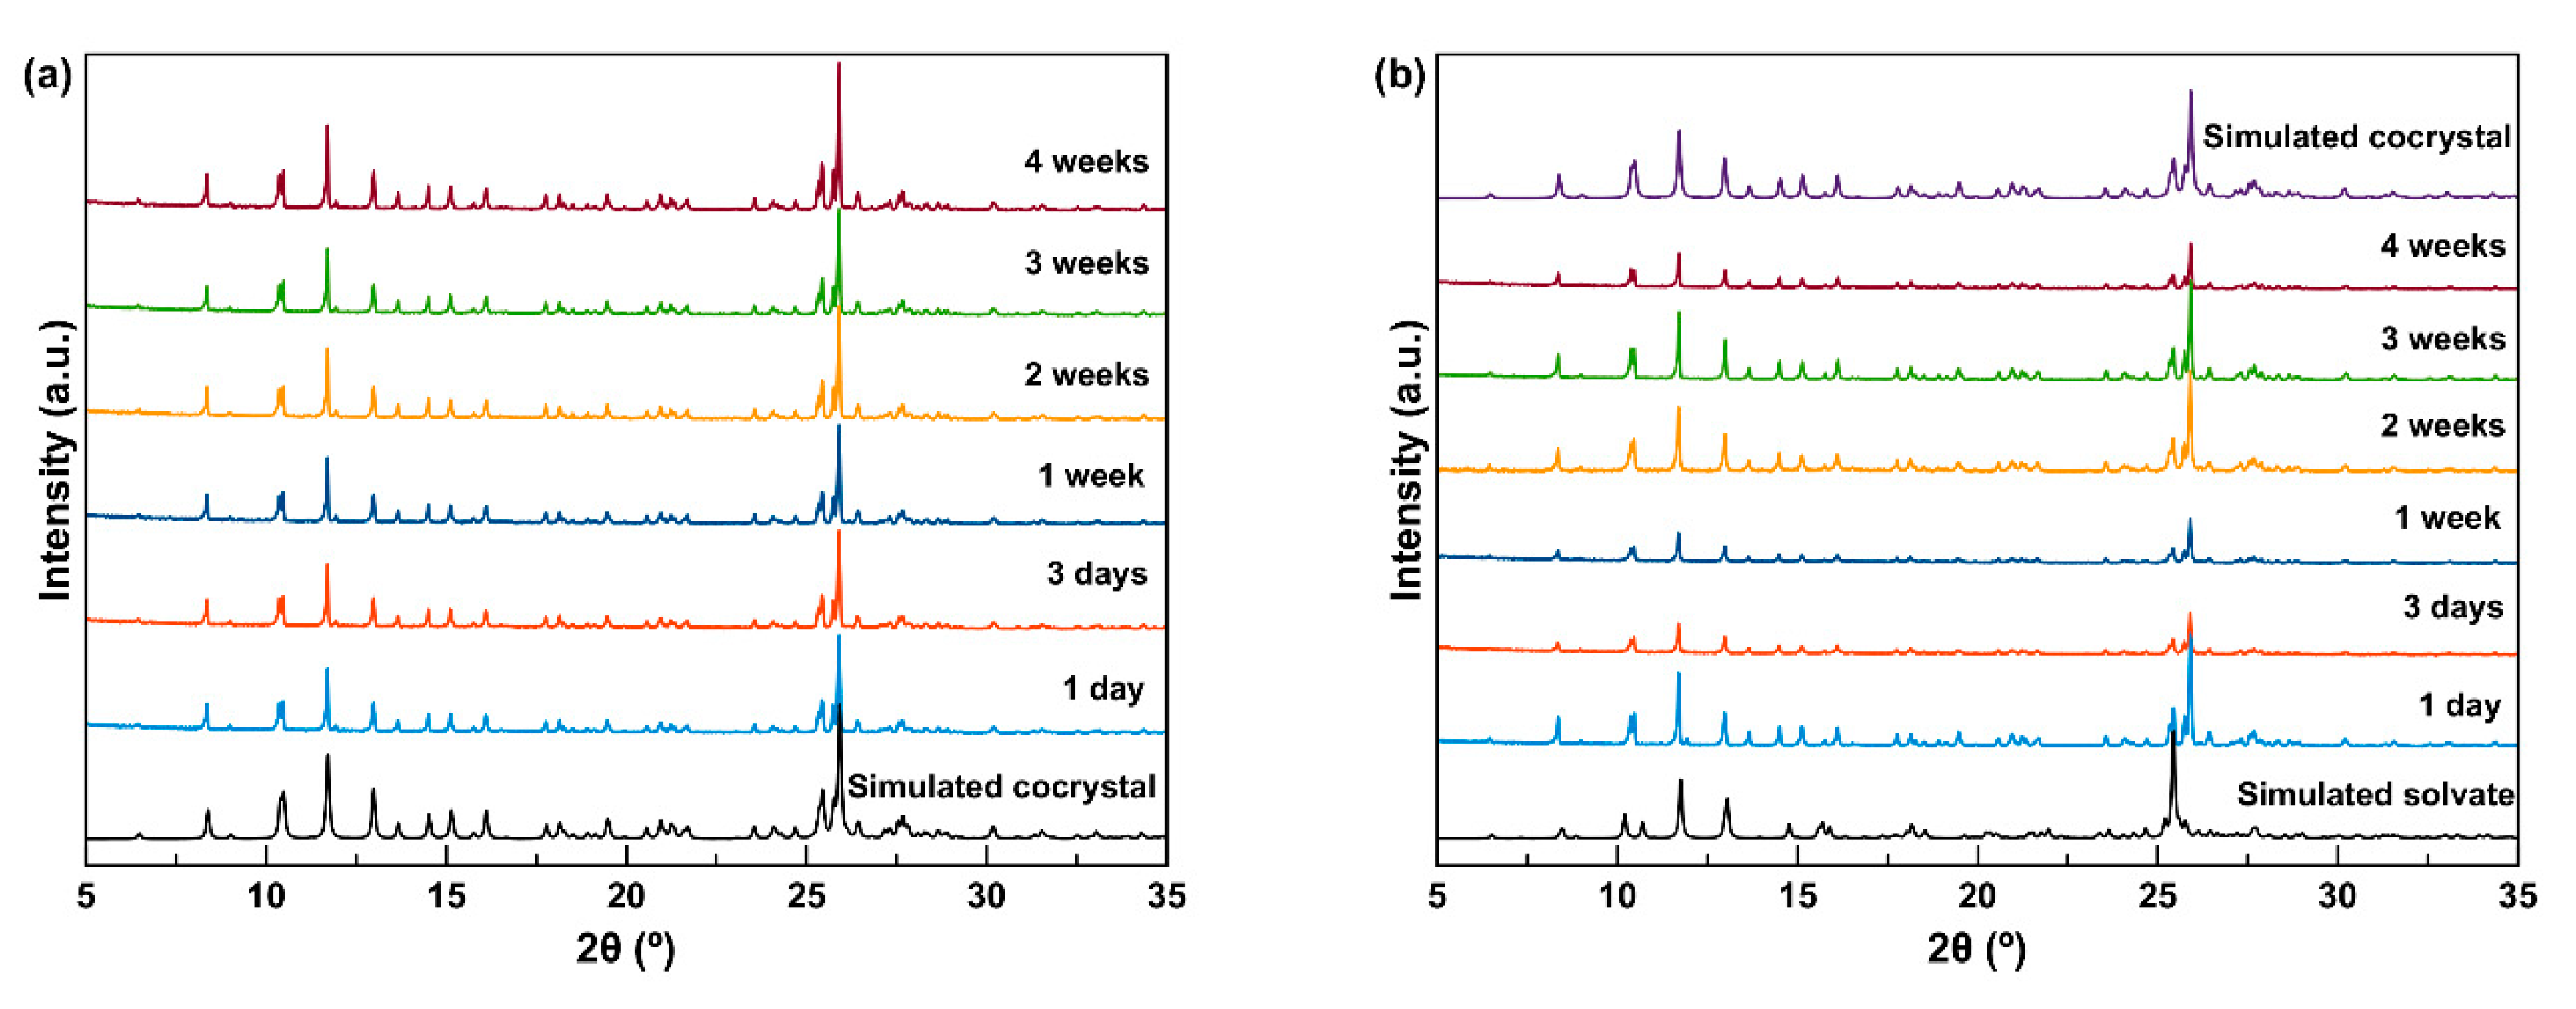
In the accelerated stability tests, the powder samples of the cocrystals were stored at 40 °C and 75% relative humidity (RH). Results of the stability tests suggest that HCT–CAF remained the same after storage for 4 weeks (
Figure 12a), but the methanol solvate converted to HCT–CAF within 1 day of storage (
Figure 12b). The stability of the cocrystals at accelerated test conditions is consistent with the thermodynamic stability observed in the slurry experiments.
3.7. Interconversion between Solid Forms
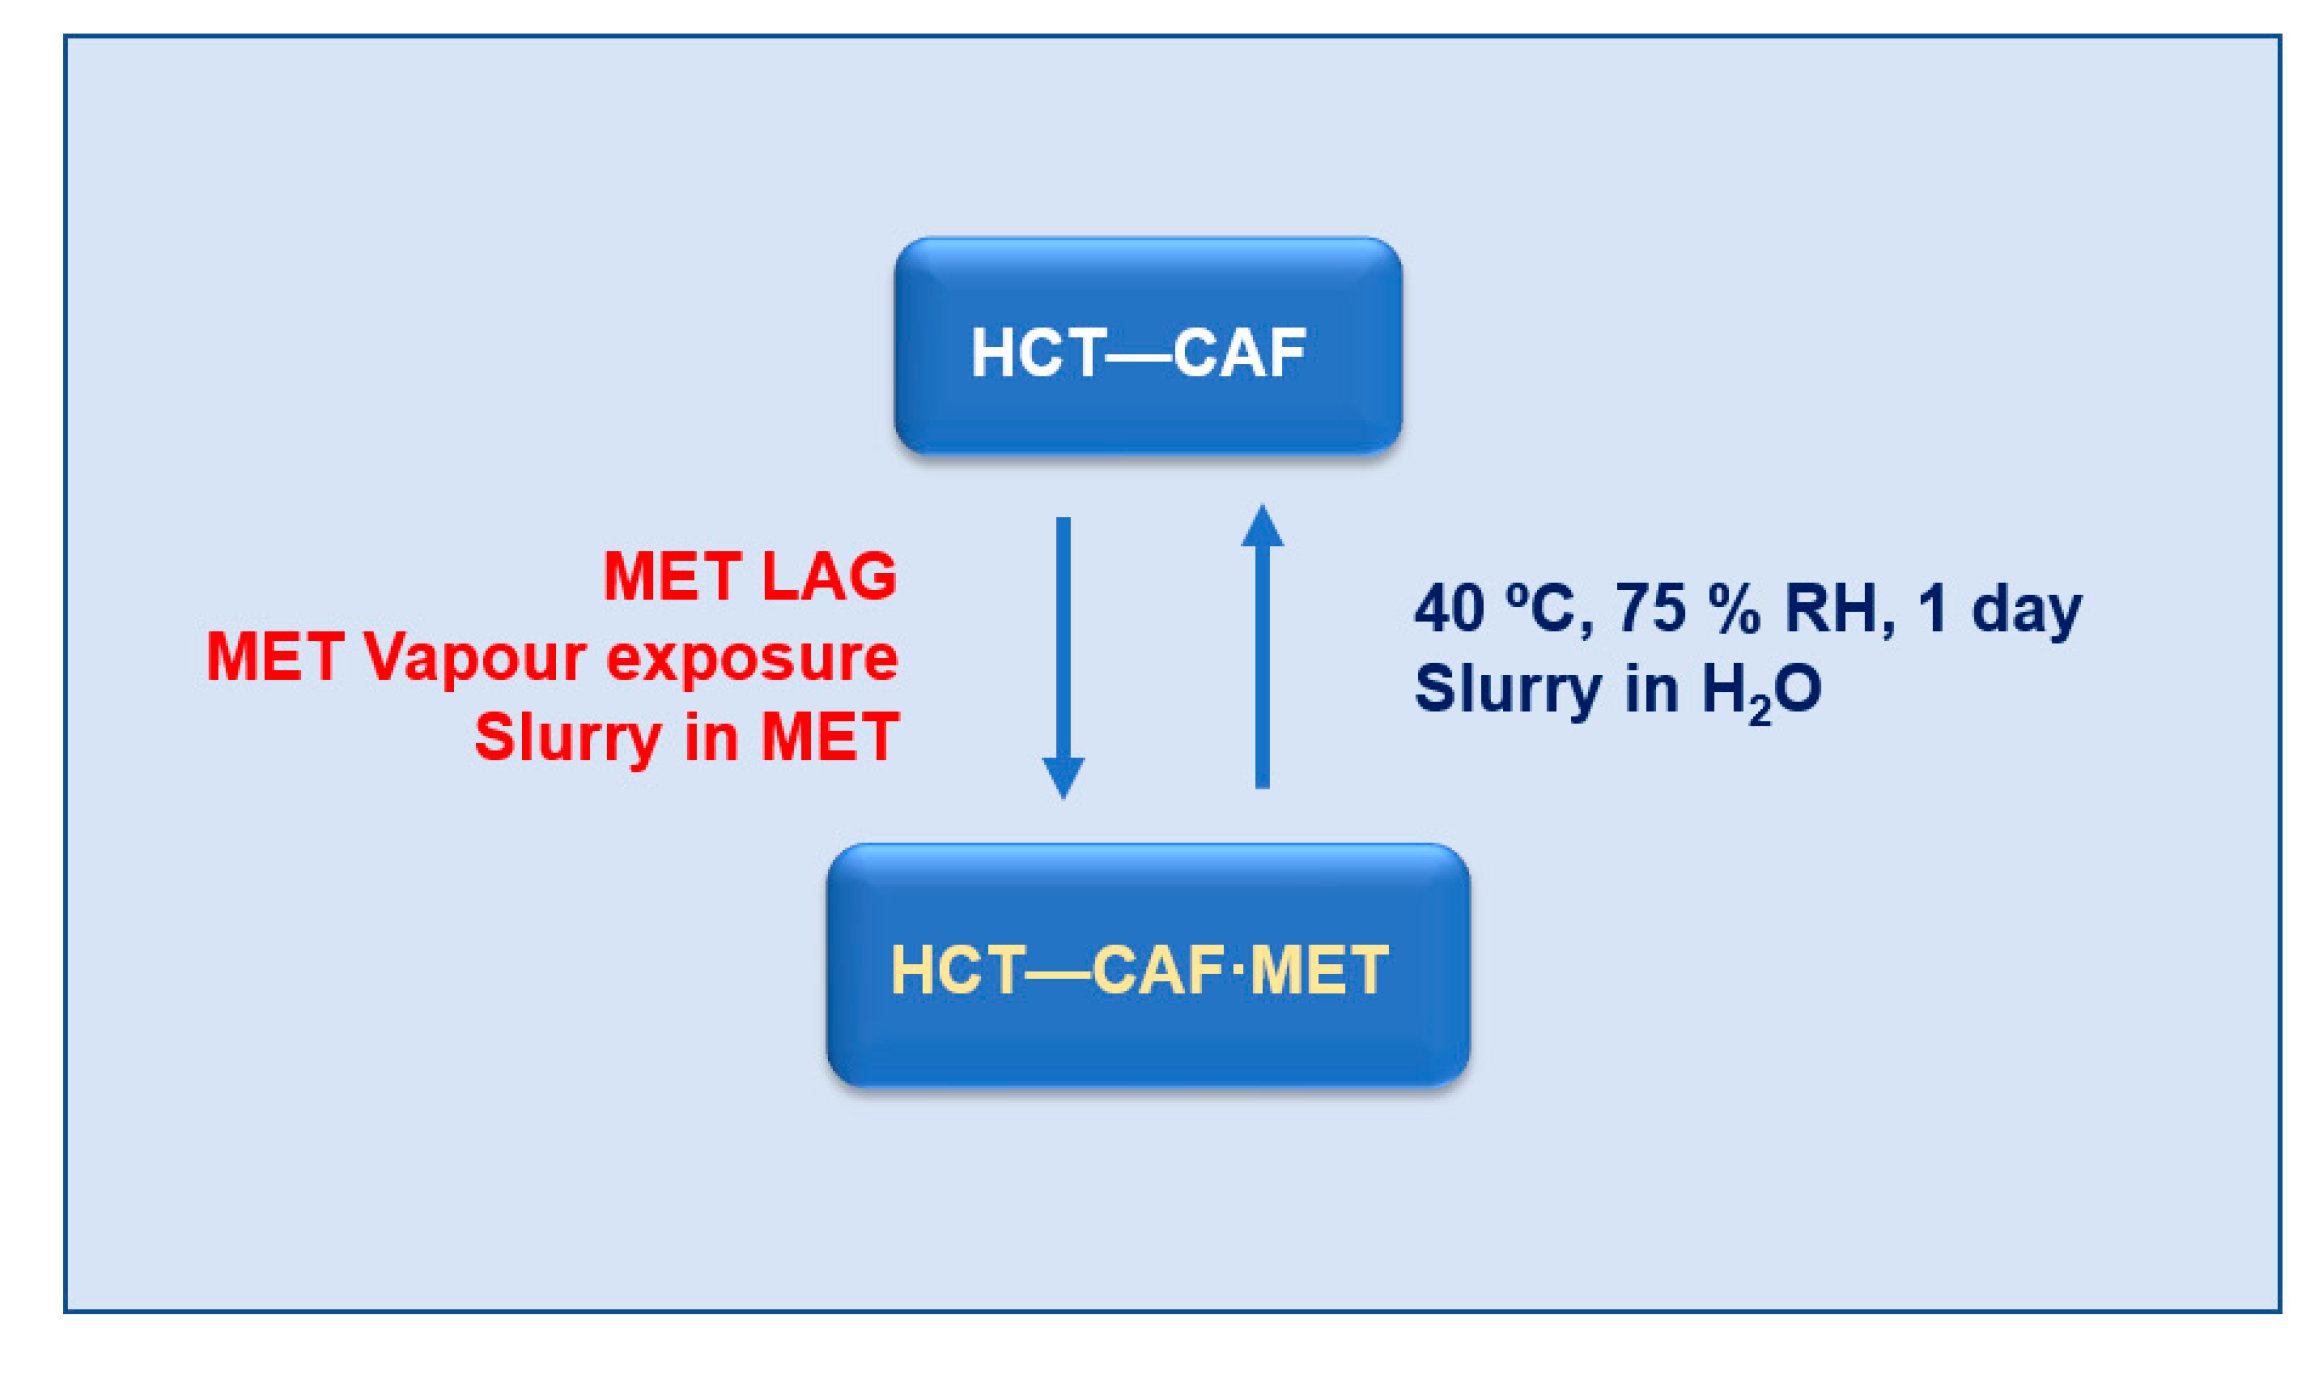
HCT–CAF and HCT–CAF·MET can experience a reversible transformation by adding/removing the methanol component. As discussed above, the structures of the cocrystal and the methanol solvate have similar hydrogen bonding units. From these structural similarities, it is expected that solvent removal might occur with preservation of the hydrogen bonding units, thus promoting the facile occurrence of such transformations between cocrystal and solvate.
LAG of HCT–CAF in methanol produced HCT-CAF·MET (
Figure S8). In addition, the solvate can also be simply obtained by slurrying the cocrystal in methanol or by its exposure in methanol vapors (
Figure S9). Conversely, as already discussed, the storage of HCT–CAF·MET at accelerated ageing conditions (40 °C, 75% RH) afforded the cocrystal. Slurrying in water of HCT–CAF·MET resulted also in the cocrystal phase. Therefore, no matter which HCT–CAF or HCT–CAF·MET phase is used as the starting material, the interconversion between them can be achieved infinitely. In terms of conversion, all the crystalline materials in this work can be dealt with as seen in
Scheme 2.
3.8. Solubility Studies
Solubility is a critical physicochemical property that can influence the performance of a drug by directly impacting its bioavailability. Among the various HCT cocrystals reported, cocrystals with isoniazid, pyrazine, isonicotinic acid, pyrazinamide and
p-aminobenzoic acid have been shown to have an enhanced solubility compared to HCT [
16,
46]. Solubility of the methanol solvate cocrystal was not measured due to the conversion to HCT–CAF. Solubility of the newly prepared cocrystal was measured in pH 7.4 phosphate buffer solution by slurrying the excess amount of solid in buffer at room temperature. The new solid form showed higher solubility than HCT (1.13 mg/mL). It was found that the solubility of HCT and the cocrystal after 24 h follows the order: HCT–CAF (1.5 fold) > HCT, evidencing the inverse correlation previously reported for HCT cocrystals [
16] between solubility-melting point (°C): HCT–CAF (182.31) < HCT (273.55) and solubility-calculated density (g cm
−3): HCT–CAF (1.584) < HCT (polymorph I) (1.71) < HCT (polymorph II) (1.80). Finally, it is worth mentioning that the cocrystal is stable up to 24 h in the aqueous medium as confirmed by PXRD (
Figure S10).

 ,
, 


