Characterization of Nematic Liquid Crystals at Microwave Frequencies
by
 , , ,
, , ,
Vicente Nova
1,† ,
,
Carmen Bachiller
1,*,† ,
,
Belén Villacampa
2,
Rainer Kronberger
3 and
Vicente E. Boria
1,† 1
Instituto de Telecomunicaciones y Aplicaciones Multimedia, Universitat Politècnica de València, 46022 Valencia, Spain
2
Instituto de Nanociencia y Materiales de Aragón (INMA), CSIC-Universidad de Zaragoza, 50009 Zaragoza, Spain
3
High Frequency Laboratory, TH Cologne University of Applied Sciences, Ubierring 40, 50678 Köln, Germany
*
Author to whom correspondence should be addressed.
†
Current address: Instituto de Telecomunicaciones y Aplicaciones Multimedia, Universitat Politècnica de València. Camino de Vera, 46021 Valencia, Spain.
Crystals 2020, 10(12), 1106; https://doi.org/10.3390/cryst10121106
Submission received: 5 November 2020
/
Revised: 25 November 2020
/
Accepted: 27 November 2020
/
Published: 3 December 2020
(This article belongs to the Special Issue Nematic Liquid Crystals)
Abstract
:The use of nematic liquid crystal (LC) mixtures for microwave frequency applications presents a fundamental drawback: many of these mixtures have not been properly characterized at these frequencies, and researchers do not have an a priori clear idea of which behavior they can expect. This work is focused on developing a new procedure for the extraction of the main parameters of a nematic liquid crystal: dielectric permittivity and loss tangent at 11 GHz under different polarization voltages; splay elastic constant , which allows calculation of the threshold voltage (); and rotational viscosity , which allows calculating the response time of any arbitrary device. These properties will be calculated by using a resonator-based method, which is implemented with a new topology of substrate integrated transmission line. The LC molecules should be rotated (polarized) by applying an electric field in order to extract the characteristic parameters; thus, the transmission line needs to have two conductors and low electric losses in order to preserve the integrity of the measurements. This method was applied to a well-known liquid crystal mixture (GT3-23002 from MERCK) obtaining the permittivity and loss tangent versus bias voltage curves, the splay elastic constant, and the rotational viscosity of the mixture. The results validate the viability of the proposed method.

1. Introduction
Current wireless communication systems are driven by a growing demand for greater capability and data rate, more functionality, and improved mobility. This, along with the scarcity of frequency spectrum, leads to the development of more flexible and adaptable RF front ends [1,2]. Thus, the necessity for reconfigurable microwave components has lately become more imperative.
Reconfigurability can be implemented through three main different technologies: mechanical actuators, integrated devices, and tunable materials. Mechanical actuators as microelectromechanical systems (MEMS) and integrated devices as PIN diodes or field-effect transistors (FETs) have been traditionally used due to their easy integration in planar structures. However, these technologies only achieve a discrete reconfigurability and have high transmission losses, especially at higher frequencies [3].
Contrarily, tunable materials can achieve a continuous tunability range by changing their permittivity or permeability through an external (electric or magnetic) field. Although the integration of these materials in some communication systems could be complex, they can achieve broader reconfigurability ranges and higher quality factors than the previously mentioned technologies.
Among these tunable materials, nematic liquid crystals (LCs) have been employed to develop tunable devices at optical frequencies, and lately, they have become more relevant at microwave (MW) and millimetre-wave (mmW) frequency ranges. This is largely because LCs do not have an upper working frequency limit. In fact, these materials have lower losses at higher frequencies, being especially useful for frequencies above 10 GHz [3,4]. Additionally, LCs need an especially low bias voltage compared to other tunable materials like ferrites or other devices like MEMS. For these reasons, the development of reconfigurable LC-based devices for MW or mmW applications has gotten the attention of the research community in recent years, and several reconfigurable LC devices such as steerable antennas [5], phase shifters [6,7,8,9,10], and filters [11,12,13,14,15,16] have been reported in the literature.
Although nematic LCs are promising tunable materials, choosing an LC mixture for a specific function can be difficult as it depends on a large number of factors. The most determining ones are: the dielectric anisotropy, the dielectric loss, the switching voltage, and the switching times. Hence, an accurate characterization of these parameters is essential in order to use LCs in frequency agile devices.
Two techniques have widely been used to determine the permittivity characteristics of LCs [4]. The first approach involves the measurement of an LC filled transmission line. These transmission line based methods can determine the complex permittivity of LCs within a broad frequency band, but they have a limited accuracy. We can find some examples of these techniques in the literature: in [17] a broadband coaxial line was used and in [18] an inverse microstrip line.
The other approach involves the measurement of a resonant structure, from which the complex permitivity of LCs can be determined at single frequency points. These resonator-based methods have higher sensitivity and better accuracy than the ones based on transmission lines [19].
The aim of this work is to develop a new method for measuring the dielectric anisotropy and the dielectric loss at microwave frequencies, and approximating the splay elastic constant and the rotational viscosity of LCs using only one device. For this purpose, a new substrate integrated resonator topology was designed and manufactured, and the proposed method was applied to a well-known nematic LC mixture (GT3-23002 from MERCK).
2. Materials And Methods
This section will examine the methodology for the parameter extraction, the topology of the proposed resonator, the creation of an alignment layer valid on the copper cladding of commercial printed board circuits (PCBs), the assembling and filling of the whole structure and, finally, the measurement setup.
2.1. LC Parameters Extraction
LCs are anistropic materials that show intermediate state phases (mesophases) between the solid/crystalline, and the fluid/isotropic state. Thermotropic LCs exhibit phase transitions into LC phase(s) as temperature is changed. LCs used in radio frequency applications are integrated by elongated rod-like molecules (calamitic LCs) that can typically show a nematic phase at room temperature [20], i.e., the molecules flow as liquids, but they maintain long-range directional (or orientational) order.
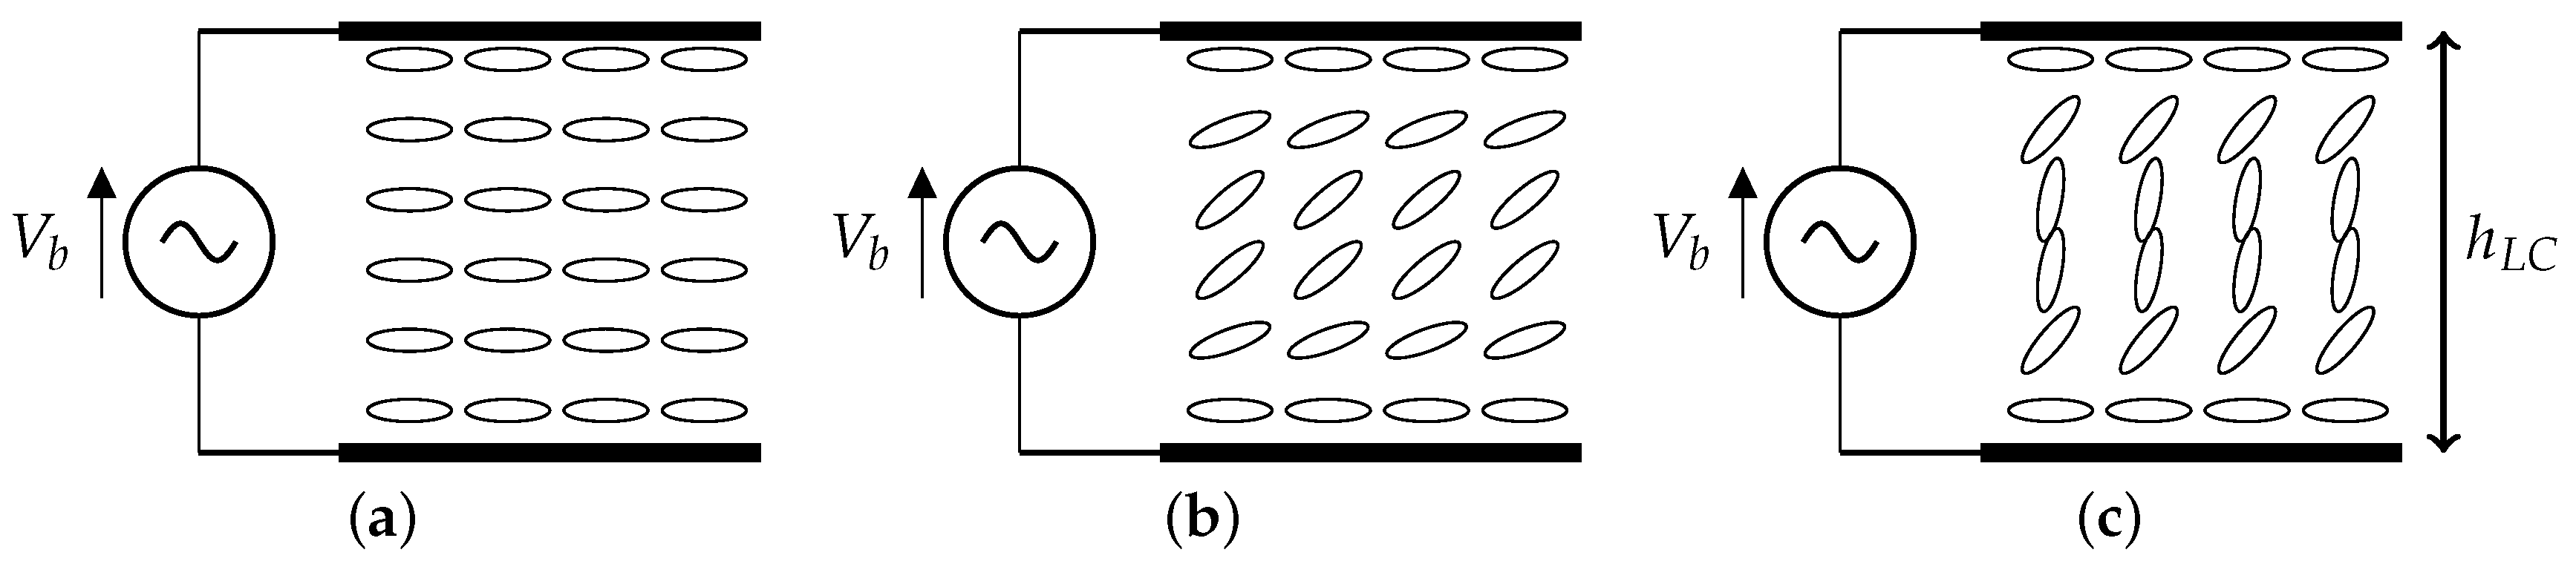
Macroscopically, the anisotropic structure of nematic LCs can be described by a director vector (), which corresponds to the average direction of the long axis of LC molecules, see Figure 1a, and the dielectric permittivity of this material can be defined by the angle formed between this director and the electric field. Thus, LCs have two principal electric permittivities, parallel to the director and perpendicular to the director . Moreover, molecules of these LCs include a polar group that allows the reorientation of the molecules by using a DC or low frequency electric field. This results in a uniaxial anisotropic material, whose permittivity can be controlled through an electric or magnetic bias field.
In a typical configuration where LC is sandwiched between two electrodes, the initial alignment of the molecules is achieved by an anchoring layer. These anchoring layers are attained by coating the electrodes with a polyimide film engraved with microscopic grooves; this enables the molecular alignment in the unbiased state, Figure 1a. In this case, the effective relative permittivity can be approximated by . The LC molecules start rotating when the bias voltage applied between the two electrodes exceeds the Fréedericksz transition threshold value [20], which depends on the splay elastic constant and the electric anisotropy at the polarization frequency (1kHz) :
As bias voltage is increasing () the effective relative permittivity increases until saturation (), when LC molecules are totally parallel to the electric field (), see Figure 1c. Thereby, for intermediate voltage values () we will obtain intermediate permittivity values, Figure 1b).
As can be noticed, dielectric anisotropy is one of the most important properties of interest in the design of tunable devices, since it limits the total tunability range of the device. However, the threshold voltage and response times could be a very limiting factor in the development of this kind of devices, since they define the complexity of the biasing network and the response time for reconfiguration. In order to calculate their values, two LC properties are used: the splay elastic constant , which allows for the calculation the LC threshold voltage () and the rotational viscosity , which allows to determine the response times ( and ) of any arbitrary LC-based device.
These properties will be calculated by using a resonator-based method, which is implemented on a new topology of substrate integrated transmission line. In this method the LC serves as a key part of a resonator, and the properties (complex permittivity, i.e., and ) of the material can be determined from its electric response (resonance frequency and quality factor Q). In order to compute and , liquid crystals molecules need to be reorientated by using an electric or magnetic polarization field. Since magnetic field polarization systems are complex and bulky, a two conductor structure that allows for the application of a bias electric field was chosen. Moreover, this structure allows for the measurement of the electric response of the resonator at different polarization voltage levels.
For determining the splay electric constant and the rotational viscosity, the well-known Fréedericksz transition solution can be employed [20]. This transition defines where the electric force of the bias voltage and the elastic forces of the anchoring layer are in equilibrium, i.e., the minimum voltage required to start the rotation of the LC molecules, Equation (1). For calculating the splay electric constant and the rotational viscosity, the relationships between these parameters, the threshold voltage , and the response times, as given by Equations (1)–(3), are used. It is important to notice that these equations are only valid when backflow and inertial effects are ignored, and assuming [21]. Furthermore, Equation (3) is valid only when the applied voltage is not much higher than the threshold [20] so it will be used to compute Equation (3) but not to compute the rotational viscosity. From the curve can be extracted, then, using Equation (1) and knowing , i.e., electric anisotropy at the polarization frequency, the splay elastic constant can be calculated.
The relaxation response time () for commuting from the parallel polarization () state to the steady state () is related to a set of LC parameters, as Equation (2) states. Knowing the height of the LC volume and the splay elastic constant , the rotational viscosity can be easily extracted by measuring the time that this reorientation takes. Finally, the reorientation time from the steady state to parallel state can be computed.
2.2. Proposed Resonant Cavity
As already mentioned in the Introduction section, there are plenty of examples of permittivity extraction methods based on resonant structures. These techniques can be classified into two types: shielded or quasishielded structures and open structures.
The first approach mainly uses resonant cavities implemented on circular waveguides, rectangular waveguides or coaxial resonators. These shielded cavities achieve high Q, obtaining high sensitivity and a good accuracy. However, this approach requires an expensive and bulky laboratory setup in order to polarize LC molecules using a static magnetic field [4] and do not allow the calculation of and because they do not use electric polarization.
On the other hand, the usage of resonant structures implemented on planar transmission lines achieves lower accuracy than shielded structures due to the related higher losses. However, unlike the previous ones, these structures allow for the polarization of the LC molecules using a combination of anchoring layers and electric biasing. This allows the extrapolation of and response times.
In this work, a new hybrid approach based on the substrate integrated waveguide (SIW) technology is presented. This approach has higher accuracy than other methods based on planar transmission lines, while it enables measuring permittivities, , and response times.
2.2.1. Transmission Line Topology
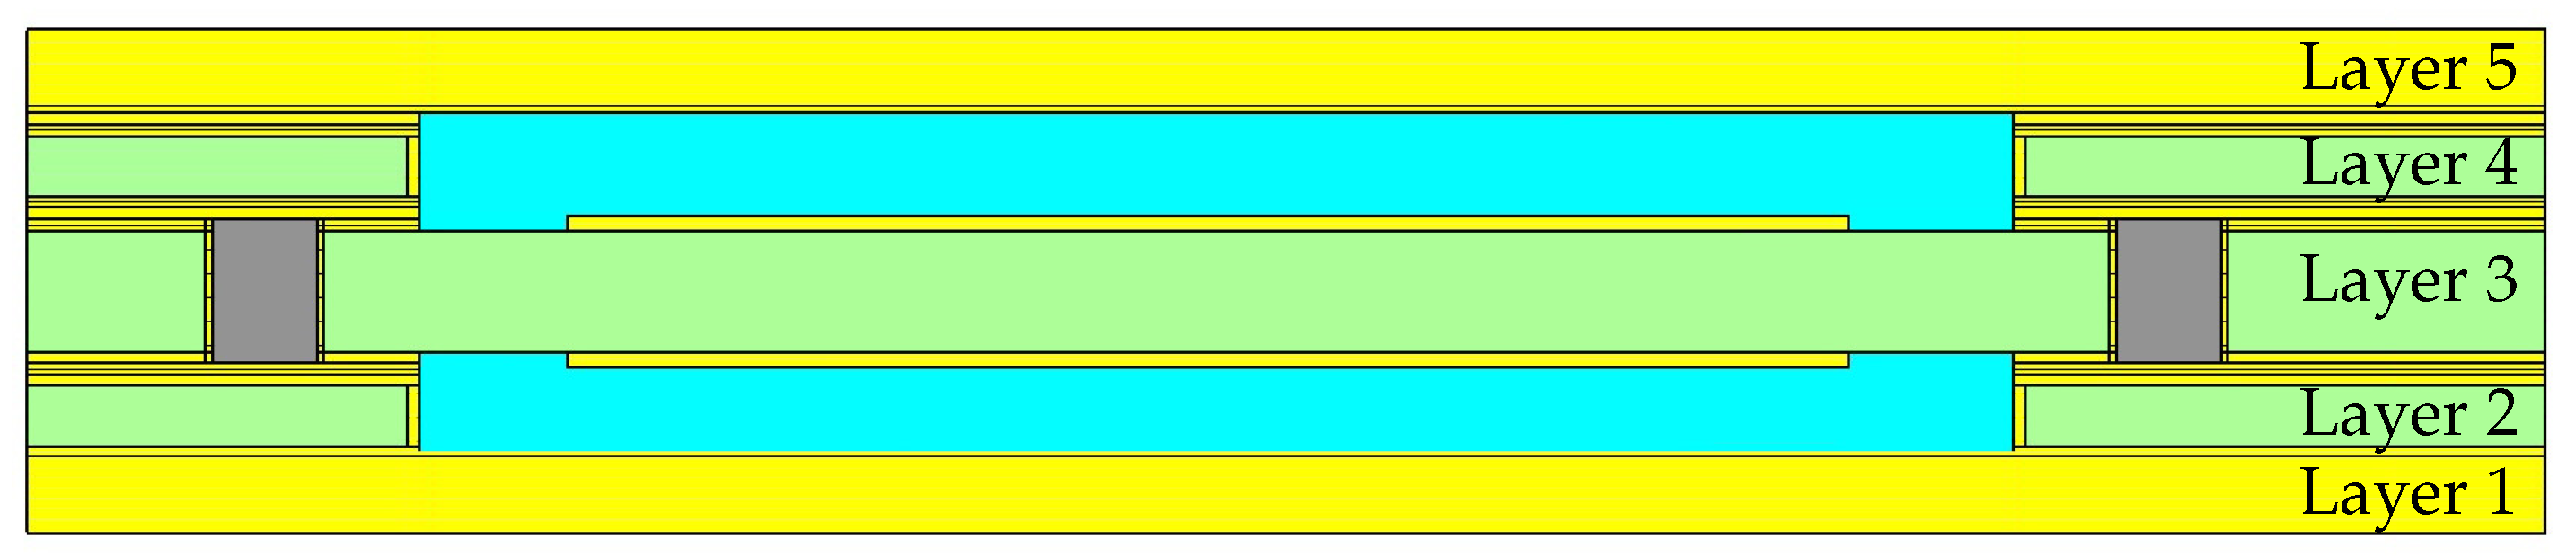
The proposed structure is a 5-layer Substrate Integrated Waveguide (SIW) in which, layers 1 and 5 (numbered from bottom to top) perform the top and bottom electric horizontal walls of the equivalent waveguide. On the other hand, the equivalent sidewalls of the waveguide are performed using plated cuts and Plated Through Holes (PTH) on layers 2, 3, and 4. Therefore, the electromagnetic field is confined in layers 2, 3, and 4, whereas layers 1 and 5 are used just as covers.
In this particular structure, two sealed cavities are performed on layers 2 and 4 by cutting the substrate. Hence, the vertical walls of these cuts are plated to perform the sidewalls of the equivalent waveguide (see Figure 2). It is important to notice that layer 3 (the middle one) is used as a support to build a second conductor, which is decoupled to the walls of the waveguide, as depicted in Figure 3c. The top and bottom conductors of this layer 3 are, respectively, the bottom and top horizontal walls of the two sealed cavities created. The two conductors of layer 3 are connected to the same voltage through a PTH, thus enabling their use to polarize the LC in the cavities by using a low frequency field.
2.2.2. Resonator Layout
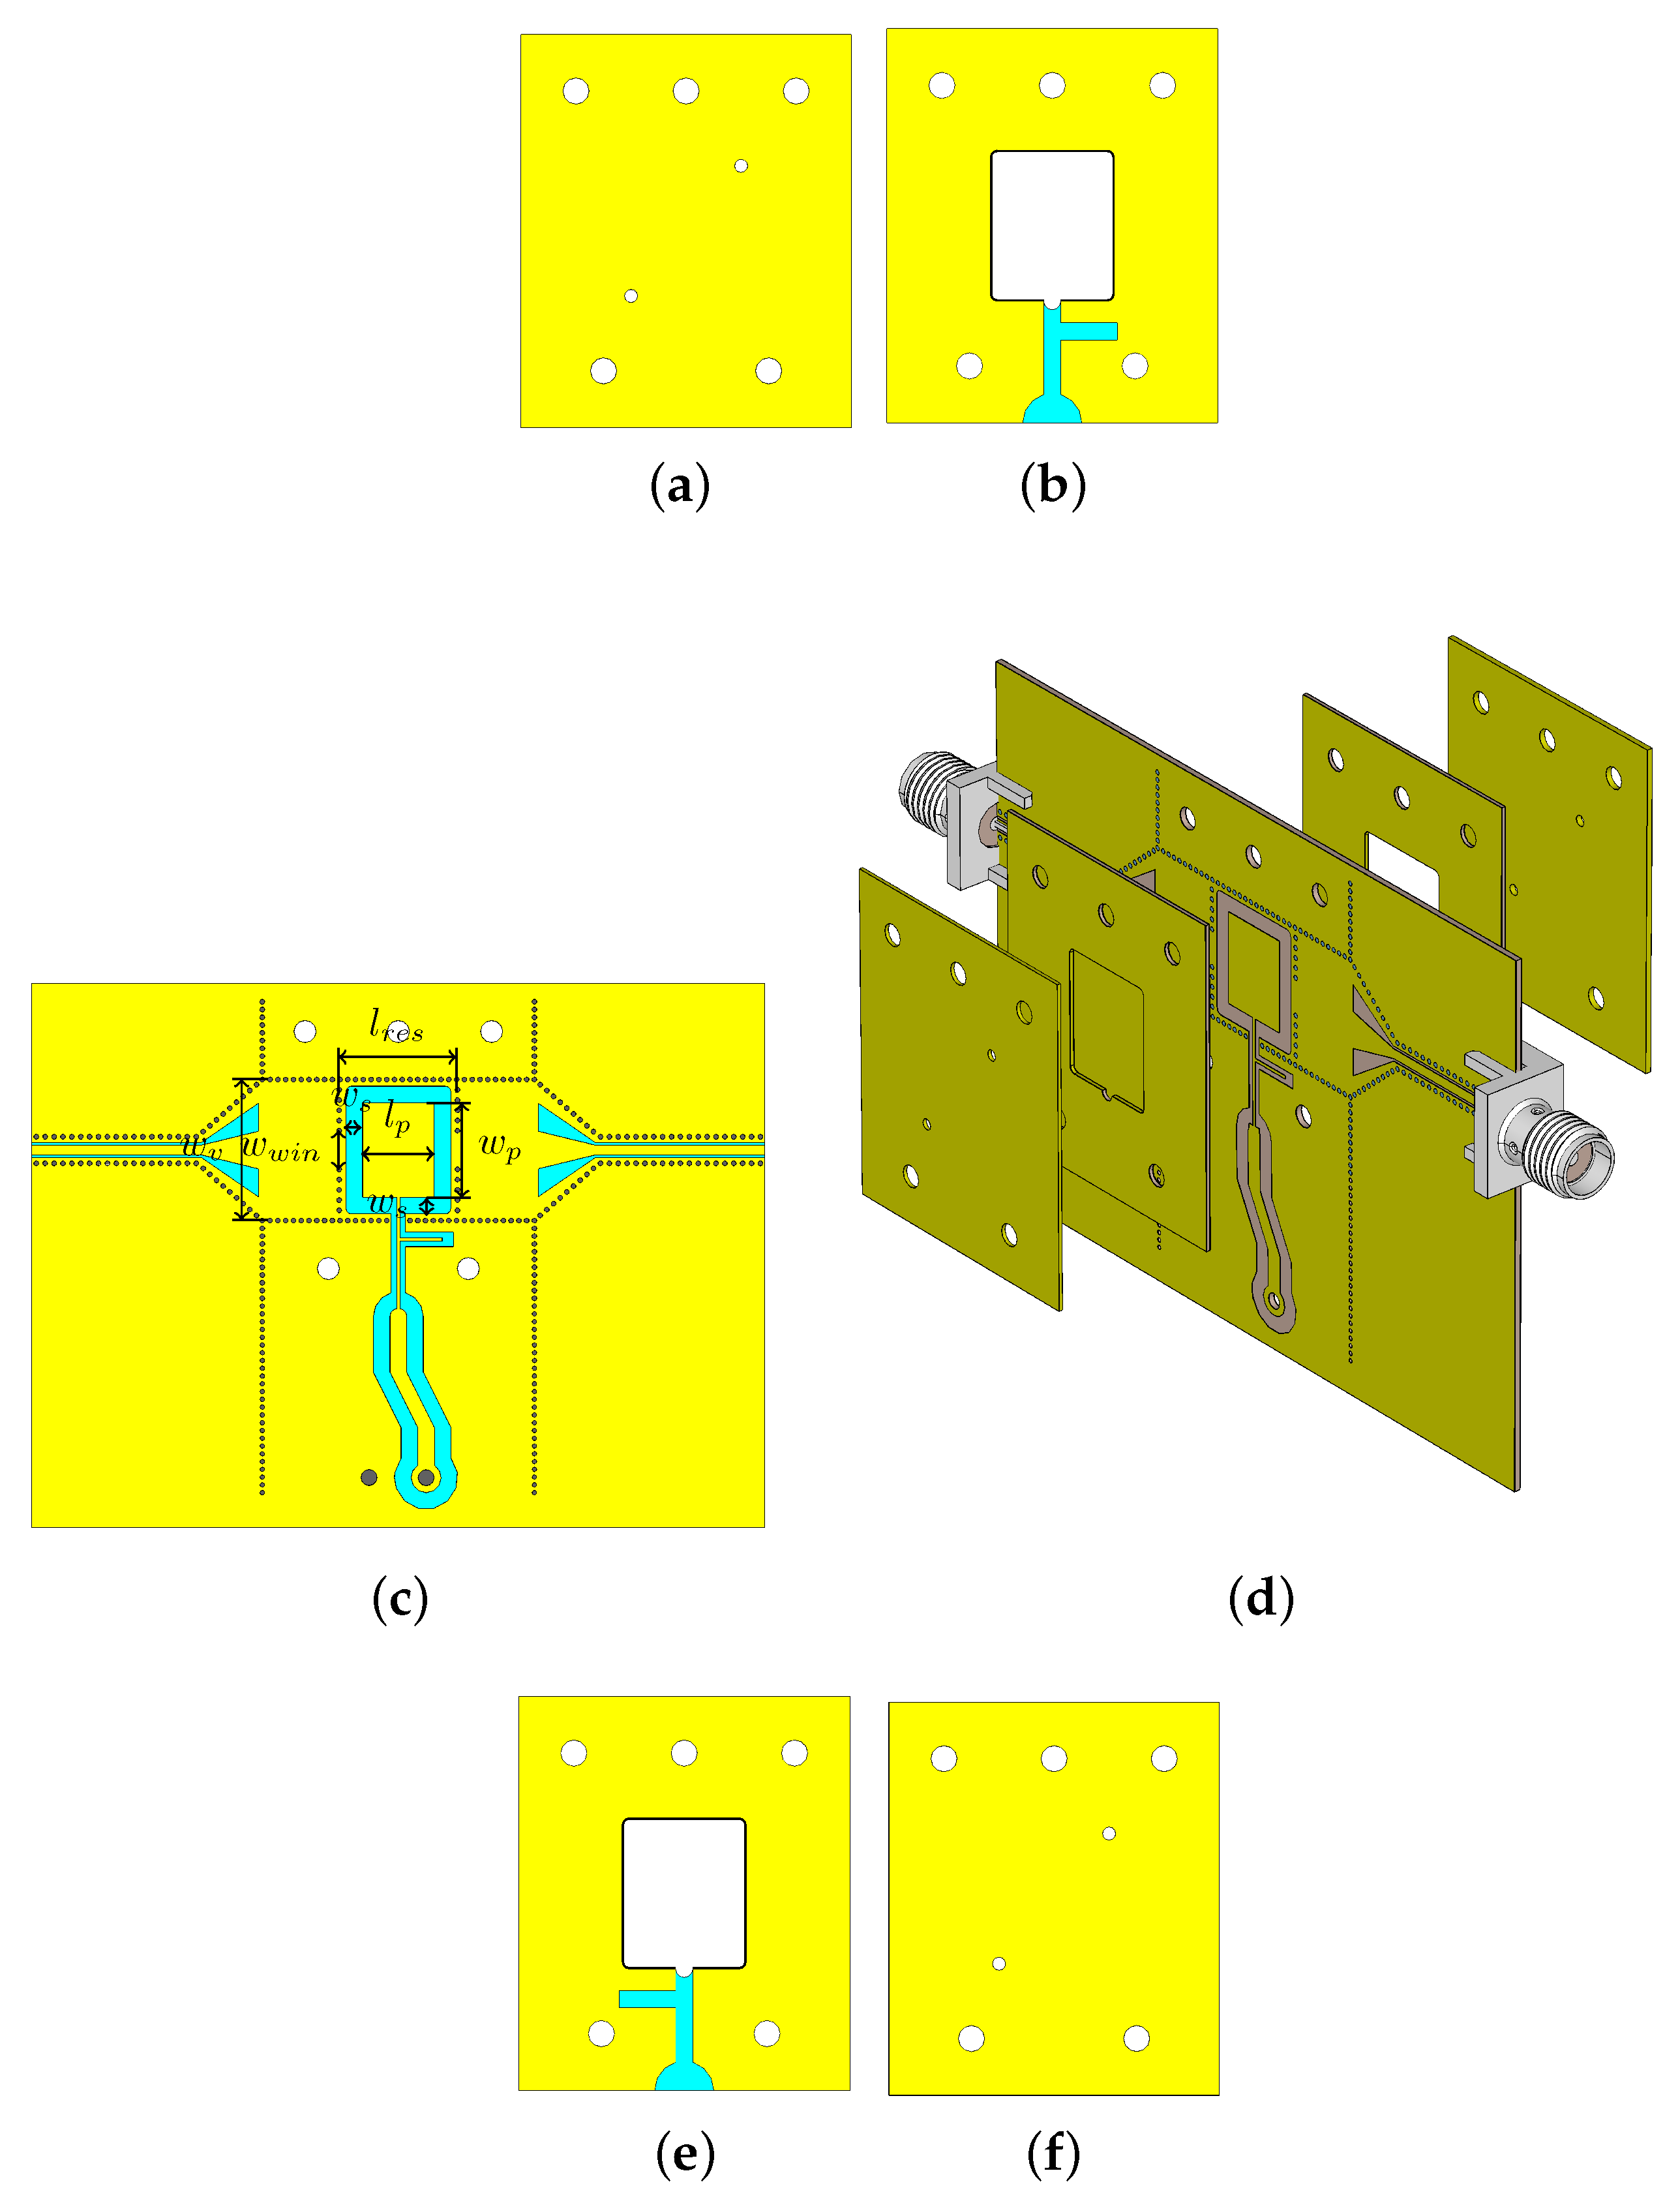
Figure 3c shows the third layer (the most relevant one) of the proposed resonator. The microwave frequency signal (RF) is fed by a Coplanar Waveguide with Lower Ground Plane (CPWG) that allows for the measurement of the devices by using SMA connectors. The RF field is transmitted, using a tapered transition, from the CPWG to a SIW line created in layer 3. This SIW line is implemented by two PTH rows with 0.5 mm of diameter and a separation pitch of 0.7 mm, and the width of this structure was designed to have a cutoff frequency of 6.25 GHz [22]. This SIW line feeds the resonator by using an equivalent coupling window implemented with PTH, the RF signal is transmitted in the two cavities that will contain the LC and also in the substrate of layer 3 through a weak coupling, see Figure 9. Conversely, the low frequency signal (bias voltage) can be applied to the polarization patch through an integrated biasing network and a phoenix connector, which allows us to apply more than 300 Vpp.
This biasing network is based on a high impedance strip line designed to avoid the coupling of the RF signal. Furthermore, at a length distance of of these strip lines, an open-ended -stub line has been incorporated to ensure that the biasing network appears as an open circuit to the RF signal, in order to protect the output of the biasing generator system [23]. The bottom view of layer 3 is the same as the top one but without the isolation of the CPGW feeding line and taper transition.
The resonator was designed to have a resonant mode at 11 GHz when both cavities are filled with the LC mixture. The main design parameters of the structure, see Figure 3c, are: equivalent width of the SIW line and resonator = 12.7 mm, width of the resonator coupling window = 3.48 mm, equivalent resonator length = 10.15 mm, biasing patch length = 3.8 mm, biasing patch width = 0.3 mm and clearance width = 1.5 mm. The height of the cavities is determined by the thickness of the substrates of layer 2 and layer 4, plus the copper cladding and the welding used to assemble the stack (see Figure 2), resulting in a total height = 0.392 mm.
The cavities for the LC mixture are inserted in layers 2 and 4, which are realized by hollowing and platting rectangular gaps in the center of each layer. It is noteworthy that the top view of layer 2 (see Figure 3b) is exactly the same as the bottom view of layer 4 (see Figure 3e) due to the vertical symmetry of the device. Moreover, the clearance in these layers corresponds with the biasing network of layer 3, and therefore it is only necessary in the immediately upper and lower layers views (i.e., top of layer 2 and bottom of layer 4). The filling of the cavities are done through two thin unplated holes performed in the covers (layers 1 and 5).
Concerning the materials for manufacturing, layers 1 and 5 can be made on any affordable substrate that could be easily plated (e.g., FR4), layer 2 and 4 were developed on RO4003C, thickness = 0.305 mm and copper cladding = 1/2 oz (17 m), layer 3 was developed on RO4003C substrate, thickness = 0.508 mm and copper cladding = 1/2 oz (17 m).
2.3. Alignment Layer
The alignment coating is usually formed by deposition of polyimide (PI) on the liquid crystal support, typically glass, and creation of microgroves by rubbing in a well defined direction. However, when creating this layer on a rougher material such as copper, it is possible that the great roughness of the support hides the microgrooves of the alignment layer causing a malfunction. In these situations, a thicker layer of PI is usually used [4,23]. In our case, it was needed to flatten a far more roughness surface than glass, so we decided to carry out a double deposition using two different materials: polybisphenol A carbonate (PC) and PI. In this double deposition, PC would reduce the effect of the copper roughness on the PI alignment layer.
2.3.1. Deposition of Polybisphenol A Carbonate
In order to apply this layer, PC needs to be dissolved into one of its solvents, in this case chloroform (methylene chloride) was used. This solution was applied to the support and was solidified at room temperature. After some tests to experiment with the concentration of the PC solution and the deposition mechanism, it was decided to use a coating blade with a solution of 100 L of solvent for every 15 mg of PC, which provides a homogeneous thickness layer that flattens the copper surface. A Kapton mask was used to limit the deposit of the polymer layer.
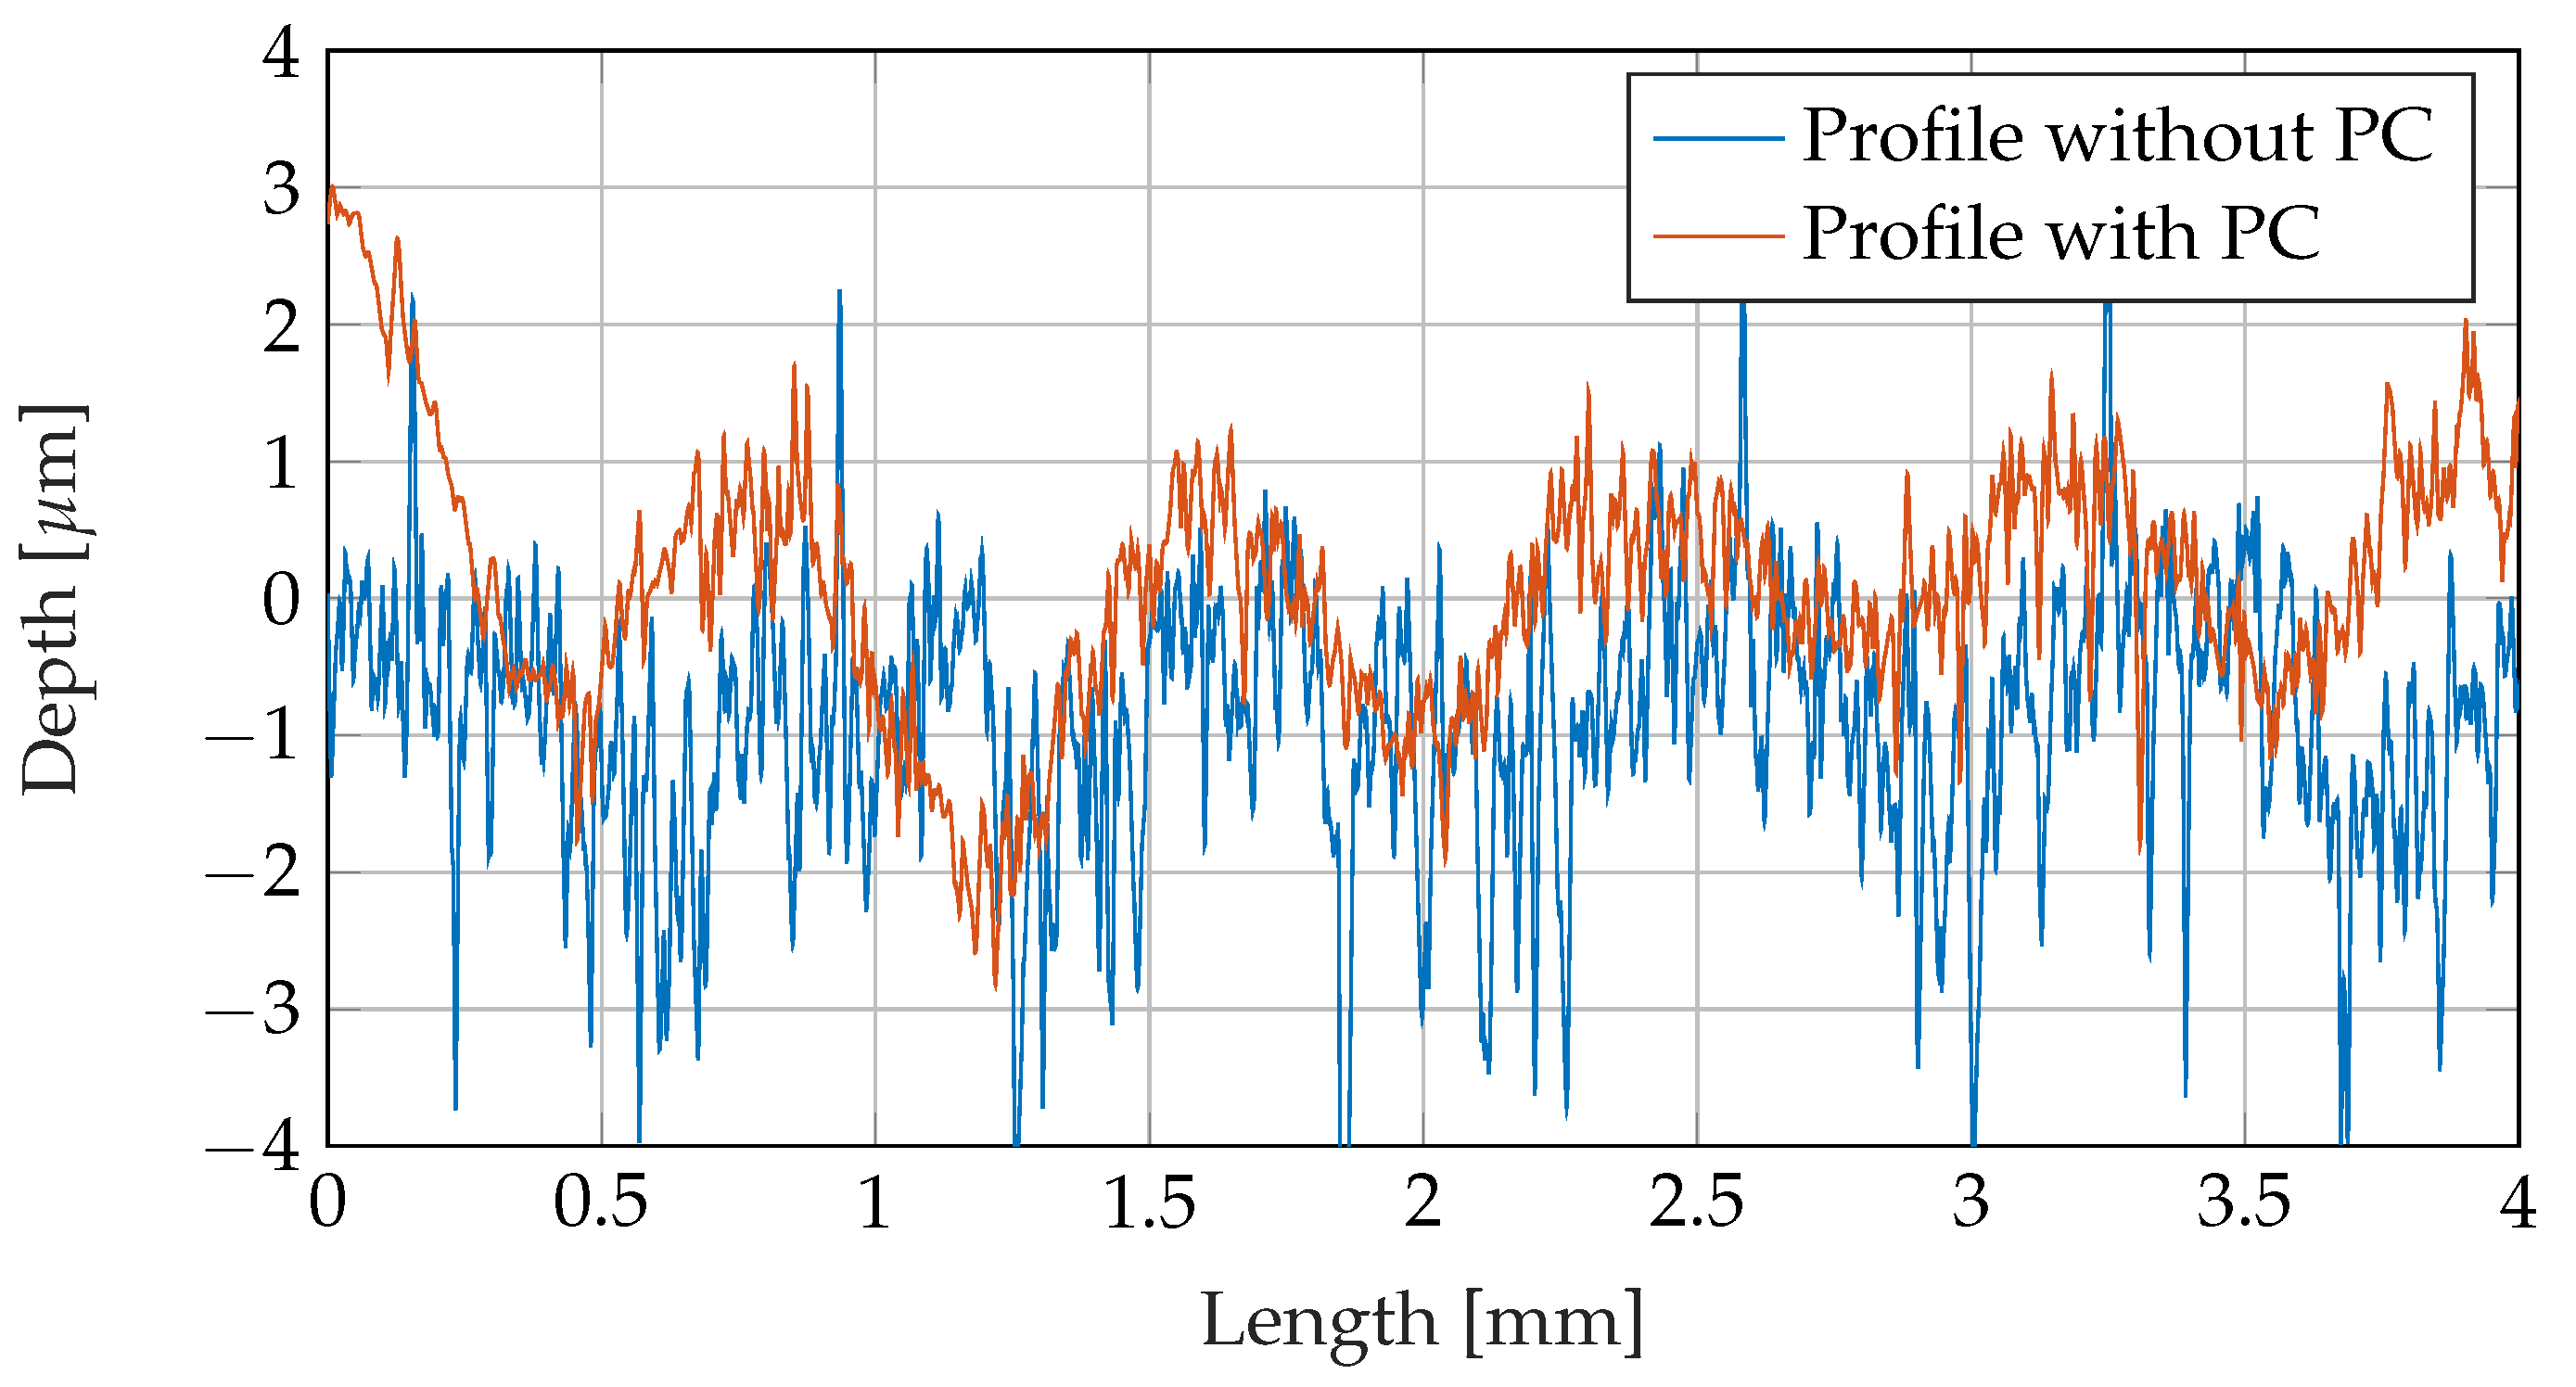
After this coating, profilometric measurements were carried out to check the thickness of the deposition and the reduction in roughness. These measurements were made on the direction perpendicular to the propagation of the microwave field, see Figure 4.
It is interesting to note the difference between waviness and roughness in measurements of Figure 4. In this case, waviness is caused by sanding the copper surface with 400 grit sandpaper, but this waviness does not hinder the effect of the alignment layer. However, the profile without PC has an average roughness (high frequency variation over the envelope) of 417 nm that can interfere with the microgrooves that conform the alignment layer. In this case, the PC deposition was able to reduce this average surface roughness by 26%.
2.3.2. Polyimide Deposition
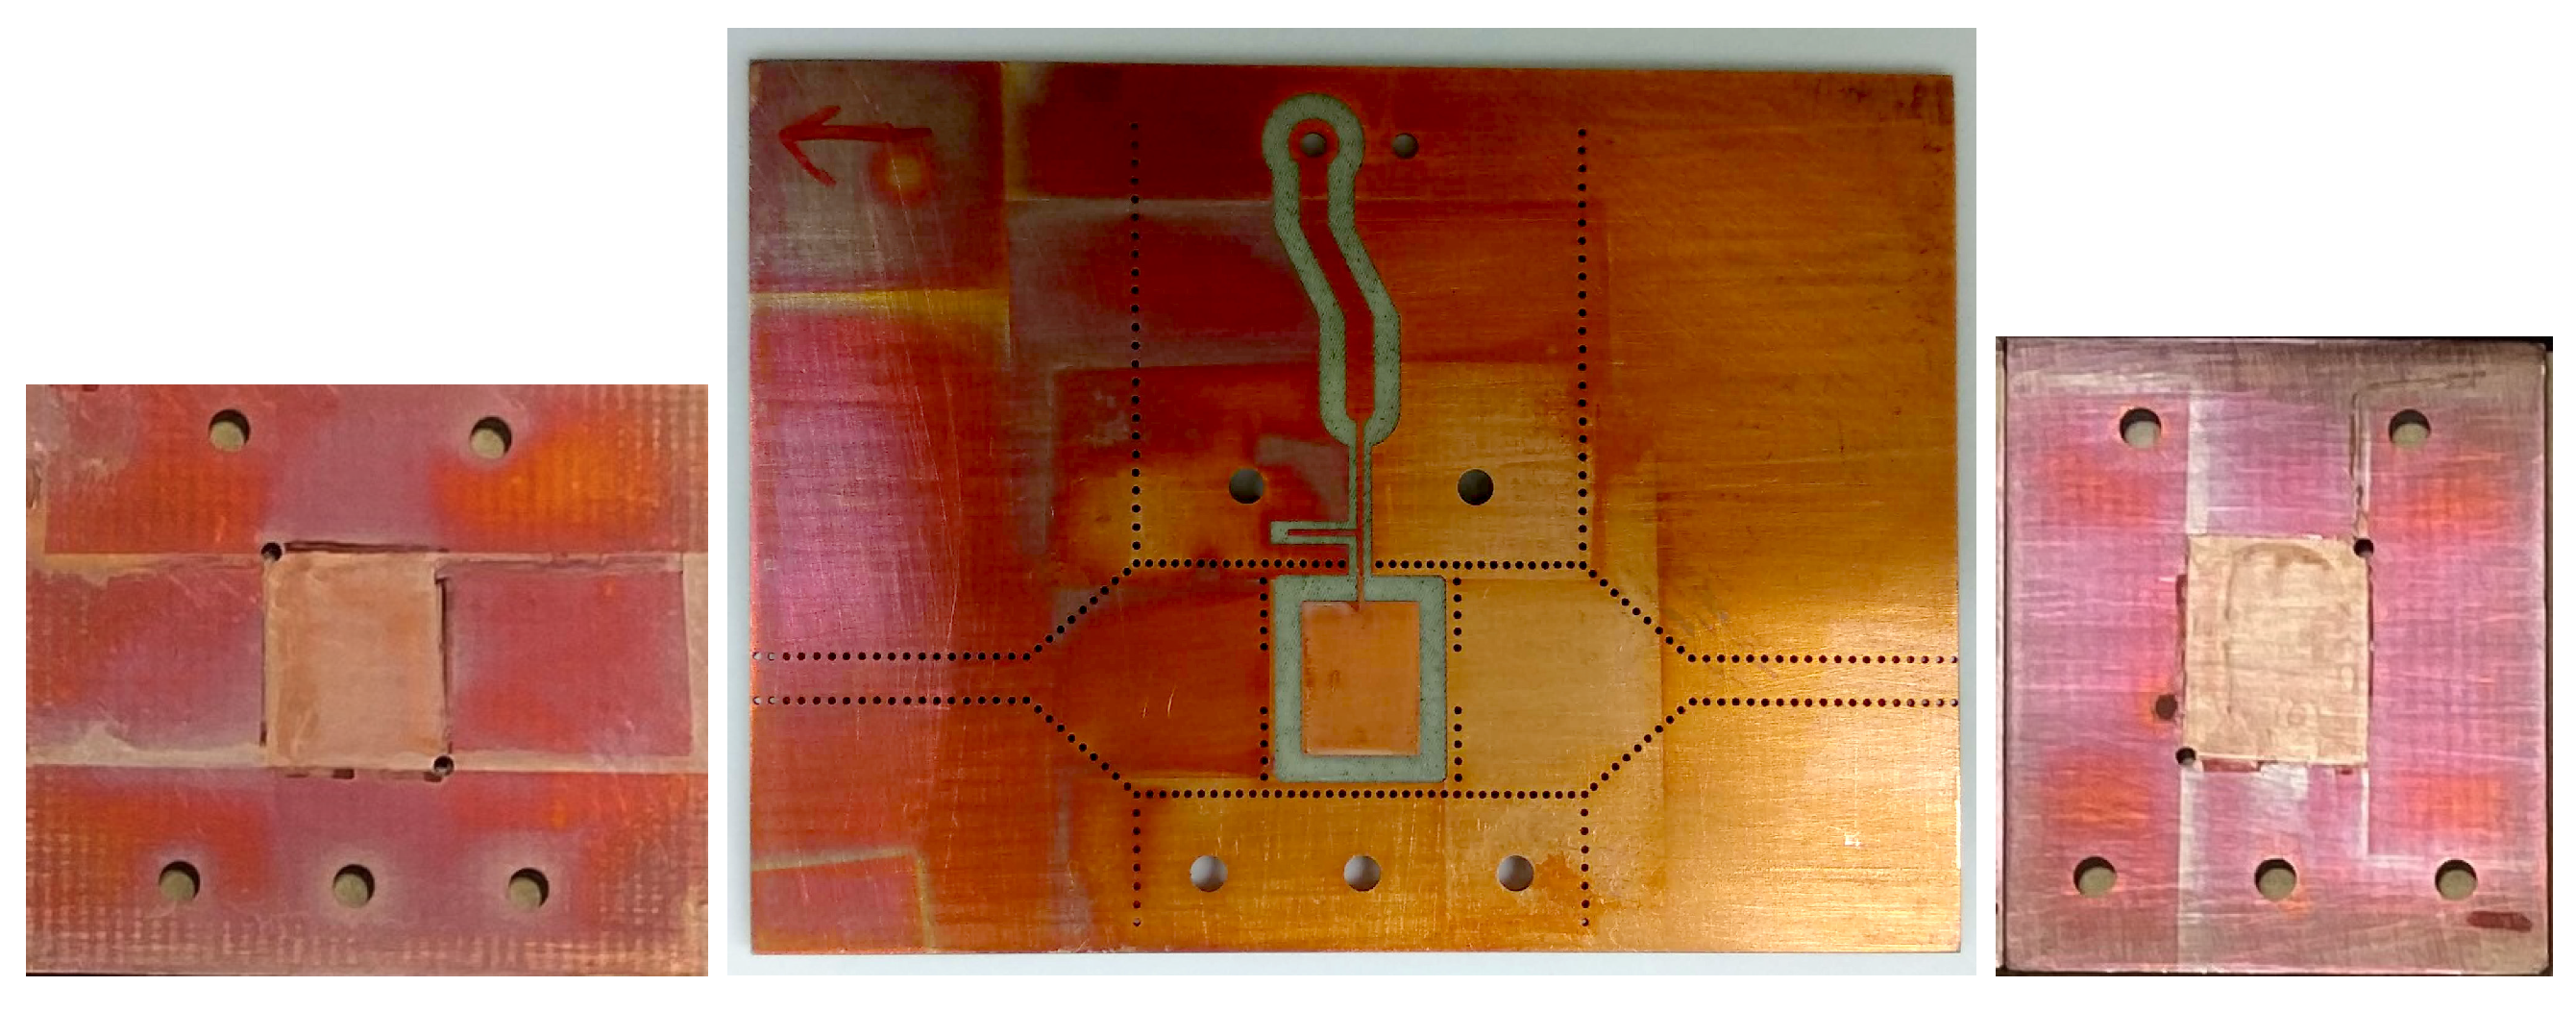
PI was deposited by spin coating and cured by the application of the following temperature profile: 80 C for 20 min and 180 C for 60 min. After curing, the samples were covered and rested for a couple of hours. Then, a velvet rubbing was carried out, which achieved the microgrooves of the alignment layer. Finally, the Kapton mask was removed by carefully cutting the deposition of the masking tape; it was observed that the temperature treatment of the PI had hardened the PC deposition, making it adhere more strongly to the copper and easing the unmasking process. Figure 5 shows the manufactured layers 1, 3 and 5 after the double deposition process.
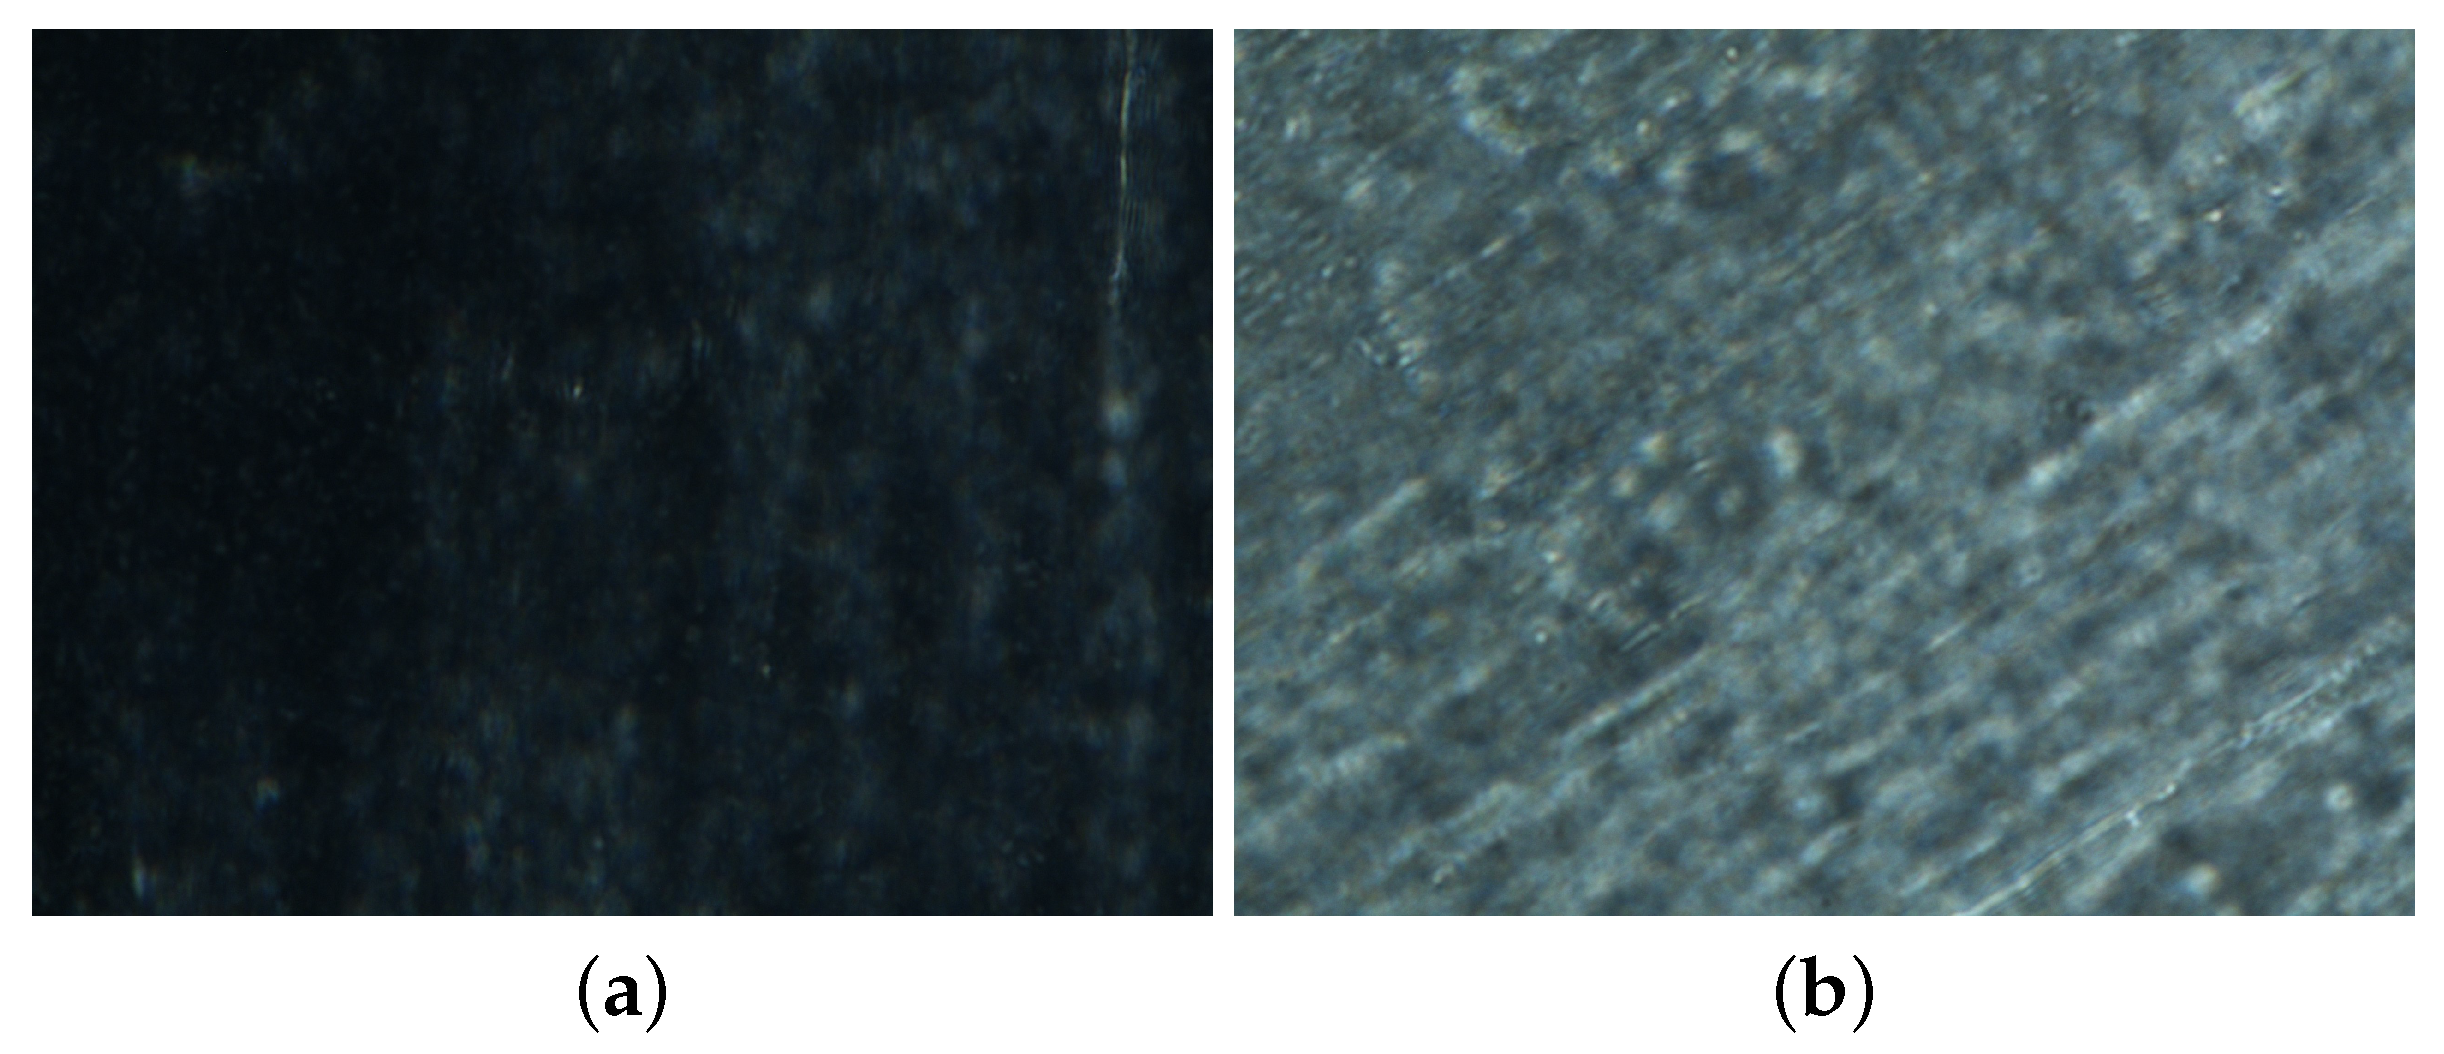
In order to discern if the alignment of the LC can actually be achieved by using the described double deposition, it was applied to a glass cell as this enables an optical check of the orientation. After the deposition and making up of the cell, light transmission measurements were carried out with the cell between crossed polarizers. In Figure 6, the absence of transmission can be observed when the liquid crystal orientation is parallel to the direction of one of the polarizers (a), while the light is transmitted when the angle between the axis of the cell and that of the polarizers is 45 (b). The orientation grooves are also appreciated in the microphotography.
2.4. Assembling and Filling
The five layers of the resonator are then assembled by welding and screwing. A low temperature no water washable solder paste (SMDLTLFP10T5 from Chipquik) was used to assemble the stack. SMA connectors for the RF signal are welded to the ports as well as the phoenix connector for the bias voltage. The frequency response (transmission and reflection parameters) of the empty resonator was measured in order to check that the device worked properly and no problems during the manufacturing had appeared.
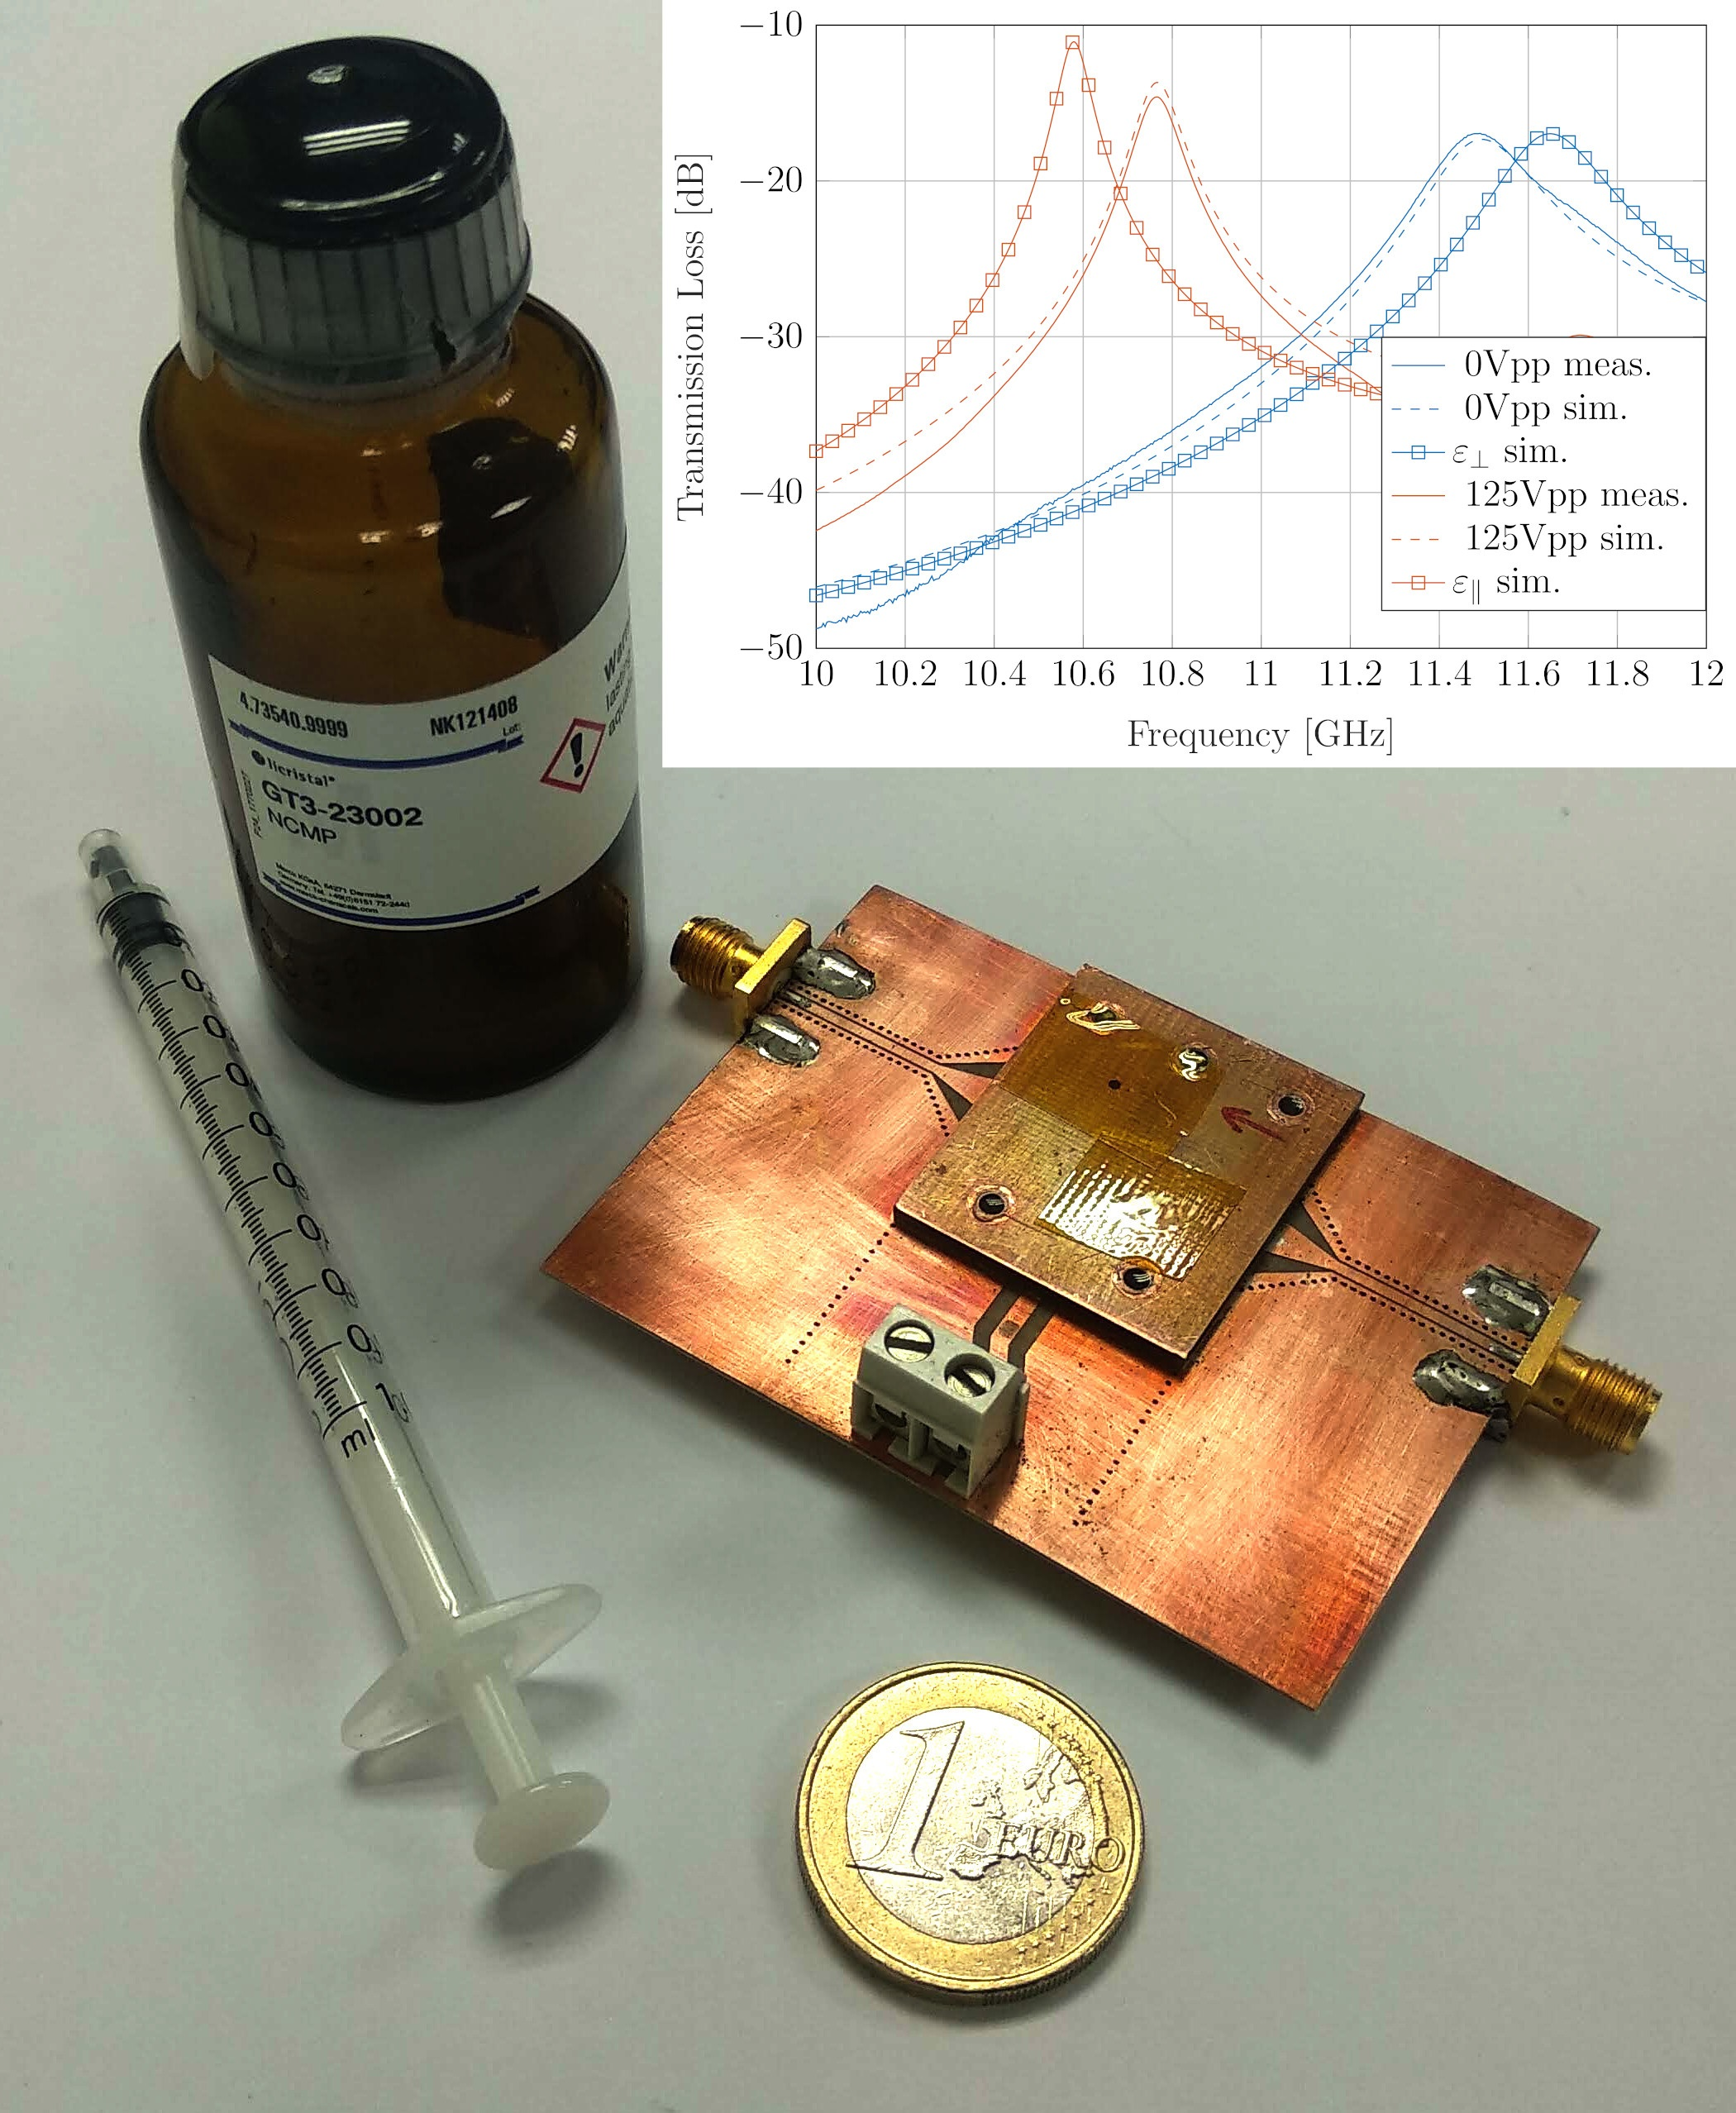
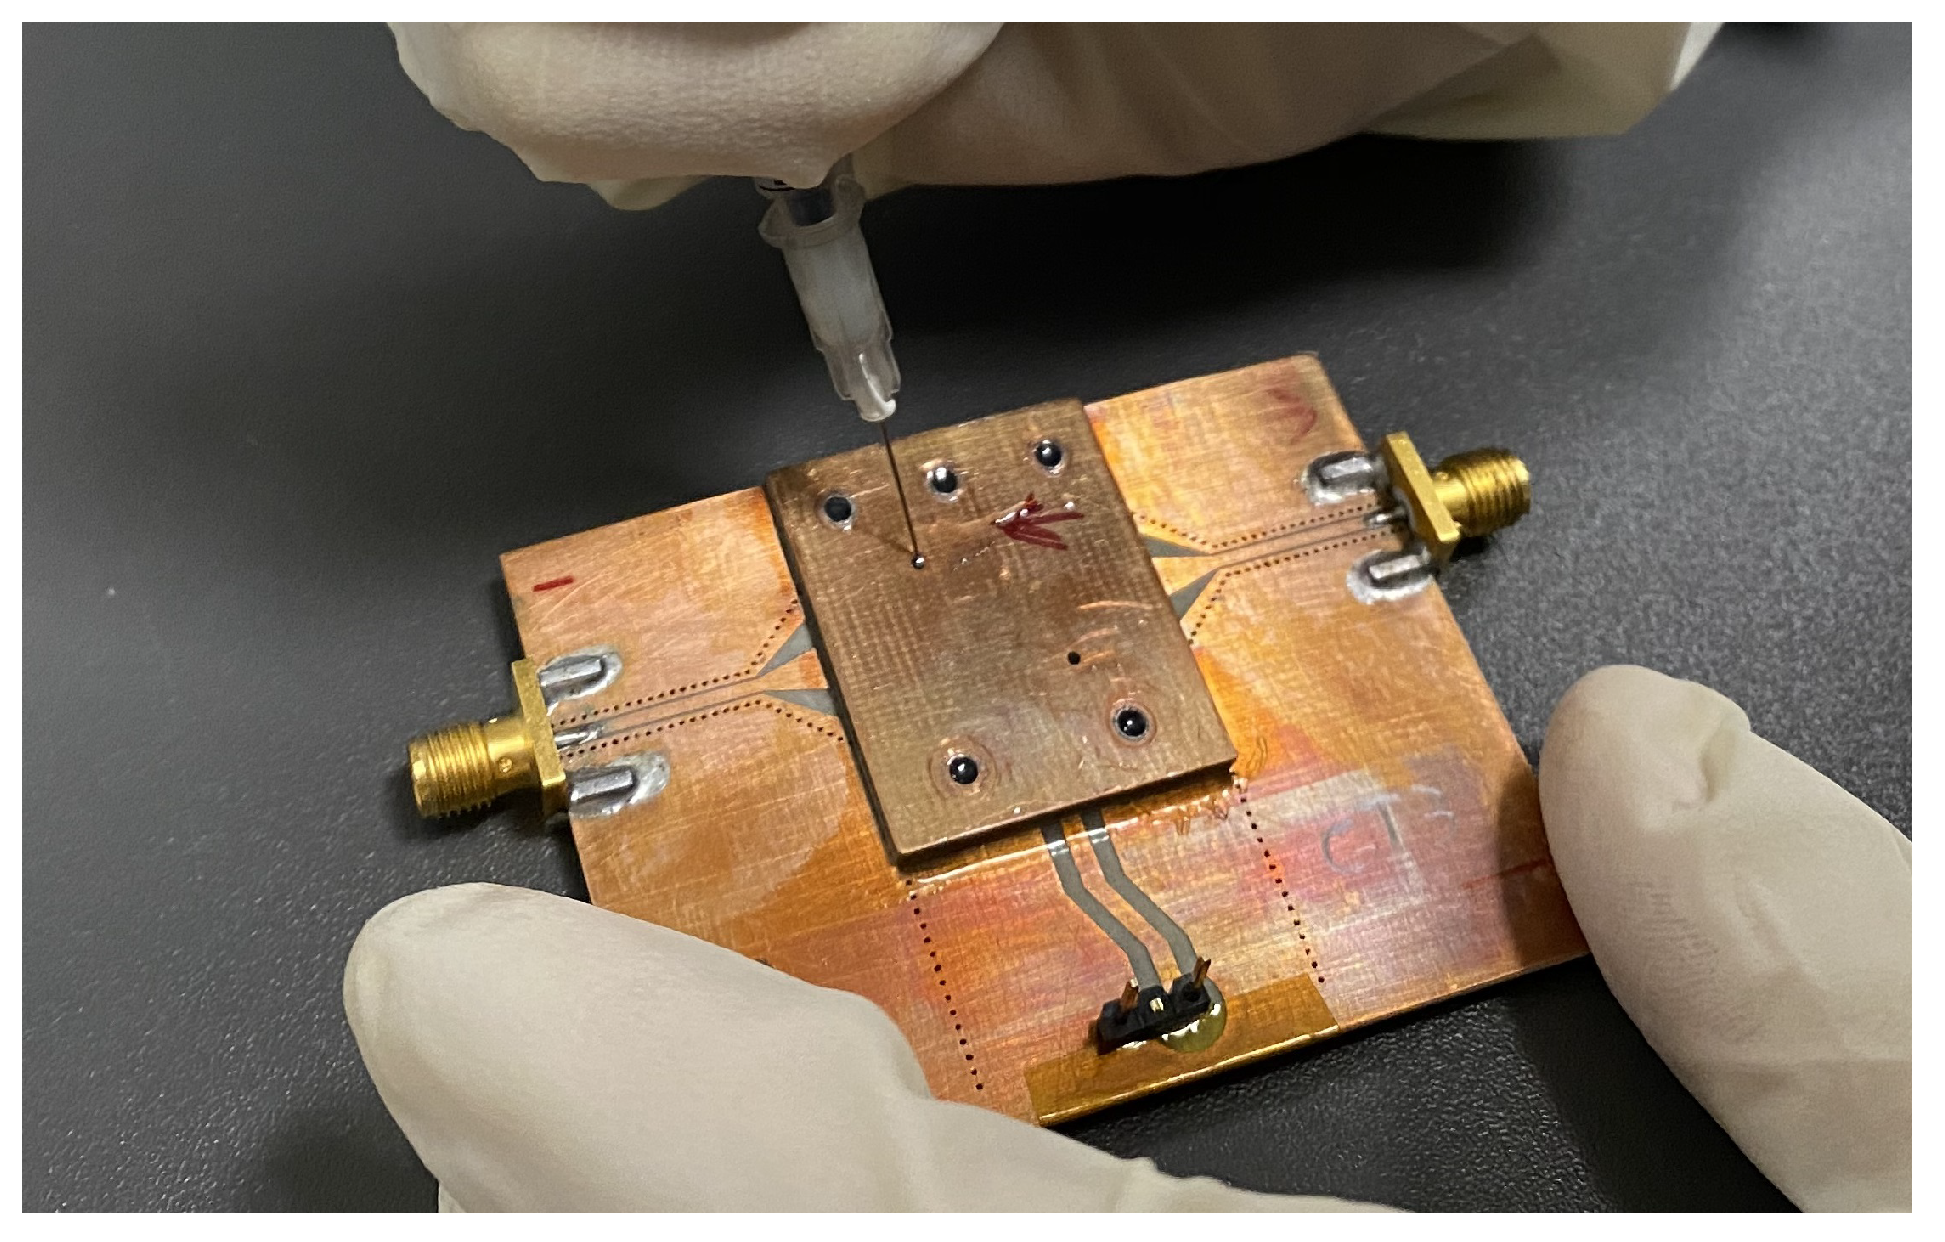
The two cavities created in the resonator were then filled with MERCK GT3 23002 liquid crystal using a syringe (see Figure 7) and sealed with NORLAN UV glue.
2.5. Measurement Setup
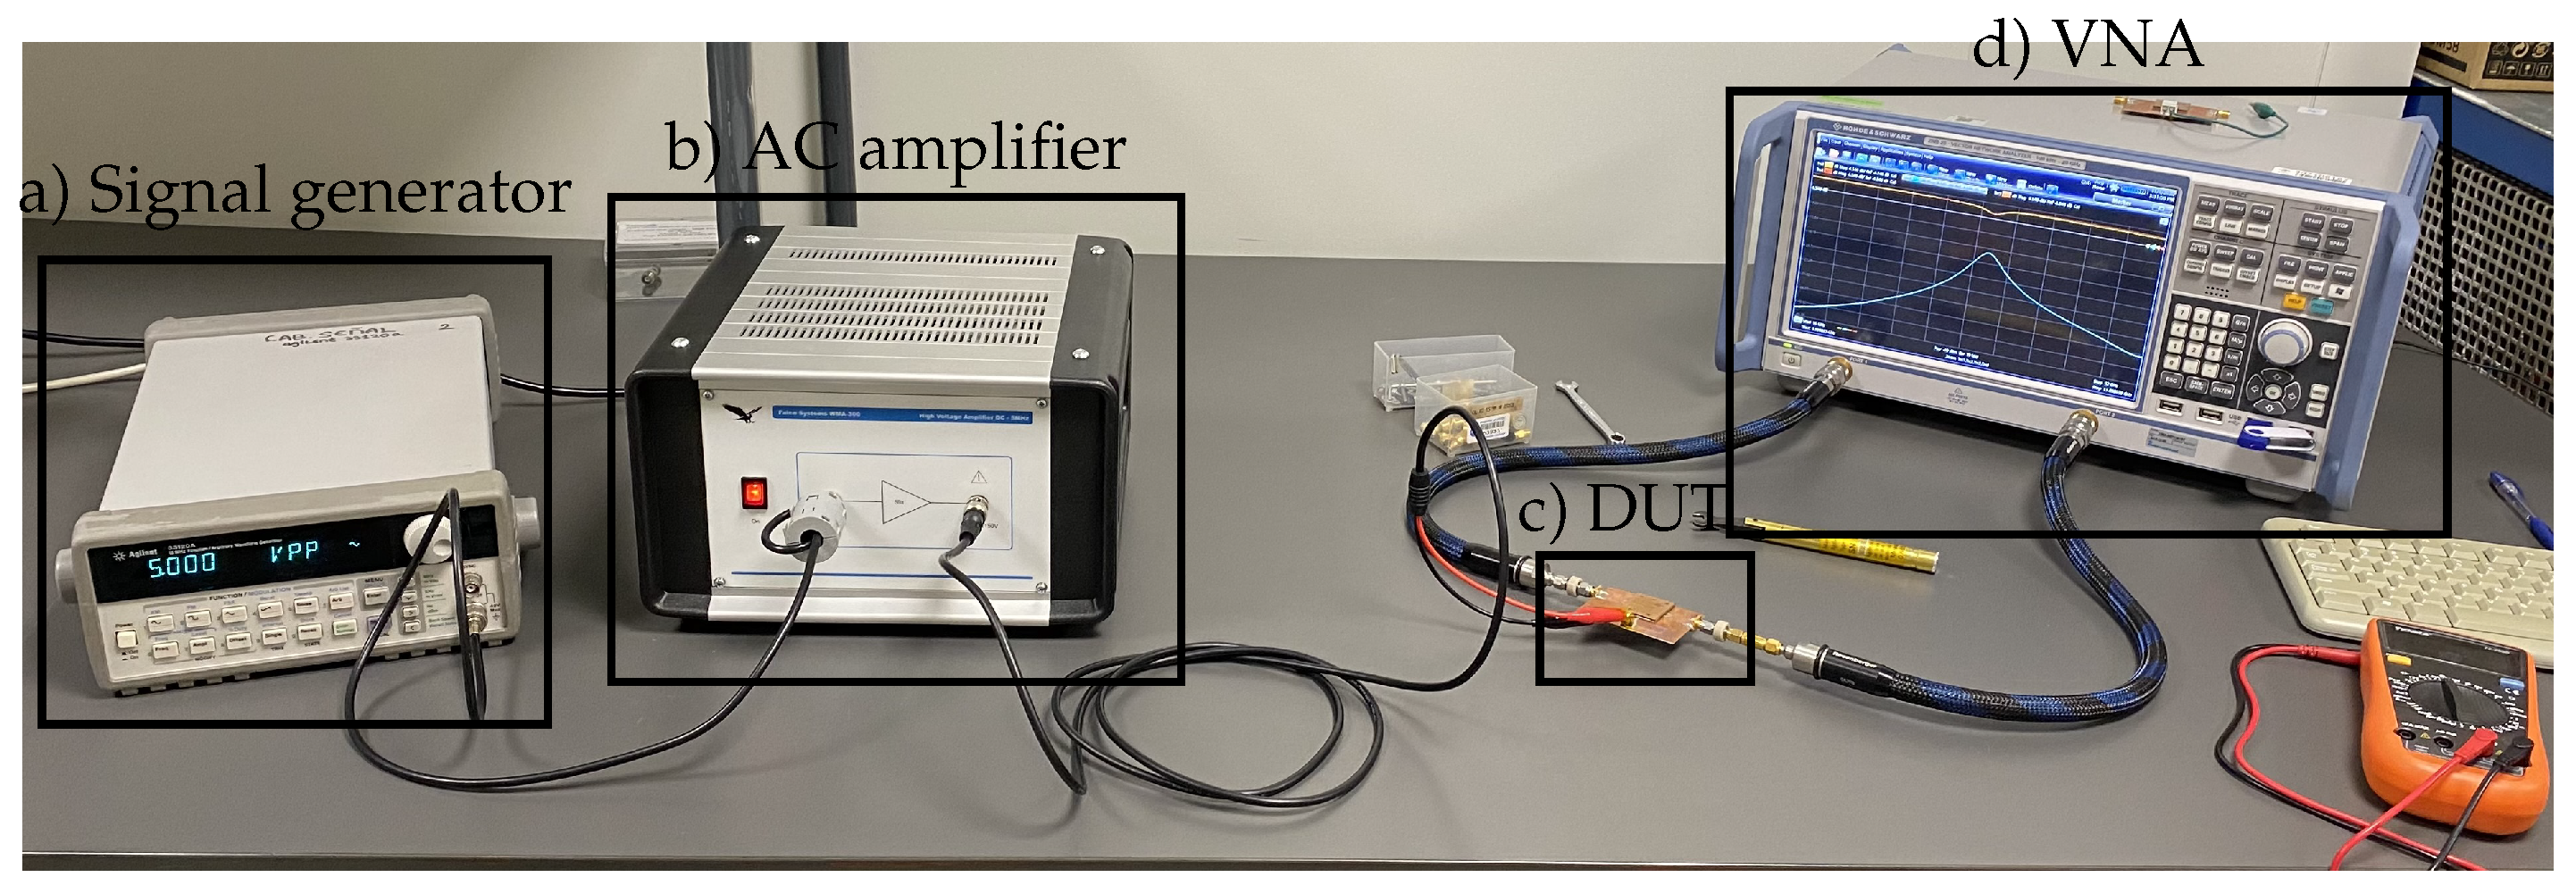
The measurement setup required a low frequency signal generator and an AC voltage amplifier for the generation of the bias signal and a sinusoidal wave of 1kHz that was varied from 0 to 125 during the measurement. The frequency response of the resonator was measured at the different bias voltages by using a Vectorial Network Analyzer (VNA) with additional DC blocks to protect the equipment. Figure 8 shows the whole measurement setup.
3. Results And Discussion
In resonant methods, the electrical properties of the material under test, , and , can be determined from the frequency response of the resonator: resonance frequency and quality factor. The electric response of the resonator used in this work has no theoretical solution due to its complex structure, which includes: parallel PTH rows, multiple electric contacts (polarization patches), and multiple dielectric materials (RO4003 substrate and LC). Therefore, the structure is simulated using the commercial software CST Studio Suite [24], and the electrical properties of the LC are computed by matching the measured response and the simulation data throughout an optimization process.
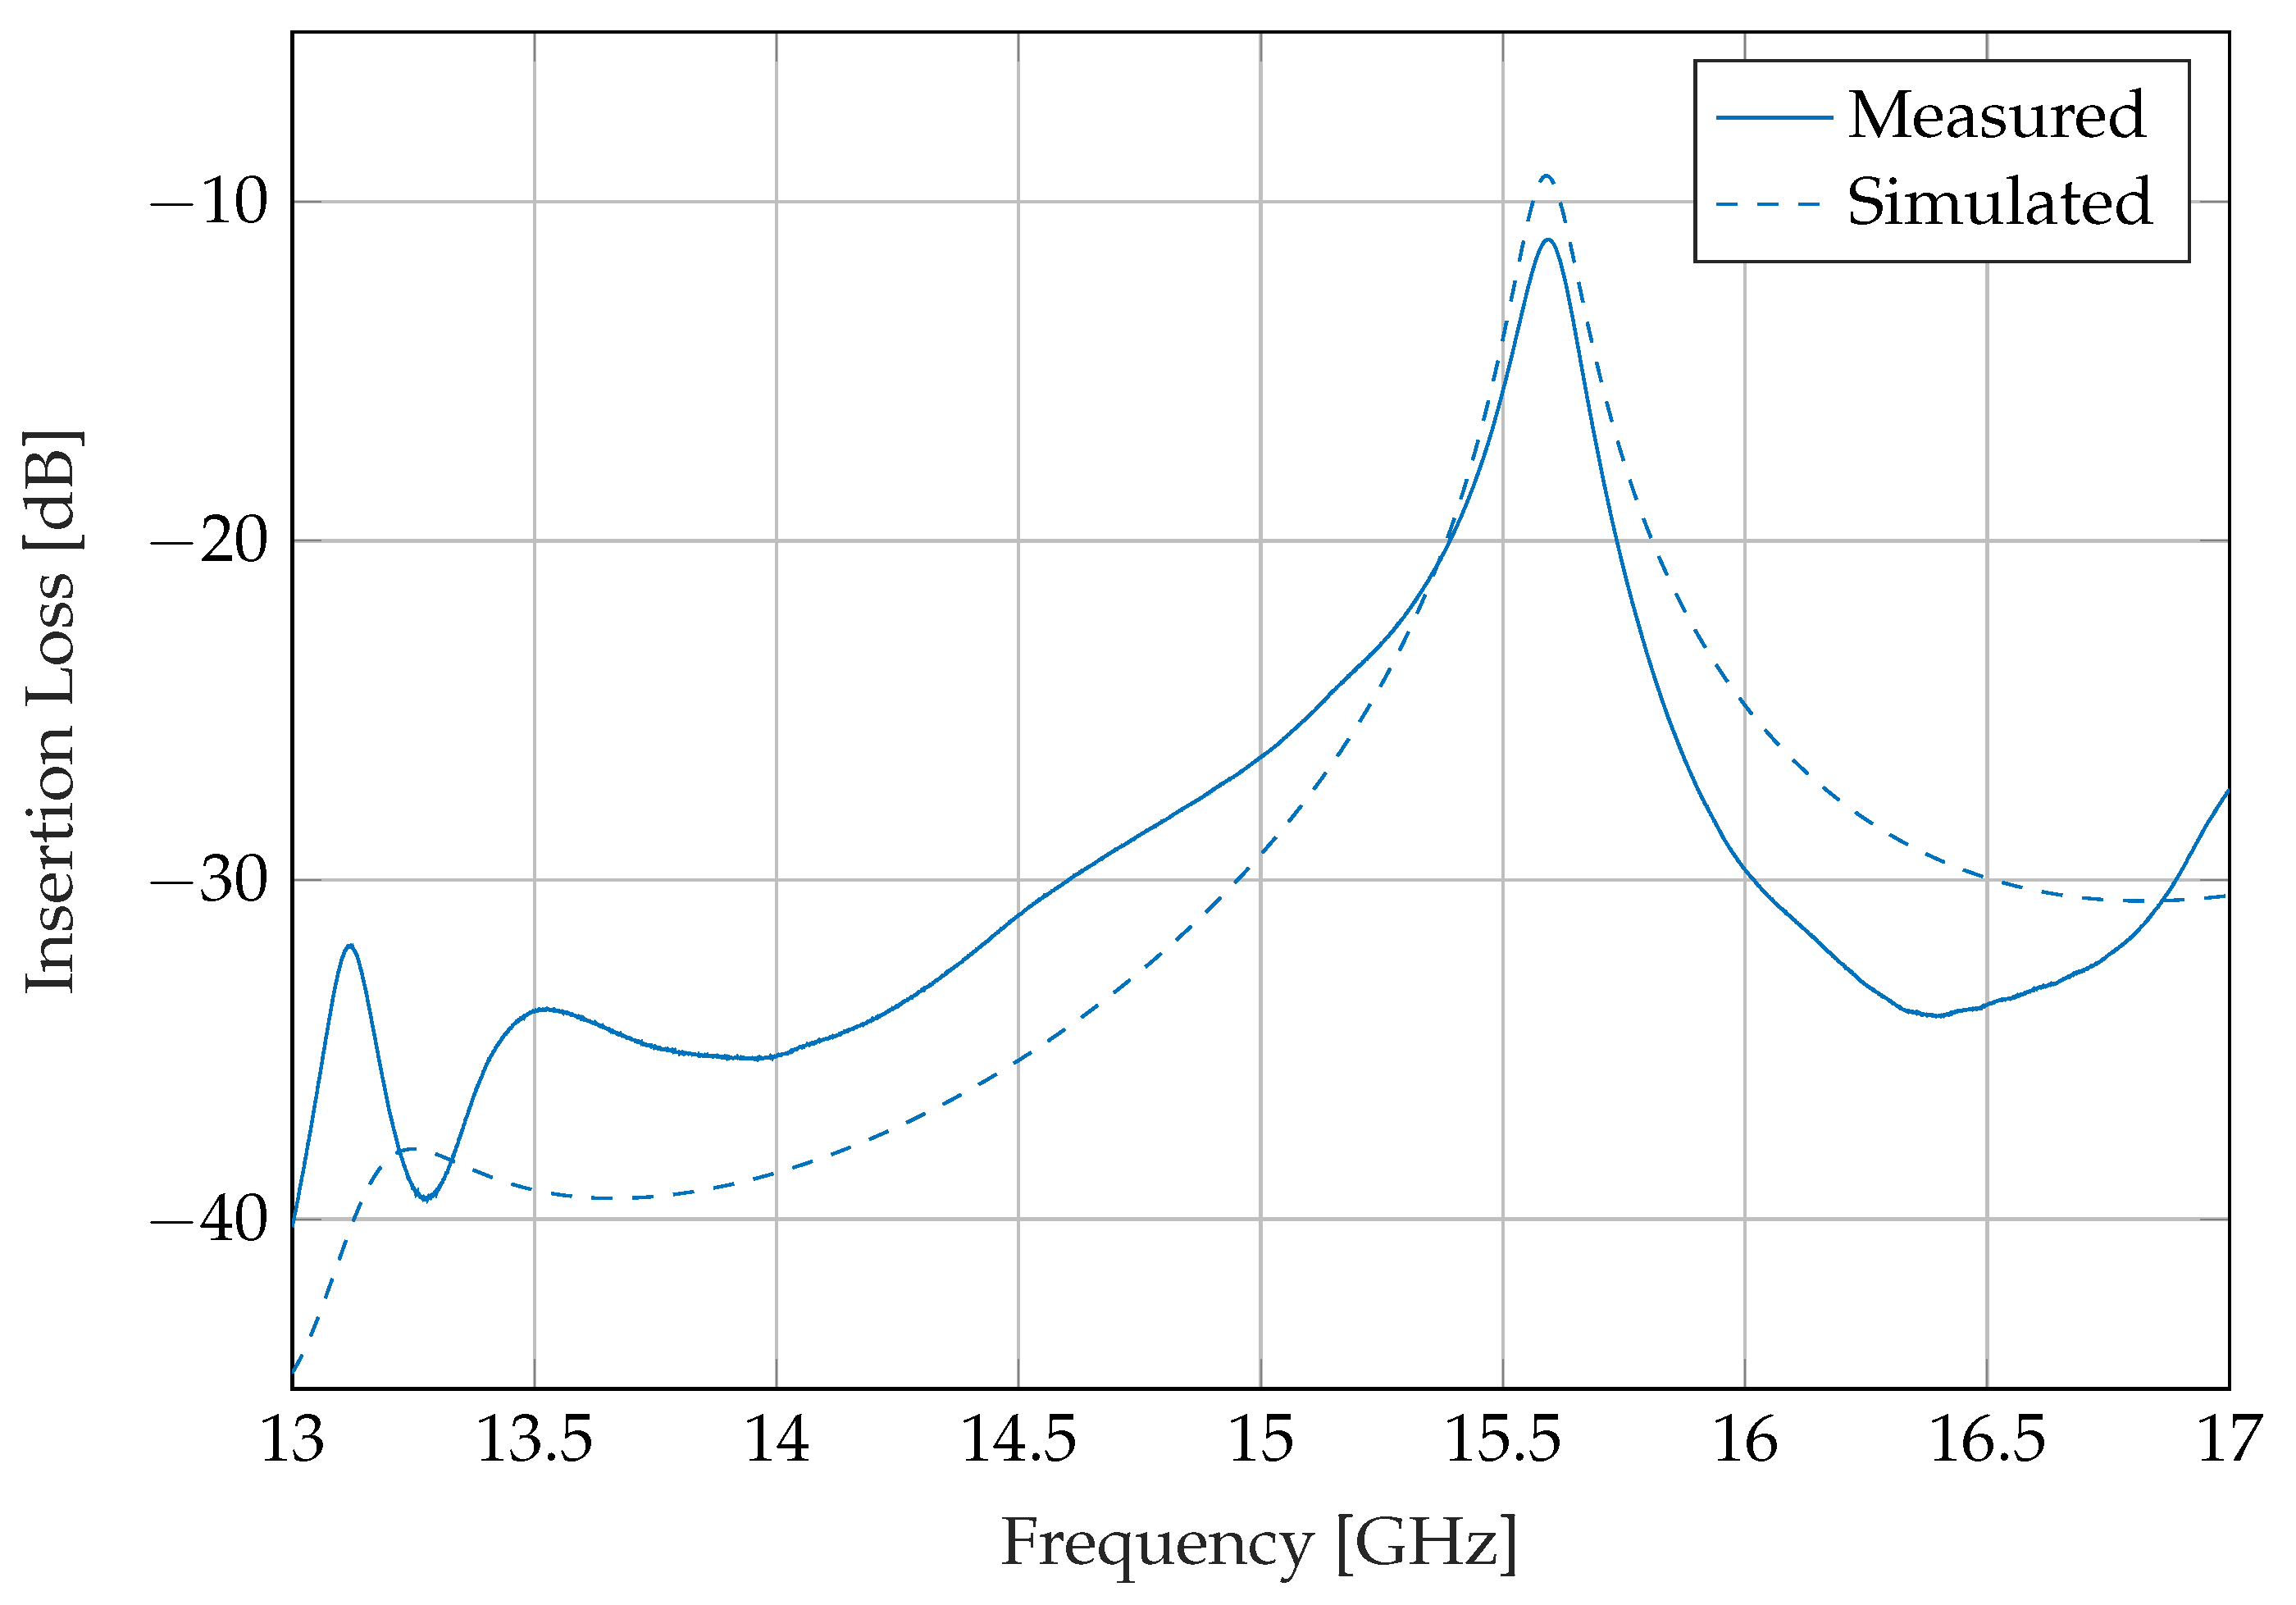
In order to improve the method accuracy, the frequency response of the empty resonator was firstly measured, and the geometry of the simulation model (length of resonant cavity and width of coupling window) is adapted to match the experimental results. Figure 9 shows the measured response and the adapted one. It can be noticed that simulation and measurement do not perfectly fit outside the resonance frequency area; this deviation is due to assembling and manufacturing tolerances in the feeding network (connectors and transitions). However, since the resonator is low coupled with this feeding network, these tolerances have a low impact on resonance frequency and quality factor.
Afterwards, the response of the adapted model is matched to the measured response of the resonator at different bias voltages, obtaining the dielectric permittivity and the loss tangent of the LC at different states of polarization. In order to match the frequency response, the simulation starts with the initial trial value of permittivity and loss tangent obtained from a simpler model: a rectangular waveguide cavity resonator, whose resonance frequency and quality factor are computed by Equations (4) and (5) respectively.
This model assumes an electrically closed structure where the electric field is equally distributed in height, i.e., a cavity resonator filled with an effective dielectric constant of . Furthermore, no conductor losses are considered, so that the quality factor is inversely proportional to . Note that these results serve as the initial value and have no impact on the final accuracy of the method. Starting from this initial value, the error between the simulated and measured resonance frequency and quality factor is minimized by using a trust region optimization algorithm. The resonator was designed to have a resonance around 11 GHz.
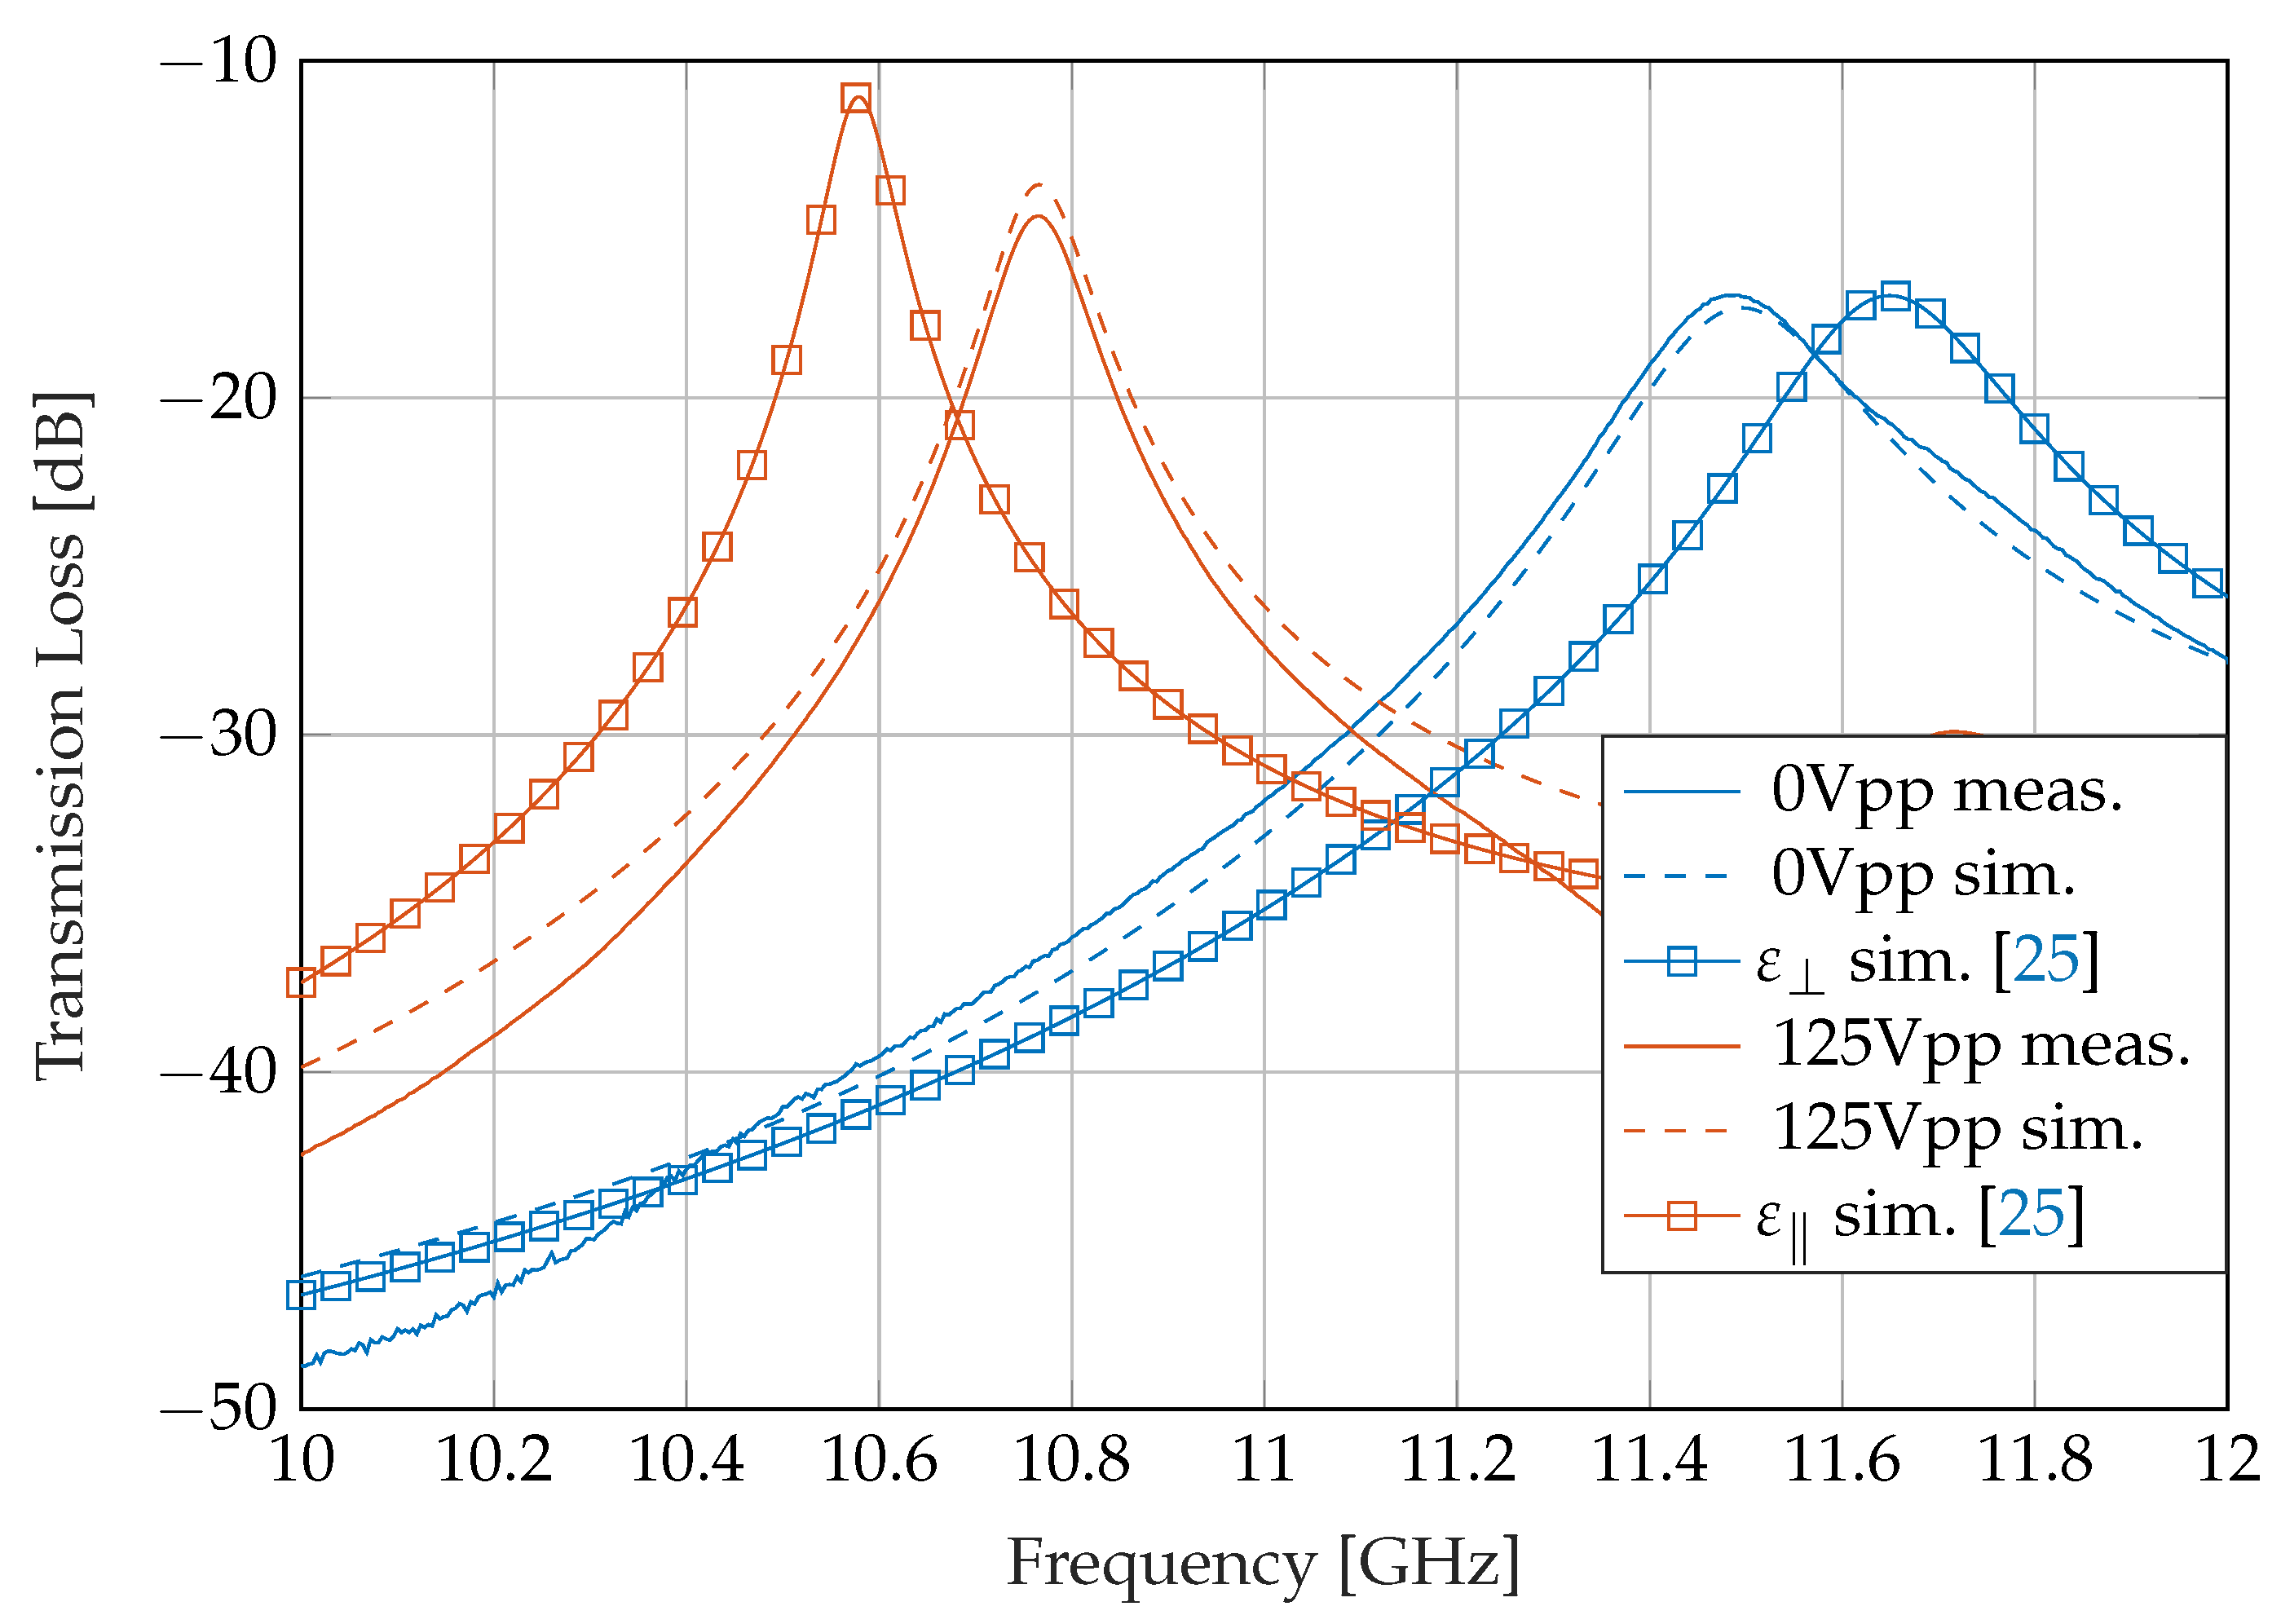
Figure 10 shows the frequency response of the resonator at steady state, with = 0 and at parallel state, with = (125 ), versus two adapted simulations. On the one hand, it shows the extracted values of complex permittivity at the two bias voltages (in dotted lines in the graph) in the materials filling the cavities. On the other hand, it shows the simulation with and (in squared lines in the graphs) known from a previous work [25] at this frequency, in which a more accurate method was employed. These results have been included for validation purposes.
In [25], permittivity and loss tangent of the same LC mixture were computed by using a split cylinder and a glass LC cell. That approach achieves higher accuracy but does not allow applying an electric voltage, so parallel and perpendicular polarization states were commuted by manually rotating the LC cell.
As can be seen in Figure 10, frequency responses of the simulated structure are very close to the measured ones, and they both are close to validation result [25] responses. There are small differences between the measured responses and the expected ones from the validation results. Concerning perpendicular polarization state , i.e., maxima around 11.6 GHz, the differences are caused by a nonperfect orientation of the liquid crystal. In this state no voltage is applied, so the LC molecules are laying following the director of the alignment layer. Since the height of the LC volume in the cavity is close to 400 m and the roughness of the copper surface was not completed corrected, it is not possible to assure that the LC molecules are completely aligned with the preferred director. On the other hand, differences related to and are based on a simplification of the director distribution. In simulations, the director of the liquid crystal was supposed ideal, i.e., totally parallel to the microwave electric field in the patch area and perpendicular in the surrounding areas. However, this is not precise, since the polarization field would experiment with a fringing effect. For future works, the real director distribution should be calculated which would increase the accuracy of the method.
With these limitations, this device presents a reconfigurability range (between the two extreme values of frequency = 11.51 GHz and = 10.76 GHz) of 6.73%. Previous tests with the same resonator without alignment layers on the cavities showed less frequency excursion. Although, when polarizing with bias voltage, the frequency response arrives to , the steady state provided a resonance frequency in between of the two extreme values. The conclusion is that in the steady state the permittivity is an average, not corresponding to , making it impossible to determine the accurate measurement of this parameter without the alignment layers.
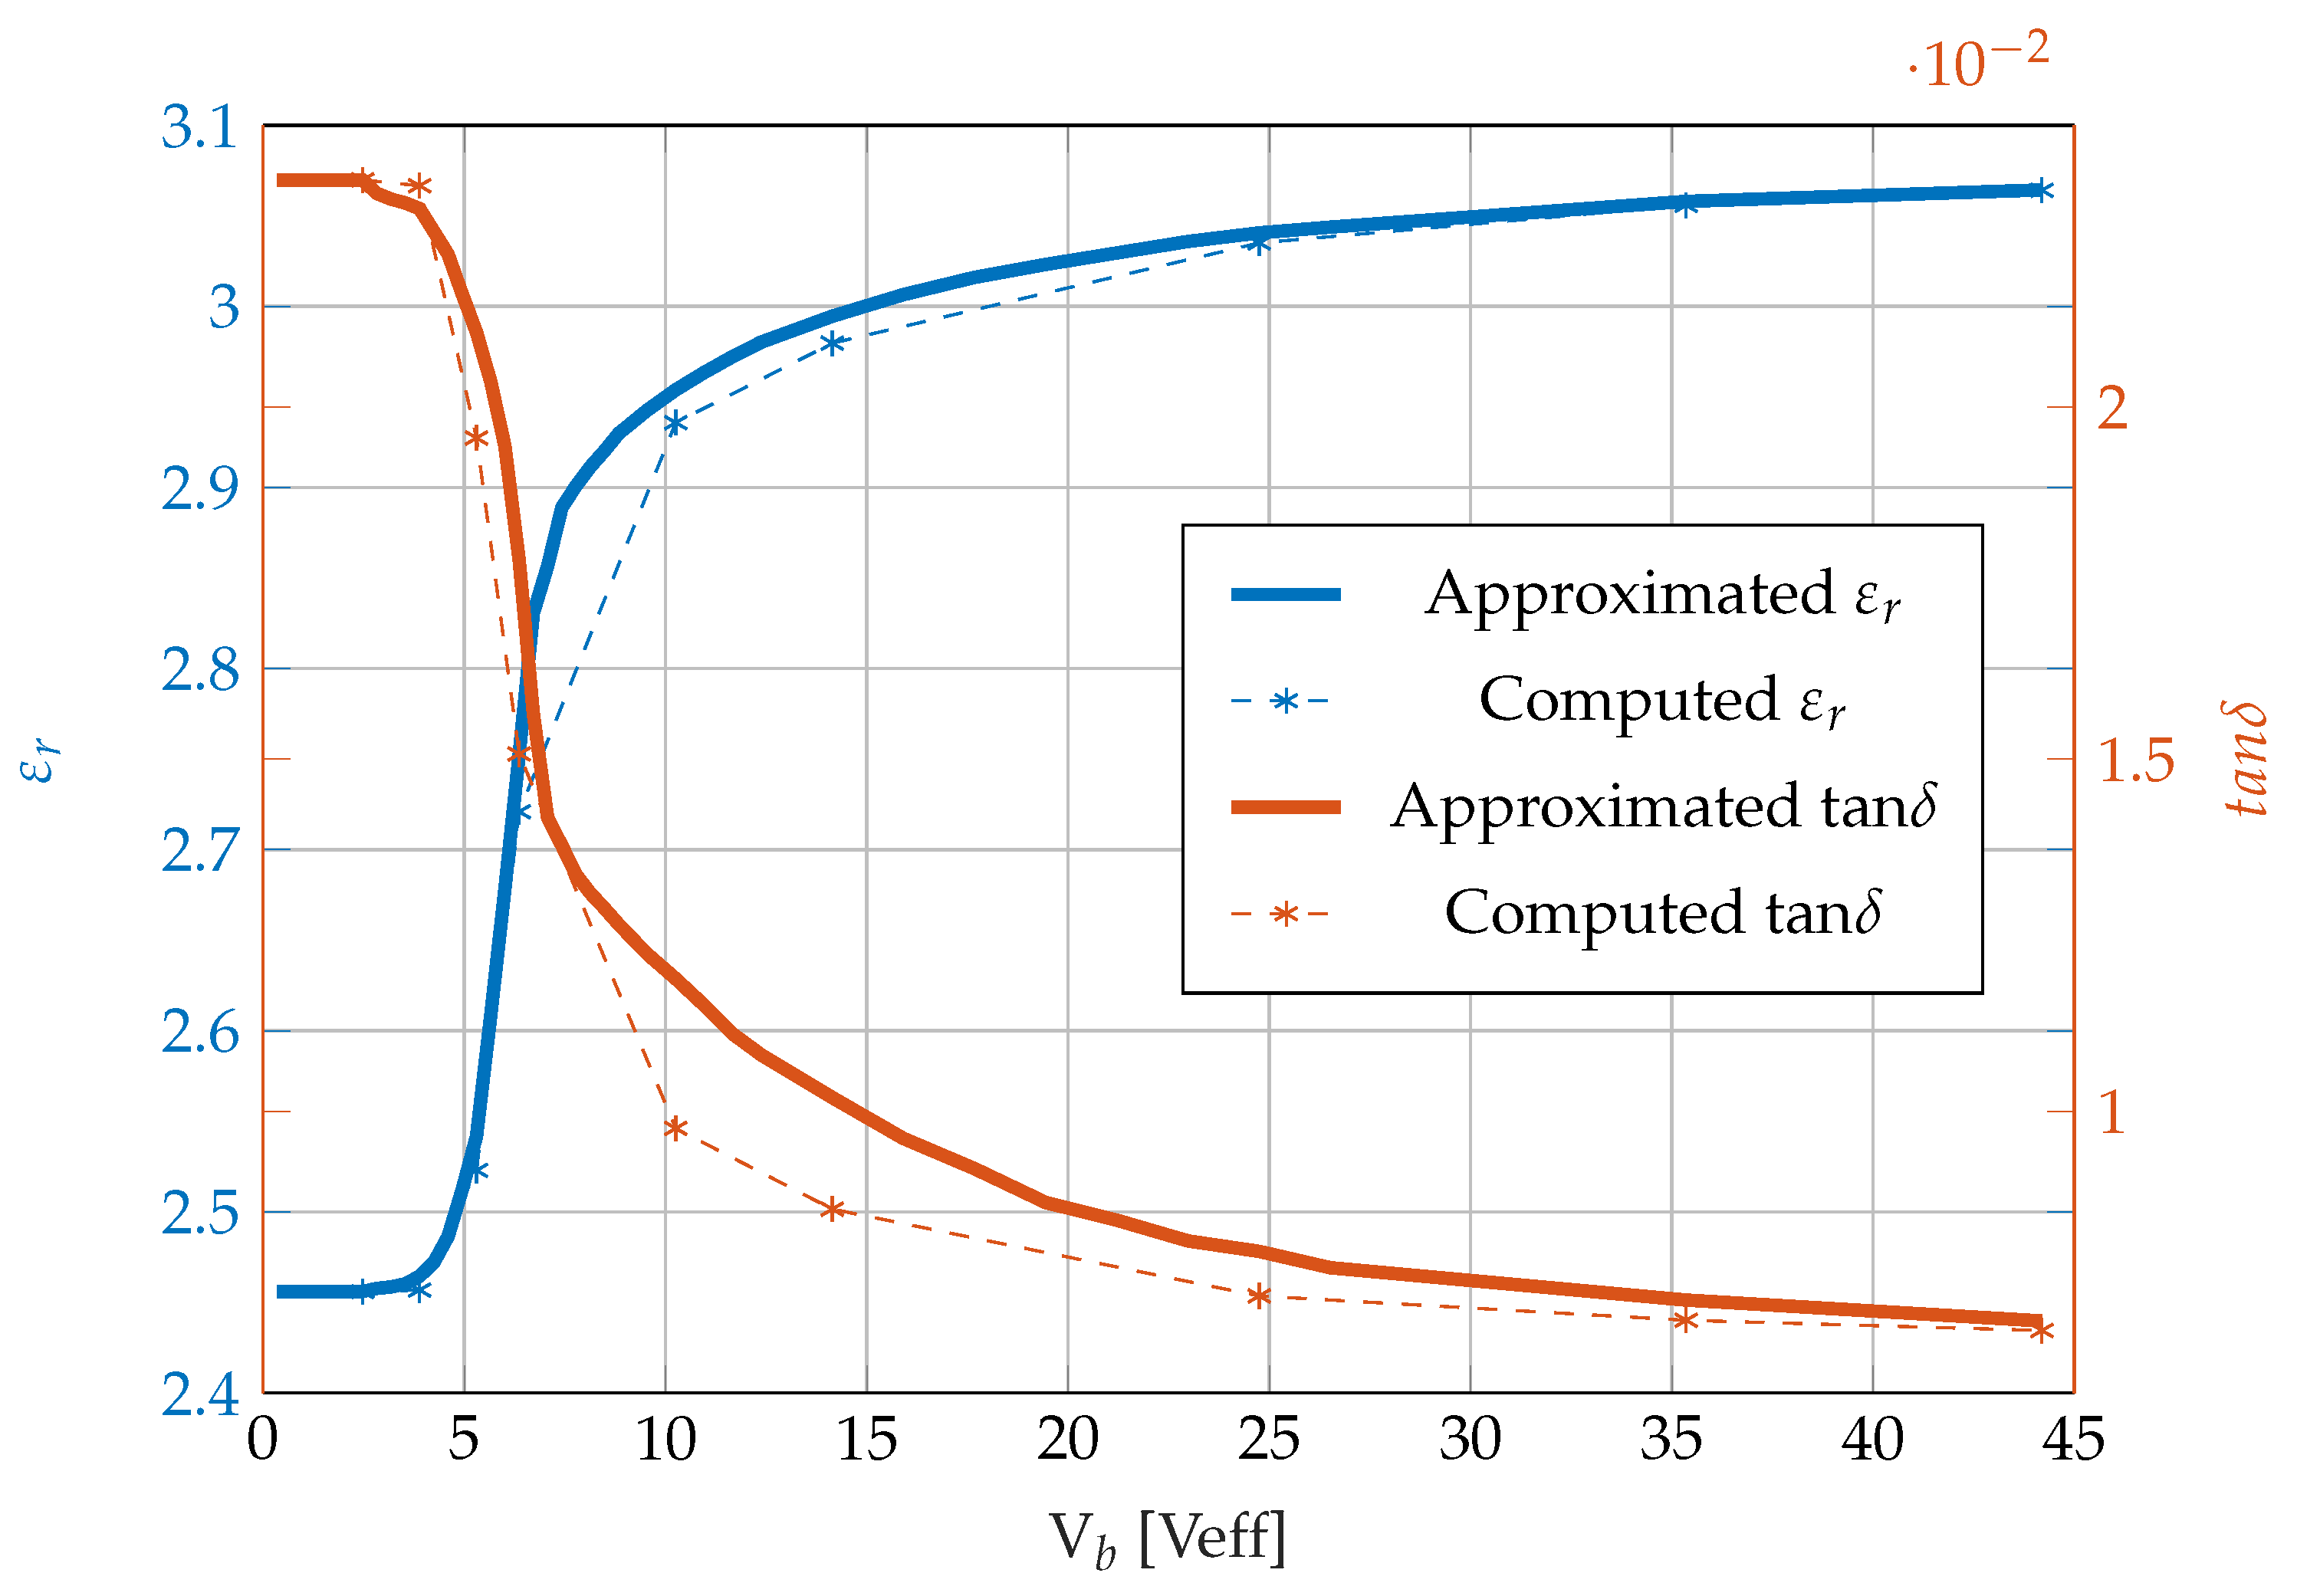
When the electrical properties of the parallel and perpendicular state of polarization of the LC is computed (, , , and ), the value of these quantities in intermediate states can be approximated by using the measured frequency and quality factor at different bias voltages. As can be seen in Equation (4), the resonance frequency, of a rectangular resonant cavity, is inversely proportional to the permittivity of the filling material, , while the quality factor, Q, is directly proportional to the loss factor, , Equation (5). Knowing these extreme points and the proportionality relationship ( with and Q with ), the curves for resonance frequency versus permittivity and quality factor versus loss tangent can be inferred. These approximated values can be used as starting points to compute the intermediate polarization states applying the same optimization process used for , , and . Inferred and extracted values of and can be seen in Figure 11.
Table 1 shows the comparison between the extracted data from measurements using Equations (1)–(3) and the data provided by the manufacturer. In the case of the column "Measured", the threshold voltage ( in since the bias voltage is a low frequency signal) and the times (relaxation and polarization ) are the parameters that were effectively measured and and the extracted ones. The manufacturer provides (V since they use a DC voltage), , and for the liquid crystal (in the column "Data sheet"). As it was explained in Section 2.1, the response times can be extracted from these parameters. It can be seen that both columns are quite similar; however, there are some differences mainly due to the height of the liquid crystal cavities. For the computation of , is used, and as explained before, this alignment layer may not be perfect, so the needed to overcome the alignment force is lower thus impacting on the value of . Moreover, Fréedericksz equation does not consider the blackflow and inertial effects in the transition, affecting .
4. Conclusions
The objective of this work is to develop a practical procedure for the extraction of the main parameters of a nematic liquid crystal: dielectric permittivity and loss tangent at microwave frequencies related to the polarization voltage, splay elastic constant , and rotational viscosity . The selected method uses a cavity resonator with two decoupled conductors and provides an accurate measurement of the RF complex permittivity in a range of bias voltages and the possibility to measure the voltage threshold and response times. Moreover, the resonator was designed on a new topology of substrate integrated transmission line, which presents less radiation loss and better quality factors than other planar resonators, such as the ones implemented on inverted microstrip lines.
An 11 GHz resonator based on this transmission line was designed and manufactured by layers, those layers conforming the cavities were coated with an alignment layer, and finally the resonator was assembled and filled with a well-known liquid crystal mixture (GT3-23002 from MERCK). The device is then fed by a RF signal and a variable bias voltage while its electric response is measured. The observed variation in resonance frequency and quality factor enables the extraction of the curves for permittivity and loss tangent versus bias voltage at the RF frequency (11 GHz). The threshold voltage and the response times allows for the computation of the splay elastic constant and the rotational viscosity of the mixture. Although there are more reliable methods to compute these properties, the present method can extract them and perform LC complex permittivity at microwave frequencies with a single device.
Author Contributions
Conceptualization, V.N. and C.B.; methodology, C.B.; software, V.N.; validation, B.V., C.B., and V.N.; formal analysis, C.B. and V.N.; investigation, V.N., C.B., and B.V.; resources, B.V. and R.K.; data curation, C.B. and V.N.; writing—original draft preparation, C.B. and V.N.; writing—review and editing, R.K. and V.E.B.; visualization, V.N.; supervision, C.B.; project administration, V.E.B.; funding acquisition, B.V. All authors have read and agreed to the published version of the manuscript.
Funding
This work was partially funded by the Generalitat Valenciana research project PROMETEO/2019/120, by Agencia Estatal de Investigación (Spain) under the Fellowship for Training PhDs BES-2017-079728, by Ministerio de Ciencia e Innovación, Spanish Government, under Project PID2019-103982RB-C41, and by Gobierno de Aragón (Ref.:E47_20R).
Conflicts of Interest
The authors declare no conflict of interest, and the funders had no role in the design of the study; in the collection, analyses, or interpretation of data; in the writing of the manuscript, or in the decision to publish the results.
Abbreviations
The following abbreviations are used in this manuscript:
| LC | Liquid Crystal |
| RF | Radio Frequency |
| MEMS | Microelectromechanical Systems |
| FET | Field-Effect Transistors |
| MW | Microwave |
| mmW | millimetre-Wave |
| PCB | Printed Board Circuits |
| DC | Direct Current |
| SIW | Substrate Integrated Waveguide |
| PTH | Plated Through Hole |
| CPWG | Coplanar Waveguide with Lower Ground Plane |
| PI | Polyimide |
| PC | Polybisphenol A Carbonate |
| AC | Alternate Current |
| VNA | Vectorial Network Analyzer |
| DUT | Device Under Test |
References
- Borkar, S.; Pande, H. Application of 5G next generation network to Internet of Things. In Proceedings of the 2016 International Conference on Internet of Things and Applications (IOTA), Pune, India, 22–24 January 2016; pp. 443–447. [Google Scholar] [CrossRef]
- Jakoby, R.; Gaebler, A.; Weickhmann, C. Microwave liquid crystal enabling technology for electronically steerable antennas in SATCOM and 5G millimeter-wave systems. Crystals 2020, 10, 514. [Google Scholar] [CrossRef]
- Yaghmaee, P.; Karabey, O.H.; Bates, B.; Fumeaux, C.; Jakoby, R. Electrically tuned microwave devices using liquid crystal technology. Int. J. Antenna Propag. 2013, 2013, 1–9. [Google Scholar] [CrossRef] [Green Version]
- Zografopoulos, D.C.; Ferraro, A.; Beccherelli, R. Liquid crystal high frequency microwave technology: Materials and characterization. Adv. Mater. Technol. 2019, 4, 1800447. [Google Scholar] [CrossRef]
- Reese, R.; Polat, E.; Tesmer, H.; Strobl, J.; Schuster, C.; Nickel, M.; Granja, A.B.; Jakoby, R.; Maune, H. Liquid crystal based dielectric waveguide phase shifters for phased arrays at W-band. IEEE Access 2019, 7, 127032–127041. [Google Scholar] [CrossRef]
- Li, J.F.; Xu, H.; Chu, D.P. Design of liquid crystal based coplanar waveguide tunable phase shifter with no floating electrodes for 60–90 GHz applications. In Proceedings of the 2016 46th European Microwave Conference (EuMC), London, UK, 3–7 October 2016; pp. 1047–1050. [Google Scholar] [CrossRef]
- Cai, L.; Xu, H.; Li, J.; Chu, D. High FoM liquid crystal based microstrip phase shifter for phased array antennas. In Proceedings of the 2016 International Symposium on Antennas and Propagation (ISAP), Okinawa, Japan, 24–28 October 2016; pp. 402–403. [Google Scholar]
- Nestoros, M.; Papanicolaou, N.C.; Polycarpou, A.C. Design of beam-steerable array for 5G applications using tunable liquid crystal phase shifters. In Proceedings of the 2019 13th European Conference on Antennas and Propagation (EuCAP), Krakow, Poland, 31 March–5 April 2019; pp. 1–4. [Google Scholar]
- Polat, E.; Reese, R.; Jost, M.; Nickel, M.; Schuster, C.; Jakoby, R.; Maune, H. Liquid crystal phase shifter based on non-radiative dielectric waveguide topology at W-band. In Proceedings of the 2019 IEEE MTT-S International Microwave Symposium (IMS), Boston, MA, USA, 2–7 June 2019; pp. 184–187. [Google Scholar] [CrossRef]
- Li, J. Bias tees integrated liquid crystals inverted microstrip phase shifter for phased array feeds. In Proceedings of the 2020 21st International Conference on Electronic Packaging Technology (ICEPT), Guangzhou, China, 12–15 August 2020; pp. 1–5. [Google Scholar] [CrossRef]
- Bairavasubramanian, R.; Papapolymerou, J. Fully canonical pseudo-elliptic bandpass filters on multilayer liquid crystal polymer technology. IEEE Microw. Wirel. Compon. Lett. 2007, 17, 190–192. [Google Scholar] [CrossRef]
- Polat, E.; Reese, R.; Jost, M.; Schuster, C.; Nickel, M.; Jakoby, R.; Maune, H. Tunable liquid crystal filter in nonradiative dielectric waveguide technology at 60 GHz. IEEE Microw. Wirel. Compon. Lett. 2019, 29, 44–46. [Google Scholar] [CrossRef]
- Liu, Y.; Jiang, D.; Li, X.; Wang, Z.; Ran, P.; Fu, Z. Microwave CSIW filter based on the high anisotropy electro-optic nematic liquid crystal. In Proceedings of the 2019 International Conference on Microwave and Millimeter Wave Technology (ICMMT), Shenzhen, China, 5–8 May 2019; pp. 1–3. [Google Scholar] [CrossRef]
- Jiang, D.; Liu, Y.; Li, X.; Wang, G.; Zheng, Z. Tunable microwave bandpass filters with complementary split ring resonator and liquid crystal materials. IEEE Access 2019, 7, 126265–126272. [Google Scholar] [CrossRef]
- Prasetiadi, A.E.; Karabey, O.H.; Weickhmann, C.; Franke, T.; Hu, W.; Jost, M.; Nickel, M.; Jakoby, R. Continuously tunable substrate integrated waveguide bandpass filter in liquid crystal technology with magnetic biasing. Electron. Lett. 2015, 51, 1584–1585. [Google Scholar] [CrossRef]
- Kaesser, T.; Fritzsch, C.; Franz, M. Tunable RF filters based on liquid crystal for space applications. Crystals 2020, 10, 455. [Google Scholar] [CrossRef]
- Mueller, S.; Penirschke, A.; Damm, C.; Scheele, P.; Wittek, M.; Weil, C.; Jakoby, R. Broad-band microwave characterization of liquid crystals using a temperature-controlled coaxial transmission line. IEEE Trans. Microw. Theory Tech. 2005, 53, 1937–1945. [Google Scholar] [CrossRef]
- Deo, P.; Mirshekar-Syahkal, D.; Seddon, L.; Day, S.E.; Fernández, F.A. Microstrip device for broadband (15–65 GHz) measurement of dielectric properties of nematic liquid crystals. IEEE Trans. Microw. Theory Tech. 2015, 63, 1388–1398. [Google Scholar] [CrossRef] [Green Version]
- Chen, L.; Ong, C.; Neo, C.P.; Varadan, V.V.; Varadan, V. Chapter 5—Resonator Methods. In Microwave Electronics: Measurement and Materials Characterization; John Wiley & Sons, Incorporated: Hoboken, NJ, USA, 2004. [Google Scholar]
- Yang, D.K.; Wu, S.T. Fundamentals of Liquid Crystal Devices; Wiley: London, UK, 2014. [Google Scholar] [CrossRef]
- Nie, X.; Xianyu, H.; Lu, R.; Wu, T.X.; Wu, S. Pretilt angle effects on liquid crystal response time. J. Display Technol. 2007, 3, 280–283. [Google Scholar] [CrossRef]
- Yan, L.; Hong, W.; Wu, K.; Cui, T.J. Investigations on the propagation characteristics of the substrate integrated waveguide based on the method of lines. IEEE Proc. Microw. Antenna. Propag. 2005, 152, 35–42. [Google Scholar] [CrossRef]
- Yazdanpanahi, M.; Bulja, S.; Mirshekar-Syahkal, D.; James, R.; Day, S.E.; Fernandez, F.A. Measurement of dielectric constants of nematic liquid crystals at mm-wave frequencies using patch resonator. IEEE Trans. Instrum. Meas. 2010, 59, 3079–3085. [Google Scholar] [CrossRef]
- 3D Design & Engineering Software - Dassault Systèmes ®. Available online: https://www.3ds.com/products-services/simulia/products/cst-studio-suite/ (accessed on 19 October 2020).
- Sánchez, J.R.; Nova, V.; Bachiller, C.; Villacampa, B.; de la Rua, A.; Kronberger, R.; Peñaranda-Foix, F.; Boria, V.E. Characterization of nematic liquid crystal at microwave frequencies using split-cylinder resonator method. IEEE Trans. Microw. Theory Techniq. 2019, 67, 2812–2820. [Google Scholar] [CrossRef]
Figure 1.
Polarization of a nematic liquid crystal cell: (a) , (b) , (c) .

Figure 2.
Cross section of the line (the propagation direction is normal to the image). Yellow is copper, green is substrate, gray is plated through holed, and blue is liquid crystal.
Figure 2.
Cross section of the line (the propagation direction is normal to the image). Yellow is copper, green is substrate, gray is plated through holed, and blue is liquid crystal.

Figure 3.
Layouts of the resonator layers: (a) top view of layer 1, (b) top view of layer 2, (c) top view of layer 3, (d) explosion view of the device, (e) bottom view of layer 4, and (f) top view of layer 5. Yellow is copper, blue is clearance, grey is plated through hole vias, white is empty zone, and black lines are plated walls.

Figure 4.
Roughness profiles before (blue) and after (orange) PC application.

Figure 5.
Layers 1, 3 and 5, once PI+PC have been applied and the Kapton mask removed.

Figure 6.
Preoriented liquid crystal cell with double deposition of PI+PC observed between crossed polarizers. (a) Orientation parallel to one of the polarizers. (b) Orientation 45 to the polarizers.
Figure 6.
Preoriented liquid crystal cell with double deposition of PI+PC observed between crossed polarizers. (a) Orientation parallel to one of the polarizers. (b) Orientation 45 to the polarizers.

Figure 7.
Filling process of one of the cavities of the resonator.

Figure 8.
Measurement setup: (a) Signal generator, (b) AC voltage amplifier, (c) Device Under Test (DUT) and (d) Vectorial Network Analyzer (VNA).
Figure 8.
Measurement setup: (a) Signal generator, (b) AC voltage amplifier, (c) Device Under Test (DUT) and (d) Vectorial Network Analyzer (VNA).

Figure 9.
Frequency response of the empty resonator.

Figure 10.
Frequency response of the resonator at steady state and at bias voltage versus the simulation with and materials filling the cavities.
Figure 10.
Frequency response of the resonator at steady state and at bias voltage versus the simulation with and materials filling the cavities.

Figure 11.
Permittivity and loss tangent of the liquid crystal at different bias voltages.


Table 1.
Threshold voltage and response times with their related parameters.
| Parameter | Measured | Data sheet |
|---|---|---|
| 2.48 | 2.99 V | |
| 2.20 s | 1.19 s | |
| 426.68 s | 258.50 s | |
| - | 2.6 | |
| 14.35 pN | 20.90 pN | |
| 393.1 mPa·s | 347.0 mPa·s |
Publisher’s Note: MDPI stays neutral with regard to jurisdictional claims in published maps and institutional affiliations. |
© 2020 by the authors. Licensee MDPI, Basel, Switzerland. This article is an open access article distributed under the terms and conditions of the Creative Commons Attribution (CC BY) license (http://creativecommons.org/licenses/by/4.0/).
Share and Cite
MDPI and ACS Style
Nova, V.; Bachiller, C.; Villacampa, B.; Kronberger, R.; Boria, V.E. Characterization of Nematic Liquid Crystals at Microwave Frequencies. Crystals 2020, 10, 1106. https://doi.org/10.3390/cryst10121106
AMA Style
Nova V, Bachiller C, Villacampa B, Kronberger R, Boria VE. Characterization of Nematic Liquid Crystals at Microwave Frequencies. Crystals. 2020; 10(12):1106. https://doi.org/10.3390/cryst10121106
Chicago/Turabian StyleNova, Vicente, Carmen Bachiller, Belén Villacampa, Rainer Kronberger, and Vicente E. Boria. 2020. "Characterization of Nematic Liquid Crystals at Microwave Frequencies" Crystals 10, no. 12: 1106. https://doi.org/10.3390/cryst10121106
Note that from the first issue of 2016, this journal uses article numbers instead of page numbers. See further details here.