
Bio-Synthesized Tin Oxide Nanoparticles: Structural, Optical, and Biological Studies

 ,
,  ,
,  , , and
Abstract
:1. Introduction
2. Materials and Methods
2.1. Preparation of SnO2 Nanoparticles
2.2. Characterization
2.3. Antimicrobial Activity
2.4. Antioxidant Activity
3. Results and Discussion
3.1. XRD Analysis
3.2. SEM Analysis
3.3. FTIR Analysis
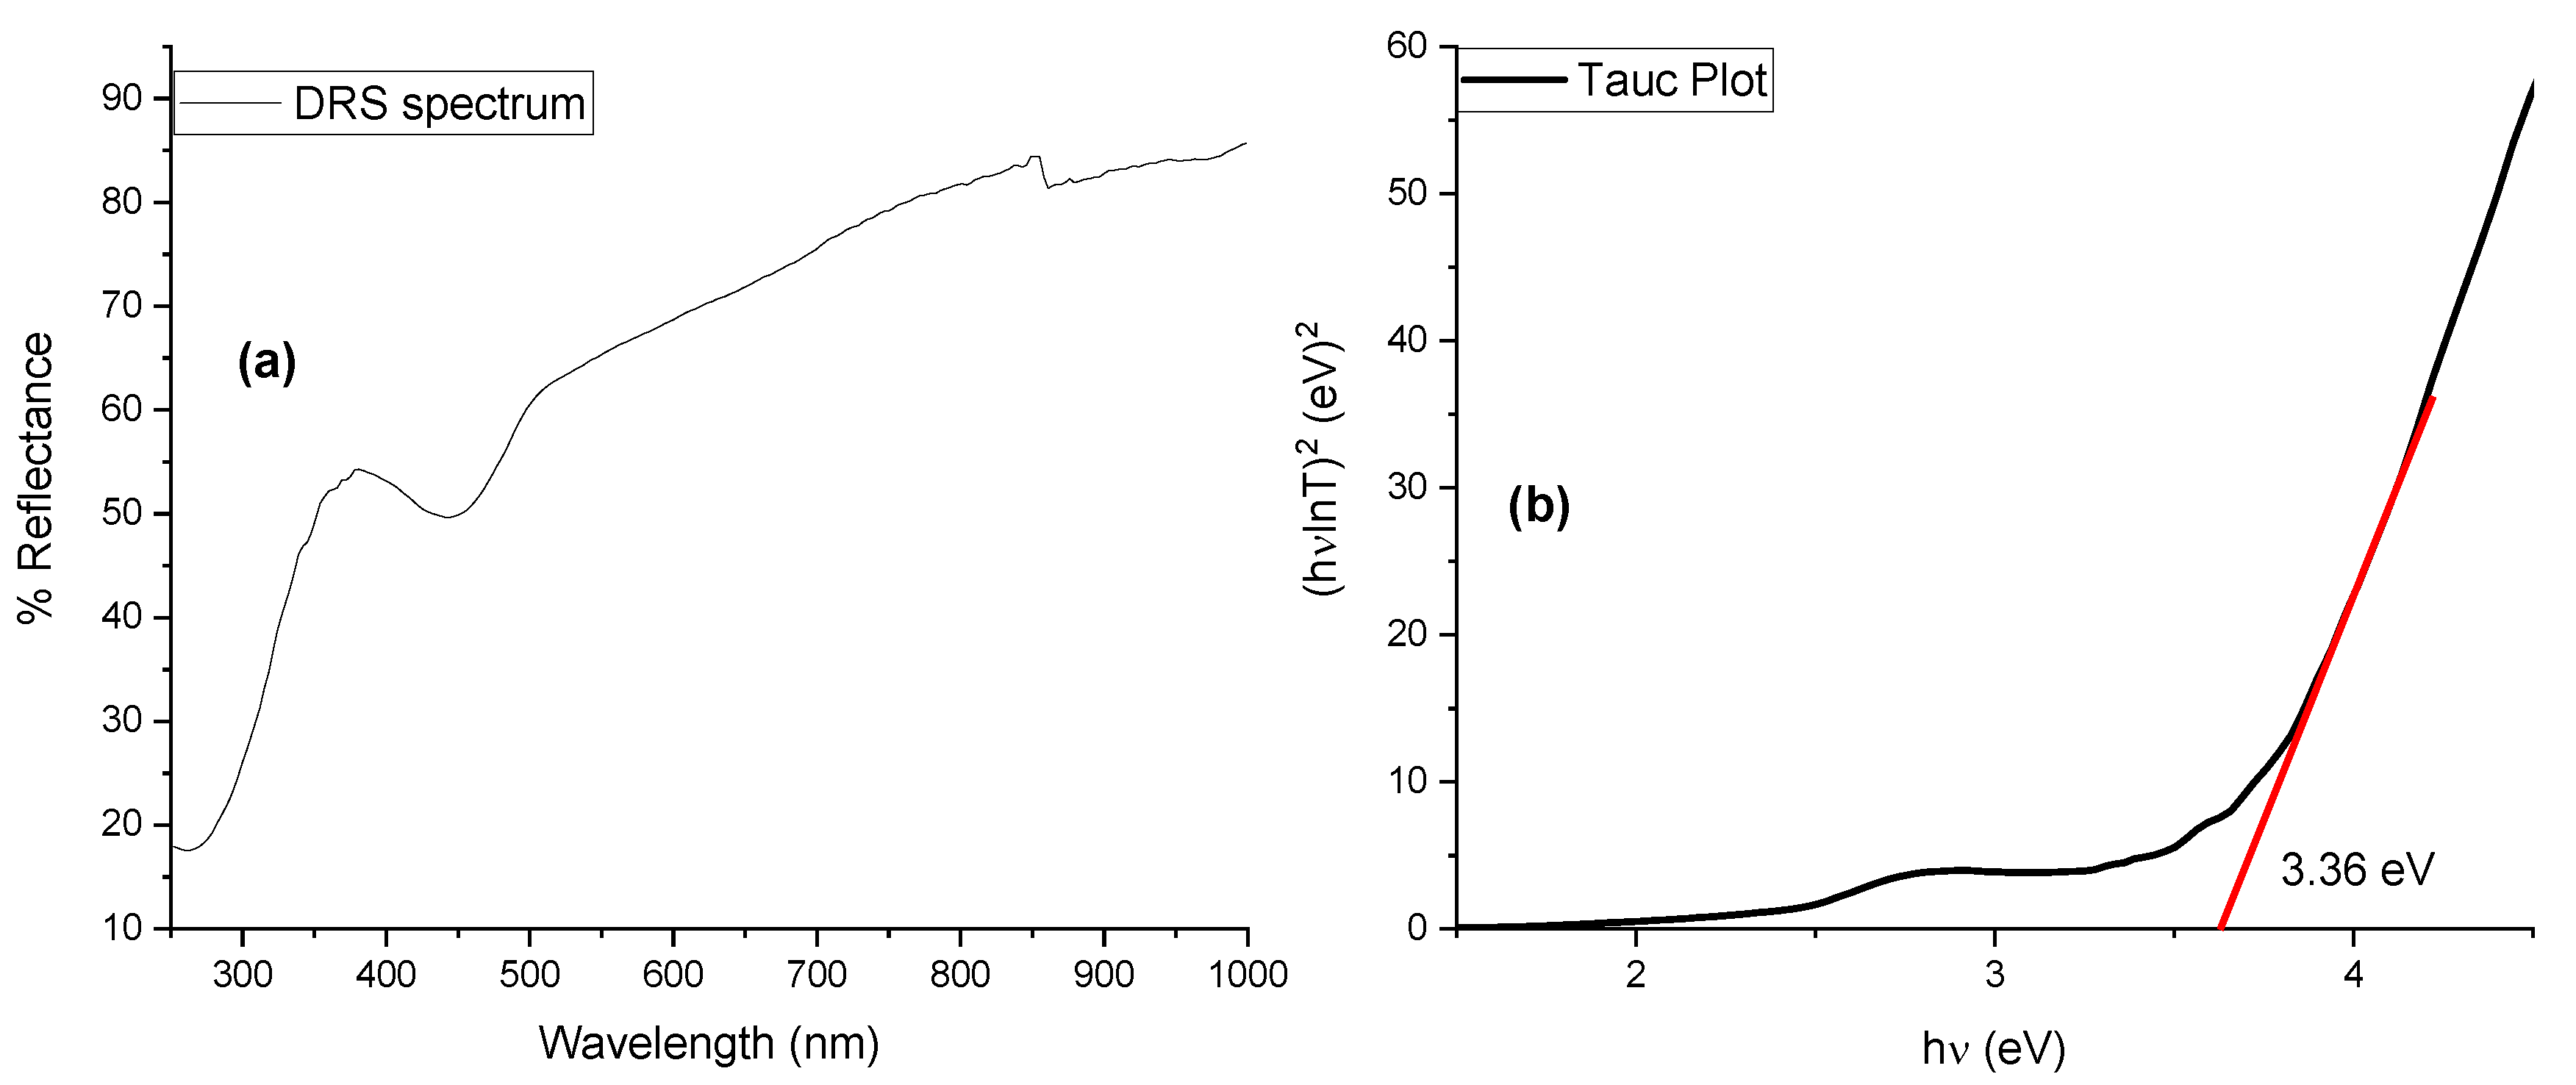
3.4. DRS Analysis
3.5. EDX Analysis
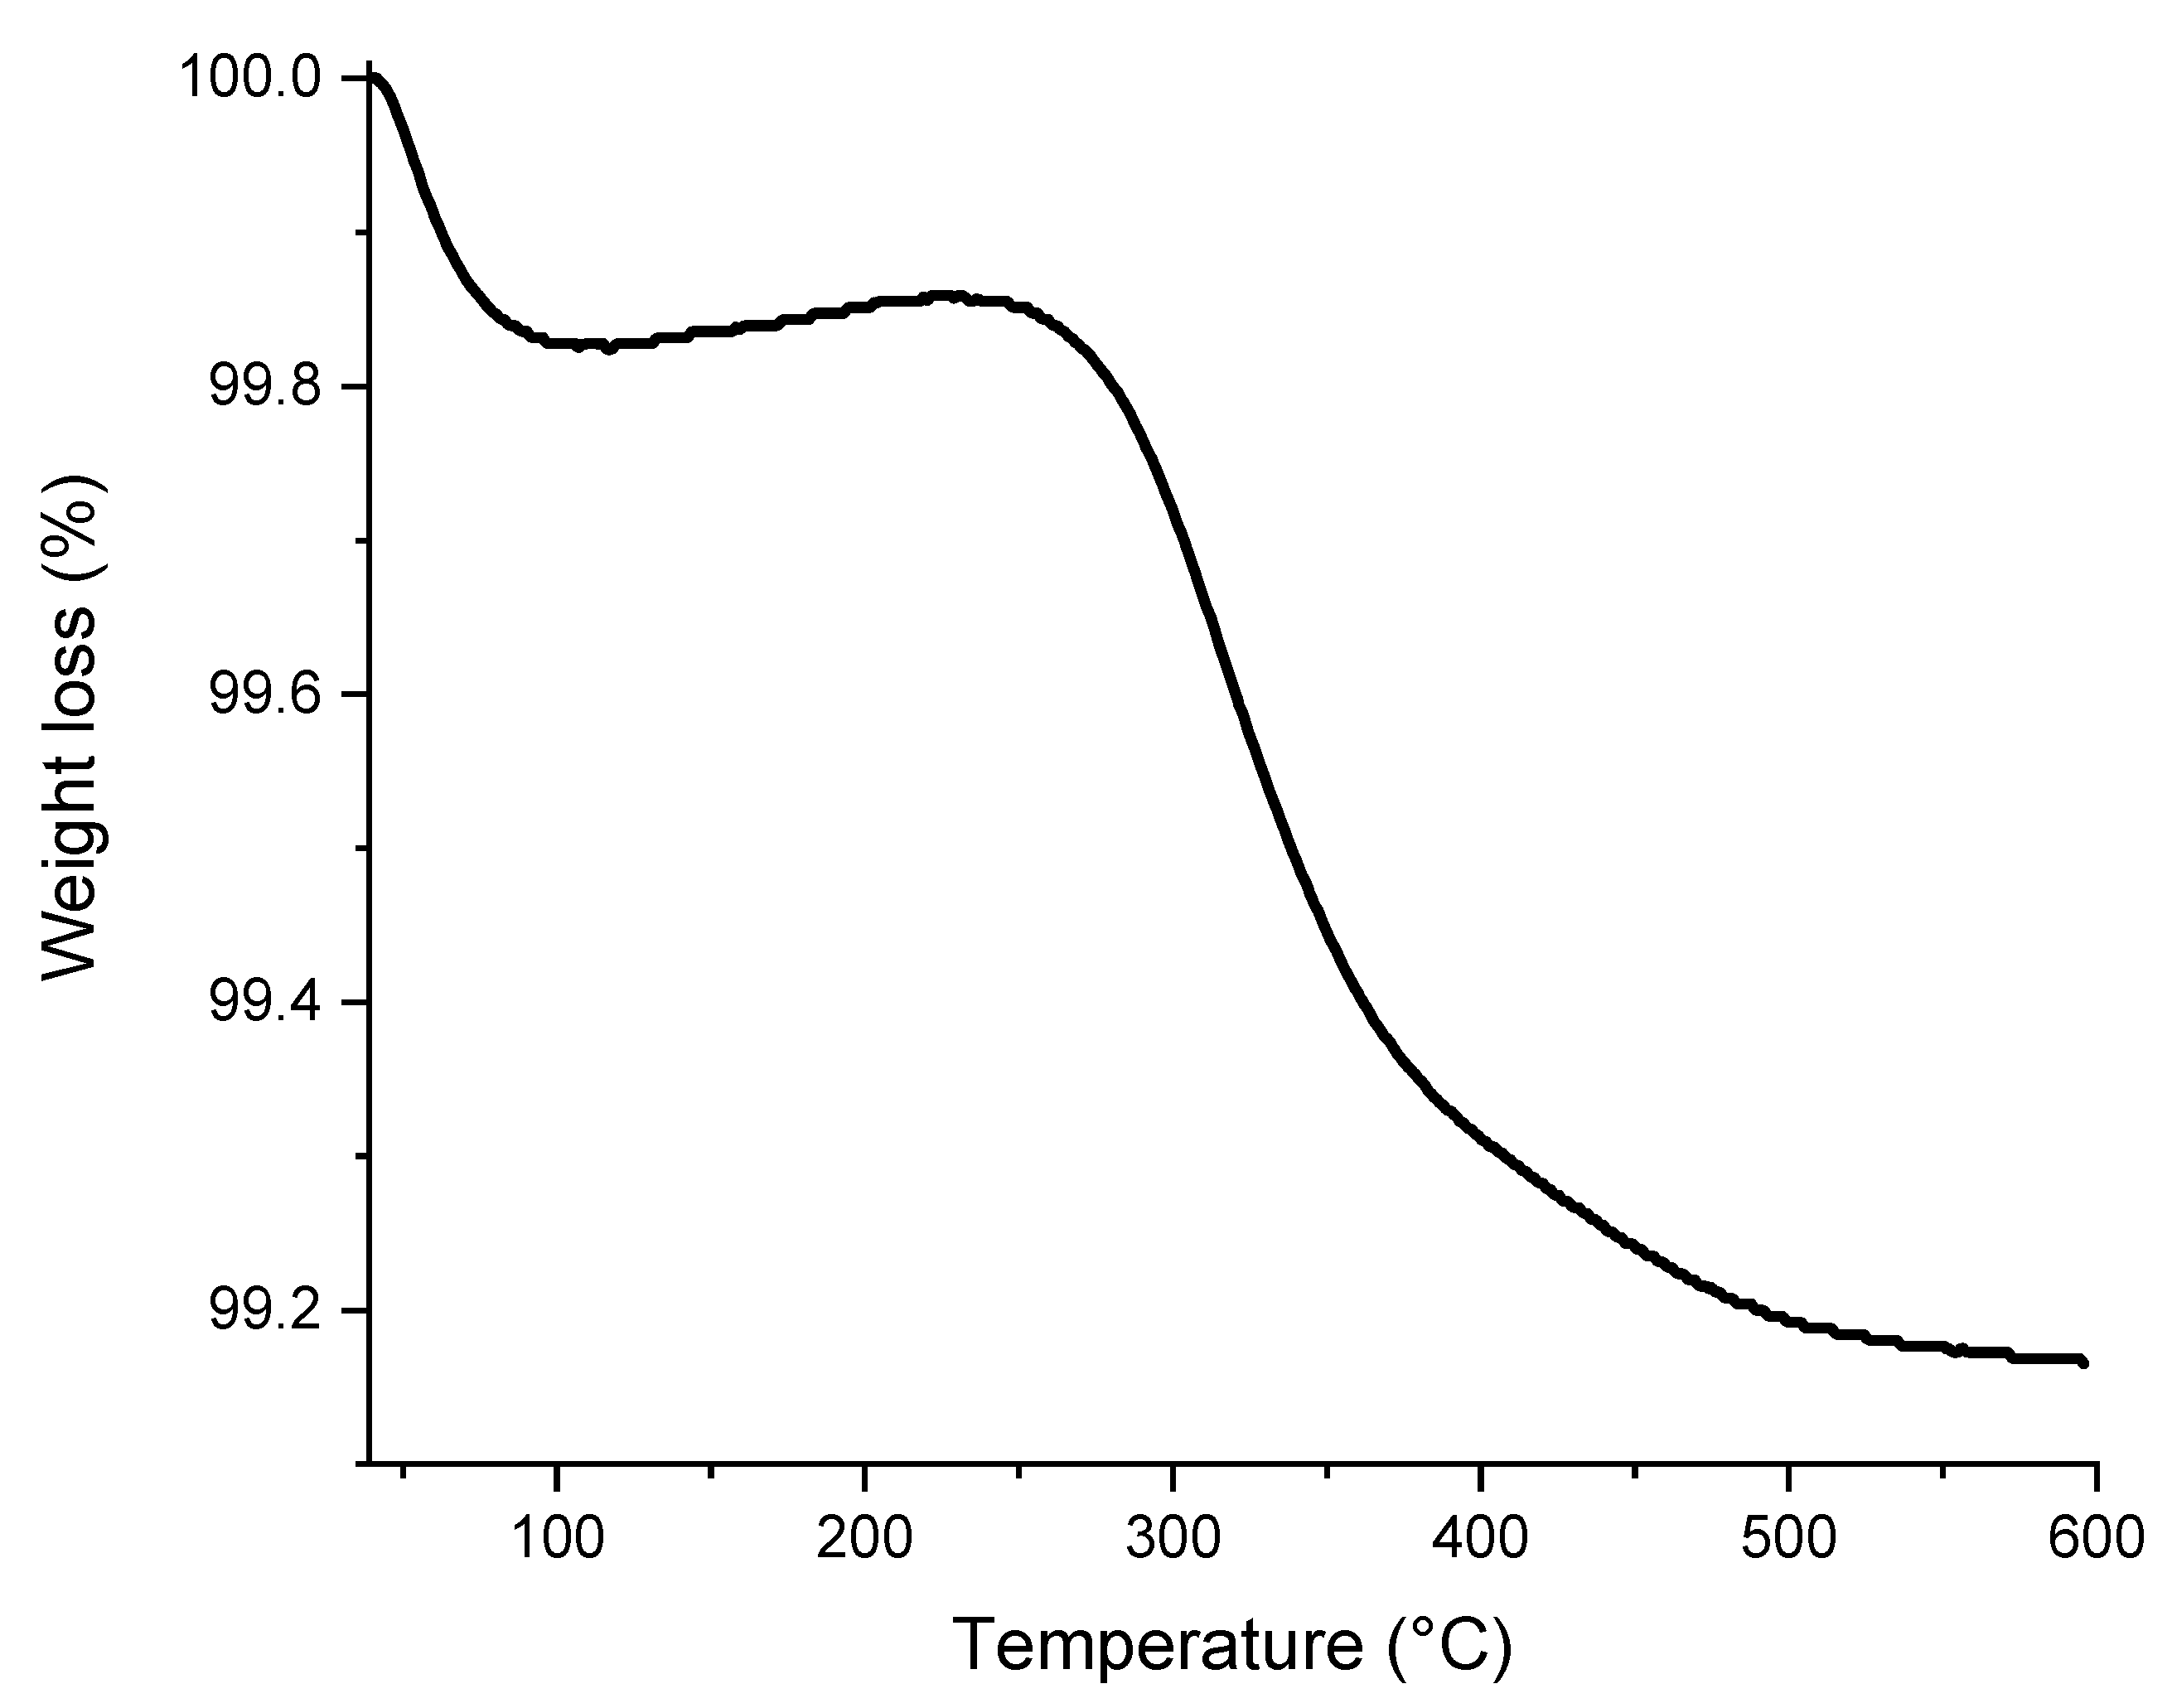
3.6. TGA Analysis
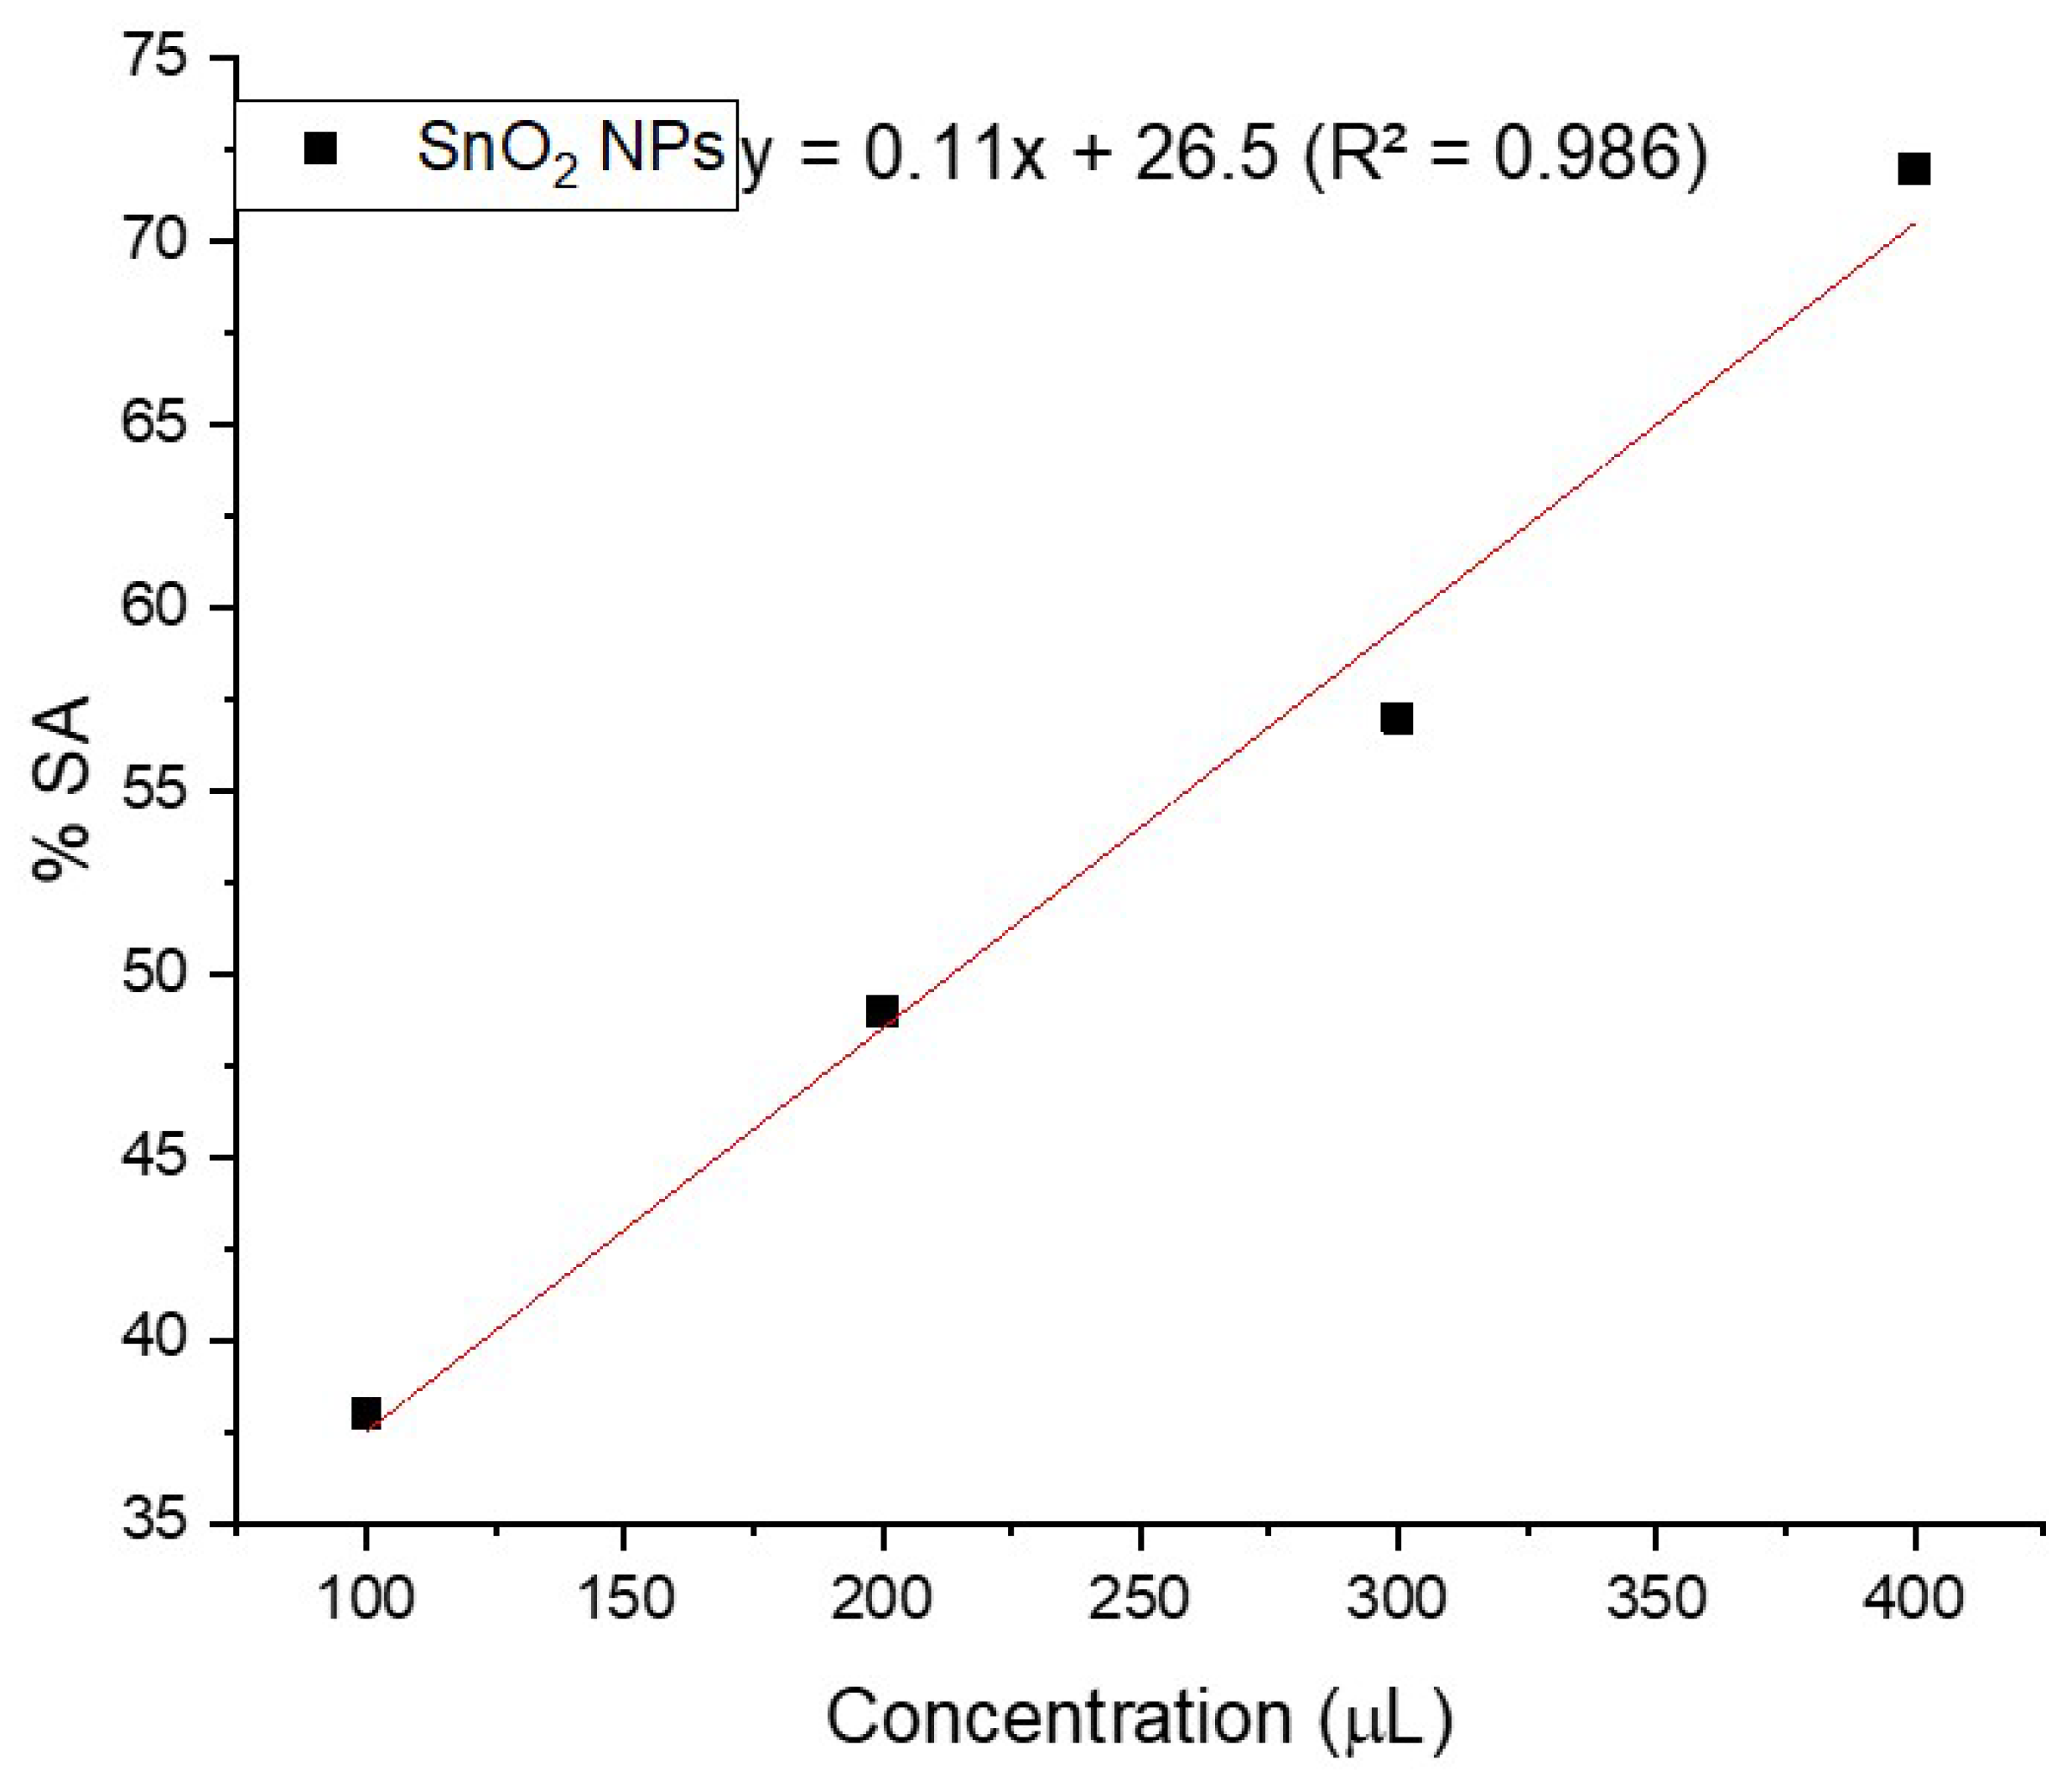
3.7. Antioxidant Property
3.8. Antimicrobial Activity
4. Conclusions
Author Contributions
Funding
Data Availability Statement
Conflicts of Interest
References
- Hajipour, M.J.; Fromm, K.M.; Ashkarran, A.A.; Jimenez de Aberasturi, D.; de Larramendi, I.R.; Rojo, T.; Serpooshan, V.; Parak, W.J.; Mahmoudi, M. Antibacterial properties of nanoparticles. Trends Biotechnol. 2012, 30, 499–511. [Google Scholar] [CrossRef] [PubMed] [Green Version]
- Ahmad, W.; Kalra, D. Green synthesis, characterization and antimicrobial activities of ZnO nanoparticles using Euphorbia hirta leaf extract. J. King Saud Univ.-Sci. 2020, 32, 2358–2364. [Google Scholar] [CrossRef]
- Liew, S.S.; Ho, W.Y.; Yeap, S.K.; Bin Sharifudin, S.A. Phytochemical composition and in vitro antioxidant activities of Citrus sinensis peel extracts. PeerJ 2018, 2018, e5331. [Google Scholar] [CrossRef] [Green Version]
- Din, M.I.; Arshad, F.; Hussain, Z.; Mukhtar, M. Green Adeptness in the Synthesis and Stabilization of Copper Nanoparticles: Catalytic, Antibacterial, Cytotoxicity, and Antioxidant Activities. Nanoscale Res. Lett. 2017, 12, 638. [Google Scholar] [CrossRef] [Green Version]
- Drzymała, E.; Gruzeł, G.; Depciuch, J.; Budziak, A.; Kowal, A.; Parlinska-Wojtan, M. Structural, chemical and optical properties of SnO2 NPs obtained by three different synthesis routes. J. Phys. Chem. Solids 2017, 107, 100–107. [Google Scholar] [CrossRef]
- PMahfooz-ur-Rehman; Waseem, M.; Rehman, W.; Hussain, R.; Hussain, S.; Haq, S.; Anis-ur-Rehman, M. Evaluation of structural, electrical and magnetic properties of nanosized unary, binary and ternary particles of Fe3O4, SnO2 and TiO2. Chem. Pap. 2021, 75, 2625–2638. [Google Scholar] [CrossRef]
- Bibi, N.; Haq, S.; Rehman, W.; Waseem, M.; Rehman, M.U.; Shah, A.; Khan, B.; Rasheed, P. Low temperature fabrication of SnO2, ZnO and Zn2SnO4 nanostructures for the degradation of Rhodamine 6G: Characterization. Biointerface Res. Appl. Chem. 2020, 10, 5895–5900. [Google Scholar]
- Naje, A.N.; Norry, A.S.; Suhail, A.M. Preparation and Characterization of SnO2 Nanoparticles. Int. J. Innov. Res. Sci. Eng. Technol. 2013, 2, 7068–7072. [Google Scholar] [CrossRef]
- Pereira, M.S.; Ribeiro, T.S.; Lima, F.A.S.; Santos, L.P.M.; Silva, C.B.; Freire, P.T.C.; Vasconcelos, I.F. Synthesis and properties of Sn1−xFexO2 nanoparticles obtained by a proteic sol–gel method. J. Nanoparticle Res. 2018, 20, 212. [Google Scholar] [CrossRef]
- Aziz, M.; Saber Abbas, S.; Wan Baharom, W.R. Size-controlled synthesis of SnO2 nanoparticles by sol-gel method. Mater. Lett. 2013, 91, 31–34. [Google Scholar] [CrossRef]
- Rahmi, R.; Kurniawan, F. Synthesis of SnO2 Nanoparticles by high potential electrolysis. Bull. Chem. React. Eng. Catal. 2017, 12, 281–286. [Google Scholar] [CrossRef] [Green Version]
- Leite, E.R.; Gomes, J.W.; Oliveira, M.M.; Lee, E.J.; Longo, E.; Varela, J.A.; Paskocimas, C.A.; Boschi, T.M.; Lanciotti, J.F.; Pizani, P.S.; et al. Synthesis of SnO2 nanoribbons by a carbothermal reduction process. J. Nanosci. Nanotechnol. 2002, 2, 125–128. [Google Scholar] [CrossRef]
- Masuda, Y.; Ohji, T.; Kato, K. Highly enhanced surface area of tin oxide nanocrystals. J. Am. Ceram. Soc. 2010, 93, 2140–2143. [Google Scholar] [CrossRef]
- Haq, S.; Rehman, W.; Waseem, M.; Shahid, M.; Rehman, M.U.; Shah, K.H.; Nawaz, M. Adsorption of Cd2+ ions on plant mediated SnO2 nanoparticles. Mater. Res. Express 2016, 3, 105019. [Google Scholar] [CrossRef]
- Haq, S.; Rehman, W.; Waseem, M.; Shah, A.; Khan, A.R. Green synthesis and characterization of tin dioxide nanoparticles for photocatalytic and antimicrobial studies. Mater. Res. Express 2020, 7, 025012. [Google Scholar] [CrossRef]
- Singh, J.; Kaur, H.; Kukkar, D.; Mukamia, V.K.; Kumar, S.; Rawat, M. Green synthesis of SnO2 NPs for solar light induced photocatalytic applications. Mater. Res. Express 2019, 6, 115007. [Google Scholar] [CrossRef]
- Diallo, A.; Manikandan, E.; Rajendran, V.; Maaza, M. Physical & enhanced photocatalytic properties of green synthesized SnO2 nanoparticles via Aspalathus linearis. J. Alloys Compd. 2016, 681, 561–570. [Google Scholar] [CrossRef]
- Elango, G.; Kumaran, S.M.; Kumar, S.S.; Muthuraja, S.; Roopan, S.M. Green synthesis of SnO2 nanoparticles and its photocatalytic activity of phenolsulfonphthalein dye. Spectrochim. Acta-Part A Mol. Biomol. Spectrosc. 2015, 145, 176–180. [Google Scholar] [CrossRef]
- Haq, F.; Ahmad, H.; Alam, M. Traditional uses of medicinal plants of Nandiar Khuwarr catchment (District Battagram), Pakistan. J. Med. Plants Res. 2011, 5, 39–48. [Google Scholar]
- Aggarwal, G.; Gaur, A.; Srivastava, D.K. Establishment of high frequency shoot regeneration system in Himalayan poplar (Populus ciliata Wall. ex Royle) from petiole explants using Thidiazuron cytokinin as plant growth regulator. J. For. Res. 2015, 26, 651–656. [Google Scholar] [CrossRef]
- Haq, S.; Rehman, W.; Waseem, M.; Meynen, V.; Ullah, S.; Saeed, S.; Iqbal, N. Fabrication of pure and moxi fl oxacin functionalized silver oxide nanoparticles for photocatalytic and antimicrobial activity. J. Photochem. Photobiol. B Biol. 2018, 186, 116–124. [Google Scholar] [CrossRef] [PubMed]
- Elhaddad, E.; Rehman, W.; Waseem, M.; Nawaz, M.; Haq, S.; Guo, C.Y. Fabrication of Highly Efficient Bi2Sn2O7/C3N4 Composite with Enhanced Photocatalytic Activity for Degradation of Organic Pollutants. J. Inorg. Organomet. Polym. Mater. 2020, 31, 172–179. [Google Scholar] [CrossRef]
- Fu, L.; Zheng, Y.; Ren, Q.; Wang, A.; Deng, B. Green biosynthesis of SnO2 nanoparticles by plectranthus amboinicus leaf extract their photocatalytic activity toward rhodamine B degradation. J. Ovonic Res. 2015, 11, 21–26. [Google Scholar]
- Ho, S.Y.; Wong, A.S.W.; Ho, G.W. Controllable porosity of monodispersed tin oxide nanospheres via an additive-free chemical route. Cryst. Growth Des. 2009, 9, 732–736. [Google Scholar] [CrossRef]
- Haq, S.; Ahmad, P.; Khandaker, M.U.; Faruque, M.R.I.; Rehman, W.; Waseem, M.; Din, S.U. Antibacterial, antioxidant and physicochemical investigations of tin dioxide nanoparticles synthesized via microemulsion method. Mater. Res. Express 2021, 8, 035013. [Google Scholar] [CrossRef]
- Shoukat, S.; Haq, S.; Rehman, W.; Waseem, M.; Shahzad, M.I.; Shahzad, N.; Hafeez, M.; Din, S.U.; Zain-ul-Abdin; Shah, A.; et al. Fabrication and Characterization of Zinc Titanate Heterojunction for Adsorption and Photocatalytic Applications. J. Inorg. Organomet. Polym. Mater. 2020, 30, 4944–4953. [Google Scholar] [CrossRef]
- Haq, S.; Rehman, W.; Waseem, M.; Rehman, M.U.; Khan, B. Adsorption of Cd2+ ions onto SnO2 nanoparticles synthesized via sol-gel method: Physiochemical study. Mater. Res. Express 2019, 6, 105035. [Google Scholar] [CrossRef]
- de Monredon, S.; Cellot, A.; Ribot, F.; Sanchez, C.; Armelao, L.; Gueneau, L.; Delattre, L. Synthesis and characterization of crystalline tin oxide nanoparticles. J. Mater. Chem. 2002, 12, 2396–2400. [Google Scholar] [CrossRef]
- Haq, S.; Dildar, S.; Ali, M.B.; Mezni, A.; Hedfi, A.; Shahzad, M.I.; Shahzad, N.; Shah, A. Antimicrobial and antioxidant properties of biosynthesized of NiO nanoparticles using Raphanus sativus (R. sativus) extract. Mater. Res. Express 2021, 8, 055006. [Google Scholar] [CrossRef]
- Rehman, F.U.; Mahmood, R.; Ali, M.B.; Hedfi, A.; Mezni, A.; Haq, S.; Din, S.U.; Ehsan, R. Physicochemical, Photocatalytic, Antibacterial, and Antioxidant Screening of Bergenia Ciliata Mediated Nickel Oxide Nanoparticles. Crystal 2021, 11, 1137. [Google Scholar] [CrossRef]
- Haq, S.; Yasin, K.A.; Rehman, W.; Waseem, M.; Ahmed, M.N.; Shahzad, M.I.; Shahzad, N.; Shah, A.; Rehman, M.U.; Khan, B. Green Synthesis of Silver Oxide Nanostructures and Investigation of Their Synergistic Effect with Moxifloxacin Against Selected Microorganisms. J. Inorg. Organomet. Polym. Mater. 2020, 31, 1134–1142. [Google Scholar] [CrossRef]
- Precious Ayanwale, A.; Reyes-López, S.Y. ZrO2-ZnO Nanoparticles as Antibacterial Agents. ACS Omega 2019, 4, 19216–19224. [Google Scholar] [CrossRef] [PubMed] [Green Version]
- Shah, A.; Haq, S.; Rehman, W.; Muhammad, W.; Shoukat, S.; Rehman, M.U. Photocatalytic and antibacterial activities of Paeonia emodi mediated silver oxide nanoparticles. Mater. Res. Express 2019, 6, 045045. [Google Scholar] [CrossRef]
- Hamid, A.; Haq, S.; Ur Rehman, S.; Akhter, K.; Rehman, W.; Waseem, M.; Ud Din, S.; Zain-ul-Abdin; Hafeez, M.; Khan, A.; et al. Calcination temperature-driven antibacterial and antioxidant activities of fumaria indica mediated copper oxide nanoparticles: Characterization. Chem. Pap. 2021, 75, 4189–4198. [Google Scholar] [CrossRef]
- Haq, S.; Rehman, W.; Waseem, M.; Javed, R.; Mahfooz-ur-Rehman; Shahid, M. Effect of heating on the structural and optical properties of TiO2 nanoparticles: Antibacterial activity. Appl. Nanosci. 2018, 8, 11–18. [Google Scholar] [CrossRef] [Green Version]


| Miller Indices (hkl) | 2θ Values | d (Å) | a (Å) |
|---|---|---|---|
| 110 | 26.68° | 0.344 | 0.486 |
| 101 | 32.77° | 0.285 | 0.403 |
| 200 | 38.24° | 0.250 | 0.5 |
| 211 | 51.84° | 0.196 | 0.480 |
| 221 | 62.14° | 0.174 | 0.522 |
| 301 | 65.58° | 0.169 | 0.534 |
| 202 | 71.29° | 0.163 | 0.461 |
| 321 | 78.85° | 0.157 | 0.608 |
| Planck’s Constant (h) | Velocity of Light (c) | Band Gap Reflectance Edge (λ) | Optical Band Gap Energy (Eg) |
|---|---|---|---|
| 6.626 × 10⁻³⁴ J s | 3 × 10⁸ m s–1 | 500 nm | 3.36 eV |
| Stages | Temperature (°C) | Weight Loss (mg) | Total Weight Loss |
|---|---|---|---|
| 1st | 40–245 °C | 0.03 mg | 0.21 mg |
| 2nd | 246–530 °C | 0.18 mg | |
| 3rd | After 530 °C | No weight loss |
| Samples Code | Concentration (µL) | Percentage Scavenging Activity (%) | IC50 |
|---|---|---|---|
| SnO2 nanoparticles | 100 | 38 | 213.64 |
| 200 | 49 | ||
| 300 | 57 | ||
| 400 | 72 |
Publisher’s Note: MDPI stays neutral with regard to jurisdictional claims in published maps and institutional affiliations. |
© 2022 by the authors. Licensee MDPI, Basel, Switzerland. This article is an open access article distributed under the terms and conditions of the Creative Commons Attribution (CC BY) license (https://creativecommons.org/licenses/by/4.0/).
Share and Cite
Din, S.U.; Kiani, S.H.; Haq, S.; Ahmad, P.; Khandaker, M.U.; Faruque, M.R.I.; Idris, A.M.; Sayyed, M.I. Bio-Synthesized Tin Oxide Nanoparticles: Structural, Optical, and Biological Studies. Crystals 2022, 12, 614. https://doi.org/10.3390/cryst12050614
Din SU, Kiani SH, Haq S, Ahmad P, Khandaker MU, Faruque MRI, Idris AM, Sayyed MI. Bio-Synthesized Tin Oxide Nanoparticles: Structural, Optical, and Biological Studies. Crystals. 2022; 12(5):614. https://doi.org/10.3390/cryst12050614
Chicago/Turabian StyleDin, Salah Ud, Sabah Hanif Kiani, Sirajul Haq, Pervaiz Ahmad, Mayeen Uddin Khandaker, Mohammad Rashed Iqbal Faruque, Abubakr M. Idris, and M. I. Sayyed. 2022. "Bio-Synthesized Tin Oxide Nanoparticles: Structural, Optical, and Biological Studies" Crystals 12, no. 5: 614. https://doi.org/10.3390/cryst12050614