

Influence of Synthesis Conditions on the Crystal, Local Atomic, Electronic Structure, and Catalytic Properties of (Pr1−xYbx)2Zr2O7 (0 ≤ x ≤ 1) Powders

 , , , , , , , , , , , ,
Abstract
:1. Introduction
2. Materials and Methods
2.1. Catalyst Synthesis
2.2. Characterization
3. Results and Discussion
3.1. Characterization of Catalytic Materials
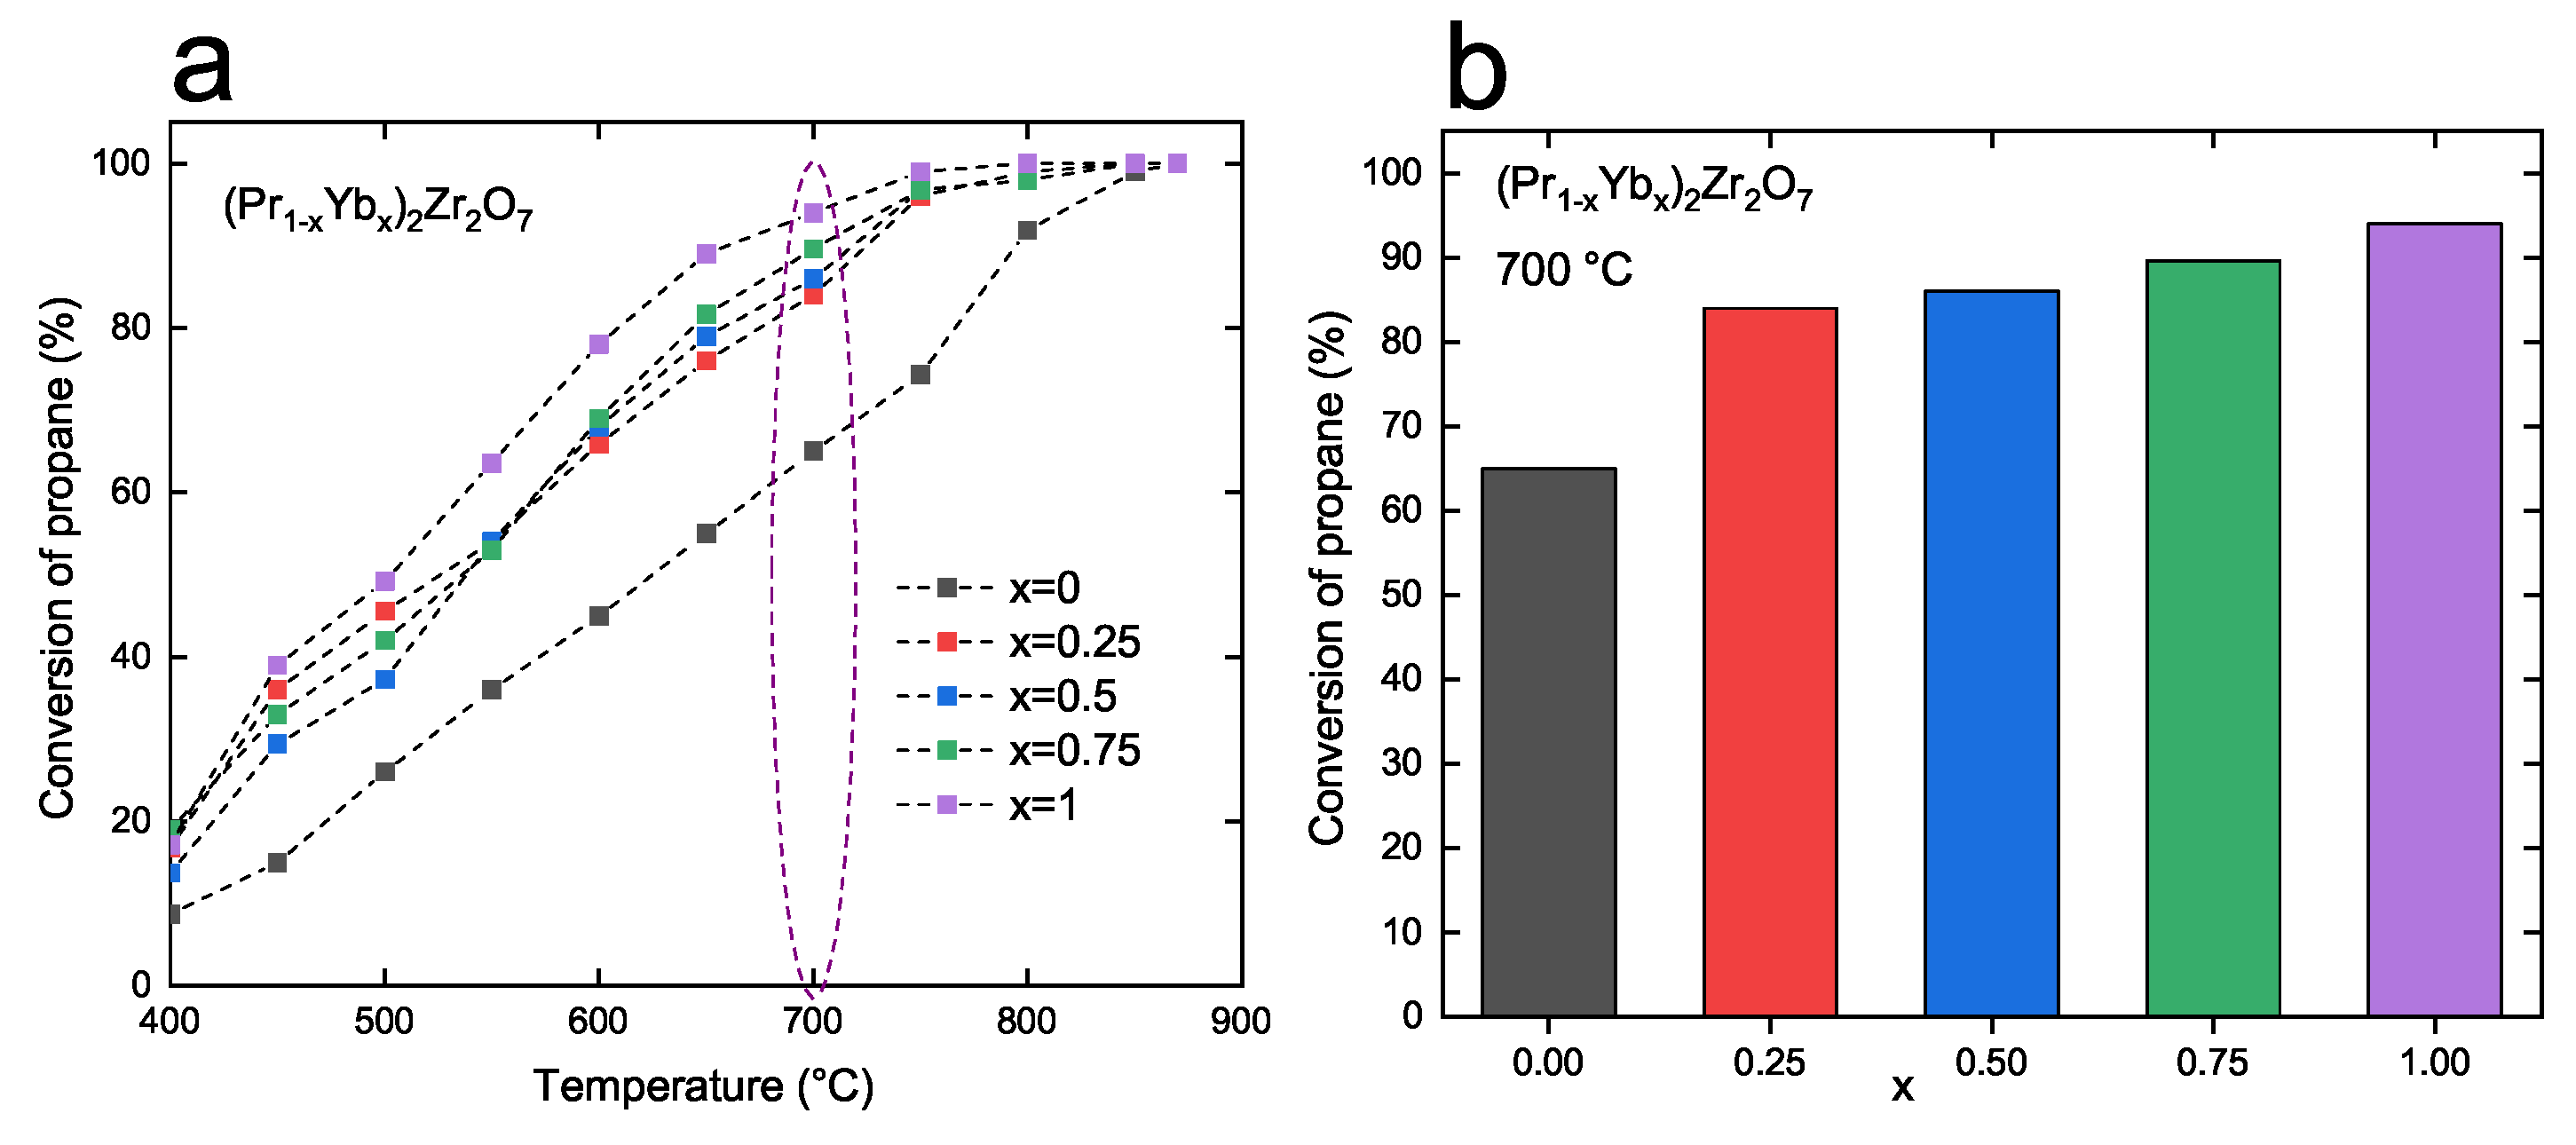
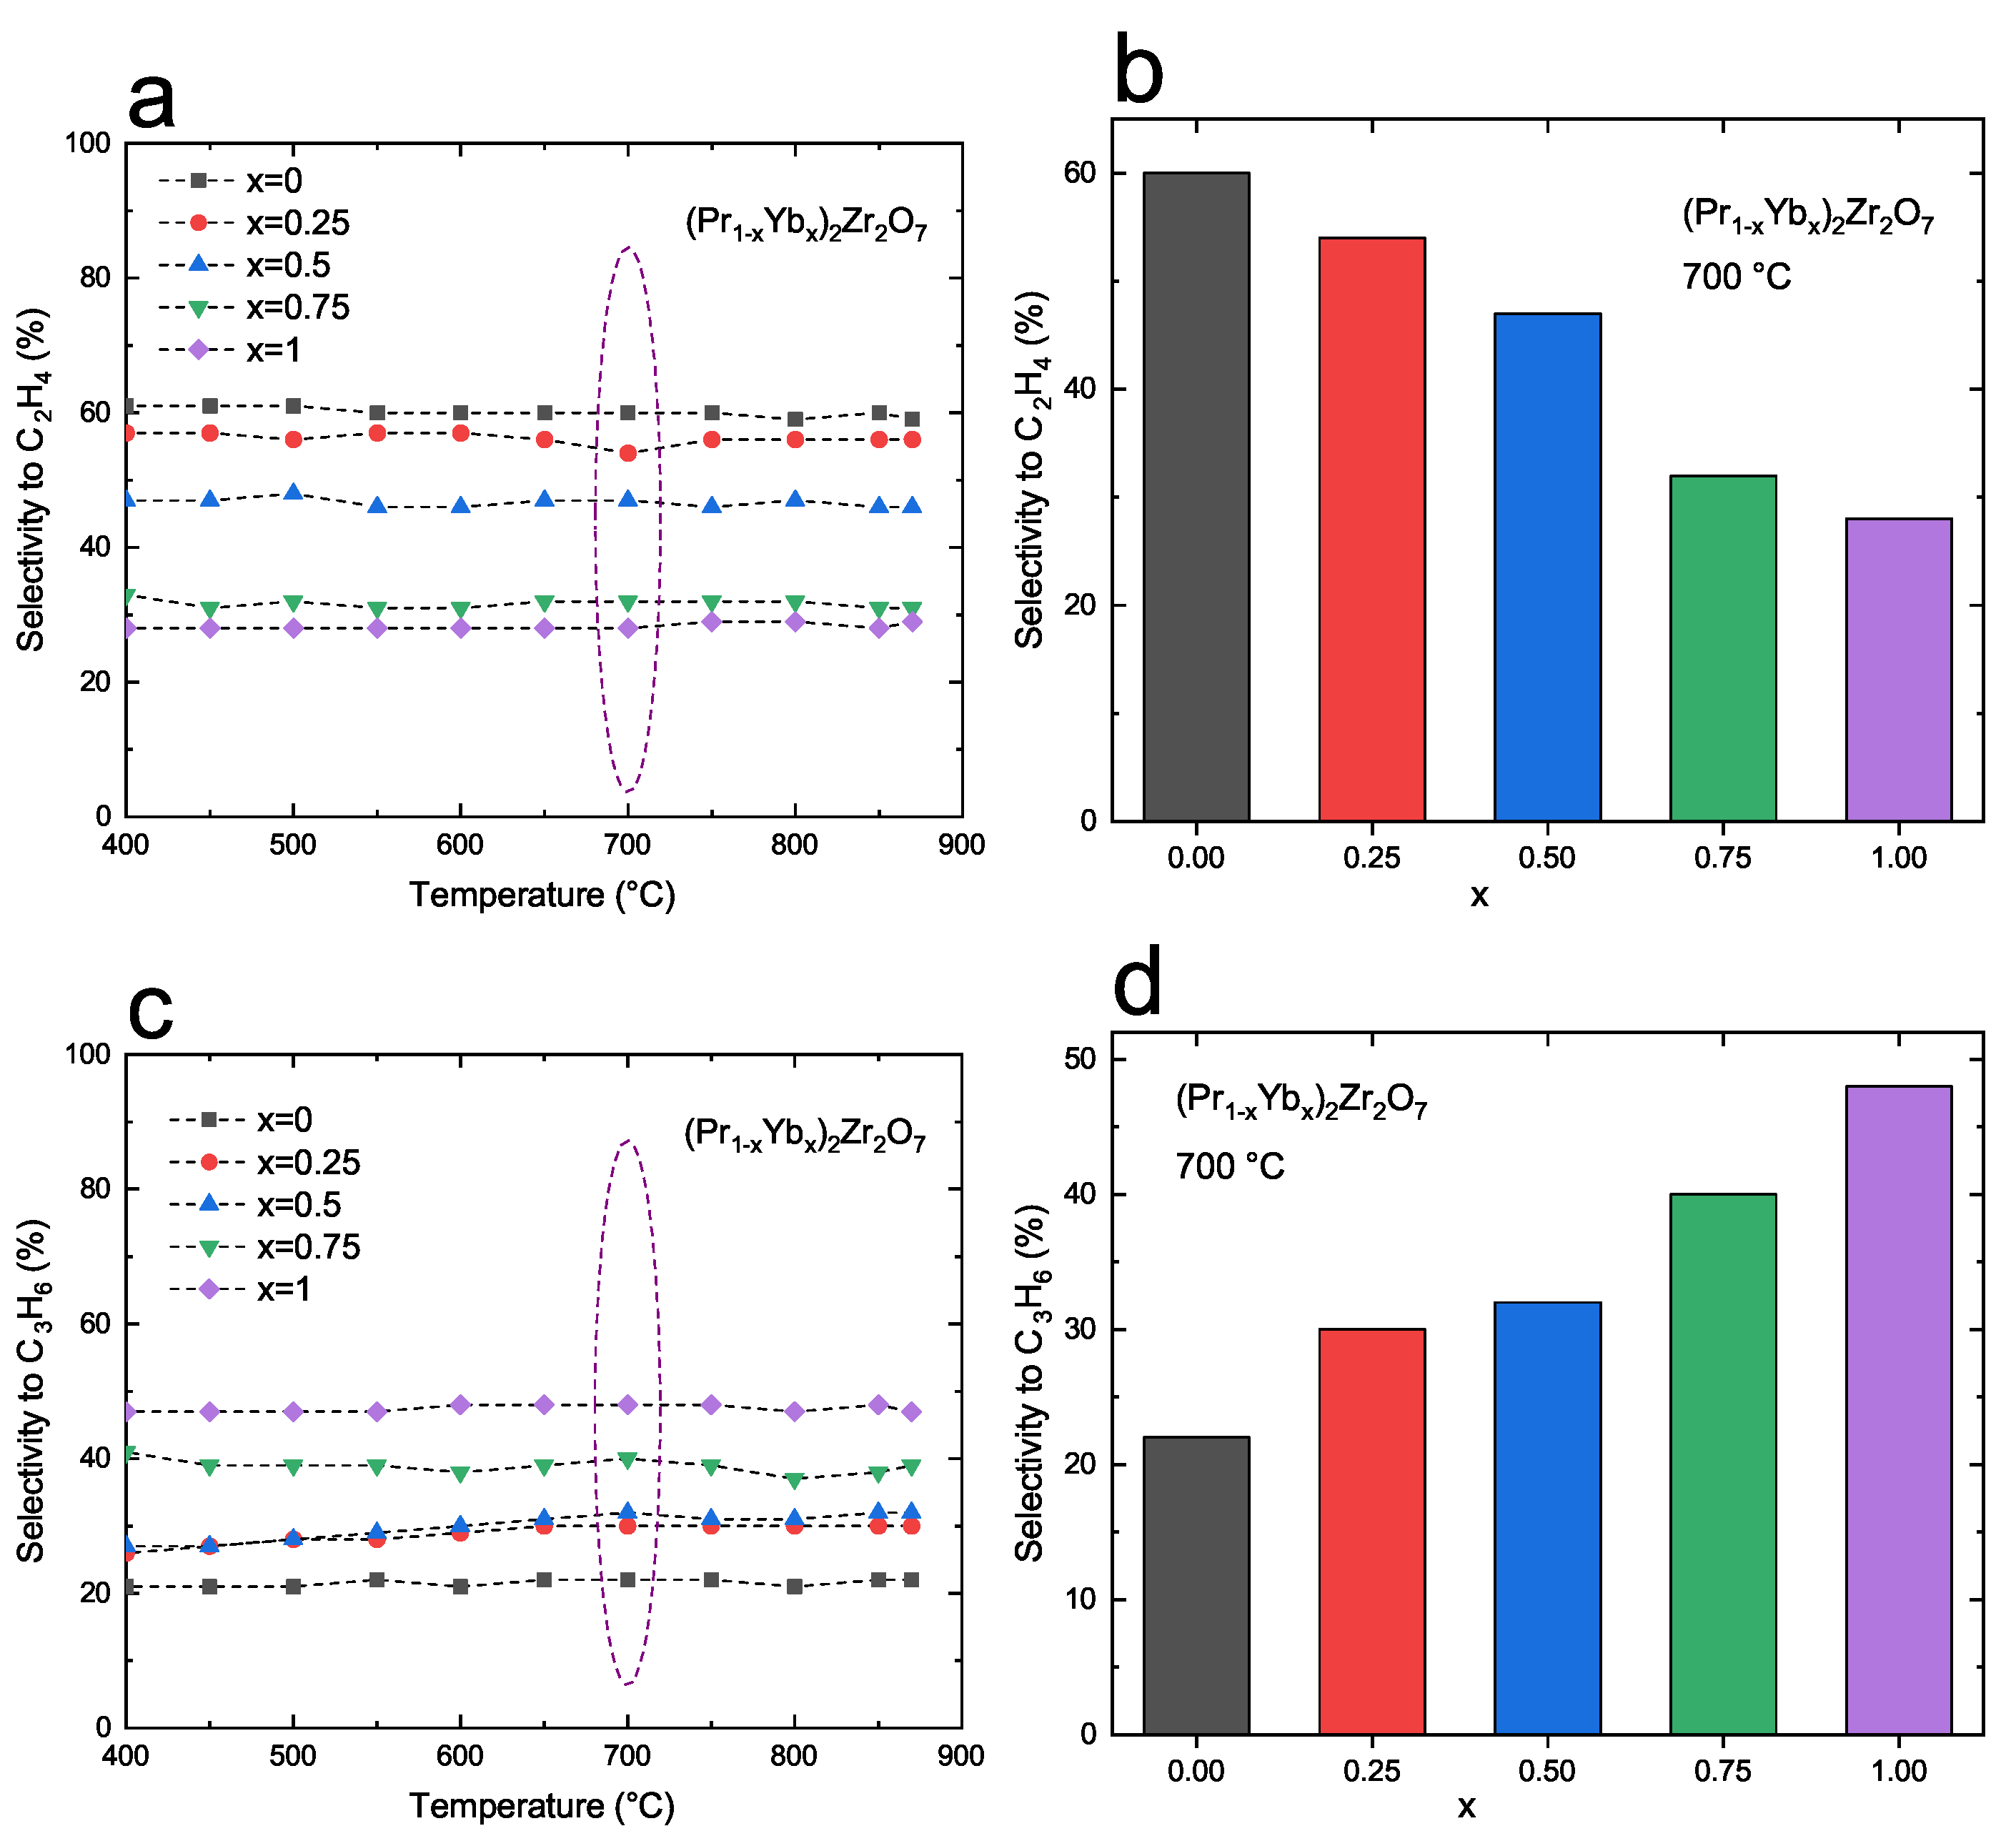
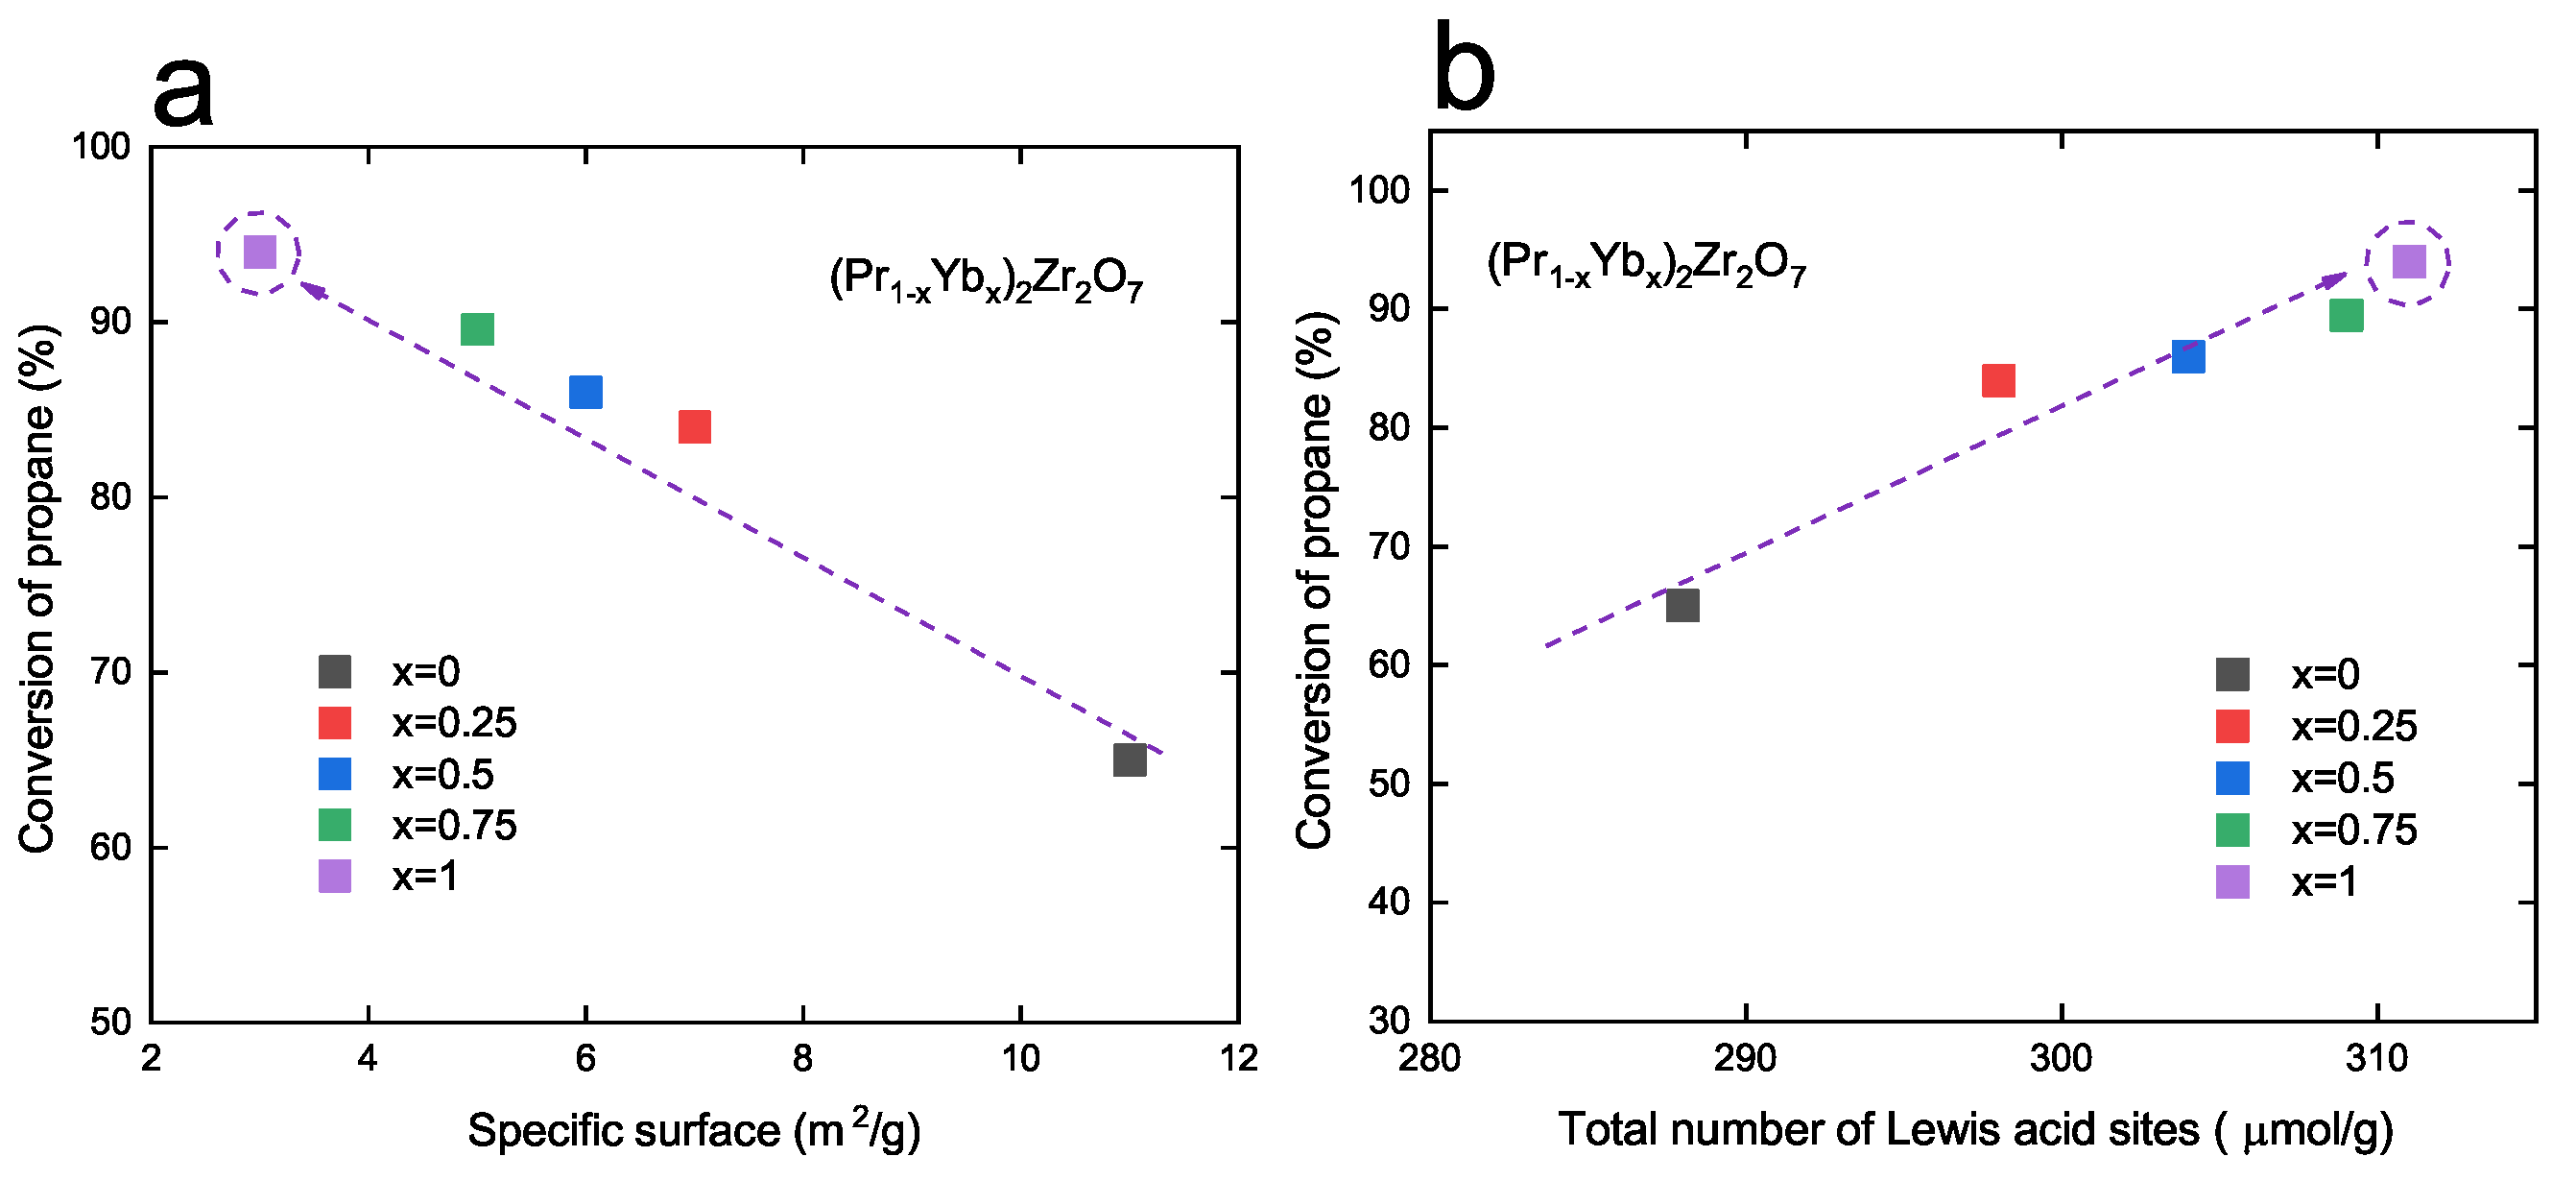
3.2. Catalytic Properties
4. Conclusions
Supplementary Materials
Author Contributions
Funding
Data Availability Statement
Acknowledgments
Conflicts of Interest
References
- Subramanian, M.; Aravamudan, G.; Rao, G.S. Oxide pyrochlores—A review. Prog. Solid State Chem. 1983, 15, 55–143. [Google Scholar] [CrossRef]
- Blanchard, P.E.; Clements, R.; Kennedy, B.J.; Ling, C.D.; Reynolds, E.; Avdeev, M.; Stampfl, A.P.; Zhang, Z.; Jang, L.Y. Does Local Disorder Occur in the Pyrochlore Zirconates? Inorg. Chem. 2012, 51, 13237–13244. [Google Scholar] [CrossRef] [PubMed]
- Karthik, C.; Anderson, T.J.; Gout, D.; Ubic, R. Transmission electron microscopic study of pyrochlore to defect–fluorite transition in rare-earth pyrohafnates. J. Solid State Chem. 2012, 194, 168–172. [Google Scholar] [CrossRef]
- Blanchard, P.E.R.; Liu, S.; Kennedy, B.J.; Ling, C.D.; Avdeev, M.; Aitken, J.B.; Cowie, B.C.C.; Tadich, A. Investigating the Local Structure of Lanthanoid Hafnates Ln2Hf2O7 via Diffraction and Spectroscopy. J. Phys. Chem. C 2013, 117, 2266–2273. [Google Scholar] [CrossRef]
- Farmer, J.M.; Boatner, L.A.; Chakoumakos, B.C.; Du, M.H.; Lance, M.J.; Rawn, C.J.; Bryan, J.C. Structural and crystal chemical properties of rare-earth titanate pyrochlores. J. Alloys Compd. 2014, 605, 63–70. [Google Scholar] [CrossRef]
- Thorogood, G.J.; Finkeldei, S.C.; Lang, M.K.; Simeone, D. (Eds.) Ordered and Disordered Cubic Systems: Pyrochlore to Fluorite, Now and the Horizon; Frontiers Media SA: Lausanne, Switzerland, 2022. [Google Scholar] [CrossRef]
- Blanchard, P.E.R.; Liu, S.; Kennedy, B.J.; Ling, C.D.; Zhang, Z.; Avdeev, M.; Cowie, B.C.C.; Thomsen, L.; Jang, L.Y. Investigating the order–disorder phase transition in Nd2−xYxZr2O7 via diffraction and spectroscopy. Dalton Trans. 2013, 42, 14875. [Google Scholar] [CrossRef]
- Shamblin, J.; Feygenson, M.; Neuefeind, J.; Tracy, C.L.; Zhang, F.; Finkeldei, S.; Bosbach, D.; Zhou, H.; Ewing, R.C.; Lang, M. Probing disorder in isometric pyrochlore and related complex oxides. Nat. Mater. 2016, 15, 507–511. [Google Scholar] [CrossRef]
- Simeone, D.; Thorogood, G.J.; Huo, D.; Luneville, L.; Baldinozzi, G.; Petricek, V.; Porcher, F.; Ribis, J.; Mazerolles, L.; Largeau, L.; et al. Intricate disorder in defect fluorite/pyrochlore: A concord of chemistry and crystallography. Sci. Rep. 2017, 7, 3727. [Google Scholar] [CrossRef]
- Kimura, K.; Nakatsuji, S.; Wen, J.J.; Broholm, C.; Stone, M.B.; Nishibori, E.; Sawa, H. Quantum fluctuations in spin-ice-like Pr2Zr2O7. Nat. Commun. 2013, 4, 1934. [Google Scholar] [CrossRef]
- Gingras, M.J.P.; McClarty, P.A. Quantum spin ice: A search for gapless quantum spin liquids in pyrochlore magnets. Rep. Prog. Phys. 2014, 77, 056501. [Google Scholar] [CrossRef]
- Winter, M.R.; Clarke, D.R. Oxide Materials with Low Thermal Conductivity. J. Am. Ceram. Soc. 2007, 90, 533–540. [Google Scholar] [CrossRef]
- Pan, W.; Phillpot, S.R.; Wan, C.; Chernatynskiy, A.; Qu, Z. Low thermal conductivity oxides. MRS Bull. 2012, 37, 917–922. [Google Scholar] [CrossRef]
- Liu, D.; Shi, B.; Geng, L.; Wang, Y.; Xu, B.; Chen, Y. High-entropy rare-earth zirconate ceramics with low thermal conductivity for advanced thermal-barrier coatings. J. Adv. Ceram. 2022, 11, 961–973. [Google Scholar] [CrossRef]
- Yamamura, H.; Nishino, H.; Kakinuma, K.; Nomura, K. Electrical conductivity anomaly around fluorite–pyrochlore phase boundary. Solid State Ionics 2003, 158, 359–365. [Google Scholar] [CrossRef]
- Shlyakhtina, A.V.; Shcherbakova, L.G. New solid electrolytes of the pyrochlore family. Russ. J. Electrochem. 2012, 48, 1–25. [Google Scholar] [CrossRef]
- Ewing, R.C.; Weber, W.J.; Lian, J. Nuclear waste disposal–pyrochlore (A2B2O7): Nuclear waste form for the immobilization of plutonium and “minor” actinides. J. Appl. Phys. 2004, 95, 5949–5971. [Google Scholar] [CrossRef]
- Wang, Z.; Zhu, C.; Wang, H.; Wang, M.; Liu, C.; Yang, D.; Li, Y. Preparation and irradiation stability of A2B2O7 pyrochlore high-entropy ceramic for immobilization of high-level nuclear waste. J. Nucl. Mater. 2023, 574, 154212. [Google Scholar] [CrossRef]
- Risovany, V.; Varlashova, E.; Suslov, D. Dysprosium titanate as an absorber material for control rods. J. Nucl. Mater. 2000, 281, 84–89. [Google Scholar] [CrossRef]
- Risovany, V.; Zakharov, A.; Muraleva, E.; Kosenkov, V.; Latypov, R. Dysprosium hafnate as absorbing material for control rods. J. Nucl. Mater. 2006, 355, 163–170. [Google Scholar] [CrossRef]
- Uno, M.; Kosuga, A.; Okui, M.; Horisaka, K.; Muta, H.; Kurosaki, K.; Yamanaka, S. Photoelectrochemical study of lanthanide zirconium oxides, Ln2Zr2O7 (Ln = La, Ce, Nd and Sm). J. Alloys Compd. 2006, 420, 291–297. [Google Scholar] [CrossRef]
- Xu, J.; Xi, R.; Xu, X.; Zhang, Y.; Feng, X.; Fang, X.; Wang, X. A2B2O7 pyrochlore compounds: A category of potential materials for clean energy and environment protection catalysis. J. Rare Earths 2020, 38, 840–849. [Google Scholar] [CrossRef]
- Chen, S.; Chang, X.; Sun, G.; Zhang, T.; Xu, Y.; Wang, Y.; Pei, C.; Gong, J. Propane dehydrogenation: Catalyst development, new chemistry, and emerging technologies. Chem. Soc. Rev. 2021, 50, 3315–3354. [Google Scholar] [CrossRef]
- Monai, M.; Gambino, M.; Wannakao, S.; Weckhuysen, B.M. Propane to olefins tandem catalysis: A selective route towards light olefins production. Chem. Soc. Rev. 2021, 50, 11503–11529. [Google Scholar] [CrossRef] [PubMed]
- Al-Sultan, F.S.; Basahel, S.N.; Narasimharao, K. Yttrium Oxide Supported La2O3 Nanomaterials for Catalytic Oxidative Cracking of n-Propane to Olefins. Catal. Lett. 2019, 150, 185–195. [Google Scholar] [CrossRef]
- Markova, E.B.; Cherednichenko, A.G.; Smirnova, S.S.; Sheshko, T.F.; Kryuchkova, T.A. Features of the Catalytic Cracking of Propane with a Step-Wise Change PrxYb2−xZr2O7. Catalysts 2023, 13, 396. [Google Scholar] [CrossRef]
- Popov, V.V.; Menushenkov, A.P.; Gaynanov, B.R.; Zubavichus, Y.V.; Svetogorov, R.D.; Yastrebtsev, A.A.; Pisarev, A.A.; Arzhatkina, L.A.; Ponkratov, K.V. Features of formation and evolution of crystal and local structures in nanocrystalline Ln2Zr2O7 (Ln = La − Tb). J. Phys. Conf. Ser. 2017, 941, 012079. [Google Scholar] [CrossRef]
- Yastrebtsev, A.; Popov, V.; Menushenkov, A.; Beskrovnyi, A.; Neov, D.; Shchetinin, I.; Ponkratov, K. Comparative neutron and X-ray diffraction analysis of anionic and cationic ordering in rare-earth zirconates (Ln = La, Nd, Tb, Yb, Y). J. Alloys Compd. 2020, 832, 154863. [Google Scholar] [CrossRef]
- Stanek, C.R.; Jiang, C.; Uberuaga, B.P.; Sickafus, K.E.; Cleave, A.R.; Grimes, R.W. Predicted structure and stability of A4B3O12δ-phase compositions. Phys. Rev. B 2009, 80, 174101. [Google Scholar] [CrossRef]
- Andrievskaya, E. Phase equilibria in the refractory oxide systems of zirconia, hafnia and yttria with rare-earth oxides. J. Eur. Ceram. Soc. 2008, 28, 2363–2388. [Google Scholar] [CrossRef]
- Grima, L.; Peña, J.; Sanjuán, M. Pyrochlore-like ZrO2-PrOx compounds: The role of the processing atmosphere in the stoichiometry, microstructure and oxidation state. J. Alloys Compd. 2022, 923, 166449. [Google Scholar] [CrossRef]
- Bonville, P.; Guitteny, S.; Gukasov, A.; Mirebeau, I.; Petit, S.; Decorse, C.; Hatnean, M.C.; Balakrishnan, G. Magnetic properties and crystal field in Pr2Zr2O7. Phys. Rev. B 2016, 94, 134428. [Google Scholar] [CrossRef]
- Wang, Y.; Gao, B.; Wang, Q.; Li, X.; Su, Z.; Chang, A. A2Zr2O7 (A = Nd, Sm, Gd, Yb) zirconate ceramics with pyrochlore-type structure for high-temperature negative temperature coefficient thermistor. J. Mater. Sci. 2020, 55, 15405–15414. [Google Scholar] [CrossRef]
- Clements, R.; Hester, J.R.; Kennedy, B.J.; Ling, C.D.; Stampfl, A.P. The fluorite–pyrochlore transformation of Ho2−yNdyZr2O7. J. Solid State Chem. 2011, 184, 2108–2113. [Google Scholar] [CrossRef]
- Sayed, F.N.; Jain, D.; Mandal, B.; Pillai, C.G.S.; Tyagi, A.K. Tunability of structure from ordered to disordered and its impact on ionic conductivity behavior in the Nd2−yHoyZr2O7 (0.0 ≤ y ≤ 2.0) system. RSC Adv. 2012, 2, 8341. [Google Scholar] [CrossRef]
- Heremans, C.; Wuensch, B.J.; Stalick, J.K.; Prince, E. Fast-Ion Conducting Y2(ZryTi1−y)2O7 Pyrochlores: Neutron Rietveld Analysis of Disorder Induced by Zr Substitution. J. Solid State Chem. 1995, 117, 108–121. [Google Scholar] [CrossRef]
- Hess, N.J.; Begg, B.D.; Conradson, S.D.; McCready, D.E.; Gassman, P.L.; Weber, W.J. Spectroscopic Investigations of the Structural Phase Transition in Gd2(Ti1−yZry)2O7 Pyrochlores. J. Phys. Chem. B 2002, 106, 4663–4677. [Google Scholar] [CrossRef]
- Moreno, K.J.; Fuentes, A.F.; Maczka, M.; Hanuza, J.; Amador, U. Structural manipulation of pyrochlores: Thermal evolution of metastable Gd2(Ti1−yZry)2O7powders prepared by mechanical milling. J. Solid State Chem. 2006, 179, 3805–3813. [Google Scholar] [CrossRef]
- Lu, X.; Fan, L.; Shu, X.; Su, S.; Ding, Y.; Yi, F. Phase evolution and chemical durability of co-doped Gd2Zr2O7 ceramics for nuclear waste forms. Ceram. Int. 2015, 41, 6344–6349. [Google Scholar] [CrossRef]
- Wang, J.; Wang, J.X.; Zhang, Y.B.; Wei, Y.F.; Zhang, K.B.; Tan, H.B.; Liang, X.F. Order-disorder phase structure, microstructure and aqueous durability of (Gd, Sm)2(Zr, Ce)2O7 ceramics for immobilizing actinides. Ceram. Int. 2019, 45, 17898–17904. [Google Scholar] [CrossRef]
- Popov, V.; Menushenkov, A.; Yastrebtsev, A.; Rudakov, S.; Ivanov, A.; Gaynanov, B.; Svetogorov, R.; Khramov, E.; Zubavichus, Y.; Molokova, A.; et al. Multiscale study on the formation and evolution of the crystal and local structures in lanthanide tungstates Ln2(WO4)3. J. Alloys Compd. 2022, 910, 164922. [Google Scholar] [CrossRef]
- Brahlek, M.; Gazda, M.; Keppens, V.; Mazza, A.R.; McCormack, S.J.; Mielewczyk-Gryń, A.; Musico, B.; Page, K.; Rost, C.M.; Sinnott, S.B.; et al. What is in a name: Defining “high entropy” oxides. APL Mater. 2022, 10, 110902. [Google Scholar] [CrossRef]
- Popov, V.V.; Menushenkov, A.P.; Yaroslavtsev, A.A.; Zubavichus, Y.V.; Gaynanov, B.R.; Yastrebtsev, A.A.; Leshchev, D.S.; Chernikov, R.V. Fluorite-pyrochlore phase transition in nanostructured Ln2Hf2O7 (Ln = La − Lu). J. Alloys Compd. 2016, 689, 669–679. [Google Scholar] [CrossRef]
- Svetogorov, R.D.; Dorovatovskii, P.V.; Lazarenko, V.A. Belok/XSA Diffraction Beamline for Studying Crystalline Samples at Kurchatov Synchrotron Radiation Source. Cryst. Res. Technol. 2020, 55, 1900184. [Google Scholar] [CrossRef]
- Petricek, V.; Dusek, M.; Palatinus, L. Crystallographic computing system JANA2006: General features. Z. Krist. 2014, 229, 345–352. [Google Scholar] [CrossRef]
- Castro, G.R. Optical design of the general-purpose Spanish X-ray beamline for absorption and diffraction. J. Synchrotron Radiat. 1998, 5, 657–660. [Google Scholar] [CrossRef]
- Chernyshov, A.; Veligzhanin, A.; Zubavichus, Y. Structural Materials Science end-station at the Kurchatov Synchrotron Radiation Source: Recent instrumentation upgrades and experimental results. Nucl. Instrum. Methods Phys. Res. Sect. A 2009, 603, 95–98. [Google Scholar] [CrossRef]
- Klementev, K.V. Extraction of the fine structure from x–ray absorption spectra. J. Phys. D Appl. Phys. 2001, 34, 209–217. [Google Scholar] [CrossRef]
- Newville, M. IFEFFIT: Interactive XAFS analysis and FEFF fitting. J. Synchrotron Radiat. 2001, 8, 322–324. [Google Scholar] [CrossRef]
- Rehr, J.J.; Kas, J.J.; Vila, F.D.; Prange, M.P.; Jorissen, K. Parameter-free calculations of X-ray spectra with FEFF9. Phys. Chem. Chem. Phys. 2010, 12, 5503–5513. [Google Scholar] [CrossRef]
- Teplonogova, M.; Yapryntsev, A.; Baranchikov, A.; Ivanov, V. High-Entropy Layered Rare Earth Hydroxides. Inorg. Chem. 2022, 61, 19817–19827. [Google Scholar] [CrossRef]
- Du, H.; Williams, C.T.; Ebner, A.D.; Ritter, J.A. In Situ FTIR Spectroscopic Analysis of Carbonate Transformations during Adsorption and Desorption of CO2 in K-Promoted HTlc. Chem. Mater. 2010, 22, 3519–3526. [Google Scholar] [CrossRef]
- Nakamoto, K. Infrared and Raman Spectra of Inorganic and Coordination Compounds. Part A: Theory and Applications in Inorganic Chemistry, 6th ed.; John Wiley & Sons, Inc.: Hoboken, NJ, USA, 2009. [Google Scholar]
- Popov, V.; Menushenkov, A.; Gaynanov, B.; Ivanov, A.; d’Acapito, F.; Puri, A.; Shchetinin, I.; Zheleznyi, M.; Berdnikova, M.; Pisarev, A.; et al. Formation and evolution of crystal and local structures in nanostructured Ln2Ti2O7 (Ln = Gd − Dy). J. Alloys Compd. 2018, 746, 377–390. [Google Scholar] [CrossRef]
- Popov, V.; Menushenkov, A.; Zubavichus, Y.; Dubyago, F.; Yastrebtsev, A.; Ivanov, A.; Rudakov, S.; Svetogorov, R.; Khramov, E.; Kolyshkin, N.; et al. Control over crystal, local atomic and electronic structures of cerium chromates/chromites via the synthesis conditions. Mater. Chem. Phys. 2023, 296, 127269. [Google Scholar] [CrossRef]
- Shlyakhtina, A.V.; Vorobieva, G.A.; Leonov, A.V.; Shchegolikhin, A.N.; Chernyak, S.A.; Baldin, E.D.; Streletskii, A.N. Kinetics of Formation and Crystallization of Ln2Ti2O7 (Ln = Gd, Lu) Pyrochlores from Nanoparticulate Precursors. Inorg. Mater. 2022, 58, 964–982. [Google Scholar] [CrossRef]
- Chernyshev, V.A. Structure and Lattice Dynamics of La2Zr2O7 Crystal: Ab Initio Calculation. In Computational Science and Its Applications–ICCSA 2019; Springer International Publishing: Berlin/Heidelberg, Germany, 2019; pp. 625–638. [Google Scholar] [CrossRef]
- Kushwaha, A.; Mishra, S.; Vishwakarma, M.; Chauhan, S.; Jappor, H.R.; Khenata, R.; Omran, S.B. Theoretical study of thermal conductivity, mechanical, vibrational and thermodynamical properties of Ln2Zr2O7 (Ln = La, Nd, Sm, and Eu) pyrochlore. Inorg. Chem. Commun. 2021, 127, 108495. [Google Scholar] [CrossRef]
- Bai, Y.; Lu, L.; Bao, J. Synthesis and Characterization of Lanthanum Zirconate Nanocrystals Doped with Iron Ions by a Salt-Assistant Combustion Method. J. Inorg. Organomet. Polym. Mater. 2011, 21, 590–594. [Google Scholar] [CrossRef]
- Tang, Z.; Huang, Z.; Qi, J.; Guo, X.; Han, W.; Zhou, M.; Peng, S.; Lu, T. Synthesis and characterization of Gd2Zr2O7 defect fluorite oxide nanoparticles via a homogeneous precipitation-solvothermal method. RSC Adv. 2017, 7, 54980–54985. [Google Scholar] [CrossRef]
- Lee, Y.H.; Chen, J.M.; Lee, J.F.; Kao, H.C.I. XANES Spectroscopic Studies of the Phase Transition in Gd2Zr2O7. J. Chin. Chem. Soc. 2009, 56, 543–548. [Google Scholar] [CrossRef]
- Nandi, C.; Poswal, A.; Jafar, M.; Kesari, S.; Grover, V.; Rao, R.; Prakash, A.; Behere, P. Effect of Ce4+-substitution at A and B sites of Nd2Zr2O7: A study for plutonium incorporation in pyrochlores. J. Nucl. Mater. 2020, 539, 152342. [Google Scholar] [CrossRef]
- Luo, Q.H.; Howell, R.C.; Dankova, M.; Bartis, J.; Williams, C.W.; Horrocks, W.D.; Young, V.G.; Rheingold, A.L.; Francesconi, L.C.; Antonio, M.R. Coordination of Rare-Earth Elements in Complexes with Monovacant Wells-Dawson Polyoxoanions. Inorg. Chem. 2001, 40, 1894–1901. [Google Scholar] [CrossRef]
- Popov, V.; Menushenkov, A.; Ivanov, A.; Gaynanov, B.; Yastrebtsev, A.; d’Acapito, F.; Puri, A.; Castro, G.; Shchetinin, I.; Zheleznyi, M.; et al. Comparative analysis of long- and short-range structures features in titanates Ln2Ti2O7 and zirconates Ln2Zr2O7 (Ln = Gd, Tb, Dy) upon the crystallization process. J. Phys. Chem. Solids 2019, 130, 144–153. [Google Scholar] [CrossRef]
- Gao, Y.; Liu, Y.; Yu, H.; Zou, D. High-entropy oxides for catalysis: Status and perspectives. Appl. Catal. A 2022, 631, 118478. [Google Scholar] [CrossRef]
- Pan, Y.; Liu, J.X.; Tu, T.Z.; Wang, W.; Zhang, G.J. High-entropy oxides for catalysis: A diamond in the rough. Chem. Eng. J. 2023, 451, 138659. [Google Scholar] [CrossRef]
- Panchenkov, G.M.; Kolesnikov, I.M. On the Relationship between the Composition and Structure of Catalysts and Catalytic Properties. Russ. J. Phys. Chem. A 1970, 44, 900–903. [Google Scholar]
- Markova, E.B.; Lyadov, A.S.; Kurilkin, V.V. Features of propane conversion in the presence of SmVO3 and SmVO4. Russ. J. Phys. Chem. A 2016, 90, 1754–1759. [Google Scholar] [CrossRef]
- Jeon, N.; Choe, H.; Jeong, B.; Yun, Y. Propane dehydrogenation over vanadium-doped zirconium oxide catalysts. Catal. Today 2020, 352, 337–344. [Google Scholar] [CrossRef]


| Sample x | Stoichiometry | ICP-AES | EDS | nHO (TG at 200 °C) |
|---|---|---|---|---|
| 0 | Pr/Zr = 1/1 | Pr/Zr = 1/1.11 | Pr/Zr = 1/1.05 | 1.50 |
| 0.25 | Pr/Yb = 3/1 | Pr/Yb = 2.78/1 | 1.76 | |
| (Pr + Yb)/Zr = 1/1 | (Pr + Yb)/Zr = 1/0.95 | |||
| 0.5 | Pr/Yb = 1/1 | Pr/Yb = 1.10/1 | Pr/Yb = 0.98/1 | 2.29 |
| (Pr + Yb)/Zr = 1/1 | (Pr + Yb)/Zr = 1/0.95 | (Pr + Yb)/Zr = 1/1.12 | ||
| 0.75 | Pr/Yb = 1/3 | Pr/Yb = 1/3.11 | 2.47 | |
| (Pr + Yb)/Zr = 1/1 | (Pr + Yb)/Zr = 1/0.96 | |||
| 1 | Yb/Zr = 1/1 | Yb/Zr = 1.06/1 | Yb/Zr = 1.16/1 | 1.85 |
| Sample | Structure | Phase | Lattice | Unit Cell | L, nm | , % | R | R | S | |
|---|---|---|---|---|---|---|---|---|---|---|
| x | (sp. gr.) | % | Parameters, Å | Vol., Å | % | |||||
| 0 | Cubic | 100 | 10.7145(3) | 1230.03(5) | 0.3315 | 300(15) | 0.02(1) | 9.70 | 12.92 | 3.85 |
| () | ||||||||||
| 0.25 | Cubic | 100 | 10.6338(3) | 1202.45(5) | 0.3381 | 245(12) | 0.28(3) | 4.89 | 6.54 | 2.21 |
| () | ||||||||||
| 0.5 | Cubic | 73 | 10.6006(3) | 1191.22(5) | 0.3379 | >1000 | 1.24(5) | 6.70 | 8.49 | 1.15 |
| () | ||||||||||
| Cubic | 27 | 5.2431(3) | 114.13(5) | 325(30) | 0.60(4) | |||||
| () | ||||||||||
| 0.75 | Cubic | 100 | 5.2088(3) | 141.32(5) | 235(12) | 0.12(3) | 7.52 | 10.18 | 1.47 | |
| () | ||||||||||
| 1 | Rhomb. | 100 | 9.6641(9) | 724.18(12) | 104(5) | 0.27(7) | 6.03 | 8.92 | 5.30 | |
| () | 8.9528(9) |
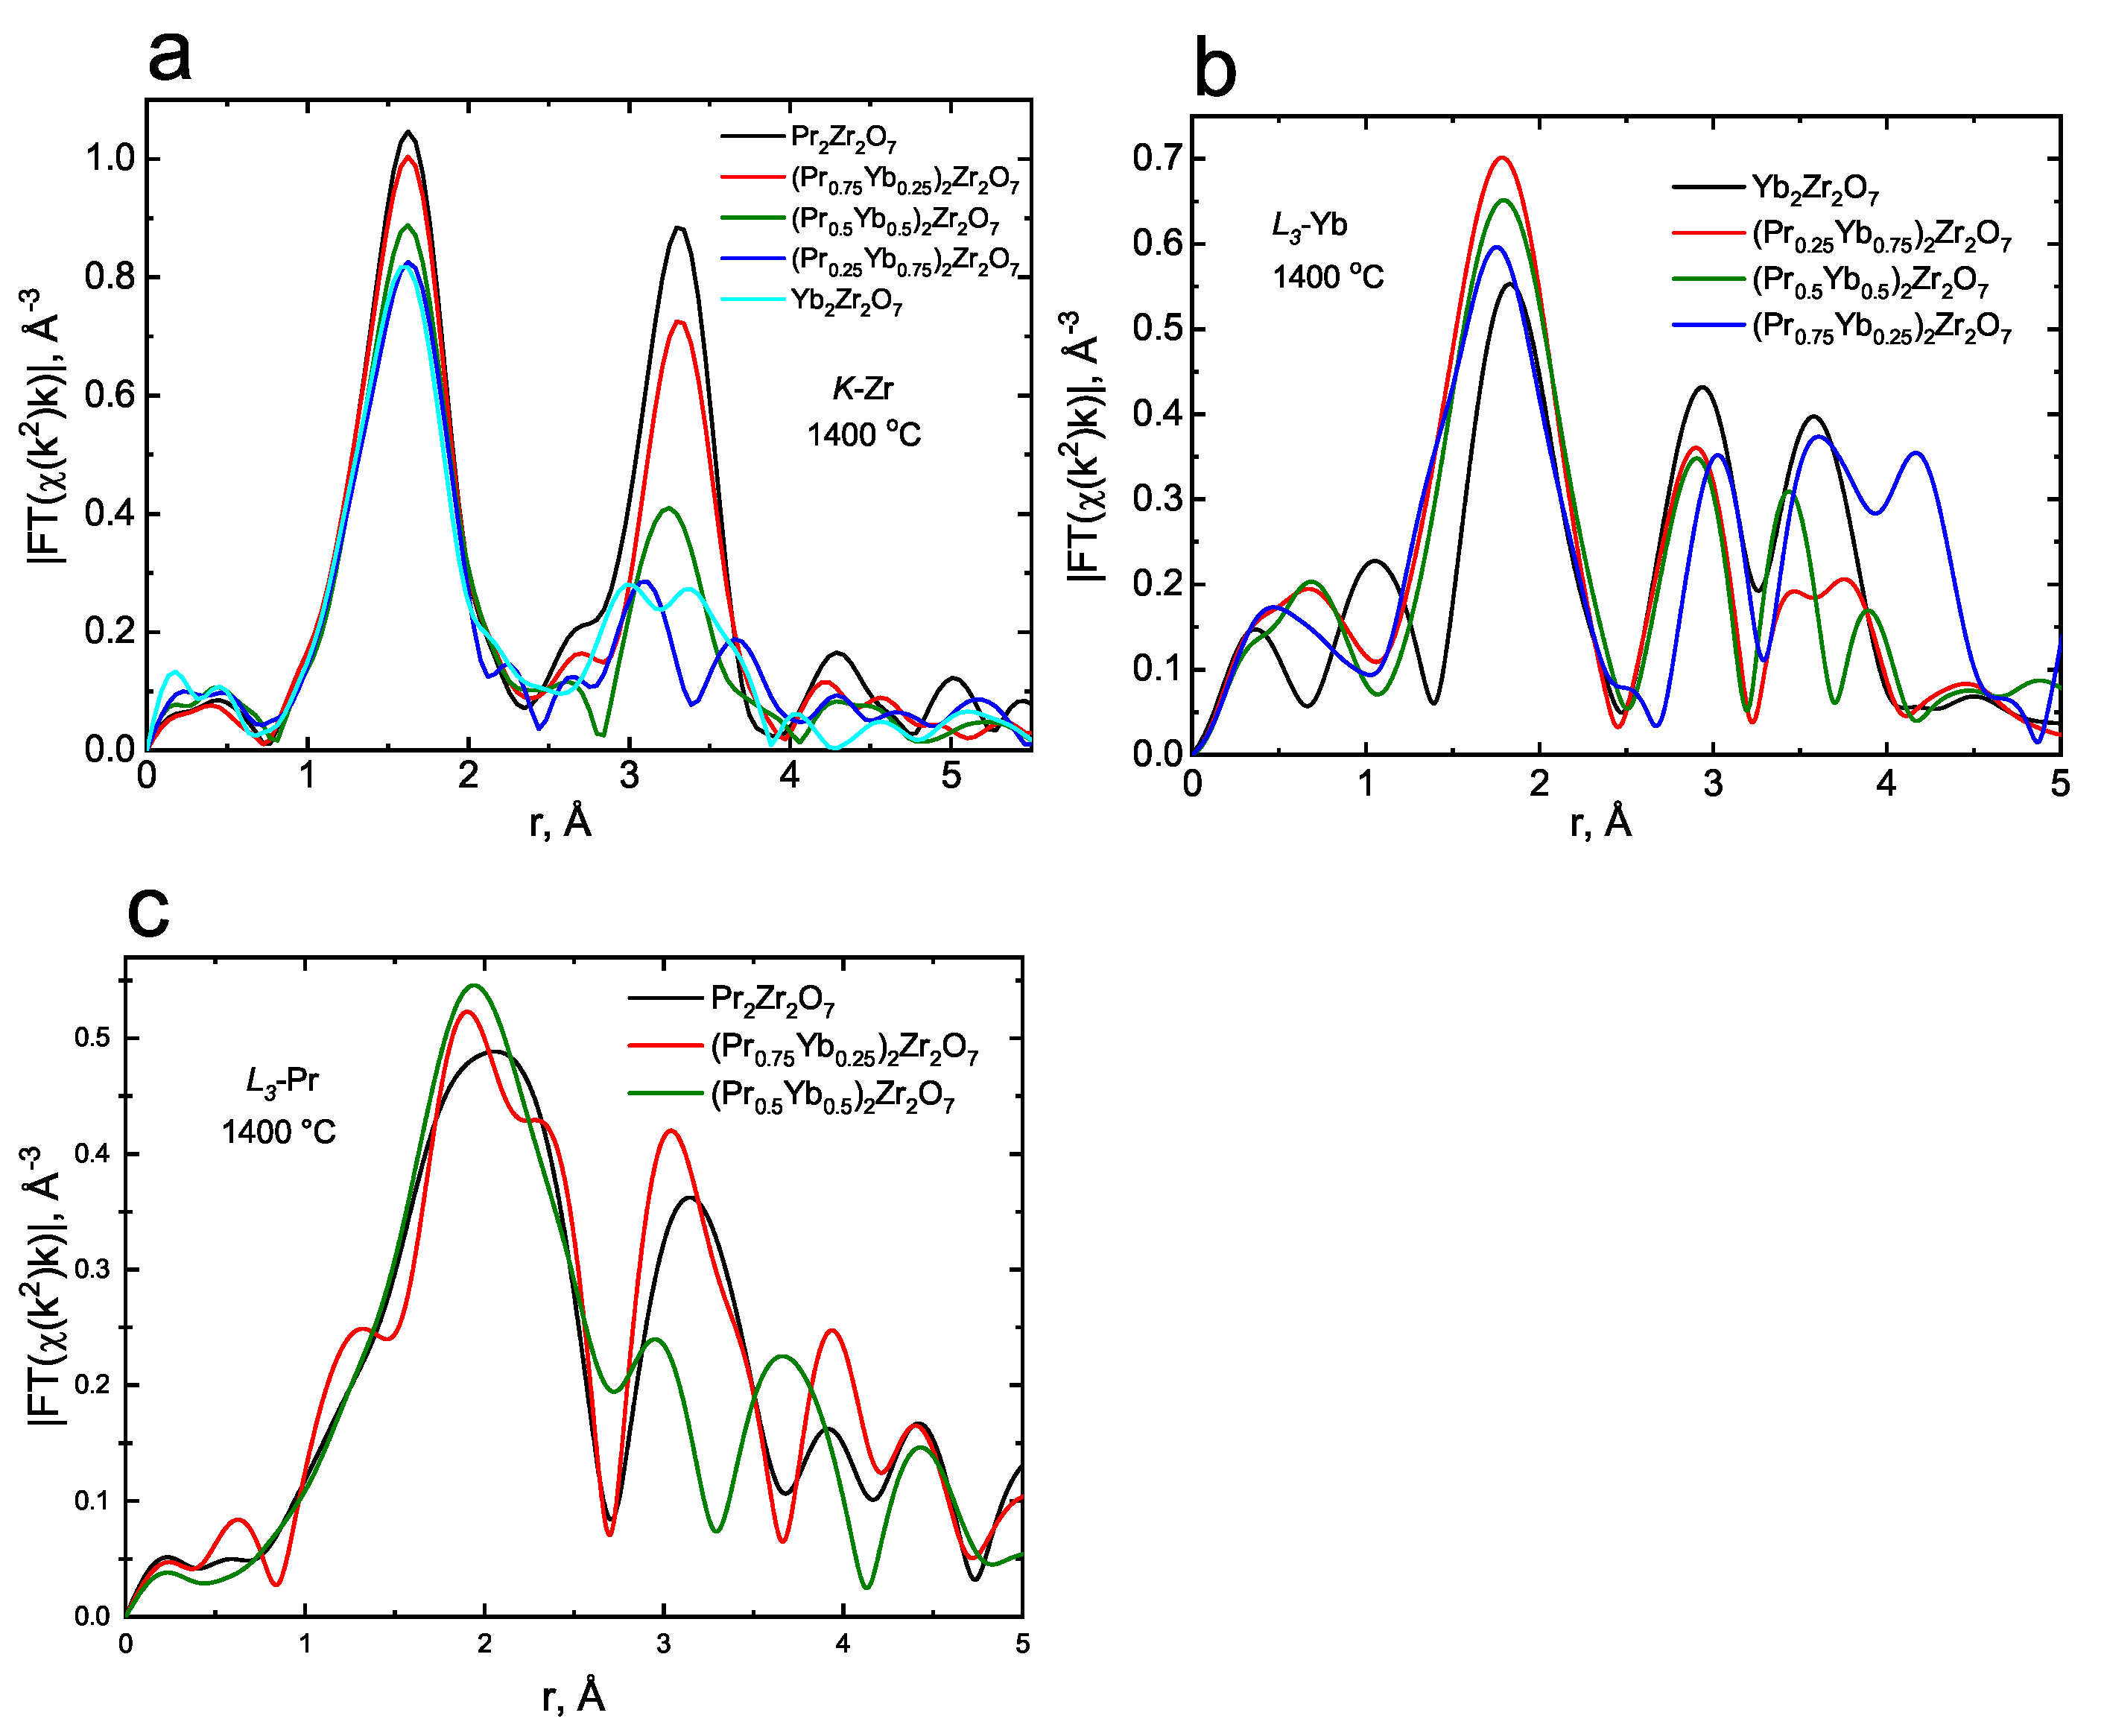
| K-Zr Edge | |||||
| Sample | R(Zr–O), Å | (Zr–O), Å2 | N (sp. gr.) | R, % | R, Å |
| PrZrO | 2.12(1) | 0.007(1) | 6 (Fdm) | 16 | 2.09(1) |
| (PrYb)ZrO | 2.11(1) | 0.006(1) | 6 (Fdm) | 15 | 2.10(1) |
| (PrYb)ZrO | 2.13(1) | 0.006(1) | 6.4 (Fdm | 13 | 2.07(1) |
| +Fmm) | 2.27(1) | ||||
| (PrYb)ZrO | 2.15(1) | 0.010(1) | 7 (Fmm) | 17 | 2.26(1) |
| YbZrO | 2.24(1) | 0.008(1) | 6 (R) | 15 | 2.13(1) |
| L-Yb edge | |||||
| Sample | R(Yb–O), Å | (Yb–O), Å2 | N (sp. gr.) | R, % | R, Å |
| (PrYb)ZrO | 2.14(1) | 0.008(1) | 2 (Fdm) | 9 | 2.05(1) |
| 2.31(1) | 0.004(1) | 6 | 2.31(1) | ||
| (PrYb)ZrO | 2.23(1) | 0.012(1) | 6.2 (Fdm | 12 | 2.07(1) |
| +Fmm) | 2.27(1) | ||||
| (PrYb)ZrO | 2.25(1) | 0.010(1) | 7 (Fmm) | 16 | 2.26(1) |
| YbZrO | 2.23(1) | 0.013(1) | 6 (R) | 9 | 2.28(2) |
| L-Pr edge | |||||
| Sample | R(Pr–O), Å | (Pr–O), Å2 | N (sp. gr.) | R, % | R, Å |
| PrZrO | 2.28(2) | 0.015(2) | 2 (Fdm) | 15 | 2.32(1) |
| 2.53(2) | 0.022(2) | 6 | 2.61(1) | ||
| (PrYb)ZrO | 2.16(2) | 0.015(2) | 2 (Fdm) | 16 | 2.30(1) |
| 2.44(2) | 0.019(2) | 6 | 2.55(1) | ||
| (PrYb)ZrO | 2.39(2) | 0.011(2) | 2 (Fdm) | 18 | 2.29(1) |
| 2.56(2) | 0.020(2) | 6 | 2.58(1) | ||
| (PrYb)ZrO * | 2.26(1) | ||||
| Catalyst | PAC, mmol/g | N, μmol/g | W cm/g | E, kJ/mol | S, m/g | r, nm |
|---|---|---|---|---|---|---|
| PrZrO | 63.3 | 288 | 0.004 | 27.2 | 11 | 11.7 |
| (PrYb)ZrO | 55.8 | 298 | 0.007 | 31.1 | 7 | 10.0 |
| (PrYb)ZrO | 48.5 | 304 | 0.008 | 33.1 | 6 | 9.6 |
| (PrYb)ZrO | 44.1 | 309 | 0.008 | 35.7 | 5 | 9.0 |
| YbZrO | 41.3 | 311 | 0.009 | 37.7 | 3 | 8.3 |
| Catalyst | TON | E, kJ/mol/g | CB, % |
|---|---|---|---|
| PrZrO | 4 | 89 | 97 |
| (PrYb)ZrO | 2.7 | 87 | 97 |
| (PrYb)ZrO | 2.5 | 86 | 98 |
| (PrYb)ZrO | 2.1 | 79 | 98 |
| YbZrO | 2 | 77 | 97 |
Disclaimer/Publisher’s Note: The statements, opinions and data contained in all publications are solely those of the individual author(s) and contributor(s) and not of MDPI and/or the editor(s). MDPI and/or the editor(s) disclaim responsibility for any injury to people or property resulting from any ideas, methods, instructions or products referred to in the content. |
© 2023 by the authors. Licensee MDPI, Basel, Switzerland. This article is an open access article distributed under the terms and conditions of the Creative Commons Attribution (CC BY) license (https://creativecommons.org/licenses/by/4.0/).
Share and Cite
Popov, V.V.; Markova, E.B.; Zubavichus, Y.V.; Menushenkov, A.P.; Yastrebtsev, A.A.; Gaynanov, B.R.; Chernysheva, O.V.; Ivanov, A.A.; Rudakov, S.G.; Berdnikova, M.M.; et al. Influence of Synthesis Conditions on the Crystal, Local Atomic, Electronic Structure, and Catalytic Properties of (Pr1−xYbx)2Zr2O7 (0 ≤ x ≤ 1) Powders. Crystals 2023, 13, 1405. https://doi.org/10.3390/cryst13091405
Popov VV, Markova EB, Zubavichus YV, Menushenkov AP, Yastrebtsev AA, Gaynanov BR, Chernysheva OV, Ivanov AA, Rudakov SG, Berdnikova MM, et al. Influence of Synthesis Conditions on the Crystal, Local Atomic, Electronic Structure, and Catalytic Properties of (Pr1−xYbx)2Zr2O7 (0 ≤ x ≤ 1) Powders. Crystals. 2023; 13(9):1405. https://doi.org/10.3390/cryst13091405
Chicago/Turabian StylePopov, Victor V., Ekaterina B. Markova, Yan V. Zubavichus, Alexey P. Menushenkov, Alexey A. Yastrebtsev, Bulat R. Gaynanov, Olga V. Chernysheva, Andrei A. Ivanov, Sergey G. Rudakov, Maria M. Berdnikova, and et al. 2023. "Influence of Synthesis Conditions on the Crystal, Local Atomic, Electronic Structure, and Catalytic Properties of (Pr1−xYbx)2Zr2O7 (0 ≤ x ≤ 1) Powders" Crystals 13, no. 9: 1405. https://doi.org/10.3390/cryst13091405