
Analysis of Diffracted Intensities from Finite Protein Crystals with Incomplete Unit Cells

1
ARC Centre of Excellence in Advanced Molecular Imaging, School of Physics, University of Melbourne, Parkville, Victoria 3010, Australia
2
School of Physics, University of Melbourne, Parkville, Victoria 3010, Australia
*
Author to whom correspondence should be addressed.
Crystals 2017, 7(7), 220; https://doi.org/10.3390/cryst7070220
Submission received: 31 May 2017
/
Revised: 7 July 2017
/
Accepted: 8 July 2017
/
Published: 14 July 2017
(This article belongs to the Special Issue Development of Computational Methods for Structure Determination of Biological Macromolecules)
Abstract
:Developments in experimental techniques in micro electron diffraction and serial X-ray crystallography provide the opportunity to collect diffraction data from protein nanocrystals. Incomplete unit cells on the surfaces of protein crystals can affect the distribution of diffracted intensities for crystals with very high surface-to-volume ratios. The extraction of structure factors from diffraction data for such finite protein crystals sizes is considered here. A theoretical model for the continuous diffracted intensity distribution for data merged from finite crystals with two symmetry-related sub-units of the conventional unit cell is presented. This is used to extend a whole-pattern fitting technique to account for incomplete unit cells in the extraction of structure factor amplitudes. The accuracy of structure factor amplitudes found from this whole-pattern fitting technique and from an integration approach are evaluated.
1. Introduction
Serial X-ray crystallography (SXC) has developed in recent years at X-ray free-electron laser (XFEL) [1] and synchrotron [2,3] facilities, enabling the study of protein crystals that are significantly smaller than those used in conventional X-ray protein crystallography. Crystal sizes for SXC experiments can be in the micron to submicron regime due to the serial nature of these experiments, while conventional X-ray crystallography experiments require macroscopic crystals of the order of 100 m to withstand the radiation dose delivered during data collection. Submicron protein crystals are also used in micro electron diffraction (microED) experiments [4,5]. Protein crystal dimensions involving just a few tens of unit cells are desirable for electron experiments [6]; this is required to reduce the number of multiple scattering events [7].
The distribution of diffraction data from finite, submicron protein crystals departs from that encountered in established X-ray crystallography diffraction methods. Small crystals that are wholly illuminated by incident radiation act as finite diffracting objects and can produce broad peak distributions with widths that are inversely proportional to crystal size [8]. A range of other factors can affect the width of diffraction peaks [9], with limitations on the crystal size ranges for which size estimation relationships can be applied [10]. Nevertheless, the broadening of diffraction spots from finite protein crystals has been observed in SXC experiments and the collection of data from very small crystals has been achieved [1,11]. It was shown in work preceding the first SXC experiments performed at XFELs that powder diffraction data could be collected from submicron membrane protein crystals (>100 nm) [12] with the peak widths of diffraction rings used to estimate average crystal mosaicity. The first SXC experiment performed at the Linac Coherent Light Source (LCLS) reported the collection of diffraction data from single membrane protein crystals, some of which were estimated to have dimensions of fewer than 10 unit cells (∼300 nm) [1]. The crystal size and beam coherence allowed for the observation of diffraction fringes between Bragg locations. Extended peak distributions from the merging of SXC diffraction data from cathepsin B crystals containing submicron dimensions have also been demonstrated [11], producing a continuous diffracted intensity distribution.
Renewed consideration of crystal size effects is required for the analysis of data from SXC and microED experiments that use very small crystals (<500 nm). The problem of distributions of protein molecules on crystal surfaces is considered here with so-called ‘incomplete’ or ‘partial’ unit cells. In the case of protein crystals, the smallest translationally repeating arrangement of a crystal, the unit cell, is typically formed by several symmetry-related protein molecules. This is a mathematically convenient construction for which a number of equivalent selections can be made for crystals whose dimensions are very large compared with those of the unit cell. The boundaries of a crystal surface need not, however, be defined by the boundaries of the conventional unit cell; while the crystal is bounded by intact protein molecules, this does not require the formation of complete unit cells. A model of a protein crystal with incomplete occupation of external unit cells is more realistic. The presence of incomplete unit cells on crystal surfaces can be expected to have an effect upon the distribution of diffracted intensities when the crystal acts as a finite object. It has been noted [13] that the presence of incomplete unit cells may not affect diffracted intensities situated exactly at Bragg positions, yet will alter diffracted intensities in inter-Bragg locations. Here we consider the accuracy of extracted structure factor amplitudes from finite crystals. While structure factor amplitudes are associated with Bragg locations, the estimation of structure factor amplitudes from experimental data typically requires the characterisation of diffraction peak spots. Extended diffraction peak distributions arising from finite crystal size effects may then be expected to affect the accuracy of structure factor amplitudes found from data collected from finite crystals containing incomplete unit cells. This effect is negligible for macroscopic crystals for which both the surface-to-volume ratios are low and crystal-size peak broadening is absent.
The implications of incomplete unit cells in protein crystals have been considered previously for the potential direct phasing of SXC data. This application was first proposed by Spence et al. [14] for finite crystals composed of whole unit cells. They demonstrated that it may be feasible to access the continuous scattering factor for the unit cell with diffracted intensity distributions formed from finite crystals (assuming high dynamic ranges of detector images). This might be achieved by characterising the average Bragg peak shape distributions and separating these from the merged distributions. Coherent diffractive imaging techniques [15,16] might then be used for the determination of the unit cell structure. This was later demonstrated with experimental data using artificial targets [17]. Other work has considered this with the inclusion of incomplete unit cells [13,18,19,20], for which a common definition of the underlying repeating atomic structure of the crystal is no longer satisfied. It has been shown by Liu et al. [18] that the direct phasing approach of [14] may be used if it is assumed that a single definition of the unit cell is preferentially formed. Kirian et al. [13] presented modifications to the approach of [14] for random distributions of protein molecules on crystal surfaces using a sub-lattice description for each molecular sub-unit, a similar approach also employed here. It was shown through simulations [13] that the reconstruction algorithm could be modified using appropriate diffracted intensity constraints for the solution of the protein structure.
In this work, we consider the influence of incomplete unit cells on the reliability of extracted structure factor amplitudes for the conventional analysis of serial diffraction data from finite crystals. Our model shows that the contribution of incomplete unit cells on diffracted intensity distributions is most significant between Bragg locations. Extended peak distributions within continuous diffraction distributions are produced in the finite crystal size limit. Peak integration methods for the extraction of structure factor amplitudes include the contributions of diffracted intensities in selected regions around Bragg locations and, as a consequence, may introduce some inaccuracies due to incomplete unit cells on crystal surfaces of finite crystals.
We present a study of the accuracy of structure factor amplitudes extracted using peak integration methods compared with a new technique based on whole-pattern fitting analysis [21]. Whole-pattern fitting analysis of serial crystallography data is a technique for the iterative estimation of structure factor amplitudes via the fitting of a continuous model function to the observed diffracted intensity distribution. Similar approaches are well-established in X-ray powder diffraction analysis to extract structure factor amplitudes from extended and overlapping peak distributions arising in one-dimensional powder diffraction patterns [22,23]. Diffraction data merged from finite protein crystals from SXC and microED exhibit similarities to powder diffraction data due to the extended diffracted intensities distributions that may be formed by crystal size effects and additional crystal and beam characteristics. In contrast, the data can be merged into higher dimensional space due to the collection of data from separate crystals. This has stimulated the development of whole-pattern fitting analysis in higher dimensional space [21]. Initial studies involved simulated, finite crystals composed entirely of whole unit cells. Here, we demonstrate the extension of this approach to incorporate the presence of incomplete unit cells on crystal surfaces.
2. Materials and Methods
2.1. Construction of a Model for the Average Diffracted Intensity Distribution
The electron density of finite protein crystal, , can be defined as the convolution of the electron density of the unit cell, , and a finite lattice function defining the shape, size and periodicity of the crystal, , defined by
An extended formalism was proposed by Kirian et al. [13] to account for the presence of differing numbers of sub-units within the conventional unit cell. This approach is adopted here and is expressed for the simplest case of two sub-units as
where and are the electron densities of each of the sub-units (labelled as types 1 and 2 here for convenience) and and are the finite sub-lattices describing the positions of sub-units of type 1 and 2, respectively.
SXC experiments on finite protein crystals require the merging of diffraction data from large quantities of crystals to address experimental limitations imposed by radiation damage and for the collection of three-dimensional structural information. Diffraction data collected in microED experiments have also been reported to be merged from multiple crystals in some instances [24,25]. As derived by Kirian et al. [13], the diffracted intensity distribution averaged from n finite crystals can be expressed as
where and are the scattering factors for each of two sub-units (types 1 and 2, respectively) and denotes the ensemble average from n finite protein crystals. and are the average of the squared magnitudes of the Fourier transforms of the sub-lattices, and , respectively. Equation (3) assumes that the electron density of the sub-units is constant across the set of merged crystals (or implicitly refers to an average electron density), yet allows for variation in crystal size and shape across the crystal ensemble.
Following Equation (3), we extend the formulation to include a generalised lattice-transform term, , and correlation coefficients between contributions from sub-units, leading to
where the terms are correlation coefficients between sub-units of types i and j (). These terms are equal to unity for identical sub-unit types, yet otherwise introduce a term that is dependent on the scattering vector (). This is demonstrated for a two-dimensional parallelogram crystal in the Appendix A.
The scattering factor of the conventional unit cell is bandwidth-limited function. We have previously [21] used this observation to express the scattering factor of the unit cell via interpolation with the shape transform of the unit cell at the Bragg sampling rate. The scattering factors from separate sub-units of the unit cell can be similarly characterised using
where denote the contributions from the two symmetry-related components of a whole unit cell, is the shape transform of the unit cell (i.e., the Fourier transform of a binary function defining the extent and boundary), centred on the Bragg locations, , and the summation is performed over Bragg reflections, k. It should be noted that Equation (5) is an extension of the model of Guinier [26] for the electron density of a finite crystal that assumes that the electron density within a unit cell is truncated at the boundaries of the cell. Our model extends this to allow for the absence of electron density sub-units within these boundaries. It has been shown by Ino and Minami [27] that other definitions of the electron density of a finite crystal can be made from consideration of the centring of atoms or, in this case, molecular clusters within the unit cell. This would introduce a new form of the structure factor amplitude, , with dependence on the scattering vector, . The inclusion of this dependence of the scattering factor amplitude may improve the performance of whole-pattern modeling in future work.
Assuming the validity of Equation (5), it follows that Equation (4) can be recast into the form
where is an intensity parameter corresponding to the whole unit cell case,
and
2.1.1. The Whole-Pattern Fitting Model
In this section, the form of Equation (6) is derived and the range of validity of its approximations is discussed. This expression is used later to model the diffracted intensity distribution formed from simulated finite protein crystals with incomplete unit cells on crystal surfaces during the application of whole-pattern fitting analysis. We have previously demonstrated the feasibility of whole-pattern fitting analysis for the improved extraction of structure factor amplitudes using finite crystals [21]. In our previous work, it was shown that the diffracted intensity distribution from ideal finite crystals with whole unit cells can be written as
where is the average of the Fourier transforms of the shape functions defining the crystal dimensions and boundaries. This can be equivalently expressed as
where is the shape transform of the unit cell (as in Equation (5)) and is the lattice-transform term. Here, a similar approach is used to account for the presence of incomplete unit cells.
Substitution of the interpolation expression for the scattering factors of separate sub-units (Equation (5)) can be made into the average diffracted intensity distribution given in Equation (4), yielding
Several definitions are made in the following to recast the continuous diffracted intensity distribution in terms of conventional crystallographic intensities at Bragg positions. We begin by introducing the definitions
and
into the diffracted intensity distribution, Equation (11), to obtain
or
where is the conventional crystallographic intensity at Bragg location, , (Equation (7)) and weights the second term and differs from the conventional crystallographic intensity. The and contributions can be defined by
and
Alternatively, these contributions can be expressed in terms of the shape transforms of the unit cell and the generalised lattice-transform as
and
Both Equations (19) and (20) contain contributions from . This is also present in the model function for the diffracted intensity distribution, Equation (10), that we have demonstrated and used previously for crystals composed of whole unit cells. In our previous study [21], we chose to model these contributions with analytical peak-shape functions. Using the same approach here, Equations (19) and (20) may be equivalently written as
and
where is a peak-shape function for the reflection.
The correlation coefficient, , is considered in the Appendix A for a random occupancy model of a two-dimensional parallelogram crystal. It is shown in the Appendix A that, under certain assumptions for the distribution electron density sub-units on crystal surfaces, the correlation coefficient can be given as
where a and b are the unit cell parameters defining the two-dimensional crystal. As a consequence, and will exhibit local maxima in different regions of -space, with being prominent at Bragg locations and at midpoints between Bragg locations. This behaviour motivates the approximation that neglects terms weighted by for the task of estimating structure factor amplitudes, which are defined at Bragg positions. However, it is expected that for other applications, such as the direct phasing of data from finite crystals [14], these contributions should be retained if using the formulation presented here.
The diffracted intensity distribution from finite crystals with external incomplete unit cells can now be expressed as
which is equivalent to Equation (6). This result (Equation (6)) is used in the whole-pattern fitting analysis presented here. This form casts the diffracted intensity distribution from incomplete unit cells in terms of the intensities of Bragg reflections corresponding to the whole unit cell case, (Equation (7)). Moreover, comparison of Equations (6) and (10) indicate that incomplete unit cells are incorporated within this formulation simply by the inclusion of the term, .
2.1.2. Crystal Dimensions
The dimensions of a crystal determine whether the inclusion of the modification term, , introduces differences to the diffracted intensity distributions. This is considered here for the one-dimensional behaviour of diffracted intensity profiles with respect to lattice dimensions.
Diffracted intensity profiles were calculated for collections of one-dimensional lattices. The lattice transform contribution of a conventional one-dimensional lattice can be expressed as,
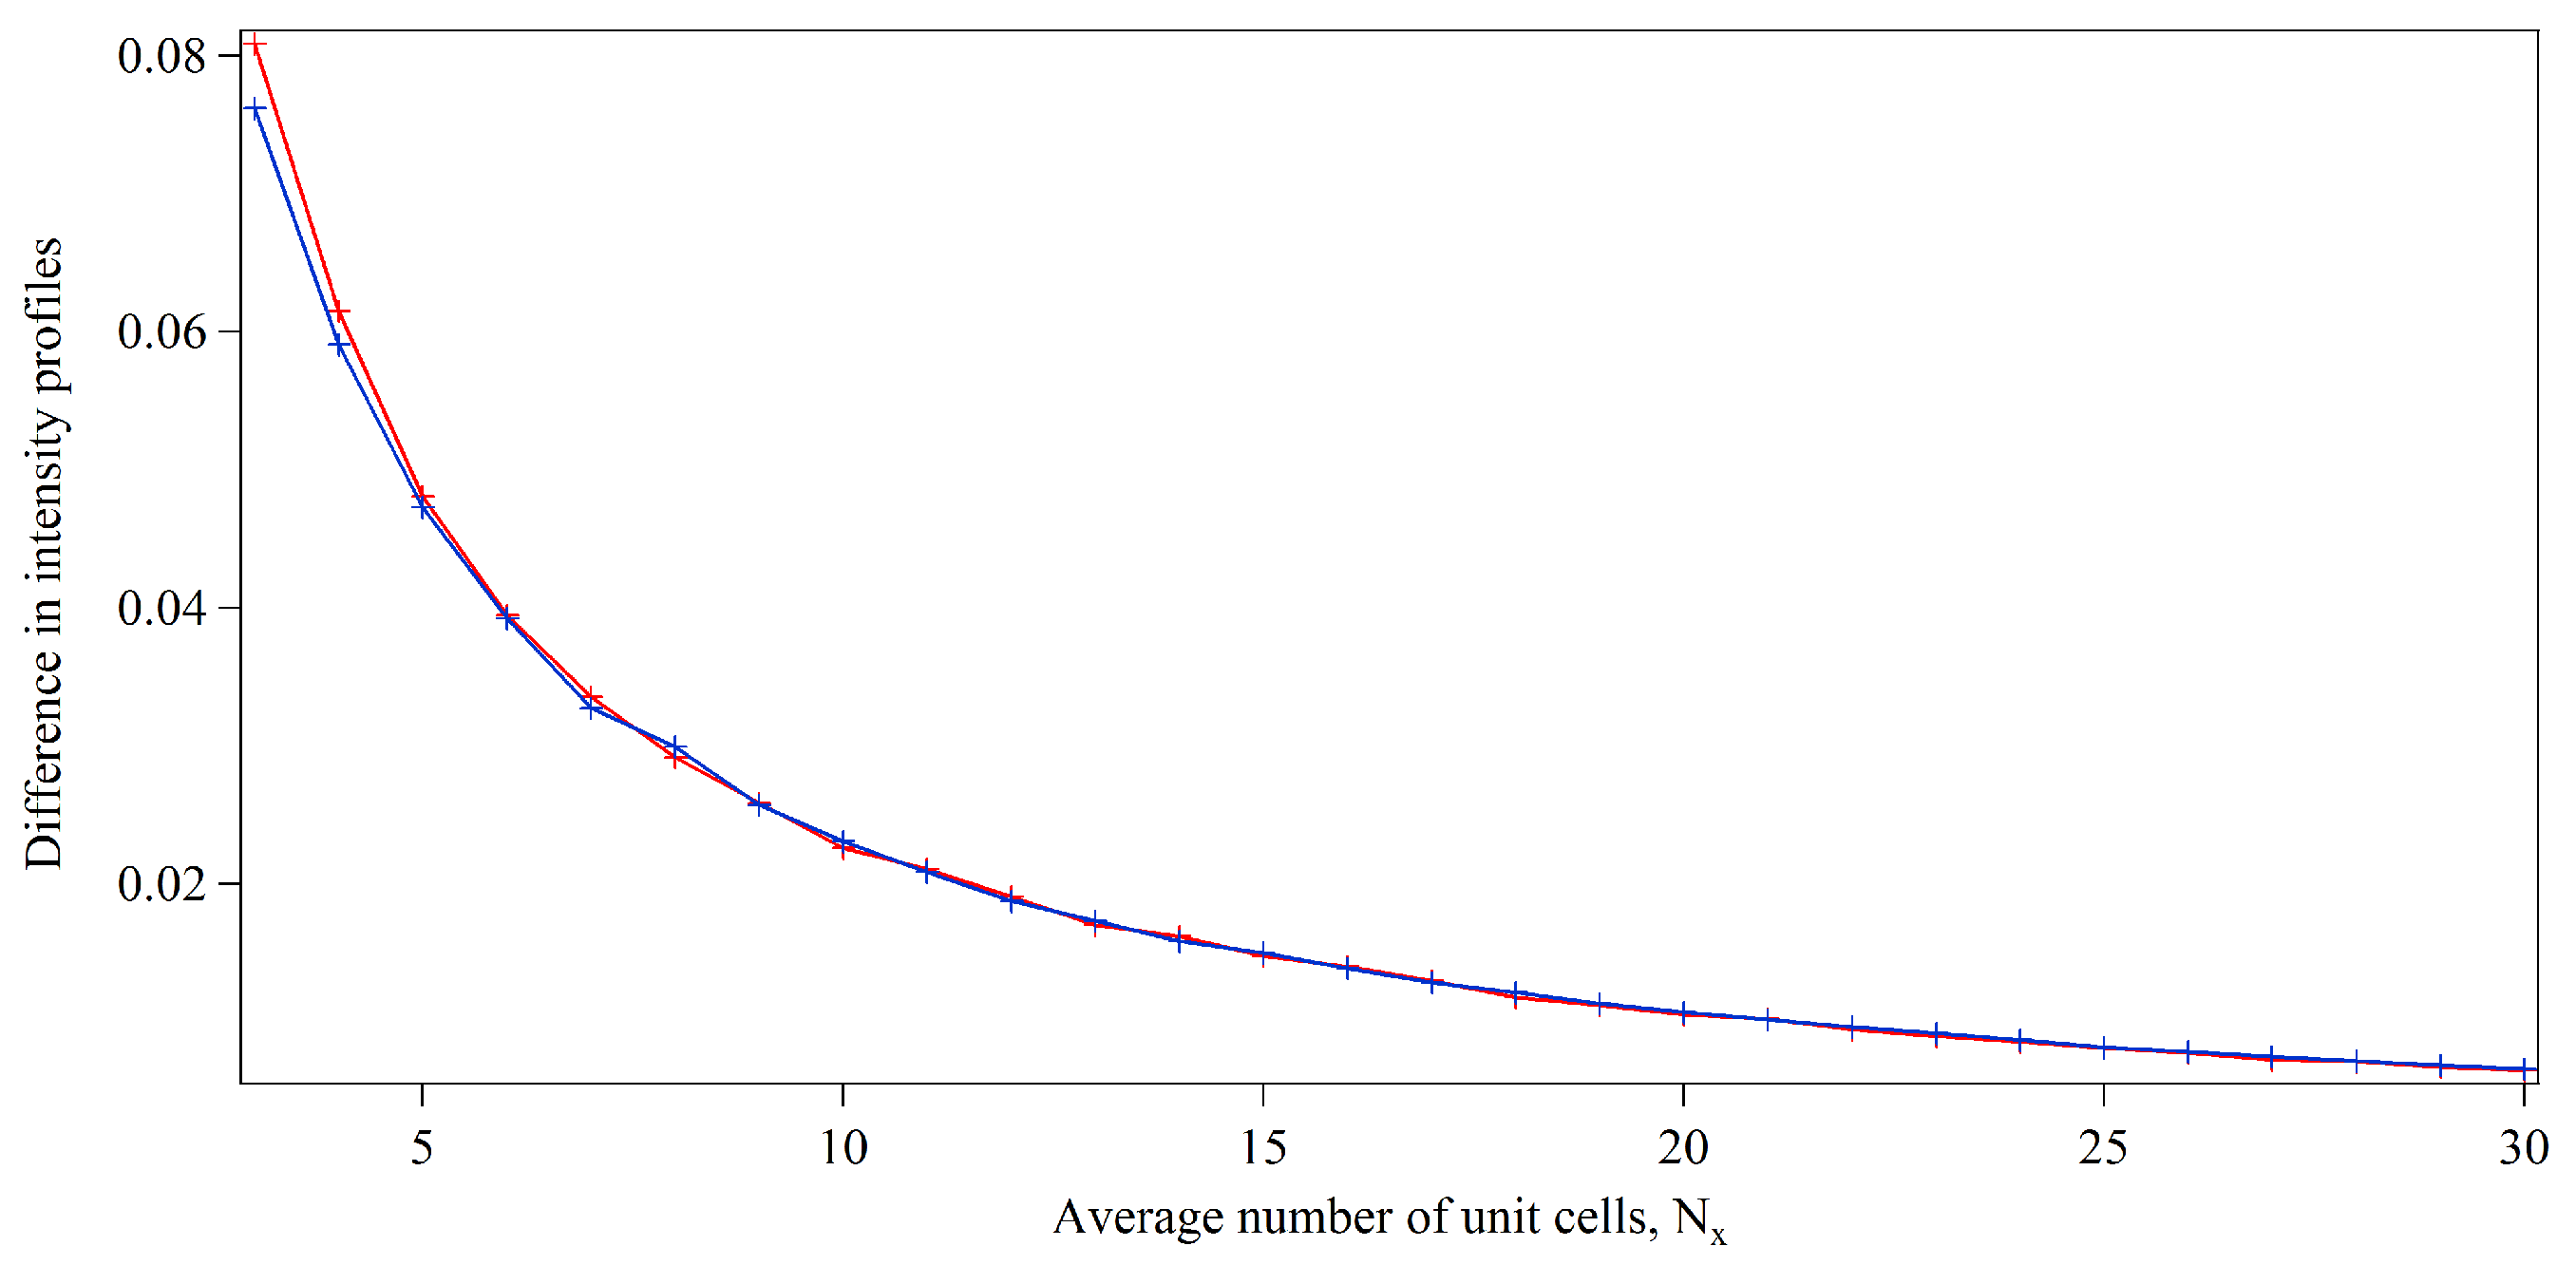
where is the number of unit cells along the crystal direction defined by a. Two sets of 1000 one-dimensional lattices were generated with their dimensions defined by Gaussian distributions with a standard deviation of 25% of the mean dimension and defined by lognormal distributions. For each probability distribution, the profile of a single one-dimensional peak was formed by merging the contributions defined by Equation (25) for each simulated lattice. This represents an average peak-shape, , for the crystal size distribution that follows Equation (9) for whole unit cells. The average peak-shape formed with the introduction of was also calculated and is denoted here by . Differences in the one-dimensional profiles were quantified by the metric,
Figure 1 shows that the metric indicates that the contribution of our term to model the presence of incomplete unit cells rapidly becomes negligible as the average number of unit cells increases. Our one-dimensional analysis shows that the weighted sum of differences between the intensity profiles drops below 2% when the average length of the one-dimensional lattices reaches 12 unit cells for both Gaussian and lognormal size distributions. Such crystal dimensions are relevant for microED experiments [6] and were also present in the first SXC experiment performed at the LCLS [1]. Protein crystals with comparable unit cell dimensions correspond to crystal sizes of 25–500 nm, based on analysis of the average unit cell dimensions of protein structures deposited in the Protein Data Bank [28]. Our analysis suggests that limited accuracy may be expected in the extraction of structure factor amplitudes from merged diffraction data sets from very small protein crystals, exhibiting at least one dimension of the order of a few unit cells, if the presence of incomplete unit cells is neglected. Otherwise, the presence of incomplete unit cells may have little effect on the outcome of the data analysis. Our model assumes the random occupancy of surface sites by protein molecules (see Appendix A). Different dependencies of intensity profiles with respect to crystal sizes may arise for other probability distributions of incomplete unit cells or for greater numbers of sub-units.
2.2. Simulations
Simulations were performed to examine the accuracy of structure factor amplitudes with the presence of incomplete unit cells using a simple model for the attachment of electron density sub-units. A hemagglutinin HA1 domain structure from the H3N2 influenza virus A (Perth, 2009) [29] was selected as the test protein structure. This was treated as containing two rigid-body sub-units within the conventional unit cell, defined by the two symmetry operators of the space group symmetry of the reported crystal structure (PDB ID: 4WE6). Each of the two sub-units contains two biological assemblies of electron density that have been assumed to attach as rigid-body units of electron density within simulations. Protein crystal structures with two rigid-body sub-units within the unit cell are the simplest case that can be considered for the presence of incomplete unit cells and have been the primary focus of other studies on this topic [13,18]. At the time of writing, the second most frequent space group of protein structures deposited in the Protein Data Bank [30] (http://www.rcsb.org) is defined by two symmetry operators and as such may frequently contain two sub-units, depending on the quantities and attachment characteristics of protein molecules within the asymmetric unit. It is anticipated that the approach outlined here can be extended to higher numbers of sub-units within the unit cell with the introduction of extra correlation coefficients between sub-unit types.
Calculation of the merged diffracted intensity distributions was performed according to Equation (3), with separation of the continuous scattering factor distributions for each of the two rigid-body sub-units. The finite lattice transforms of the sub-lattices assigned to each sub-unit type were calculated individually. The simulation of these finite lattice transforms was performed through several steps. First, an ideal two-dimensional crystal composed of whole unit cells was calculated. The dimensions of the crystal were sampled independently in orthogonal directions from lognormal distributions. Two cases were considered in this study—sets of crystals with average bulk dimensions of 15 and 5 in x and y directions, respectively, and sets of crystals with average bulk dimensions of 30 and 10 in x and y directions, respectively. Dimensions of such sizes are particularly relevant in microED experiments [4,5], for which sizes of the order of hundreds of nanometres or lower may be required to reduce the effects of multiple scattering [7]. The crystal dimensions in the real space x and y directions were selected randomly for each crystal and independently in these directions, thus introducing variation in both crystal size and shape. Secondly, finite sub-lattices for each sub-unit were created for the ideal crystal to satisfy the shape and size selected. Incomplete unit cells were then introduced by allowing sites within one unit cell thickness of the crystal surface to be independently filled for each sub-lattice. At this point, the sub-lattice distributions differed from each other. Next, the Fourier transform of each of the finite lattices, and , and their product, , were calculated. These distributions were stored and the process was then repeated for total number of 1000 crystals for each crystal set. Finally, the merged diffracted intensity distributions were calculated according to Equation (3).
2.2.1. Crystal Surfaces
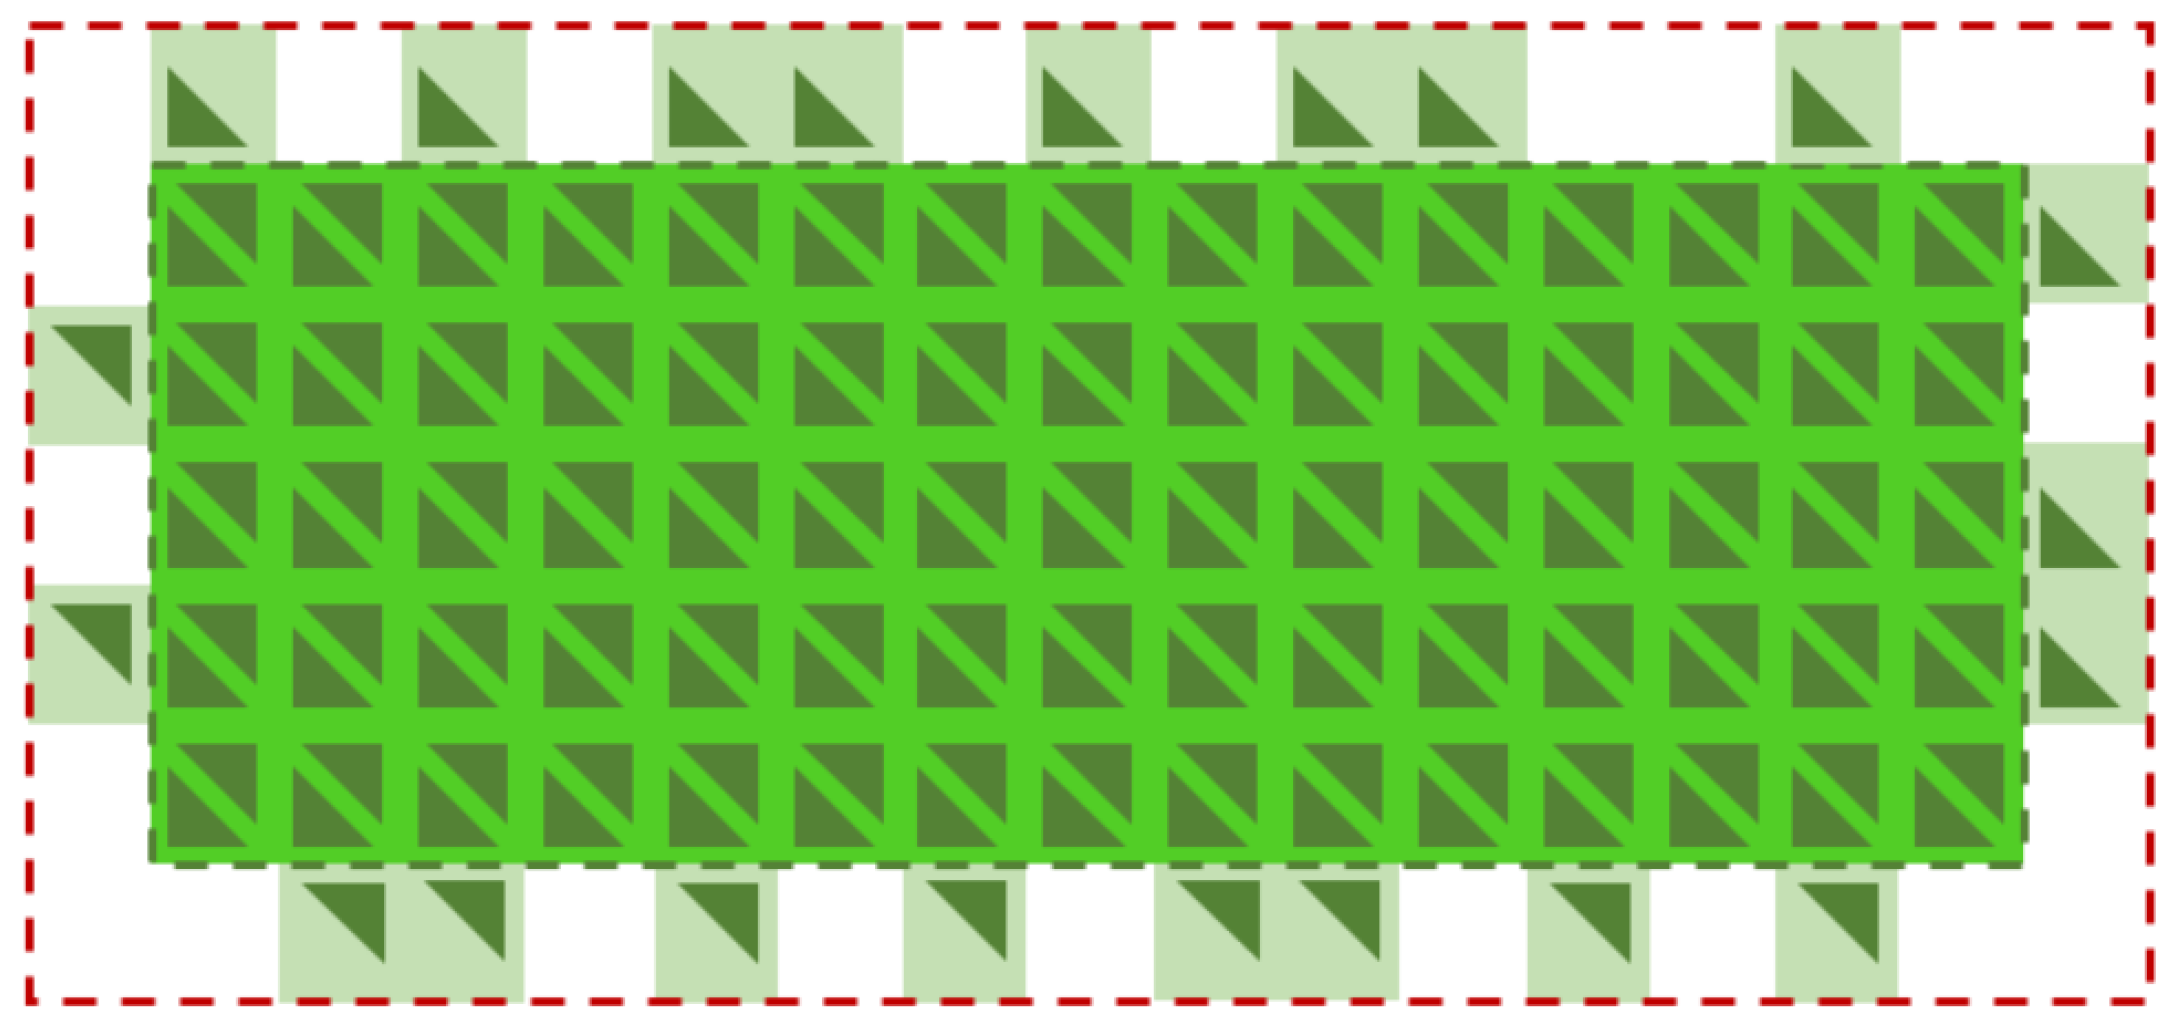
A simplified model was used to generate the incomplete unit cell distributions within the simulation study. The occupation of surface sites were randomly distributed by the sampling of uniform probability distributions to satisfy the selected occupancy level for each set of simulated crystals. Similar random occupancy models have been used in the literature for incomplete unit cells [13,18,19]. We have limited our work to the use of a random occupancy model for the construction of crystal surfaces, yet alternative models could be incorporated within this analysis with different forms of the correlation coefficient, , within Equation (6)). Attachment rules were imposed to avoid the occurrence of electron density voids on the crystal surface, similarly to Liu et al. [18]. It was imposed that the attachment of each rigid-body sub-unit was restricted to opposing surfaces in orthogonal directions. This is not applicable to all protein structures as surface populations might depend on a range of factors, including the positioning of crystal contacts within the standard unit cell and the crystal geometry. In other cases, both incomplete and whole unit cells could potentially form within the distribution of protein molecules on the crystal surface. Figure 2 provides a schematic of a finite two-dimensional crystal with incomplete unit cells that follows our simple model. Several sets of crystals were simulated that were defined by varying occupancy levels of surface sites, including 0%, 10%, 30% and 50% occupancy levels.
3. Results and Discussion
The extraction of structure factor amplitudes with whole-pattern fitting analysis was tested on serial diffraction data from simulated finite protein crystals containing incomplete unit cells. The accuracy of the extracted structure factors was assessed by the conventional crystallographic R-factor
where is the extracted structure factor amplitude of the reflection and is the structure factor amplitude of the reflection calculated from the information deposited in the PDB entry.
In all cases, each set of structure factor amplitudes was independently scaled and assessed against the atomic model of given by the PDB entry (4WE6 [29]) using SFCHECK [31], which is available within the software suite CCP4 [32]. SFCHECK estimates overall thermal factors from Wilson statistics [33] and from the Patterson distribution [34]. The scaling of observed structure factor amplitudes is then performed by SFCHECK using the Patterson origin peak and the overall thermal factor.
3.1. Integration Analysis for Incomplete Unit Cells
Structure factor amplitudes from SXC data are typically extracted using integration methods, known as Monte-Carlo integration [35]. This approach estimates structure factor amplitudes through the averaging of variations in crystal parameters such as crystal shape, size and quality and in experimental parameters. Structure factor amplitudes are extracted through the integration of intensities in restricted regions around Bragg locations. This can be performed on individual diffraction patterns with the factors from equivalent peaks combined to form the fully integrated peak contributions or following the merging of diffraction patterns into a single diffracted intensity distribution [11]. We have applied this to merged diffracted intensity distributions formed via simulations characterised by selected average crystal dimensions with varying occupancy levels of incomplete unit cells.
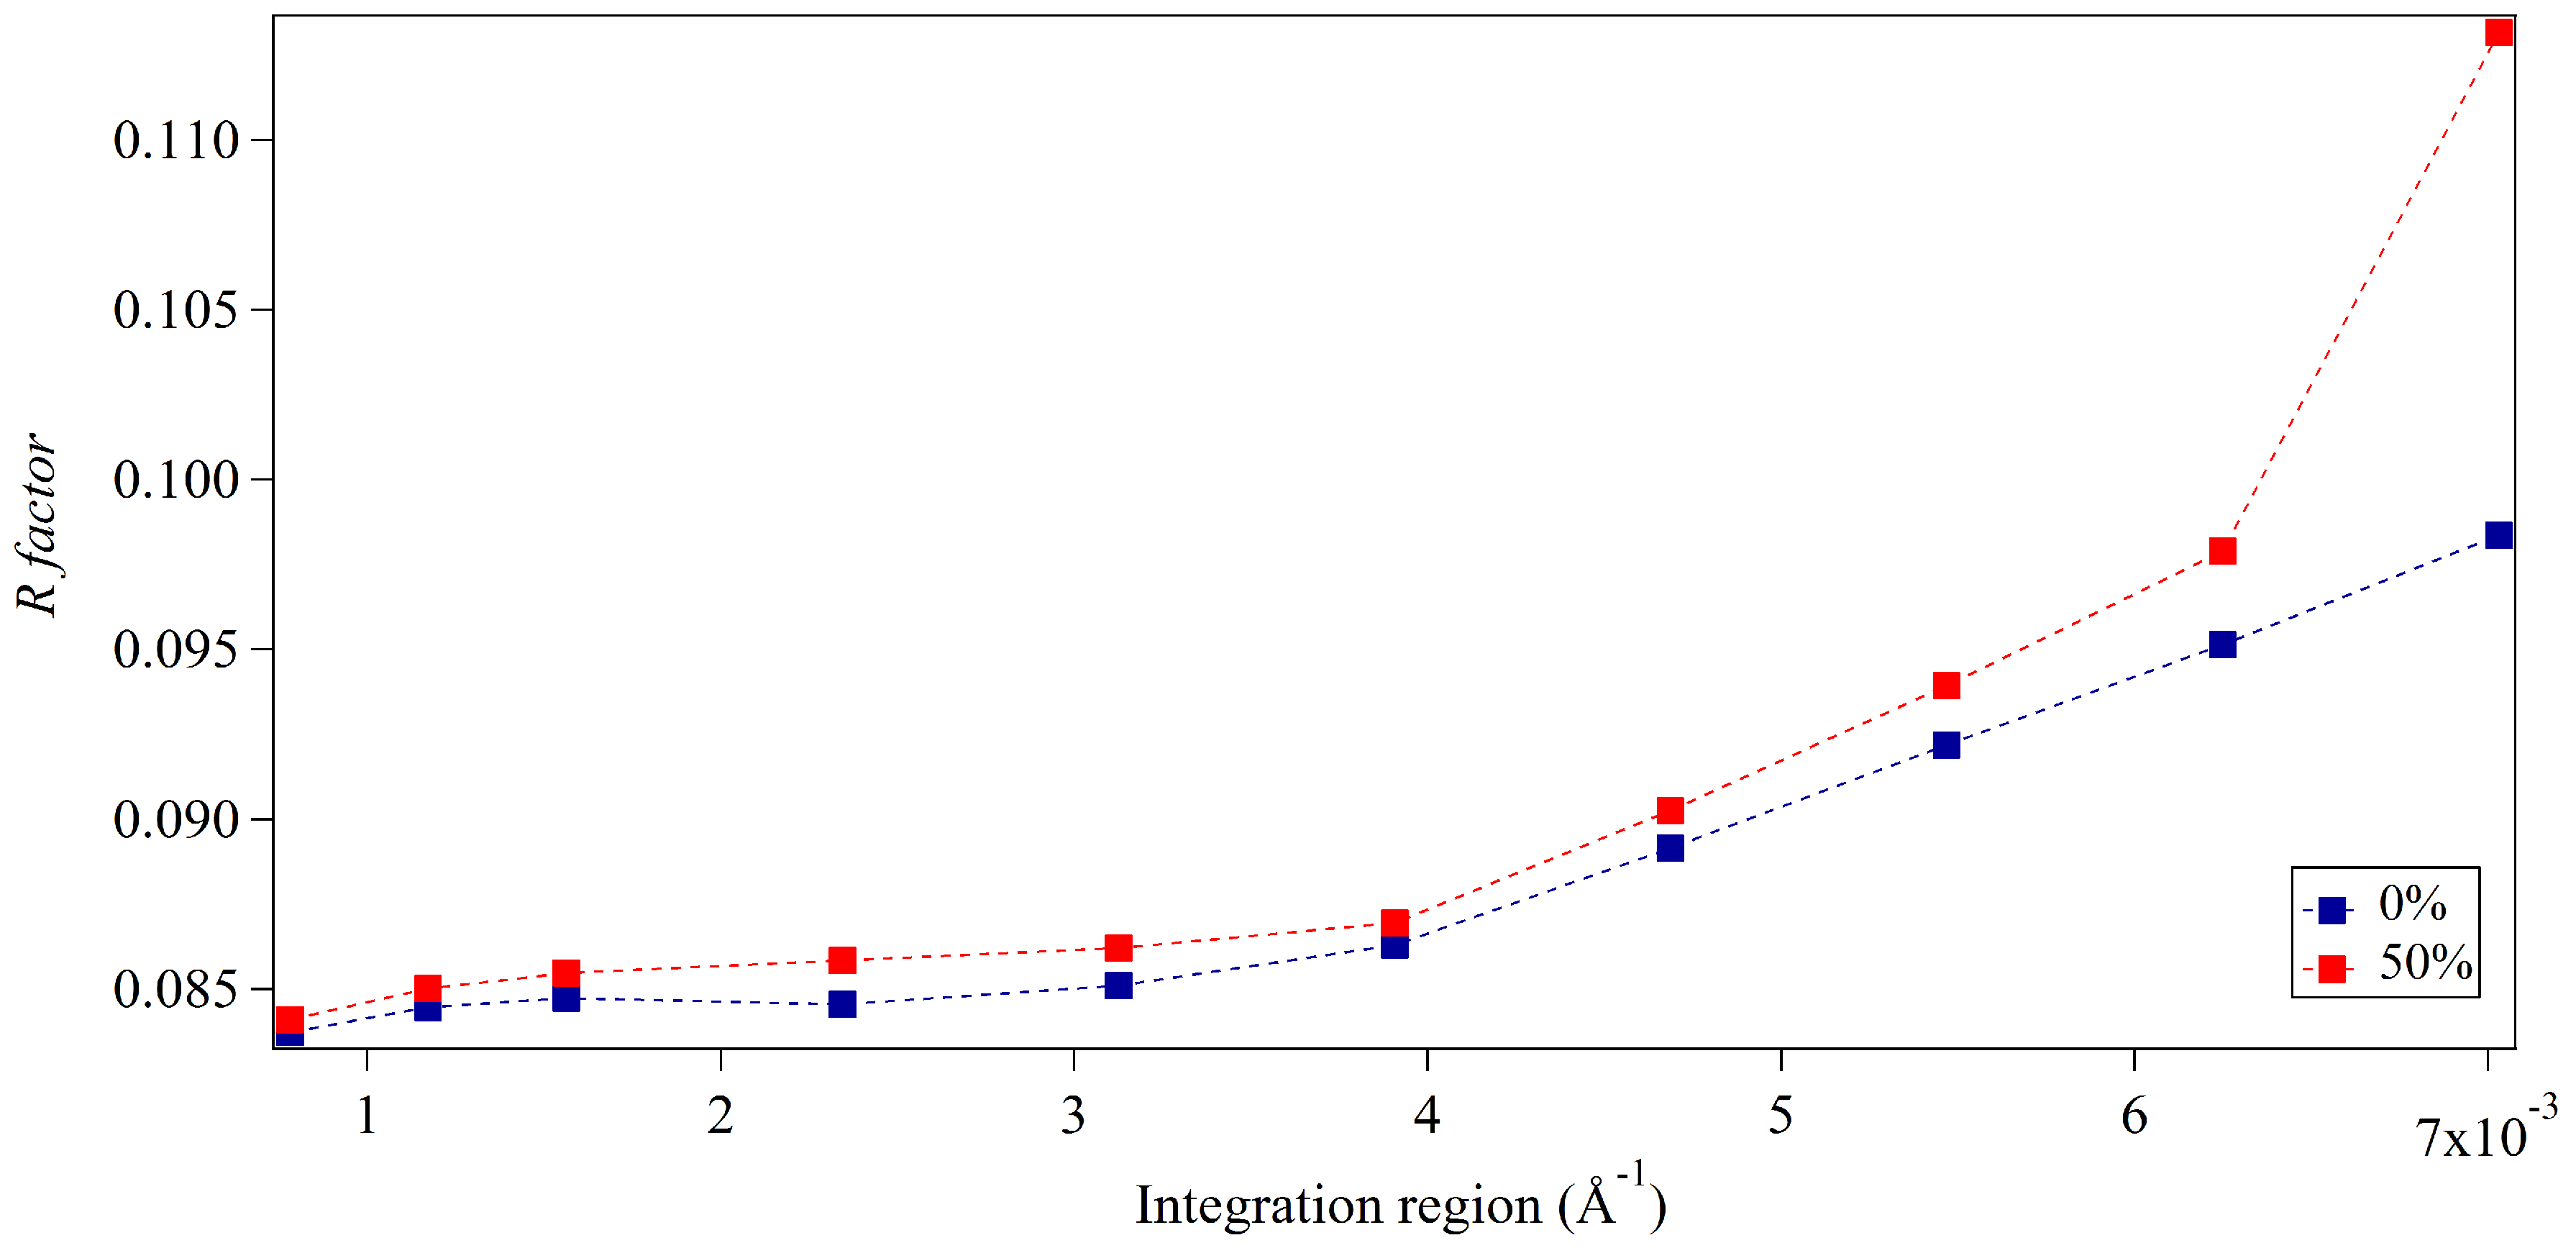
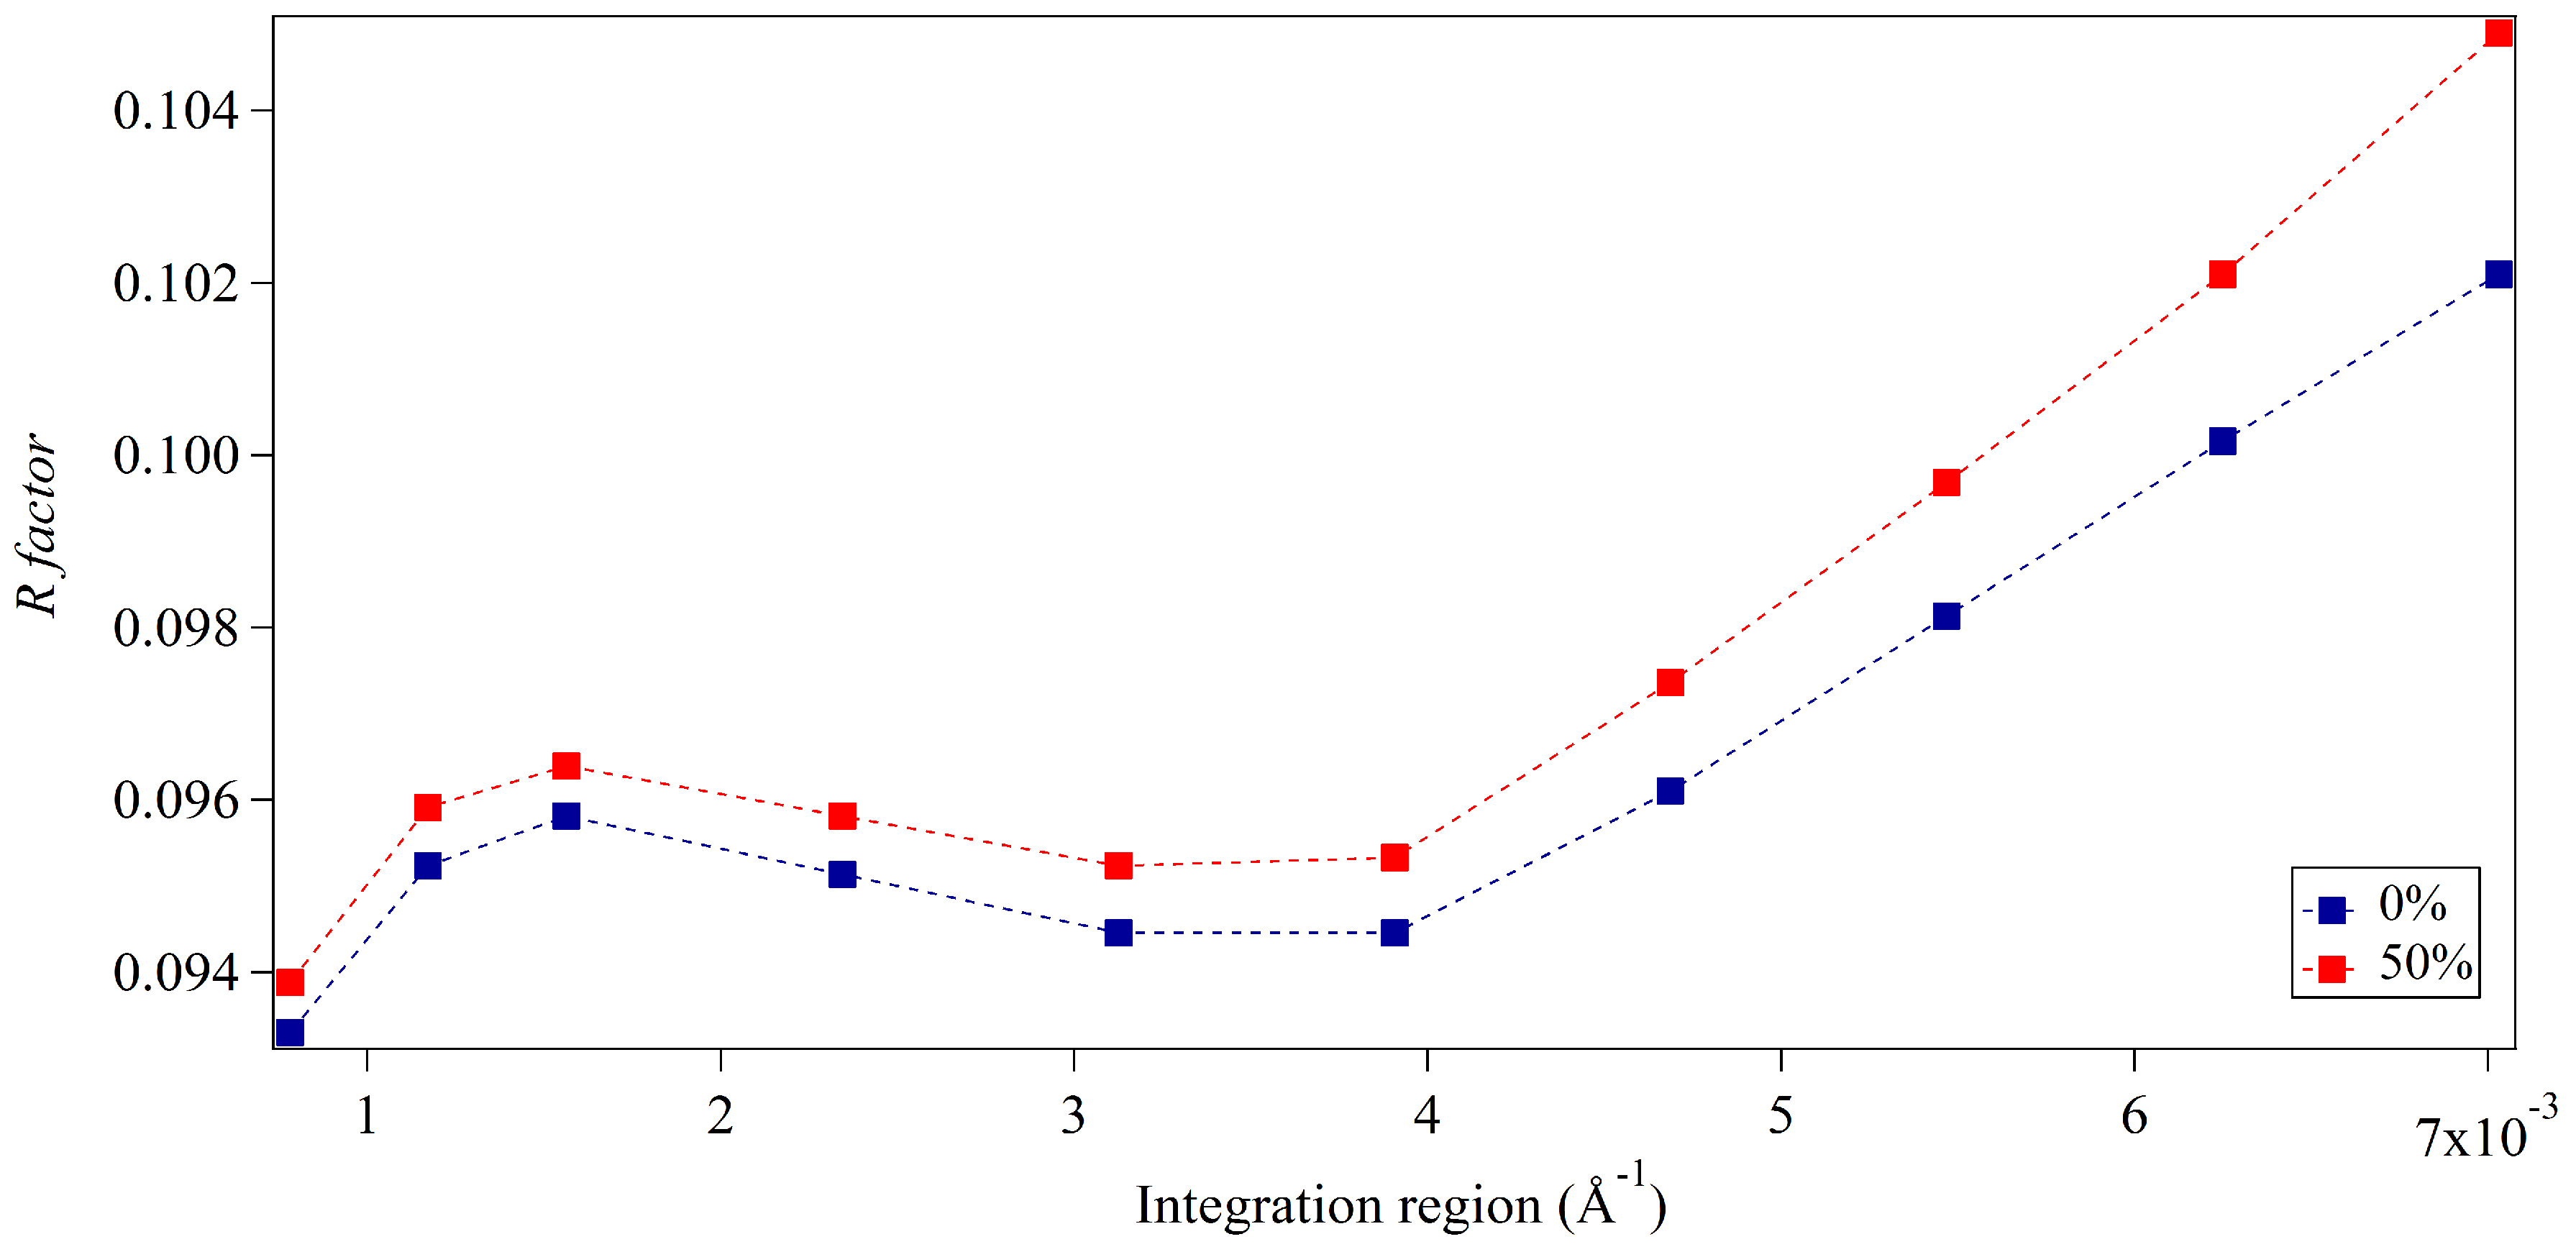
Figure 3 and Figure 4 show the accuracy of the integration approach for two different merged diffracted intensity distributions with respect to the integration region. Both distributions are characterised by occupancy levels of incomplete unit cells of 0% and 50% on crystal surfaces. The distributions vary in terms of the crystal size simulated; results are shown for crystals of average dimensions 15-by-5 unit cells and for crystals of average dimensions 30-by-10 unit cells, respectively. The dependence of the integration approach on the integration region is evident in Figure 3 and Figure 4. The accuracy of structure factors is best for narrower regions of integration for all diffracted intensity distributions, yet the sensitivity to integration region is increased in the case of 50% occupancy for both average crystal sizes. This might be expected to be the result of the disorder introduced by incomplete unit cells, affecting the distribution of intensities around Bragg reflections. However, additional sources of inaccuracy might also be present given that the optimal R-factors obtained from narrow integration regions are greater in the larger crystal case. If incomplete unit cells were the sole source of error, it would be expected that larger R-factors would result for smaller crystals given the greater contribution of surface sites due to the larger surface-to-volume ratio. It appears that numerical inaccuracies may also be present, possibly introduced through the sampling of continuous distributions from discrete, finite pixels and the merging of simulated patterns. The integration regions approach distances of 40% of the reciprocal lattice spacing within Figure 3 and Figure 4. For broader integration regions, the increase in R-factors is most substantial for the smaller crystal size and exceeds those found from the larger crystal case. This meets expectations with inaccuracies introduced by incomplete unit cell contributions becoming more dominant away from Bragg locations and for smaller crystal sizes. Very small protein crystals with large unit cells will hold fewer pixels between Bragg locations and may suffer from incomplete unit cell contributions due to a limited selection of integration regions. Adequate pixel sampling is required to circumvent such errors.
Figure 3 and Figure 4 exhibit offsets in accuracy for the extracted structure factors between the two occupancy levels of incomplete unit cells for all integration regions in both diffracted intensity distributions. These offsets were found to be greater for simulated crystals of smaller average dimensions. This agrees with physical expectations given the greater surface-to-volume ratio of incomplete unit cells for this case and our analysis of one-dimensional intensity profiles. The overall accuracy of the extracted structure factors appears limited using this approach in the presence of incomplete unit cells in comparison to that of the ideal finite crystal case of entirely intact unit cells. Despite this, inaccuracies introduced due to the presence of incomplete unit cells are not significant with appropriate integration regions when considering the relative differences in R-factors obtained, for which the worst increase for narrow integration regions was found to be less than 0.005. This indicates that in most cases with the conventional unit cell populated by two symmetry-related sub-units, the surface distributions of incomplete unit cells will make a largely negligible contribution to the extraction of structure factor amplitudes. This is an encouraging result as it indicates that the potential presence of incomplete unit cells should not limit the conventional crystallographic analysis of submicron crystals in SXC and microED experiments. Some caution should be exercised, however, given that greater inaccuracies could result for larger numbers of sub-units within the conventional unit cell, with greater variety in possible surface constructions, or for surface regions of incomplete unit cells of widths greater than one cell and for broad integration regions. Shifted intensities arising from peak partiality in SXC experiments can also be expected to introduce further inaccuracies and sensitivity to integration size.
3.2. Whole-Pattern Fitting and Integration Analysis
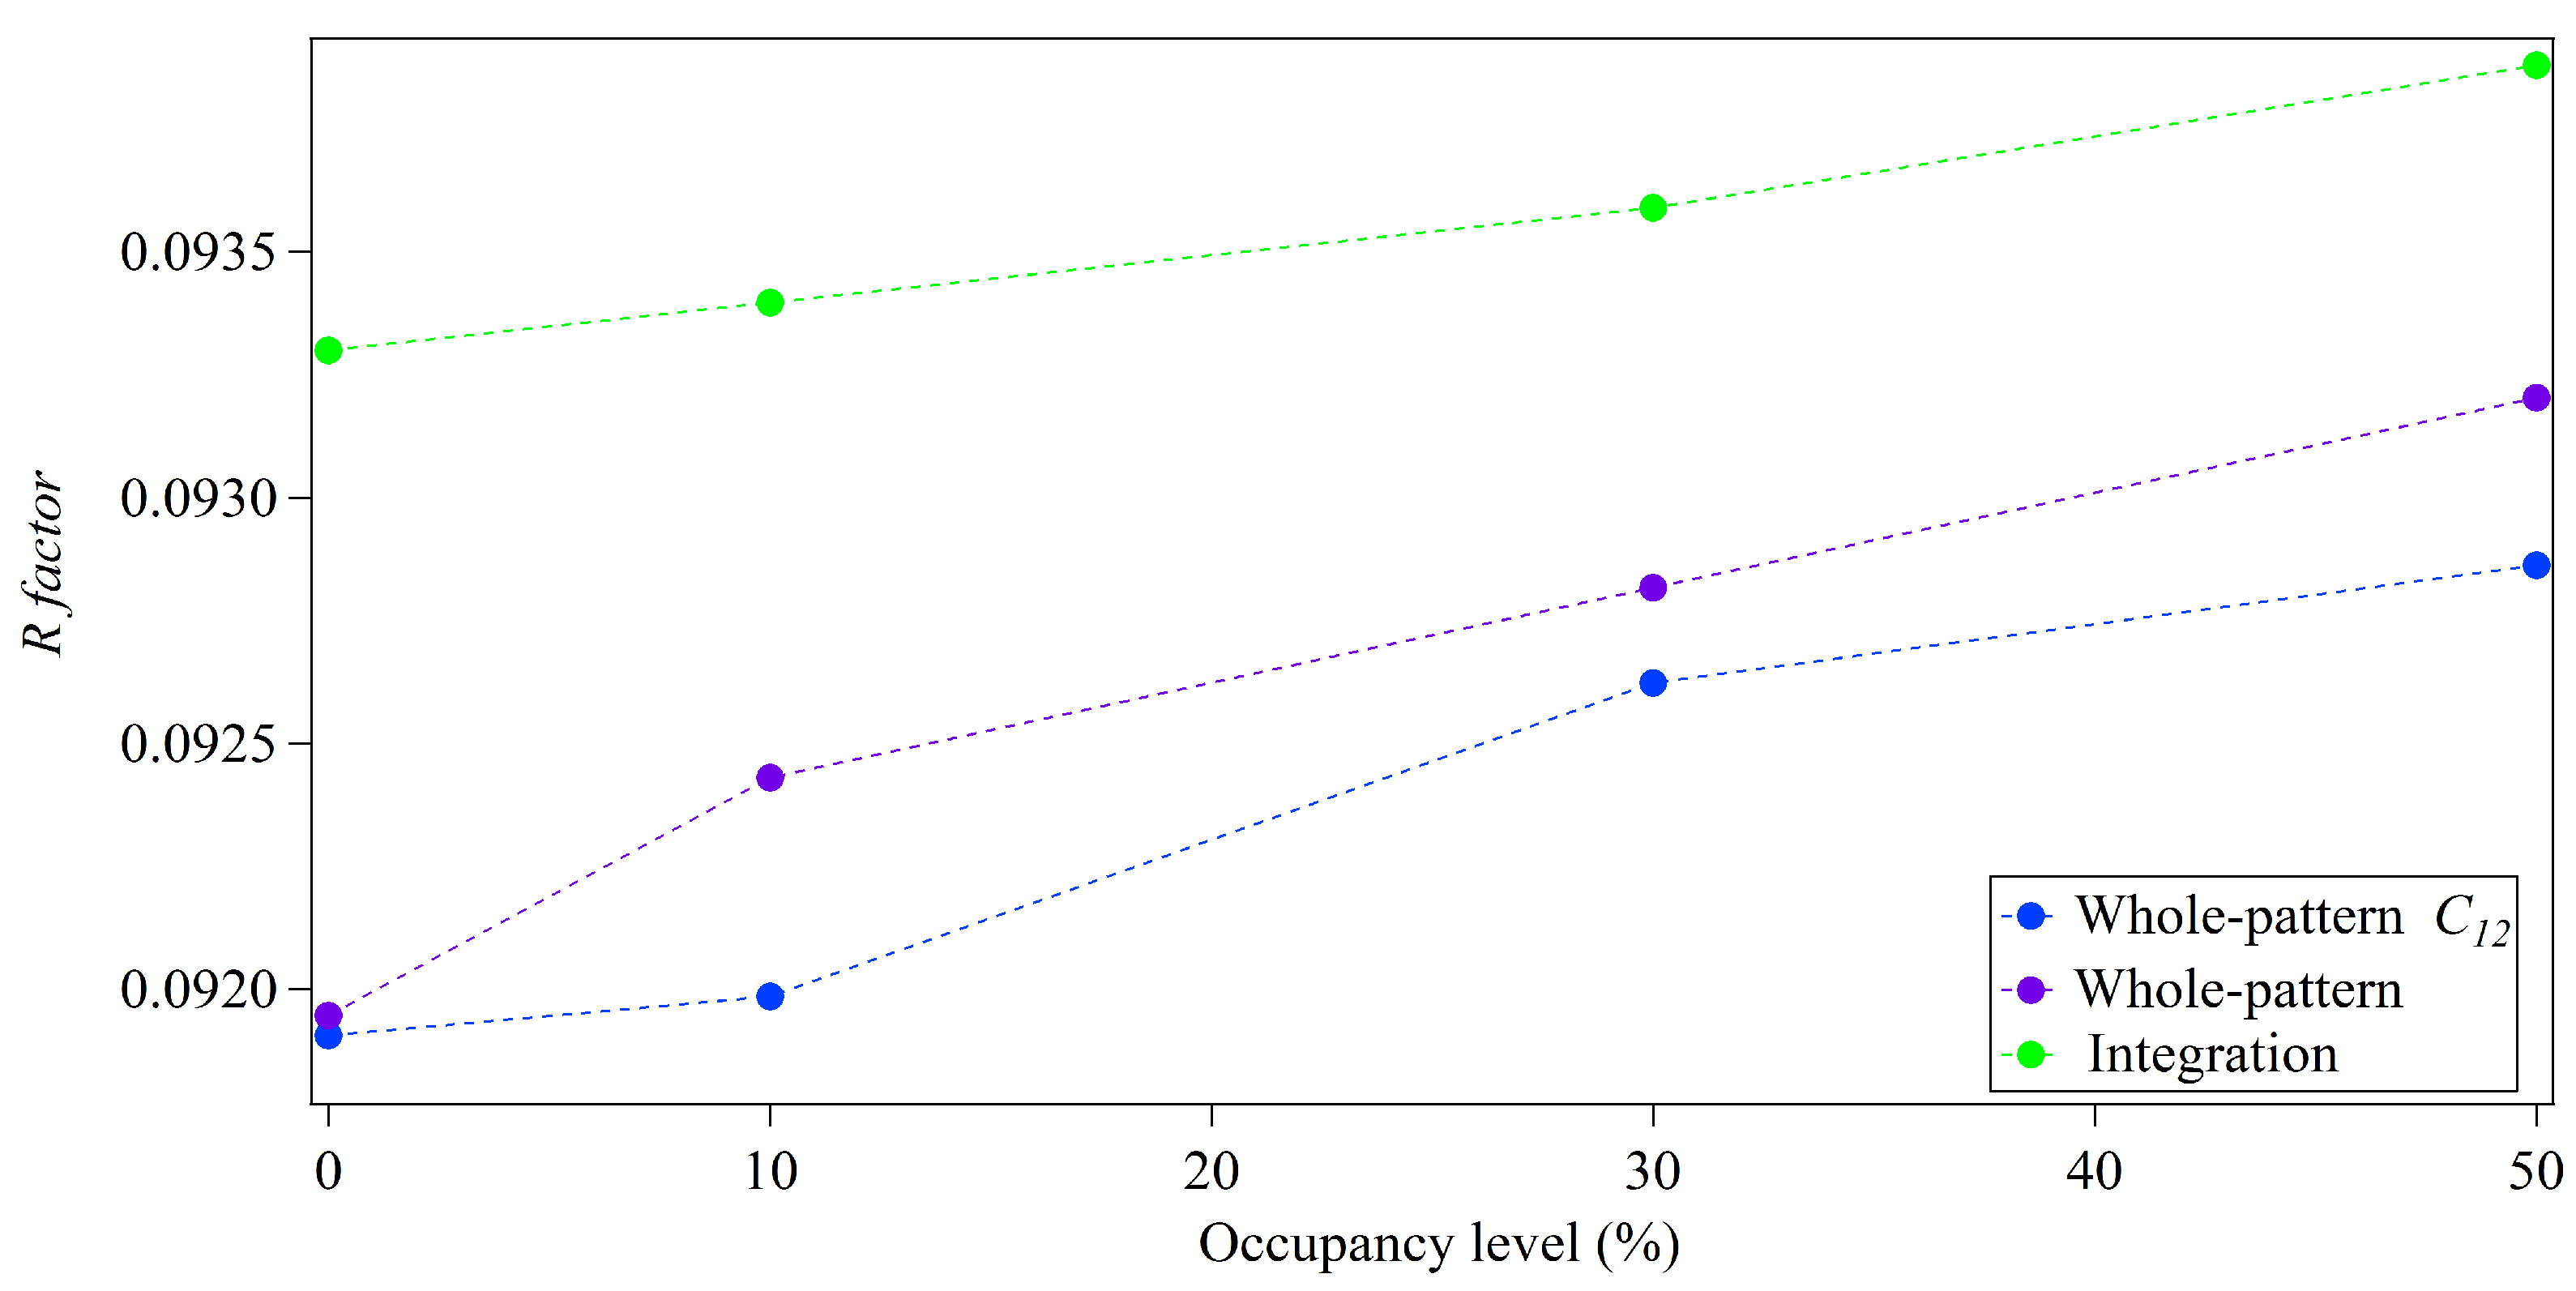
Whole-pattern fitting was applied to the simulated diffracted intensity distributions following the procedure outlined previously by Dilanian et al. [21] using a two-dimensional pseudo-Voigt function to fit the modeled peak-shape , both with and without the modification term ( in Equation (6)) to incorporate the presence of incomplete unit cells. Figure 5 and Figure 6 show the accuracy of extracted structure factor amplitudes for varying occupancy levels (%) of incomplete unit cells on crystal surfaces of average dimensions of 15 by 5 unit cells and 30 by 10 unit cells, respectively. These results are those found by the modified whole-pattern fitting technique with a correction factor for incomplete unit cells, the whole-pattern fitting technique without this factor and by the integration of regions surrounding Bragg reflections. Structure factor amplitudes obtained from whole-pattern fitting analysis present a small improvement in accuracy for all occupancy levels on incomplete unit cells in comparison to whole-pattern fitting without modification and in comparison to the best results obtained from integration.
The modified whole-pattern fitting approach presents an improvement of approximately ∼0.01 over integration for the smallest crystals. It should be noted that the accuracy of the integration approach has some dependence on the size of the integration region. This is demonstrated here for incomplete unit cells in Figure 3 and Figure 4. The results displayed in Figure 5 and Figure 6 for the integration approach are those found from narrow integration areas. In contrast, the modified whole-pattern approach is not dependent on the selection of integration regions and shows an improvement in accuracy over the integration method for its optimal integration region. This improvement is more substantial when compared to other regions of integration. The optimal integration region can be affected by several factors, including crystal size and quality, pixel size and beam characteristics [36].
Small differences are present in the R-factors obtained from whole-pattern fitting performed including and excluding the modification term in Figure 5 and Figure 6. It should be noted that all diffracted intensity distributions were independently fitted. Different peak-shape parameters were found as the final output providing the best agreement between the simulated and modeled diffracted intensity distributions in all cases. The contribution of incomplete unit cells is then not the only factor varying between results obtained from whole-pattern modeling and cannot be readily isolated. It is possible that the variation of peak-shape parameters may take into account variation in occupancy to some extent. Comparison of the performance of whole-pattern modeling with and without the modification term introduced for incomplete unit cells shows some interesting trends. Smaller R-factors were found overall using the modification term, even in the case of 0% occupancy of incomplete unit cells. This might be interpreted as this term providing an improvement to the peak-shape function selected to model the ideal peak-shape, . The quality of fit between simulated and diffracted intensity distributions was assessed for all cases with the weighted sum of all differences between simulated and modeled distributions, R. Figure 7 shows the behaviour of this metric for the larger crystal size case for both whole-pattern modeling approaches for increasing occupancy of incomplete unit cells. This indicates that the inclusion of the modification term both provides improved fitting for 0% occupancy, supporting that this might present an improvement to the ideal peak-shape, but that it also improves the quality of fitting as the fraction of incomplete unit cells increases. Without this term, the quality of fitting worsens more rapidly as the presence of incomplete unit cells increases.
The inclusion of the modification term in the whole-pattern fitting model does not entirely mitigate the presence of incomplete unit cells and other sources of inaccuracies. As shown in Figure 5 and Figure 6, the poorest R-factors were found from modified whole-pattern fitting for the case of the largest occupancy of incomplete unit cells, while Figure 7 shows the modification terms improves yet does not remove dependence of the quality of fit with respect to occupancy. Within the derivation of the modification term for the presence of incomplete unit cells (see Appendix A), it is assumed that the probability of the attachment of differing sub-units is equal for a given crystal direction. It is also assumed that the probabilities of attachment in opposing crystal directions are independent. These assumptions were satisfied in our simulations of crystals with incomplete unit cells. Despite this, the accuracy of structure factor amplitudes exhibits dependence on the occupancy of surface unit cells with single protein molecules. This suggests limitations in the approximations made, such as discarding terms such as Equation (22). Equation (22) includes contributions that are most significant at halfway points between Bragg locations. It may be the case that for finite crystals, such as those only a few unit cells across, the inclusion of these contributions is necessary for the full characterisation of the presence of incomplete unit cells. On the other hand, other sources of error may be affecting the performance of the whole-pattern fitting technique. It is worth noting that larger overall R-factors were found in the larger crystal case from this technique, as observed for integration in Section 3.1 possibly due to the presence of other inaccuracies. The whole-pattern fitting approach is designed for small crystals, where Bragg peak distributions are broad and scattering between peaks is significant. This may also affect the relative performance of the whole-pattern fitting for the larger crystal case, where less extended peak distributions are present than in the smaller crystal case. In addition, other selections of peak-shape functions for modeling may produce different behaviour. Despite these points, the structure factor amplitudes are consistently of greater accuracy from the modified whole-pattern fitting analysis for all considered distributions of incomplete unit cells in comparison to the other approaches tested. As noted, greater numbers of sub-units within the conventional unit cell may affect the accuracy of structure factor amplitudes. In this case, a model to incorporate the presence of incomplete unit cells may be required for standard crystallographic analysis of the diffraction data.
Experimental diffraction data from finite protein crystals would be expected to include other sources of disorder beyond the presence of incomplete unit cells on crystal surfaces. A recent study [37] presented the merging of XFEL diffraction data from photosystem II crystals to form a continuous diffractive distribution, satisfying a model of Gaussian translational disorder of lattice sites. Remarkably, this allowed for an extension of the effective resolution of the crystals by the inclusion and analysis of the continuous high resolution diffraction using coherent diffractive imaging techniques. It has also been demonstrated that disorder within submicron protein crystals can be treated as a source of partial coherence within a continuous model for the diffractive intensity distribution [38]. This approach could be potentially combined with our model for the analysis of experimental data with various sources of structural disorder, via the introduction of multiple coherent modes [39]. Recent developments in crystallography experiments provide the capability of gaining new insight into the structural disorder of finite protein crystals [40]. The comparison of experimental data from well-characterised finite protein crystal samples against models for incomplete unit cells may provide insight into their occurrence on crystal surfaces in future work. For example, the performance of the algorithm presented here on such data may provide greater understanding of the likelihood of the conditions assumed within our model for incomplete unit cells.
4. Conclusions
The extraction of structure factor amplitudes from merged diffraction data formed from finite protein crystals with surface distributions of protein molecules was considered in this work and is relevant for diffraction experiments involving small, finite crystals, such as microED and SXC. A new model for the diffracted intensity distribution merged from a collection of finite protein crystals with random occupancy distributions of surface molecules, forming incomplete unit cells, was presented. We demonstrated that this model can affect the accuracy of structure factor amplitudes for very small crystals, especially those with at least one crystal dimension of the order of a few unit cells.
Our model was used to extend a new whole-pattern fitting technique [21] for the improved estimation of structure factor amplitudes from finite crystals. The modified whole-pattern fitting approach was found to provide structure factor amplitudes of greater accuracy compared with integration approaches for different occupancies of incomplete unit cells on crystal surfaces for two-dimensional crystals with average dimensions of 15-by-5 and 30-by-10 conventional unit cells. The whole-pattern fitting results still displayed some dependence on the occupancy of surface unit cells, diminishing in accuracy as this increased. The approximations that were employed do not entirely take into account the contributions of incomplete unit cells, yet may provide an improved method for the extraction of structure factor amplitudes over integration methods in the cases considered. The presence of incomplete unit cells could not be entirely neglected without affecting the accuracy of structure factor amplitudes within our simulations with small inaccuracies in structure factor amplitudes obtained by whole-pattern fitting analysis and by integration methods relative to whole unit cells. The relative increase in R-factors obtained due to the introduction of incomplete unit cells was limited to less than 0.005 with appropriate selection of integration regions and could be further improved by ∼0.01 by the use of whole-pattern fitting analysis. As a consequence, the presence of incomplete unit cells did not present an intrinsic limitation to the analysis of merged diffraction data from finite crystals containing two electron density sub-units within the conventional unit cell in both approaches.
The scope of this work was limited to protein crystal structures with conventional unit cells containing two rigid-body sub-units and with distributions of incomplete unit cells limited to a width of a single unit cell, rather than large regions and internal structural voids. Future work could extend this to greater numbers of sub-units and other probability distributions for the inclusion of protein molecules on crystal surfaces and vacancies within the crystal bulk.
Acknowledgments
The authors acknowledge the support of the Australian Research Council Centre of Excellence in Advanced Molecular Imaging, the Australian Research Council Discovery Early Career Researcher Award, the Australian Government Research Training Program Scholarship and the Ernst & Grace Matthaei Research Scholarship.
Author Contributions
A.M. conceived and designed the incomplete unit cells model with input from H.Q. and S.W.; R.D. and S.W. developed the application of whole-pattern fitting analysis to SXC data; S.W. and R.D. developed the code; S.W. performed the simulations; S.W. wrote the manuscript with input from all authors.
Conflicts of Interest
The authors declare no conflict of interest. The funding sponsors had no role in the design of the study; in the collection, analyses, or interpretation of data; in the writing of the manuscript, and in the decision to publish the results.
Abbreviations
The following abbreviations are used in this manuscript:
| SXC | serial X-ray crystallography |
| XFELs | X-ray free-electron lasers |
| microED | micro electron diffraction |
Appendix A
Here we derive the form of Equation (23) and show that the effect of incomplete unit cells can be described by a correlation coefficient for the case of a two-dimensional parallelogram crystal.
The lattice transform of a conventional two-dimensional parallelogram crystal can be expressed as
where and are the quantities of unit cells of the crystal along directions defined by unit cell parameters a and b, respectively. Similarly to the sub-lattice approach outlined in Section 2.1, the lattice transform corresponding to each electron density sub-unit can be expressed by separating quantities for each sub-unit. and will be used here to denote the quantities of the sub-unit along the a and b crystal directions, respectively.
The average sub-lattice transform for n crystals will be examined here for the case of two rigid-body sub-units. This can be expressed as
where and and lattice transform terms can be cast for each sub-unit following Equation (A1) using the quantities and .
The average sub-lattice transform for identical sub-units can be expressed as,
where the probabilities, and , of the distributions of the sub-unit along the a and b crystal directions, respectively, are assumed to be independent.
It is also assumed that probabilities of the distributions of each sub-unit are identical (i.e., and ). This equates the sub-lattice transforms of each sub-unit, which is defined here as the generalised lattice-transform introduced in Equation (4):
The sub-lattice transform formed from differing sub-units is now considered. It is assumed that the probabilities along crystal directions a and b are independent and, as a consequence, are separable:
where
Equation (A6) is one-dimensional and is dependent on the truncations of crystal surfaces. Four cases of surface truncations are possible for surface distributions of incomplete unit cells limited to the width of a single unit cell. Using to denote the number of sub-units of type 1 for brevity, the four cases include:
- (1)
- Equal numbers of each sub-unit. The unit cell is defined by 1,2 packing order with .
- (2)
- Equal numbers of each sub-unit. The unit cell is defined by 2,1 packing order with .
- (3)
- . The unit cell is not defined. For this case,.
- (4)
- . The unit cell is not defined. For this case,.
If the average sub-lattice transform is assumed to be an equally weighted sum of these cases, this can be written after some manipulation as
Substitution of this result into Equation (A5) yields
Substitution of this result into Equation (3) defines the diffracted intensity distribution as
The last term, , has a maximum contribution of one quarter of the preceding term, , and will be neglected as a consequence. With this approximation, the following definition has been used
where is the the generalised lattice-transform introduced in Equation (4).
This can now be evaluated for all correlation coefficients. For identical sub-units, the correlation coefficients are
For differing sub-units, the correlation coefficient can be expressed as,
References
- Chapman, H.N.; Fromme, P.; Barty, A.; White, T.A.; Kirian, R.A.; Aquila, A.; Hunter, M.S.; Schulz, J.; DePonte, D.P.; Weierstall, U.; et al. Femtosecond X-ray protein nanocrystallography. Nature 2011, 470, 73–77. [Google Scholar] [CrossRef] [PubMed]
- Stellato, F.; Oberthür, D.; Liang, M.; Bean, R.; Gati, C.; Yefanov, O.; Barty, A.; Burkhardt, A.; Fischer, P.; Galli, L.; et al. Room-temperature macromolecular serial crystallography using synchrotron radiation. IUCrJ 2014, 1, 204–212. [Google Scholar] [CrossRef] [PubMed]
- Gati, C.; Bourenkov, G.; Klinge, M.; Rehders, D.; Stellato, F.; Oberthür, D.; Yefanov, O.; Sommer, B.P.; Mogk, S.; Duszenko, M.; et al. Serial crystallography on in vivo grown microcrystals using synchrotron radiation. IUCrJ 2014, 1, 87–94. [Google Scholar] [CrossRef] [PubMed]
- Shi, D.; Nannenga, B.L.; Iadanza, M.G.; Gonen, T. Three-dimensional electron crystallography of protein microcrystals. ELife 2013, 2, e01345. [Google Scholar] [CrossRef] [PubMed]
- Nannenga, B.L.; Shi, D.; Leslie, A.G.W.; Gonen, T. High-resolution structure determination by continuous-rotation data collection in MicroED. Nat. Methods 2014, 11, 927–930. [Google Scholar] [CrossRef] [PubMed]
- Shi, D.; Nannenga, B.L.; de la Cruz, M.J.; Liu, J.; Sawtelle, S.; Calero, G.; Reyes, F.E.; Hattne, J.; Gonen, T. The collection of MicroED data for macromolecular crystallography. Nat. Protoc. 2016, 11, 895–904. [Google Scholar] [CrossRef] [PubMed]
- Subramanian, G.; Basu, S.; Liu, H.; Zuo, J.M.; Spence, J.C.H. Solving protein nanocrystals by cryo-EM diffraction: Multiple scattering artifacts. Ultramicroscopy 2015, 148, 87–93. [Google Scholar] [CrossRef] [PubMed]
- Patterson, A.L. The Scherrer Formula for X-ray Particle Size Determination. Phys. Rev. 1939, 56, 978–982. [Google Scholar] [CrossRef]
- Langford, J.I.; Wilson, A.J.C. Scherrer after sixty years: A survey and some new results in the determination of crystallite size. J. Appl. Crystallogr. 1978, 11, 102–113. [Google Scholar] [CrossRef]
- Holzwarth, U.; Gibson, N. The Scherrer equation versus the ’Debye-Scherrer equation’. Nat. Nanotechnol. 2011, 6, 534. [Google Scholar] [CrossRef] [PubMed]
- Yefanov, O.; Gati, C.; Bourenkov, G.; Kirian, R.A.; White, T.A.; Spence, J.C.H.; Chapman, H.N.; Barty, A. Mapping the continuous reciprocal space intensity distribution of X-ray serial crystallography. Philos. Trans. R. Soc. B 2014, 369, 20130333. [Google Scholar] [CrossRef] [PubMed]
- Hunter, M.S.; DePonte, D.P.; Shapiro, D.A.; Kirian, R.A.; Wang, X.; Starodub, D.; Marchesini, S.; Weierstall, U.; Doak, R.B.; Spence, J.C.H.; et al. X-ray Diffraction from Membrane Protein Nanocrystals. Biophys. J. 2011, 100, 198–206. [Google Scholar] [CrossRef] [PubMed]
- Kirian, R.A.; Bean, R.J.; Beyerlein, K.R.; Yefanov, O.M.; White, T.A.; Barty, A.; Chapman, H.N. Phasing coherently illuminated nanocrystals bounded by partial unit cells. Philos. Trans. R. Soc. B 2014, 369, 20130331. [Google Scholar] [CrossRef] [PubMed]
- Spence, J.C.H.; Kirian, R.A.; Wang, X.; Weierstall, U.; Schmidt, K.E.; White, T.; Barty, A.; Chapman, H.N.; Marchesini, S.; Holton, J. Phasing of coherent femtosecond X-ray diffraction from size-varying nanocrystals. Opt. Express 2011, 19, 2866–2873. [Google Scholar] [CrossRef] [PubMed]
- Fienup, J. Phase Retrieval Algorithms: A comparison. Appl. Opt. 1982, 21, 2758–2769. [Google Scholar] [CrossRef] [PubMed]
- Miao, J.; Sayre, D.; Chapman, H.N. Phase retrieval from the magnitude of the Fourier transforms of nonperiodic objects. J. Opt. Soc. Am. A 1998, 15, 1662–1669. [Google Scholar] [CrossRef]
- Kirian, R.A.; Bean, R.J.; Beyerlein, K.R.; Barthelmess, M.; Yoon, C.H.; Wang, F.; Capotondi, F.; Pedersoli, E.; Barty, A.; Chapman, H.N. Direct phasing of finite crystals illuminated with a free-electron laser. Phys. Rev. X 2015, 5, 011015. [Google Scholar] [CrossRef]
- Liu, H.; Zatsepin, N.A.; Spence, J.C.H. Ab-initio phasing using nanocrystal shape transforms with incomplete unit cells. IUCrJ 2013, 1, 19–27. [Google Scholar] [CrossRef] [PubMed]
- Chen, J.P.J.; Millane, R.P. Diffraction by nanocrystals. J. Opt. Soc. Am. A 2013, 30, 2627–2634. [Google Scholar] [CrossRef] [PubMed]
- Chen, J.P.J.; Millane, R.P. Diffraction by nanocrystals II. J. Opt. Soc. Am. A 2014, 31, 1730–1737. [Google Scholar] [CrossRef] [PubMed]
- Dilanian, R.A.; Williams, S.R.; Martin, A.V.; Streltsov, V.A.; Quiney, H.M. Whole-pattern fitting technique in serial femtosecond nanocrystallography. IUCrJ 2016, 3, 127–138. [Google Scholar] [CrossRef] [PubMed]
- Rietveld, H.M. A profile refinement method for nuclear and magnetic structures. J. Appl. Crystallogr. 1969, 2, 65–71. [Google Scholar] [CrossRef]
- Le Bail, A.; Duroy, H.; Fourquet, J.L. Ab-initio structure determination of LiSbWO6 by X-ray powder diffraction. Mater. Res. Bull. 1988, 23, 447–452. [Google Scholar] [CrossRef]
- Rodriguez, J.A.; Ivanova, M.I.; Sawaya, M.R.; Cascio, D.; Reyes, F.E.; Shi, D.; Sangwan, S.; Guenther, E.L.; Johnson, L.M.; Zhang, M.; et al. Structure of the toxic core of α-synuclein from invisible crystals. Nature 2015, 525, 486–490. [Google Scholar] [CrossRef] [PubMed]
- Sawaya, M.R.; Rodriguez, J.; Cascio, D.; Collazo, M.J.; Shi, D.; Reyes, F.E.; Hattne, J.; Gonen, T.; Eisenberg, D.S. Ab initio structure determination from prion nanocrystals at atomic resolution by MicroED. Proc. Natl. Acad. Sci. USA 2016, 113, 11232–11236. [Google Scholar] [CrossRef] [PubMed]
- Guinier, A. X-ray Diffraction in Crystals, Imperfect Crystals, and Amorphous Bodies; W. H. Freeman and Company: San Francisco, CA, USA, 1963. [Google Scholar]
- Ino, T.; Minami, N. X-ray diffraction by small crystals. Acta Crystallogr. Sect. A 1979, 35, 163–170. [Google Scholar]
- Bogan, M.J. X-ray free electron lasers motivate bioanalytical characterization of protein nanocrystals: Serial femtosecond crystallography. Anal. Chem. 2013, 85, 3464–3471. [Google Scholar] [CrossRef] [PubMed]
- Yang, H.; Carney, P.J.; Chang, J.C.; Guo, Z.; Villanueva, J.M.; Stevens, J. Structure and receptor binding preferences of recombinant human A(H3N2) virus hemagglutinins. Virology 2015, 477, 18–31. [Google Scholar] [CrossRef] [PubMed]
- Berman, H.M.; Westbrook, J.; Feng, Z.; Gilliland, G.; Bhat, T.N.; Weissig, H.; Shindyalov, I.N.; Bourne, P.E. The Protein Data Bank. Nucleic Acids Res. 2000, 28, 235–242. [Google Scholar] [CrossRef] [PubMed]
- Vaguine, A.A.; Richelle, J.; Wodak, S.J. SFCHECK: A unified set of procedures for evaluating the quality of macromolecular structure-factor data and their agreement with the atomic model. Acta Crystallogr. D Biol. Crystallogr. 1999, 55, 191–205. [Google Scholar] [CrossRef] [PubMed]
- Winn, M.D.; Ballard, C.C.; Cowtan, K.D.; Dodson, E.J.; Emsley, P.; Evans, P.R.; Keegan, R.M.; Krissinel, E.B.; Leslie, A.G.W.; McCoy, A.; et al. Overview of the CCP4 suite and current developments. Acta Crystallogr. D Biol. Crystallogr. 2011, 67, 235–242. [Google Scholar] [CrossRef] [PubMed]
- Wilson, A.J.C. The probability distribution of X-ray intensities. Acta Crystallogr. 1949, 2, 318–321. [Google Scholar] [CrossRef]
- Patterson, A.L. A Fourier Series Method for the Determination of the Components of Interatomic Distances in Crystals. Phys. Rev. 1934, 46, 372–376. [Google Scholar] [CrossRef]
- Kirian, R.A.; Wang, X.; Weierstall, U.; Schmidt, K.E.; Spence, J.C.H.; Hunter, M.; Fromme, P.; White, T.; Chapman, H.N.; Holton, J. Femtosecond protein nanocrystallography-data analysis methods. Opt. Express 2010, 18, 5713–5723. [Google Scholar] [CrossRef] [PubMed]
- Kirian, R.A.; White, T.A.; Holton, J.M.; Chapman, H.N.; Fromme, P.; Barty, A.; Lomb, L.; Aquila, A.; Maia, F.R.N.C.; Martin, A.V.; et al. Structure-factor analysis of femtosecond micro-diffraction patterns from protein nanocrystals. Acta Crystallogr. Sect. A 2011, 67, 131–140. [Google Scholar] [CrossRef] [PubMed]
- Ayyer, K.; Yefanov, O.M.; Oberthür, D.; Roy-Chowdhury, S.; Galli, L.; Mariani, V.; Basu, S.; Coe, J.; Conrad, C.E.; Fromme, R.; et al. Macromolecular diffractive imaging using imperfect crystals. Nature 2016, 530, 202–206. [Google Scholar] [CrossRef] [PubMed]
- Dilanian, R.A.; Streltsov, V.A.; Quiney, H.M.; Nugent, K.A. Continuous X-ray diffractive field in protein nanocrystallography. Acta Crystallogr. Sect. A 2013, 69, 108–118. [Google Scholar] [CrossRef] [PubMed]
- Wolf, E. New theory of partial coherence in the space-frequency domain. Part I: Spectra and cross spectra of steady-state sources. J. Opt. Soc. Am. 1982, 72, 343–351. [Google Scholar] [CrossRef]
- Nave, C.; Sutton, G.; Evans, G.; Owen, R.; Rau, C.; Robinson, I.; Stuart, D.I. Imperfection and radiation damage in protein crystals studied with coherent radiation. J. Synchrotron Radiat. 2016, 23, 228–237. [Google Scholar] [CrossRef] [PubMed]
Figure 1.
Differences in one-dimensional diffracted intensity profiles ( in Equation (26)) with respect to average one-dimensional unit cell dimensions, . Results are shown from simulations of unit cell distributions merged from 1000 one-dimensional lattices with dimensions defined by Gaussian distributions with a standard deviation of 25% of the mean dimension, , in red and with dimensions defined by lognormal distributions of mean, , in blue.

Figure 2.
Schematic drawing of an externally incomplete unit cell distribution. Dark green cells indicate a whole unit cell; light green cells indicate an incomplete cell. For simplicity, molecules are represented by triangular shapes. The boundary of the crystal bulk is indicated with dashed green lines and the boundary of the filling region for incomplete unit cells is indicated by dashed red lines. This region was limited to a width of a single unit cell in this study.

Figure 3.
Accuracy of extracted structure factor amplitudes via the integration approach for varying integration regions from crystals of average dimensions of 15-by-5 unit cells and varying occupancy levels of surface unit cells. The integration region is shown as the distance from Bragg locations; the upper value approaches a distance of 40% of the reciprocal lattice spacing. The legend indicates the average percentage of occupancy levels for each set of simulated crystals.

Figure 4.
Accuracy of extracted structure factor amplitudes via the integration approach for varying integration regions from crystals of average dimensions of 30-by-10 unit cells and varying occupancy levels of surface unit cells. The integration region is shown as the distance from Bragg locations; the upper value approaches a distance of 40% of the reciprocal lattice spacing. The legend indicates the average percentage of occupancy levels for each set of simulated crystals.

Figure 5.
Accuracy of extracted structure factor amplitudes for varying occupancy levels (%) of incomplete unit cells on crystal surfaces of average dimensions of 15-by-5 unit cells. Blue points show the results of the modified whole-pattern fitting analysis outlined in this study; purple points show results excluding the correction factor, . Green points show the results of the integration of Bragg reflections. Integration results are shown for a single integration region for which the most accurate structure factor amplitudes were extracted.

Figure 6.
Accuracy of extracted structure factor amplitudes for varying occupancy levels (%) of incomplete unit cells on crystal surfaces of average dimensions of 30-by-10 unit cells. Blue points show the results of the modified whole-pattern fitting analysis outlined in this study; purple points show results excluding the correction factor, . Green points show the results of the integration of Bragg reflections. Integration results are shown for a single integration region for which the most accurate structure factor amplitudes were extracted.

Figure 7.
Quality of fit of the modeled distributions for varying occupancy levels (%) of incomplete unit cells on crystal surfaces of average dimensions of 30-by-10 unit cells. Blue points show the results of the modified whole-pattern fitting analysis outlined in this study and purple points show results excluding the correction factor, . All values have the minimum R factor obtained, , subtracted for scaling purposes.

© 2017 by the authors. Licensee MDPI, Basel, Switzerland. This article is an open access article distributed under the terms and conditions of the Creative Commons Attribution (CC BY) license (http://creativecommons.org/licenses/by/4.0/).
Share and Cite
MDPI and ACS Style
Williams, S.R.; Dilanian, R.A.; Quiney, H.M.; Martin, A.V. Analysis of Diffracted Intensities from Finite Protein Crystals with Incomplete Unit Cells. Crystals 2017, 7, 220. https://doi.org/10.3390/cryst7070220
AMA Style
Williams SR, Dilanian RA, Quiney HM, Martin AV. Analysis of Diffracted Intensities from Finite Protein Crystals with Incomplete Unit Cells. Crystals. 2017; 7(7):220. https://doi.org/10.3390/cryst7070220
Chicago/Turabian StyleWilliams, Sophie R., Ruben A. Dilanian, Harry M. Quiney, and Andrew V. Martin. 2017. "Analysis of Diffracted Intensities from Finite Protein Crystals with Incomplete Unit Cells" Crystals 7, no. 7: 220. https://doi.org/10.3390/cryst7070220
Note that from the first issue of 2016, this journal uses article numbers instead of page numbers. See further details here.