Article

Genotyping-By-Sequencing Reveals Population Structure and Genetic Diversity of a Buffelgrass (Cenchrus ciliaris L.) Collection

1
Feed and Forage Development Program, International Livestock Research Institute, Addis Ababa, Ethiopia
2
Feed and Forage Development Program, International Livestock Research Institute, Nairobi 00100, Kenya
*
Author to whom correspondence should be addressed.
Diversity 2020, 12(3), 88; https://doi.org/10.3390/d12030088
Submission received: 17 January 2020 / Revised: 7 February 2020 / Accepted: 7 February 2020 / Published: 27 February 2020
(This article belongs to the Section Plant Diversity)

Abstract

:
Buffelgrass (Cenchrus ciliaris L.) is an important forage grass widely grown across the world with many good characteristics including high biomass yield, drought tolerance, and adaptability to a wide range of soil conditions and agro-ecologies. Two hundred and five buffelgrass accessions from diverse origins, conserved as part of the in-trust collection in the ILRI genebank, were analyzed by genotyping-by-sequencing using the DArTseq platform. The genotyping generated 234,581 single nucleotide polymorphism (SNP) markers, with polymorphic information content (PIC) values ranging from 0.005 to 0.5, and the short sequences of the markers were aligned with foxtail millet (Setaria italica) as a reference genome to generate genomic map positions of the markers. One thousand informative SNP markers, representing a broad coverage of the reference genome and with an average PIC value of 0.35, were selected for population structure and diversity analyses. The population structure analysis suggested two main groups, while the hierarchical clustering showed up to eight clusters in the collection. A representative core collection containing 20% of the accessions in the collection, with germplasm from 10 African countries and Oman, was developed. In general, the study revealed the presence of considerable genetic diversity and richness in the collection and a core collection that could be used for further analysis for specific traits of interest.

1. Introduction

The availability of sufficient quantity and quality feed resources is a key factor underpinning sustainable livestock production, particularly with the current trend of climate change [1] and to meet the ever-increasing demand for livestock products. To address these challenges, the promotion of new options of climate resilient forages from the collections held in genebanks is considered crucial. Thus, generating knowledge to support a greater understanding of the genetic resources of forage crops and promoting their use can contribute to the sustainable development goals of ‘no poverty’, ‘zero hunger’, and ensuring ‘healthy lives’.
Buffelgrass (Cenchrus ciliaris L. Poaceae) is an important warm-season perennial (C4) forage grass [2] widely grown in the tropics, subtropics, and warm temperate areas of the world [3,4]. It is widely distributed, but native to Africa, Middle East, Western Asia, and Europe [3,4]. Over the course of forage cultivation, it has been introduced to USA, Mexico, Colombia, Nicaragua, El Salvador, Honduras, Brazil, Bolivia, Panama, Venezuela, and Australia, where several cultivars have been developed [3,4].
Genetically, buffelgrass reproduces primarily through aposporous apomixis with some sexual genotypes [5,6,7]. When sexual reproduction occurs, it is predominately cross-pollinated [8]. Three ploidy levels are known to exist in buffelgrass: Tetraploid (2n = 4x = 36, the most common one), pentaploid (2n = 5x = 45), and hexaploid (2n = 6x = 56) [2,5,6,9]. Its estimated nuclear DNA content (2C) ranges from 3.03 pg to 4.48 pg [2].
Buffelgrass is a climate resilient species adapted to diverse soil characteristics, altitudes (sea level to 2000 m), and agro-ecological conditions [3]. Known for its good pasture production across a wide range of environments, it can produce up to 24 tons/ha/yr of good quality forage [10]. It is one of the most drought- and high temperature stress-tolerant species that can grow in areas with annual rainfall as low as 250 mm and up to 2670 mm [3]. Some genotypes have been shown to tolerate cold temperatures [11,12]. It can be grazed directly, is capable of recovering from heavy grazing, and can be made into hay and stored for use during the feed shortage seasons of the year [10]. It is a deep-rooted species that responds rapidly to rain and plays a crucial role in soil conservation [13]. The combination of these characteristics makes buffelgrass a forage of choice in smallholder farming systems.
The forage genebank at the International Livestock Research Institute (ILRI) maintains a large collection of buffelgrass, both as live plants in field genebanks and as seeds in cold storage. The germplasm was collected from different parts of Africa, India, Yemen, and Oman [14]. Previous phenotypic studies using subsets of the collection revealed the presence of large variation for agro-morphological traits [15,16]. Similarly, wide agro-morphological variation has been recorded in buffelgrass germplasm from South Africa [17], Pakistan [18], Tunisia [19], and other countries [20]. Considerable genetic diversity was also reported in buffelgrass germplasm maintained in the United States Department of Agriculture-Agricultural Research Service (USDA-ARS) genetic resources conservation unit and in germplasm collected from different provenances of Tunisia using AFLP molecular markers [21,22]. Thus, this suggests the presence of wide genetic diversity in the different collections that could be used for the selection of climate resilient lines and to develop novel varieties to address future unforeseen production constraints.
Despite the phenotypic diversity, there is little information on genetic diversity in the collection based on molecular characterization. Developing our understanding of the genetic diversity contained in the collection and how this relates to and potentially complements other collections of this species will contribute to the enhanced use, conservation, and improvement of buffelgrass germplasm globally. Therefore, the aim of this study was to characterize the buffelgrass collection maintained in ILRI’s genebank and to develop a core collection containing most of the genetic diversity using the molecular approach of genotyping-by-sequencing (GBS) of the DArTseq platform.

2. Materials and Methods
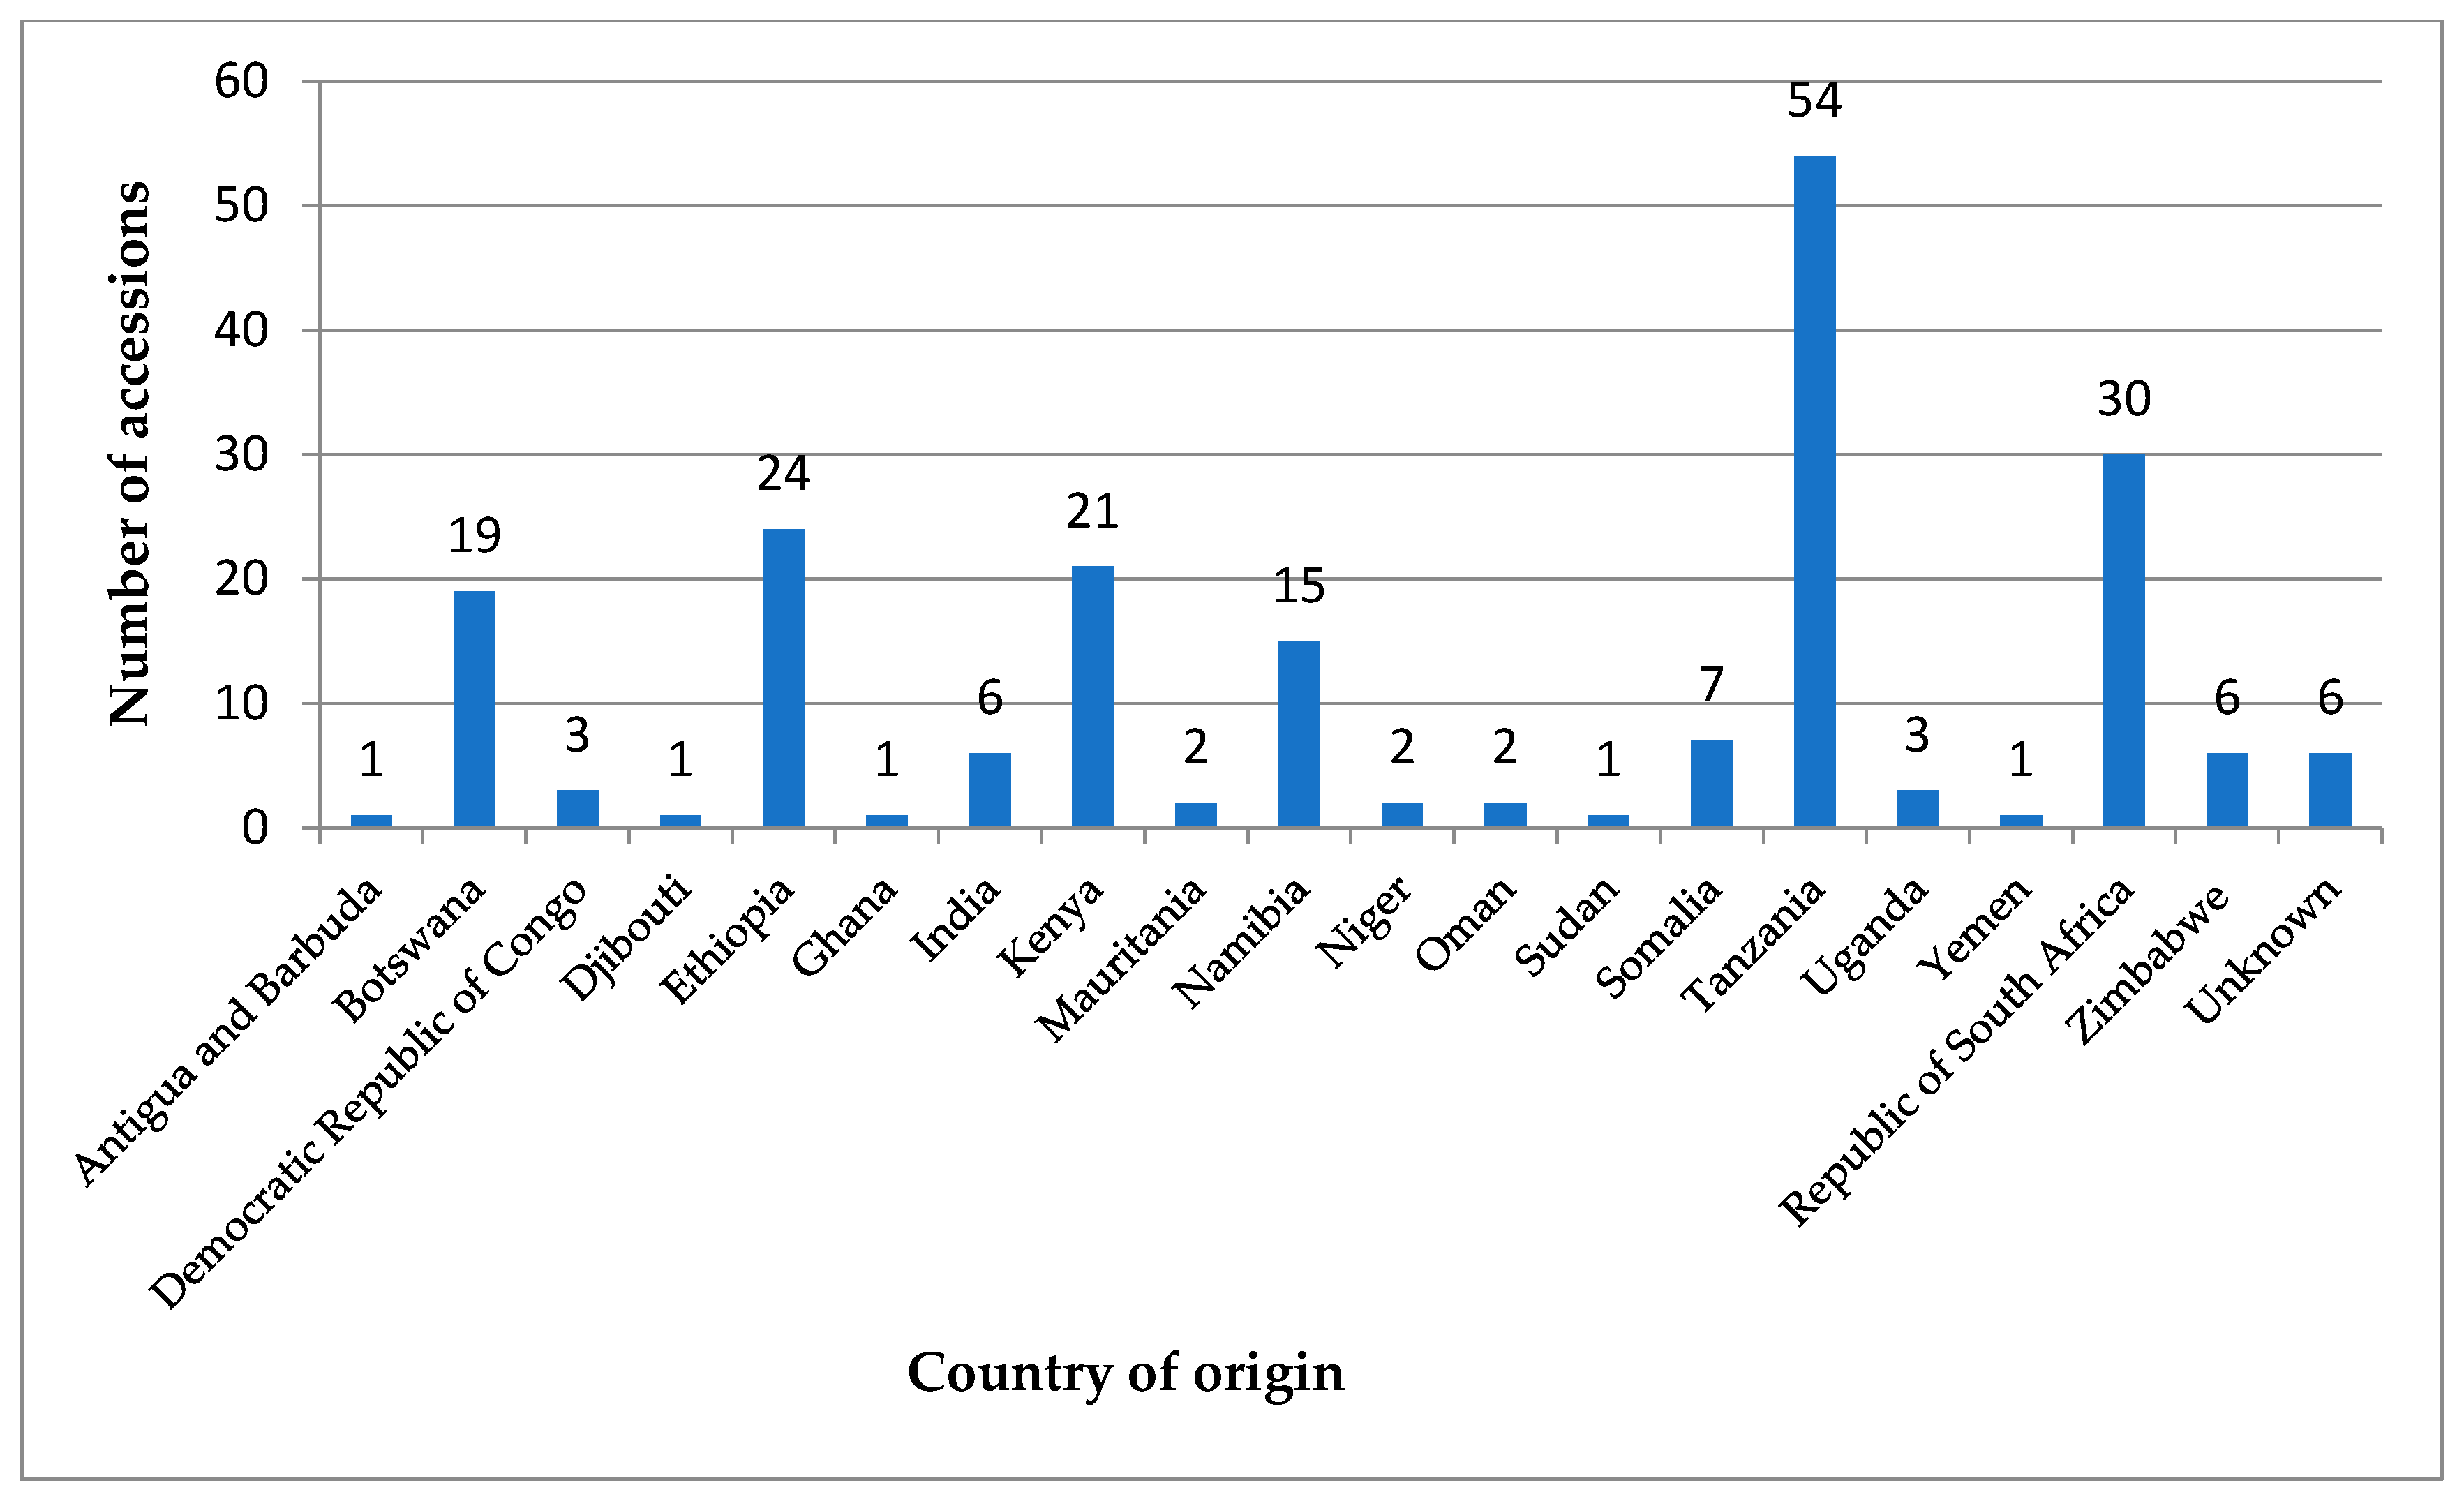
2.1. Materials

Two hundred and five accessions of buffelgrass held in the ILRI genebank were used in the study. The collection contains germplasm collected from different parts of Africa, Asia, and Middle East (Figure 1, Table S1). The collection contains accessions with a diverse range of morphological and agronomic characteristics [15,16].

2.2. DNA Extraction

Leaf samples were collected from plants maintained in Zwai (7.899966, 38.734574) field genebank of Oromia region, Ethiopia. DNA was extracted from freeze-dried leaf samples using a DNeasy Plant Mini kit (Cat No./ID:69106) according to the manufacturer’s instructions. The DNA quantity and quality were checked using a DeNovix DS-11 spectrophotometer. DNA samples were diluted to a concentration of 50–100 ng/µL, and 25 µL of the diluted DNA samples was aliquoted into 96-well fully skirted plates, packed, and shipped for genotyping.

2.3. Genotyping

GBS was performed on the DArTseq platform at Diversity Array, Canberra, Australia. The single nucleotide polymorphism (SNP) markers were generated according to the DArTSeq protocol as described elsewhere [23]. The marker fragments were aligned with the Setaria italica reference genome [24] and the genome-wide distribution of the markers was visualized using the R-package Synbreed [25]. The reference genome of Setaria italica was selected based on phylogenetic tree analysis of species in the Poaceae family, for which the whole genome sequence is available in the literature [26]. The basic chromosome number and the subfamily were also taken into account in selecting the reference genome. Cenchrus ciliaris and Setaria italica belong to the subfamily Panicoideae (Poaceae) and have a similar basic chromosome number of x = 9.

2.4. Data Analysis

The genotyping data were analyzed using various statistical software packages. The percentage of missing data and polymorphic information content (PIC) were calculated in Microsoft Excel. The PIC value was calculated using the formula PIC = 1 − ∑Xi2, where Xi is the frequency of the ith allele of the SNP marker [27]. Markers with known genomic positions, ≤20% missing data, and PIC value of ≥0.2 were selected for population structure and genetic diversity analyses. The DAPC function of the R package adegenet [28] was used to determine the optimal number of groups and assign individual accessions to the different groups, as well as to determine a marker’s contribution to the diversity in the collection. The Euclidean distance matrix and hierarchical clustering were calculated using the dist () and hclust () functions of R statistical software [29]. The R packages dendextend [30] and factoextra [31] were used to visualize the phylogenetic relationship and a principal component analysis of the population, respectively. Analysis of molecular variance (AMOVA) was conducted to determine the contribution of, among, and within cluster variation to the total variation using GenAlex 6.5 [32]. The STRUCTURE software [33,34] was used to analyze population structure as described elsewhere [35], with modifications as follows: The burn-in time and number of iterations were set to 30,000, with three repetitions testing the probability of K = 2–20 subpopulations. The results of the run were uploaded to the software “Structure harvester” [36] and the optimal number of subpopulations was determined by the Evanno method [37].

2.5. Core Collection Development

The R package Core Hunter v.3.2.1 [38] was used to select a subset of accessions broadly representing the genetic diversity held in the collection. Genotyping data of 1000 informative SNP markers identified during diversity analysis of the collection were used for core collection development. To assess the representation of the core collection, analysis of molecular variance (AMOVA) and principal coordinate analysis visualization were performed using GenAlex 6.5 [32].

3. Results

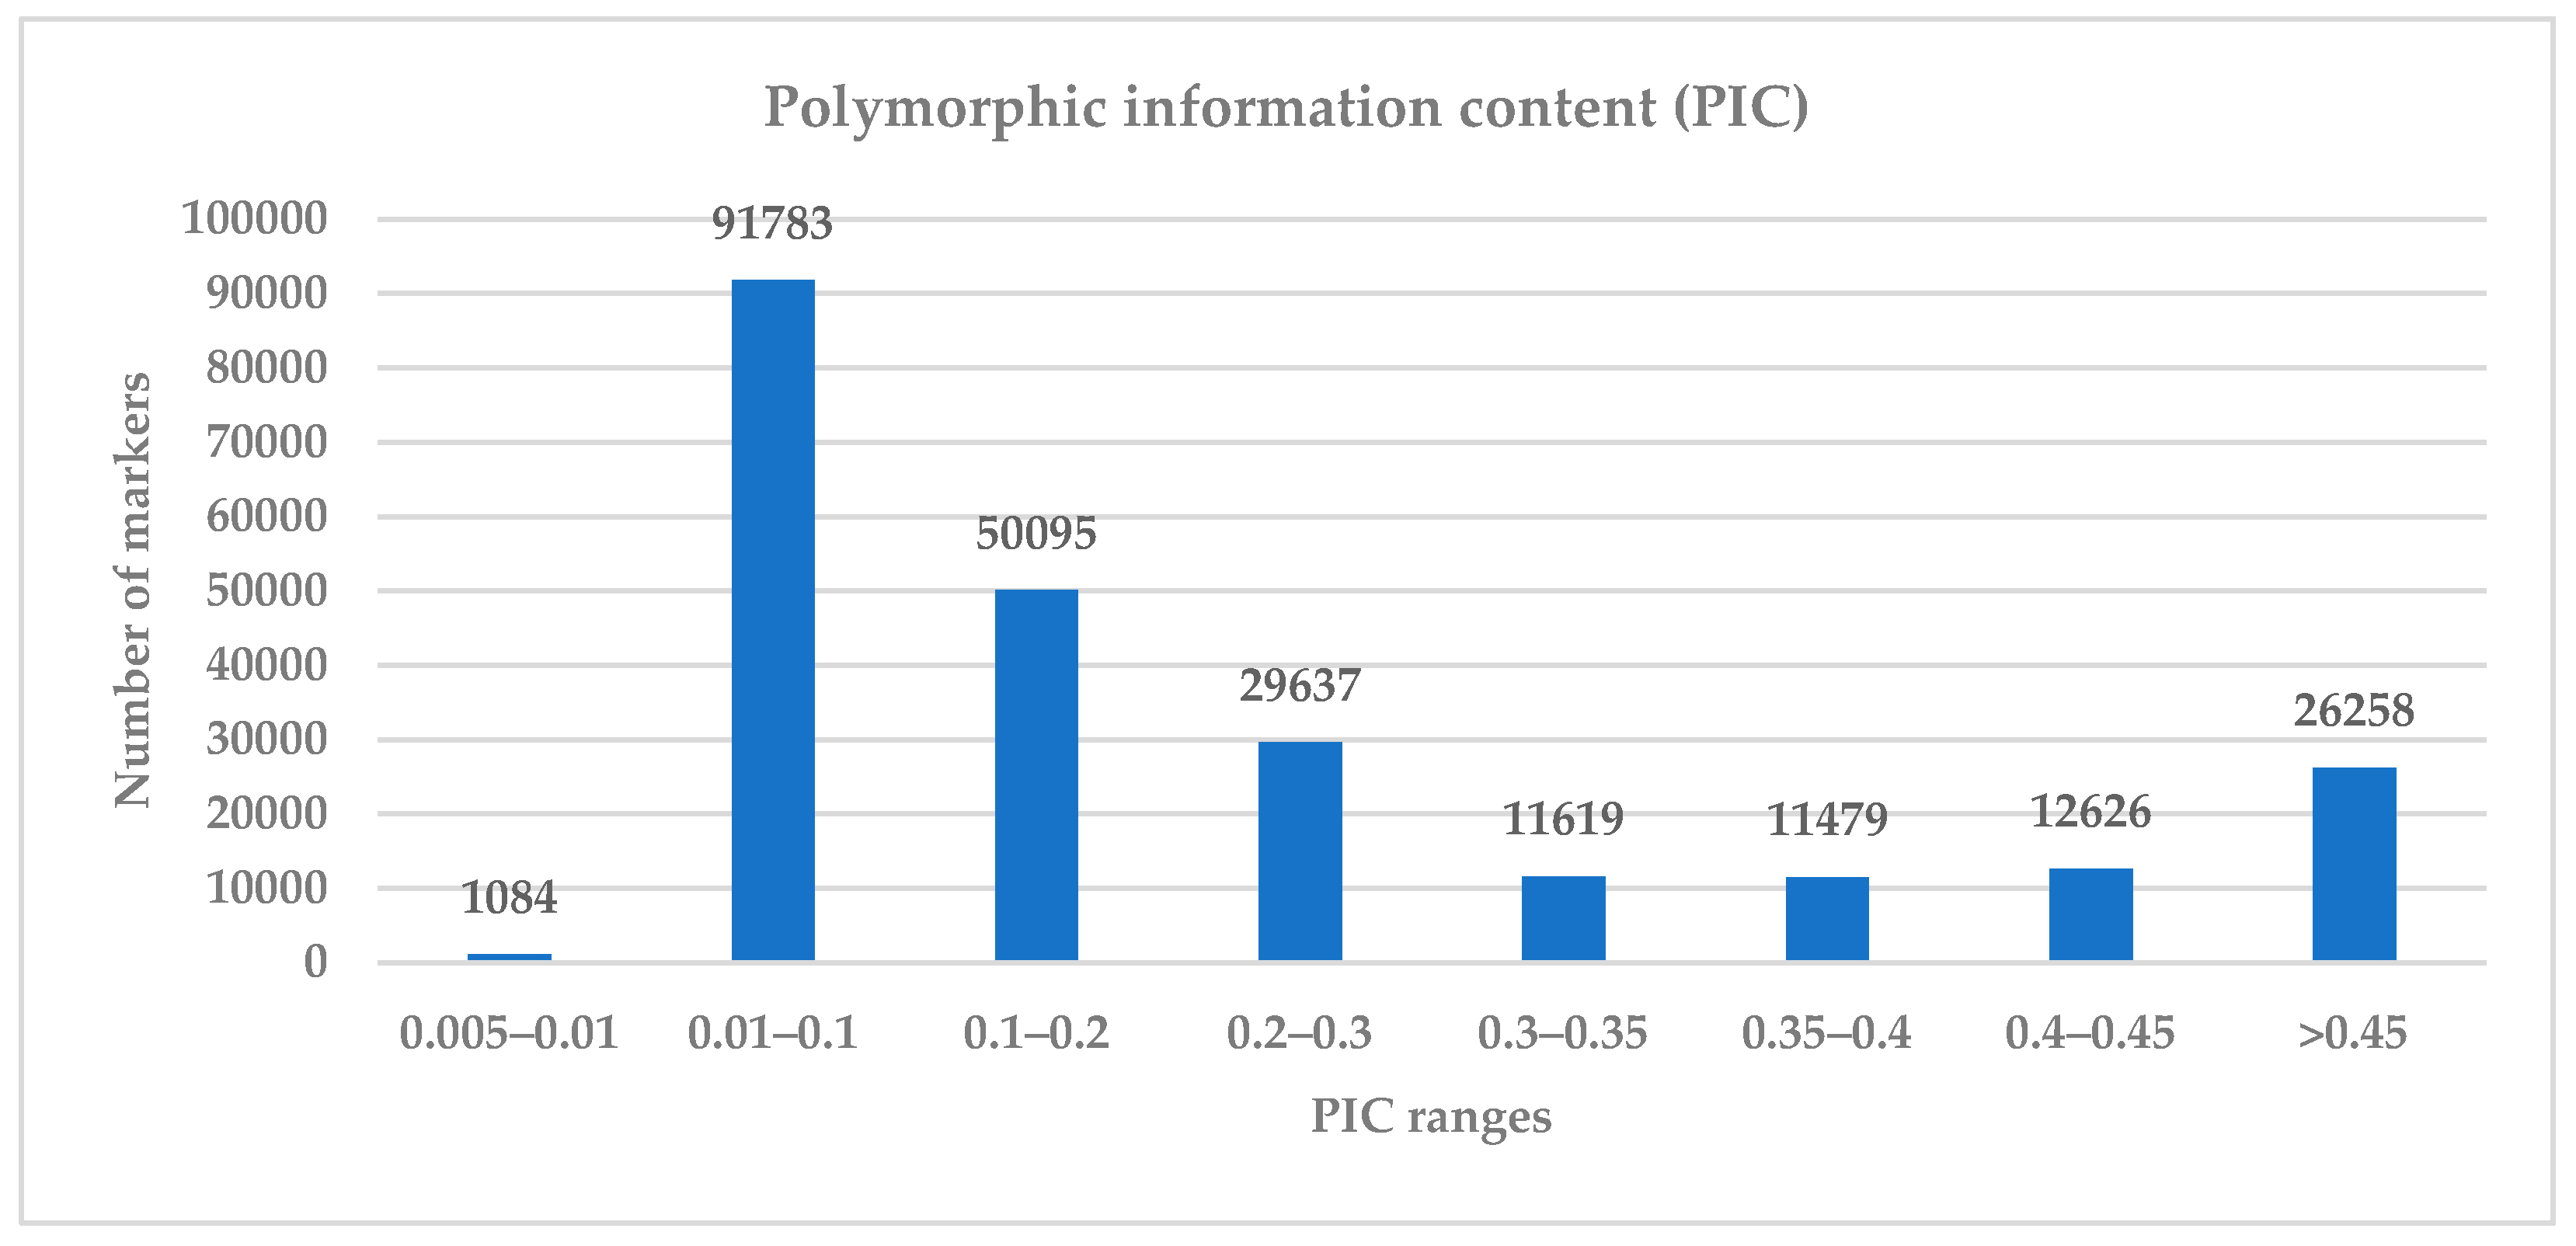
3.1. Informativeness and Diversity of the SNP Markers

A total of 234,581 SNP markers were generated for the 205 buffelgrass accessions. The PIC value of the markers ranged from 0.005 to 0.5 (Figure 2), and 65,361 SNP markers had a PIC value of ≥0.2. The missing data percentage ranged from 1% to 92% per SNP marker and 42% to 81% per accession, with an average of 65.5%. Approximately, 1% of the markers (2163) had no missing data, while 4.3% of the markers (10,318) had up to 20% missing data.

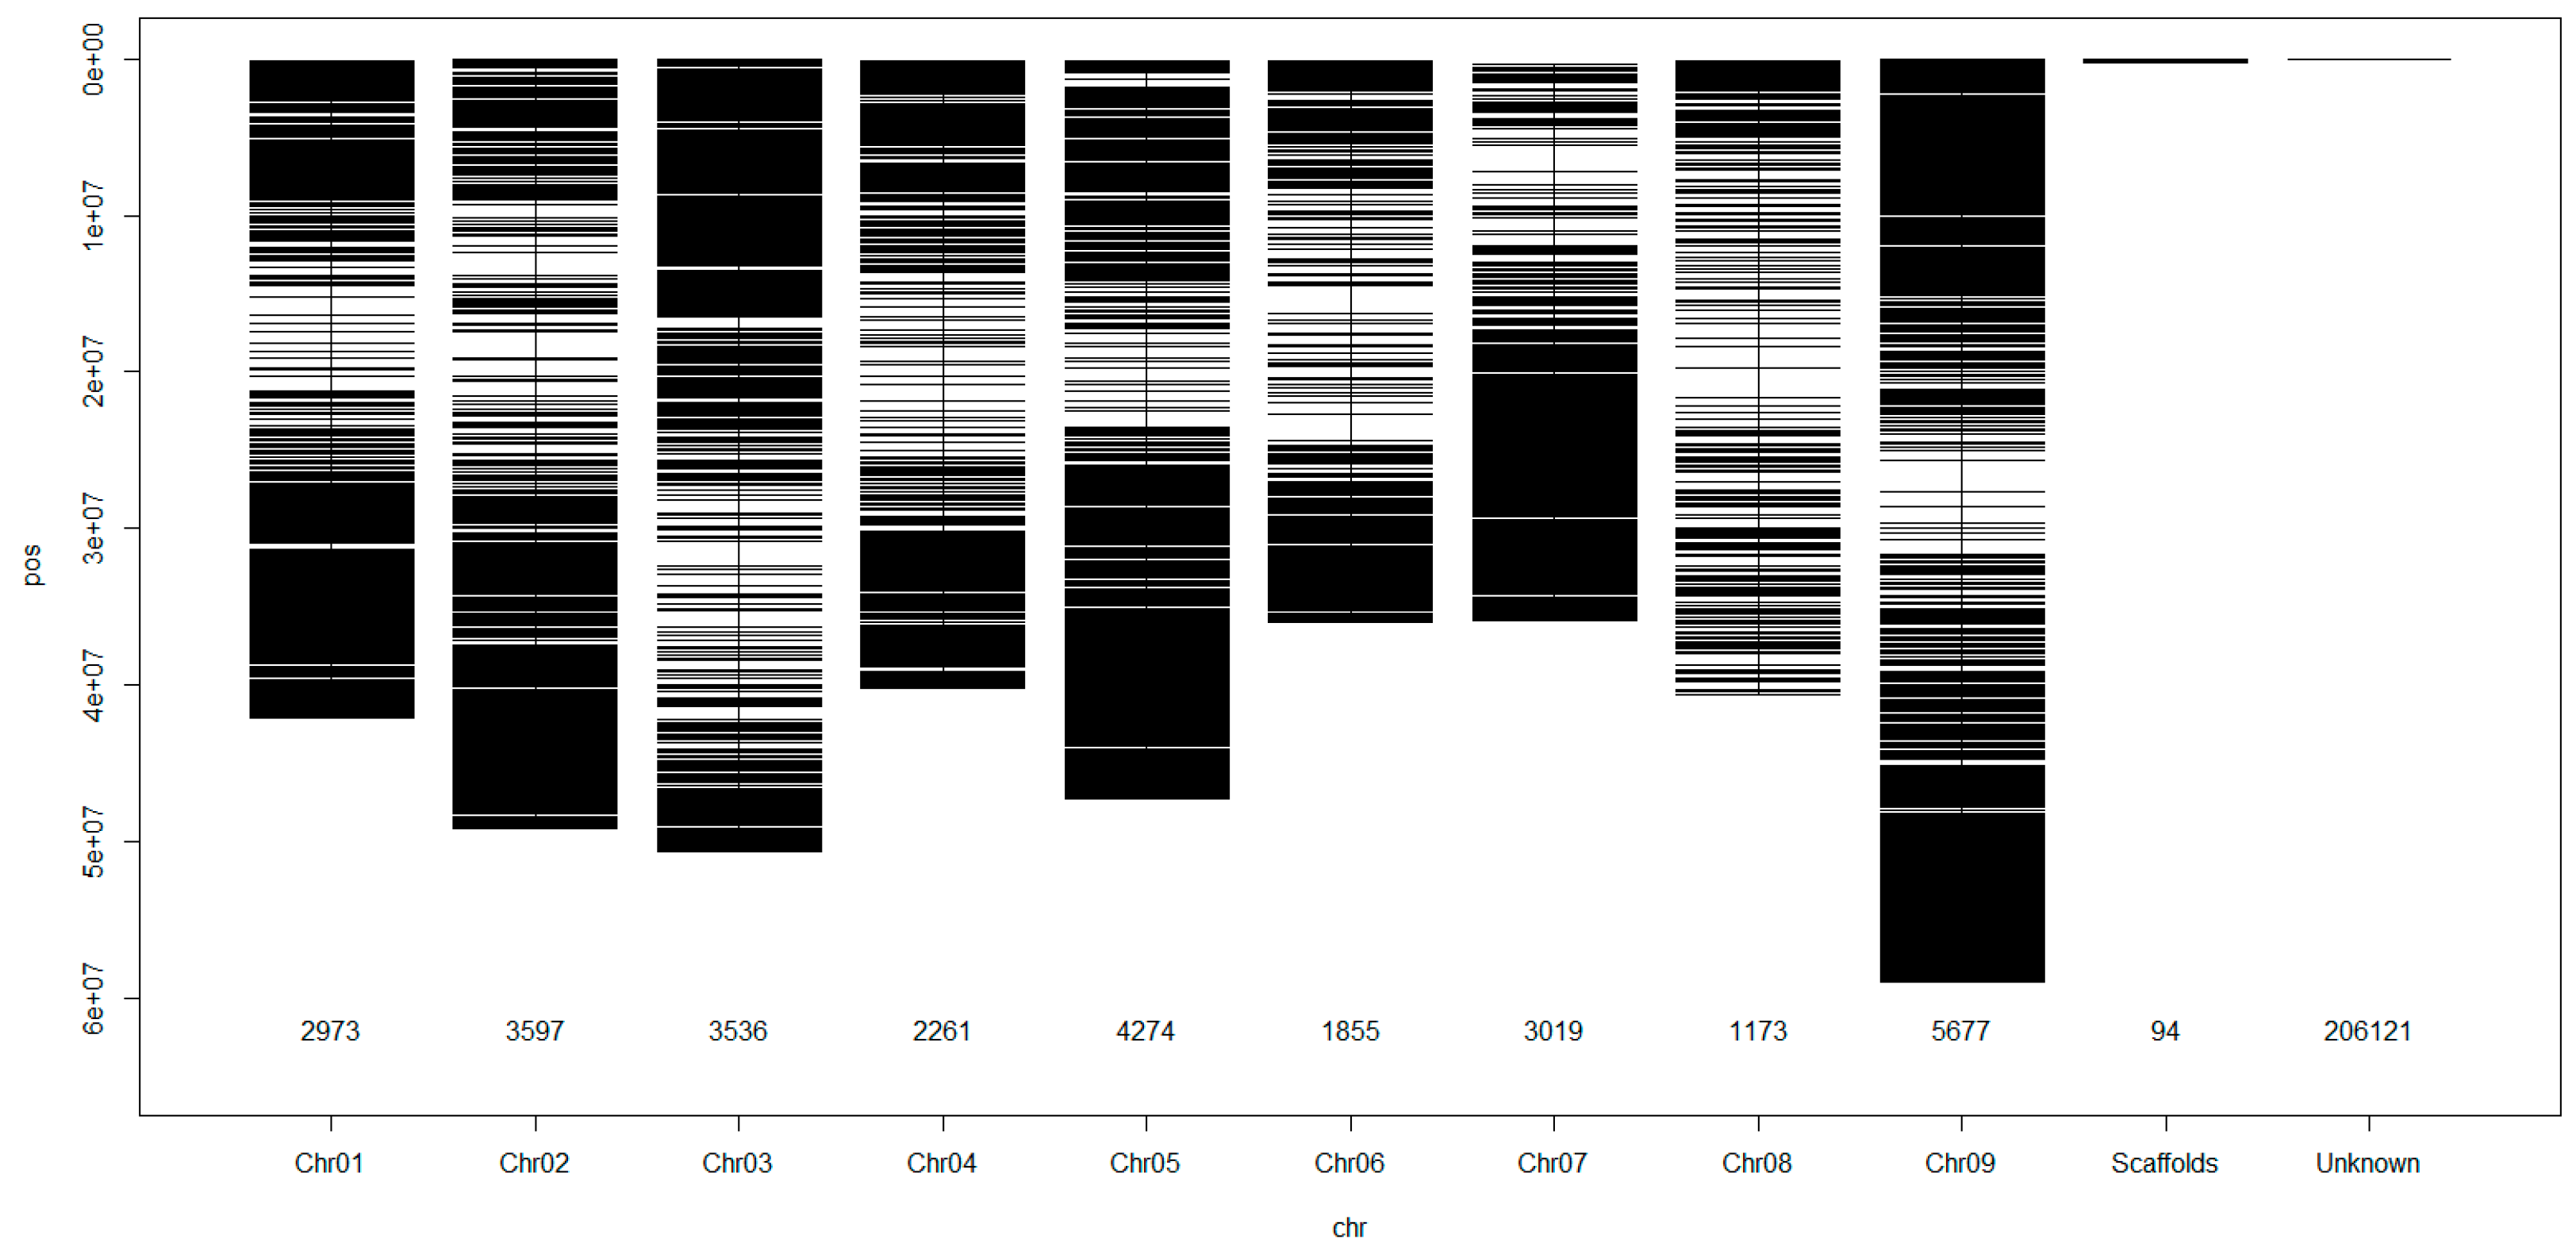
3.2. Mapping and Genome Wide Distribution of the SNP Markers

Figure 3 shows the genome-wide distribution of the SNP markers on the Setaria italica reference genome [24]. Around 12% (28,459) of the markers mapped onto the different chromosomes and scaffolds. The largest number of markers were mapped onto chromosome 9 (5677 SNP markers) followed by chromosomes 5 (4274 markers), 2 (3597 markers), and 3 (3526 markers). The lowest number of markers were mapped onto chromosomes 8 (1173 markers) and 6 (1855 markers). A few markers (94 SNPs) were mapped onto different scaffolds. Over 88% of the markers (206,122) were not able to be mapped onto the Setaria italica reference genome.

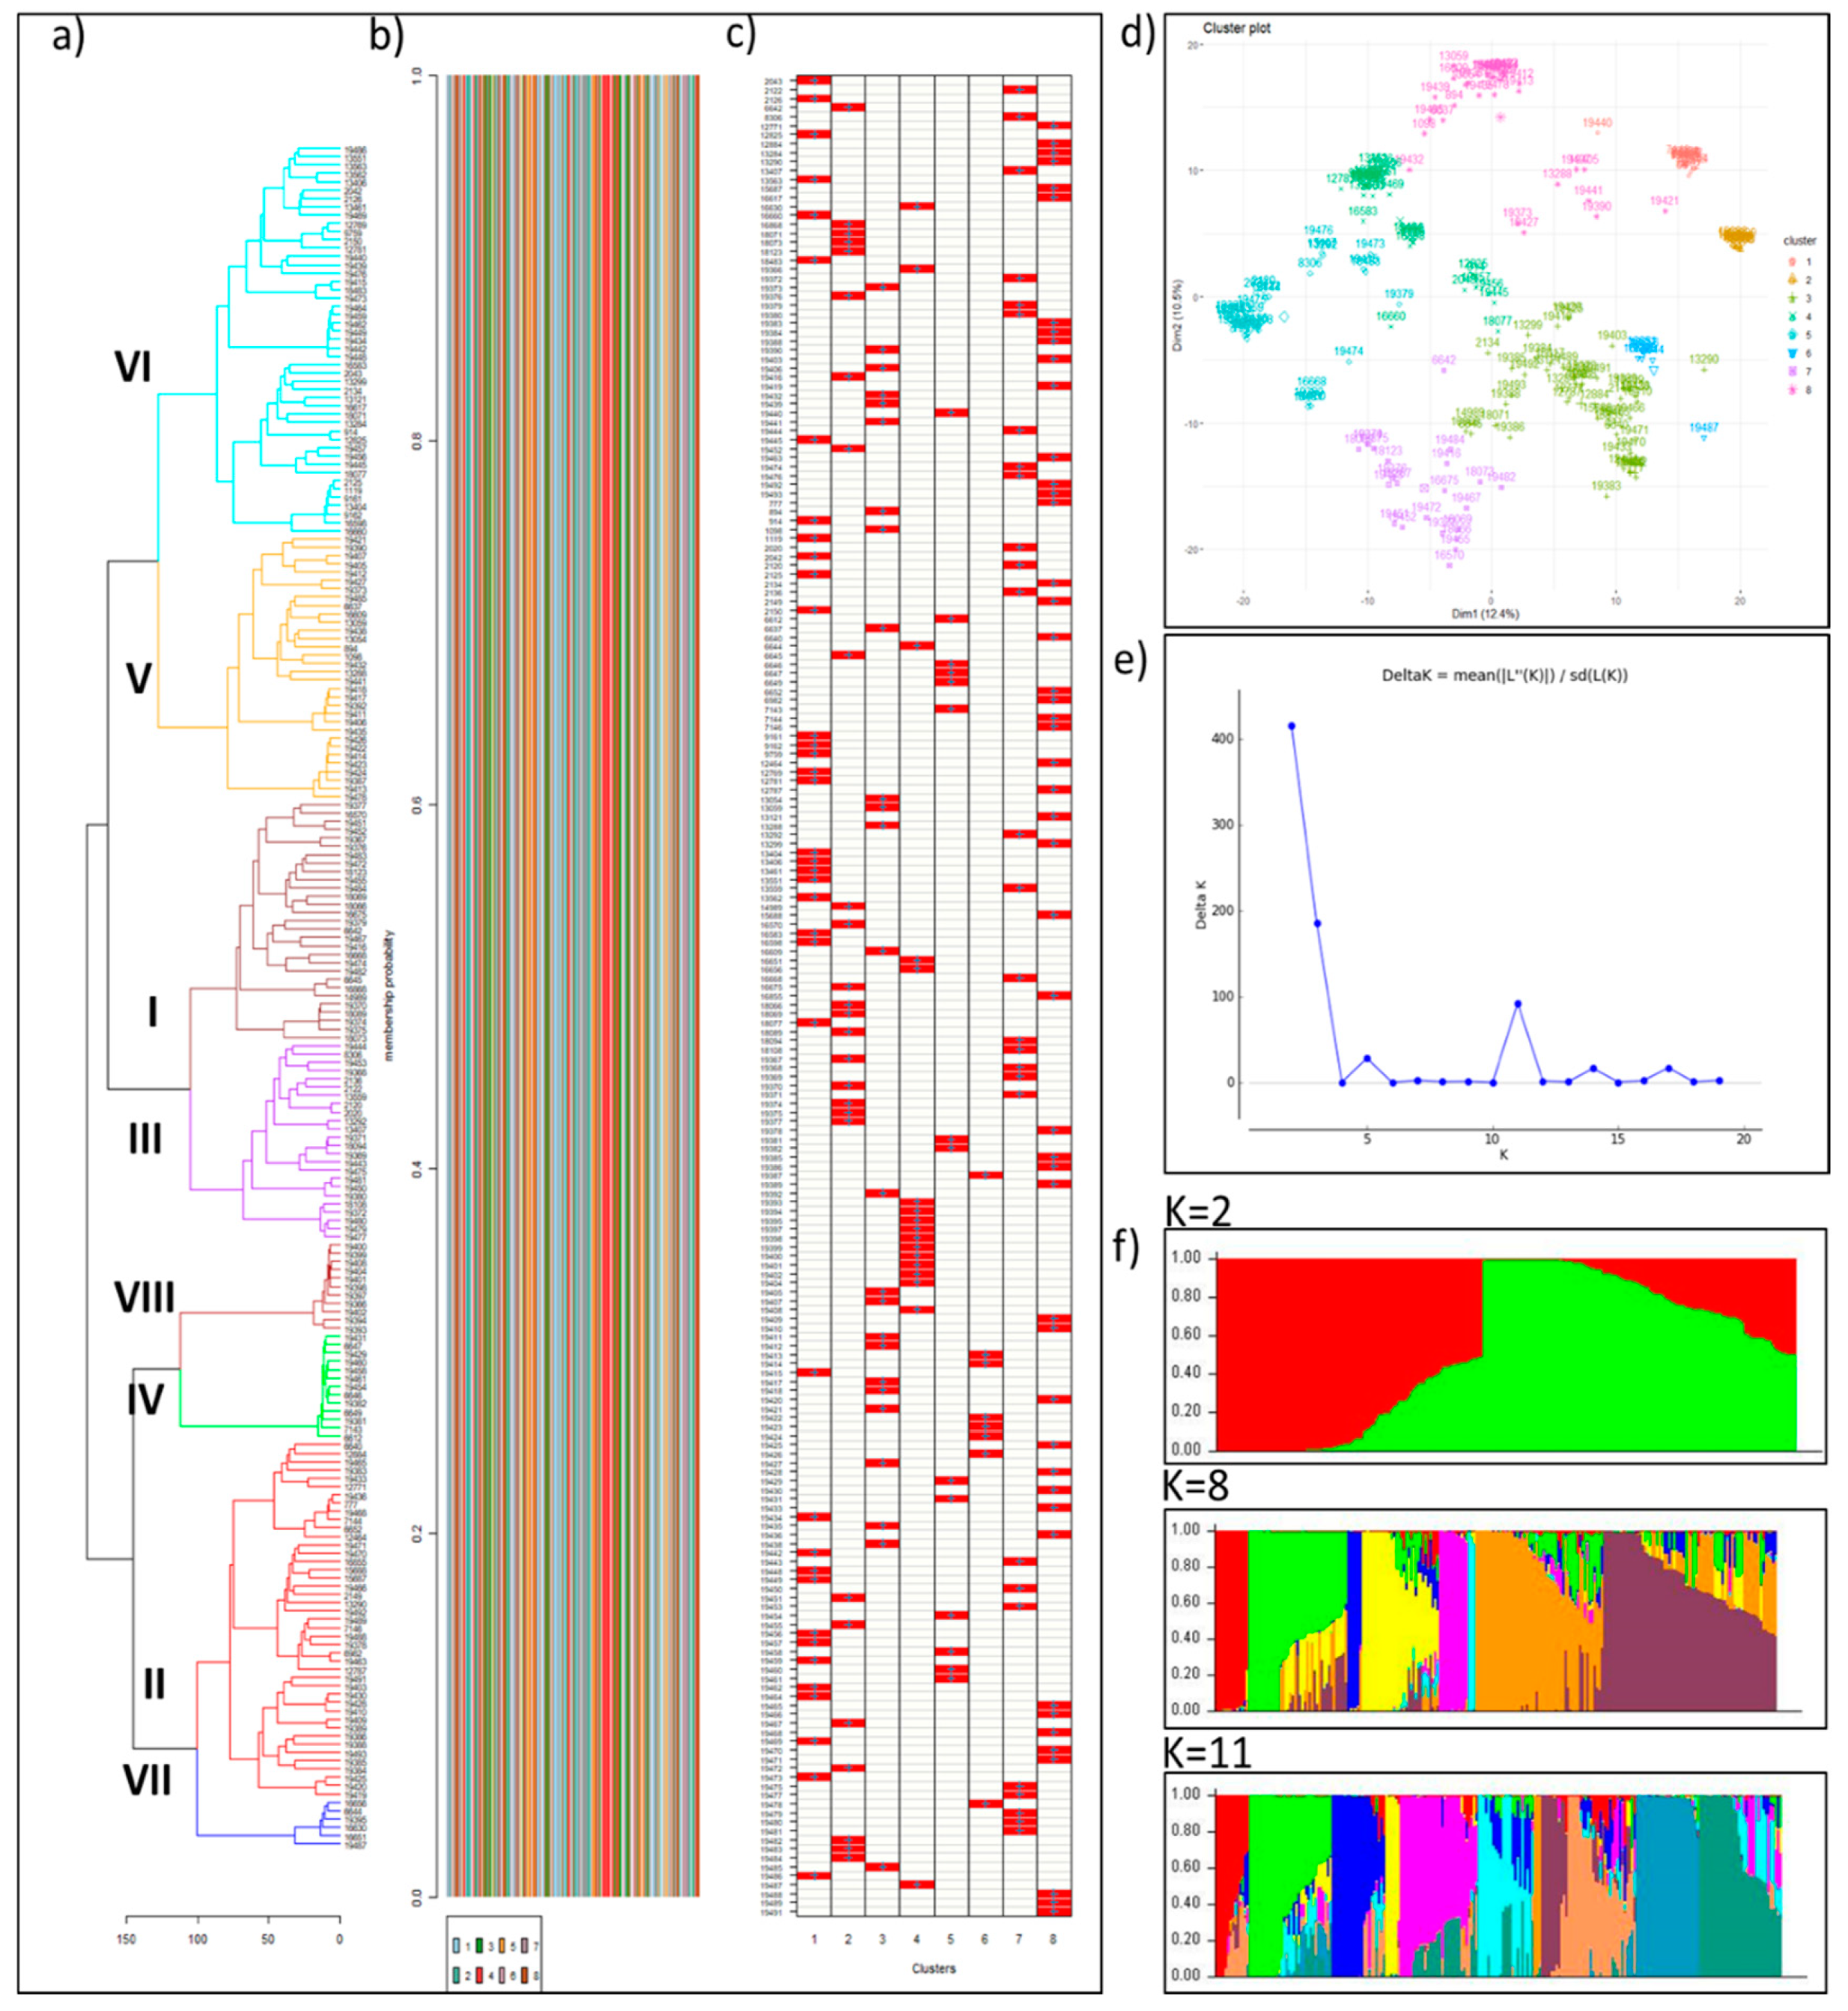
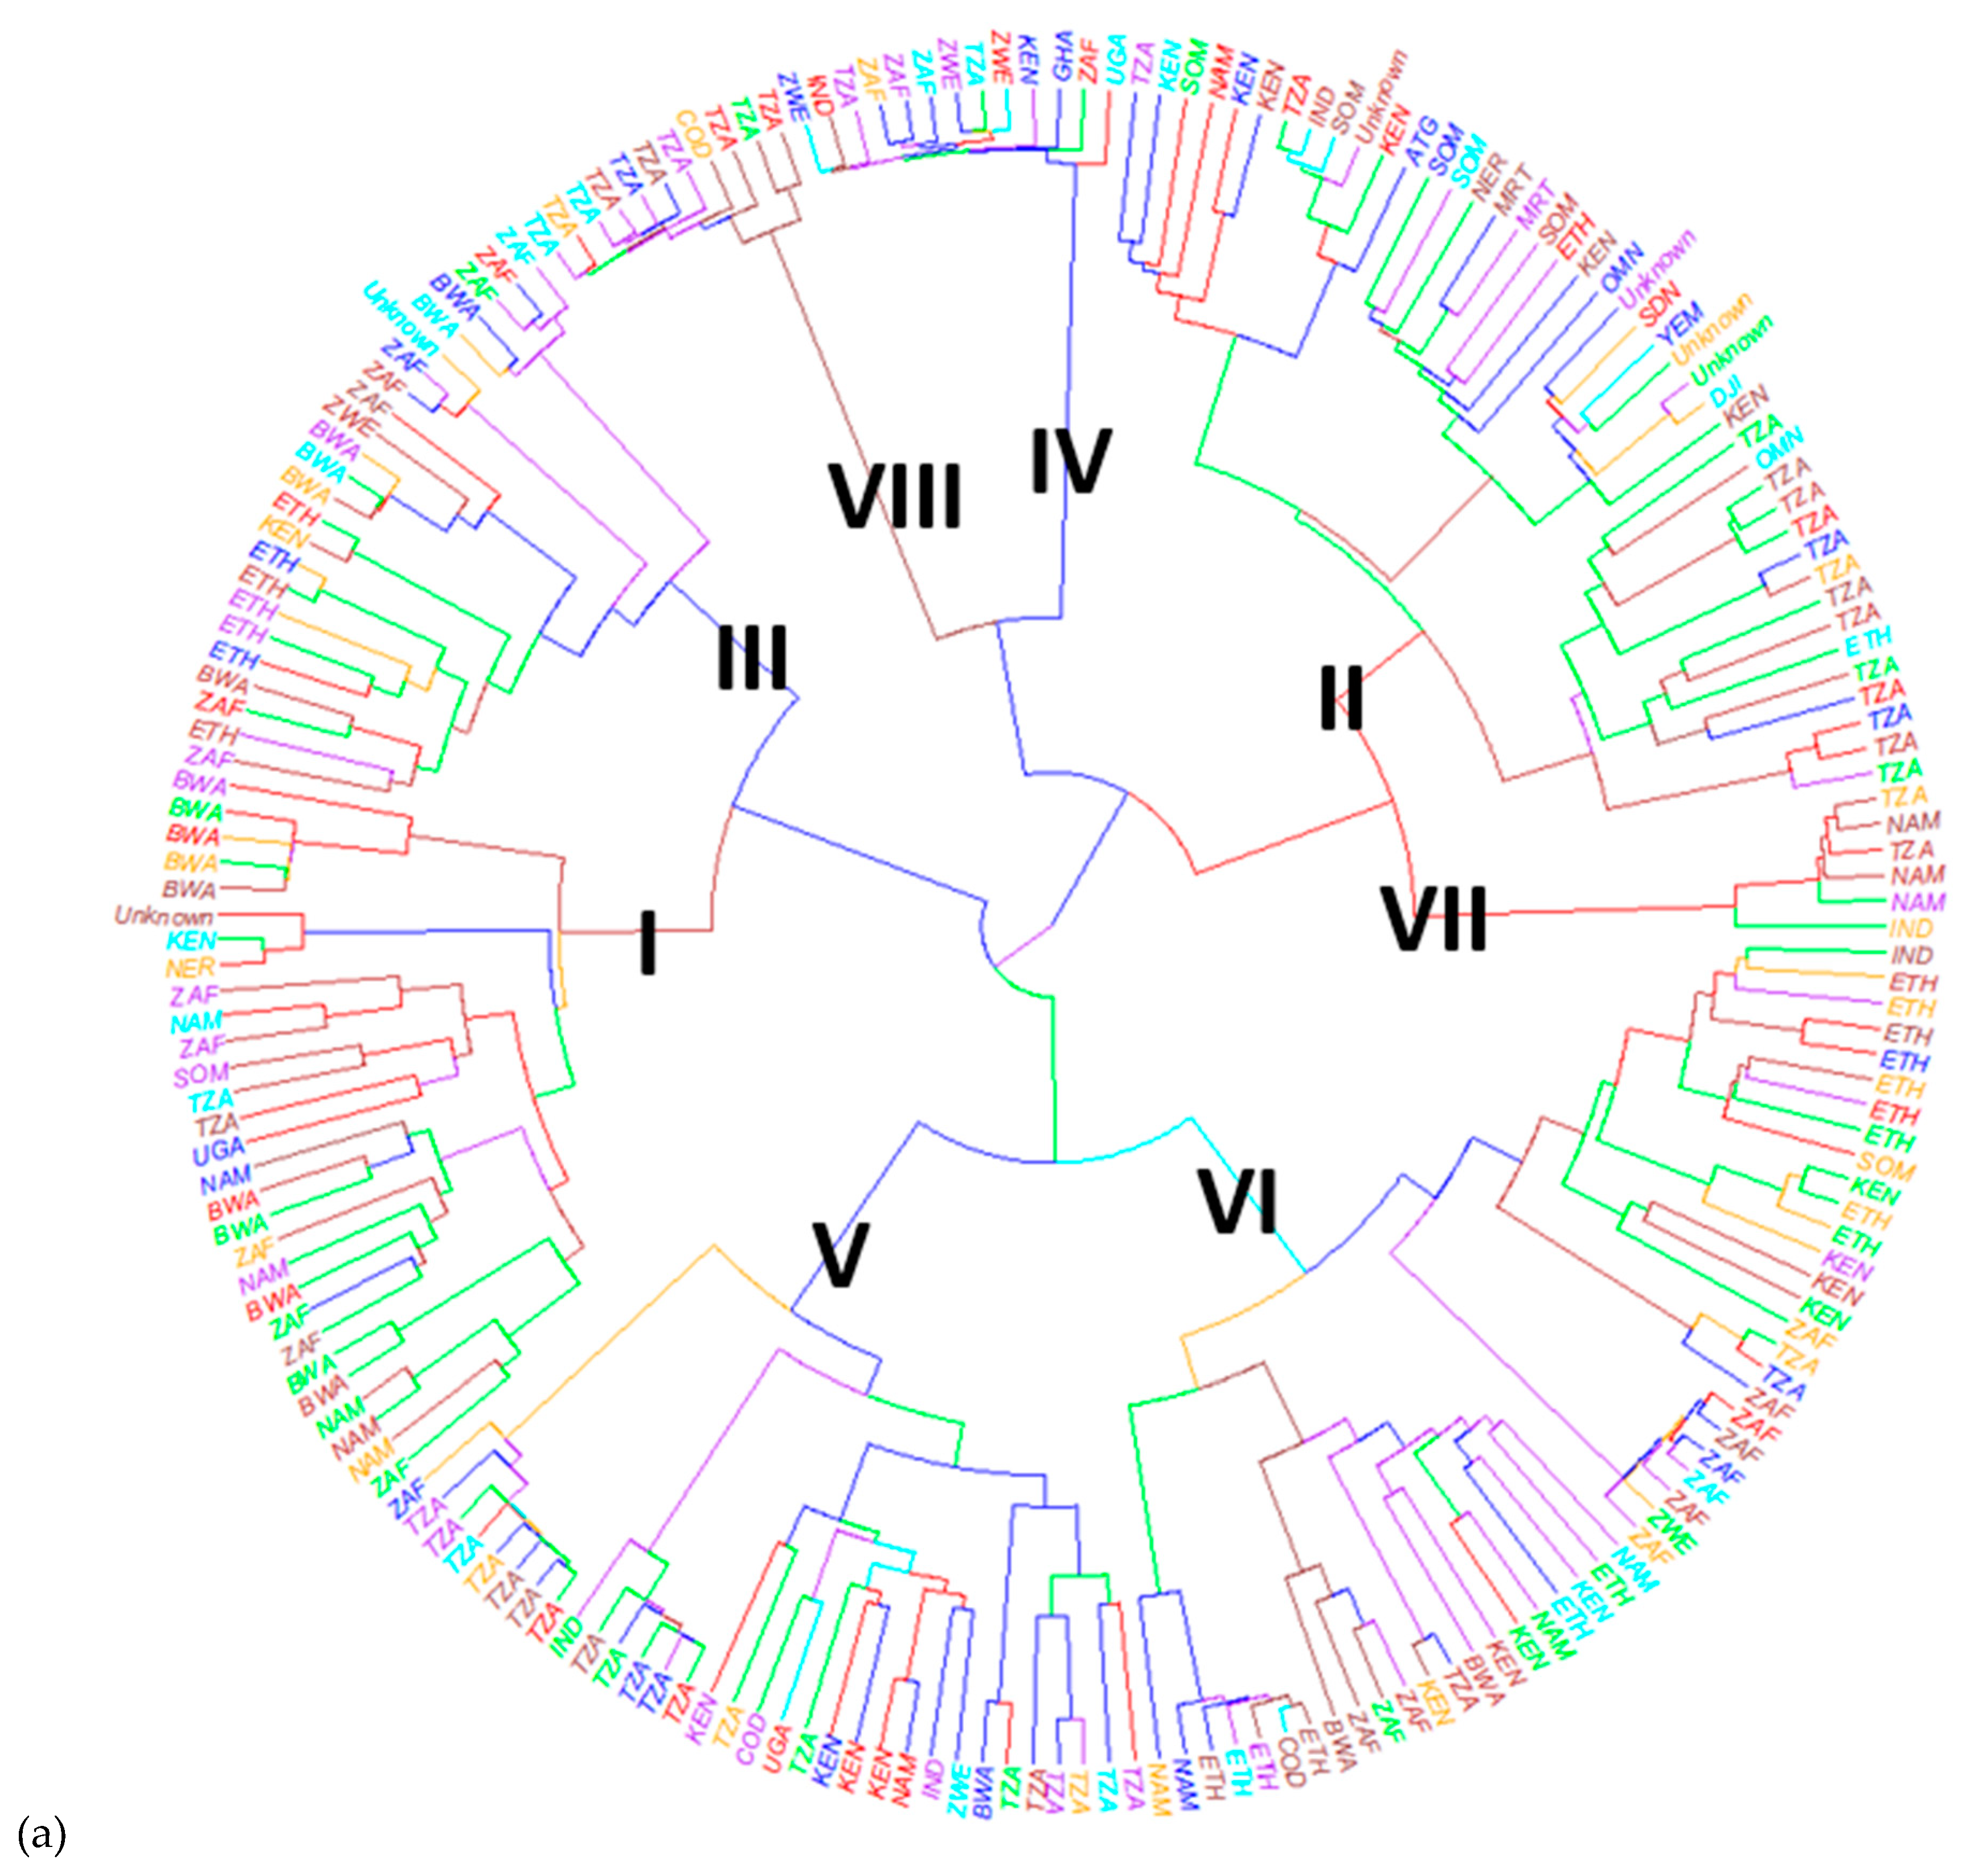
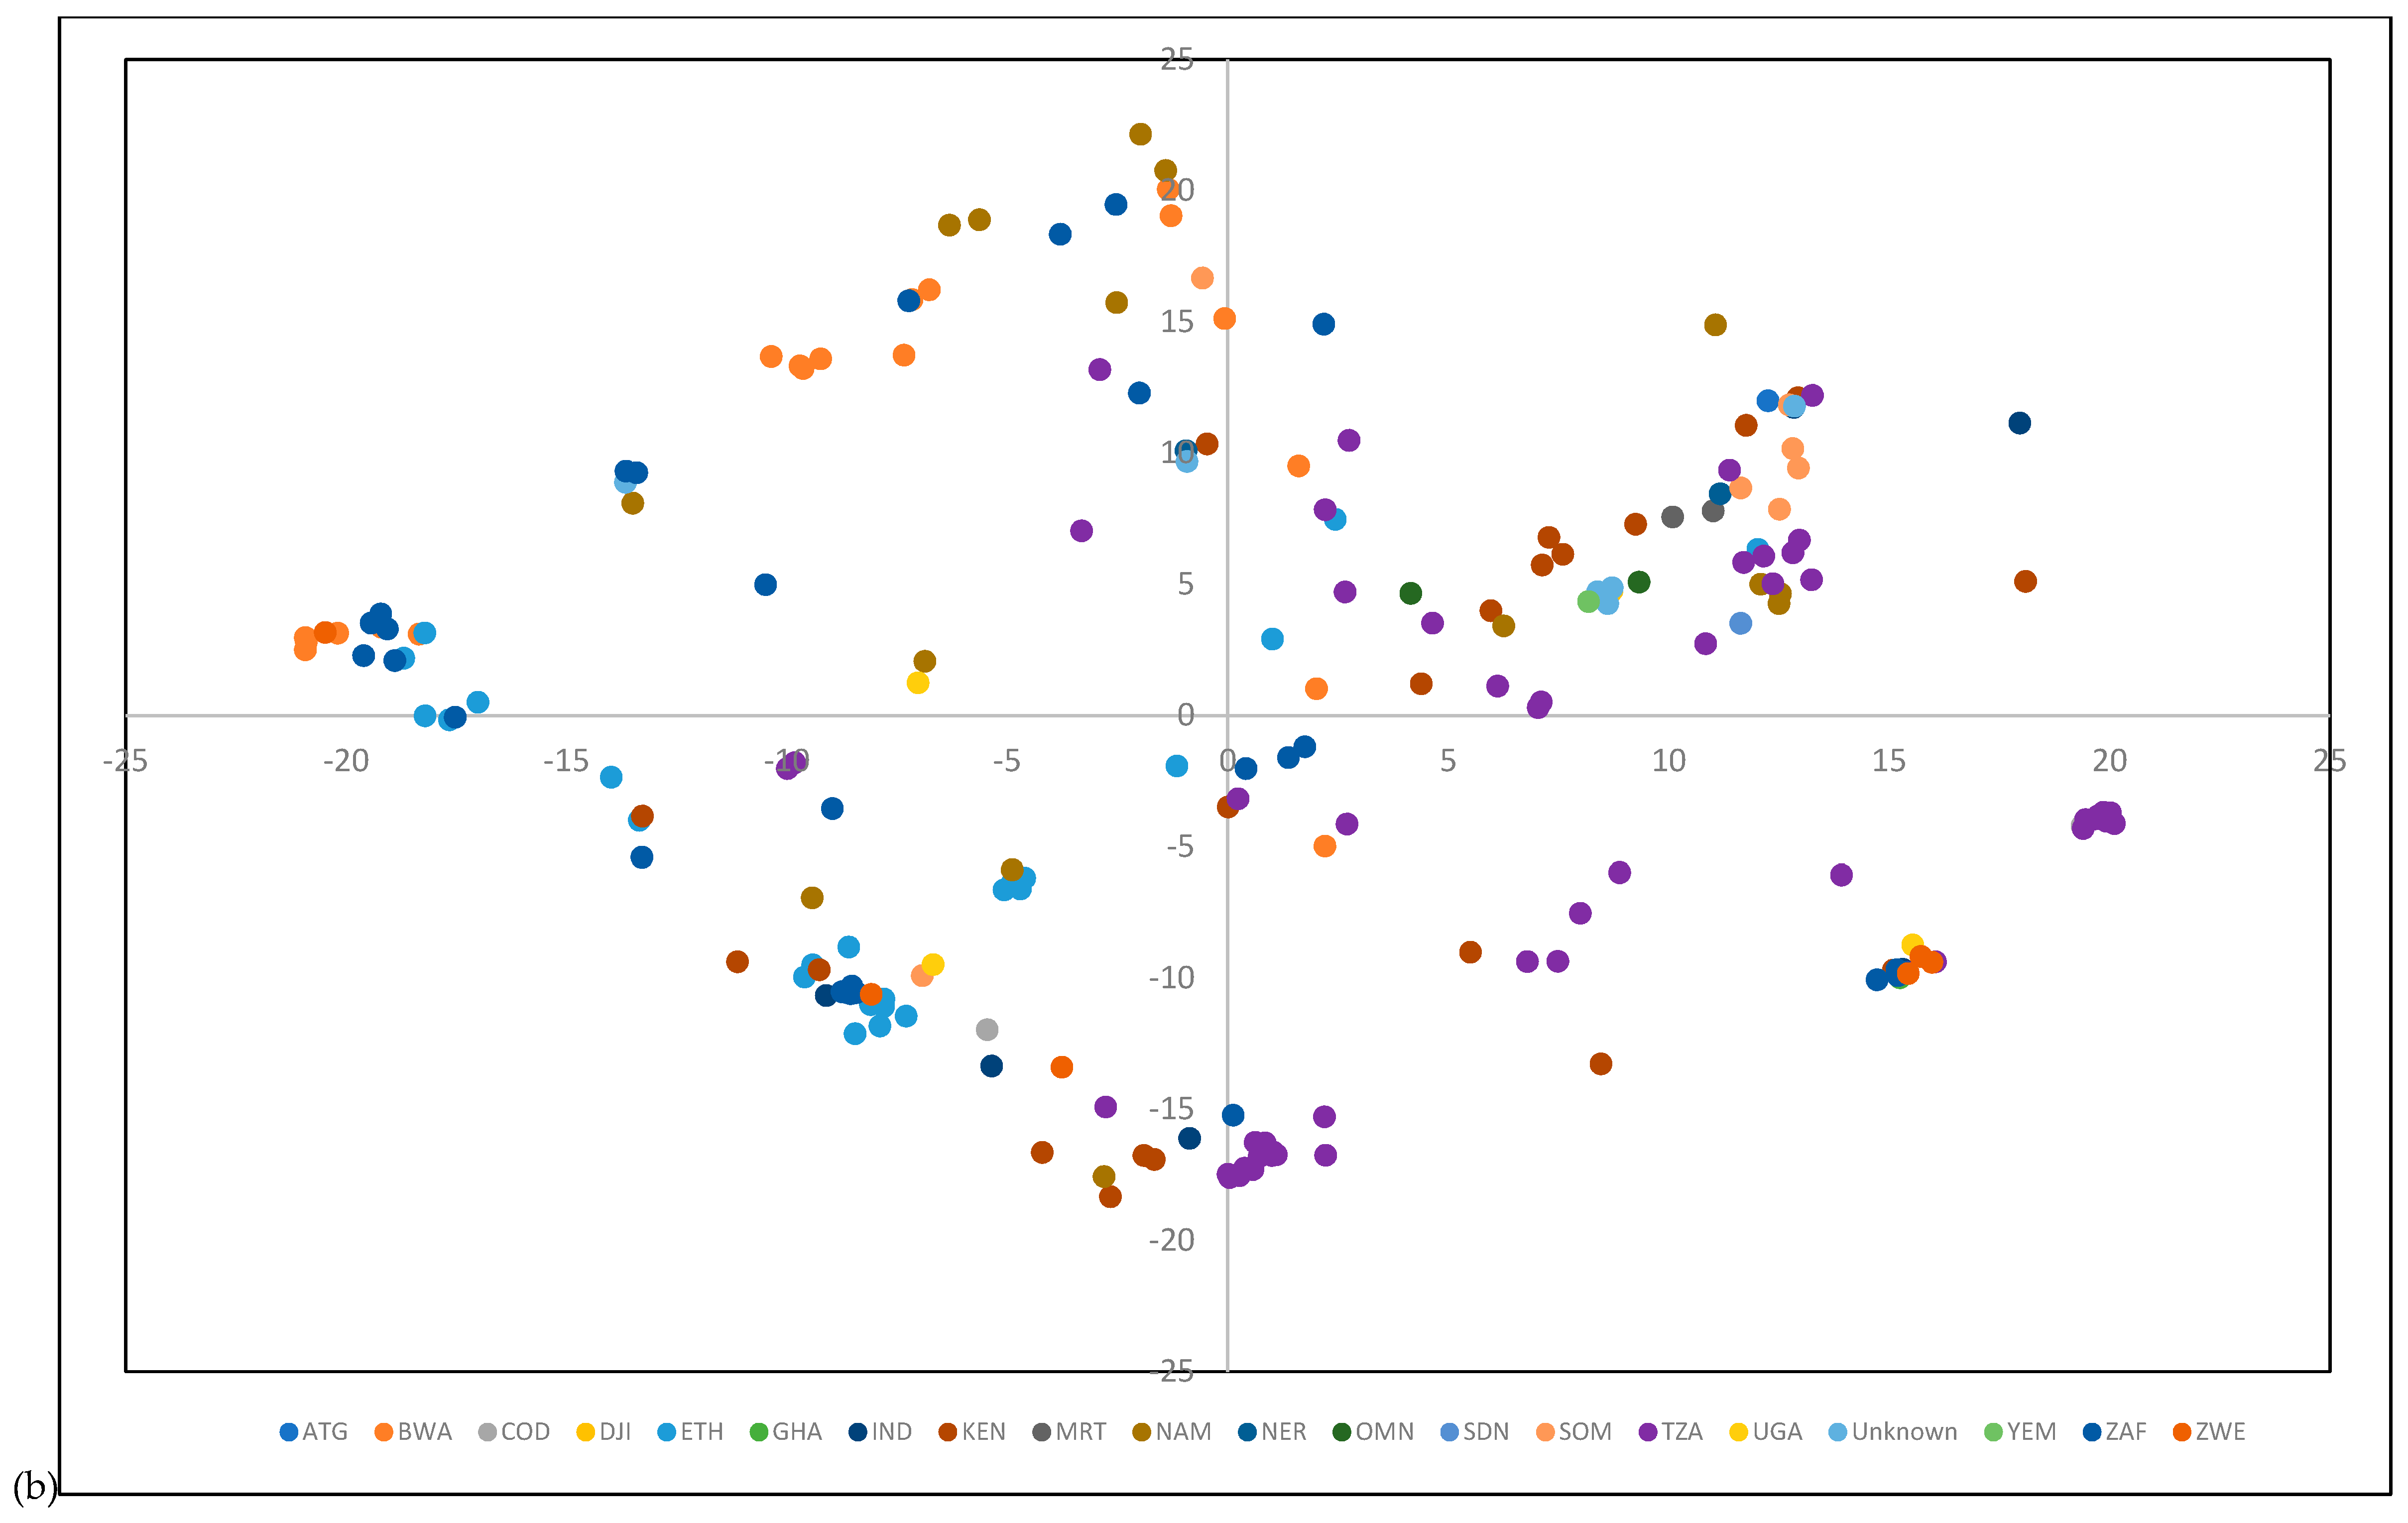
3.3. Population Structure and Genetic Diversity of the Buffelgrass Collection

To assess the genetic diversity and population structure of the collection, markers with missing data percentage of ≤20%, polymorphic information content (PIC) values of ≥0.2, and that were mapped onto the reference genome were selected. From 1641 SNP markers which passed the selection criteria, the top 1000 markers contributing to the diversity and clustering were selected using the R package adegenet [28] for in-depth analyses of the collection (population structure and diversity). The average PIC value of the selected markers was 0.35. Figure 4 shows the genome wide distribution of the selected 1000 SNP markers.
The hierarchical cluster analysis grouped the collection into eight clusters (Figure 5a) with further subclusters, and the accessions were assigned to the clusters with clear cluster membership (Figure 5b,c). The result of a cluster plot using the first two components, which explained 22.9% of the total variation, was consistent with the hierarchical clustering (Figure 5d). AMOVA was used to estimate the components of total genetic variation (Table 1). The AMOVA result showed that the among and within cluster diversity explained 38% and 62% of the total variation, respectively. In addition, population structure was also analyzed with the STRUCTURE software [30,31], with the highest delta K (∆K) [34] at K = 2 suggesting the presence of two main groups in the collection (Figure 5e,f). There was a second peak at K = 11, indicating further subgrouping of the collection.

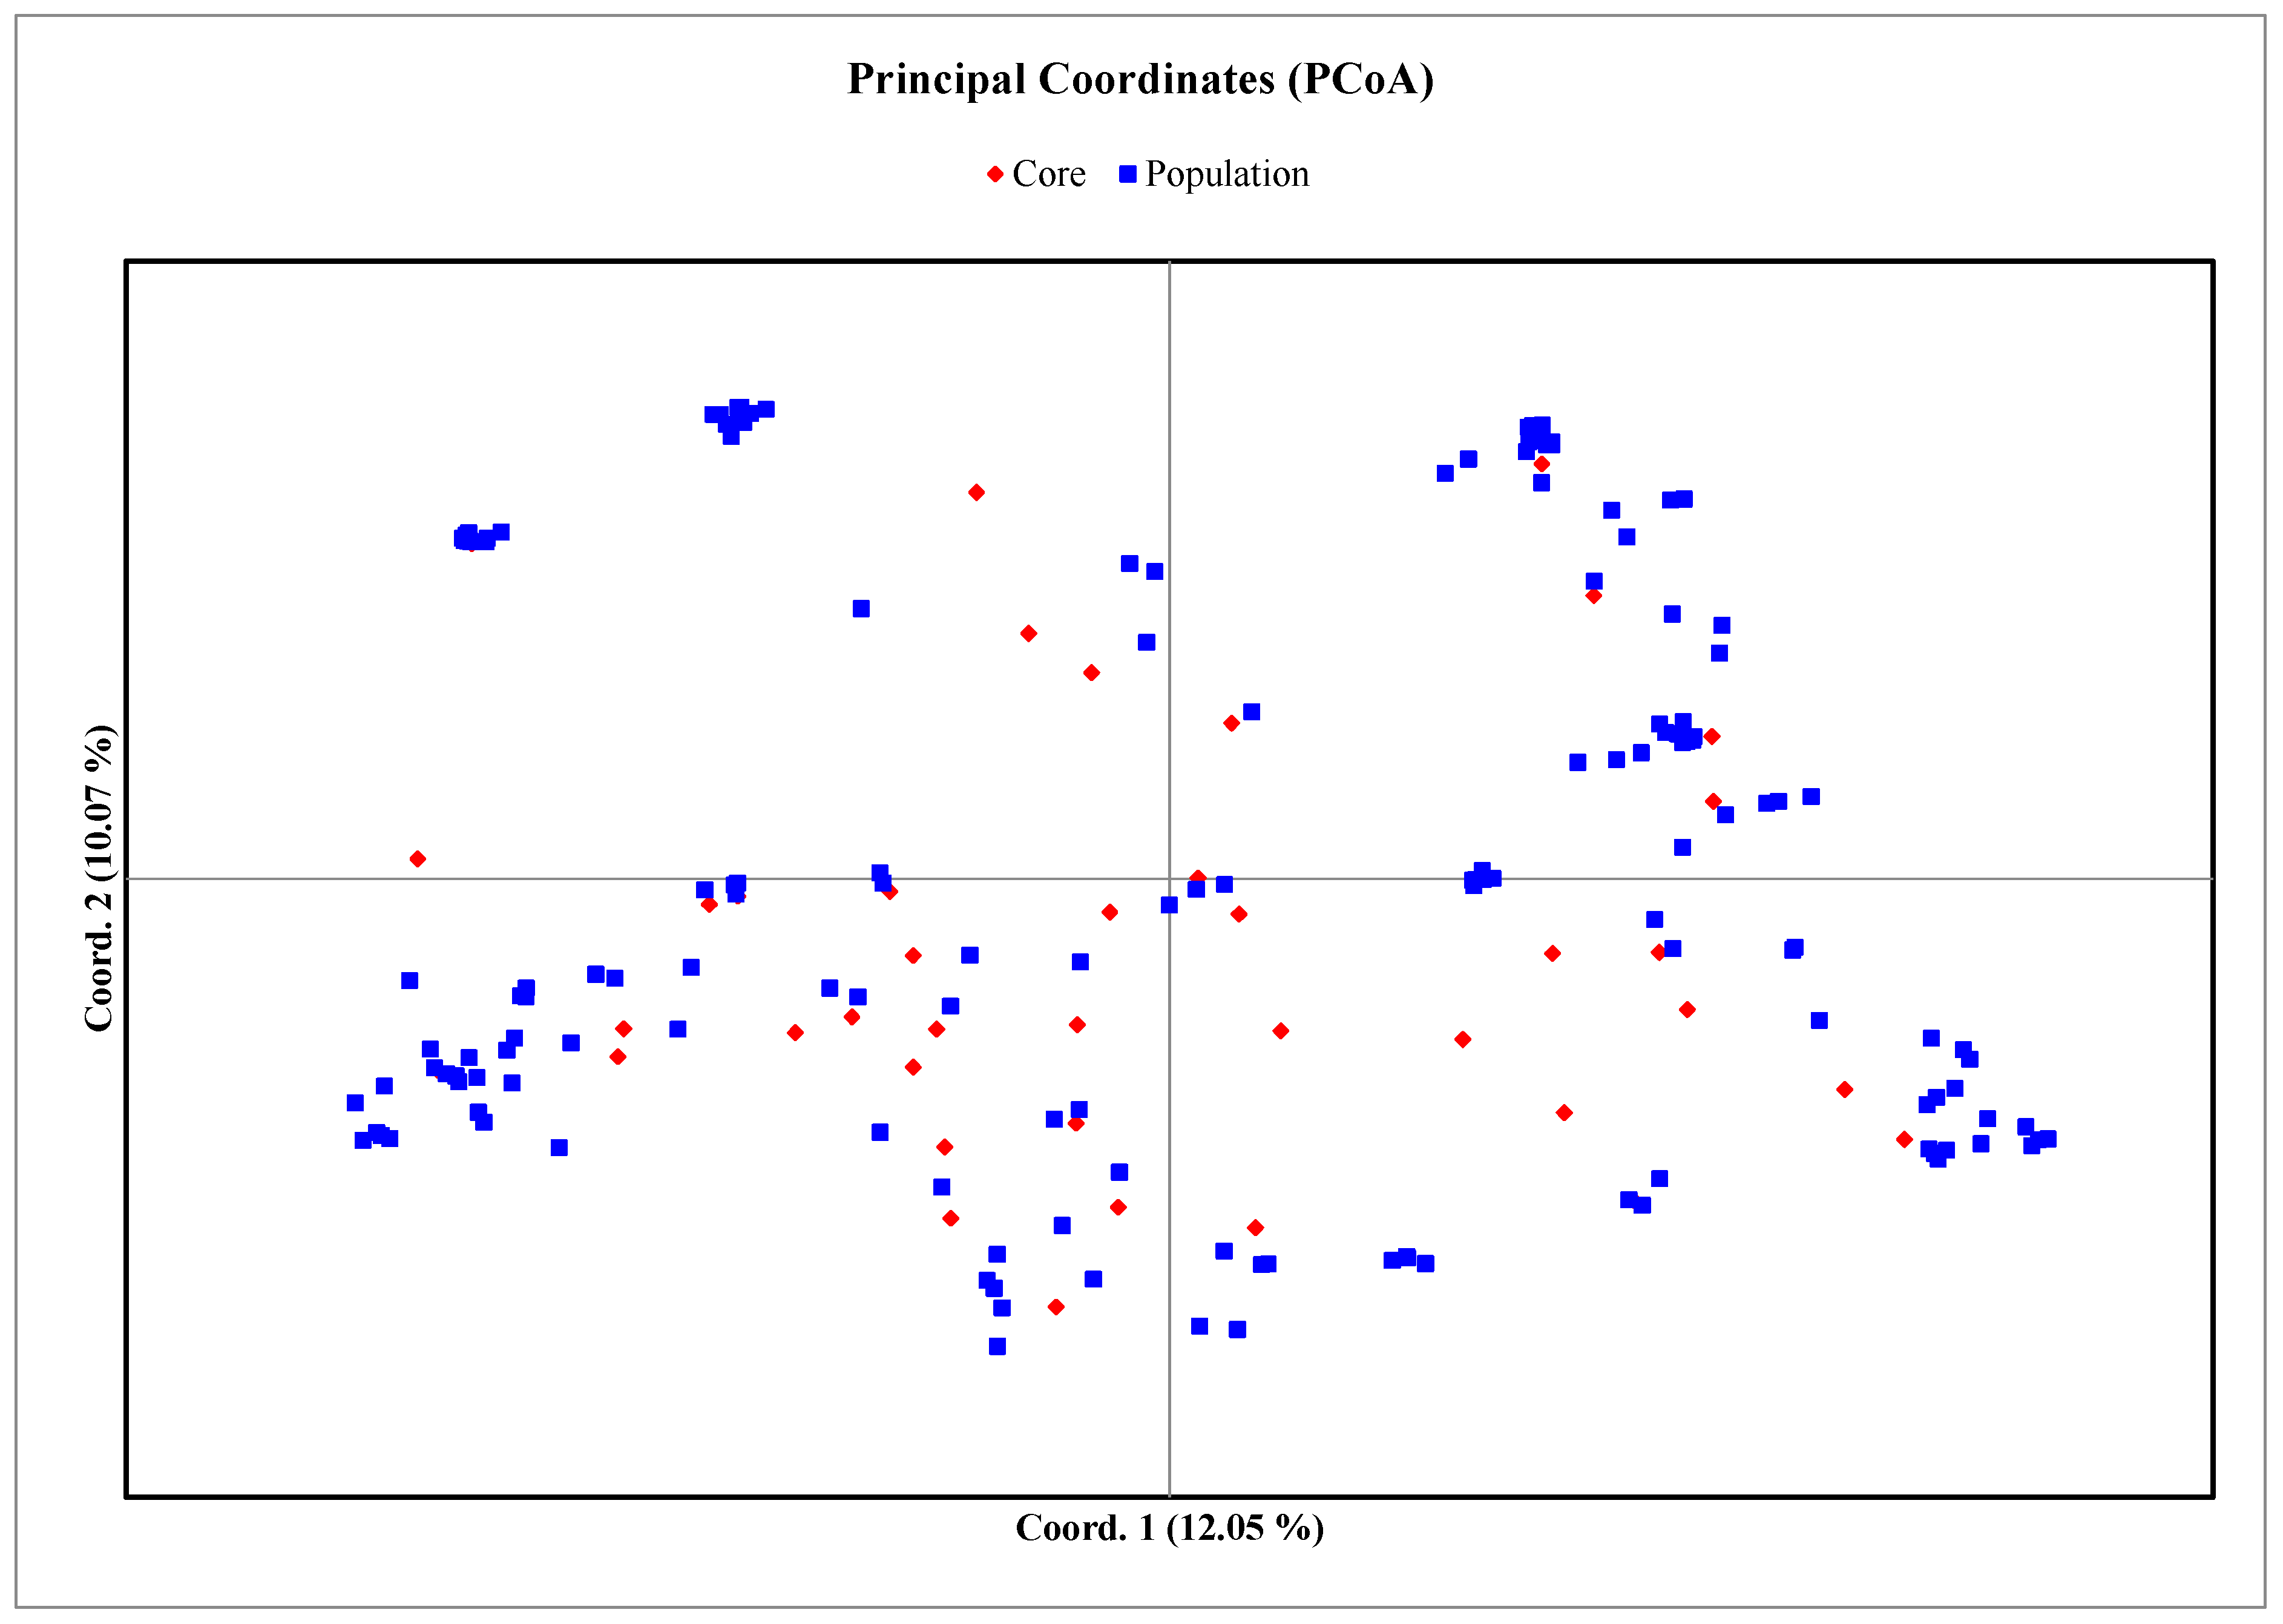
3.4. Core Collection Development

Core collection development was undertaken using the R package Core Hunter [38]. The core collection contained 41 accessions, representing the different clusters of the collection (Figure 6). Table 2 shows the list of accessions constituting the core collection which originated from 11 different countries: 11 accessions from Tanzania, 4 from Botswana, 6 each from Kenya and Republic of South Africa, 2 from Namibia, 5 from Ethiopia, 2 from Uganda, and 1 accession each from Oman, Somalia, Djibouti, and Niger. One accession of unknown origin (19380) was also included in the core collection. In terms of clusters, the largest number of accessions was contained in cluster II (14 accessions), followed by clusters I, III, V, and VI (6 accessions each). The least number of accessions were from clusters V, VII, and VIII (one accession each). The AMOVA result showed that there was no significant difference between the developed core collection and the rest of germplasm, and that the ‘within population’ differences between accessions contributed almost all of the total genetic variation, indicating that the developed core collection represented the overall collection well (Table 3).

4. Discussion

4.1. Population Structure and Genetic Diversity of the Buffelgrass Collection

Understanding the genetic relationship and population structure of a collection is very important for enhancing the conservation and utilization of the genetic resources. In this study, 205 accessions of buffelgrass from the ILRI forage genebank were studied by genotyping-by-sequencing, and a large number of SNP markers were generated from the collection. The short sequences of the markers were mapped onto the reference genome of Setaria italica. However, only a small percentage of the generated markers (12%) was able to be aligned with the reference genome. A subset of genome-wide representative markers was selected for population structure and diversity analyses and core collection development. Diversity analysis revealed the presence of substantial genetic variation in the collection. In the hierarchical cluster analysis, the collection was grouped into eight clusters. Further subclustering of the clusters was observed in five of the clusters (I, II, III, V, and VI). Cluster II contained the largest number (52) of accessions with their origins traced to different countries, while cluster VII contained the fewest number (6) of accessions originating from India, Yemen, and Zambia. Similarly, the population structure analysis indicated the presence of two main clusters in the collection. The first cluster contained 100 accessions that originated from various African countries (97 accessions), Oman (2 accessions), and Yemen (1 accession), as well as five accessions of unknown origin. All accessions from clusters II, IV, VII and VIII of the hierarchical grouping were contained in this cluster of the STRUCTURE analysis. The second cluster contained 105 accessions originating from Africa (101 accessions), India (3 accessions) and one accession of unknown origin. All accessions from cluster III and most of the accessions from clusters I, V, and VI of the hierarchical grouping were contained in this second cluster of the STRUCTURE analysis. This is the first report of diversity information on the collection using advanced molecular marker technologies. The observed clustering showed the presence of a wide range of genetic diversity in the collection. The result from this study is in line with previous reports, which documented the genetic diversity of the collection using agro-morphological variables [15,16]. However, Jorge et al. [15] reported the lack of clear clustering of the collection based on agro-morphological variables, which may be due to the limited polymorphism of agro-morphological variables compared to molecular markers [39,40] and the continuous nature of the variables [14]. The presence of wide genetic diversity using AFLP markers was also reported in pentaploid buffelgrass germplasm held in the USDA National Germplasm System [21] and among germplasm collected from different provinces of Tunisia [22]. In addition, the phenotypic polymorphism in buffelgrass germplasm from South Africa [17], Pakistan [18], and Tunisia [19] also revealed a wide genetic basis of the buffelgrass genetic resources.

4.2. GBS Data Revealed a Lack of Genetic Differentiation among Germplasm from Diverse Origins

The studied collection contains 199 accessions of known origin from 19 countries (16 countries in Africa, India, Oman, and Yemen) and 6 accessions of unknown origin. However, the observed clustering and population stratification did not follow the geographical origins of the genetic resources (Figure 7). Genotypes from the same country (origin) were scattered among the different clusters. For example, germplasm from Tanzania was found in all the eight clusters, while germplasm from Botswana, Ethiopia, India, Kenya, Namibia, Somalia, Uganda, South Africa, and Zimbabwe was distributed in at least three of the clusters (Table S2). This is supported by the weak Mantel correlation coefficient (r = 0.206, p-value = 0.0001) between the genotypic distance and geographic distance (Figure S1). A similar result was reported in buffelgrass using AFLP markers [21,22]. The lack of direct correlation between genotypic clustering and spatial distribution between pasture and roadside populations of buffelgrass in Mexico was also reported [41]. This could be explained by the historical movement of genetic resources across countries. According to Marshall and colleagues [3], there has been an extensive intercontinental dispersal of buffelgrass for the pastoral industries since the early 1900s. This could be one of the reasons for the lack of correlation between genetic differentiation and geographical backgrounds.

4.3. The GBS Data could be Used for Gap Filling in the Collection

A large amount of buffelgrass genetic resources are held by different centres (Table S3). Of the different centres, ILRI’s forage genebank maintains geographically diverse germplasm resources collected from different countries in Eastern, Western, and Southern Africa and Asia. Despite the observed genetic diversity, the collection lacks germplasm from some of the countries of origin (Northern Africa, Asia, and Europe) and/or where the species has been naturalized over time (South and North American countries and Australia) [3,4]. Those geographical areas may contain a different set of polymorphisms to add to the existing collection. This is supported by recent reports using geographic information, cytological techniques, and molecular markers. Based on the analysis of geographic information, it was indicated that germplasm from dry environments were underrepresented in the ILRI collection [15]. Buffelgrass is a polymorphic grass of different ploidy levels (tetraploid, pentaploid, hexaploids, and aneuploids), with tetraploid being the most common followed by pentaploid [11]. However, within the germplasm collected from different provinces of Tunisia, hexaploids were the most frequent from warmer climatic conditions, while tetraploid was dominant in humid areas [2]. Septaploids were also reported in germplasm from Australia and South Africa [11]. Though there is no information on the ploidy of accessions in the ILRI collection, germplasm from countries like Tunisia, where hexaploids are common, is not represented in the collection. In line with these reports, there are gaps which could be complemented by germplasm exchange and/or collection of new germplasm from underrepresented areas. This would enhance the chance of capturing unique materials that will widen the diversity in the collection. Molecular toolboxes, such as high-throughput SNP genotyping, could help in the identification of gaps and in making decisions about what to add to the existing collection. ILRI has experience of marker-assisted identification of gaps and germplasm acquisition, as demonstrated in the Napier grass collection, which was used to enhance the diversity of the existing collection [42]. A similar approach could be used to fill some of the identified gaps in the buffelgrass collection.
Another challenge in genebank management is the potential of holding duplicate genotypes and/or closely related genotypes, and the associated cost incurred to regenerate and curate them. A recent report of a substantial number of duplicates, both within and across genebank collections of Aegilops tauschii [43], provides good evidence of the issues associated with the presence of duplicates in genebank collections. The molecular tools described here could also be used to identify and eradicate duplicate materials held in genebank collections.

4.4. Core Collection Establishment

One of the goals of genotyping and genomic studies is to enhance the use and conservation of germplasm in genebanks. To this end, the current GBS data were used to develop a core collection (subset), a proportion of the collection that contains most of the genetic diversity and richness of the collection [44,45], that can be used as an entry point to the full range of germplasm available in the collection. Accordingly, a core collection containing 20% of accessions in the entire collection was developed using the R package Core Hunter [38]. The core collection contained germplasm from 10 African countries and Oman. Despite the lack of relationship between the hierarchical clustering and geographical origins of the germplasm, the developed core collection is a good representation of geographic diversity in the collection. The different clusters from the structure analysis were also represented in the core collection. The AMOVA result also confirmed the representativeness of the core collection, with no significant difference between the core collection and the rest of the population in terms of genetic diversity. The developed core collection and/or subset could be used to enhance the germplasm utilization and for multilocational evaluation for some traits of interest.

5. Conclusions

A collection of buffelgrass, a high-value forage grass, was assessed in this study using the GBS approach. A large number of SNP markers were generated for the genetic analysis of buffelgrass and its related species. Population structure and genetic diversity analyses using 1000 informative markers revealed the presence of a substantial amount of genetic diversity in the collection. A core collection containing 20% of the collection, with germplasm from diverse geographical backgrounds, was identified, which could enhance the use of the buffelgrass genetic resources held in the ILRI genebank. In general, the generated information, together with the developed core collection, could be used to select genotypes with diverse genetic makeup for further evaluation in multilocation trials, as well as for further genomic studies, such as those that aim to develop our understanding of the molecular basis of drought tolerance in buffelgrass.

Supplementary Materials

The following are available online at https://www.mdpi.com/1424-2818/12/3/88/s1, Table S1: Passport data of buffelgrass collection, Table S2. Number for accessions in different clusters according to their country of origin, Table S3: Buffelgrass collections and number of accessions held by centres across the world, Figure S1: Mantel correlation analysis of genetic and geographical distance of the buffelgrass accessions

Author Contributions

Conceptualization, A.T.N., C.S.J. and J.H.; Data curation, A.T.N.; Formal analysis, A.T.N.; Funding acquisition, A.M.S. and C.S.J. and J.H.; Investigation, A.M.S., A.T.N., C.S.J., E.H. and M.S.M.; Methodology, A.A., A.T.N. and Y.A.; Resources, A.M.S. and C.S.J. and J.H.; Supervision, A.M.S. and C.S.J.; Visualization, A.T.N.; Writing – original draft, A.T.N.; Writing – review & editing, A.T.N., A.M.S., C.S.J., E.H., J.H. and M.S.M. All authors have read and agreed to the published version of the manuscript.

Funding

This research was funded by the Genebank platform “use module” and Deutsche Gesellschaft für Internationale Zuammenarbeit (GIZ), “attributed funding”.

Acknowledgments

The authors would like to thank Genebank staff, Ato Tsige and Zeyede, for help with the leaf sample collection at Zwai field site.

Conflicts of Interest

The authors declare no conflict of interest.

References

  1. Devendra, C.; Swanepoel, F.; Stroebel, A.; Van Rooyen, C. Implications and innovative strategies for enhancing the future contribution of livestock. In The Role of Livestock in Developing Communities; SUN MeDIA Bloemfontein: Bloemfontein, South Africa, 2010. [Google Scholar]
  2. Kharrat-Souissi, A.; Siljak-Yakovlev, S.; Brown, S.C.; Chaieb, M. Cytogeography of Cenchrus ciliaris (Poaceae) in Tunisia. Folia. Geobot. 2013, 48, 95–113. [Google Scholar] [CrossRef]
  3. Marshall, V.M.; Lewis, M.M.; Ostendorf, B. Buffelgrass (Cenchrus ciliaris) as an invader and threat to biodiversity in arid environments: A review. J. Arid Environ. 2012, 78, 1–12. [Google Scholar] [CrossRef]
  4. Cook, B.G.; Pengelly, B.C.; Brown, S.D.; Donnelly, J.L.; Eagles, D.A.; Franco, M.A.; Hanson, J.; Mullen, B.F.; Partridge, I.J.; Peters, M.; et al. Tropical Forages: An Interactive Selection Tool [CD-ROM]; CSIRO, DPI&F(Qld), CIAT and ILRI: Brisbane, Australia, 2005. [Google Scholar]
  5. Kharrat-Souissi, A.; Siljak-Yakovlev, S.; Brown, S.C.; Baumel, A.; Torre, F.; Chaieb, M. The polyploid nature of Cenchrus ciliaris L. (Poaceae) has been overlooked: New insights for the conservation and invasion biology of this species—A review. Rangel. J. 2014, 36, 11–23. [Google Scholar] [CrossRef] [Green Version]
  6. Jessup, R.W.; Burson, B.L.; Burow, G.; Wang, Y.W.; Chang, C.; Li, Z.; Paterson, A.H.; Hussey, M.A. Segmental allotetraploidy and allelic interactions in buffelgrass (Pennisetum ciliare (L.) Link syn. Cenchrus ciliaris L.) as revealed by genome mapping. Genome 2003, 46, 304–313. [Google Scholar] [CrossRef] [Green Version]
  7. Bray, R.A. Evidence for Facultative Apomixis in Cenchrus ciliaris. Euphytica 1978, 27, 801–804. [Google Scholar] [CrossRef]
  8. Shafer, G.S.; Burson, B.L.; Hussey, M.A. Stigma receptivity and seed set in protogynous buffelgrass. Crop Sci. 2000, 40, 391–397. [Google Scholar] [CrossRef] [Green Version]
  9. Visser, N.C.; Spies, J.J.; Venter, H.J.T. Aneuploidy in Cenchrus cilliaris (Poaceae, Panicoideae, Paniceae): Truth or fiction? S. Afr. J. Bot. 1998, 64, 337–345. [Google Scholar] [CrossRef]
  10. Buffelgrass (Cenchrus ciliaris). Feedipedia, A Programme by INRA, CIRAD, AFZ and FAO. Available online: https://www.feedipedia.org/node/482 (accessed on 4 October 2019).
  11. Burson, B.L.; Actkinson, J.M.; Hussey, M.A.; Jessup, R.W. Ploidy determination of buffelgrass accessions in the USDA National Plant Germplasm System collection by flow cytometry. S. Afr. J. Bot. 2012, 79, 91–95. [Google Scholar] [CrossRef] [Green Version]
  12. Velázquez, S.G.; Herrera, R.R.; Carrillo, A.R.Q.; Quiroz, J.F.E.; Garay, A.H.; Hernández, A.P. Evaluación morfológica, citológica y valor nutritivo de siete nuevos genotipos y un cultivar de pasto Cenchrus ciliaris L., tolerantes a frío. Rev. Mex. Cienc. Agrícolas 2015, 6, 1679–1687. [Google Scholar] [CrossRef] [Green Version]
  13. Al-Dakheel, A.J.; Hussain, M.I. Genotypic variation for salinity tolerance in Cenchrus ciliaris L. Front. Plant Sci. 2016, 7, 1090. [Google Scholar] [CrossRef] [Green Version]
  14. Genesys PGR. Available online: https://www.genesys-pgr.org/ (accessed on 30 April 2019).
  15. Jorge, M.A.B.; Van De Wouw, M.; Hanson, J.; Mohammed, J. Characterisation of a collection of buffelgrass (Cenchrus ciliaris). Trop. Grassl. 2008, 42, 27–39. [Google Scholar]
  16. SávGutiéc, R.A.; Morales Nieto, C.R.; Hanson, J.; Santellano Estrada, E.; Jurado Guerra, P.; Villanueva Avalos, J.F.; Melgoza Castillo, A. Caracterización forrajera de ecotipos de zacate buffel en condiciones de temporal en Debre Zeit, Etiopía. Rev. Mex. Cienc. Agrícolas 2017, 8, 13–26. [Google Scholar]
  17. Hignight, K.W.; Bashaw, E.C.; Hussey, M.A. Cytological and morphological diversity of native apomictic buffelgrass, Pennisetum ciliare (L) Link. Bot. Gaz. 1991, 152, 214–218. [Google Scholar] [CrossRef]
  18. Arshad, M.; Ashraf, M.Y.; Ahamad, M.; Zaman, F. Morpho-genetic variability potential of Cenchrus ciliaris L., from Cholistan Desert, Pakistan. Pak. J. Bot. 2007, 39, 1481–1488. [Google Scholar]
  19. Kharrat-Souissi, A.; Baumel, A.; Mseddi, K.; Torre, F.; Chaieb, M. Polymorphism of Cenchrus ciliaris L. a perennial grass of arid zones. Afr. J. Ecol. 2011, 49, 209–220. [Google Scholar] [CrossRef]
  20. Bruno, L.R.G.P.; Antonio, R.P.; Assis, J.G.D.; Moreira, J.N.; Lira, I.C.D.A. Buffelgrass morphoagronomic characterization from Cenchrus germplasm active bank. Rev. Caatinga. 2017, 30, 487–495. [Google Scholar] [CrossRef] [Green Version]
  21. Burson, B.L.; Renganayaki, K.; Dowling, C.D.; Hinze, L.L.; Jessup, R.W. Genetic diversity among pentaploid Buffelgrass accessions. Crop Sci. 2015, 55, 1637–1645. [Google Scholar] [CrossRef]
  22. Kharrat-Souissi, A.; Baumel, A.; Torre, F.; Juin, M.; Siljak-Yakovlev, S.; Roig, A.; Chaieb, M. New insights into the polyploid complex Cenchrus ciliaris L. (Poaceae) show its capacity for gene flow and recombination processes despite its apomictic nature. Aust. J. Bot. 2011, 59, 543–553. [Google Scholar] [CrossRef]
  23. Kilian, A.; Wenzl, P.; Huttner, E.; Carling, J.; Xia, L.; Blois, H.; Caig, V.; Heller-Uszynska, K.; Jaccoud, D.; Hopper, C.; et al. Diversity arrays technology: A generic genome profiling technology on open platforms. Meth. Mol. Biol. 2012, 888, 67–89. [Google Scholar]
  24. Reference Genome of Setaria Italica (Foxtail Millet). Available online: https://www.ncbi.nlm.nih.gov/genome/?term=foxtail+millet (accessed on 22 May 2019).
  25. Wimmer, V.; Albrecht, T.; Auinger, H.-J.; Schon, C.-C. Synbreed: A framework for the analysis of genomic prediction data using R. Bioinformatics 2012, 28, 2086–2087. [Google Scholar] [CrossRef] [Green Version]
  26. Michael, T.P.; Jackson, S. The First 50 Plant Genomes. Plant Genom. 2013, 6, 2. [Google Scholar] [CrossRef] [Green Version]
  27. Nei, M. Analysis of gene diversity in subdivided populations. Proc. Natl. Acad. Sci. USA 1973, 70, 3321–3323. [Google Scholar] [CrossRef] [PubMed] [Green Version]
  28. Jombart, T. Adegenet: A R package for the multivariate analysis of genetic markers. Bioinformatics 2008, 24, 1403–1405. [Google Scholar] [CrossRef] [PubMed] [Green Version]
  29. The R Project for Statistical Computing. Available online: https://www.r-project.org/ (accessed on 16 January 2019).
  30. Galili, T. Dendextend: An R package for visualizing, adjusting and comparing trees of hierarchical clustering. Bioinformatics 2015, 31, 3718–3720. [Google Scholar] [CrossRef] [Green Version]
  31. Extract and Visualize the Results of Multivariate Data Analyses. Available online: https://cran.r-project.org/web/packages/factoextra/factoextra.pdf (accessed on 15 August 2019).
  32. Peakall, R.; Smouse, P.E. GenAlEx 6.5: Genetic analysis in Excel. Population genetic software for teaching and research—An update. Bioinformatics 2012, 28, 2537–2539. [Google Scholar] [CrossRef] [Green Version]
  33. Pritchard, J.K.; Stephens, M.; Donnelly, P. Inference of population structure using multilocus genotype data. Genetics 2000, 155, 945–959. [Google Scholar]
  34. Falush, D.; Stephens, M.; Pritchard, J.K. Inference of population structure using multilocus genotype data: Linked loci and correlated allele frequencies. Genetics 2003, 164, 1567–1587. [Google Scholar]
  35. Muktar, M.S.; Teshome, A.; Hanson, J.; Negawo, A.T.; Habte, E.; Entfellner, J.-B.D.; Lee, K.-W.; Jones, C.S. Genotyping by sequencing provides new insights into the diversity of Napier grass (Cenchrus purpureus) and reveals variation in genome-wide LD patterns between collections. Sci. Rep. 2019, 9, 6936. [Google Scholar] [CrossRef] [Green Version]
  36. Earl, D.A.; VonHoldt, B.M. STRUCTURE HARVESTER: A website and program for visualizing STRUCTURE output and implementing the Evanno method. Conserv. Genet. Resour. 2012, 4, 359. [Google Scholar] [CrossRef]
  37. Evanno, G.; Regnaut, S.; Goudet, J. Detecting the number of clusters of individuals using the software STRUCTURE: A simulation study. Mol. Ecol. 2005, 14, 2611–2620. [Google Scholar] [CrossRef] [Green Version]
  38. de Beukelaer, H.; Davenport, G.F.; Fack, V. Core Hunter 3: Flexible core subset selection. BMC Bioinform. 2018, 19, 203. [Google Scholar] [CrossRef] [PubMed]
  39. Nybom, H.; Weising, K.; Rotter, B. DNA fingerprinting in botany: Past, present, future. Investig. Genet. 2014, 5, 1. [Google Scholar] [CrossRef] [PubMed] [Green Version]
  40. Using Molecular Marker Technology in Studies on Plant Genetic Diversity. Available online: https://www.bioversityinternational.org/fileadmin/user_upload/online_library/publications/pdfs/Molecular_Markers_Volume_1_en.pdf (accessed on 11 November 2019).
  41. Gutierrez-Ozuna, R.; Eguiarte, L.E.; Molina-Freaner, F. Genotypic diversity among pasture and roadside populations of the invasive buffelgrass (Pennisetum ciliare L. Link) in north-western Mexico. J. Arid Environ. 2009, 73, 26–32. [Google Scholar] [CrossRef]
  42. Negawo, A.T.; Jorge, A.; Hanson, J.; Teshome, A.; Muktar, M.S.; Azevedo, A.L.S.; Ledo, F.J.S.; Machado, J.C.; Jones, C.S. Molecular markers as a tool for germplasm acquisition to enhance the genetic diversity of a Napier grass (Cenchrus purpureus syn. Pennisetum purpureum) collection. Trop. Grassl. 2018, 6, 58–69. [Google Scholar]
  43. Singh, N.; Wu, S.Y.; Raupp, W.J.; Sehgal, S.; Arora, S.; Tiwari, V.; Vikram, P.; Singh, S.; Chhuneja, P.; Gill, B.S.; et al. Efficient curation of genebanks using next generation sequencing reveals substantial duplication of germplasm accessions. Sci. Rep. 2019, 9, 1–10. [Google Scholar] [CrossRef] [Green Version]
  44. The Core Collection at the Crossroads. Available online: https://www.researchgate.net/publication/285536959 (accessed on 10 February 2020).
  45. Frankel, O.H. Genetic perspectives of germplasm conservation. In Genetic Manipulation: Impact on Man and Society; Arber, W., Illmensee, K., Peacock, W.J., Starlinger, P., Eds.; Cambridge University Press: Cambridge, UK, 1984; pp. 161–170. [Google Scholar]
Figure 1. Buffelgrass accessions used in the study by country of origin.
Diversity 12 00088 g001
Figure 2. Frequency of single nucleotide polymorphism (SNP) marker by polymorphic information content (PIC) values.
Diversity 12 00088 g002
Figure 3. Genome-wide distribution of the SNP markers across the nine chromosomes of Setaria italica reference genome.
Diversity 12 00088 g003
Figure 4. Genome-wide distribution of the 1000 SNP markers selected for in-depth genetic diversity and population structure analyses.
Diversity 12 00088 g004
Figure 5. Cluster analyses of the 205 accessions of buffelgrass using the 1000 selected SNP markers. (a) Phylogenetic tree showing the genetic relationship of the accessions grouped into eight clusters, (b) probability of the accessions cluster membership, (c) identifying and assigning accessions into clusters, (d) PCA plot using Dim1 and Dim2, (e) Delta K suggesting two main groups, and (f) bar plots based on the admixture model in STRUCTURE.
Diversity 12 00088 g005
Figure 6. Principal Coordinate Analysis (PCoA) plot showing accessions selected for the core collection of the buffelgrass collection.
Diversity 12 00088 g006
Figure 7. Phylogenetic tree (a) and PCA (b) showing the geographical origin of the collection. ATG: Antigua and Barbuda, BWA: Botswana, COD: Democratic Republic of the Congo, DJI: Djibouti, ETH: Ethiopia, GHA: Ghana, IND: India, KEN: Kenya, MRT: Mauritania, NAM: Namibia, NER: Niger, OMN: Oman, SDN: Sudan, SOM: Somalia, TZA: Tanzania, UGA: Uganda, YEM: Yemen, ZAF: Republic of South Africa, and ZWE: Zimbabwe.
Diversity 12 00088 g007aDiversity 12 00088 g007b
Table 1. Analysis of genetic differentiation among and within clusters of buffelgrass collection by analysis of molecular variance (AMOVA).
Source of VariationDegree of FreedomSum of SquaresMean Sum of SquaresEstimation VariationPercentage of Variation
Among clusters718445.552635.08100.6538%
Within clusters19732813.78166.57166.5762%
Total20451259.33 267.22100%
Table 2. List of accessions, origin, and cluster groups constituting the core collection based on genotyping data.
Accession No.DOIOriginRegionElevation (m a.s.l.) Cluster+Accession No.DOIOriginRegionElevationCluster +
204310.18730/FZ78METHAfrica167061938810.18730/FY563TZAAfrica11172
212610.18730/G03P5ETHAfrica160061939010.18730/FY585TZAAfrica11175
213410.18730/G06FMETHAfrica160021940310.18730/FY5PKTZAAfrica11402
664210.18730/G5X2HTZAAfrica 11940810.18730/FY5VRTZAAfrica11408
1277110.18730/FRMSKKENAfrica521941610.18730/FY63*TZAAfrica12291
1282510.18730/FRPB*KENAfrica1161941910.18730/FY66 = TZAAfrica12292
1328410.18730/FS158KENAfrica94521942710.18730/FY6E6TZAAfrica12075
1329010.18730/FS1BEKENAfrica67021943210.18730/FY6KBUGAAfrica10005
1356310.18730/FS8JQETHAfrica140061943910.18730/FY6TJKENAfrica16675
1663010.18730/FVPF0NAMAfrica20071944010.18730/FY6VKKENAfrica154
1666010.18730/FVQ7RNAMAfrica120061944110.18730/FY6WMTZAAfrica9095
1686810.18730/FVXK6NERAfrica37021944410.18730/FY6ZQZAFAfrica7583
1807110.18730/FWX8MBWAAfrica90021944510.18730/FY70RZAFAfrica12886
1807310.18730/FWXAPBWAAfrica90011946310.18730/FY7J5DJIAfrica112
1810810.18730/FWYAHBWAAfrica90031946510.18730/FY7M7SOMAfrica202
1812310.18730/FWYNWBWAAfrica80011947410.18730/FY7XGZAFAfrica4393
1848310.18730/FX9AUTZAAfrica140031947610.18730/FY7ZJZAFAfrica3143
1937710.18730/FY4VXZAFAfrica 11947810.18730/FY81MZAFAfrica9005
1937910.18730/FY4XZUGAAfrica 31949210.18730/FY8F$OMNMiddle East25002
1938010.18730/FY4Y*Unknown 11949310.18730/FY8G=ETHAfrica3252
1938410.18730/FY52UTZAAfrica12412
+ Cluster group based on hierarchical clustering. BWA: Botswana, DJI: Djibouti, ETH: Ethiopia, KEN: Kenya, NAM: Namibia, NEG: Niger, OMN: Oman, SOM: Somalia, TZA: Tanzania, UGA: Uganda, ZAF: Republic of South Africa, and ZWE: Zimbabwe.
Table 3. Result of the AMOVA between the core collection and the rest of the population.
Source of VariationDegree of Freedom Sum of Squares Mean Sum of Squares Estimation VariationPercentage of Variation
Variation among groups1286.89286.890.550.22%
Variation within groups20350972.44251.20251.2099.78%
Total20451259.33 251.65100.00%

