Article

Fatty Acid Changes in Nearshore Phytoplankton under Anthropogenic Impact as a Biodiversity Risk Factor for the World’s Deepest Lake Baikal

by
Alyona Alexandrovna Nikonova
1,*,
Sergey Mikhailovich Shishlyannikov
1,2,
Nadezhda Antonovna Volokitina
1,
Yuri Pavlovich Galachyants
1,
Yuri Sergeevich Bukin
1,
Vadim Vasil’evich Blinov
1,
Ruslan Yur’evich Gnatovsky
1 and
Svetlana Semyonovna Vorobyeva
1
1
Limnological Institute of the Siberian Branch of the Russian Academy of Sciences, 3, Ulan-Batorskaya Street, 664033 Irkutsk, Russia
2
Smorodintsev Research Institute of Influenza, 15/17, Prof. Popov Street, 197376 Saint Petersburg, Russia
*
Author to whom correspondence should be addressed.
Diversity 2022, 14(1), 55; https://doi.org/10.3390/d14010055
Submission received: 24 October 2021 / Revised: 27 December 2021 / Accepted: 3 January 2022 / Published: 14 January 2022
(This article belongs to the Special Issue Aquatic Restoration Ecology and Monitoring)

Abstract

:
In this study, we present results on fatty acid analysis of phytoplankton of Lake Baikal, the world’s deepest lake, which differs from other lakes by its oceanic features. Since we used a large-mesh net, the net sample phytoplankton were primarily represented by the large elongated diatom Synedra acus. subsp. radians (Kützing) Skabichevskij. The similar algae composition of net samples of spring season phytoplankton collected at different sites of the lake allows us to compare results of the fatty acid analysis of these samples. The phytoplankton diversity of the sedimentation samples was contrary represented by 32 algae species. There are clear changes in the fatty acid composition of net phytoplankton exposed to anthropogenic impacts of varying intensity. The content of polyunsaturated fatty acids in phytoplankton collected from central stations (pelagic stations at a distance of ~10–30 km from the shoreline) without anthropogenic impact was higher by up to 15% than phytoplankton collected from nearshore stations (littoral stations at a distance of ~0.01–0.05 km from the shoreline) and offshore stations (pelagic stations at a distance of ~3 km from the shoreline). The interlaboratory precision of fatty acid determination of phytoplankton is estimated as ≤10%. We found high content of the lipid peroxidation marker (80–340 μg g−1 of dry weight) in phytoplankton from nearshore and offshore stations with intensive anthropogenic impact. In phytoplankton from central stations, we did not find any lipid peroxidation. Determination of unsaturated fatty acids, coupled with analysis of fatty acid peroxidation products, can be used to evaluate the level of anthropogenic impact in terms of ecological health and biodiversity conservation.

1. Introduction

Lake Baikal is the world’s deepest (maximum depth of 1642 m) [1,2] and oldest (20–25 million years) lake, containing 23,615.39 km3 of fresh water with a mineralization of 96–98 mg L−1. Lake Baikal, a rift lake, is located in the southern part of Eastern Siberia (Russia) and comprises three basins: northern, central, and southern [3,4].
There are both littoral and pelagic zones in Lake Baikal [3,5,6]. The lake is 636 km long, with a maximum width of 79 km. Its littoral zone reaches 80–120 m of depth, including the nearshore zone, which extends to a 25 m depth [7,8]. The tectonic terrace on the western flank rises over the lake surface at heights of about 300–1500 m and continues steeply underwater to 1200–1400 m. It then turns into the valley bottom, which slants toward the east coast [9]. As demonstrated in a schematic bathymetric map (Figure 1), the platform is fairly shallow near the shore but drops off steeply, especially on the western flank. This platform step forms a boundary between the littoral and pelagic zones. The surface area of Lake Baikal is 32,822 km2, of which the littoral zone occupies only ~3.4%.
Nevertheless, the nearshore zone of Lake Baikal is the most productive, containing more than 98% of all bottom dwellers, such as Porifera, Polychaeta, Oligochaeta, and other worms, along with Sagina, Isopoda, Trichoptera, Chironomidae, Mollusca, and fishes. Their biomass in the southern basin was 620 kg per hectare at depths of ≤4 m and 100–150 kg per hectare at depths of 20–70 m [10,11].
Phytoplankton are the primary producers of organic matter in Lake Baikal, inhabiting the photic zone at depths of ~60–120 m. Intensive photosynthesis takes place in this zone. Phytoplankton also inhabit the epipelagic zone, a zone with depths of ~200–300 m and maximum vertical mixing of water [10]. Microalgae live in the deep-water pelagic zone down to 750 m of depth [12] without cell division due to mixotrophic growth [13] and the rest stage of growth during adverse conditions [14]. Some microalgae and their spores drop to the bottom water layer during the disadvantageous season, floating to the surface later in the spring period. After blooming, phytoplankton become food for protozoa, zooplankton, benthic organisms, and bacteria, helping maintain biodiversity. Spring primary production of Lake Baikal phytoplankton reaches ~160 tons per hectare (i.e., ~80% of the annual biomass) [10]. Phytoplankton are highly sensitive to environmental changes, and their health benefits the well-being of the entire lake ecosystem [15,16,17,18].
The high productivity and biodiversity in the nearshore zone of Lake Baikal are due to unique oceanic or marine features of climate, hydrological regime, and bathymetry. In oceans (and seas), there are places where the ocean floor deepens closer to shore. In coastal areas of oceans, the interaction of winds and currents generates vertical movement of cold, nutrient-rich deepwater towards the surface (upwelling). As in oceans, upwelling is a typical phenomenon for Lake Baikal [19,20]. Causes of vertical water movement include asymmetric depression and the presence of high-pressure thermal and cold-water springs through bottom cracks. Another cause is climate features and winds formed due to the great length of Lake Baikal from south to north, which leads to a baric gradient between the northern and southern basins. Winds also cause movement in the water column down to the bottom [21,22]. The most intensive upwelling processes and nutrient enrichment take place near the western and northern coasts of Lake Baikal [21,22,23,24]. These several peculiarities coupled with the runoff of ten largest tributaries of the lake (the total water discharge of ~1522 m3 s−1) lead to an almost unlimited concentration of nutrients in the coastal zone, which is sufficient for the autotrophic organisms providing the bioproductivity of the lake [24,25,26].
For Baikal phytoplankton, the bulk of primary production comprises lipids [27]. The fatty acid (FA) composition of phytoplankton depends on metabolism, abiotic factors [28,29,30], and biotic factors. Lake Baikal phytoplankton produce esterified and free fatty acids [29], including essential polyunsaturated fatty acids (PUFA) [31,32]. FAs migrate through food webs and have an impact on the functioning and energetic potential of all organisms [33,34]. Changes in phytoplankton FA composition can elucidate the ecosystem stress caused by anthropogenic impact [35,36,37].
For live cells, which are the structural units of whole organisms, the cell wall is the first target of negative anthropogenic impacts. Phospholipids are dominant constituents of the cell wall. There are two known routes for lipid destruction in the cell. The first is the α-, β-, and ω-oxidation of lipids by enzymes with the formation of numerous vital compounds, including acetyl coenzyme A (acetyl-CoA) with its further oxidation to adenosine triphosphate (ATP) and energy generation. The second is lipid peroxidation. One final product of peroxidation is malondialdehyde (MDA), which can exist in the cell in free (f-MDA) and covalently-bonded (b-MDA) forms [38,39,40]. MDA reacts with lipids, thiol groups, and amino groups of nucleic acids of proteins, as well as with lipoproteins and DNA, resulting in the destruction of these biological molecules [34,35,36]. MDA can also react with DNA to form mutagenic adducts [41,42]. Lipid peroxidation products, including MDA, can be analyzed in their reaction with thiobarbituric acid, at which point they are called thiobarbituric reactive substances (TBARS).
In large aquatic ecosystems, the nearshore zone is much more exposed to negative anthropogenic impact than the pelagic zone [15] and can result in stress. The narrow nearshore zone of Lake Baikal, with its unique biodiversity, warrants concern. Changes in littoral phytoplankton from 2000 to 2015 were observed [43]. For example, the biomass of atypical small unicellular green algae and atypical filamentous green algae increased significantly. On the other hand, psychrophilic pelagic phytoplankton did not change significantly from 1964 to 2011. Diatoms comprised about 50–90% of biomass [44], and changes in the structure of benthic communities [45] and the death of Lake Baikal sponges in the littoral zone were also observed [46,47].
Understanding the dynamics and functioning of nearshore communities is necessary to decrease the anthropogenic impact on the littoral zone. This study aims to reveal stress in Baikal phytoplankton through the analysis of FAs and their peroxidation products as a response of the environment to anthropogenic impacts of different intensities.

2. Experiment

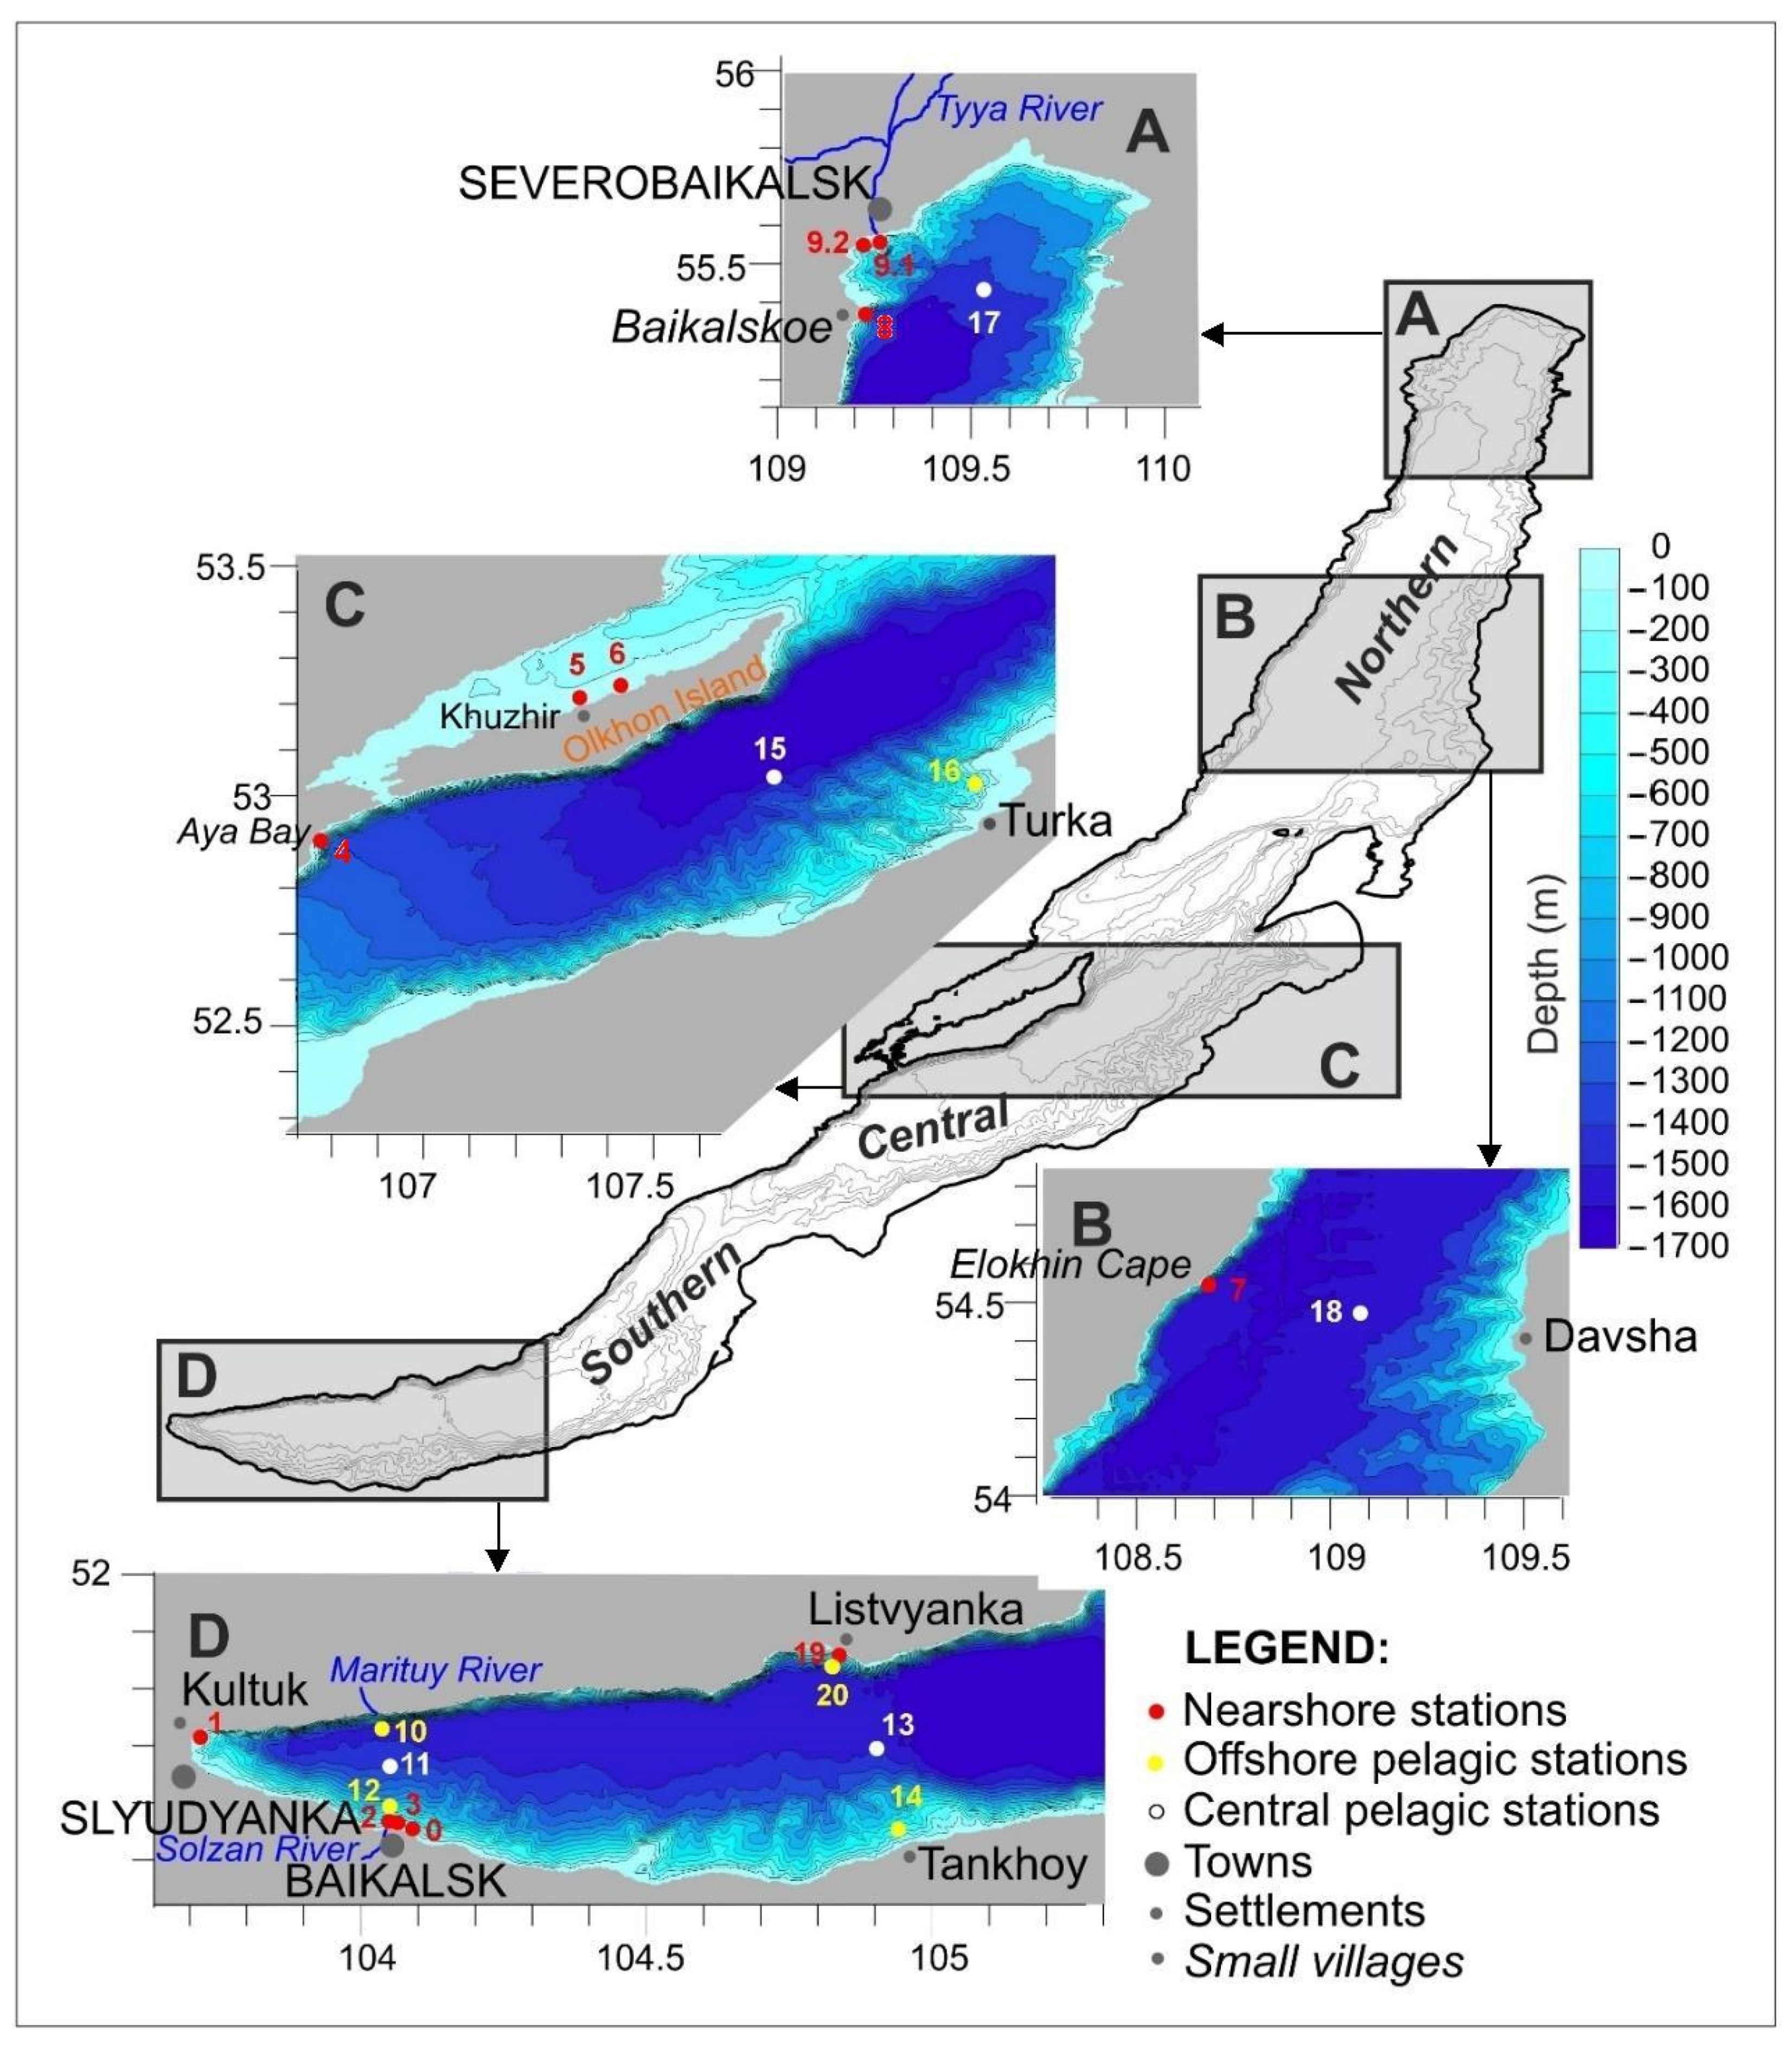
2.1. Sample Collection

For Lake Baikal, a delay of seasonal onsets in the coastal zone is common compared to the nearby continental zone [24]. Phytoplankton samples were collected in the spring seasons of 2014, 2016, 2018, and 2020, from 28 May to 20 June, using the vertical Juday-type net with 100 μm mesh size. Samples were collected from a depth of 20 m at the coastal and pelagic stations located in the three Lake Baikal basins (Figure 1).
All samples were collected from the stations of three types. These types differ by their distances from shore. The differences are the following.
1. Pelagic phytoplankton were collected from central stations located within the central deep-water areas of the three basins. Of all stations, these were the farthest from shore. The distance from the shoreline was ~10–30 km. The central stations no. 11, 13, 15, 17, and 18 were considered to lack anthropogenic impact.
2. Pelagic phytoplankton were collected from offshore pelagic stations located ~3 km from the shoreline. The offshore stations no. 10, 12, 14, and 16 were considered to have a low anthropogenic impact.
3. Coastal phytoplankton were collected from the stations located about 0.01–0.05 km from the shoreline. These are considered nearshore stations. Some were located near cities (no. 0, 2, 3, and 9) and settlements (no. 1, 5, and 8). The nearshore stations no. 4, 5, and 6 were located in areas with intensive recreation. Nearshore stations no. 4 and 7 were located far from any settlements.
For the spring season, the phytoplankton Bacillariophyta and Dinophyta microalgae are typical. For example, the mean cell length of the dominant Synedra acus subsp. radians (Kützing) Skabichevskij (this name is currently regarded as a synonym of Fragilaria radians (Kützing) D.M. Williams and Round) reaches 142–288 μm, and the length of some cells reaches 500 μm. These algae dominated from 2014 to 2020. Aulacoseira baikalensis (Wislouch) Simonsen, a diatom endemic to Lake Baikal, forms filaments up to 160–1000 μm long, but this species was not dominant from 2014 to 2020. We used a 100 μm mesh net to obtain S. acus as net samples, excluding other small algae because different algae species have various responses to stress factors. This allows us to compare the results of chemical analysis of phytoplankton samples obtained in different parts of the lake. Samples containing zooplankton organisms were filtered through a nylon net with 400 mesh size to separate them from phytoplankton. Phytoplankton net samples were immediately filtered onto glass fiber filters (47 mm), wrapped in aluminum foil, and stored at −20 °C before chemical analysis.
The separate samples of phytoplankton were collected to analyze Baikal phytoplankton diversity by the classical sedimentation method [6]. Water from the surface down to a depth of 1 m was sampled using the bathometer. A water sample of 1 L volume was poured into a plastic bottle, which was kept in dark at 20 °C. For the estimation of algal biomass, samples were fixed with Lugol’s solution. The sedimentation process lasted 10 days. Supernatant was removed by drop method using a siphon. It was shown previously that there were no algae cells in each drop of the removed supernatant. Samples then underwent concentration to 0.5–1 mL. Cells in concentrated sedimentation samples were subsequently identified and counted using light microscopy (Axiovert 200, Carl Zeiss, Jena, Germany) at 400× magnification. According to microscopic analysis, zooplankton content was negligible in all net samples (<0.5%). The number of cells was converted into phytoplankton biomass, taking into account the biovolume measurements of individual cells. Mean cell dimensions were used to estimate cell biovolumes for different species.
The separate water samples were collected at coastal (n = 53) and pelagic (n = 4) sites in the three basins to analyze anionic surfactant concentrations. Surface water to a depth of 1 m was sampled in autumn 2019, from 13 to 22 September, and in the spring season 2020, from 28 May to 10 June, using the bathometer.

2.2. Lipid Extraction and Derivatization of FA to Fatty Acid Methyl Esters (FAMEs)

Wet sample weights ranged from 0.15–0.20 g. The humidity of the samples was estimated gravimetrically, with values reaching ~90%. To extract lipids from replicate samples, 1.2 mL of Folch solution (chloroform–methanol, 2:1, by volume) was added to each sample. Samples then underwent extraction for 5 min using a 50 Hz ultrasonic bath, after which 0.35 mL of distilled water was added to the extracts. The mixtures were vigorously shaken for 0.5 min and centrifuged at 13,000 rpm for 3 min. The chloroform extracts were put into 10 mL glass vials and the solvent evaporated using an argon stream [31].
Fatty acid methyl esters (FAME) were derived through the acidic esterification of fatty acids. First, 4.5 mL of 2% H2SO4 solution in methanol was added to the dry fraction. The bottles were covered with aluminum foil caps and kept for 1.5 h at 55 °C. Next, 0.8 mL of n-hexane was added to the FAME solutions and the samples were cooled to room temperature. FAMEs were extracted twice with n-hexane (3 mL × 2 min). The extracts were first dried with anhydrous Na2SO4 and then concentrated to 1 mL volume using argon stream. An internal standard was added to the extract.

2.3. FAME Analysis by Gas Chromatography with Flame-Ionization (GC-FID) and Mass-Spectrometric Detection (GC-MS)

For qualitative and quantitative analyses, the internal standard (1 mg mL–1 of dodecyl ether solution in n-hexane) and external standard solutions of FAs “FAME Mix C4–C24” and “methyl cis-4,7,10,13,16,19-docosahexaenoic acid” solution (both Supelco, USA) were used. Qualitative analysis of FAMEs by GC-MS was carried out using the Agilent 6890B GC System coupled to the 7000C GC/MS Triple Quad mass spectrometer (Agilent, USA). The injector temperature was 290 °C; the injection volume was 2 μL in splitless mode; the quadrupole temperature was 150 °C; the ion source temperature was 230 °C; the ionization energy was 70 eV. Chromatographic peaks were detected in the m/z 40–500 range. FAMEs were identified based on retention times and their mass spectra using the NIST Mass Spectral Search Program for the NIST/EPA/NIH Mass Spectral Library software (V. 2.2).
Quantitative analysis of FAMEs was carried out using a Shimadzu GC-2010-Plus gas chromatograph (Shimadzu, Japan). Injection of 2 µL of sample into the column was carried out in the splitless regime using an Optima-17MS GC column (30 m × 0.25 mm, SGE Macherey-Nagel, Germany). The injector temperature was 310 °C; the injection volume was 2 μL in splitless mode; the detector temperature was 310 °C; the hydrogen velocity was 40 mL/min; the air velocity was 400 mL/min; the carrier-gas velocity (helium) was 30 mL/min; the linear velocity was 28.5 cm/s. Chromatography was carried out by heating the column first from 80 °C to 120 °C at the rate of 10 °C/min and then to 260 °C at the rate of 2.5 °C/min.

2.4. Fatty Acid Peroxidation Estimate by Spectrophotometric Determination of Thiobarbituric acid Reactive Substances (TBARS)

Thiobarbituric acid reactive substances (TBARS) can form pink TBA2-TBARS adducts with thiobarbituric acid (TBA) with an absorption maximum at 532 nm, which is a true indicator of lipid peroxidation [38,48,49]. In our study, we analyzed TBARS using the modified technique. Wet sample weights ranged from 0.15–0.20 g at ~85–90% humidity. Samples were placed in plastic, 2-mL Eppendorf taste-tubes, and 1 mL of 10% trichloroacetic acid (TCA) solution was added. Samples were sonicated for 5 min in a 50 Hz ultrasonic bath and centrifuged at 13,000 rpm for 3 min. The supernatant was put into 5 mL glass vials with plastic screw caps and mixed with 2 mL of 0.5% TBA solution in 10% TCA. The mixture was kept for 0.5 h at 95 °C, cooled, and centrifuged. Absorbance was measured using a Cintra-20 spectrophotometer (GBC, Australia) and standart quartz quvettes (path length 1 cm). The TBARS extinction coefficient was 155 mM–1 L. Baseline absorption was measured at 532 nm using the solution obtained by mixing 1 mL of 10% TCA and 2 mL of 0.5% TBA solutions. The TBARS absorption was measured at 532 nm. The limit of quantification (LOQ) of 1.21 μmol mL−1 extract and the limit of determination (LOD) of 0.51 μmol mL−1 via spectrophotometry were determined by Rakita et al. [50].

2.5. Statistical Data

The laboratory precision of FAME determinations was estimated by calculating the relative standard deviations (RSD) of two replicate results from the average value using the degree of freedom number f = 22. For selected subgroups, the homogeneity of variations was checked using Fisher and Cochran tests [51]. The repeatability of the technique for total FAME content was characterized by V = 6%. We also used three replicates for the in vitro microalgae growing experiment.
For the determination of similarities and differences between natural samples and laboratory cultures in terms of FA concentrations and profiles, the principal component analysis of multidimensional statistics was used [52]. Results were visualized using the Statistica software.
To determine similarities between the fatty acid spectra of samples, cluster analysis was carried out using the Statistica software. To estimate distances between stations, Ward’s method based on multifactorial variance analysis was used. The matrix of distances was calculated using the Euclidean method.

2.6. Cultivation of the S. acus

S. acus diatoms were grown in 100 cm3 Erlenmeyer flasks at +6 °C for 50 days with the chemically defined medium (DM medium) containing Ca(NO3)2 × 4H2O (20 mg L−1), KH2PO4 (12.4 mg L−1), MgSO4 × 7H2O (25 mg L−1), NaHCO3 (16 mg L−1), Na2EDTA (23 mg L−1), H3BO3 (2.48 mg L−1), MnCl × 4H20 (1.4 mg L−1), (NH4)6Mo7O24 × 4H2O (1.0 mg L−1), cyanocobalamin (0.04 mg L−1), thiamine hydrochloride (0.04 mg L−1), biotin (0.04 mg L−1), Na2SiO3 × 5H2O (42.6 mg L−1), and FeCl3 (1.6 mg L−1). The 12/12 h day/night light cycle was provided by luminescent bulbs with a photon flux density of ~200 μE m−2 s−1. Biomass sampling was carried out over 12 h, 24 h, and 14 days.

2.7. Anionic Surfactant Analysis by Spectrophotometric Determination

Anionic surfactants were analyzed as a complex with methylene blue dye. Linear alkylbenzene sulphonate (LAS) mixture was used as an external standard. The calibration equation y = 3.0423x + 0.0041 (R2 = 0.9933) was obtained in the range of concentrations from 2 to 100 μg L−1. LAS were extracted from the 0.05 L water samples with trichloromethane (5 mL × 2 min). All water samples passed through cellulose acetate filters (45 μm, VLADiSART, Russia) using the filter-apparatus (Duran Group, Germany) to separate suspended matter on filters. Preliminary extraction of surfactants absorbed on suspended matter such as phytoplankton was carried out with ethanol (1 mL × 2 min). Both soluble and absorbed surfactants were involved in the extraction. Absorbance was measured using a Cintra-20 spectrophotometer with quartz quvettes (path length of 1 cm). The methylene blue and anionic surfactant complex has a maximum absorbance at 651.5 nm.

3. Results

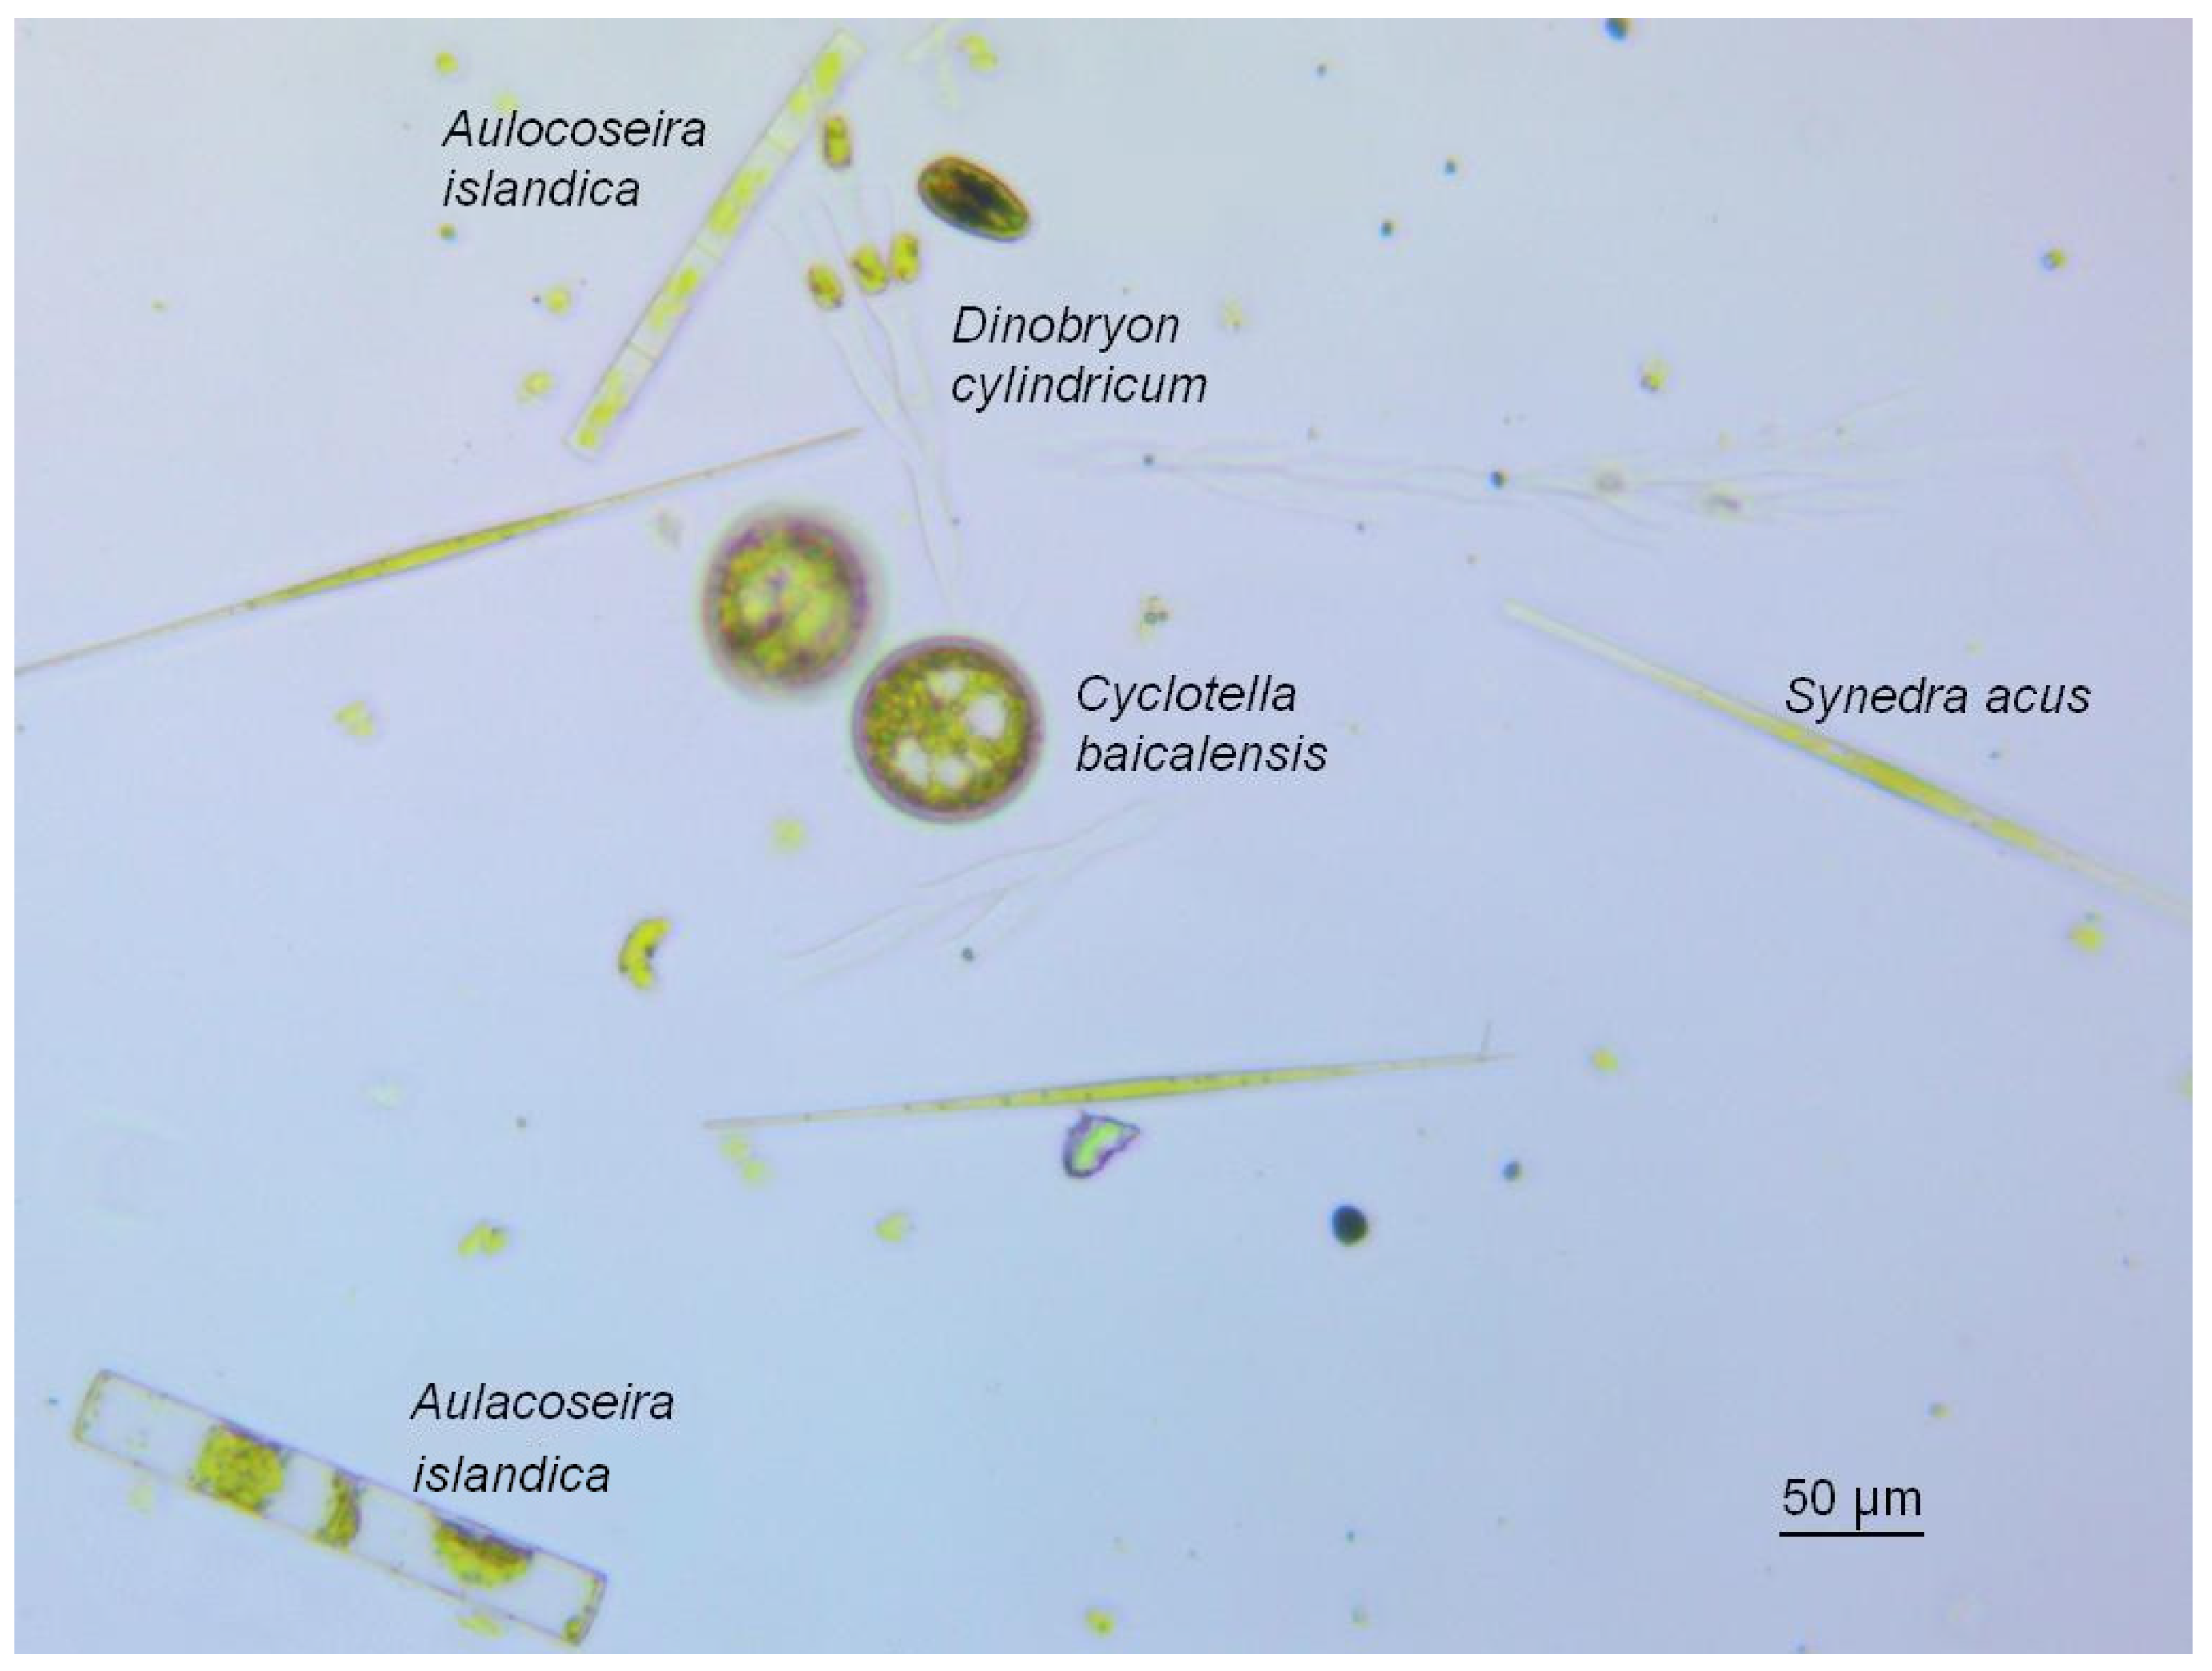
3.1. Baikal Phytoplankton Composition

Microscopy data revealed that the S. acus diatom dominated most samples of littoral and pelagic Baikal phytoplankton during the spring seasons of 2014, 2016, 2018, and 2020. The composition of Baikal phytoplankton (2020) is presented in Table 1.
In all sedimentation samples of littoral and pelagic phytoplankton (2014, 2016–2021), S. acus subsp. radians dominated. Six algal classes represented the phytoplankton composition of sedimentation samples: Cyanophyta, Chrysophyta, Cryptophyta, Dinophyta, Bacillariophyta, and Chlorophyta (Table 2). As shown, Bacillariophyta were dominant during the spring season, with biomass values from 79% in deep water to 93% in surface water.
All net samples of littoral and pelagic phytoplankton contained S. acus as a dominant species in 2014 and 2016. S. acus contribution to total biomass was ~95%, excluding small-celled phytoplankton. The large-volume algae (Figure 2) A. baicalensis, Aulacoseira islandica (O. Müller) Simonsen and Ceratium hirundinella (O.F. Müller) Dujardin, long-size Synedra ulna (Nitzsch) Ehrenberg and Synedra ulna var. danica (Kützing) Van Heurck, small-volume Cyclotella baicalensis Skvortsov and K.I. Meyer and Cyclotella minuta (Skvortsov) Antipova, both of which may form long chains, and Dinobryon cylindricum O.E. Imhof, all contributed less than 5% to the total biomass of net phytoplankton.
The compositions of net samples and sedimentation samples were different. All sedimentation samples of littoral and pelagic phytoplankton contained S. acus as a dominant species in 2014 and 2016. S. acus contribution to the total biomass was up to 95% (Table 3).

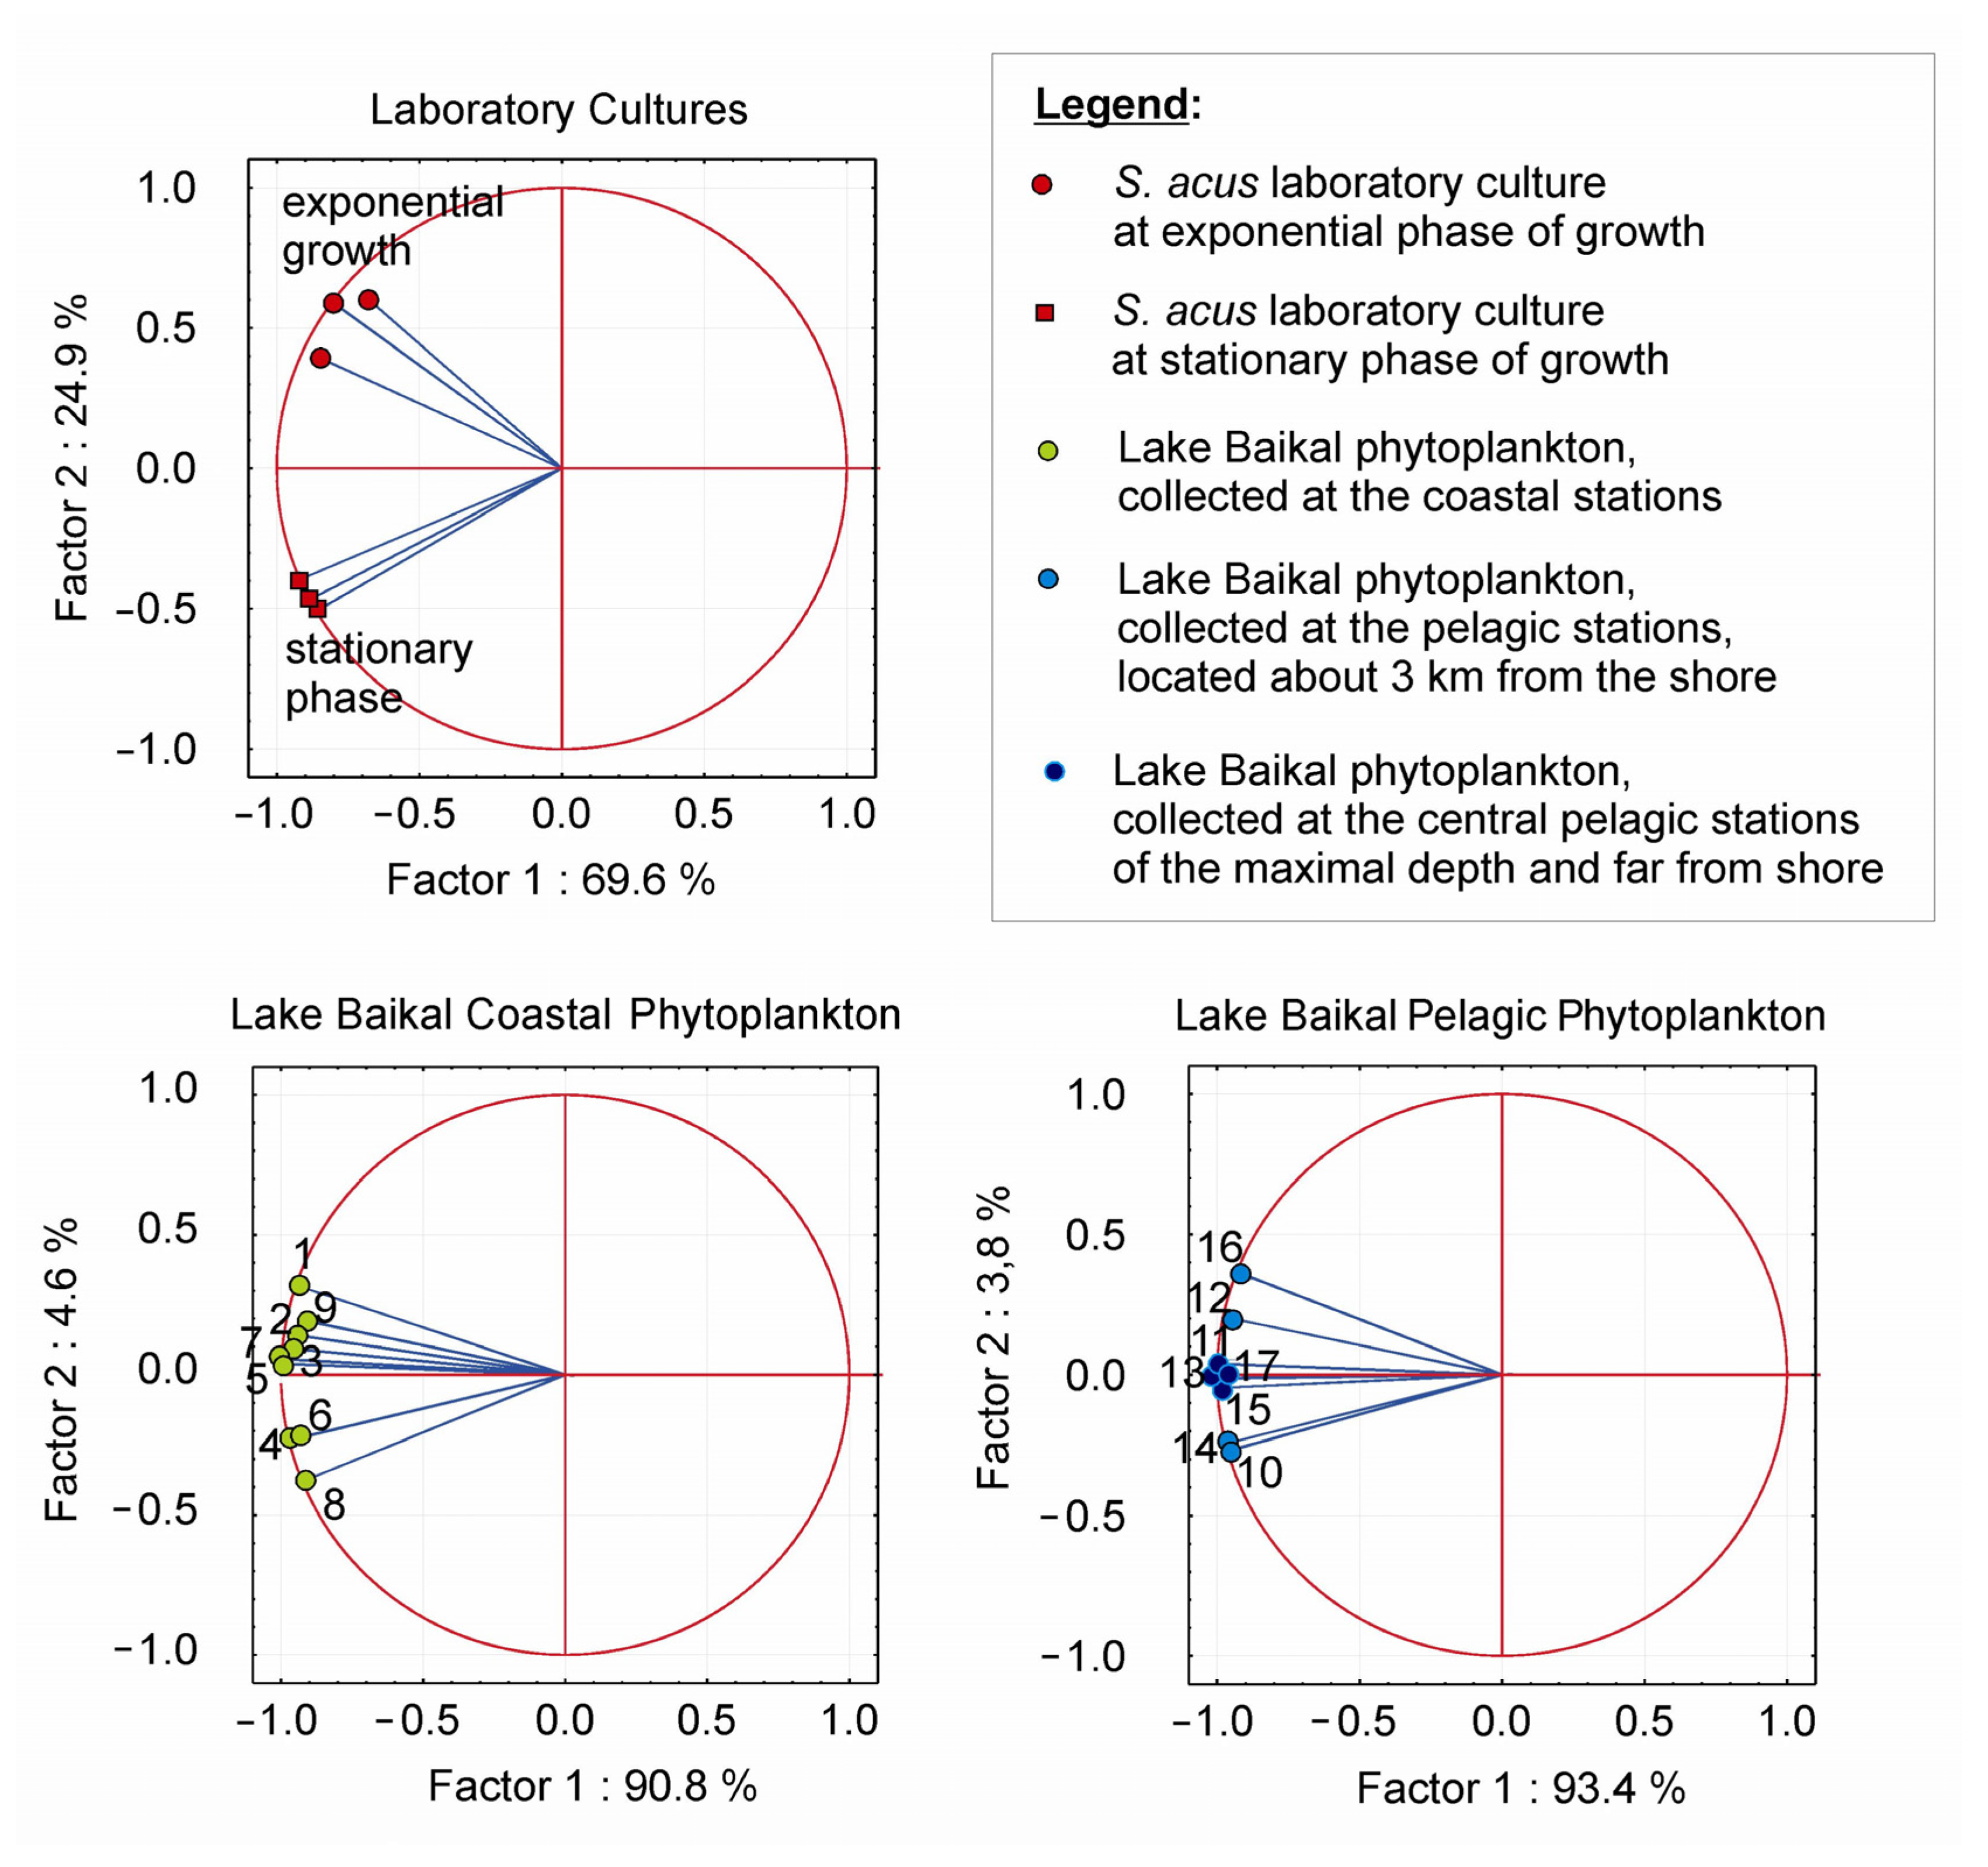
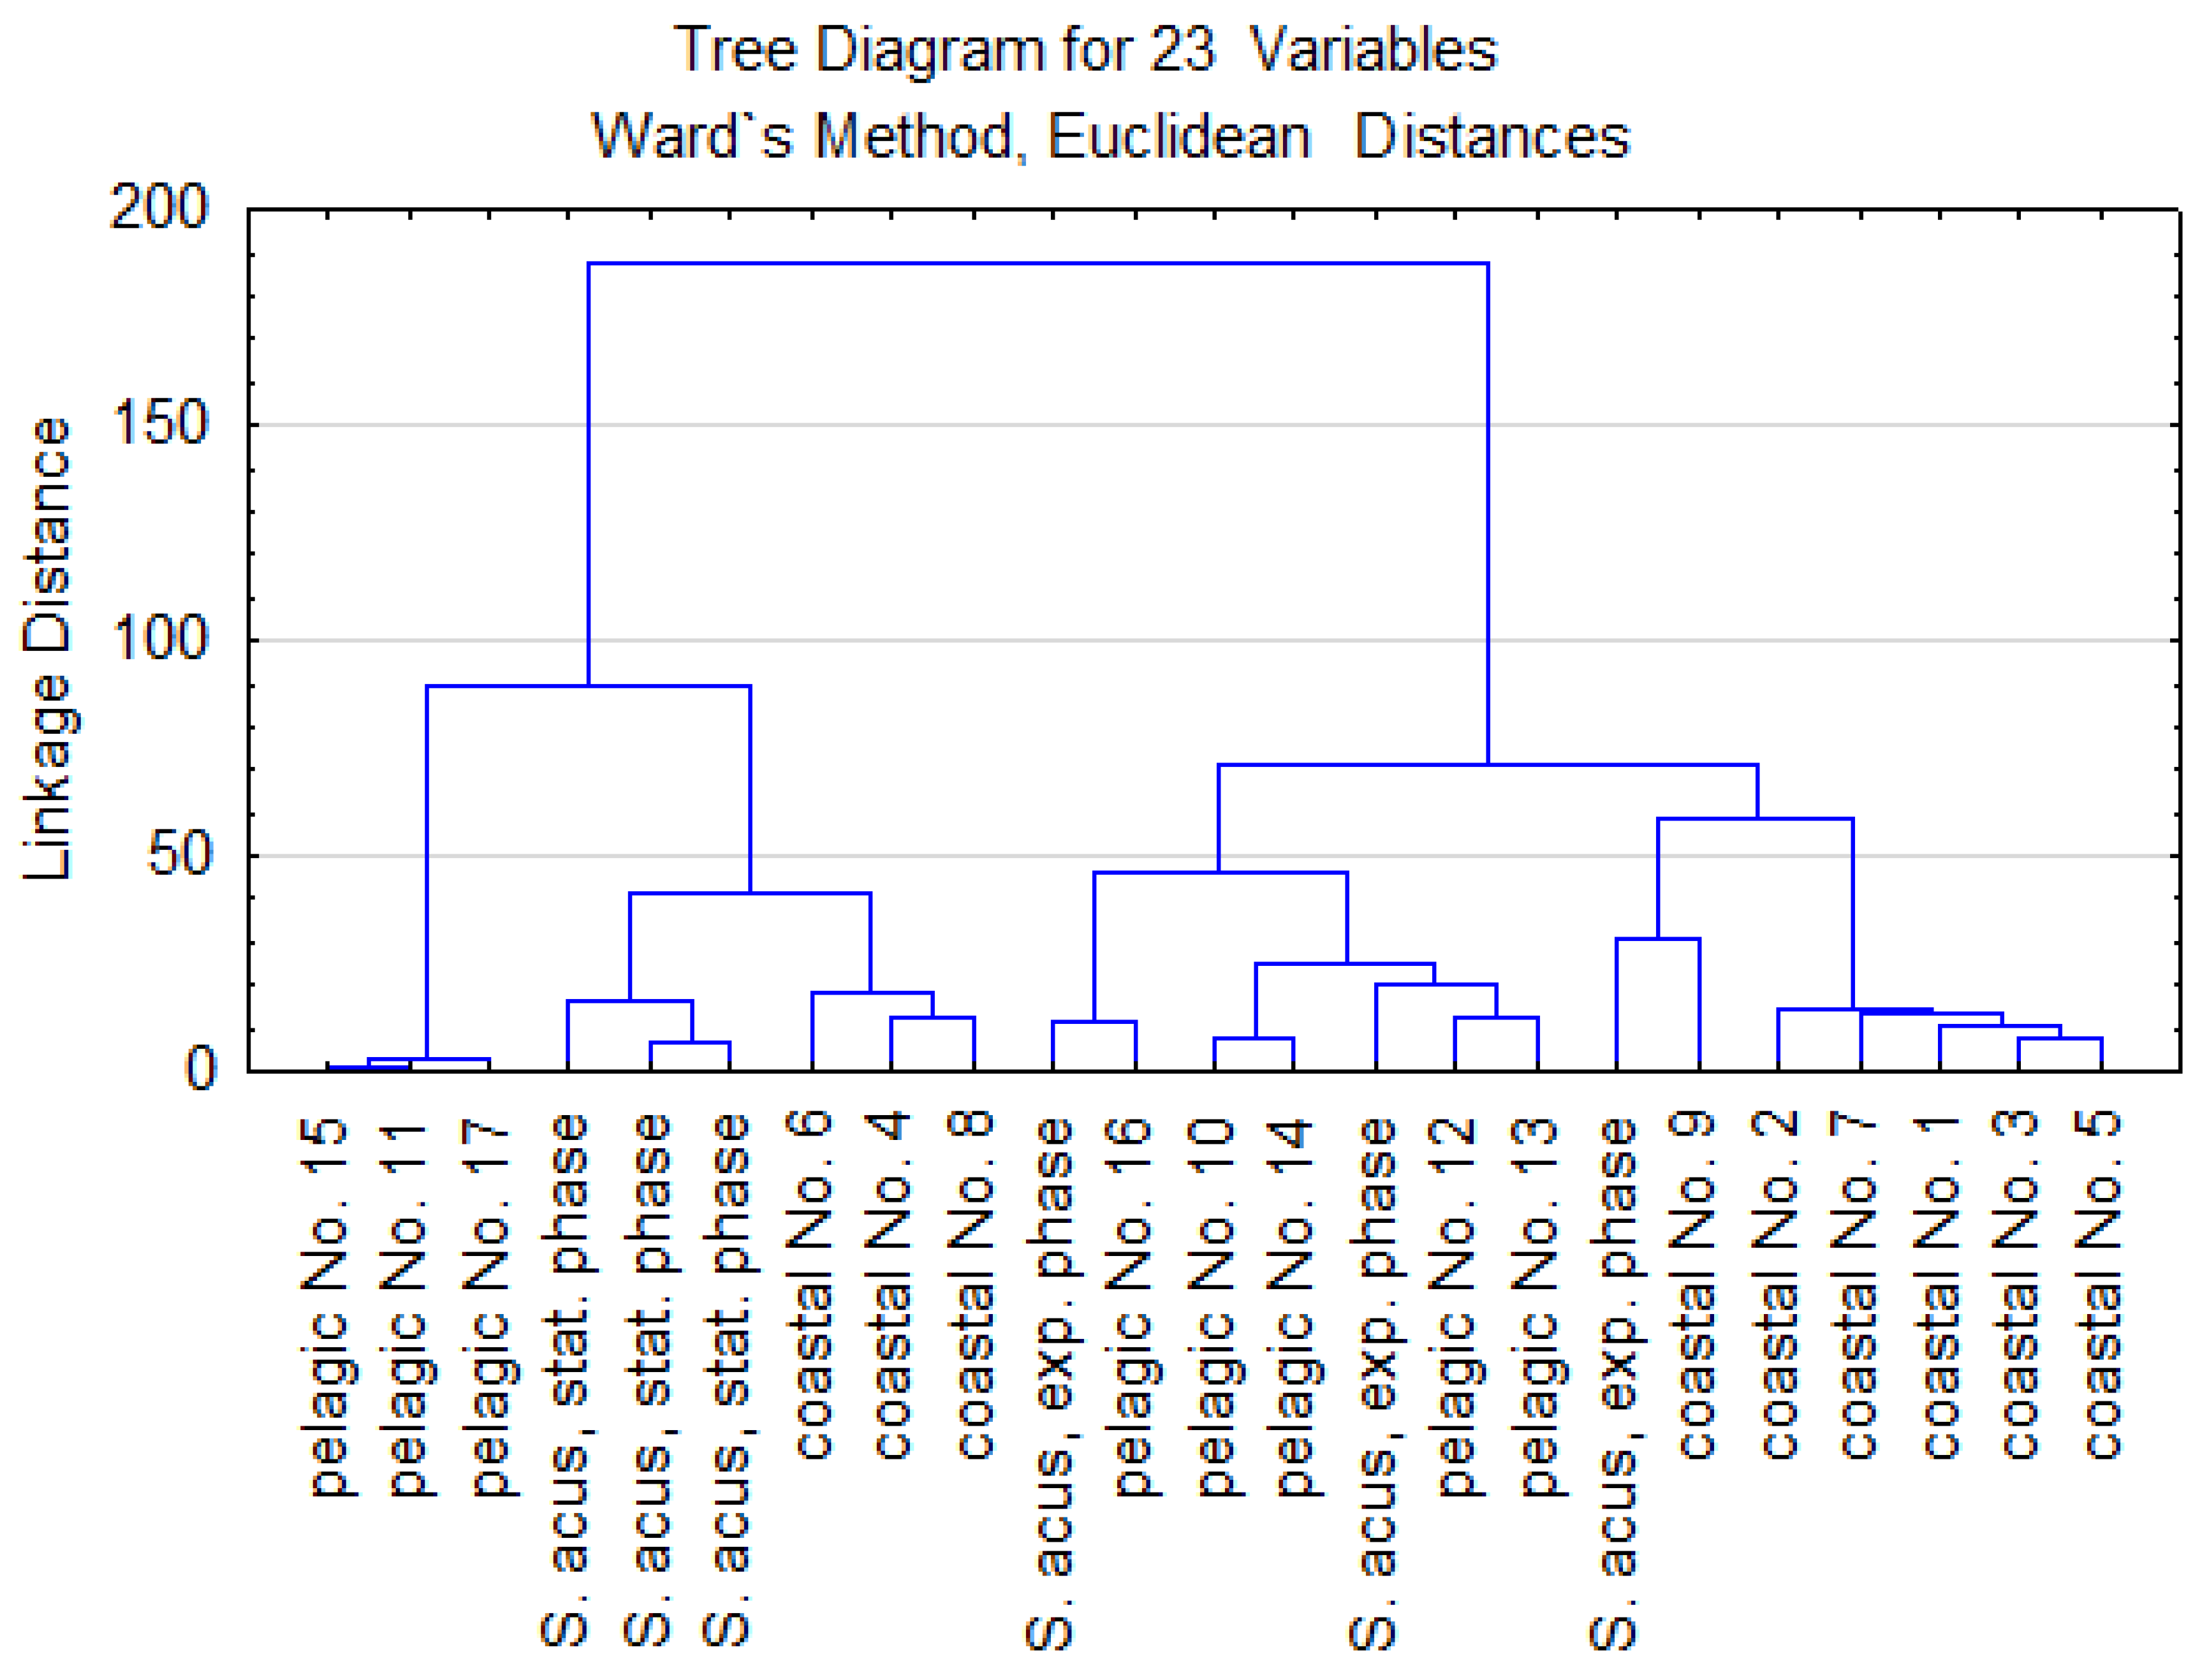
3.2. Statistical Analysis

The comparative statistical analysis of data on FA content in the samples of the axenic culture of S. acus and natural plankton dominated by S. acus using the principal component method is shown in Figure 3. This method takes into account a high number of individual FAs in every sample. It allows us to visualize data through the conversion of the multidimensional space to a two-dimensional one. As the principal components, we selected FAs of different saturations and chain lengths (1–22 carbon atoms). These FAs are C16:0, C16:1(ω-7), C16:2(ω-4), C16:3(ω-4), C18:0, C18:1(ω-9), C18:3(ω-3), C18:4(ω-3), C20:4(ω-6), C20:5(ω-3), and C22:6(ω-3). Of total FA weight, 70–80% belongs to these FAs. Percentages of the aforementioned FAs in laboratory culture biomass at stationary and exponential phases of growth, as well as in the coastal (no. 1 to 9) and pelagic phytoplankton samples (no. 10 to 17), were chosen as variables in the data array. Three separate projections to the factor plane were made for laboratory culture (Figure 3, top), coastal phytoplankton (Figure 4, bottom left), and pelagic phytoplankton variables (Figure 3, bottom right). The significant validity (≥90%) of presented results was marked for all three cases. Based on analysis of the FA composition of the laboratory culture determined by this statistical method, differences are clear for diatoms at stationary and exponential growth phases (Figure 3, top).
The vectors of most samples of the coastal Baikal phytoplankton lie in the upper left-half plane, except for samples no. 4, 6, and 8. This figure demonstrates the significant difference between the nearshore samples no. 4, 6, and 8 from the cities and other coastal samples.
Considering that samples were collected at the spring blooming peak, we can explain with relative confidence the positioning of vectors for the samples of coastal phytoplankton (Figure 3, bottom left), which is similar to that of vectors for laboratory culture samples at the stage of exponential growth. Concerning pelagic Baikal phytoplankton, the maximum closeness between FA compositions of the samples from central pelagic stations no. 11, 13, 15, and 17 that were maximally remote from the shore is noteworthy. FA composition of these central samples differed from offshore pelagic ones.
Cluster analysis of the samples is presented (Figure 4). There are two main clusters of the samples, which do not cross. Laboratory culture samples at the stage of exponential growth are clustered together with pelagic samples and the bulk of coastal samples. This can be explained by the fact that during the sampling of natural phytoplankton, all stations were at the stage of intensive cell division. Moreover, it is also obvious that the pelagic plankton samples and the bulk of the coastal plankton samples form the two main clusters and show clear differences in FA composition of coastal and pelagic plankton (Figure 4).
The difference between the phytoplankton from the central pelagic stations and the offshore pelagic stations is possibly related to the distance from the shore. Stations no. 11, 13, 15, and 17 were located in the central area of the lake in contrast to stations no. 10, 12, 14, and 16, which were located at a distance of 3 km from the shore (Figure 1 and Figure 4). Some pelagic and coastal samples clustered together with laboratory culture samples at the stationary phase (Figure 4). This suggests that at these stations, natural phytoplankton were the same as at the stationary phase, which contradicts the microscopy data. Therefore, it is necessary to carefully compare the results of laboratory experiments and those of natural phytoplankton. Data analysis using the principal component method and the cluster analysis method is related to the so-called exploring analysis. This allows us to find dependencies in the analysis of large data arrays, but their interpretation is beyond the scope of mathematical statistics [53].

3.3. FA Composition and FA Peroxidation Product Analysis

In our study, we analyzed the FA composition and TBARS concentration in natural phytoplankton as well as in laboratory culture of S. acus. Total FA content in the pelagic and nearshore phytoplankton samples (2014 and 2016) varied from 20–60 mg g−1 of dry weight (d.w.). Myristic C14:0, palmitic C16:0, and oleic C18:0 acids were dominant saturated FAs (SFAs) of ~30–40%. Palmitoleic acid C16:1(n-7) was the dominant MUFA (~20–30%). Hexatrienoic C16:3(n-6,9,12) and essential eicosapentaenoic C20:5(n-5,8,11,14,17) acids were dominant PUFAs (~30–40%). For all samples, high contents of C16:1 and C16:0 FAs (26–48%), as well as of C20:5 ω-3 FA (13–23%), were observed (Table 4).
The most similar FA compositions were observed for nearshore phytoplankton collected far from settlements and S. acus cultivated at 6 °C in poor medium during the two-week period (Table 4). The maximum content of polyunsaturated FAs (PUFAs) and monounsaturated FAs (MUFAs), including essential C20:5 ω3 eicosapentaenoic acid, was recorded in pelagic phytoplankton from the central stations (Table 3).
The formation of malondialdehyde (MDA) as an FA peroxidation product characterizes pathological processes in a living cell. MDA can appear in water organisms under the impact of anionic surfactants, such as linear alkylbenzene sulphonates (LASs) [41,42,54], heavy metals [55], polycyclic aromatic hydrocarbons (PAH) [56], and antibiotics [57]. According to a previous investigation [58], anionic surfactants found in the Baikal nearshore water ranged from 4.8 μg L−1 to 20 μg L−1 [58]. Low concentrations of LASs (5–20 μg L−1) can cause toxic effects on aquatic microorganisms [59,60,61].
Based on these data, we analyzed for the first time the lipid peroxidation marker in Lake Baikal phytoplankton and laboratory cultures of S. acus. In phytoplankton collected from central pelagic stations no. 11, 13, 15, 17, and 18 and at nearshore stations no. 4 and 8, TBARS were not detected (Table 5). In phytoplankton of nearshore station no. 6, TBARS were represented a minimal concentration (14 μg g−1 of d.w.). TBARS concentration in phytoplankton of other nearshore stations near the Kultuk settlement, as well as near towns of Baikalsk and Severobaikalsk, ranged from 80–340 μg g−1 of d.w. TBARS were either not found or represented a minimal concentration in samples with high PUFA and MUFA percentages of ~70%. A TBARS concentration of ≥80 μg g−1 was identified in samples with an average PUFA and MUFA content of 53 μg g−1 of d.w. In the S. acus laboratory culture, both at exponential and stationary stages of growth, TBARS were not detected (Table 5).

4. Discussion

4.1. The Present Composition of Baikal Phytoplankton during the Spring Season

Previously, it was thought that during the spring season the algal complex of pelagic phytoplankton in Lake Baikal consisted predominantly of large-volume diatoms [44], such as endemic Aulacoseira baicalensis (Wislouch) Simonsen, A. islandica (O.Müller) Simonsen, Cyclotella minuta (Skvortzov) Antipova, endemic Cyclotella baicalensis Skvortzov et Meyer; S. acus subsp. radians (Kützing) Skabitschevsky, and Stephanodiscus meyeri Genkal et Popovskaya. A similar phytoplankton composition is typical of pelagic and coastal zones [54,55,56]. Notably, for the past period (~30 years), the structure and functioning of shallow spring phytoplankton have changed. The periodicity of years with high productivity (B ≥ 1000 mg m−3) and low productivity (B ≤ 100 mg m−3) of large-volume A. baicalensis has disappeared [62,63]. In the last ten years, the small-volume diatom S. acus subsp. radians has been maximally abundant during each spring season. Phytoplankton productivity in the current period from 2014 to 2021 was much lower than in previous years (1950–1970 and 1970–1995) when large-cell diatoms of the genus Aulacoseira predominated [12,63,64]. In recent years, A. baicalensis has been found as single cells without intensive blooming.
Our data show that in all littoral and pelagic net samples, phytoplankton (2016–2020) containing S. acus, prevailed. This allows us to compare the FA composition of S. acus fraction of coastal and pelagic phytoplankton exposed to anthropogenic impacts of varying intensity. The dominance of S. acus is needed to compare the results of FA analysis of the samples collected within different parts of the lake. This is due to S. acus prevalence and its sensitivity to pollution. We found that S. acus is a bioindicator of anionic surfactant pollution—it responds to the exposure of anionic surfactants of 5–20 μg L−1 concentration. The response appears as oxidation stress due to a high content of PUFAs in cell membranes of diatoms. Diatom membranes consist of proteins and phospholipids (~50%/50% by mass) including PUFAs. For example, the PUFA content of S. acus cell membrane is ~30%. On the other hand, the cell membranes of Chrysophyta, Cryptophyta, Dinophyta, Cyanophyta, and Chlorophyta classes consist mostly of polymers. These polymers such as cellulose and hemicellulose make these algae more stress resistant.
Many lakes show vertical stratification of their water masses, at least for some extended periods. In Lake Baikal, we can observe inverse water stratification in March, with a surface water temperature of ~0.4–2 °C [64]. In the deep-water layer, the water temperature is ~3.6 °C. At the end of May or in the first two weeks of June, we observed spring homothermy of the water body, during which water temperature is ~3.5–3.7 °C through all layers, from the bottom to the surface [65]. At the end of August or in the first two weeks of September, we can observe a reverse water stratification, in which surface water temperature is ~10–12 °C and sometimes it may reach 14–22 °C, deep-water temperature is ~3.5–3.7 °C, and thermocline depth is 25–50 m. At the end of November, an autumn homothermy can occur. In our study, all samples were collected during the spring season when water temperatures were near homothermy values [64].
In our investigation, water temperature ranged from 3.4–3.6 °C at almost all pelagic sampling sites and from 3.0–6.0 °C at almost all coastal sites. Nitrate, phosphate, and silica concentrations in Baikal water are constant throughout the year [10,19,66]. According to Popovskaya et al., there is no clear relationship between the concentration of nutrients and phytoplankton growth [44]. The seasonal by-turn blooming of the different species is mostly due to temperature changes. The temperature during the spring season increases irregularly throughout the entire water area of the lake due to its large length from south to north. According to Popovskaya et al. [44], there is no clear relationship between the intensity of phytoplankton growth to water temperatures of 0.8 °C to 5.0 °C. Hence, our study did not take into account water temperatures and nutrient concentrations that provide high productivity in coastal and pelagic zones [10,21,25,26] and which cannot cause stress or change in phytoplankton FA composition under spring season homothermy.

4.2. Phytoplankton FA Composition and FA Peroxidation

At all sampling sites, phytoplankton were at the exponential stage of growth, allowing us to exclude the dependence of FA composition on growth stages. Multivariate analysis of the results by the principal component method and the cluster analysis confirms that FA composition of pelagic and coastal phytoplankton differs.
A higher PUFA concentration (~40%) was determined in the samples of pelagic phytoplankton compared to most of the coastal samples (~26%). Additionally, a higher content (up to 10–15%) of MUFA of triacylglycerols was determined in the coastal samples. Higher concentrations of the sum of MUFA and PUFA (~65%) were detected in coastal samples no. 4, 6, and 8 compared to other coastal samples (~53%). We noted differences in PUFA concentrations between pelagic phytoplankton collected at the central stations and phytoplankton from the offshore pelagic stations. Trying to understand this difference, this study analyzed, for the first time, TBARS as a lipid peroxidation marker in Baikal phytoplankton and laboratory cultures of S. acus. Table 5 shows that TBARS were either not found or shows minimal concentrations in the coastal samples no. 4, 6, and 8 samples. Aya Bay (station no. 4), Shamanka Bay (station no. 6), and Ludar Cape (Station no. 8), where the Baikalskoe settlement is situated (population 600 people), are the areas with low anthropogenic load compared to other nearshore stations. Oxidative stress was not identified at these stations. As mentioned above, the principal component method and cluster analysis revealed the clustering of these samples separately from other coastal samples (Figure 3 and Figure 4).
Coastal stations no. 1, 2, 3, 5, and 9 were situated near large cities and settlements, such as Kultuk (3715 citizens, according to 2020 data), Baikalsk (12,534), Khuzhir (1350), and Severobaikalsk (23,180). The high TBARS concentration in phytoplankton of these stations ranged from 80–340 μg g–1 of dry weight (Table 5). High TBARS concentration near Elokhin Cape can be explained by cyclonic convectional gradient flow along the perimeter of the lake, as this flow can transport water from the Severobaikalsk town (station no. 9) along the west coast to Elokhin Cape [23,67].
Therefore, we suggest that this phenomenon of TBARS occurrence in phytoplankton results from peroxidation of cell membrane phospholipids (mainly PUFAs) due to anthropogenic impact in the coastal zone. We assume that this impact can be caused by anionic surfactants. These substances were found in Lake Baikal for the first time in 2019 in our previous investigation [58]. According to the mentioned investigation, anionic surfactant concentrations in the coastal water of Lake Baikal ranged from 4.8 μg L−1 (station no. 8) to 20 μg L−1 (station no. 9). A higher concentration of linear alkylbenzene sulphonates LAS (40 μg L–1) was found in the Tyya River, a tributary of Lake Baikal. The Tyya mouth is located close to the station no. 9 (~3 km). A dramatically high concentration of anionic surfactants (170 μg L−1) was registered in sewage water of Severobaikalsk (Republic of Buryatia) [57]. We also analyzed anionic surfactants in surface water of three basins (n = 57) using a modified spectrophotometry method with methylene blue and gas chromatography coupled with mass spectrometry. Surfactant concentrations ranged from 4.5 ± 0.6 to 29.2 ± 3.5. μg L−1 in samples collected in autumn 2019, and from 2.00 ± 0.24 to 16.9 ± 2.1 μg L−1 in samples collected in spring season 2020. Maximum concentrations (≥20 μg L−1, n = 3) were found in the recreation zones as well as in zones located not far from settlements.
There is no production plant at the coast of Lake Baikal dumping untreated sewage water into the lake. Nevertheless, the recreation and human impacts on the environment have increased significantly [68]. The dramatic effect relates to the absence of wastewater treatment plants on the Lake Baikal coast. Few treatment plants are of outdated design. As a result, eutrophication of local nearshore areas as well as the toxic effect of environmental pollutants of untreated sewage water can be observed. Anionic surfactants such as LASs are the most common aquatic pollutants. Low LAS concentrations (5–20 μg L−1) have toxic effects on aquatic microorganisms [59,60] and fishes, leading to morphological changes in gills and skin [61]. Given this, we can assume a negative impact of low surfactant concentrations on Baikal phytoplankton. This phenomenon can cause changes in the production of biologically active substances including fatty acids that puts the biodiversity of the world’s deepest lake at risk. Baikal is one of the largest and deepest lake of the world natural heritage of the UNESCO. It differs from other lakes by its unique marine features. A lot of fine poetic words like these “Hoc mare [Yonder is the sea], magnum et spatiosum manibus [great and wide]; illic reptilia quorum non est numerus [Wherein are things creeping innumerable], animalia pusilla cum magnis [Both small and great beasts]” can be dedicated to great lakes. But nearshore living organisms of great water ecosystems need our efficient actions to decrease anthropogenic impact on littoral. Phytoplankton represent the first link of the water ecosystem. Their damage by chemicals may result in serious biodiversity changes, the onset of which can already be observed in the nearshore zone.

5. Conclusions

For the first time, we revealed a lipid peroxidation product (TBARS) in the Baikal nearshore phytoplankton collected near large cities and settlements (80–340 μg g−1). TBARS were not detected in the phytoplankton of stations that were maximally remote from the sources of anthropogenic impact. Changes in fatty acid composition, including a decrease in PUFA, were identified for phytoplankton exposed to anthropogenic impact. This suggests that the high level of anthropogenic impact on the coastal zone near cities and large settlements causes stress of phytoplankton.

Author Contributions

Conceptualization, methodology, writing the text of the manuscript, translation—A.A.N.; editing—S.S.V.; chemical analysis of FAs, their peroxidation products, and surfactants—A.A.N.; cultivation of the S. acus—N.A.V., Y.P.G., S.M.S.; water temperature measurements—V.V.B., R.Y.G.; microscopic analysis of Lake Baikal phytoplankton composition (2018–2021)—S.S.V.; phytoplankton investigation (2014–2016)—S.M.S.; sampling of water—A.A.N., S.S.V.; sampling of phytoplankton—S.M.S., S.S.V., A.A.N.; statistical analysis—A.A.N., S.M.S., Y.S.B.; evaluation of the level of anthropogenic impact—A.A.N. The investigation is the authors’ common cause. All authors have read and agreed to the published version of the manuscript.

Funding

The investigation was carried out within the State Projects of the Ministry of the Science and High Education of the Russian Federation (no. 0279-2021-0005 “Investigation of the transformation s in the states of water bodies and watercourses in East Siberia…”, no. 0279-2021-0008 “From the cell to the ecosystem: investigation the ultrastructure of the hydrocoles…”, no. 0279-2021-0009 “Investigation of the role of selected genes and proteins of Baikal diatoms…”).

Institutional Review Board Statement

Not applicable.

Informed Consent Statement

Not applicable.

Data Availability Statement

The data presented in this study are available on request from the corresponding author Alyona Nikonova. E-mail: [email protected].

Acknowledgments

The authors thank Andrey P. Fedotov, Igor B. Mizandrontsev, and Alexander G. Gorshkov for helpful advises. We are grateful to Mikhail A. Grachev and Elena V. Likhoshway for the “Ultramicroanalysis” Instrumental Center equipment. We acknowledge Tamara V. Khodzher and Irina I. Marinaite for the possibility of using GC-FID. We thank Andrey V. Khabuev for the Lake Baikal map-making, and the crew of R/V “Vereshchagin”, “Papanin”, “Koptyug”, “Titov” for fieldwork made on Lake Baikal. Alyona Nikonova expresses deep gratitude to her family.

Conflicts of Interest

The authors declare no conflict of interest.

References

  1. Schmid, M.; De Batist, M.; Granin, N.G.; Kapitanov, V.A.; McGinnis, D.F.; Mizandrontsev, I.B.; Obzhirov, A.I.; Wuest, A. Sources and sinks of methane in Lake Baikal: A synthesis of measurements and modeling. Limnol. Oceanogr. 2007, 52, 1824–1837. [Google Scholar] [CrossRef] [Green Version]
  2. De Batist, M.; Canals, M.; Sherstyankin, P.; Alekseev, S. The INTAS Project 99-1669 Team, 2002. A New Bathymetric Map of Lake Baikal. Available online: http://www.lin.irk.ru/intas/index.htm (accessed on 6 December 2021).
  3. Vereschagin, G.Y. Baikal; Gosudartvennoye Izdatel’stvo Geograficheskoi Literatury: Moscow, Russia, 1949; 228p. (In Russian) [Google Scholar]
  4. Galazii, G.I. (Ed.) Baikal; Russian Academy of Sciences, Siberian Branch, Interdepartmental Scientific Board on “Siberia” Program, Federal Service of Geodesy and Cartography of Russia: Moscow, Russia, 1993; 160p. (In Russian) [Google Scholar]
  5. Wetzel, R.G. Limnology: Lake and River Ecosystems, 3rd ed.; Academic Press: San Diego, CA, USA; San Francisco, CA, USA; New York, NY, USA; Boston, MA, USA; London, UK; Sydney, Australia; Tokyo, Japan, 2001; 1006p. [Google Scholar]
  6. Nakashizuka, T.; Stork, N. (Eds.) Biodiversity Research Methods: YBOY (International Biodiversity Observation Year) in Western Pacific and Asia; University Press, Trans Pacific Press: Kyoto, Japan, 2002; 216p. [Google Scholar]
  7. Karabanov, E.B. Podvodnye Ladshafty Baikala [Underwater Landscapes of Lake Baikal]; Nauka Publ.: Novosibirsk, Russia, 1987; p. 183. (In Russian) [Google Scholar]
  8. Kozhov, M.M. Biologiya Ozera Baikal [Lake Baikal Biology]; Acad. of Sciences of USSR: Moscow, Russia, 1962; p. 316. [Google Scholar]
  9. Lut, B.F. Morfologiya i morfometriya Baikalskoi vpadiny [Morphology and Morphometry of Baikal Depression], Chapter II. In The Way for knowledge of Baikal; Afanasieva, E.L., Beckman, M.Y., Bezrukova, E.V., Verbolov, V.I., Votintcev, K.K., Galazii, G.I., Goldyrev, G.S., Granina, L.Z., Dryukker, V.V., Ladeishokov, N.P., et al., Eds.; Nauka Publ.: Novosibirsk, Russia, 1987; pp. 34–47. (In Russian) [Google Scholar]
  10. Votintsev, K.K.; Meshcheryakova, A.I.; Popovskya, G.I. Krugovorot Organicheskogo Veshchestva v Ozere Baikal [Organic Substance Cycle in Lake Baikal]; Nauka Publ.: Novosibirsk, Russia, 1975; 190p. (In Russian) [Google Scholar]
  11. Vadeboncoeur, Y.; McIntyre, P.B.; Vander Zanden, M.J. Borders of Biodiversity: Life at the Edge of the World’s Large Lakes. BioScience 2011, 61, 526–537. [Google Scholar] [CrossRef]
  12. Popovskaya, G.I. Ecological monitoring of phytoplankton in Lake Baikal. Aquat. Ecosyst. Health Manag. 2000, 3, 215–225. [Google Scholar] [CrossRef]
  13. Shishlyannikov, S.M.; Klimenkov, I.V.; Bedoshvili, E.D.; Mikhailov, I.S.; Gorshkov, A.G. Effect of mixotrophic growth on the ultrastructure and fatty acid composition of the diatom Synedra acus from Lake Baikal. J. Biol. Res. 2014, 21, 1–8. [Google Scholar] [CrossRef] [Green Version]
  14. Rives, D.B.; Jewson, D.H.; Sturm, M.; Battarbee, R.; Flower, R.G.; Mackay, A.W.; Granin, N.G. Quantitative and qualitative relationships between planktonic diatom communities and diatom assemblages in sedimenting material and surface sediments in Lake Baikal, Siberia. Limnol. Oceanogr. 2003, 48, 1643–1661. [Google Scholar] [CrossRef] [Green Version]
  15. Behrenfeld, M.J.; O’Malley, R.T.; Siegel, D.A.; McClain, C.R.; Sarmiento, J.L.; Feldman, G.C.; Milligan, A.J.; Falkowski, P.G.; Letelier, R.; Boss, E. Climate-driven trends in contemporary ocean productivity. Nature 2006, 444, 752–755. [Google Scholar] [CrossRef]
  16. Ansari, A.A.; Gill, S.S.; Lanza, G.R.; Rast, W. Eutrophication: Causes, Consequences and Control; Springer: Dordrecht, The Netherlands; Heidelberg, Germany; London, UK; New York, NY, USA, 2011; 394p. [Google Scholar]
  17. Häder, D.P.; Gao, K. Interactions of anthropogenic stress factors on marine phytoplankton. Front. Environ. Sci. 2015, 3, 1–14. [Google Scholar] [CrossRef] [Green Version]
  18. Echeveste, P.; Galbán-Malagón, C.; Dachs, J.; Berrojalbiz, N.; Agustí, S. Toxicity of natural mixtures of organic pollutants in temperate and polar marine phytoplankton. Sci. Total. Environ. 2016, 571, 34–41. [Google Scholar] [CrossRef]
  19. Grachev, M.; Bukin, Y.; Blinov, V.; Khlystov, O.; Firsova, A.; Bashenkhaeva, M.; Kamshilo, O.; Titova, L.; Bairamova, E.; Bedoshvili, Y.; et al. Is a High Abundance of Spring Diatoms in the Photic Zone of Lake Baikal in July 2019 Due to an Upwelling Event? Diversity 2021, 13, 504. [Google Scholar] [CrossRef]
  20. Odum, E.P.; Barrett, G.W. Fundamentals of Ecology, 5th ed.; Cengage Learning: Boston, UK, 2004; 624p. [Google Scholar]
  21. Votintsev, K.K.; Glazunov, I.V. Hydrochemical regime of Lake Baikal near settlement of Listvennichnyi//Transactions of the Limnological Institute. V. III (XXIII). In Hydrochemical Investigations of Lake Baikal; Galazii, G.I., Ed.; AS RAS Publ.: Moscow, Russia, 1963; pp. 3–56. (In Russian) [Google Scholar]
  22. Sokolnikov, V.M. Flows in deep layers and water cycle in Baikal. In Flows and Diffusion of Baikal Water; Galazii, G.I., Ed.; AS RAS Publ.: Moscow, Russia, 1963; pp. 67–74. (In Russian) [Google Scholar]
  23. Afanasyev, A.N.; Verbolov, V.I. Techeniya v Baikale [Flows in Baikal]; Nauka: Novosibirsk, Russia, 1977; 160p. (In Russian) [Google Scholar]
  24. Ladeishchikov, N.P. Izuchenie klimata Baikala [Baikal Climate Investigation]. In the Way for Knowledge of Baikal; Afanasieva, E.L., Beckman, M.Y., Bezrukova, E.V., Verbolov, V.I., Votintcev, K.K., Galazii, G.I., Goldyrev, G.S., Granina, L.Z., Dryukker, V.V., Ladeishokov, N.P., et al., Eds.; Nauka Publ.: Novosibirsk, Russia, 1987; pp. 76–84. (In Russian) [Google Scholar]
  25. Goldman, C.R.; Elser, J.J.; Richards, R.C.; Reuter, J.E.; Priscu, J.C.; Levin, A.L. Thermal stratification, nutrient dynamics and phytoplankton productivity during the onset of spring phytoplankton growth in Lake Baikal, Russia. Hydrobiologia 1996, 331, 9–24. [Google Scholar] [CrossRef]
  26. Genkai-Kato, M.; Sekino, T.; Yoshida, T.; Miyasaka, H.; Khoszher, T.; Belykh, O.A.; Melnik, N.G.; Kawabata, Z.; Higashi, M.; Nakanishi, M. Nutritional diagnosis of phytoplankton in Lake Baikal. Ecol. Res. 2002, 17, 135–142. [Google Scholar] [CrossRef]
  27. Falk-Petersen, S.; Sargent, J.R.; Henderson, J.; Hegseth, E.N.; Hop, H.; Okolodkov, Y.B. Lipids and fatty acids in ice algae and phytoplankton from the Marginal Ice Zone in the Barents Sea. Polar Biol. 1998, 20, 41–47. [Google Scholar] [CrossRef]
  28. Zhila, N.O.; Kalacheva, G.S. Effect of salinity on the biochemical composition of the alga Botryococcus braunii Kütz IPPAS H-252. J. Appl. Phycol. 2011, 23, 47–52. [Google Scholar] [CrossRef] [Green Version]
  29. Wagenen, J.V.; Miller, T.W.; Hobbs, S.; Hook, P.; Crowe, B.; Huesemann, M. Effect of Light and Temperature on fatty acid production in Nannochloropsis Salina. Energies 2012, 5, 731–740. [Google Scholar] [CrossRef] [Green Version]
  30. Costantini, D. Oxidative Stress and Hormesis in Evolutionary Ecology and Physiology; Springer: Heidelberg, Germany; New York, NY, USA; Dordrecht, The Nehterlands; London, UK, 2014; 346p. [Google Scholar]
  31. Nikonova, A.A.; Shishlyannikov, S.M.; Shishlyannikova, T.A.; Avezova, T.N.; Babenko, T.A.; Belykh, O.I.; Glyzina, O.Y.; Obolkin, V.A.; Pavlova, O.N.; Smagunova, A.N.; et al. Determination of Free and Esterified Fatty Acids in Hydrocoles of Different Content of Polyunsaturated Fatty Acids by Gas–Liquid Chromatography. J. Anal. Chem. 2020, 75, 1310–1321. [Google Scholar] [CrossRef]
  32. Abedi, E.; Sahari, A.M. Long-chain polyunsaturated fatty acid sources and evaluation of their nutrition and functional properties. Food Sci. Nutr. 2014, 2, 443–463. [Google Scholar] [CrossRef] [PubMed]
  33. Berg, J.M.; Tymoczko, J.L.; Stryer, L. Biochemistry, 5th ed.; W. H. Freeman and Company: New York, NY, USA, 2002; 1208p. [Google Scholar]
  34. Goncalves, A.M.M.; Marques, J.C.; Goncalves, F. Fatty Acids’ Profiles of Aquatic Organisms: Revealing the Impacts of Environental and Anthropogenic Stressors; Intech Open: London, UK, 2017; Chapter 6; pp. 89–117. [Google Scholar]
  35. Arts, M.T.; Ackman, R.G.; Holub, B.J. “Essential fatty acids” in aquatic ecosystems: A crucial link between diet and human health and evolution. Can. J. Fish. Aquat. Sci. 2001, 58, 122–137. [Google Scholar] [CrossRef]
  36. Hampel, M.; Ortiz-Delgado, J.B.; Sarasquete, C.; Blasco, J. Effects of sediment sorbed linear alkylbenzene sulphonate on juveniles of the Senegal sole, Solea senegalensis: Toxicity and histological indicators. Histol. Histopathol. 2008, 23, 87–100. [Google Scholar] [PubMed]
  37. Katagi, T. Surfactant Effects on Environmental Behavior of Pesticides. Rev. Environ. Contam. Toxicol. 2008, 194, 71–177. [Google Scholar]
  38. Zelzer, S.; Oberreither, R.; Bernecker, C.; Stelzer, I.; Truschnig-Wilders, M.; Fauler, G. Measurement of total and free malondialdehyde by gas–chromatography mass spectrometry-comparison with high-performance liquid chromatography methology. Free. Radic. Res. 2013, 47, 651–656. [Google Scholar] [CrossRef]
  39. Janero, D.R. Malondialdehyde and thiobarbituric acidreactivity as diagnostic indices of lipid peroxidation and peroxidative tissue injury. Free Radic. Biol. Med. 1990, 9, 515–540. [Google Scholar] [CrossRef]
  40. Lopez, C.A.; Mendez, J.C. Anticancer drugs acting via radical species, photosensitizers and photodynamic therapy of cancer. Chapter 4. In Medicinal Chemistry of Anticancer Drugs; Carmen, A., Carlos Menéndez, J., Eds.; Elsevier B.V.: Madrid, Spain, 2008; pp. 93–138. [Google Scholar]
  41. Marnett, L.J. Lipid peroxidation-DNA damage by malondialdehyde. Mutat. Res. Fundam. Mol. Mech. Mutagenesis 1999, 424, 83–95. [Google Scholar] [CrossRef]
  42. Zhou, J.; Wu, Z.; Yu, D.; Pang, Y.; Cai, H.; Liu, Y. Toxicity of linear alkylbenzene sulfonate to aquatic plant Potamogeton perfoliatus L. Environ. Sci. Pollut. Res. 2018, 25, 32303–32311. [Google Scholar] [CrossRef] [PubMed]
  43. Bondarenko, N.A.; Logacheva, N.F. Structural Changes in Phytoplankton of the Littoral Zone of Lake Baikal. Hydrobiol. J. 2017, 53, 16–24. [Google Scholar] [CrossRef]
  44. Popovskaya, G.I.; Usoltseva, M.V.; Domysheva, V.M.; Sakirko, M.V.; Blinov, V.V.; Khodzher, T.V. The spring phytoplankton in the pelagic zone of Lake Baikal during 2007–2011. Geogr. Nat. Resoures 2015, 36, 253–262. [Google Scholar] [CrossRef]
  45. Timoshkin, O.A.; Samsonov, D.P.; Yamamuro, M.; Moore, M.V.; Belykh, O.I.; Malnik, V.; Sakirko, M.; Shirokaya, A.; Bondarenko, N.; Domysheva, V.; et al. Rapid ecological change in the coastal zone of Lake Baikal (East Siberia): Is the site of the world’s greatest freshwater biodiversity in danger? J. Great Lakes Res. 2006, 42, 487–497. [Google Scholar] [CrossRef] [Green Version]
  46. Khanaev, I.V.; Kravtsova, L.S.; Maikova, O.O.; Bukshuk, N.A.; Sakirko, M.V.; Kulakova, N.V.; Butina, T.V.; Nebesnykh, I.A.; Belikov, D.I. Current state of the sponge fauna (Porifera: Lubomirskiidae) of Lake Baikal: Sponge disease and the problem of conversation of diversity. J. Great Lakes Res. 2018, 44, 77–85. [Google Scholar] [CrossRef]
  47. Maikova, O.O.; Kravtsova, L.S.; Khanaev, I.V. Baikal endemic sponges in the system of ecological monitoring. Limnol. Freshw. Biol. 2020, 1, 364–367. [Google Scholar] [CrossRef] [Green Version]
  48. Moselhy, H.F.; Reid, R.G.; Yousef, S.; Boyle, S.P. A specific, accurate, and sensitive measure of total plasma malondialdehyde by HPLC. J. Lipid Res. 2013, 54, 852–858. [Google Scholar] [CrossRef] [Green Version]
  49. Al-Rashed, S.A.; Ibrahim, M.M.; El-Gaaly, G.A.; Al-Shehri, S.; Mostafa, A. Evaluation of radical scavenging system in two microalgae in response to interactive stresses of UV-B radiation and nitrogen starvation. Saudi J. Biol. Sci. 2016, 23, 706–712. [Google Scholar] [CrossRef] [Green Version]
  50. Rakita, S.M.; Colovie, D.S.; Levart, A.R.; Banjac, V.V.; Colovie, R.R.; Dragojlović, D.M.; Đuragić Olivera, M. A rapid spectrophotometric method for determination of thiobarbituric acid reactive substances in rainbow trout feed. Food Feed Res. 2020, 47, 43–53. [Google Scholar] [CrossRef]
  51. Smagunova, A.N. Metody Matematicheskoi Statistiki v Analiticheskoi Khimii [Methods of Mathematical Statistics in Analytical Chemistry]; Gosudarstvennyi Universitet: Irkutsk, Russia, 2008; 340p. (In Russian) [Google Scholar]
  52. Mardia, K.V.; Kent, J.T.; Bibby, J.M. Multivariate Analysis; Academic Press Limited Publ.: London, UK, 1979; 100p. [Google Scholar]
  53. Yule, G.U.; Kendall, M.G. An Introduction to the Theory of Statistics, 14th ed.; Griffin & Company Publ.: Glasgow, UK, 1950; 701p. [Google Scholar]
  54. Liu, N.; Wu, Z. Toxic effects of linear alkylbenzene sulfonate on Chara vulgaris L. Environ. Sci. Pollut. Res. 2018, 25, 4934–4941. [Google Scholar] [CrossRef] [PubMed]
  55. Srivastava, S.; Tripathi, G.; Mishra, S.; Gupta, G. Copper-induced oxidative stress and responses of antioxidants and phytochelatins in Hydrilla verticillata (L.f.). Royle Aquatic Toxicol. 2006, 8, 405–415. [Google Scholar] [CrossRef] [PubMed]
  56. Vega-López, A.; Ayala-López, G.; Posadas-Espadas, B.P.; Olivares-Rubio, H.F.; Dzul-Caamal, R. Relations of oxidative stress in freshwater phytoplankton with heavy metals and polycyclic aromatic hydrocarbon. Comp. Biochem. Physiol. Part A Mol. Integr. Physiol. 2013, 165, 498–507. [Google Scholar] [CrossRef]
  57. Guoa, J.; Penga, J.; Leia, Y.; Kanervab, M.; Lia, Q.; Song, J.; Guo, J.; Sun, H. Comparison of oxidative stress induced by clarithromycin in two freshwater microalgae Raphidocelis subcapitata and Chlorella vulgaris. Aquat. Toxicol. 2020, 219, 105376. [Google Scholar] [CrossRef] [PubMed]
  58. Nikonova, A.A. Organic synthetic anionic surfactants as persistent organic pollutants of water ecosystems. Limnol. Freshw. Biol. 2020, 4, 620–621. [Google Scholar] [CrossRef]
  59. Lewis, A.M. Chronic and sublethal toxicities of surfactants to aquatic animals: A review and risk assessment. Water Res. 1991, 25, 101–113. [Google Scholar] [CrossRef]
  60. Jorgensen, E.; Christoffersen, K. Short-term effects of linear alkylbenzene sulfonate on freshwater Plankton studied under field conditions. Environ. Toxicol. Chem. 2000, 19, 904–911. [Google Scholar] [CrossRef]
  61. Stamatelatou, K.; Pakou, C.; Lyberatos, G. 6.37.4.1. Linear alkylbenzene sulfonates (LAS). Occurrence, toxicity, and biodegradation of selected emerging priority pollutants in municipal sewage sludge. In Comprehensive Biotechnology, 2nd ed.; Moo-Young, M., Ed.; Pergamon: Oxford, UK, 2011; Volume 6, pp. 473–484. [Google Scholar]
  62. Vorobyeva, S.S. Phytoplankton assemblages of the Southern Baikal in 1990–1995 and 2016–2018. Limnol. Freshw. Biol. 2018, 2, 141–143. [Google Scholar] [CrossRef]
  63. Bondarenko, N.A.; Vorobyova, S.S.; Zhuchenko, N.A.; Golobokova, L.P. Current state of phytoplankton in the littoral area of Lake Baikal, spring 2017. J. Great Lakes Res. 2020, 46, 17–28. [Google Scholar] [CrossRef]
  64. Vologina, E.G.; Sturm, M.; Vorobyeva, S.S. Present Sedimentation in Lake Baikal. Experimental Results with Sedimentary Traps. Dvenadtsatoe Uralskoe Litilogicheskoe Soveshanie [12th Ural Litologic Workshop]; IGGUrO RAN Publ.: Ekaterinburg, Russia, 2018; pp. 62–63. [Google Scholar]
  65. Tomberg, I.V.; Sakirko, M.V.; Domysheva, V.M.; Sez’ko, N.P.; Lopatina, I.N.; Bashenkhaeva, N.V.; Philevich, E.A.; Kulikova, N.N.; Popova, O.V.; Malnik, V.V.; et al. First Data about Chemical Composition of Interstitial Water of Lake Baikal Splash Zone; Series “Biology. Ecology”; Izvestiya Irkutskogo Gosudarstvennogo Universiteta [Bull. of Irkutsk State University]: Irkutsk, Russia, 2012; Volume 5, pp. 64–74. (In Russian) [Google Scholar]
  66. Rusinek, O.T.; Takhteev, V.V.; Gladkochub, D.P.; Khodzher, T.V.; Budnev, N.M.; Bezrukova, E.V.; Galkin, V.V.; Galkina, V.I.; Granina, L.Z.; Goryunova, O.I.; et al. Baikalogy: In 2 books. Book 1; Nauka Publ.: Novosibirsk, Russia, 2012; 468p. [Google Scholar]
  67. Krotova, V.A. Geostrophic Baikal Water Circulation at the Straight Stratification Period. Trudy Limnologicheskogo Institute SO AN SSSR [Transactions of Limnological Institute SB RAS, USSR]; Nauka Publ.: Leningrad, Russia, 1970; pp. 11–45. (In Russian) [Google Scholar]
  68. Gagarinova, O.V.; Belozertseva, I.A.; Vorobyeva, I.B.; Vlasova, N.V.; Emelyanova, N.V.; Sorokovoi, A.A. Anthropogenic transformations in the mouth area of tributaries as factors of negative impact on Lake Baikal. Water 2021, 13, 1295. [Google Scholar] [CrossRef]
Figure 1. Bathymetric map of Lake Baikal. Sampling sites are marked.
Diversity 14 00055 g001
Figure 2. Some large-volume and long-sized algae in phytoplankton of Lake Baikal during the spring season 2020. Sample site no. 20.
Diversity 14 00055 g002
Figure 3. Analysis of Baikal phytoplankton and S. acus axenic laboratory culture by the principal component method.
Diversity 14 00055 g003
Figure 4. Dendrogram of the FA composition of the Baikal coastal and pelagic phytoplankton and the FA composition of the S. acus laboratory culture at stationary and exponential phases of growth.
Diversity 14 00055 g004
Table 1. Comprehensive composition of the current spring season phytoplankton in Lake Baikal (2020).
Algae TaxaSample Stations in South Basin of the Lake
Western Flank Nearshore Sampling
Site No. 19
Pelagic Sampling Site No. 20Eastern Flank Nearshore Sampling Site No. 14
Sampling Depth
1 m1 m50 m400 m1 m
Number of cells N, 103 cells L−1 and cell biomass B, mg m−3
NBNBNBNBNB
Class Cyanophyta
Anabaena sp.3.40.34
Oscillatoria sp.425.9
Lyngbya sp.
Phormidium sp.
Total425.93.40.3
Class Chrysophyta
Dinobryon cylindricum O.E. Imhof0.20.40.30.61.42.72.54.80.40.20
Cystes of Chrysophyta0.60.30.60.31.40.76.53.3
Dinobryon sociale (Ehrenberg) Ehrenberg
Mallomonas vannigera Asmund984.9
Chrysochromulina parva Lackey582.9422.18.40.40.50.03
Total593.6433.0113.8108.0985.1
Class Cryptophyta
Rhodomonas pusilla (H. Bachmann) Javornicky6516266.3174.02.20.514535
Cryptomonas gracilis Skuja0.40.80.61.21.12.20.51.10.61.2
Cryptomonas ovata Ehrenberg
Total6516277.5186.32.71.614636
Class Dinophyta
Gyrodinium helveticum (Penard) Y. Takano and T. Horiguchi0.4100.9232.3581.1280.411
Gymnodinium baicalense N.L. Antipova0.260.154.50.206.0
Peridinium baicalense Kisselev and V. Zvetkov
Glenodinium sp.0.40.60.91.31.11.72.74.11.42.0
Ceratium hirundinella (O.F.Müller) Dujardin
Total1.0171.9283.4593.8322.019
Class Bacillariophyta
Aulacoseira baikalensis (Wislouch) Simonsen0.460.34.50.58.13.248
Aulacoseira islandica (O.Müller) Simonsen + spore0.840.632103.81934170
Synedra acus subsp. radians (Kützing) Skabichevskij13124921039914026665124280532
Synedra ulna var. danica (Kützing) Van Heurck0.20.60.51.7
Synedra ulna (Nitzsch) Ehrenberg0.10.22
Nitzschia graciliformis Lange-Bertalot and Simonsen0.30.08
Cyclotella minuta (Skvortsov) Antipova0.20.40.30.60.30.60.200.4
Cyclotella baicalensis Skvortsov and K.I.Meyer0.24.00.35.80.360.36.00.204.0
Ellerbeckia teres (Brun) R.M.Crawford
Stephanodiscus meyeri Genkal and Popovskaya0.20.20.60.60.60.60.80.8
Asterionella formosa Hassall
Total13326421240814428871160318754
Class Chlorophyta
Monoraphidium arcuatum (Korshikov) Hindák151.88.61.0131.60.80.106.20.7
Monoraphidium contortum (Thuret) Komárková-Legnerová0.80.11
Koliella longiseta (Vischer) Hindák0.30.080.60.150.30.080.80.200.70.18
Elakatothrix genevensis (Reverdin) Hindák0.140.02
Scenedesmus acuminatus (Lagerheim) Chodat
Scenedesmus sp.
Closterium moniliferum Ehrenberg ex Ralfs
Pediastrum boryanum (Turpin) Meneghini
Chlamidomonas sp.0.30.15
Total161.99.31.214.11.71.90.46.90.9
Total phytoplankton biomass31630929344819435989202571815
Table 2. Contribution of Bacillariophyta to total phytoplankton biomass during spring season (2020).
Class of AlgaeSample Stations in the Southern Basin of Lake Baikal
Western
Flank Nearshore
Station
Central Pelagic StationEastern
Flank Nearshore Station
Sampling Depth
1 m1 m50 m400 m1 m
Number of cells N (%) and cell biomass B (%)
NBNBNBNBNB
Cyanophyta131.91.80.09
Chrysophyta191.2150.75.81.1114.017.20.6
Cryptophyta215.39.21.79.31.73.10.8264.4
Dinophyta0.35.40.76.31.8164.3160.42.3
Bacillariophyta42867291748080795693
Chlorophyta4.90.63.20.37.30.52.10.221.20.11
Table 3. Contribution of S. acus to total coastal phytoplankton biomass during spring season (2014).
Sampling StationsNorthern Latitude (N)Eastern Longitude (E)B (%) of
S. acus
Other Predominant Bacillariophyta
051°31′391″104°11′398″91A. baicalensis, C. baicalensis, A. islandica
151°43′147″103°42′964″95A. baicalensis, C. baicalensis, A. islandica
251°31′726″104°08′086″91A. baicalensis, C. baicalensis, A. islandica
351°31′726″104°08′086″91A. baicalensis, C. baicalensis, A. islandica
452°47′332″106°36′445″85A. islandica
553°12′316″107°19′587″87A. islandica
653°13′201″107°22′290″87A. islandica
754°32′285″108°39′814″89A. baicalensis, A. islandica
855°21′428″109°12′713″88A. baicalensis, A. islandica
9.155°35′385″109°20′720″88A. baicalensis, A. islandica
9.155°34′021″109°13′677″88A. baicalensis, A. islandica
1951°49′094″104°54′776″95A. baicalensis, C. baicalensis, A. islandica
Table 4. FA content averages of natural phytoplankton and laboratory culture of S. acus.
FAsFA Composition, %
Phytoplankton Sampling StationsLaboratory S. acus Culture
Nearshore Stations Far from SettlementsCentral Pelagic
Stations
Nearshore Stations Near SettlementsOffshore Pelagic Stations4 h24 h2 Weeks
C16:1 ω930.421.719.212.212.013.327.0
C16:017.311.417.413.637.236.121.0
C16:3 ω45.514.24.510.84.86.08.4
C16:2 ω43.64.32.94.72.22.93.9
C18:1 ω92.31.92.30.75.65.41.7
C18:05.11.55.112.819165.5
C18:4 ω32.40.22.40.81.652.112.4
C18:3 ω31.70.31.70.51.551.331.04
C20:4 ω60.30.30.10.30.080.050.02
C20:5 ω312.923.013.314.66.68.913.0
C22:6 ω33.81.72.03.70.591.021.27
PUFAs30.344.127.635.410.114.731.9
PUFAs + MUFAs *65725350374368
* PUFA—polyunsaturated fatty acids; MUFA—monounsaturated fatty acids.
Table 5. TBARS concentrations (μg g−1 of d.w.) in some phytoplankton samples collected in 2016.
SamplesLocationLake
Zone
Total FA,
mg g−1
PUFA and
MUFA
Percentage
TBARS,
μg g−1 of d.w.
11Marituy River—Solzan River (2016)Pelagic15.8 ± 1.472Not found
17Baikalskoe settlement—Frolikha River (2016)Pelagic17.0 ± 1.572Not found
18Elokhin Cape—Davsha settlementPelagic24.2 ± 2.270Not found
1Kultuk settlement (2016) Nearshore24.0 ± 2.15680
1Kultuk settlement (2018)Nearshore20.7 ± 1.856100
2Baikalsk town (2016) Nearshore27.1 ± 2.458280
3Baikalsk town (2016)Nearshore27.1 ± 2.458340
0Baikalsk pulp and paper mill (2016)Nearshore26.2 ± 2.360160
0Baikalsk pulp and paper mill (2018)Nearshore21.3 ± 1.954164
4Aya Bay (2016)Nearshore28.1 ± 2.566Not found
6Shamanka Bay (2016)Nearshore28.7 ± 2.66014
7Elokhin Cape (2016)Nearshore18.1 ± 1.655180
8Baikalskoe settlement (2016)Nearshore49 ± 468Not found
9.1Tyya River mouth (2016)Nearshore26.7 ± 2.446100
9.1Tyya River mouth (2018)Nearshore15.6 ± 1.45811
9.2Senogda Bay (2016)Nearshore14.0 ± 1.340190
S. acus laboratory culture, +6 °C, DM medium, 12 h4.2 ± 0.448Not found
S. acus laboratory culture, +6 °C, DM medium, 24 h35 ± 374Not found
S. acus laboratory culture, +6 °C, DM medium, 50 daysNo dataNot found
Publisher’s Note: MDPI stays neutral with regard to jurisdictional claims in published maps and institutional affiliations.

