Article

Application of DNA Barcoding for Monitoring Madagascar Fish Biodiversity in Coastal Areas

by
Henitsoa Jaonalison
1,*,
Jean-Dominique Durand
2,
Jamal Mahafina
1,
Pierre Valade
3,
Adeline Collet
3,
Frédérique Cerqueira
4 and
Dominique Ponton
5
1
Institut Halieutique et des Sciences Marines, Université de Toliara, Rue Dr. Rabesandratana, Toliara 601, Madagascar
2
MARBEC, Université Montpellier, IRD, CNRS, Ifremer, 34090 Montpellier, France
3
Organisme Consultant en Environnement Aquatique, 97432 Ravine des Cabris, France
4
ISEM, CNRS, University of Montpellier, IRD, EPHE, 34000 Montpellier, France
5
ENTROPIE, IRD, Université de La Réunion, CNRS, Université de la Nouvelle-Calédonie, Ifremer, c/o Institut Halieutique et des Sciences Marines, Université de Toliara, Rue Dr. Rabesandratana, Toliara 601, Madagascar
*
Author to whom correspondence should be addressed.
Diversity 2022, 14(5), 377; https://doi.org/10.3390/d14050377
Submission received: 24 April 2022 / Revised: 7 May 2022 / Accepted: 8 May 2022 / Published: 11 May 2022
(This article belongs to the Section Marine Diversity)

Abstract

:
Madagascar is a marine biodiversity hotspot. A recent checklist recorded 1689 marine or transitional water fish species, 2.5% being endemic. To date, studies in this country were mostly focused on adult fishes using morphological-based identification. The early life stages of fishes remain largely understudied. The present work aimed to improve knowledge of fish biodiversity in Madagascar by focusing on post-larval reef fishes and settled juveniles in seagrass meadows of southwest Madagascar by using either species identification keys or DNA barcoding. Up to 119,500 individuals were collected, and 1096 individuals were successfully barcoded. We identified 387 species—85 through their morphology (with 58 unsuccessfully sequenced) and 302 by using CO1 barcoding corresponding to 302 barcode index numbers (BINs). This study added 27 new BINs for the BOLD database, 120 new for Madagascar, but only 159 were assigned a precise species name. By referring to the updated checklist of Madagascar fishes, 10 new species were detected for Madagascar. This number will probably increase when all the barcoded specimens become assigned to precise species names. These preliminary findings stress our poor knowledge of marine fish biodiversity in Madagascar and demonstrate the relevance of DNA barcoding in improving this knowledge.

1. Introduction

Madagascar is recognized for its terrestrial and marine biodiversity [1], including fishes. The country has about 1800 fish species with about 1700 marine fish, including anadromous and catadromous species [2]. Among marine fish species, up to 43 are endemic to Madagascar according to Fricke et al. [2]. The knowledge about Madagascar marine fish biodiversity mainly focuses on morphology-based identification which is usually not useful for some families or for early life stages. However, surveying the early life stages of fishes could probably improve this knowledge as demonstrated by [3] in the waters of Reunion Island.
Specimen identification at the species level constitutes a major issue when working on post-larvae or juvenile fish. Indeed, no specialized identification guide exists for reef fish juveniles, and the available identification guides for fish larvae rarely go beyond the genus level [4]. Several more precise identification guides exist, but they have been developed for specific areas and generally concern only a few species [5,6]. Obtaining the precise species richness in early life stages of fish remains, therefore, challenging [7]. For this reason, most previous studies describing larval fish diversity remain limited to the family level in temperate and tropical areas [8,9,10,11,12,13].
DNA barcoding based on mitochondrial cytochrome-c oxidase 1 sequence (CO1) is one of the most widely used tools for species identification [3,7,14,15]. According to [16], this approach appears more effective for identifying fish larvae than techniques based on individual morphology and meristic character. Moreover, Meredith [17] reported the potential of DNA barcoding in revealing the misidentification of species when using traditional identification keys. Despite the potential ability of DNA barcoding to assign a species name to a given specimen, this tool presents, however, some limitations, such as its low capacities in identifying recently diverged or hybrid species [15]. These limitations allowed these authors to suggest an approach integrating both morphological characteristics and DNA barcoding to improve the efficiency of species identification. This identification-based approach was adopted by [3] through the combination of DNA barcoding with high-definition photos for identifying fish larvae from Reunion Island waters. Another limitation of molecular-based identification is the capacity of reference libraries to associate CO1 sequences with precise species names. Indeed, these libraries are currently confronted with problems related to misidentifications as reported by [18].
The present work focused on surveying fish larvae and juveniles by using the approach combining DNA barcoding and high-definition photos developed by [3]. The ultimate goal was to enhance our knowledge of Malagasy fish biodiversity, and to pursue the building of a CO1 sequence library for Madagascar fishes. More specifically, the present work aimed at: (i) characterizing the diversity of post-larval fish in coral reef habitats and juvenile fishes in seagrass beds, and (ii) discovering eventual new records for Madagascar.

2. Materials and Methods

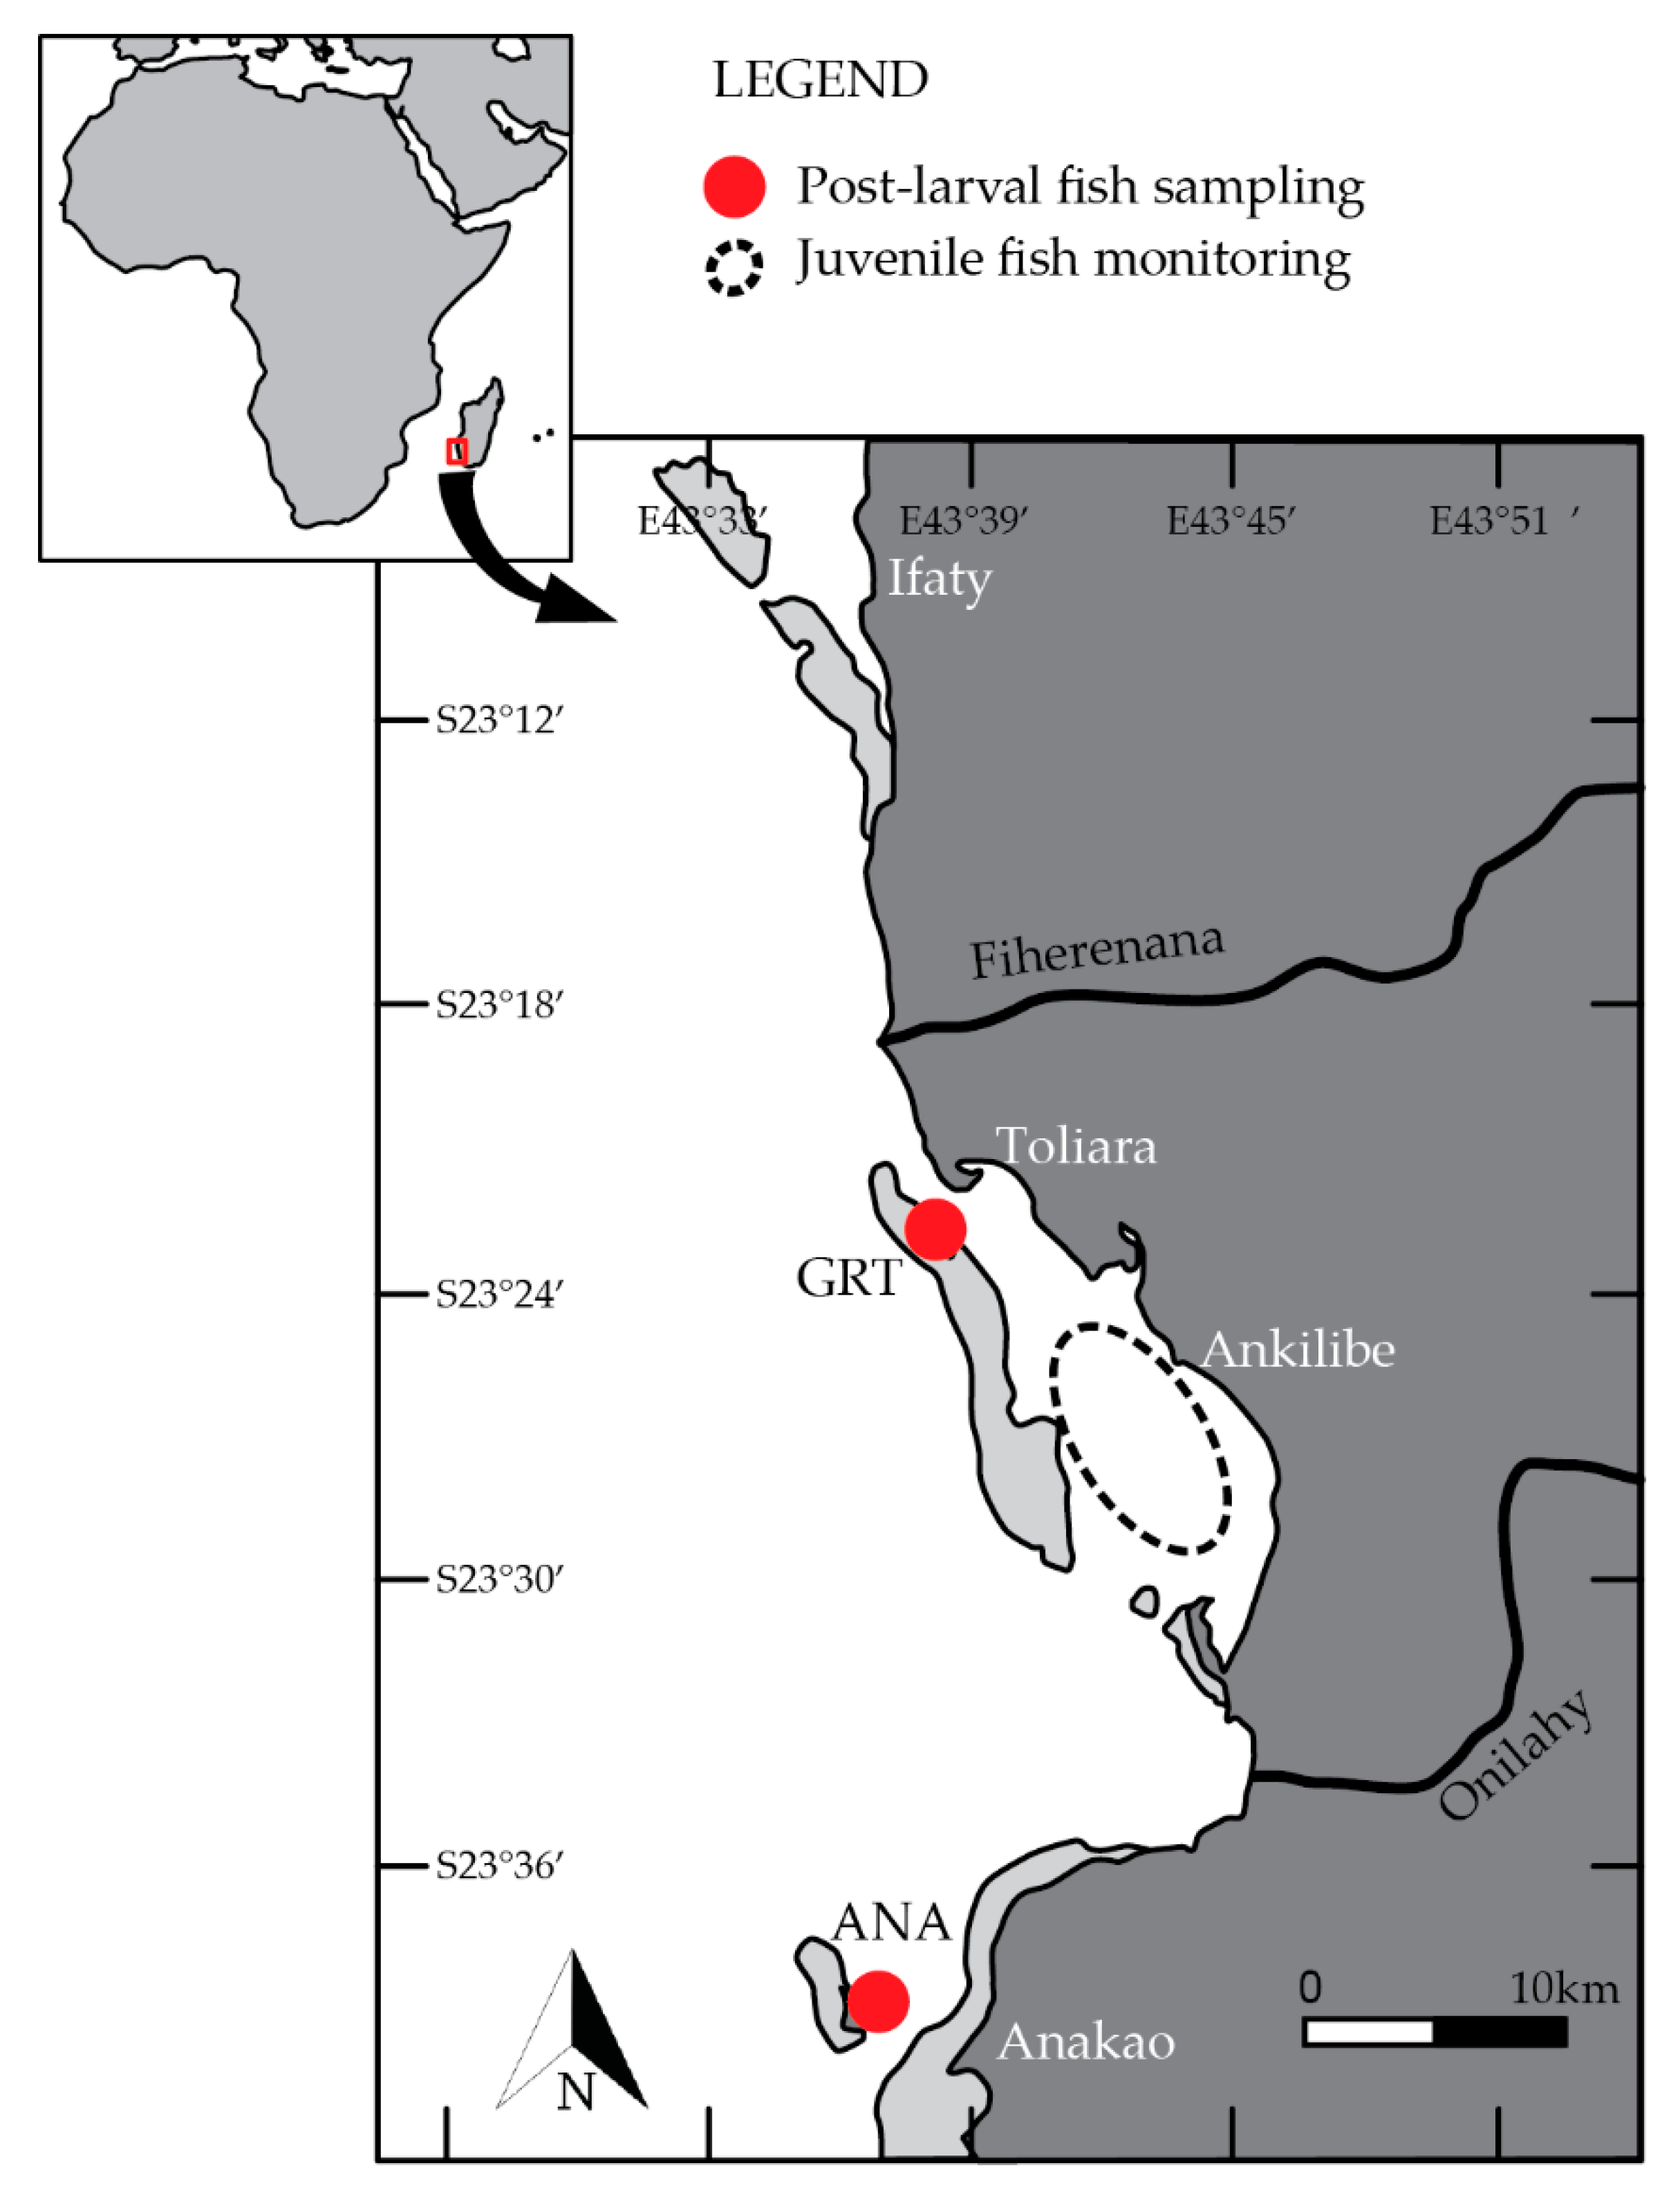
2.1. Study Sites and Sampling

This study was carried out in coral reef habitats and seagrass beds of the southwestern coast of Madagascar (Figure 1). The post-larval fish survey was conducted in (i) a flat coral reef surrounding Nosy Ve Island, and (ii) in the northern part of the Toliara Great Barrier Reef. These sites were selected because previous scientific information on habitat morphology and the associated resources were available [10,19]. A juvenile fish survey was conducted in the seagrass beds off Ankilibe, 15 km to the south of Toliara. This area was chosen because of the presence of small-scale fishermen engaged in juvenile fishing using mosquito seine nets [20].
Post-larvae sampling took place over three six-month periods during the warm season: November to April of 2014–2015, 2016–2017, and 2017–2018. The warm season was chosen as the peaks of abundance and species richness always occur during this period [10]. For each warm season, three stations per site were sampled by using light traps called “SLEEP” (acronym of “Système Lumineux Electronique d’Echantillonnage des Post-larves”) developed by OCEA Consult’ on Reunion Island [3]. Each monthly sampling consisted of three consecutive nights centered on the new moon period, as the fish larval supply on the reef environment mainly occurs around this lunar phase [21]. Although light traps are selective and their efficiency is influenced by the water-current conditions or by water mass turbidity [22,23], they were used because they allow one to catch fish larvae before they settle onto benthic habitats, at a stage called “post-larvae” [24,25]. Six light traps per night were deployed, with three traps per site (i.e., one trap per station). Light traps were set around sunset and retrieved around the crepuscule. The individuals caught by each trap were placed into separate containers filled with seawater for keeping them alive.
For seagrass fishes, the catches of two small-scale fishermen using mosquito seine nets were sampled during the warm seasons of 2016–2017 and 2017–2018 (i.e., November to April). This period corresponds to the highest landings in southwestern Madagascar [26]. Although several small-scale fishing gears are commonly used in southwest Madagascar, fishermen using mosquito seine nets were chosen as they capture many juveniles [27]. The catches were collected for three days at spring tide, a period more practical for the deployment of mosquito seine net needing a depth of less than 1.3 m and thus more favorable for fishing. Sampled catches were put into a cooler with ice and transported to the IH.SM laboratory for the identification process.

2.2. Identification Process

In the laboratory, living individuals from light traps, and dead fishes from mosquito nets, were sorted by morphospecies, i.e., individuals presenting a similar morphology. Each morphospecies was identified at the lowest possible taxonomical level by using published keys [28,29,30], the identification of some specimens remaining to family or order level. One specimen per morphospecies and per sample was randomly selected and photographed with a camera Nikon model D90 equipped with a Sigma 105 mm macro lens. Post-larvae were euthanized with an overdose of clove oil. The camera was connected directly to a computer equipped with the Adobe Lightroom 5.7 ® software—created by Adobe Systems Inc. in San Jose California USA—used for managing the photos and all the information related to each specimen. A tissue fragment from each photographed specimen was preserved in 90% ethanol and stored at −20 °C until total DNA extraction. Several tissue fragments per morphospecies were brought for barcoding at the genotyping and sequencing facility, Institut des Sciences de l’Evolution, CEMEB, University of Montpellier, France. Tissue fragments were then rinsed with distilled water to remove the alcohol and then dried in 2 mL individual tubes. An automated purification of genomic DNA from dried tissues was performed by using a Macherey–Nagel NucleoMag® 96 Tissue kit [31]. About 650 bp were amplified from cytochrome oxidase 1 (CO1) mitochondrial gene by using the cocktail of primers FishF1-5′TCAACCAACCACAAAGACATTGGCAC3′ and FishF2-5′TCGACTAATCATAAAGATATCGGCAC3’ [BOLD Primer code: C_FishF1] in combination with FishR1-5′TAGACTTCTGGGTGGCCAAAGAATCA3′ [BOLD Primer code: VR1] [32]. A complete description of the sequencing process can be found in [3]. The CO1 sequences were manually edited by using Chromas 2.6.4 (DNA Sequencing software. available online: http://technelysium.com.au/wp/chromas/, accessed on 15 May 2017). CO1 sequences with their corresponding specimen images and sampling details (e.g., location, time, taxonomy) were uploaded into the Barcode of Life Data System database [dx.doi.org/10.5883/DS-PHDJAO]. In BOLD, each sequence was assigned a barcode index number (BIN) by delineating sequence clusters through single linkage analysis by using a 2.2% sequence divergence for obtaining the operational taxonomic units [33]. The resulting OTUs were refined by using Markov clustering and the optimal partition was selected through silhouette criterion ([33]. For assigning a species name to each BIN, we adopted an approach consisting of several steps. First, if the BIN corresponded to only one species in BOLD, and this species was observed in this BIN only, the specimen was identified as “Genus + species”. Second, if the BIN corresponded to different species from the same genus, or if the species corresponding to this BIN was also assigned to different BINs in BOLD, the specimen was identified as “Genus + BIN”. Third, if the BIN corresponded to species from different genera, but belonged to the same family, the specimen was identified as “Family + BIN”. Fourth, when the BIN was new for BOLD (i.e., corresponding to specimens that had never been barcoded before), identification was based on the combination of the lowest taxonomical level based on morphological character and the BIN (i.e., Genus + BIN and/or Family + BIN). Note that identification such as “Genus + BIN”, or “Family + BIN”, do correspond to identifications at the species level, as each BIN corresponds to an OTU, and thus to a putative species [33].

2.3. Data Analyses

Data analyses were implemented with R programming software R3.5.1 created by R Core Team in Vienna-Austria [34]. For providing the expected observed fish species richness and assessing the additional sampling benefits, species accumulation curves of the population from mosquito seine nets and light-trap catches were plotted by using the “vegan” package (Version 2.5.4, [35]). Bootstrap estimators were demonstrated as better estimators of total species richness than jackknife and Chao’s estimator [36]. The “wiqid” package (Version 0.2.2, [37]) using richboot function was used to obtain the bootstrapped estimation of species richness [38].
The number of species corresponding to the initial names obtained from morphological-based identifications was compared to the resulting OTU from BOLD to highlight the strength of molecular-based identification approach. For assessing the effort of fish DNA barcoding in Madagascar, the existing BINs in BOLD—associated with fish species names from this country—were extracted from the Public Data Portal on 4 May 2022 by using the keywords “Actinopterygii Madagascar”. The species names that occurred most were assigned to each of the extracted BINs and compared to the list of fish species reported by [2]. To obtain the contribution of the present study in increasing DNA barcoding effort for Madagascar fishes, these extracted BINs were compared with the BINs obtained in this study.

3. Results

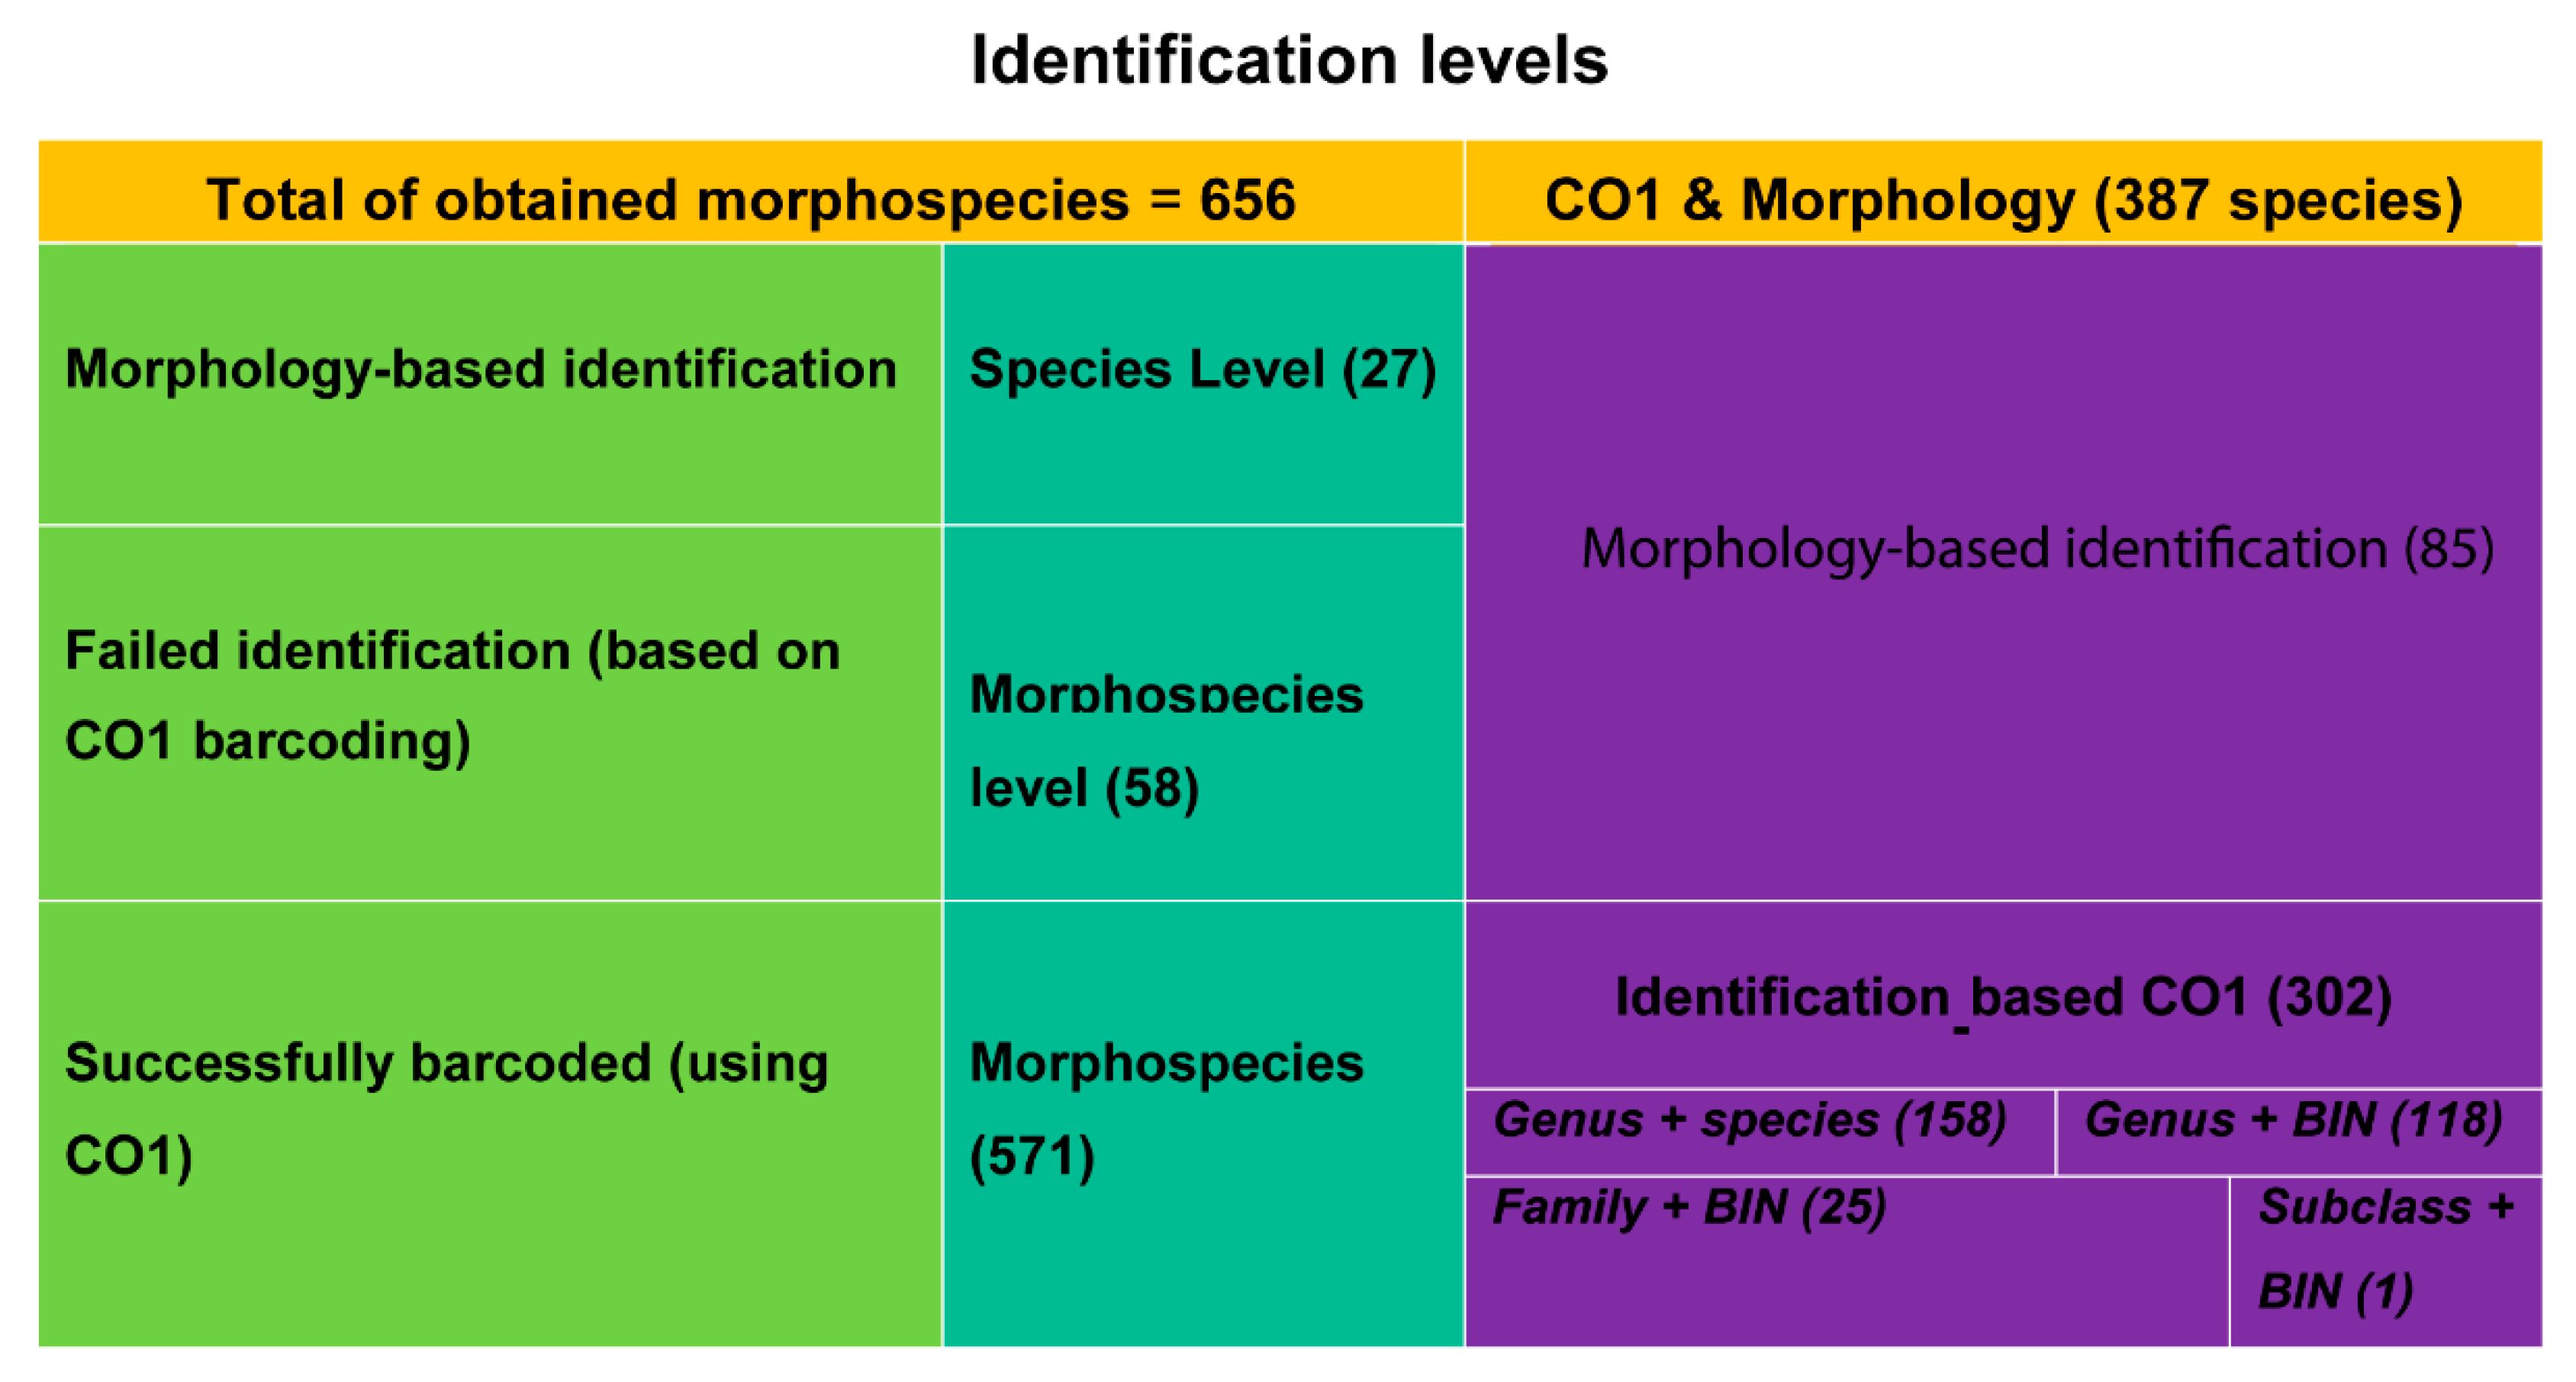
3.1. Species Richness: Morphological vs. Molecular-Based Identification

In total, 364 samples were collected: 286 from light traps and 78 from mosquito seine nets. 119,500 individuals were collected, 50,342 from light traps and 69,158 from mosquito seine nets. Using morphological characteristics only, we identified 656 morphospecies among post-larvae and juvenile fish. A total of 1096 individuals from 571 morphospecies were successfully barcoded (with 1 to 17 barcoded specimens for each morphospecies; see Supplementary Material Table S1). Finally, 387 species from 66 families were obtained by the combination of molecular-based identification and morphology approach (see Supplementary Material Table S2). Ten families were the most specious: Apogonidae with 37 species, Pomacentridae (26), Syngnathidae (25), Lethrinidae (22), Labridae (22), Mullidae (20), Chaetodontidae (18), Gobiidae (16), Acanthuridae (15), and Carangidae (14). Among the 387 species, 238 were observed as post-larvae and 232 as seagrass fishes, 83 species being observed in both sampling gears. Based on the species accumulation curves, the maximum values of species richness were not reached with light traps (Figure 2a) nor with mosquito seine nets (Figure 2b). The bootstrap estimator of the total species richness estimated that light traps and mosquito seine nets should catch up to approximately 275 and 264 species, respectively.
Among the 387 observed species, 85 (22%) were identified by their morphology only (27 at the species level, 58 as morphospecies which were unsuccessfully sequenced) and 302 (78%) by using CO1 barcoding corresponding to 302 BINs (see Supplementary Material Table S2). Among the 302 obtained BINs, 159 were unambiguously associated with a genus + species name, 115 presented ambiguities in species’ name assignment, and 27 BINs had never been recorded before in the BOLD database. The 115 BINs presenting ambiguities in species’ name assignment included 104 identified as “Genus + BIN” (e.g., Hippocampus [BOLD:ACE6993]), 11 as “Family + BIN” (e.g., Labridae [BOLD:ACT0048]) and one as “Subclass + BIN” (Actinopterygii [BOLD:ADN1799]) (Figure 3). Among the 27 new BINs, 14 were identified as “Genus + BIN” and 13 as “Family + BIN” (see Supplementary Material Table S2). More than half of these 27 new BINs for BOLD belonged to Apogonidae (four BINs), Gobiidae (three BINs), Labridae (four BINs), Lethrinidae (four BINs), and Syngnathidae (three BINs).

3.2. Discordances in Species Assignment

Among the 141 BINs presenting ambiguities in the species’ name assignment, 70, including the 27 new ones, were simply not assigned to species name in the BOLD database. The remaining 71 BINs presented ambiguities in species assignation. These ambiguities came either from BINs associated with several species names in BOLD, or from BINs assigned to one species name to which two or more BIN(s) were associated. The first type of ambiguity concerned three BINs: BOLD:AAA9764 associated with Myripristis hexagona and M. murdjan, BOLD:AAD1777 associated with Pempheris adusta and P. nesogallica, and BOLD: AAD5600 associated with Apogon erythrinus and Ostorhinchus aureus. The second type of ambiguity corresponded to 68 BINs.

3.3. Geographical Distribution of Ambiguous Species

The species’ geographical distribution is important for understanding whether the ambiguities in species name assignment could be linked to the different regions where they occur. The geographical distribution of the 71 BINs presenting ambiguities in the species’ name assignment could be categorized into two groups. The first group comprised 44 BINs for which the associated species name was also associated with another BIN(s) observed in different regions (Table 1). For the second group of 27 BINs, no clear geographical distribution was observed (Table 2).

3.4. DNA Barcoding Effort for Madagascar Fishes

Among the 1689 marine or transitional water fish species recorded in Madagascar EEZ [2], only 419 (i.e., about 24.8%) had already been barcoded and assigned to a BIN in the BOLD database in May 2022 (Table S3). Based on the comparison of these 419 BINs with the obtained BINs from this study, the present work added 120 new BINs for Madagascar (see Supplementary Material Table S2) including the 27 new BINs that were never recorded before for the BOLD database. These 120 new BINs belonged to 41 families, half of them corresponding to species of Pomacentridae (16 species), Apogonidae (14), Chaetodontidae (eight), Labridae (eight), Mullidae (eight), and Lethrinidae (six).
This study allowed us to identify 10 new records for Madagascar, i.e. species that had never been observed in the coastal waters of this country. These new species for Madagascar were among the 159 BINs that were unambiguously associated to a species name. These species were Chaetodon ulietensis Cuvier 1831, Diagramma labiosum Macleay 1883, Dipterygonotus balteatus Valenciennes 1830, Equulites klunzingeri Steindachner 1898, Foa fo Jordan & Seale 1905, Neamia octospina Smith & Radcliffe 1912, Ostorhinchus gularis Fraser & Lachner 1984, Paramonacanthus frenatus Peters 1855, Pempheris ibo Randall & Victor 2015, and Scarus fuscopurpureus Klunzinger 1871.

4. Discussion

The present work highlighted the usefulness of DNA barcoding as a tool for inventorying biodiversity based on early life stages of fish. We observed an over-evaluation of species richness when using only morphological characters, 571 morphospecies vs. 387 species when using DNA barcoding combined with a morphological approach. Inversely in other studies, using only a morphological approach has also led to an underestimation of the number of species as observed by [13] in the southwest tropical Atlantic Coast. These authors identified 76 post-larval reef fish morphospecies from 465 samples (i.e., the catches of one light trap for one night) over five years by using morphological and meristic characteristics. Even though these authors did not use DNA barcoding, this richness appeared to be low compared to the 733 reef fish species known in this part of the Atlantic Coast [39]. For instance, in [13] only one morphospecies assigned to “Genus spp. or Family spp.” was observed for each of the families Scorpaenidae, Gobiidae, and Synodontidae because meristic characters largely overlap between species. This highlights the inconsistency of traditional identification techniques due to the inefficiency of morphological characteristics for separating some species as already reported by [16].
The present work—using DNA-based identification—observed up to 265 putative species (i.e., 265 BINs) caught as post-larvae from 286 samples only. Previous work using similar light traps at the same sites obtained 128 post-larval reef fish morphospecies from 145 samples, 79 only being identified at the species level ([11]. Based on the graph presented in Figure 2a, 145 samples would correspond to approximately 180 species, i.e., ~40% more species than observed without using DNA barcoding. These findings confirm the DNA barcoding usefulness for identifying the early life stage of fish species as reported by [17], and support its higher efficiency compared to traditional techniques.
DNA barcoding can also contribute to knowledge improvement of fish biodiversity at local or global scales. As revealed by [40], DNA barcoding is useful for enhancing fish biodiversity knowledge as they detected up to 90 new species for South Africa during their ten-year-long post-larval survey. Similarly—in waters of Reunion Island—Collet et al. [3] demonstrated the importance of post-larval surveys in improving fish biodiversity knowledge using DNA barcoding. These authors found ten new species that had never been recorded in the Reunion Exclusive Economic Zone over six months of sampling during a single warm season (about 108 samples). These findings appear to be in line with our results as 10 species that had never been recorded in Madagascar were observed during three warm seasons (364 samples). By referring to the Catalog of Fishes, four of these new species for Madagascar (Dipterygonotus balteatus, Foa fo, Neamia octospina, Paramonacanthus frenatus, and Pempheris ibo) have already been observed in the Western Indian Ocean region. On the other hand, five of the new species (Chaetodon ulietensis, Diagramma labiosum, Equulites klunzingeri, Ostorhinchus gularis, and Scarus fuscopurpureus) appeared to be new records for this region. This result may be related to their misidentification during previous works using morphological identification only. This could also correspond to an extension of their geographical distribution linked to their larvae dispersal during tropical storms, which has already been demonstrated for Epinephelus marginatus whose larvae were suggested to be transported by a cyclone from South Africa—which holds the nearest known population—to Reunion Island [41]. Moreover, the present work also contributed to the enhancement of fish biodiversity knowledge at a global scale as 27 BINs new for the BOLD database were obtained. These new BINs may either correspond to fish species that have never been described due to the rarity of molecular-based studies in the region. This can also correspond to species that have never been barcoded at the adult stage [42] as most barcoding studies are still based on the commercial value of the species. The lack of CO1 sequences in BOLD may also be linked to the way specimens are usually selected for DNA analyses. Most of the time, specimens are first grouped by similar morphologies (i.e., morphospecies) and patterns of colors. As the number of barcoded specimens per morphospecies is often limited, some species that look similar based on their morphology may be ignored. In the present work, several specimens were barcoded within each morphospecies. This was particularly the case for Lethrinids post-larvae and juveniles as cryptic species are often encountered in this family [43] and morphological keys are unable to distinguish the species [44]. In the present study, BOLD assigned the CO1 sequences of 138 Lethrinids specimens to 14 BINs, four of them being new for BOLD. This finding not only confirms that DNA barcoding can deal with species that are hard to differentiate [15] but also demonstrate that the way individuals are selected for DNA analyses is important for increasing fish biodiversity knowledge.
Although DNA barcoding appeared to be a promising tool for identifying the early life stage of fish, some barcoded individuals were not assigned to a species name. Wibowo et al. [45] were also unable to assign to species names a large proportion of larval fish morphospecies (68%) they had collected in Indonesia tropical swamps. According to these authors, the main problem was the lack of reference CO1 sequences. In the present work, 141 BINs were not clearly assigned to a species name. Of these 141 BINs, 43 (excluding the 27 new BINs for BOLD) were not associated with a precise species name. For the remaining 71 BINs, the species name corresponding to each of these BINs was also assigned to other BINs in BOLD. Ideally, there should be one BIN only for each species and vice versa [33]. Interestingly, for 44 of these 71 BINs (i.e., 62%), the species name associated with each BIN was also associated with another BIN corresponding to specimens caught in a different geographical location (Table 2). For example, among the two BINs corresponding to Plectroglyphidodon lacrymatus, BIN BOLD:AAI8860, observed during the present study, is solely observed in the Western Indian Ocean, whereas BIN BOLD:AAB6989 is observed in the Western Pacific Ocean. These findings confirm the DNA barcoding ability for tracing species origin [15]. It is, however, difficult to determine if these BINs correspond to sister species or only to one species presenting a high phylogeographic structure (i.e., an intraspecific divergence without speciation process) as observed in the groupers [46]. In order to not increase noise in BOLD, the specimens caught during the current study were, thus, identified as Plectroglyphidodon [BOLD:AAI8860]. For the remaining 27 BINs out of these 71 BINs, no clear spatial distribution in the BINs corresponding to each species name was observed (Table 2). For example Zebrasoma desjardinii is associated either with the BIN BOLD:AAF6311 or with BOLD:ACV8450, both of them being observed in the Western Indian Ocean. This kind of ambiguous case may be associated with specimen voucher misidentifications that often occur in laboratories [47]. Indeed, Zebrasoma desjardinii is difficult to distinguish morphologically from Zebrasoma veliferum [48]. Such misidentifications cause serious problems in reference libraries such as in BOLD and has already been stressed by [18] for the Indo-Pacific fish larvae. This highlights the important need for revising the information present in reference libraries.
An increase in the DNA barcoding effort, not only for adult fishes but also for larval and juvenile fishes, remains mandatory for a better knowledge of fish biodiversity. For example, 1919 fish species are known from South Africa’s exclusive economic zone, but only 1006 (52.4%) have been barcoded [40]. Nevertheless, these authors demonstrated that the DNA barcoding effort added 90 new species caught as larvae and 139 as adults. For Madagascar, among the 1689 marine or transitional water fish species reported by [2], only 419 (~25%) had been barcoded before the present work. The current study sequenced up to 120 fish species of Madagascar that were never barcoded, and added 27 new BINs in BOLD, and recorded at least 10 new species for Madagascar. Thus, the number of marine, or transitional water, fish species in Madagascar rose to 1710, 530 of them (~36%) being barcoded. In Madagascar, the effort in terms of DNA barcoding is still in an early stage of development compared to other countries in the Western Indian Ocean such as South Africa. Increasing this DNA barcoding effort by conducting surveys at broader geographic and temporal scales, using all life stages from post-larvae to adults, will thus improve the knowledge of Malagasy fish biodiversity. This will allow updating the checklist of Malagasy fishes reported by [2].

5. Conclusions

In conclusion, this study clearly stressed the usefulness of DNA barcoding as a promising tool for enhancing the knowledge of the Malagasy marine fish biodiversity. This work—which added a large number of new sequences to BOLD—represents an important step for establishing a national sequence reference library for marine fish of Madagascar. The large number of fish species that remain to be barcoded demonstrates that Madagascar is still in the early stages of development in terms of molecular-based identification of marine fish. Increasing research efforts based on molecular-based identification by conducting a study on a broader scale will contribute to a significant effect on fish biodiversity. Although the present work was carried out in a restricted area only, nine new records for Madagascar were detected. This number will probably increase when all the barcoded specimens—which presented ambiguities—are assigned to a precise species name. However, even if some specimens were not assigned to a species name, BIN can be used for biodiversity or ecological surveys [49]. Therefore, accurately identifying species based on their corresponding BIN will permit linking the early life stages to adults and investigating the response of these different life stages to environmental conditions.

Supplementary Materials

The following supporting information can be downloaded at: https://www.mdpi.com/article/10.3390/d14050377/s1. Table S1: Dataset of individuals successfully barcoded during the present work. Table S2: List of species captured by light traps and mosquito seine nets during austral warm seasons. The species are organized according to Nelson (2006). Total abundances are reported for each sampling gear as well as the number of successfully barcoded specimens. Table S3: List of barcoded fish species from Madagascar in BOLD in 4 May 2022.

Author Contributions

Conceptualization, H.J., J.M., P.V., A.C. and D.P.; Methodology, H.J., J.-D.D. and D.P.; Formal analysis, H.J., J.-D.D. and D.P.; Investigation, H.J., J.-D.D., J.M., F.C., P.V. and A.C.; Data curation, H.J., J.-D.D. and D.P.; Writing—Original draft preparation, H.J., J.-D.D., J.M., P.V., A.C., F.C. and D.P.; Writing—review & editing, H.J., J.-D.D. and D.P.; Supervision, D.P.; Project Administration, J.M.; Funding acquisition, H.J., J.M., P.V., A.C. and D.P. All authors have read and agreed to the published version of the manuscript.

Funding

The research was funded by the Critical Ecosystem Partnership Fund under Grant MG 66341; the Rufford foundation under Grant 2ac29a-1; Western Indian Ocean Marine Science Association (WIOMSA) under MARG II Contract 1/2016; the French National Research Institute for Sustainable Development under Grant JEAI-ACOM/IH.SM/IRD, and the European Union under grant POE 2.10 POCT FED–FEDER ‘Biodiversité de l’Océan Indien’.

Institutional Review Board Statement

Ethical review and approval were waived for this study as we work on dead animals retrieved from small-scale fisher catches for juvenile monitoring. For the collected living fish post-larvae from light trap, only one individual per taxa were collected and the remaining we returned to the sea.

Data Availability Statement

The data presented in this study are openly available in the Barcode of Life Data System database at dx.doi.org/10.5883/DS-PHDJAO and in GENBank with Reference accession number OL409189-OL410277 (this will publicly accessible by October 2022).

Acknowledgments

The authors would like to thank the field team Duphrehino, Tsipy Romario, Noelson and Tovondrainy for their help during fish sampling, and the Institut Halieutique et des Sciences Marines (IH.SM) for the support of the administrative and technical staff and donations in kind through their materials including their car, boats, and lab facilities used for field and lab work. The DNA extraction and sequencing were performed through the GenSeq technical facilities of the «Institut des Sciences de l’Evolution de Montpellier» with the support of LabEx CeMEB, an ANR “Investissements d’avenir” program (ANR-10-LABX-04-01). This is a contribution of the IRD-IH.SM-CNRO laboratoire mixte international MIKAROKA.

Conflicts of Interest

The authors declare no conflict of interest.

References

  1. MEF. Fourth National Report on Biological Diversity Convention Madagascar; Ministry of Environment and Forests: Antananarivo, Madagascar, 2009; p. 144.
  2. Fricke, R.; Mahafina, J.; Behivoke, F.; Jaonalison, H.; Léopold, M.; Ponton, D. Annotated Checklist of the Fishes of Madagascar, Southwestern Indian Ocean, with 158 New Records. FishTaxa 2018, 3, 432. [Google Scholar]
  3. Collet, A.; Durand, J.-D.; Desmarais, E.; Cerqueira, F.; Cantinelli, T.; Valade, P.; Ponton, D. DNA Barcoding Post-Larvae Can Improve the Knowledge about Fish Biodiversity: An Example from La Reunion, SW Indian Ocean. Mitochondrial DNA Part A 2018, 29, 905–918. [Google Scholar] [CrossRef] [PubMed]
  4. Leis, J.M.; Carson-Ewart, B.M. The Larvae of Indo-Pacific Coastal Fishes: An Identification Guide to Marine Fish Larvae, 2nd ed.; Leiden; Brill: Boston, FL, USA, 2004; ISBN 978-90-04-11577-4. [Google Scholar]
  5. Maamaatuaiahutapu, M.; Remoissenet, G.; Galzin, R. Guide d’identification Des Larves de Poissons Récifauxde Polynésie Française; Coral Reef Initiative for the South Pacific; Téthys: Nouméa, New Calédonie, 2006; 108p. [Google Scholar]
  6. Juncker, M. Young Coral Reef Fish of Wallis and the Central Pacific: Identification Guide; Wallis and Futuna-Environment: Noumea, New Caledonia, 2007; 170p. [Google Scholar]
  7. Frantine-Silva, W.; Sofia, S.H.; Orsi, M.L.; Almeida, F.S. DNA Barcoding of Freshwater Ichthyoplankton in the Neotropics as a Tool for Ecological Monitoring. Mol. Ecol. Resour. 2015, 15, 1226–1237. [Google Scholar] [CrossRef] [PubMed]
  8. Brodeur, R.; Peterson, W.; Auth, T.; Soulen, H.; Parnel, M.; Emerson, A. Abundance and Diversity of Coastal Fish Larvae as Indicators of Recent Changes in Ocean and Climate Conditions in the Oregon Upwelling Zone. Mar. Ecol. Prog. Ser. 2008, 366, 187–202. [Google Scholar] [CrossRef]
  9. Carassou, L.; Ponton, D.; Mellin, C.; Galzin, R. Predicting the Structure of Larval Fish Assemblages by a Hierarchical Classification of Meteorological and Water Column Forcing Factors. Coral Reefs 2008, 27, 867–880. [Google Scholar] [CrossRef]
  10. Mahafina, J. Perception et Comportement Des Pêcheurs Pour Une Gestion Durable de La Biodiversité et de La Pêcherie Récifale Du Sud-Ouest de Madagascar. Ph.D. Thesis, Université de La Réunion et Université de Toliara, Toliara, Madagascar, 2011. [Google Scholar]
  11. Jaonalison, H.; Mahafina, J.; Ponton, D. Fish Post-Larvae Assemblages at Two Contrasted Coral Reef Habitats in Southwest Madagascar. Reg. Stud. Mar. Sci. 2016, 6, 62–74. [Google Scholar] [CrossRef]
  12. Chen, L.-C.; Lan, K.-W.; Chang, Y.; Chen, W.-Y. Summer Assemblages and Biodiversity of Larval Fish Associated with Hydrography in the Northern South China Sea. Mar. Coast. Fish. 2018, 10, 467–480. [Google Scholar] [CrossRef] [Green Version]
  13. Grande, H.; Rezende, S.d.M.; Simon, T.E.; Félix-Hackradt, F.C.; García-Charton, J.A.; Maida, M.; Gaspar, A.L.B.; Francini-Filho, R.B.; Fredou, T.; Ferreira, B.P. Diversity of Settlement-stage Reef Fishes Captured by Light-trap in a Tropical South-west Atlantic Ocean Coastal Reef System. J. Fish Biol. 2018, 94, 210–222. [Google Scholar] [CrossRef] [Green Version]
  14. Pegg, G.G.; Sinclair, B.; Briskey, L.; Aspden, W.J. MtDNA Barcode Identification of Fish Larvae in the Southern Great Barrier Reef—Australia. Sci. Mar. 2006, 70, 7–12. [Google Scholar] [CrossRef]
  15. Trivedi, S.; Aloufi, A.A.; Ansari, A.A.; Ghosh, S.K. Role of DNA Barcoding in Marine Biodiversity Assessment and Conservation: An Update. Saudi J. Biol. Sci. 2016, 23, 161–171. [Google Scholar] [CrossRef] [Green Version]
  16. Ko, H.-L.; Wang, Y.-T.; Chiu, T.-S.; Lee, M.-A.; Leu, M.-Y.; Chang, K.-Z.; Chen, W.-Y.; Shao, K.-T. Evaluating the Accuracy of Morphological Identification of Larval Fishes by Applying DNA Barcoding. PLoS ONE 2013, 8, e53451. [Google Scholar] [CrossRef] [PubMed]
  17. Meredith, C.; Hoffman, J.; Trebitz, A.; Peterson, G.; Lietz, J.; Hatzenbuhler, C.; Pilgrim, E.; Okum, S.; Martinson, J. Development of DNA-Based Identification Methods to Track the Species Composition of Fish Larvae within Nearshore Areas of the Great Lakes; Minnesota Chapter of the American Fisheries Society: St. Cloud, MN, USA, 2017. [Google Scholar]
  18. Leis, J.M. Taxonomy and Systematics of Larval Indo-Pacific Fishes: A Review of Progress since 1981. Ichthyol. Res. 2015, 62, 9–28. [Google Scholar] [CrossRef] [Green Version]
  19. Bruggemann, J.H.; Rodier, M.; Guillaume, M.M.M.; Andréfouët, S.; Arfi, R.; Cinner, J.E.; Pichon, M.; Ramahatratra, F.; Rasoamanendrika, F.; Zinke, J.; et al. Wicked Social-Ecological Problems Forcing Unprecedented Change on the Latitudinal Margins of Coral Reefs: The Case of Southwest Madagascar. Ecol. Soc. 2012, 17, 47. [Google Scholar] [CrossRef]
  20. Ranaivomanana, L.N.J. Identification Des Conditions d’appropriation de La Gestion Durable Des Ressources Naturelles et Des Écosystèmes: Cas Du Grand Récif de Toliara. Ph.D. Thesis, Institut Halieutique et des Sciences Marines (IH.SM) de l’Université de Toliara, Toliara, Madagascar, 2006. [Google Scholar]
  21. Dufour, V. Colonisation Des Recifs Coralliens Par Les Larves de Poissons. Ph.D. Thesis, Université Pierre & Marie Curie, Paris, France, 1992. [Google Scholar]
  22. Marchetti, M.P.; Esteban, E.; Limm, M.; Kurth, R. Evaluating Aspects of Larval Light Trap Bias and Specificity in the Northern Sacramento River System: Do Size and Color Matter? Am. Fish. Soc. Symp. 2004, 39, 269–279. [Google Scholar]
  23. Lindquist, D.C.; Shaw, R.F. Effects of Current Speed and Turbidity on Stationary Light-Trap Catches of Larval and Juvenile FIshes. Fish. Bull. 2005, 103, 438–444. [Google Scholar]
  24. Wilson, D. Patterns of Replenishment of Coral-Reef Fishes in the Nearshore Waters of the San Blas Archipelago, Caribbean Panama. Mar. Biol. 2001, 139, 735–753. [Google Scholar] [CrossRef]
  25. Anderson, T.W.; Bartels, C.T.; Hixon, M.A.; Bartels, E.; Carr, M.H.; Shenker, J.M. Current Velocity and Catch Efficiency in Sampling Settlement-Stage Larvae of Coral-Reef Fishes. Fish. Bull. 2002, 100, 404–413. [Google Scholar]
  26. Laroche, J.; Ramananarivo, N. A Preliminary Survey of the Artisanal Fishery on Coral Reefs of the Tulear Region (Southwest Madagascar). Coral Reefs 1995, 14, 193–200. [Google Scholar] [CrossRef]
  27. Raharinaivo, L.R.; Jaonalison, H.; Mahafina, J.; Ponton, D. How to Efficiently Determine the Size at Maturity of Small-sized Tropical Fishes: A Case Study Based on 144 Species Identified via DNA Barcoding from Southwestern Madagascar. J. Appl. Ichthyol. 2020, 36, 402–413. [Google Scholar] [CrossRef]
  28. Bauchot, M.L.; Bianchi, G. Fiches FAO d’identification Des Especes Pour Les Besoins de La Peche. Guide Des Poissons Commerciaux de Madagascar (Especes Marines et d’eaux Saumatres), Avec Le Support Du Programme Des Nations Unies Pour Le Developpement (Projet RAF/79/065); FAO: Rome, Italy, 1984; 135p. [Google Scholar]
  29. Smith, M.M.; Heemstra, P.C. (Eds.) Smiths’ Sea Fishes; Springer: Berlin/Heidelberg, Germany, 1986; ISBN 978-3-642-82860-7. [Google Scholar]
  30. Collet, A.; Bosc, P.; Pothin, K.; Chabanet, P. Guide d’identification Des Post-Larves de Poissons Des Récifs Coralliens; ARDA et OCEA Consult’: La Réunion, France, 2013; 176p. [Google Scholar]
  31. Werner, F.; Fröndt, R. Automated Purification of Genomic DNA from Tissue with the Macherey-Nagel NucleoMag® Tissue Kit on the EpMotion® 5075. Appl. Note 2015, 365, 1–7. [Google Scholar]
  32. Ward, R.D.; Zemlak, T.S.; Innes, B.H.; Last, P.R.; Hebert, P.D.N. DNA Barcoding Australia’s Fish Species. Philos. Trans. R. Soc. Lond. B Biol. Sci. 2005, 360, 1847–1857. [Google Scholar] [CrossRef] [PubMed]
  33. Ratnasingham, S.; Hebert, P.D.N. A DNA-Based Registry for All Animal Species: The Barcode Index Number (BIN) System. PLoS ONE 2013, 8, e66213. [Google Scholar] [CrossRef] [PubMed] [Green Version]
  34. R Core Team. R: A Language and Environment for Statistical Computing; R Foundation for Statistical Computing: Vienna, Austria, 2018. [Google Scholar]
  35. Oksanen, J.; Blanchet, F.G.; Friendly, M.; Kindt, R.; Legendre, P.; McGlinn, D.; Minchin, P.R.; O’Hara, R.B.; Simpson, G.L.; Solymos, P.; et al. Vegan: Community Ecology Package. 2019. Available online: https://www.scirp.org/(S(351jmbntvnsjt1aadkposzje))/reference/ReferencesPapers.aspx?ReferenceID=1778707 (accessed on 12 October 2021).
  36. Poulin, R. Comparison of Three Estimators of Species Richness in Parasite Component Communities. J. Parasitol. 1998, 84, 485–490. [Google Scholar] [CrossRef] [PubMed]
  37. Meredith, M. Quick and Dirty Estimates for Wildlife Populations. 2019. Available online: http://www.r-project.org/ (accessed on 12 October 2021).
  38. Smith, E.P.; Van Belle, G. Nonparametric Estimation of Species Richness. Biometrics 1984, 40, 119–129. [Google Scholar] [CrossRef] [Green Version]
  39. Pinheiro, H.T.; Rocha, L.A.; Macieira, R.M.; Carvalho-Filho, A.; Anderson, A.B.; Bender, M.G.; Di Dario, F.; Ferreira, C.E.L.; Figueiredo-Filho, J.; Francini-Filho, R.; et al. South-Western Atlantic Reef Fishes: Zoogeographical Patterns and Ecological Drivers Reveal a Secondary Biodiversity Centre in the Atlantic Ocean. Divers. Distrib. 2018, 24, 951–965. [Google Scholar] [CrossRef] [Green Version]
  40. Steinke, D.; Connell, A.D.; Hebert, P.D.N. Linking Adults and Immatures of South African Marine Fishes. Genome 2016, 59, 959–967. [Google Scholar] [CrossRef] [Green Version]
  41. Reid, K.; Crochelet, E.; Bloomer, P.; Hoareau, T.B. Investigating the Origin of Vagrant Dusky Groupers, Epinephelus Marginatus (Lowe, 1834), in Coastal Waters of Réunion Island. Mol. Phylogenet. Evol. 2016, 103, 98–103. [Google Scholar] [CrossRef] [Green Version]
  42. Weigt, L.A.; Baldwin, C.C.; Driskell, A.; Smith, D.G.; Ormos, A.; Reyier, E.A. Using DNA Barcoding to Assess Caribbean Reef Fish Biodiversity: Expanding Taxonomic and Geographic Coverage. PLoS ONE 2012, 7, e41059. [Google Scholar] [CrossRef] [Green Version]
  43. Healey, A.J.E.; McKeown, N.J.; Taylor, A.L.; Provan, J.; Sauer, W.; Gouws, G.; Shaw, P.W. Cryptic Species and Parallel Genetic Structuring in Lethrinid Fish: Implications for Conservation and Management in the Southwest Indian Ocean. Ecol. Evol. 2018, 8, 2182–2195. [Google Scholar] [CrossRef] [Green Version]
  44. Ponton, D.; Carassou, L.; Raillard, S.; Borsa, P. Geometric Morphometrics as a Tool for Identifying Emperor Fish (Lethrinidae) Larvae and Juveniles. J. Fish Biol. 2013, 83, 14–27. [Google Scholar] [CrossRef]
  45. Wibowo, A.; Wahlberg, N.; Vasemägi, A. DNA Barcoding of Fish Larvae Reveals Uncharacterised Biodiversity in Tropical Peat Swamps of New Guinea, Indonesia. Mar. Freshw. Res. 2017, 68, 1079. [Google Scholar] [CrossRef]
  46. Durand, J.-D.; Pham, M.H.; Tran, T.T.V.; Hoang, D.H.; Van Vo, Q. Sorting the Wheat from the Chaff: A Review of BINs Associated with Groupers of Vietnam and the Implications for Species Identification from DNA Barcoding. Mar. Biodivers. 2020, 50, 38. [Google Scholar] [CrossRef]
  47. Collins, R.A.; Cruickshank, R.H. The Seven Deadly Sins of DNA Barcoding. Mol. Ecol. Resour. 2013, 13, 969–975. [Google Scholar] [CrossRef]
  48. Semmens, B.; Buhle, E.; Salomon, A.; Pattengill-Semmens, C. A Hotspot of Non-Native Marine Fishes: Evidence for the Aquarium Trade as an Invasion Pathway. Mar. Ecol. Prog. Ser. 2004, 266, 239–244. [Google Scholar] [CrossRef] [Green Version]
  49. Blaxter, M. Imagining Sisyphus Happy: DNA Barcoding and the Unnamed Majority. Philos. Trans. R. Soc. Lond. B Biol. Sci. 2016, 371, 20150329. [Google Scholar] [CrossRef] [Green Version]
Figure 1. Locations of the sampling sites for post-larvae (red circles) and juvenile fish (dotted circle). With ANA = Anakao reef, and GRT = Great Barrier Reef of Toliara.
Diversity 14 00377 g001
Figure 2. Species accumulation curves for post-larval (a) and juvenile fishes (b). One sample corresponds to the catch of each light trap per night (a) or each mosquito seine net per day (b). With black bars: interval of confidence and Red line: accumulation curve.
Diversity 14 00377 g002
Figure 3. Identification levels. The numbers in brackets correspond to the number of species for each category.
Diversity 14 00377 g003
Table 1. Ambiguously identified species with clearly separated origins of the specimens of each BIN, with IO: Indian Ocean, PO: Pacific Ocean, and AO: Atlantic Ocean.
Species Name in BOLDCurrent WorkOther Projects in BOLD Database
BINsDistribution in BOLDOther BINsDistribution in BOLD
Amblygobius phalaenaBOLD: AAB8727West IO & POBOLD: AAB8728Center PO
Antennarius striatusBOLD: AAO6018East AO & IO, South POBOLD: AAF2509West AO, North PO
Apogon semiornatusBOLD: AAD2206West IOBOLD: AAD2207West PO
Asterropteryx semipunctataBOLD: AAC0108West IOBOLD: AAC0105/BOLD: AAC0106/
BOLD: AAC0107/BOLD: AAC0109
South & North PO, North AO
Cheilinus chlorourusBOLD: AAB4186West IOBOLD: AAB4185/BOLD: ACE8465PO
Corythoichthys flavofasciatusBOLD: AAI8860West IOBOLD: AAE9785/BOLD: ACR0421North PO
Dendrochirus brachypterusBOLD: AAC9564West IOBOLD: AAC9563East IO, West PO
Diagramma pictumBOLD: AAD4477West IOBOLD: AAB9940North & East IO, West PO
Epinephelus rivulatusBOLD: ACZ9919West IOBOLD: AAF0433East IO, West PO
Fowleria variegataBOLD: AAD8726West IOBOLD: AAD8727/BOLD: ACC5212West PO
Gazza minutaBOLD: AAB7096West IOBOLD: AAA9823North IO & Northwest PO
Gerres longirostrisBOLD: AAE6359West IOBOLD: AAE6360Souther PO
Halichoeres nebulosusBOLD: AAC7896West IOBOLD: AAC7897/BOLD: AAD5811East IO, North PO
Halichoeres zeylonicusBOLD: AAF7654West IOBOLD: AAF7655North & East IO
Hippichthys spiciferBOLD: AAE5342West IOBOLD: ADA9516North PO
Hippocampus histrixBOLD: AAE5356Southwest & North IOBOLD: AAE5355North PO
Lethrinus harakBOLD: AAC1521West IOBOLD: AAC1520East IO, West PO
Lethrinus lentjanBOLD: AAB0511West IOBOLD: AAB0508West PO
Lethrinus miniatusBOLD: AAC8078southwest & north IOBOLD: AAC8077East IO
Lethrinus nebulosusBOLD: ABY6363West IOBOLD: ACE7416/BOLD: AAE3737/
BOLD: AAB2308
Northeast IO, West PO
Lutjanus lutjanusBOLD: AAA8168West, North & east IOBOLD:AAA8169North PO
Nectamia fuscaBOLD: AAL9262West IOBOLD: AAF8240/BOLD: ABZ1276West PO
Nectamia savayensisBOLD: AAD9453West IOBOLD:AAD6832/BOLD: AAD9454/
BOLD: AAF1913/BOLD: ABY4865
North & East IO, West PO
Neoniphon sammaraBOLD: AAC8278West IOBOLD: AAC6632East IO, West PO
Ostorhinchus aureusBOLD: ACE9301West IOBOLD: AAD5599East IO, West PO
Ostorhinchus cookiiBOLD: AAC2084West & North IOBOLD: AAC2085/BOLD: AAC2086
BOLD: AAC2086
West PO
Ostorhinchus taeniophorusaBOLD: AAD8453 BOLD: AAD8454West & North IOBOLD: ACP7798West & Center PO
Oxycheilinus bimaculatusBOLD: AAC3195West IOBOLD: AAC7530/BOLD: AAC7531East IO, West PO
Petroscirtes mitratusBOLD: AAE6131West IOBOLD: AAE3283/BOLD: ADK6555North IO, West PO
Plectroglyphidodon lacrymatusBOLD: AAB6988West IOBOLD: AAB6989West PO
Plesiops coeruleolineatusBOLD: AAE4785West IOBOLD: AAE4786/BOLD: AAE4787South PO
Pomacentrus caeruleusBOLD: AAB9539West & East IOBOLD: ADW3804/BOLD: ADW3805North IO
Pristiapogon fraenatusBOLD: AAJ1264West IOBOLD: AAD6833/BOLD: ADC1718East IO, West PO
Pristiapogon kallopterusBOLD: AAB4082West IO & POBOLD: ABZ7996Center PO
Pseudalutarius nasicornisBOLD: AAI4531West IOBOLD: AAE8257South PO
Sargocentron diademaBOLD: AAB3424West, North & East IOBOLD: AAB3425PO
Scarus ghobbanBOLD: ABY4451West IOBOLD: AAB3544/BOLD: AAB3545East IO, West & East PO
Sphyraena flavicaudaBOLD: AAF8900West IOBOLD: AAG2679East IO
Stolephorus indicusBOLD: AAG4825West IOBOLD: AAB7978/BOLD: AAB7978North IO & North PO
Synanceia verrucosaBOLD: AAE2821West IO, south & center POBOLD: AAE2820North PO
Tylosurus crocodilusBOLD: AAC4148IO, North & center POBOLD:AAB9821/BOLD: ABY6772West AO, East PO
Valenciennea puellarisBOLD: AAC4124West & North IOBOLD: AAC4125West PO
Vanderhorstia ornatissimaBOLD: AAF0288West & North IOBOLD: ACC5236Southern PO
a Species complex.
Table 2. Ambiguously identified species without separated origins of the specimens of each BIN, with IO: Indian Ocean, PO: Pacific Ocean, and AO: Atlantic Ocean.
Species Name in BOLD DatabaseCurrent WorkOther Projects in BOLD Database
BINsDistribution in BOLDBINsDistribution in BOLD
Species Assigned to More Than Two BINs
Trachinocephalus myopsaBOLD: AAA9578
BOLD: ABX6347
IO, POBOLD: AAA9580/BOLD: AAA9581
BOLD: AAA9582/BOLD: ACF3856
BOLD: ACF3856
AO, IO, North PO
Selar crumenophthalmusBOLD: AAB0871West IO, West POBOLD: AAB0870West AO, West IO, West PO
Parupeneus heptacanthusBOLD: AAB2590West & East IOBOLD: AAB2589/BOLD: AAI4268East IO, West PO
Caesio caerulaureaBOLD: AAB4822West IOBOLD: AAB4823/BOLD: ABZ2197West IO, East IO, West PO
Synodus variegatusBOLD: AAB5069West & East IO, West POBOLD: AAB5072East IO
Dactyloptena orientalisBOLD: AAB5966West & East IO, West POBOLD: AAB5965East IO, West PO
Parupeneus barberinusaBOLD: AAB5978
BOLD: AAB5980
IO, West POBOLD: AAB5979IO, West PO
Gerres filamentosusBOLD: AAC0377West & North IOBOLD: AAC0379/BOLD: AAC0380/
BOLD: AAC0382/BOLD: AAC0383/
BOLD: AAL5737/BOLD: AAY1477/
BOLD: ADC2070
North & East IO, West PO
Hemiramphus farBOLD: AAC0565West IOBOLD: AAC0563/BOLD: AAX1441West, North & East IO, West PO
Gerres oyenaBOLD: AAC1291West IOBOLD: AAC1288/BOLD: AAC1289/
BOLD: AAC1290/BOLD: AAC1290
West, North & East IO, West PO
Sebastapistes strongiaBOLD: AAC4542 BOLD: AAC4543South West IO, West POBOLD: AAC4545/BOLD: ACD1673West PO
Lagocephalus sceleratusBOLD: AAC5565IO, Mediterranean Sea, West POBOLD: AAC5566/BOLD: AAC5567East IO, West PO
Epinephelus flavocaeruleusBOLD: AAD1767West & East IO, West POBOLD: ACE3678/BOLD: ACE8264West IO
Carangoides coeruleopinnatusBOLD: AAD2297West & East IO, West POBOLD: AAB3475
BOLD: AAD2298
West & East IO, West PO
Stethojulis albovittataBOLD: AAD4824West IOBOLD: ACF2947West IO
Lactoria fornasiniBOLD: AAF2668West IO, West POBOLD: AAF2667West IO
Zebrasoma desjardiniiBOLD: AAF6311West IOBOLD: ACV8450West IO
Apogon coccineusBOLD: AAU1535West IOBOLD: AAJ8751West IO
Chromis opercularisBOLD: ACF0042West IOBOLD: AAJ0279West IO
Upeneus vittatusBOLD: ACV4665West & East IOBOLD: ABZ7416West & East IO
Terapon jarbuaBOLD: ACV8977West IOBOLD: AAA9351/BOLD: AAA9352/
BOLD: AAA9354/BOLD: ADR6412
West, North & East IO, West PO
Species Assigned to a BIN
Myripristis hexagona & Myripristis murdjanBOLD: AAA9764West IO, PO West IO, PO
Pempheris adusta & Pempheris nesogallicaBOLD: AAD1777IO, Mediterranean Sea IO, Mediterranean Sea
Apogon erythrinus & Ostorhinchus aureusBOLD: AAD5600West & East IO, North PO North PO
a Species complex.
Publisher’s Note: MDPI stays neutral with regard to jurisdictional claims in published maps and institutional affiliations.

