
Linking and Sharing Technology: Partnerships for Data Innovations for Management of Agricultural Big Data


1
USDA-ARS, Crop Production Systems Research Unit, Stoneville, MS 38776, USA
2
USDA-ARS, Poultry Production and Product Safety Research Unit, Fayetteville, AR 72704, USA
3
USDA-ARS, Dale Bumpers Small Farms Research Center, Booneville, AR 72927, USA
*
Author to whom correspondence should be addressed.
Data 2022, 7(2), 12; https://doi.org/10.3390/data7020012
Submission received: 16 December 2021
/
Revised: 12 January 2022
/
Accepted: 18 January 2022
/
Published: 20 January 2022
(This article belongs to the Section Information Systems and Data Management)
Abstract
:Combining data into a centralized, searchable, and linked platform will provide a data exploration platform to agricultural stakeholders and researchers for better agricultural decision making, thus fully utilizing existing data and preventing redundant research. Such a data repository requires readiness to share data, knowledge, and skillsets and working with Big Data infrastructures. With the adoption of new technologies and increased data collection, agricultural workforces need to update their knowledge, skills, and abilities. The partnerships for data innovation (PDI) effort integrates agricultural data by efficiently capturing them from field, lab, and greenhouse studies using a variety of sensors, tools, and apps and provides a quick visualization and summary of statistics for real-time decision making. This paper aims to evaluate and provide examples of case studies currently using PDI and use its long-term continental US database (18 locations and 24 years) to test the cover crop and grazing effects on soil organic carbon (SOC) storage. The results show that legume and rye (Secale cereale L.) cover crops increased SOC storage by 36% and 50%, respectively, compared with oat (Avena sativa L.) and rye mixtures and low and high grazing intensities improving the upper SOC by 69–72% compared with a medium grazing intensity. This was likely due to legumes providing a more favorable substrate for SOC formation and high grazing intensity systems having continuous manure deposition. Overall, PDI can be used to democratize data regionally and nationally and therefore can address large-scale research questions aimed at addressing agricultural grand challenges.
1. Introduction
Research now produces larger volumes of data, owing to progress in “omics”, precision agriculture, and on-farm sensor advancements, which has resulted in a concurrent need for an advanced capacity to collect, process, and store these data. This has also resulted in more complex and integrated analyses, including multi-location, multi-discipline collaborations [1]. “Big Data”, while not formally quantified, is generally described by the “volume, velocity, and variety of data collected being big and complex enough to make them difficult to process, manage, and handle using conventional analytical tools and techniques” [1,2]. Creating a database and storage system for integrating and housing diverse data sources in real time, along with well-defined metadata information (data quality), is an important step for fully utilizing Big Data for agricultural decision support tools [3,4,5,6,7]. Such a tool has been the focus of the Agricultural Collaborative Research Outcome System (AgCROS), which is an ongoing effort by the United States Department of Agriculture (USDA) Agricultural Research Service (ARS) for a federated data repository that links diverse and disparate databases that are currently available [1]. Such a database is important for understanding key yield gap factors and will be crucial to meeting global food demands [8]. In the subsequent sections, the authors will elaborate on an innovative framework for linking and sharing diverse agricultural Big Data, as well as describe applications and technological advancements for standardizing, integrating, and automating agricultural systems research. Therefore, the objectives of this manuscript are to (1) introduce agricultural researchers to the USDA PDI, which aims to provide a solution to how agricultural data are organized, accessed, and standardized for high-performance computing through highlighting three spatially focused case studies and (2) illustrate how PDI can be used to collect, process, and analyze long-term, multi-year, and complex Big Data in a systematic, quantitative review of cover crop and grazing effects on soil carbon storage.
Core Ideas
- Data silos affect inferences and decision making;
- Standardized Big Data platforms, analytics, and accessibility is demonstrated;
- Cover crop and grazing effects on soil carbon were evaluated;
- Across 18 sites, legume and rye cover crops and low or high grazing intensities had the greatest soil carbon storage;
- PDI may prevent research redundancies and address grand challenges facing agriculture.
1.1. Introducing PDI and Its Framework
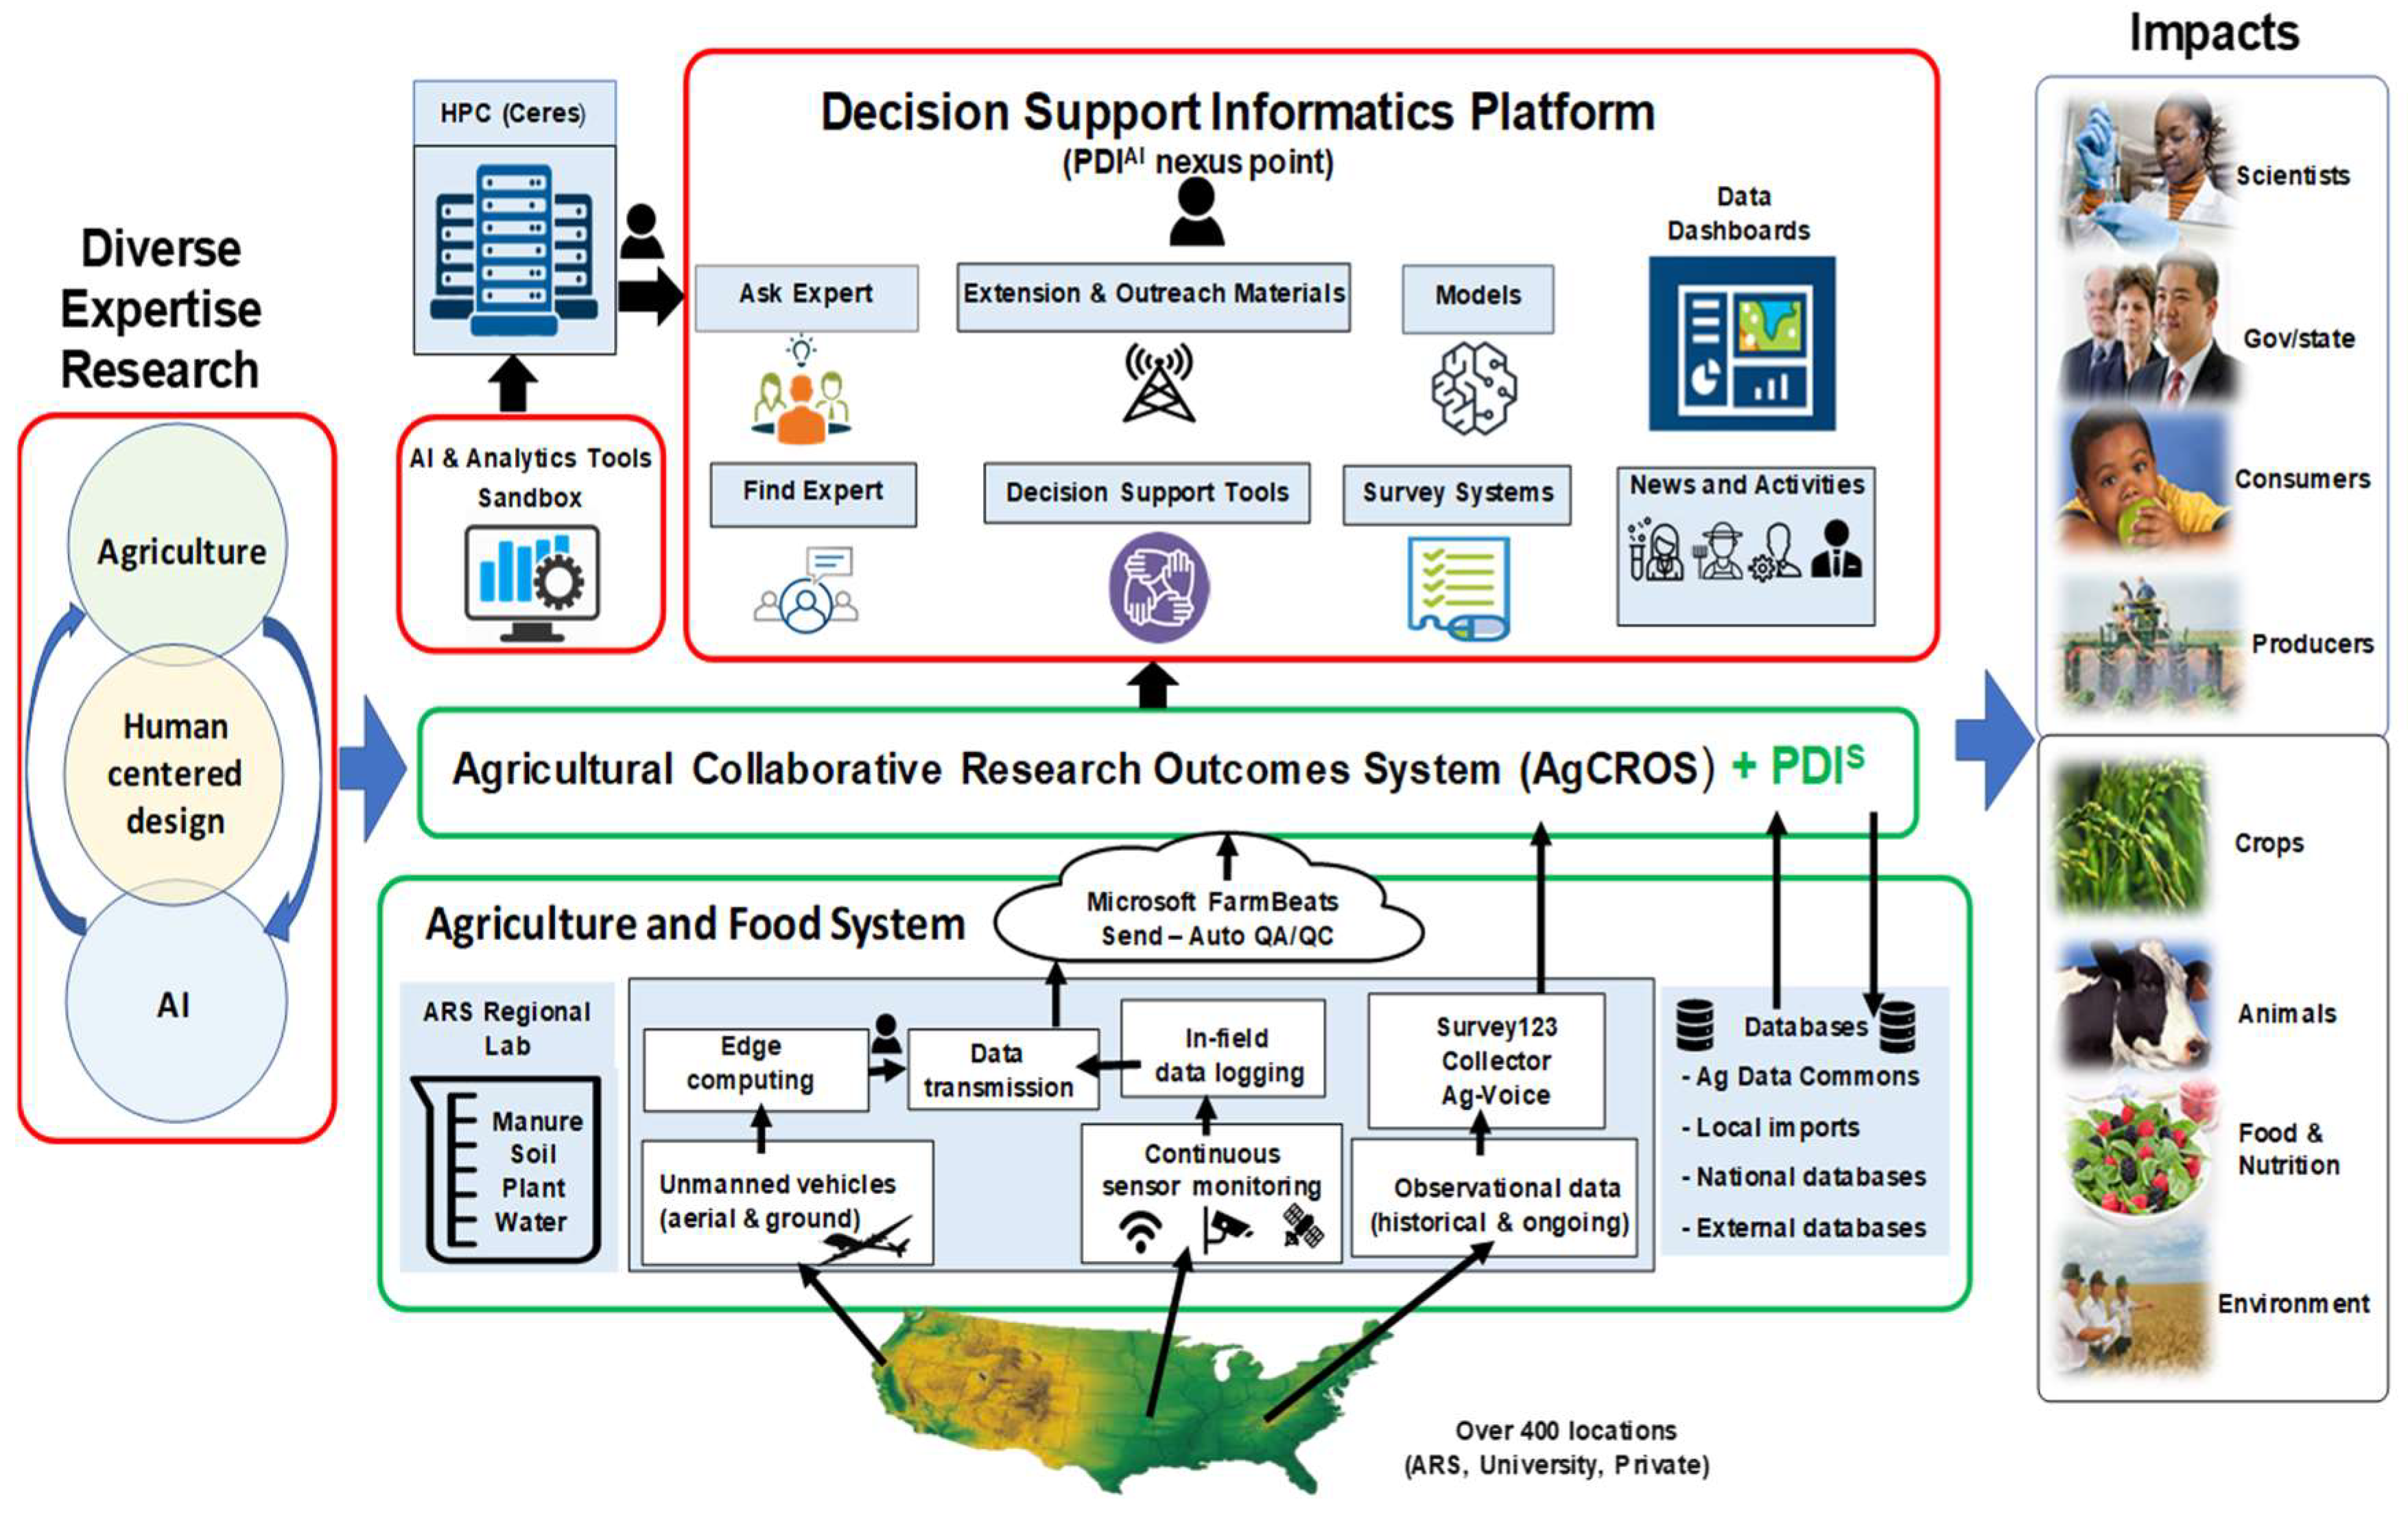
PDI is a USDA-ARS data management effort that leverages the power of strategic public and private partnerships (Figure 1). Innovation (improving the way to collect, exercise quality assurance and quality control for, process, analyze, store, and distribute data), standardization (ensuring data are of the highest quality for maximum usefulness and impact), automation (decreasing the number of times handling samples or interacting with data), and integration (expanding the power of data and opportunities for scientific collaboration) are the goals set by PDI to solve the current grand challenges facing agriculture (Figure 2). Through this public and private partnership, PDI aims to create customized solutions to reduce the time researchers spend on data management so that they can spend more time on their science to accelerate agricultural research.
As a USDA grand challenge vision of connecting research from the lab to the field, PDI is developing a suite of tools for data accessibility, analytics, and visualization. In the core of the structural organization of the PDI is the AgCROS, which serves as a one-stop shop to upload, download, and explore agricultural research data (Figure 1). The AgCROS is a structured query language (SQL) database housed on a Microsoft Azure cloud platform and directly interfaces with Esri’s ArcGIS Enterprise for the viewing and retrieval of data via a user-friendly dashboard. The AgCROS connects with several local and national databases, including USDA Ag Data commons. Research data collected through USDA-ARS regional labs are also standardized and integrated in a format that can be housed within the AgCROS. Data collection from field, lab, and greenhouse experiments for upcoming years will be streamlined and directly fed into the AgCROS. A data entry template (DET) that standardizes a “data dictionary” for each agricultural industry can be developed to capture and process research data. Traditionally, much of the data collected by agriculture researchers were pen and paper-based, a practice vulnerable to errors during data collection and entry. By developing electronic data capturing systems with a standardized DET, data errors are expected to be minimized, while the speed and efficiency are expected to increase. Through a partnership with Microsoft’s “FarmBeats”, the future of data collection can also be automated and streamlined using on-farm sensor networks.
1.2. Decision Support Informatics Platform
In the past and current research environment, much of the agricultural research data and analysis output collected across large geographic areas and over multiple years has been located within desktops and file cabinets. Consolidation and aggregation of such data and visualization in real time can aid research focused on complex climate–soil–plant interactions by extrapolation of past research results for improved sustainable production, mitigation of climate stress, and natural resource management [9,10]. The AgCROS is connected with dashboards (Figure 1) to help users quickly interrogate and visualize data to find answers to their questions. Features such as “Find Expert” and “Ask Expert” allow users to gather expert opinions on a research question. A list of researcher and industry experts on the topic area is prepared and entered in the database to direct the question toward an appropriate expertise. Experts on the topic area can be searched by name, expertise, and institution for the specific question a user may have. Currently, researchers at the USDA-ARS, research collaborators, stakeholders, customers, and USDA administration can use the database through the dashboard to speed up their decision-making process. With the tools that are linked and updated within the research data environment, PDI allows new ways for scientists to interact with their data in a living, working data environment. It is a “network of networks” where researchers can interact virtually across locations and disciplines, thus increasing the impact for scientists, collaborators, customers, and stakeholders [11]. In the next section, case studies currently using PDI will be evaluated. The value of PDI will be demonstrated through a systematic analysis of long-term cover crop and grazing effects on soil carbon storage throughout the continental US.
1.3. Big Data Parternships and How It Is Improving Connectivity
Miscrosoft’s “FarmBeats” is a cloud-based platform with geographical information system (GIS) software and is an end-to-end Internet of Things (IoT) system that enables seamless data collection for agriculture [12]. FarmBeats solves rural farming community Internet connectivity issues by using TV’ white space. Data collected within the farm using sensors, drones, satellites, and tractors are directed to cloud-based artificial intelligence models to obtain detailed farm and crop conditions in real time. The USDA-ARS is evaluating FarmBeats as pilot project on cover crop studies. A network of sensors placed on experimental sites collects data such as the soil temperature, soil moisture, soil pH, air temperature, precipitation, and wind speed, as well as sensors mounted on tractors and drones that collect crop height, biomass, greenness, and plant health data. Collected data are fed to cloud-based FarmBeats. Combining sensor data with imagery from drones and satellites help to create a derived, fused dataset to cover the entire farm.
The Federal Communication Commission (FCC), along with the data and mapping working group, identified a gap in agricultural locations for possible broadband access. As an effort to expand broadband capacity in rural America, PDI, in collaboration with ESRI using ArcGIS, developed a dashboard to visualize current internet speeds overlaid with the USDA National Agricultural Statistics Service (NASS) crop data layer. This dashboard allows for visualization of internet connectivity speeds and the total acreage for each crop to identify locations with the needs of expanding broadband capacity.
1.4. Utilization of TV White Space
Television white space is the unused frequency block between active TV channels in the very high and ultrahigh frequency spectrum bands [13]. This unused TV white space spectrum became accessible after the FCC allowed unlicensed radio transmitters to operate in white spaces. White space helps provide connectivity in rural areas by utilizing a frequency that is able to penetrate larger obstacles such as trees, mountainous terrain, and buildings and can provide signals to farm equipment over 10 km. The FCC set minimum data transmission speeds of 25 megabits per second (Mbps) for download and 3 Mbps for upload for broadband services. By using TV white space, broadband communication in rural areas is expanding its precision for agricultural use and optimizing inputs in real time. Furthermore, as agriculture equipment becomes more sophisticated, challenges surrounding the “right to repair” have elevated to the state level. There are 17 states that are considering legislation to grant farmers the “right to repair” their equipment, which include Hawaii, Illinois, Iowa, Kansas, Mississippi, Minnesota, Missouri, North Carolina, Nebraska, New Hampshire, New Jersey, New York, Oklahoma, Tennessee, Virginia, Vermont, and Washington.
1.5. Case Studies
With GIS integration and utilization being the integrator, the following are three case studies that use AgCROS to advance how information is stored and delivered to end users. The case studies are focused on different questions that utilize spatial and temporal datasets to integrate and visualize data relationships. Overall, these case studies standardize data collection and are readily available to the research community and illustrate how PDI can be used to capture, store, and use Big Data and ultimately result in more efficient and sustainable agricultural systems.
1.5.1. Case Study 1: Data Automation for the Cattle Tick Fever Eradication Program
The ticks Rhipicephalus (Boophilus) annulatus and R. (B.) microplus are obligate parasites and affect animal productivity directly, as well as serving as vectors for the cattle fever caused by protozoal parasites Babesia bigemina and Babesia bovis [14]. Cattle fever was eradicated in the US in 1943 by eliminating these vectors. However, these vectors still exist in Mexico and recolonize north of the Rio Grande [15]. A permanent quarantine zone along the border serves as a buffer area for monitoring and eradication. However, these eradication practices are constantly challenged by the alternate host such as nilgai (Boselaphus tragocamelus) and white-tailed deer (Odocoileus virginianus). The cattle tick eradication program GIS initiative started in early 2000s. The USDA Animal and Plant Health Inspection Service (APHIS) veterinary services and USDA-ARS Knipling-Bushland US livestock insects research laboratory in Kerrville, Texas partnered to spatially understand better the extent of cattle fever tick outbreaks. A web mapping application was developed for this purpose to reduce traditional manual data collection error, as well as speed up data collection. “Survey123” application automates field data collection and data upload to the cloud. The app generates field polygon boundaries as the survey crew walks around the fence line and logs the tick fever disease events. The cattle monitoring data are linked with radio frequency identification ear tags, and each sample is QR coded. The app is instantly updated on the dashboard. This automation effort is estimated to reduce labor costs by 40%.
1.5.2. Case Study 2: Battling Citrus Greening in Florida Citrus Groves
The Citrus Research and Field Trials (CRAFT) Foundation brings together experts from the Florida citrus industry and Florida citrus growers to minimize the effect of citrus greening disease, also known as “Huanglongbing” or “HLB” [16]. This disease affects nearly all commercial citrus species and cultivars [17]. The symptoms change the chemical characteristics and sensory attributes of the fruit and can be detected anywhere on the plant from roots to leaves [18,19]. Currently, HLB is found in all citrus growing counties in Florida and in California, Georgia, Louisiana, South Carolina, and Texas [20,21]. A 72.2% reduction (7.98–2.22 billion tons) of oranges for processing during 2007–2018 in the US was due to citrus greening [17].
Management practices and techniques that reduce HLB infestation require intensive field trials and testing. PDI and CRAFT partnered to streamline the field research and delivery of recommended control practices. An online public application system was created in ArcGIS Survey123 with a complete form-centric solution for creating, sharing, and analyzing data. Survey123 can be used to collect data via web or mobile devices, even when disconnected from the Internet. Citrus growers submit their current and planned management activities using Survey123 forms, which are reviewed by the technical working group. A dashboard interface connected with Survey123 forms helps researchers visualize and interpret the submitted data, along with the application to participate in the research effort. Once applications are approved, the experimental design is determined, and trees are planted. Growers enter their management data specific to each experimental plot, which include planting dates, fertilizer applications, irrigation schedules and amounts, pesticide applications, soil amendments, biostimulants, Asian Psyllid control methods, soil and water quality reports, harvest yields, and cost analyses.
Unmanned aerial vehicle imagery of the experimental sites are collected by research partners during the project period and provide time series of normalized difference red edge index (NDRE) and normalized difference vegetation index (NDVI) data:
where NIR, RedEdge and Red are near infrared, red edge, and red band of the reflectance data, respectively.
NDRE = (NIR − RedEdge)/(NIR + RedEdge)
NDVI = (NIR − Red)/(NIR + Red)
These two indices (NDRE and NDVI) are used to assess plant health remotely. Each individual tree is marked by GPS to link the time series of plant health as well as plant nutritional and diagnostic test results collected by the Florida Department of Agriculture Consumer Services. Growth metrics such as the canopy area and volume are also tracked throughout the entire length of the project. All the measurements, lab results, and plant health imagery are linked spatially to the original grove and available to growers and researchers. PDI and CRAFT have worked toward an integrated, streamlined data collection and management solution to provide Florida citrus growers and researchers extensive information on best management practices (BMPs) to guide future citrus production. Future research will be able to access all the data and continue the challenge of finding BMPs to best serve the citrus industry.
1.5.3. Case Study 3: Smart States Focus on Precision Agriculture Technologies and High-Speed Broadband for Rural Areas
Agricultural research has shown that reducing waste, increasing productivity, and ensuring sustainability while doubling agricultural products by 2050 will be required to feed the growing population. Precision agriculture is a data-driven farming technique that reduces unnecessary inputs and increases productivity by allowing variable rate applications in response to crop needs through GPS location, sensor networks, and drones [22]. In addition to saving input costs, this technology is being considered to boost crop yield by 3–18% through targeted fertilizing, planting, spraying, and irrigation. However, the challenge to implementing data-driven agriculture in rural America is the lack of high-speed Internet connectivity. According to a USDA report, 29% of US farms have no access to the Internet [23]. PDI is integrating multiple data sources to expand broadband connectivity to rural farms to increase precision agricultural tool usage.
2. Methods
Data Aggregation and Accessibility via AgCROS
Currently, data can be explored by identifying research projects or networks involved or by choosing the specific topics or locations in AgCROS, as this provides map-based data query, visualization, and download services. In efforts to illustrate AgCROS functionality, we explored how management such as cover crops or grazing intensity affects total soil organic carbon (SOC) storage based on data housed within AgCROS.
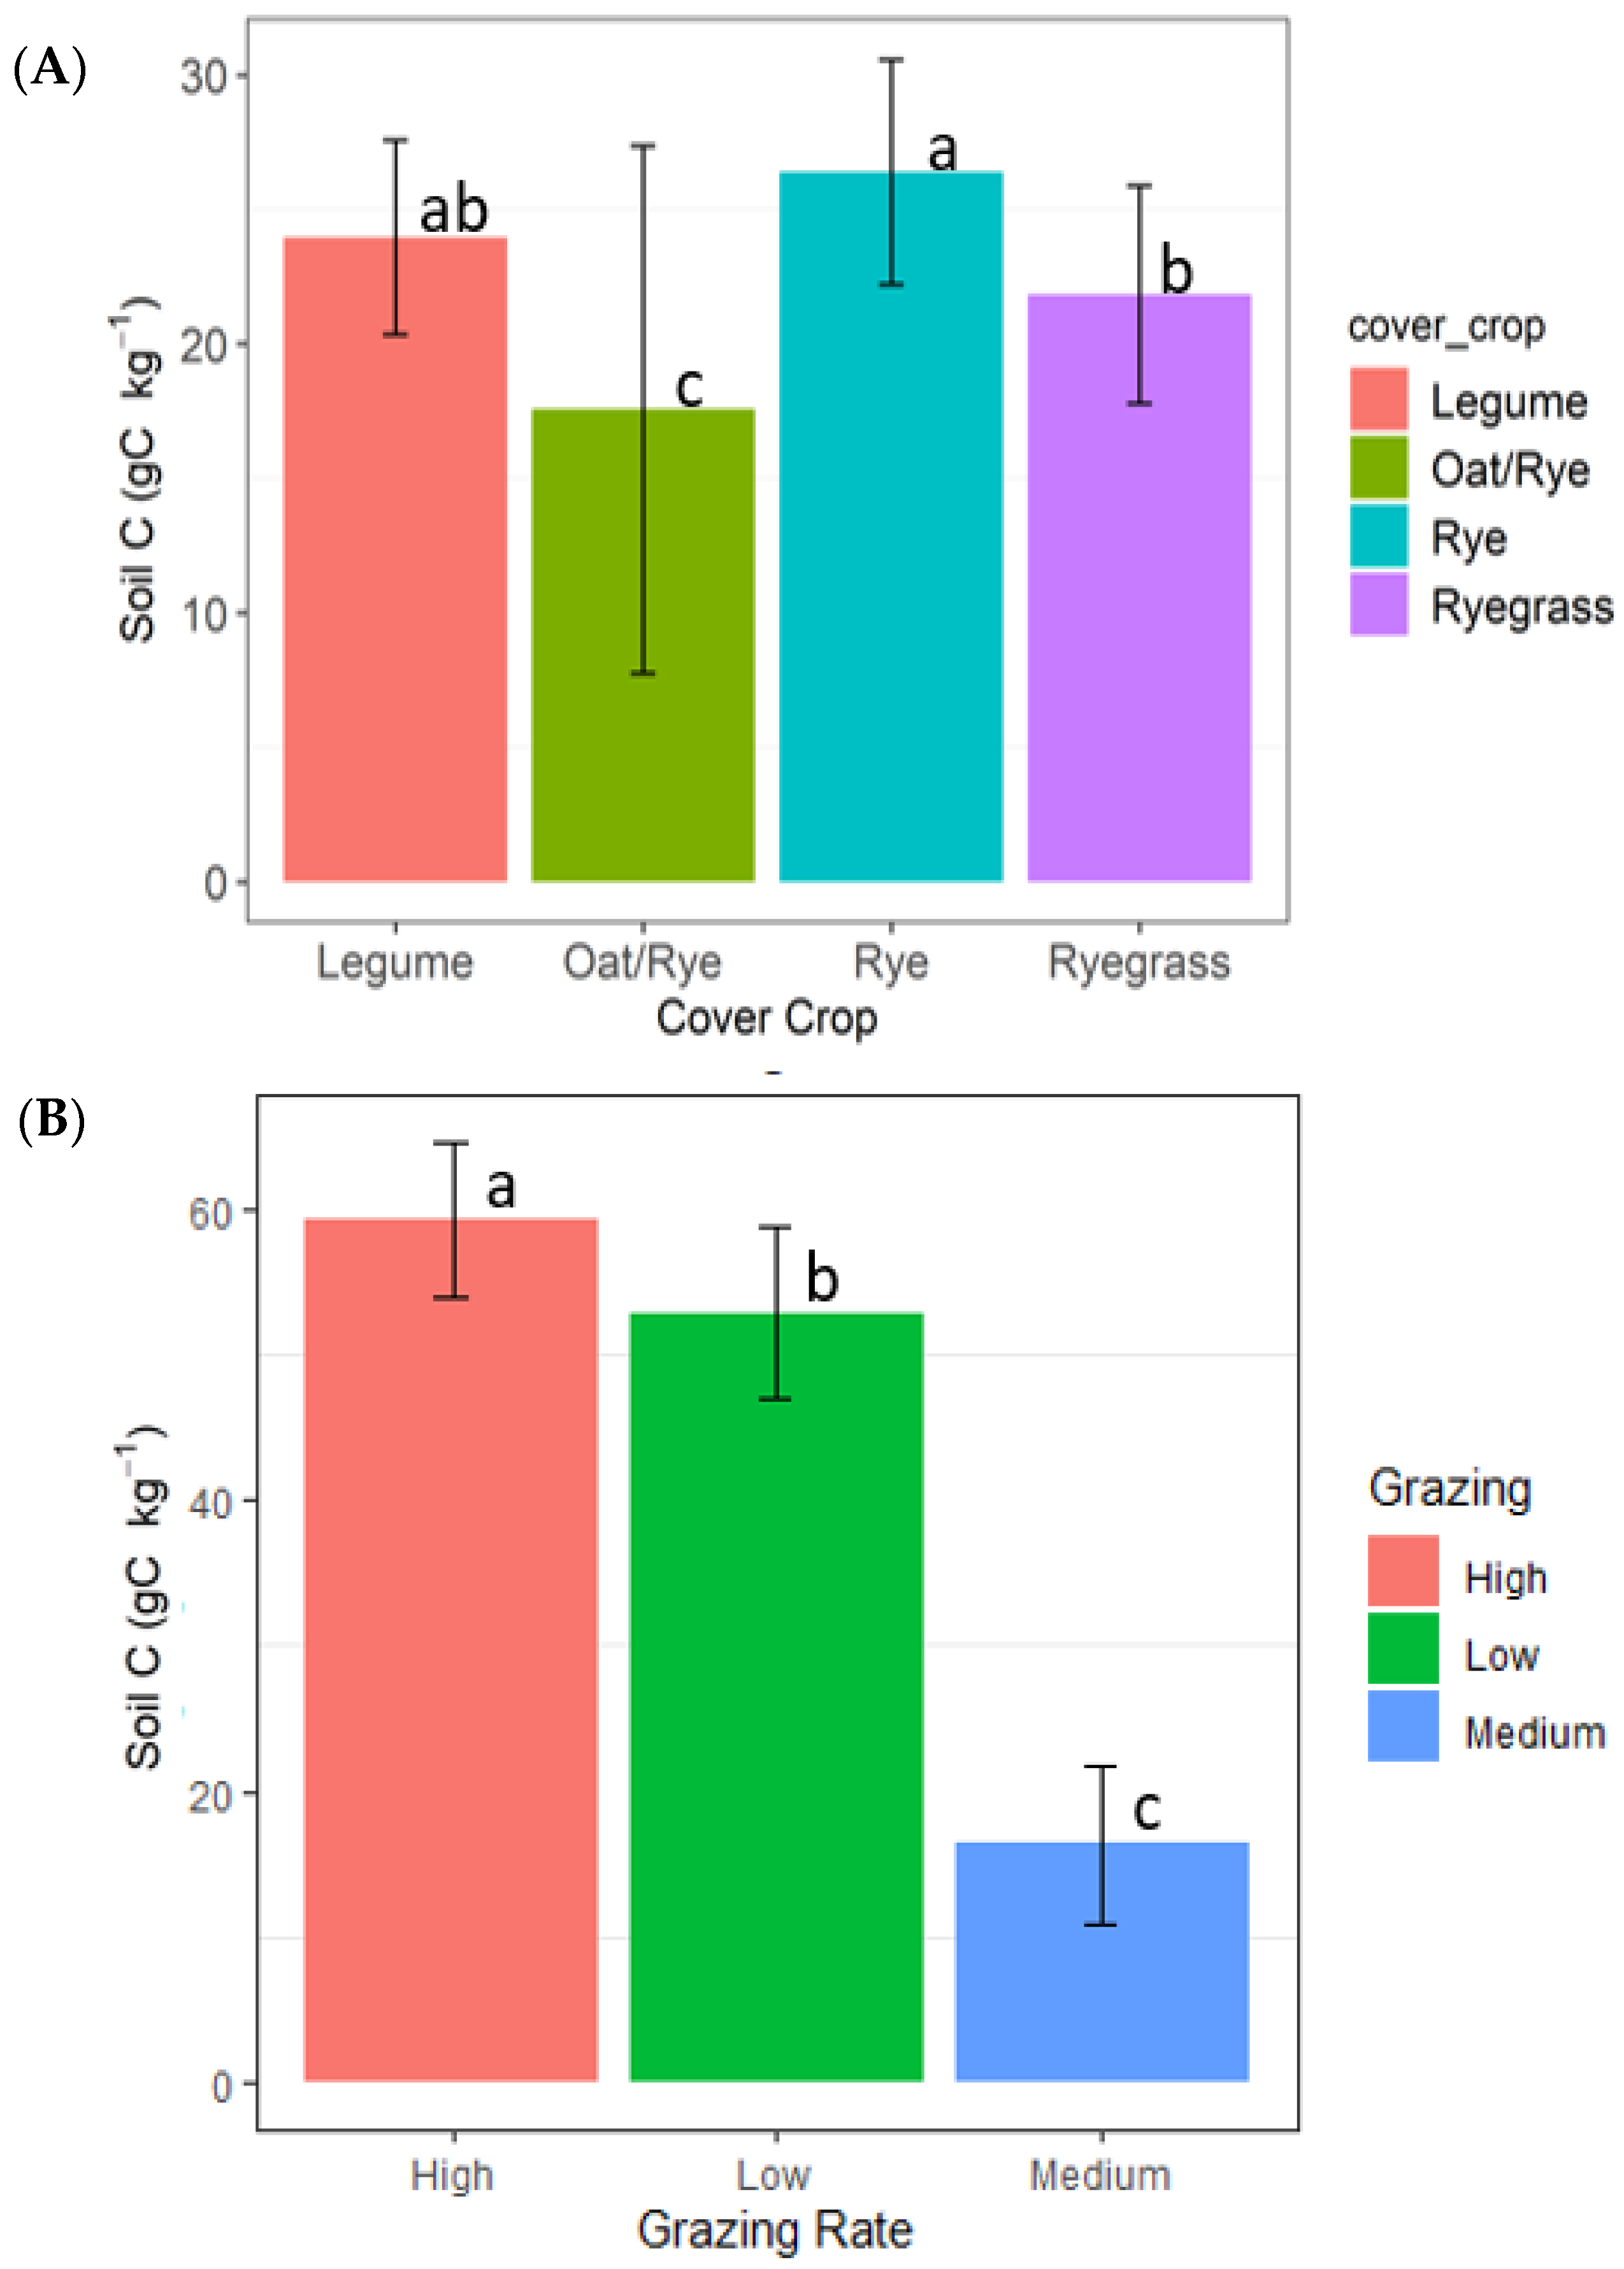
Datasets from AgCROS were downloaded in bulk using the tab “Download All (joined)”. Downloaded data contained USDA-ARS research data from several experimental locations (58 total) and years (1983–2017) combined into one excel file (n = 58). The metadata included management information and measured variables, which were organized into 33 tabs with a common identifier in the form of an experiment unit ID and treatment ID. A subset of data from a consistent depth (0–6 cm) that contained cover crop (legumes (combined), oat (Avena sativa L.) or rye (Secale cereale L.), and ryegrass (Lolium perenne L.)) and grazing intensity treatments (high, medium, and low) were analyzed (Figure 3) in R software [24]. Grazing intensity studies extracted from PDI consisted of (1) low grazing pressure (put-and-take system to maintain a target of roughly 300 g m−2 of available forage), (2) medium grazing pressure (put-and-take to maintain a target of roughly 225 g m−2 of available forage), and (3) high grazing pressure (target of 150 g m−2 of available forage). A subset of PDI-derived data was utilized in the final analyses based on a consistent sampling depth and fixed effect treatments (cover crop species and grazing regimes), totaling 18 experimental sites and 24 experimental years (1998–2012). A Pearson correlation coefficient between the SOC and other soil variables (Table 1) was evaluated and considered significant at an alpha level of 0.05.
3. Results and Discussion
Database Query and Analysis: Spatial and Temporal SOC Trends
Across all AgCROS experimental locations and years, the total SOC was strongly positively correlated with the total soil N (r = 0.56, n = 1275) and mineral carbon (r = 0.81; Table 1). The soil carbon was also positively correlated with the soil cation exchange capacity (r = 0.60), while it was negatively correlated with the electrical conductivity (EC) of the soil (r = −0.61). The silt content was positively correlated (r = 0.56, n = 100), while the bulk density was negatively correlated (r = −0.49, n = 622), with the SOC (Table 1). These results were expected, given the previously established linkage between the SOC and silt, CEC, and N content [25] and the inverse relationship with the bulk density [26], as high-CEC clay minerals can hold more aromatic C compounds than simpler (1:1), low-CEC clay minerals [27]. The SOC results may also be related to the mean annual temperature across these sites, as climate is known to impact soil mineralogy, CEC, and pH.
Overall, the cover crop effects on the soil carbon illustrated that rye (26.38 g C kg−1, n = 217) and legume (23.96 g C kg−1, n = 30) cover crops resulted in greater SOC storage spatially and temporally (Figure 3A), while ryegrass (21.8 g C kg−1, n = 40) and the oat and rye mix (17.57 g C kg−1, n = 144) resulted in a lower SOC content. This result is congruent with [28], who found that enhanced SOC storage favors legume and rye cover cropping. This result is likely owing to the more favorable (labile) substrate of legumes, greater microbial and photosynthetic biomass C, and subsequent substrate in the rye relative to the ryegrass and the oat and rye mix.
Both the high and low grazing intensities resulted in comparable but significantly different SOC levels (59.2 and 52.8 g C kg−1, respectively). The medium grazing intensity had a significantly lower SOC content (16.3 g C kg−1, p < 0.05) compared with both the high and low grazing intensities (Figure 3B). This result was likely owing to higher deposits of animal excreta under high grazing pressure, which are high in nutrients and can help build SOM and support beneficial soil microorganisms [29]. Further, low-intensity grazed systems introduce hay to supplement the animal diet, which further adds carbohydrate sources for C assimilators [30]. The low grazing treatment left substantial forage residue in the field, which served as a substrate for microbial communities and could build SOC following minor trampling by cattle [29,31]. However, the medium grazing treatment did not greatly increase SOC sequestration, most likely due to reduced levels of field crop residue and animal excreta relative to the low and high grazing treatments, thus resulting in 70% less SOC storage overall compared with high- and low-intensity grazing.
These results provide examples of how AgCROS allows for combing databases from research conducted in diverse biophysical environments and can be useful in deriving insights from agricultural Big Data, improving agricultural system efficiency, and enhancing environmental outcomes. For example, the authors of [9] identified, via AgCROS, 30–40% N2O emission reductions when integrating fertilizer manure BMPs in the US. AgCROS is currently in the development and growth phase, with some examples of available datasets being Long-Term Agroecosystem Research (LTAR), the Greenhouse Gas Reduction through Agricultural Carbon Enhancement Network (GRACEnet), the Nutrient Uptake and Outcome Network (NUOnet), Resilient Economic Agricultural Practices (REAP), and the Conservation Effects Assessment Project (CEAP). With the growth and expansion of this data repository, researchers will be able to conduct local-, regional-, and national-scale agricultural analyses [9,10].
4. Conclusions
Combining data into a queryable and linked repository such as AgCROS will require researchers’ willingness to share data, knowledge, and skills to work with the Big Data infrastructure, as well as efforts to make the necessary changes to data already collected. In addition, data infrastructure, including database managers, computer scientists, and statisticians on projects, will be needed to help overcome technical barriers.
The PDI effort integrates agricultural data through real-time storage and accessibility for enhanced in-field agricultural management decisions, improved efficiency gains, and enhanced environmental outcomes. In efforts to illustrate PDI applications and its current use, three case studies were described in the manuscript, all of which used spatial information as an integrator for their use in cloud-based applications, which span cattle tick fever, citrus greening, and high-speed broadband for precision agriculture in rural areas.
This paper also evaluated factors affecting SOC storage such as cover cropping, grazing intensity, and linkages with soil properties using PDI to develop management strategies for optimizing C sequestration. The results indicate that SOC is strongly and positively correlated with total soil N and the cation exchange capacity, while it is negatively correlated with the EC and bulk density. Ryegrass and an oat and rye mix for cover crops had lower SOC storage compared with legume and rye cover crops. In addition, high and low grazing intensities yielded greater SOC sequestration than medium intensive grazing, likely owing to lower animal excreta and residue combinations. Such information can be useful for addressing large-scale research questions aimed at sustainably intensifying systems. Overall, PDI is likely to streamline all phases of research and prevent research redundancies through advancing agricultural management decisions and data analytics for addressing grand challenges facing agronomy.
Author Contributions
Conceptualization, T.P.K., A.J.A., P.R.O.; methodology, T.P.K., A.J.A.; software, T.P.K.; validation, A.J.A., P.R.O.; formal analysis, T.P.K.; investigation, T.P.K., A.J.A., P.R.O.; resources, A.J.A., P.R.O.; data curation, T.P.K.; writing—original draft preparation, T.P.K., A.J.A.; writing—review and editing, T.P.K., A.J.A., P.R.O.; visualization, T.P.K.; supervision, P.R.O., A.J.A.; project administration, A.J.A.; funding acquisition, A.J.A. All authors have read and agreed to the published version of the manuscript.
Funding
This research was made possible by a USDA-ARS Big Data funding opportunity.
Informed Consent Statement
Not applicable.
Data Availability Statement
The data presented in this study are available on request.
Acknowledgments
Trade names or commercial products mentioned in this article are solely for the purpose of providing specific information and do not infer either recommendation or endorsement by the U.S. Department of Agriculture.
Conflicts of Interest
The authors declare that there is no conflict of interest.
Abbreviations
GPS = global positioning system; USDA = United States Department of Agriculture; ARS = Agricultural Research Service; AgCROS = Agricultural Collaborative Research Outcome System; LTAR = Long-Term Agroecosystem Research; GRACEnet = Greenhouse Gas Reduction through Agricultural Carbon Enhancement Network; NUOnet = Nutrient Uptake and Outcome Network; REAP = Resilient Economic Agricultural Practices; CEAP = Conservation Effects Assessment Project; SQL = structured query language; DET = Data Entry Template; GIS = geographical information system; IoT = Internet of Things; NASS = National Agricultural Statistics Service; CRAFT = Citrus Research and Field Trials; BMPs = best management practices; Mbps = megabits per second.
References
- Kharel, T.P.; Ashworth, A.J.; Owens, P.R.; Buser, M. Spatially and temporally disparate data in systems agriculture: Issues and prospective solutions. Agron. J. 2020, 112, 4498–4510. [Google Scholar] [CrossRef]
- Hashem, I.A.T.; Yaqoob, I.; Anuar, N.B.; Mokhtar, S.; Gani, A.; Ullah Khan, S. The rise of “Big Data” on cloud computing: Review and open research issues. Inf. Syst. 2015, 47, 98–115. [Google Scholar] [CrossRef]
- Cambra Baseca, C.; Sendra, S.; Lloret, J.; Tomas, J. A smart decision system for digital farming. Agronomy 2019, 9, 216. [Google Scholar] [CrossRef] [Green Version]
- Gill, S.S.; Chana, I.; Buyya, R. IoT based agriculture as a cloud and Big Data service. J. Organ. End User Comput. 2017, 29, 1–23. [Google Scholar] [CrossRef]
- Jeppesen, J.H.; Ebeid, E.; Jacobsen, R.H.; Toftegaard, T.S. Open geospatial infrastructure for data management and analytics in interdisciplinary research. Comput. Electron. Agric. 2018, 145, 130–141. [Google Scholar] [CrossRef]
- Lokers, R.; Knapen, R.; Janssen, S.; van Randen, Y.; Jansen, J. Analysis of big data technologies for use in agroenvironmental science. Environ. Model. Softw. 2016, 84, 494–504. [Google Scholar] [CrossRef] [Green Version]
- Zhou, L.; Chen, N.; Chen, Z. A cloud computing-enabled spatio-temporal cyber-physical information infrastructure for efficient soil moisture monitoring. ISPRS Int. J. Geo-Inf. 2016, 5, 81. [Google Scholar] [CrossRef] [Green Version]
- Hatfield, J.L.; Walthall, C.L. Meeting global food needs: Realizing the potential via genetics x environment x management interactions. Agron. J. 2015, 107, 1215–1226. [Google Scholar] [CrossRef] [Green Version]
- Delgado, J.A.; Vandenberg, B.; Neer, D.; D’Adamo, R. Emerging nutrient management databases and networks of networks will have broad applicability in future machine learning and artificial intelligence applications in soil and water conservation. J. Soil Water Conserv. 2019, 74, 113A–118A. [Google Scholar] [CrossRef] [Green Version]
- Delgado, J.A.; Short, N.M.; Roberts, D.P.; Vandenberg, B. Big data analysis for sustainable agriculture on a geospatial cloud framework. Front. Sustain. Food Syst. 2019, 3, 54. [Google Scholar] [CrossRef] [Green Version]
- Harmel, R.D.; Kleinman, P.; Eve, M.; Ippolito, J.A.; Beebout, S.; Delgado, J.; Vandenberg, B.; Buser, M. The Partnerships for Data Innovations (PDI): Facilitating data stewardship and catalyzing research engagement in the digital age. Agric. Environ. Lett. 2021, 6, e20055. [Google Scholar] [CrossRef]
- Vasisht, D.; Kapetanovic, Z.; Won, J.; Jin, X.; Chandra, R.; Kapoor, A.; Sinha, S.; Sudarshan, M. FarmBeats: An IoT platform for data-driven agriculture. In Proceedings of the 14th USENIX Symposium on Networked Systems Design and Implementation (NSDI’17), Boston, MA, USA, 27–29 March 2017. [Google Scholar]
- Nekovee, M. A survey of cognitive radio access to TV white spaces. Int. J. Digit. Multimed. Broadcasting 2010, 2010, 236568. [Google Scholar] [CrossRef] [Green Version]
- Thompson, B.S.; Goodrich, E.L. 16—Miscellaneous Infectious Diseases. In Divers, Rebhun’s Diseases of Dairy Cattle, 3rd ed.; Peek, S.F., Thomas, J., Eds.; Elsevier: Amsterdam, The Netherlands, 2018; pp. 737–783. [Google Scholar] [CrossRef]
- Pérez de Leon, A.A.; Teel, P.D.; Auclair, A.N.; Messenger, M.T.; Guerrero, F.D.; Schuster, G.; Miller, R.J. Integrated strategy for sustainable cattle fever tick eradication in USA is required to mitigate the impact of global change. Front. Physiol. 2012, 3, 195. [Google Scholar] [CrossRef] [PubMed] [Green Version]
- Halbert, S.E.; Manjunath, K.L. Asian citrus psyllids (Sternorryncha: Psyllidae) and greening disease of citrus: A literature review and assessment of risk in Florida. Fla. Entomol. 2004, 87, 330–353. [Google Scholar] [CrossRef]
- Dala-Paula, B.M.; Plotto, A.; Bai, J.; Manthey, J.A.; Baldwin, E.A.; Ferrarezi, R.S.; Gloria, M.B. Effect of Huanglongbing or greening disease on orange juice quality, a review. Front. Plant Sci. 2019, 9, 1976. [Google Scholar] [CrossRef] [PubMed] [Green Version]
- Dala Paula, B.M.; Raithore, S.; Manthey, J.A.; Baldwin, E.A.; Zhao, W.; Gloria, M.B.; Plotto, A. Active taste compounds in juice from oranges symptomatic for Huanglongbing (HLB) citrus greening disease. LWT-Food Sci. Technol. 2018, 9, 518–525. [Google Scholar] [CrossRef]
- Baldwin, E.A.; Plotto, A.; Bai, J.; Manthey, J.; Zhao, W.; Raithore, S.; Irey, S. Effect of abscission zone formation on orange (Citrus sinensis) fruit/juice quality for trees affected by Huanglongbing (HLB). J. Agric. Food Chem. 2018, 66, 2877–2890. [Google Scholar] [CrossRef] [Green Version]
- Baldwin, E.; Plotto, A.; Manthey, J.; McCollum, G.; Bai, J.; Irey, M.; Cameron, R.; Luzio, G. Effect of Liberibacter infection (Huanglongbing disease) of citrus on orange fruit physiology and fruit/fruit juice quality: Chemical and physical analyses. J. Agric. Food Chem. 2010, 58, 1247–1262. [Google Scholar] [CrossRef]
- CABI. Citrus Huanglongbing (Greening) Disease (Citrus Greening)—Datasheets. In Invasive Species Compendium; CAB International: Wallingford, UK, 2020; Available online: http://www.cabi.org/isc/datasheet/16567 (accessed on 2 October 2021).
- Kharel, T.P.; Ashworth, A.J.; Shew, A.; Popp, M.P.; Owens, P.R. Tractor guidance improves production efficiency by reducing overlaps and gaps. Agric. Environ. Lett. 2020, 5, 1–13. [Google Scholar] [CrossRef]
- National Agricultural Statistics Service (NASS). Farm Computer Usage and Ownership; United States Department of Agriculture: Washington, DC, USA, 2017. [Google Scholar]
- R Core Team. R: A Language and Environment for Statistical Computing; R Version 4.1.1; R Foundation for Statistical Computing: Vienna, Austria, 2021; Available online: https://www.R-project.org/ (accessed on 10 October 2021).
- Wight, J.; Ashworth, A.J.; Allen, F. Organic substrate, clay type, texture, and water effects on NIR carbon measurements. Geoderma 2016, 261, 36–43. [Google Scholar] [CrossRef]
- Dolan, M.S.; Clapp, C.E.; Allmaras, R.R.; Baker, J.M.; Molina, J.A.E. Soil organic carbon and nitrogen in a Minnesota soil as related to tillage, residue and nitrogen management. Soil Tillage Res. 2016, 89, 221–231. [Google Scholar] [CrossRef]
- Fissore, C.; Giardina, C.P.; Kolka, R.K.; Trettin, C.C.; King, G.M.; Jurgensen, M.F.; Barton, C.D.; McDowell, S.D. Temperature and vegetation effects on soil organic carbon quality along a forested mean annual temperature gradient in North America. Glob. Change Biol. 2008, 14, 193–205. [Google Scholar] [CrossRef] [Green Version]
- Murilo, G.; Diego Cecagno, V.; Bayer, C. Legume cover crops under no-tillage favor organomineral association in microaggregates and soil C accumulation. Soil Tillage Res. 2019, 190, 139–146. [Google Scholar]
- Yang, Y.; Ashworth, A.J.; DeBruyn, J.M.; Willett, C.; Durso, L.M.; Cook, K.L.; Moore, P.; Owens, P.R. Soil biodiversity is driven by long-term pasture management, poultry litter, and cattle manure inputs. PeerJ 2019, 7, e7839. [Google Scholar] [CrossRef] [PubMed] [Green Version]
- Ashworth, A.J.; DeBruyn, J.; Allen, F.L.; Radiosevich, M.A.; Owens, P.R. Microbial community structure is affected by cropping sequences and poultry litter under long-term no-tillage. Soil Biol. Biochem. 2017, 114, 210–219. [Google Scholar] [CrossRef]
- Ashworth, A.J.; Allen, F.L.; DeBruyn, J.; Owens, P.R.; Sams, C. Crop rotations and poultry litter impact dynamic soil chemical properties and soil biota long-term. J. Environ. Qual. 2018, 47, 1327–1338. [Google Scholar] [CrossRef] [Green Version]
Figure 1.
The USDA partnerships for data innovations (PDI), focused on standardizing, integrating, and automating agricultural research data through innovation.
Figure 1.
The USDA partnerships for data innovations (PDI), focused on standardizing, integrating, and automating agricultural research data through innovation.

Figure 2.
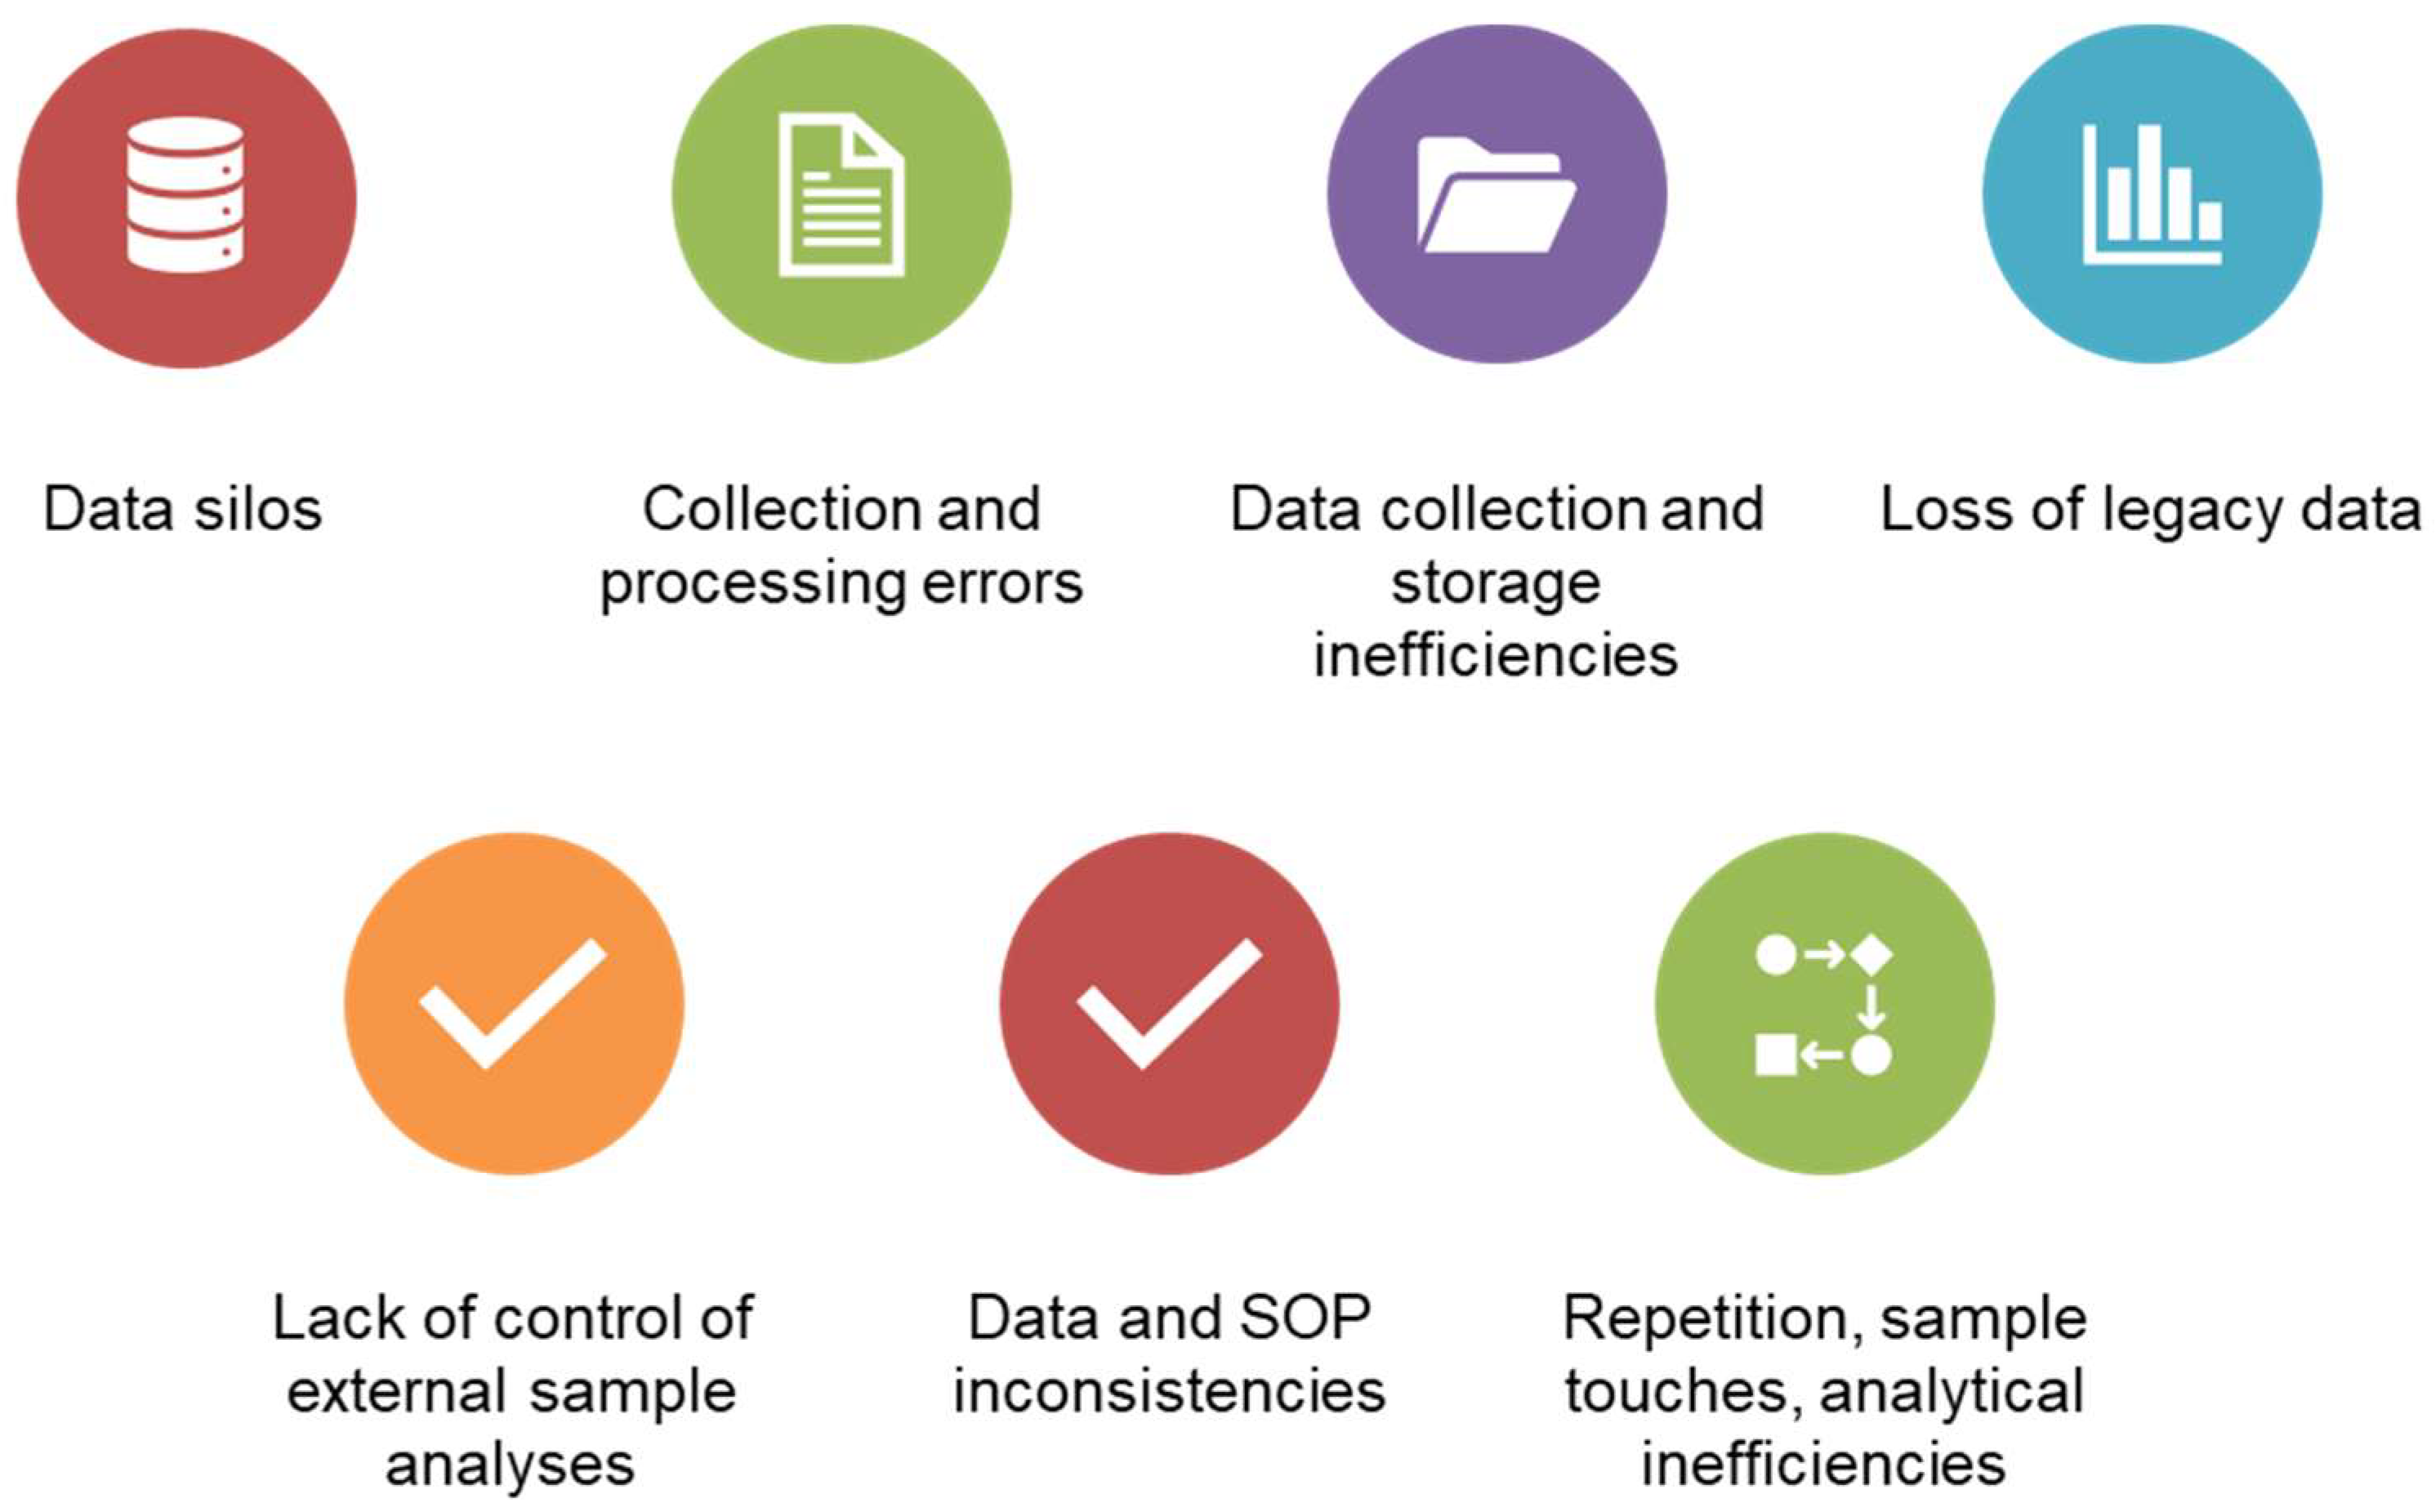
Data-based challenges facing researchers in agronomic sciences.

Figure 3.
Cover crop (A) and grazing intensity (B) effects on total soil C (gC kg−1) measured on USDA-ARS research sites. Error bars represent standard deviation of the mean per group. Different letters indicate statistical difference (p < 0.05) based on the least significant difference test.
Figure 3.
Cover crop (A) and grazing intensity (B) effects on total soil C (gC kg−1) measured on USDA-ARS research sites. Error bars represent standard deviation of the mean per group. Different letters indicate statistical difference (p < 0.05) based on the least significant difference test.


Table 1.
Correlation coefficients between total soil carbon (gC kg−1) and soil parameters (0–5 cm depth) throughout the continental US from 18 experimental sites and 24 years.
Table 1.
Correlation coefficients between total soil carbon (gC kg−1) and soil parameters (0–5 cm depth) throughout the continental US from 18 experimental sites and 24 years.
| Variables | Pearson Correlation Coefficient (r) | Number of Observations (n) |
|---|---|---|
| pH | 0.25 * | 1275 |
| Total soil N (g N kg−1) | 0.86 * | 2553 |
| Inorganic C (g C kg−1) | −0.39 * | 759 |
| Organic C (g C kg−1) | 0.81 * | 571 |
| Mineral C (g C kg−1) | 0.81 * | 571 |
| CEC (cmol kg−1) | 0.6 * | 728 |
| Electric Conductivity (siemens m−1) | −0.61 * | 268 |
| NH4-N (mg N kg−1) | 0.49 * | 589 |
| NO3-N (mg N kg−1) | 0.27 * | 589 |
| P (mg P kg−1) | 0.09 * | 1130 |
| POM (g C kg−1) | −0.35 * | 112 |
| Microbial Biomass C (mg C kg−1) | 0.14 | 60 |
| Sand %) | −0.21 * | 100 |
| Silt (%) | 0.56 * | 82 |
| Clay (%) | −0.4 * | 82 |
| Bulk Density (g cm−3) | −0.49 * | 622 |
Note: * p < 0.05; Not significant = p > 0.05.
Publisher’s Note: MDPI stays neutral with regard to jurisdictional claims in published maps and institutional affiliations. |
© 2022 by the authors. Licensee MDPI, Basel, Switzerland. This article is an open access article distributed under the terms and conditions of the Creative Commons Attribution (CC BY) license (https://creativecommons.org/licenses/by/4.0/).
Share and Cite
MDPI and ACS Style
Kharel, T.P.; Ashworth, A.J.; Owens, P.R. Linking and Sharing Technology: Partnerships for Data Innovations for Management of Agricultural Big Data. Data 2022, 7, 12. https://doi.org/10.3390/data7020012
AMA Style
Kharel TP, Ashworth AJ, Owens PR. Linking and Sharing Technology: Partnerships for Data Innovations for Management of Agricultural Big Data. Data. 2022; 7(2):12. https://doi.org/10.3390/data7020012
Chicago/Turabian StyleKharel, Tulsi P., Amanda J. Ashworth, and Phillip R. Owens. 2022. "Linking and Sharing Technology: Partnerships for Data Innovations for Management of Agricultural Big Data" Data 7, no. 2: 12. https://doi.org/10.3390/data7020012