Article

Breast Cancer Diagnosis Using Extended-Wavelength–Diffuse Reflectance Spectroscopy (EW-DRS)—Proof of Concept in Ex Vivo Breast Specimens Using Machine Learning

1
Department of Translational Medicine, Diagnostic Radiology, Lund University, 205 02 Malmö, Sweden
2
Department of Medical Imaging and Physiology, Skåne University Hospital, 214 28 Malmö, Sweden
3
Department of Clinical Sciences Lund, Ophthalmology, Skåne University Hospital, Lund University, 223 62 Lund, Sweden
4
Department of Biomedical Engineering, Lund University, 221 00 Lund, Sweden
5
Department of Physics, Lund University, 221 00 Lund, Sweden
6
Department of Surgery, Skåne University Hospital, 205 02 Malmö, Sweden
7
Department of Clinical Sciences Lund, Surgery, Lund University, 221 85 Lund, Sweden
*
Author to whom correspondence should be addressed.
These authors contributed equally to this work.
Diagnostics 2023, 13(19), 3076; https://doi.org/10.3390/diagnostics13193076
Submission received: 30 August 2023 / Revised: 24 September 2023 / Accepted: 26 September 2023 / Published: 28 September 2023
(This article belongs to the Section Optical Diagnostics)

Abstract

:
This study aims to investigate the feasibility of using diffuse reflectance spectroscopy (DRS) to distinguish malignant breast tissue from adjacent healthy tissue, and to evaluate if an extended-wavelength range (450–1550 nm) has an advantage over the standard wavelength range (450–900 nm). Multivariate statistics and machine learning algorithms, either linear discriminant analysis (LDA) or support vector machine (SVM) are used to distinguish the two tissue types in breast specimens (total or partial mastectomy) from 23 female patients with primary breast cancer. EW-DRS has a sensitivity of 94% and specificity of 91% as compared to a sensitivity of 40% and specificity of 71% using the standard wavelength range. The results suggest that DRS can discriminate between malignant and healthy breast tissue, with improved outcomes using an extended wavelength. It is also possible to construct a simple analytical model to improve the diagnostic performance of the DRS technique.

1. Introduction

Breast cancer is the most common form of cancer among women and the second most common cause of cancer death globally [1,2]. In Sweden, it accounts for roughly 30% of all cancer cases among women [3]. The diagnosis is obtained using a triple-assessment method, which includes clinical examinations, radiological investigations, and a core-needle biopsy that yields a histopathological result. Conventional radiological investigations include mammography, ultrasound (US), and magnetic resonance imaging (MRI). However, each modality has its own benefits and limitations. The use of ionising radiation in mammography, the high user-dependency in US, and the cost and use of intravenous contrast agents as part of MRI are only a few such examples. The core-needle biopsy, which is the final part of the triple assessment, is an invasive procedure with an estimated false-positive ratio of 1–2% [4]. The procedure is often associated with discomfort, and the rarest and most severe complications include arterial bleeding, infection, and pneumothorax.
The search for a non-invasive technique that can provide relevant breast tissue diagnostic information in real time and without the use of ionising radiation or intravenous contrast agents has opened the door for optical modalities such as photoacoustic imaging (PAI) and diffuse reflectance spectroscopy (DRS) [5,6,7]. These modalities use a light source in the visible and near-infrared wavelength region to illuminate a biological tissue of interest. DRS has a portable and relatively simple instrumentation setup in comparison to PAI, making it a suitable first-line instrument for optical studies. In DRS, the illuminated light interacts with tissue through absorption and scattering. The absorption spectra depend on the chemical composition of the tissue (the assortment of molecules). The scattering spectra depend on the cellular morphology (the size of the molecules). Thus, by measuring the intensity of the diffusely reflected light, the concentration of different endogenous chromophores such as haemoglobin, lipids, water, and collagen can be obtained [7,8].
Previous DRS studies have attempted to create an “optical biopsy” for breast tissue by correlating spectral results with histopathology findings [5,7,8,9,10,11,12,13]. However, the number of studies is limited in this regard. This may be due to breast tissue showing considerable intra- and intersubject variation. It is, for example, morphologically heterogeneous, and it also exhibits structural changes, with varying degrees of lipid content in the various reproductive aging stages. This makes breast tissue a complex biological tissue [7,11]. In addition, many of these studies are based on DRS-spectra obtained in the “standard” visible to near-infrared wavelength range (VIS-NIR; ~450–900 nm) where haemoglobin and deoxyhaemoglobin are the major absorbers [8,13]. There are a few studies that have used an extended-wavelength (EW) range, including not only the VIS-NIR region but also the near-infrared and short-wave infrared range (NIR-SWIR, i.e., ~750–1600 nm). The added advantage is that the absorption peaks of water, collagen, and lipids are also included [12,14].
The majority of the breast-specific DRS studies use mathematical models, such as diffusion theory or Monte Carlo simulations, for data processing [5,7,8,9,10,11,12,13]. In contrast, there are DRS studies of other human organs, such as the cervix and liver, that have used multivariate statistical algorithms for data processing [15,16,17]. The overall advantage of the latter approach is that no prior knowledge of the absorption and scattering properties is required. To the best of our knowledge, there are no previous breast-related DRS studies that have used multivariate statistical algorithms for data processing.
In this work, we use a novel in-house-developed DRS setup that combines two types of spectrometers (VIS-NIR and NIR-SWIR) to visualise the EW range (~450–1550 nm). The combination of these two spectrometers covers most of the important chromophores in breast tissue in a single reading. This setup has successfully been used with liver and skin malignancies [16,18,19]. In the liver cohort, the main distinguishing feature between malignant and adjacent healthy tissue was observed in the visible-wavelength range [16].
This study aims to investigate the feasibility of using diffuse reflectance spectroscopy (DRS) to distinguish malignant breast tissue from adjacent healthy tissue, and to evaluate if an extended-wavelength range (450–1550 nm) has an advantage over the standard wavelength range (450–900 nm).

2. Materials and Methods

2.1. Patient Recruitment

Ethical approval was granted by the Swedish Ethical Review Authority (dnr 2019-04840) for an ex vivo experimental study conducted on breast specimens (total or partial mastectomy) taken from women undergoing surgery for primary breast cancer. This study was performed in accordance with the Declaration of Helsinki [20]. In total, 23 female patients who were scheduled for surgery at Skåne University Hospital, in Malmö, Sweden, were enrolled. Data collection was performed at the Department of Pathology and at Unilabs Breast Centre in December 2020 and May 2021. The optical measurements did not alter the standard clinical workflow. This study included women above the age of 18 with biopsy-verified breast cancer and a pre-operative mammography image showing a malignant breast lesion measuring at least 1 cm. Exclusion criteria included previous history of breast surgery or neoadjuvant treatment. Patients who did not comprehend Swedish were also excluded. Informed consent was obtained from all subjects involved in this study.

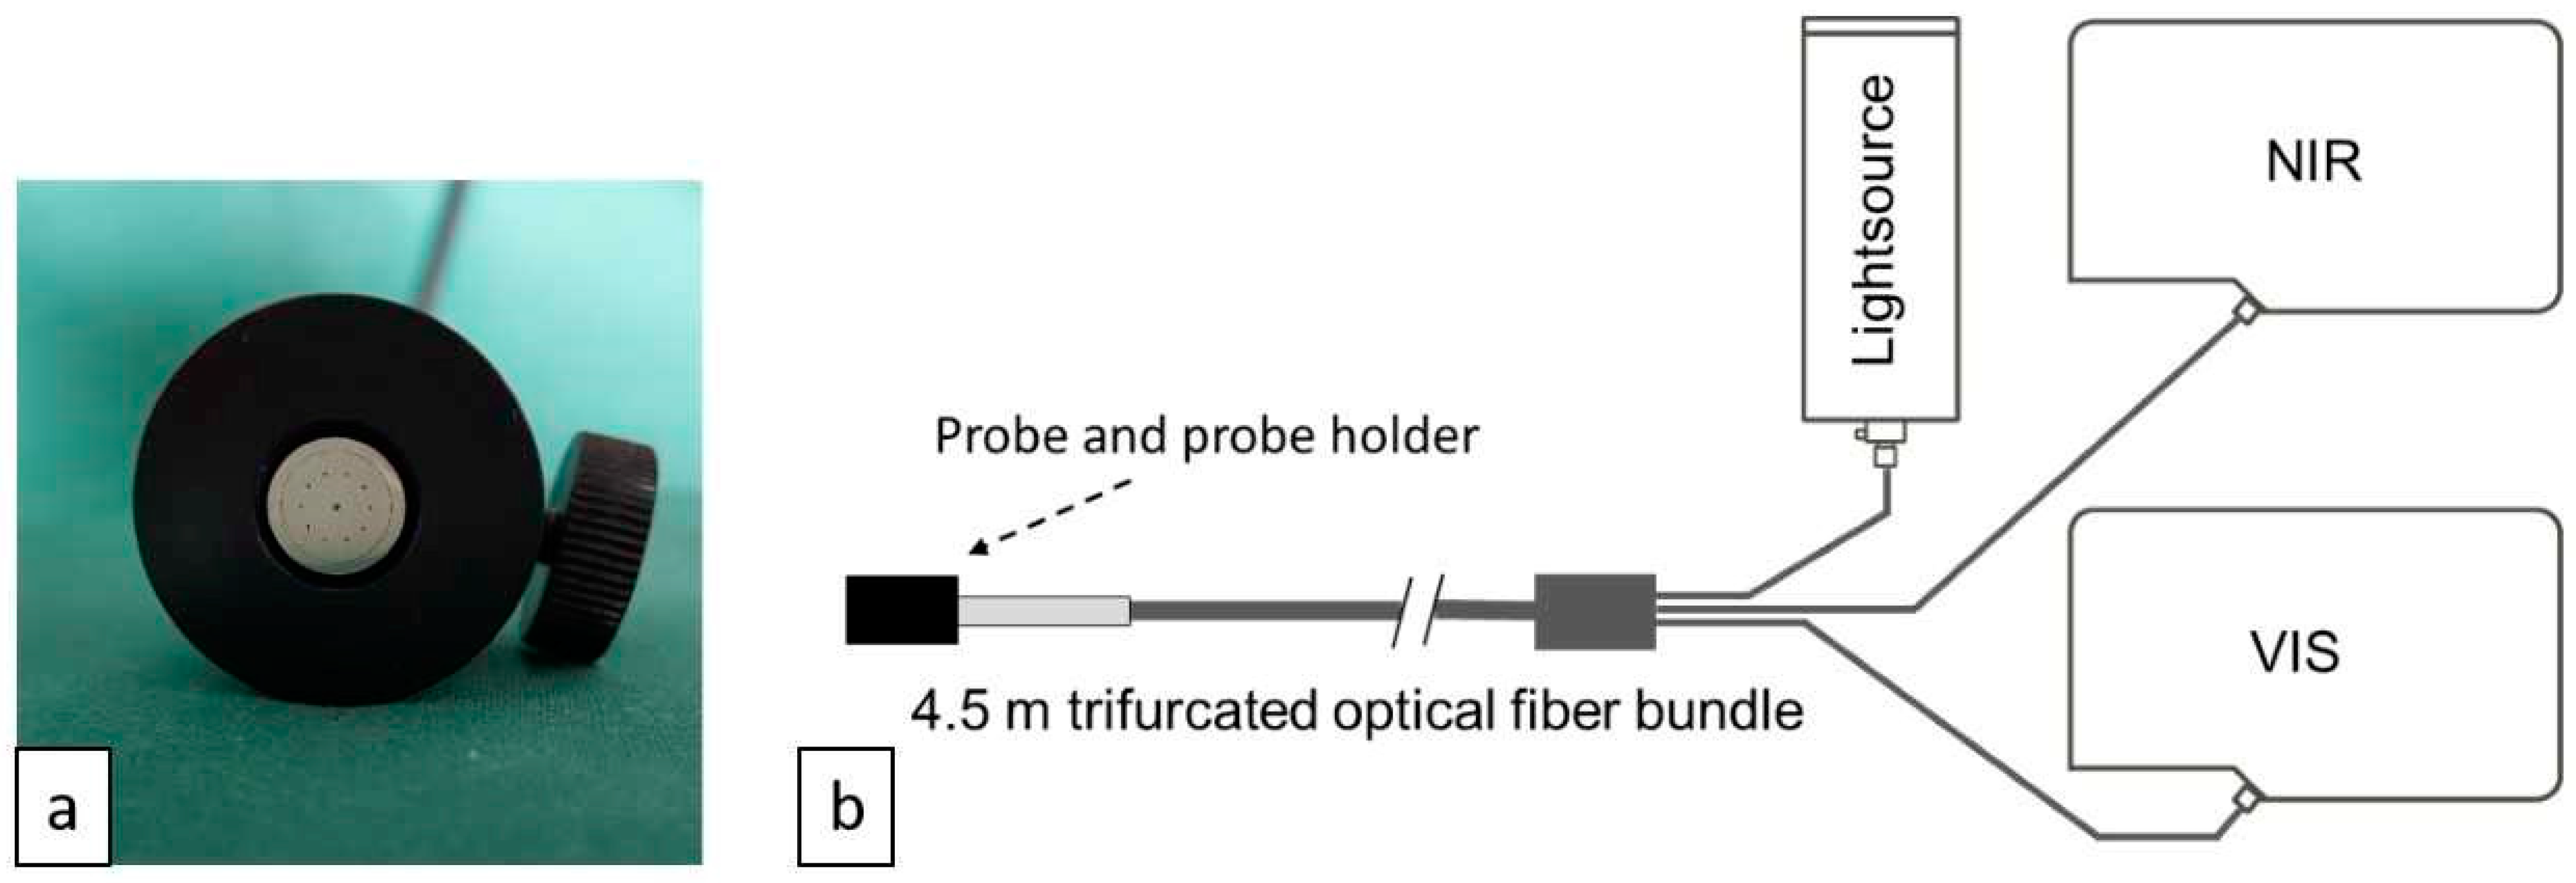
2.2. Instrumentation

A tungsten–halogen light source (Ocean Optics HL-2000-HP; Ocean Optics, Orlando, FL, USA) delivered a broadband spectrum (about 360–2000 nm) through a custom-designed fibre probe (10 mm in diameter) connected to a custom-made probe holder (25 mm diameter), as seen in Figure 1a. The fibre bundle had a central illuminating fibre (diameter 400 μm) encircled (diameter 5 mm) by ten collecting fibres (diameter 200 μm). Every alternate collecting fibre was attached to a spectrometer operating in the wavelength range of 350–1100 nm (Ocean Optics QE6500-VIS-NIR), and the remaining fibres were attached to a spectrometer operating in the wavelength range of 900–1700 nm (Ocean Optics NIRQuest512). All optical fibres had a numerical aperture of 0.22. The spectrometers’ slits of 50 and 25 μm, respectively, provided optical resolutions of about 3 nm. By using two spectrometers together, spectra were obtained in the range of 450–1550 nm (see Figure 1b) [16]. Both spectrometers enable real-time continuous spectra within their respective detector wavelength ranges. Computer software (Ocean View 2.0, Ocean Insight, Orlando, FL, USA) was used to operate the spectrometers and collect data on a laptop computer.

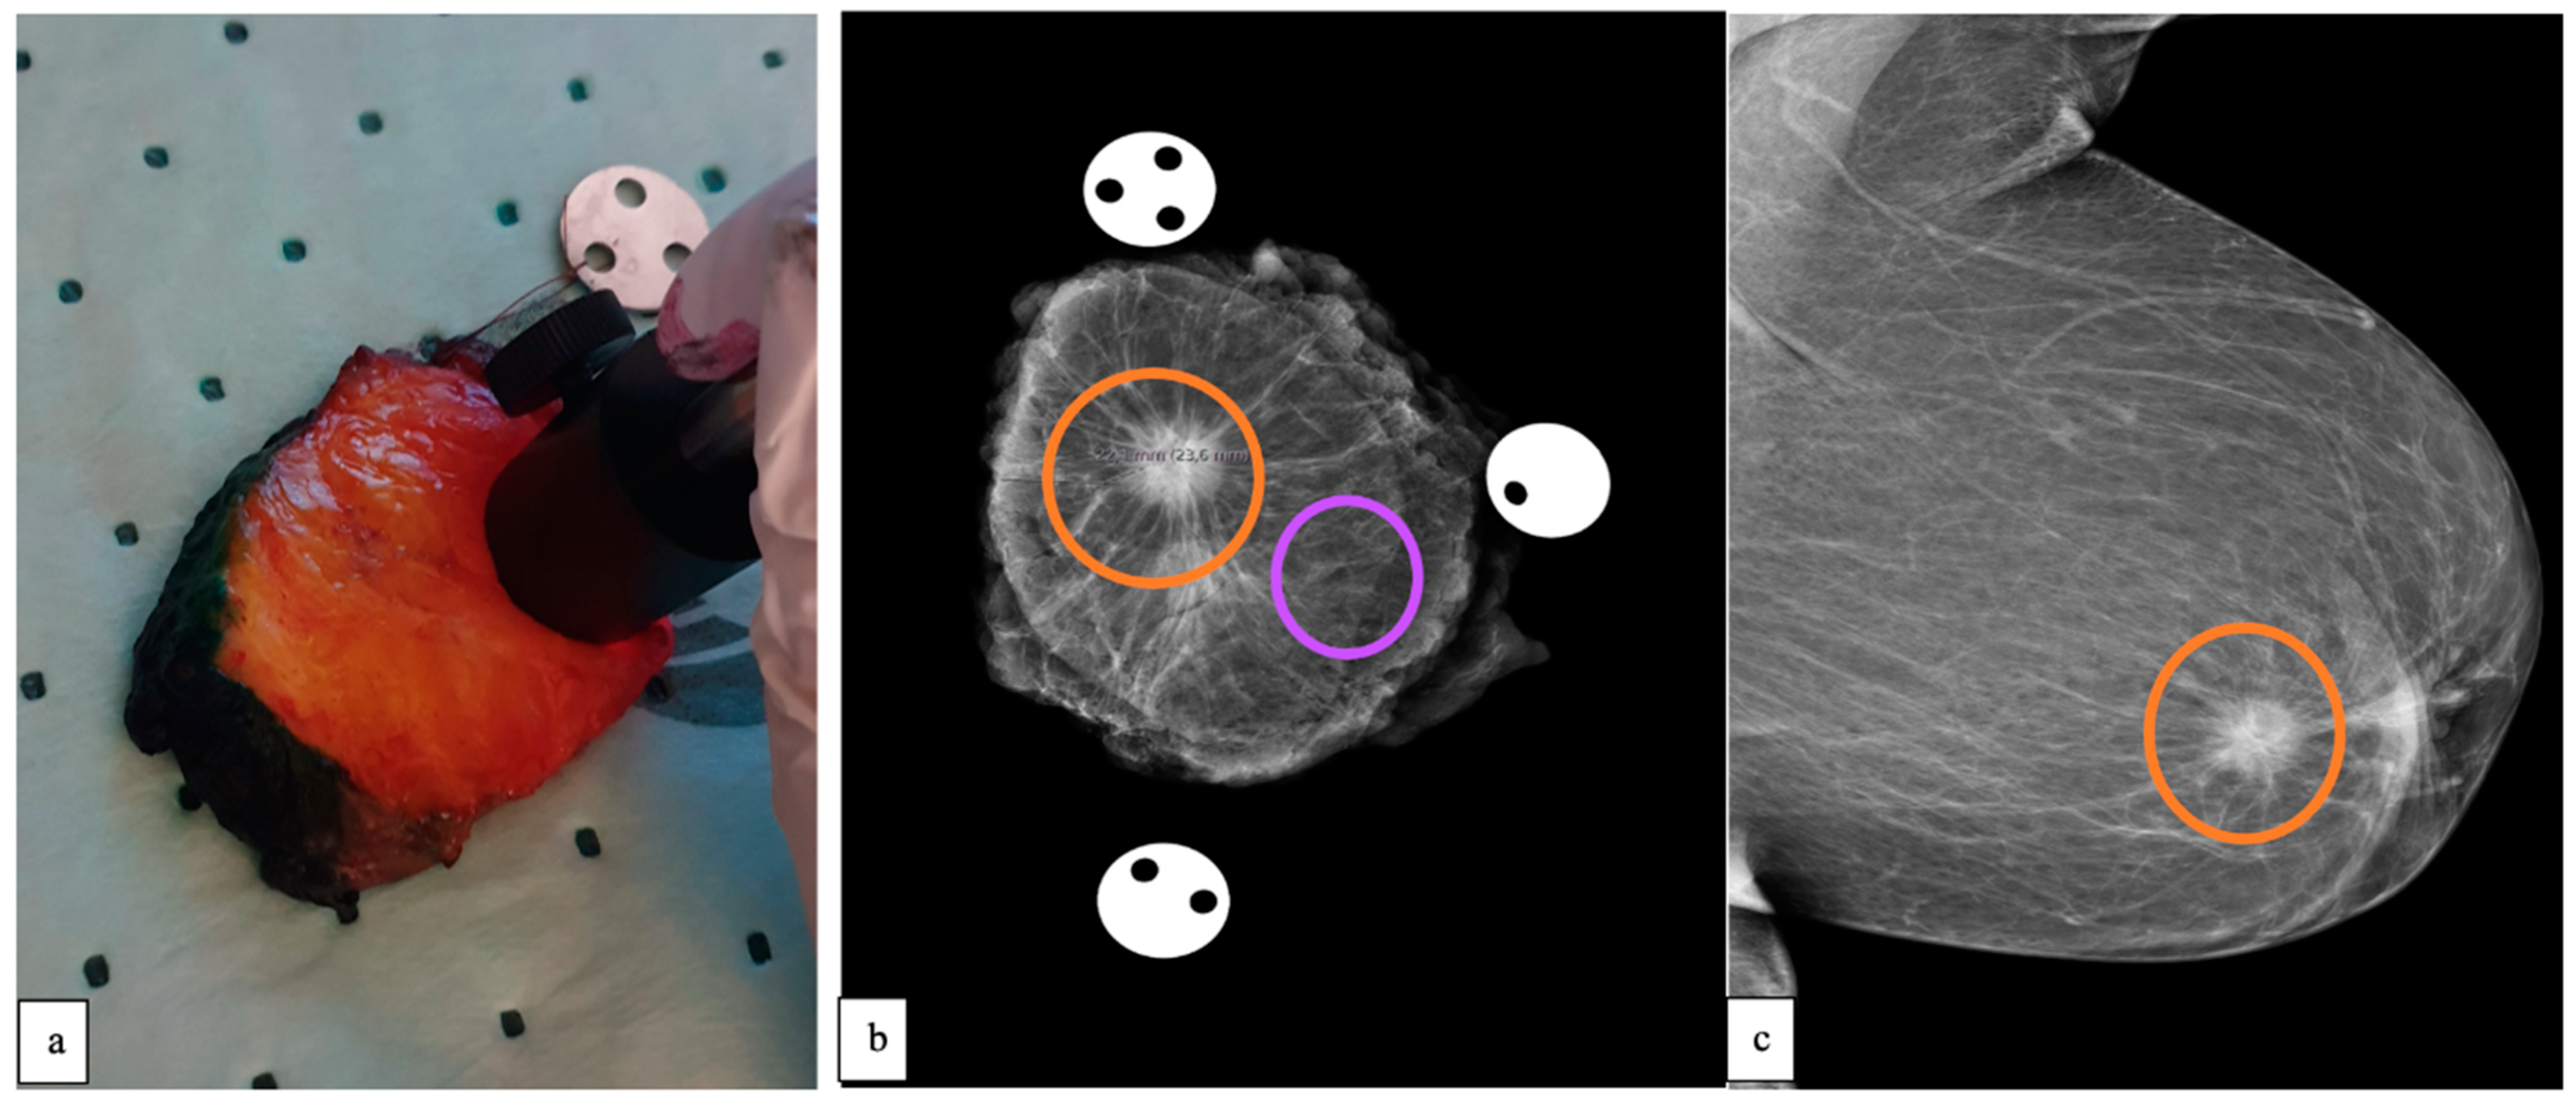
2.3. Data Collection

All measurements were performed on freshly excised breast specimens within 30–60 min of surgical resection. Both total and partial mastectomy specimens were used in this study. The partial mastectomy specimens were inked with different surgical dyes by the breast surgeon, as per clinical routine, with each colour representing a certain anatomical plane. Unfortunately, these surgical dyes limit optical measurements due to their scattering and absorption properties [21]. Thus, in the first two patients, DRS data were collected from total mastectomy specimens (non-skin-covered areas). In the remaining patients, the specimen was cut into ~5 mm thick slices by the pathologist, as per clinical routine, leaving the dye at the borders only, thereby allowing the use of partial mastectomy specimens as well. The slice in which the malignant tumour had its largest diameter was selected for EW-DRS measurements (see Figure 2a).
To minimise the effect of warm-up drift, the room temperature was recorded, and background and calibration spectra were recorded before the first measurement and after the last measurement, per specimen. The DRS probe was carefully positioned in direct contact with the malignant tumour, and if the tumour’s size was larger than the DRS probe, the probe was placed at multiple regions chosen at random. This was followed by measurements on adjacent healthy tissue chosen at random. On average, five separate locations were used to make DRS measurements in each tissue type. At each measurement site, a total of five optical measurements were obtained. The standard specimen mammography image was used as a reference to locate malignant tumour positions and adjacent healthy tissue, as seen in Figure 2b. Data collection for one measurement took about 12 s, and the total measurement time was set at about 20 min per specimen.
Patient demographic data (age and body mass index), core-needle biopsy results, the surgical technique used, and histopathological post-operative results were obtained from medical records. A protocol was set up to extract information from the standard pre-operative mammography (Figure 2c) and ultrasound report. Breast density was estimated based on the pre-operative mammography scan by two radiologists and classified according to the fifth edition of the Breast Imaging Reporting and Data System (BI-RADS) [22]. Variables such as tumour appearance and size were also noted.

2.4. Histopathological Analysis

Tumour characteristics were retrieved from pathology reports. Breast tumours were divided into five subgroups according to the 2019 WHO breast cancer classification system [23].

2.5. Multivariate Statistics and Machine Learning Discrimination Models

The included patient, radiological, and pathological variables are reported in numbers and percentages. Multivariate statistics and machine learning modelling were performed according to a previously described method used on liver malignancies [16]. More specifically, the spectral data were evaluated for all patients collectively and classified as either malignant or healthy tissue based on three steps. Firstly, a principal component analysis was performed to reduce the dimensions of data. Secondly, by using the first two principal components, the data were classified into either malignant or healthy tissue by using the linear diagnostic analysis (LDA) or the support vector machine (SVM) algorithm. The LDA algorithm increases the covariance between the two groups and decreases the variances within the groups. The SVM algorithm finds the hyperplane that can distinguish the data into two groups. Lastly, a cross-validation was performed using the “leave-one-out” method. The sensitivity (SE), specificity (SP), classification ratio (CR), and Matthew’s correlation coefficient (MCC) were calculated. Receiver operating characteristic (ROC) curves were plotted, and the area under the curve (AUC) was calculated. Data processing was performed in the statistics and machine learning toolbox™ package in MATLAB R2022a (The MathWorks, Inc., Natick, MA, USA).

3. Results

3.1. Demographics

The median patient age and the mean patient age were 66 and 67 years, respectively (range: 52 to 84 years). The median and mean BMI values were 28.7 and 27.2 kg/m2, respectively. About 8% of the women were using hormone-replacement therapy at the time of diagnosis. Invasive ductal carcinoma was the most common histopathological diagnosis, accounting for eleven patients (46%), followed by invasive lobular carcinoma, with eight patients (33%); tubular carcinoma, with two patients (8%); papillary carcinoma, with one patient (4%); and ductal carcinoma in situ, with one patient (4%) (see Table 1).

Pre-Operative Radiological Report
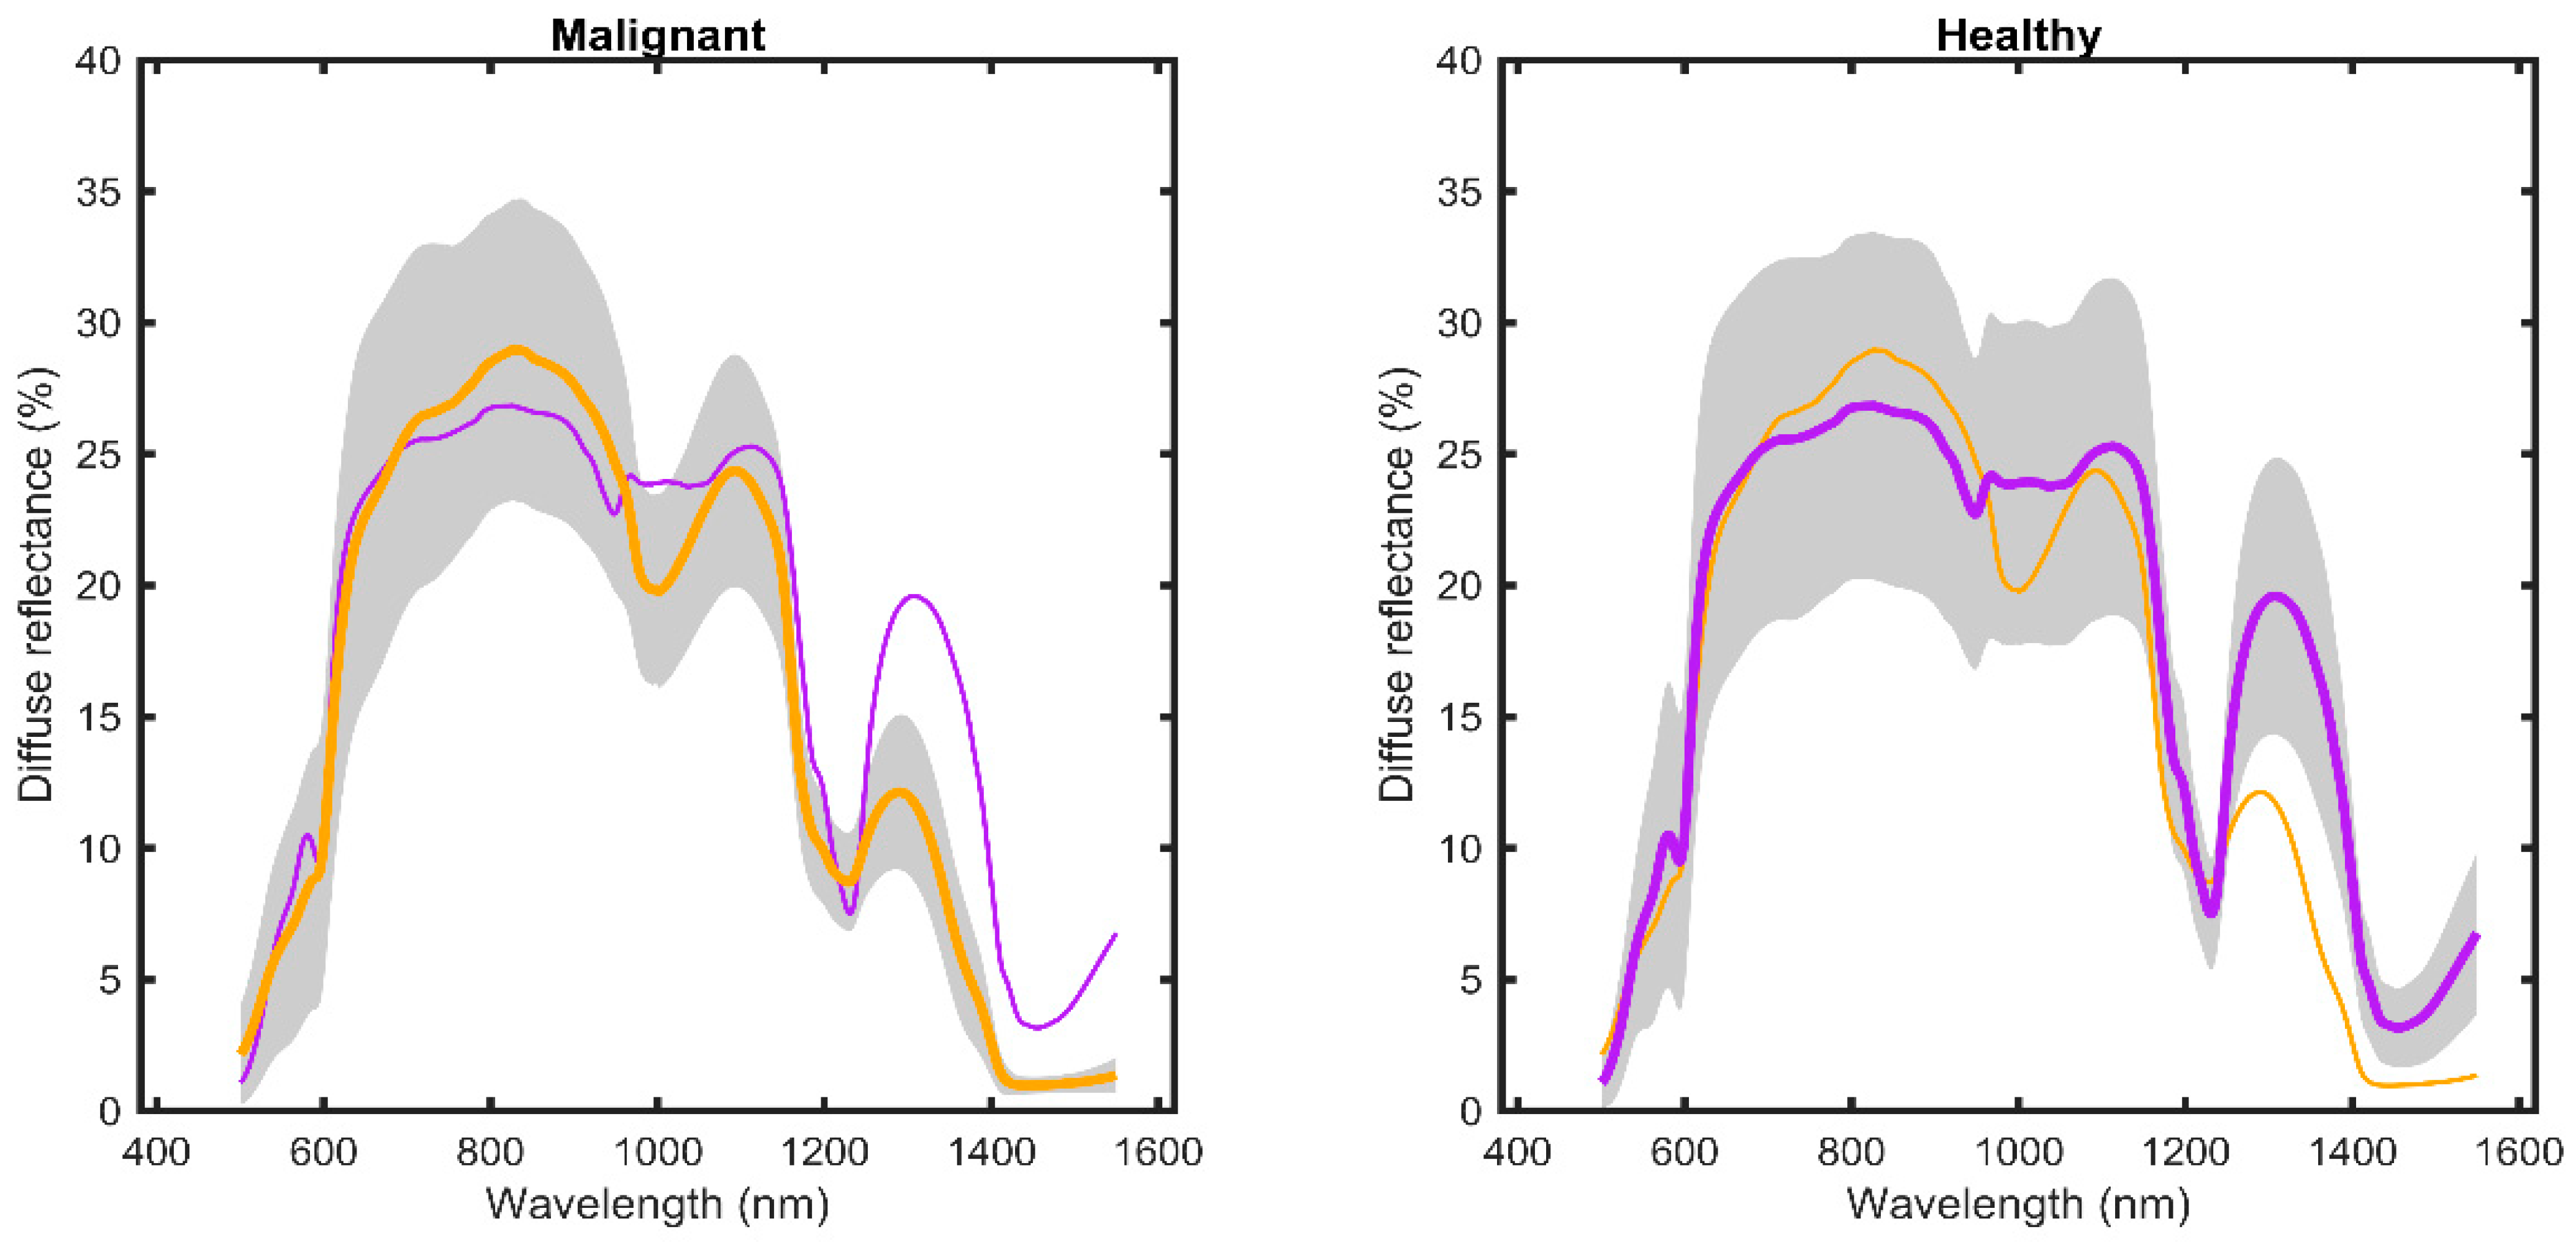
The average size of the breast malignancies was about 18.3 mm on both ultrasound and mammography (see Table 2). All breast density categories were represented with the most common breast density being B. For multifocal malignancies, the largest tumour diameter was used in the size calculations.

3.2. DRS Data

In total, 1035 EW-DRS spectra were obtained from 23 female patients: 505 from malignant tissue and 530 from adjacent healthy tissue (see Table 3). To enhance visual comparison, the means and standard deviations (±1 SD) of DRS for each tissue type were plotted against wavelength (see Figure 3). An overlapping wavelength region (930 to 1030 nm) of the two spectrometers was used to merge the two spectra into one continuous spectrum ranging from 450 to 1550 nm.

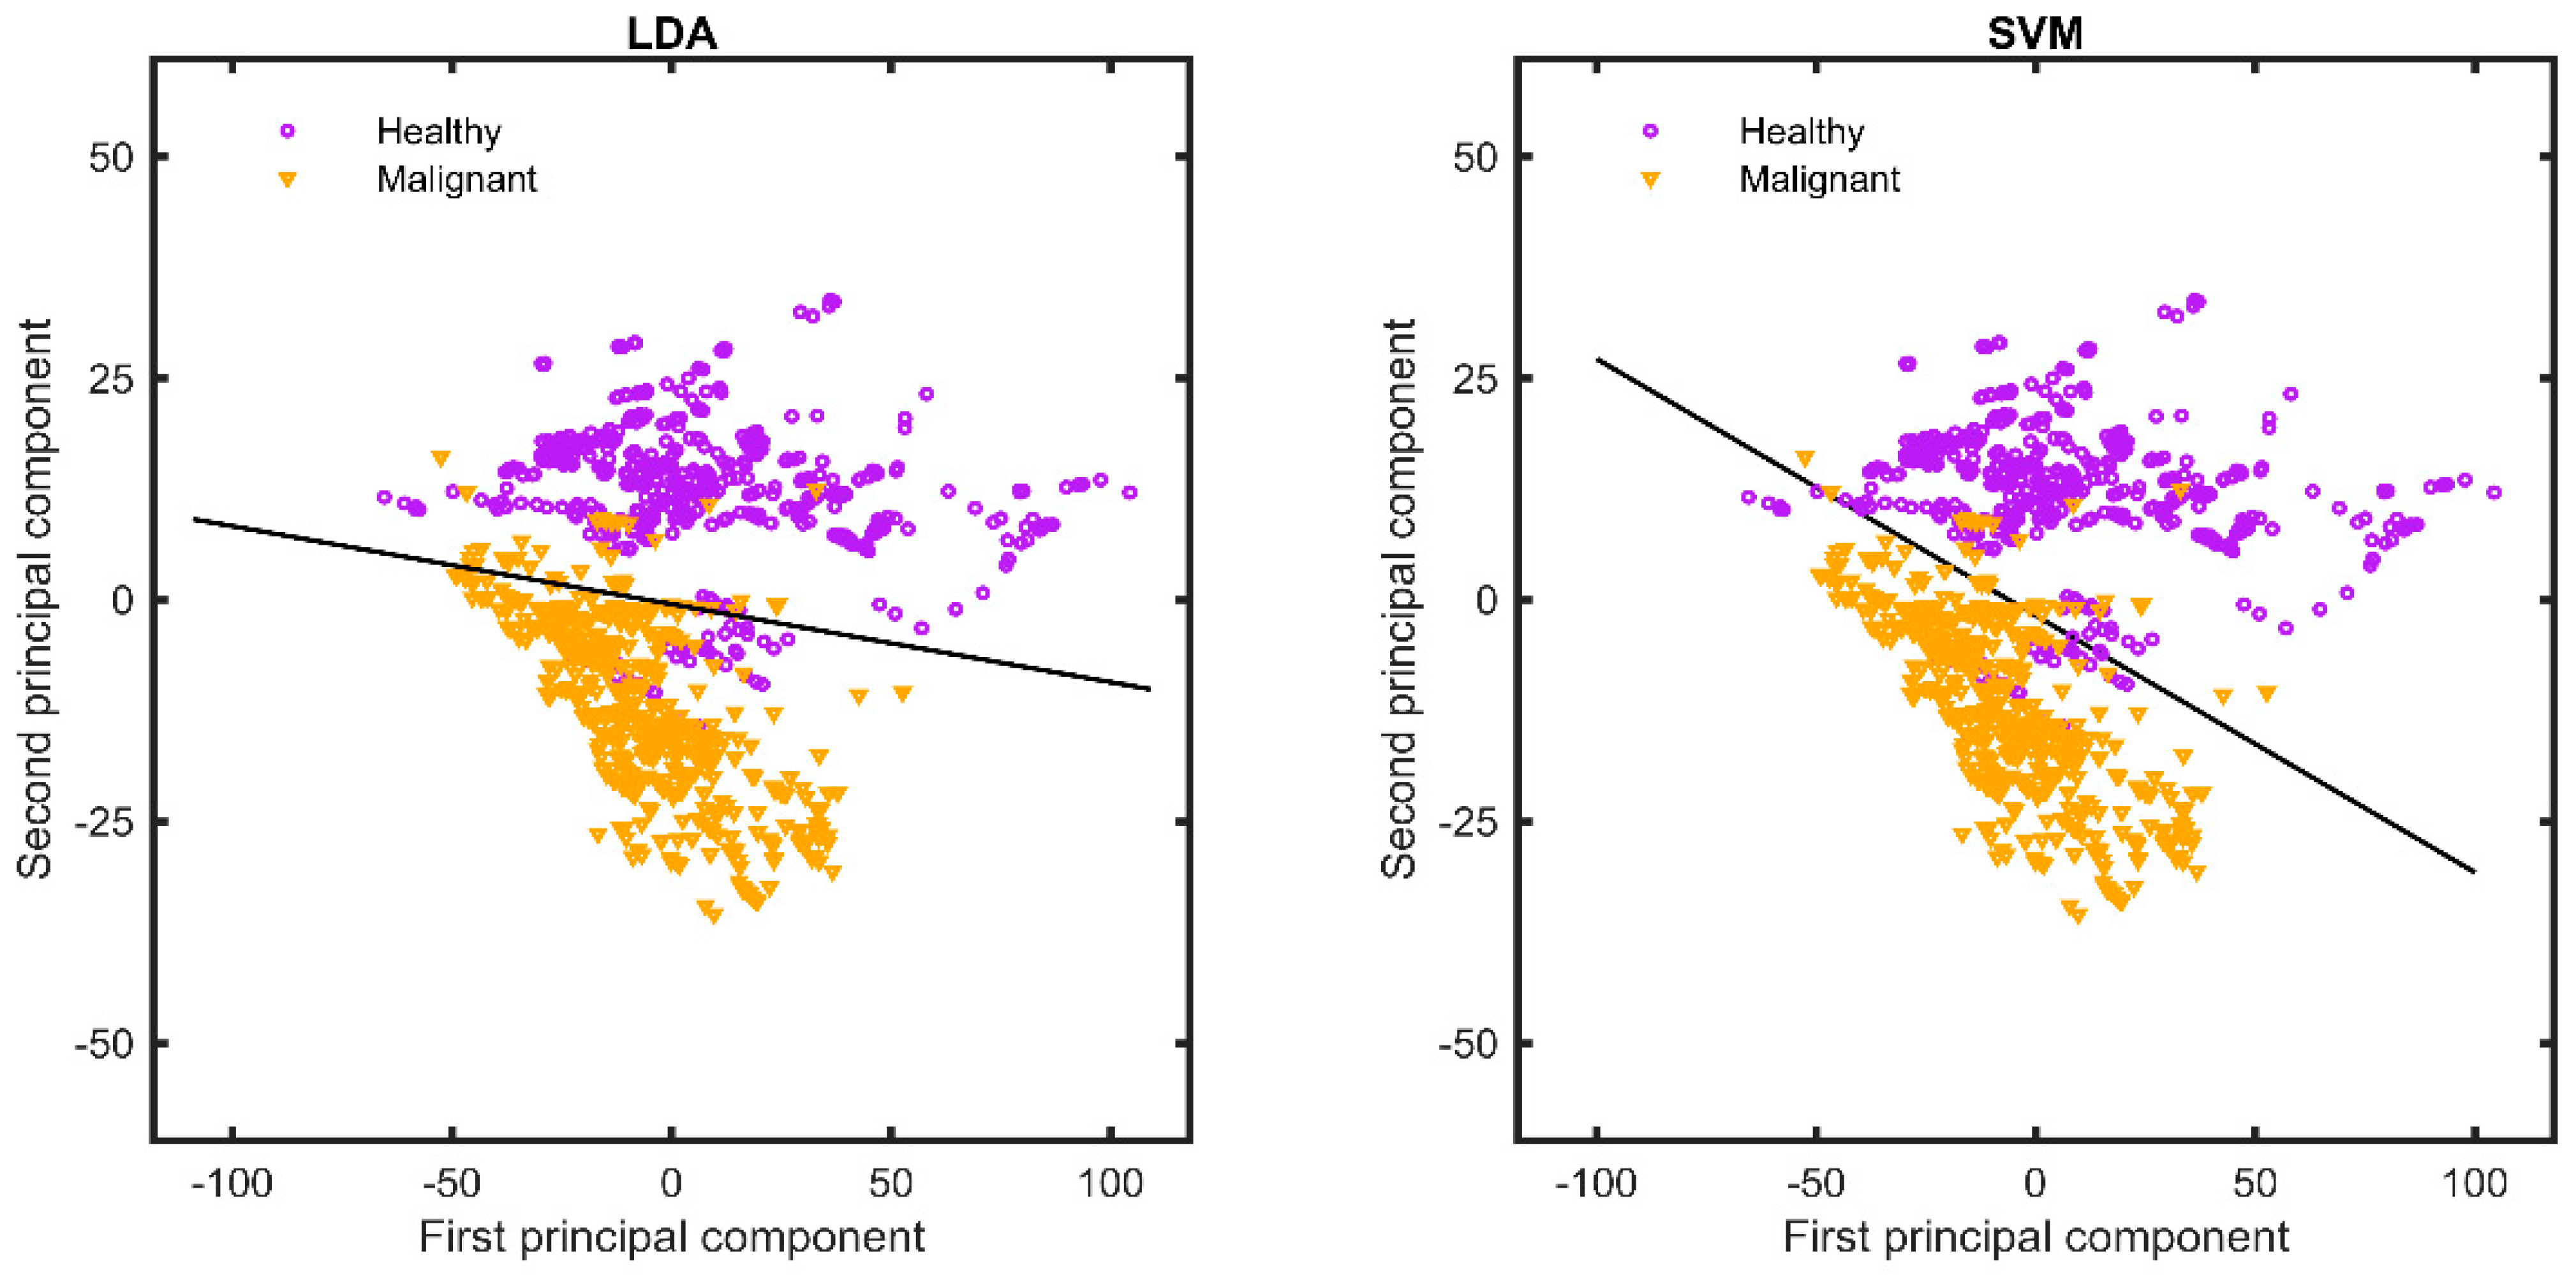
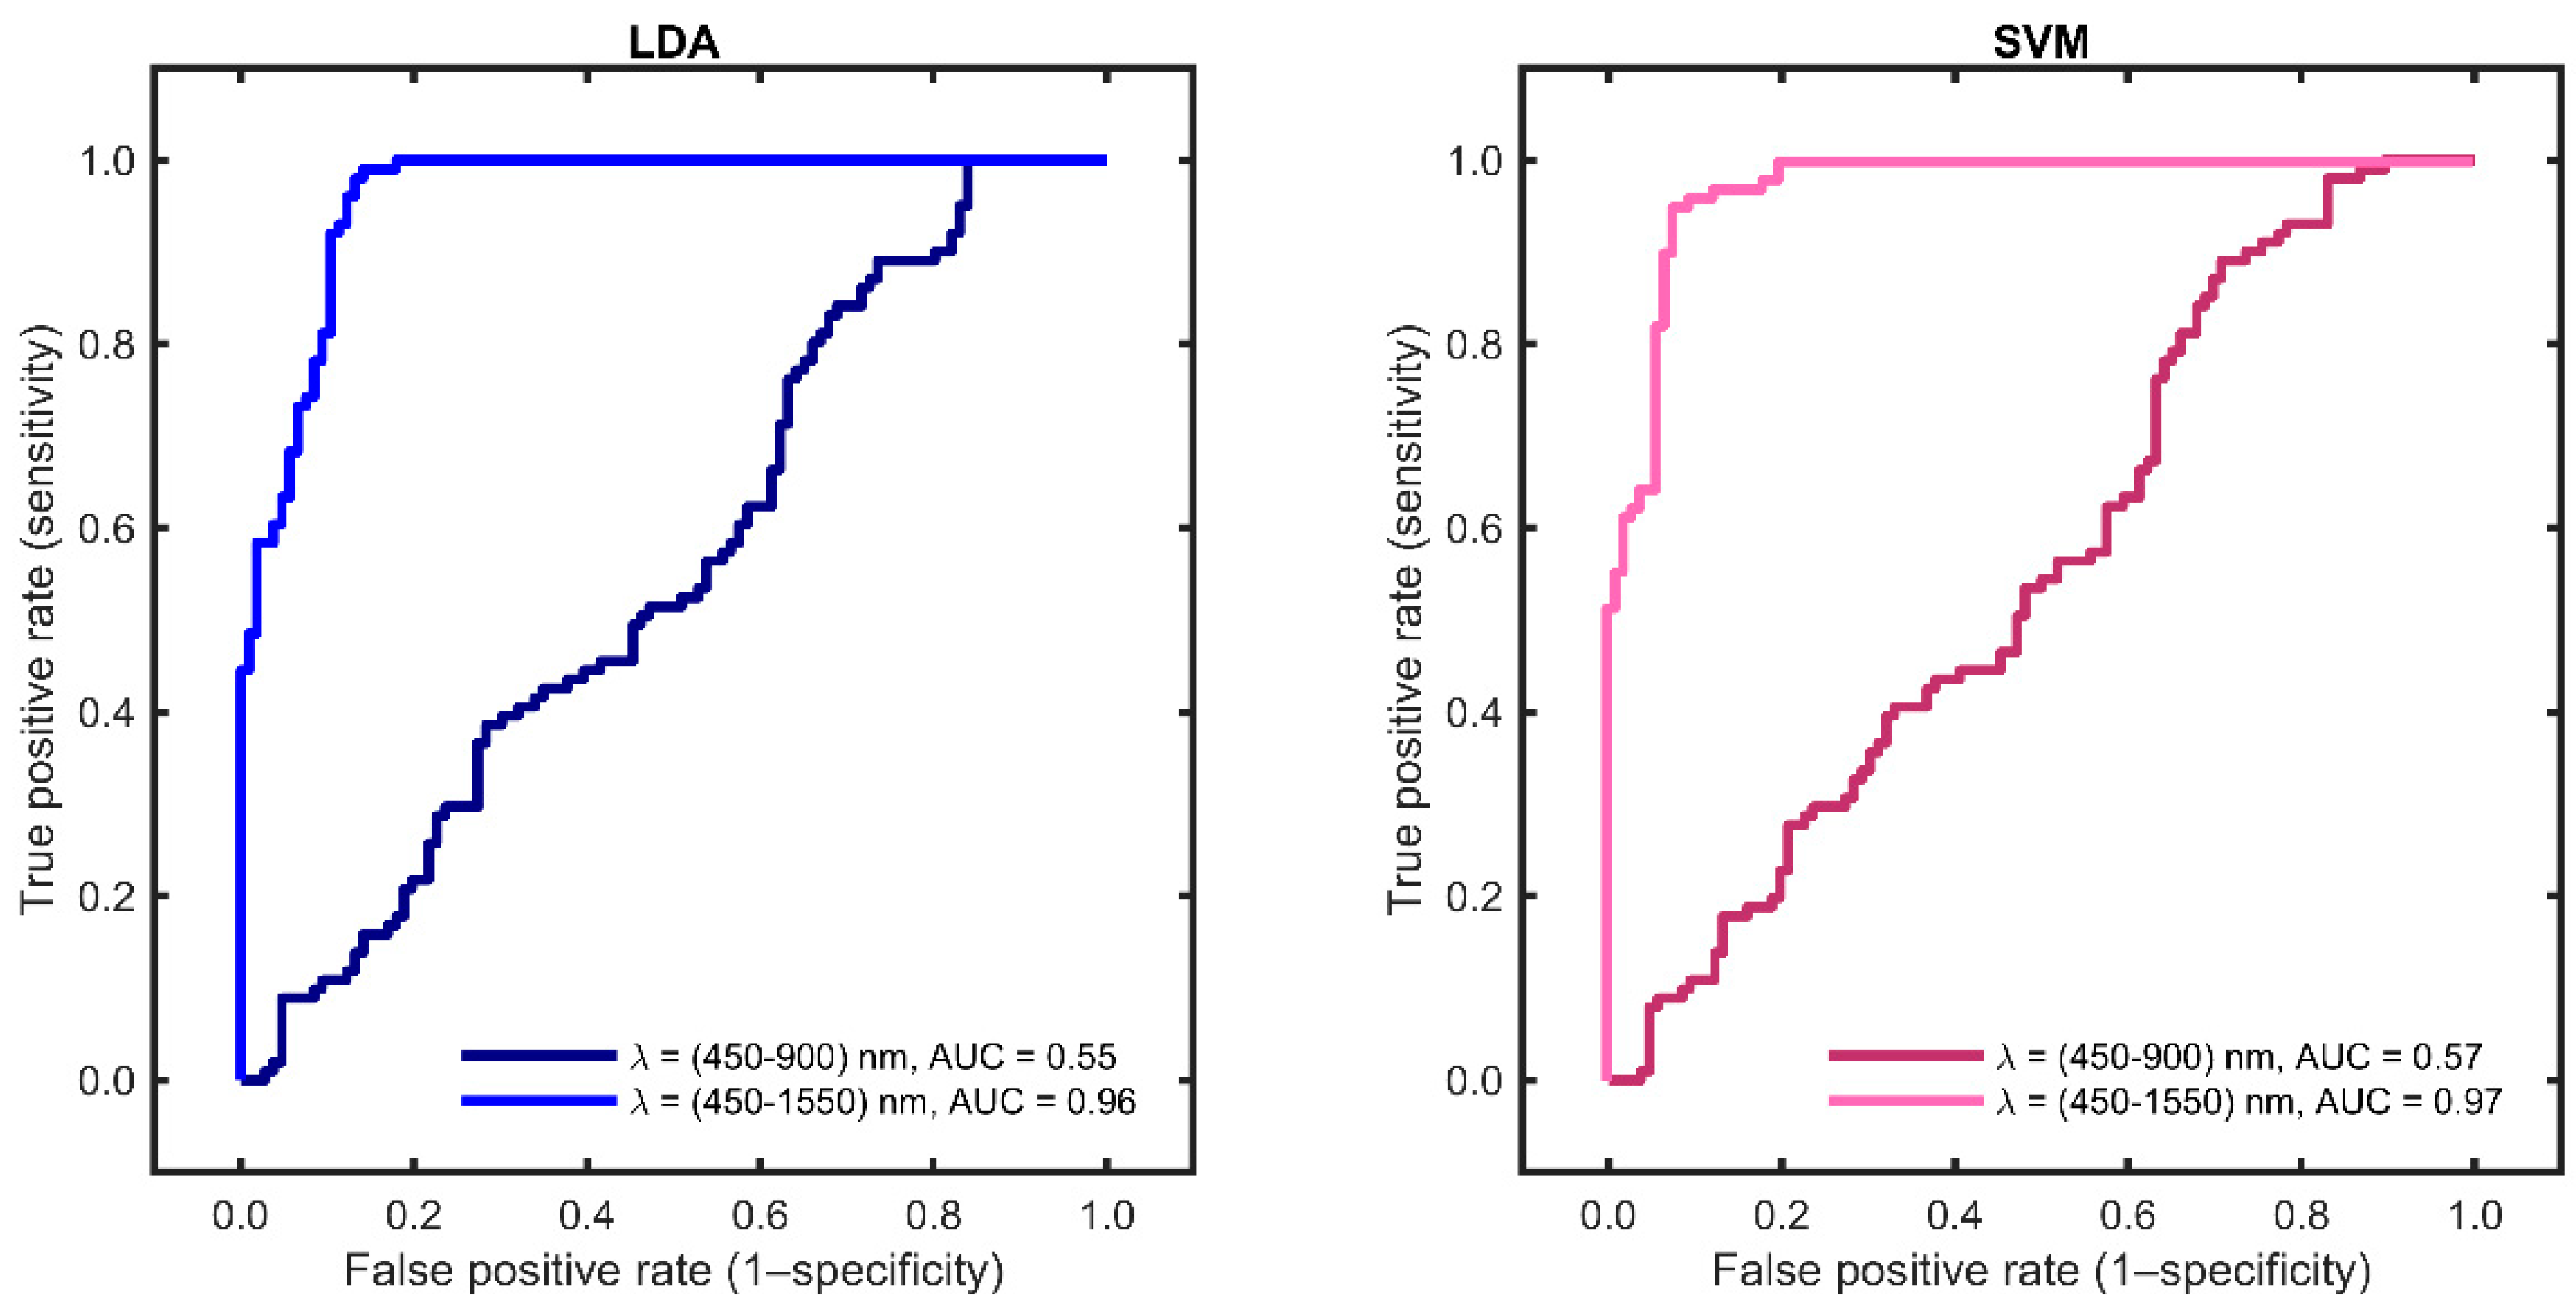
3.3. Machine Learning Outcome

Based on the wavelength range of 450–900 nm, the first two principal components, together, accounted for 83% of the total explained variance in the optical spectrum. When utilising the extended-wavelength range of 450–1550 nm, the corresponding figure was 80%. Whatever wavelength range used, almost all the spectral variation in the entire dataset was captured by the first two principal components. The linear discrimination analysis (LDA) and support vector machine (SVM) discrimination algorithms were used to categorise the samples based on only two principal components (see Figure 4). The score charts for the two first principal components show a clear discrimination between healthy and malignant breast tissue in the extended-wavelength range.

4. Discussion

The first objective of this ex vivo study was to evaluate whether EW-DRS can be used to distinguish between healthy and malignant breast tissue in an ex vivo setting. The results suggest that both tissue types have distinctive optical signatures. Malignant breast tissue displays increased absorption at a wavelength range of 950–1100 nm and decreased absorption at 680–950 nm and 1250–1550 nm, relative to adjacent healthy tissue. These wavelength ranges represent the absorption of essential breast tissue chromophores, such as haemoglobin (around 600 nm), water, lipids, and collagen (wavelengths around 1200–1400 nm) [14,24]. Thus, the EW range plays a vital role in characterising malignant and healthy breast tissue, and our results are consistent with previous DRS studies [5,10,13]. The multivariate approach does not, however, quantify the concentration of endogenous chromophores, making it an interesting topic for future studies.
An optical difference between malignant and healthy breast tissue is found in the NIR/SWIR wavelength range, as mentioned above. In contrast, malignant and healthy liver tissue demonstrates an optical difference in the VIS wavelength range (i.e., morphological differences are seen with the naked eye) [16]. This, in turn, can explain why breast surgeons face challenges when attempting to visually recognise tumour tissue at the surgical margin. It also highlights the crucial role of specimen mammography in detecting surgical margins.
Despite inter-patient variability, such as varying breast densities and different types of histopathological malignancies, a difference in the spectral signatures between malignant and healthy breast tissue is obtained. EW-DRS can detect a breast malignancy in mammographically dense breast tissue, which is a known radiological challenge. EW-DRS can detect common breast cancer types, such as invasive ductal carcinomas, as well as rarer forms, such as lobular and papillary carcinomas, with the former being a radiological challenge due to its mammographic features being similar to those of glandular tissue. Thus, DRS could play a complementary role in defining tumour borders and foci. This should be addressed in future studies with larger sample sizes.
The second objective of this study was to evaluate the role of an extended-wavelength (450–1550 nm), as opposed to the “standard” VIS-NIR optical wavelength range (450–900 nm), using a multivariate statical algorithm for data processing. The use of EW-DRS increases sensitivity from 33 to 92%, specificity from 70 to 90% and MCC from 3 to 82% using LDA, as well as from 40 to 94%, 71 to 91%, and 11 to 85% when using SVM, respectively. Similar results are observed for the receiver operating curves, as the AUC value is increased from 0.55 to 0.97 using LDA and from 0.57 to 0.97 using SVM when the extended-wavelength range is included. Previous studies of malignant and healthy breast tissue have reported sensitivities and specificities of about 90% and 88%, respectively [7]. The slightly improved results could be explained by the use of a multivariate and machine learning approach to data processing, as opposed to complex mathematical models. By using the extended-wavelength range and only two principal components, we managed to obtain relevant information, with a total of 80% variance being represented. This simplification is important for future clinical applications that require real-time processing.
Ex vivo studies like ours have limitations because tissue perfusion is eliminated after surgical resection. It has, however, been suggested that the difference in spectral signatures is not significantly different in ex vivo versus in vivo settings [9,10]. In other words, our ex vivo results may be applicable to future studies in which the breast is investigated pre-operatively (in vivo) by using other optical modalities with a greater depth penetration than DRS (e.g., PAI). Another potential limitation was that it was not possible to precisely correlate the final histopathological tumour borders with the placement of the DRS probe. However, guidance using the specimen mammography, as well as with the macroscopic contrast between the two tissue types being apparent, should have minimised incorrect measurements. Furthermore, our limited study sample included peri- and postmenopausal patients. However, all breast-density patterns were represented, and we have no reason to believe that the results would be different in pre-menopausal patients, because optical methods, in general, have shown that malignancy detection remains constant irrespective of breast density [25,26]. It should be noted that benign tumours were not included. The main reason for this choice was that these tumours are placed in a formaldehyde solution for fixation in the operating theatre as per clinical routine. This, in turn, alters their chemical and physical properties, making them unsuitable for inclusion in this study. Finally, the EW-DRS used in our study had a depth penetration of a few millimetres, depending on the wavelength [27]. This limits in vivo use during breast surgery, as the tumour itself is kept intact, surrounded by healthy tissue, upon resection. This DRS technique may be a more suitable real-time tool for pathologists to use in defining tumour borders or foci directly on tissue slices.
The results of this study will serve as an optical reference bank for future optical studies of breast tissue. It proves that EW-DRS can differentiate between malignant and healthy breast tissue.

5. Conclusions

We have shown that it is possible to distinguish malignant from healthy breast tissue using EW-DRS. Our results further suggest that it is possible to construct simple algorithms using only two principal components and standard machine learning discrimination algorithms such as LDA and SVM, thereby improving the diagnostic performance of the DRS technique.

Author Contributions

Conceptualization, N.C., M.C., M.M., N.R. and S.Z.; methodology, N.C., N.R. and S.Z.; software, N.R.; validation, N.R.; formal analysis, N.C., N.R. and S.Z.; investigation, N.C., N.R. and S.Z.; resources, N.C., N.R. and S.Z.; data curation, N.C., N.R. and S.Z.; writing—original draft, N.C., N.R. and S.Z.; writing—review and editing, N.C., J.A., M.C., S.K., M.M., L.R., R.S., N.R. and S.Z.; visualization, N.C., N.R. and S.Z.; supervision, N.R. and S.Z.; project administration, N.C., N.R. and S.Z.; funding acquisition, N.R. and S.Z. All authors have read and agreed to the published version of the manuscript.

Funding

This study received funding from the European Union’s Horizon 2020 research and innovation program under grant agreement nos. 654148 and 871124, Laserlab-Europe, The Swedish Cancer Society, governmental funding for clinical research (ALF), and the Malmö General Hospital Cancer Foundation.

Institutional Review Board Statement

The study was conducted in accordance with the Declaration of Helsinki and approved by the Swedish Ethical Review Authority (dnr 2019-04840).

Informed Consent Statement

Informed consent was obtained from all subjects involved in the study.

Data Availability Statement

The data supporting this study’s findings are available from the corresponding author upon reasonable request.

Acknowledgments

We thank Helena Erixon, the research nurse, for her efforts in the patient-recruitment process.

Conflicts of Interest

The authors declare no conflict of interest.

References

  1. Fakhri, N.; Chad, M.A.; Lahkim, M.; Houari, A.; Dehbi, H.; Belmouden, A.; El Kadmiri, N. Risk factors for breast cancer in women: An update review. Med. Oncol. 2022, 39, 197. [Google Scholar] [CrossRef]
  2. Sung, H.; Ferlay, J.; Siegel, R.L.; Laversanne, M.; Soerjomataram, I.; Jemal, A.; Bray, F. Global Cancer Statistics 2020: GLOBOCAN Estimates of Incidence and Mortality Worldwide for 36 Cancers in 185 Countries. CA Cancer J. Clin. 2021, 71, 209–249. [Google Scholar] [CrossRef]
  3. Olle Bergman, L.F.; Hont, G.; Johansson, E.; Ljungman, P. Cancer i Siffror 2018. Socialsyrelsen. 2018. Available online: https://www.socialstyrelsen.se/globalassets/sharepoint-dokument/artikelkatalog/statistik/2018-6-10.pdf (accessed on 5 January 2022).
  4. Segnan, N.; Minozzi, S.; Ponti, A.; Bellisario, C.; Balduzzi, S.; González-Lorenzo, M.; Gianola, S.; Armaroli, P. Estimate of false-positive breast cancer diagnoses from accuracy studies: A systematic review. J. Clin. Pathol. 2017, 70, 282–294. [Google Scholar] [CrossRef] [PubMed]
  5. Taroni, P.; Quarto, G.; Pifferi, A.; Abbate, F.; Balestreri, N.; Menna, S.; Cassano, E.; Cubeddu, R. Breast tissue composition and its dependence on demographic risk factors for breast cancer: Non-invasive assessment by time domain diffuse optical spectroscopy. PLoS ONE 2015, 10, e0128941. [Google Scholar] [CrossRef] [PubMed]
  6. Steinberg, I.; Huland, D.M.; Vermesh, O.; Frostig, H.E.; Tummers, W.S.; Gambhir, S.S. Photoacoustic clinical imaging. Photoacoustics 2019, 14, 77–98. [Google Scholar] [CrossRef] [PubMed]
  7. Evers, D.J.; Nachabe, R.; Peeters, M.-J.V.; van der Hage, J.A.; Oldenburg, H.S.; Rutgers, E.J.; Lucassen, G.W.; Hendriks, B.H.W.; Wesseling, J.; Ruers, T.J.M. Diffuse reflectance spectroscopy: Towards clinical application in breast cancer. Breast Cancer Res. Treat. 2012, 137, 155–165. [Google Scholar] [CrossRef]
  8. Shalaby, N.; Al-Ebraheem, A.; Le, D.; Cornacchi, S.; Fang, Q.; Farrell, T.; Lovrics, P.; Gohla, G.; Reid, S.; Hodgson, N.; et al. Time-resolved fluorescence (TRF) and diffuse reflectance spectroscopy (DRS) for margin analysis in breast cancer. Lasers Surg. Med. 2018, 50, 236–245. [Google Scholar] [CrossRef]
  9. de Boer, L.L.; Hendriks, B.H.W.; van Duijnhoven, F.; Peeters-Baas, M.-J.T.F.D.V.; Van de Vijver, K.; Loo, C.E.; Jóźwiak, K.; Sterenborg, H.J.C.M.; Ruers, T.J.M. Using DRS during breast conserving surgery: Identifying robust optical parameters and influence of inter-patient variation. Biomed. Opt. Express 2016, 7, 5188–5200. [Google Scholar] [CrossRef]
  10. de Boer, L.L.; Molenkamp, B.G.; Bydlon, T.M.; Hendriks, B.H.W.; Wesseling, J.; Sterenborg, H.J.C.M.; Ruers, T.J.M. Fat/water ratios measured with diffuse reflectance spectroscopy to detect breast tumor boundaries. Breast Cancer Res. Treat. 2015, 152, 509–518. [Google Scholar] [CrossRef]
  11. Kennedy, S.; Geradts, J.; Bydlon, T.; Brown, J.Q.; Gallagher, J.; Junker, M.; Barry, W.; Ramanujam, N.; Wilke, L. Optical breast cancer margin assessment: An observational study of the effects of tissue heterogeneity on optical contrast. Breast Cancer Res. 2010, 12, R91. [Google Scholar] [CrossRef]
  12. Taroni, P.; Paganoni, A.M.; Ieva, F.; Pifferi, A.; Quarto, G.; Abbate, F.; Cassano, E.; Cubeddu, R. Non-invasive optical estimate of tissue composition to differentiate malignant from benign breast lesions: A pilot study. Sci. Rep. 2017, 7, 40683. [Google Scholar] [CrossRef] [PubMed]
  13. Zhu, C.; Palmer, G.M.; Breslin, T.M.; Harter, J.M.; Ramanujam, N. Diagnosis of breast cancer using fluorescence and diffuse reflectance spectroscopy: A Monte-Carlo-model-based approach. J. Biomed. Opt. 2008, 13, 034015. [Google Scholar] [CrossRef] [PubMed]
  14. Nachabé, R.; Hendriks, B.H.W.; Desjardins, A.E.; van der Voort, M.; van der Mark, M.B.; Sterenborg, H.J.C.M. Estimation of lipid and water concentrations in scattering media with diffuse optical spectroscopy from 900 to 1600 nm. J. Biomed. Opt. 2010, 15, 037015. [Google Scholar] [CrossRef]
  15. Prabitha, V.G.; Suchetha, S.; Jayanthi, J.L.; Baiju, K.V.; Rema, P.; Anuraj, K.; Mathews, A.; Sebastian, P.; Subhash, N. Detection of cervical lesions by multivariate analysis of diffuse reflectance spectra: A clinical study. Lasers Med. Sci. 2016, 31, 67–75. [Google Scholar] [CrossRef] [PubMed]
  16. Reistad, N.; Sturesson, C. Distinguishing tumor from healthy tissue in human liver ex vivo using machine learning and multivariate analysis of diffuse reflectance spectra. J. Biophotonics 2022, 15, e202200140. [Google Scholar] [CrossRef]
  17. Reistad, N.; Nilsson, J.H.; Bergenfeldt, M.; Rissler, P.; Sturesson, C. Intraoperative liver steatosis characterization using diffuse reflectance spectroscopy. HPB 2019, 21, 175–180. [Google Scholar] [CrossRef]
  18. Dahlstrand, U.; Sheikh, R.; Nguyen, C.D.; Hult, J.; Reistad, N.; Malmsjö, M. Identification of tumor margins using diffuse reflectance spectroscopy with an extended-wavelength spectrum in a porcine model. Ski. Res. Technol. 2018, 24, 667–671. [Google Scholar] [CrossRef]
  19. Bunke, J.; Sheikh, R.; Reistad, N.; Malmsjö, M. Extended-wavelength diffuse reflectance spectroscopy for a comprehensive view of blood perfusion and tissue response in human forearm skin. Microvasc. Res. 2019, 124, 1–5. [Google Scholar] [CrossRef]
  20. World Medical Association. World Medical Association Declaration of Helsinki: Ethical principles for medical research involving human subjects. J. Am. Coll. Dent. 2014, 81, 14–18. [Google Scholar]
  21. McClatchy, D.M., 3rd; Krishnaswamy, V.; Kanick, S.C.; Elliott, J.T.; Wells, W.A.; Barth, R.J.; Paulsen, K.D.; Pogue, B.W. Molecular dyes used for surgical specimen margin orientation allow for intraoperative optical assessment during breast conserving surgery. J. Biomed. Opt. 2015, 20, 040504. [Google Scholar] [CrossRef]
  22. Sickles, E.; D’Orsi, C.J.; Bassett, L.W. ACR BI-RADS® Mammography. In ACR BI-RADS® Atlas, Breast Imaging Reporting and Data System, 5th ed.; American College of Radiology: Reston, VA, USA, 2013. [Google Scholar]
  23. Hoon Tan, P.; Ellis, I.; Allison, K.; Brogi, E.; Fox, S.B.; Lakhani, S.; Lazar, A.J.; Morris, E.A.; Sahin, A.; Salgado, R.; et al. The 2019 World Health Organization classification of tumours of the breast. Histopathology 2020, 77, 181–185. [Google Scholar] [CrossRef] [PubMed]
  24. Roggan, A.; Friebel, M.; Dörschel, K.; Hahn, A.; Müller, G. Optical Properties of Circulating Human Blood in the Wavelength Range 400–2500 nm. J. Biomed. Opt. 1999, 4, 36–46. [Google Scholar] [CrossRef] [PubMed]
  25. Heijblom, M.; Piras, D.; van den Engh, F.M.; Van Der Schaaf, M.; Klaase, J.M.; Steenbergen, W.; Manohar, S. The state of the art in breast imaging using the Twente Photoacoustic Mammoscope: Results from 31 measurements on malignancies. Eur. Radiol. 2016, 26, 3874–3887. [Google Scholar] [CrossRef] [PubMed]
  26. Heijblom, M.; Piras, D.; Xia, W.; van Hespen, J.C.G.; Klaase, J.M.; van den Engh, F.M.; van Leeuwen, T.G.; Steenbergen, W.; Manohar, S. Visualizing breast cancer using the Twente photoacoustic mammoscope: What do we learn from twelve new patient measurements? Opt. Express 2012, 20, 11582–11597. [Google Scholar] [CrossRef] [PubMed]
  27. Randeberg, L.L. Diagnostic Applications of Diffuse Reflectance Spectroscopy 2005. Ph.D. Thesis, Norwegian University of Science and Technology, Trondheim, Norway, 2005. [Google Scholar]
Figure 1. DRS instrumentation. (a) DRS probe (silver) attached to a probe holder (black). (b) The common leg consists of a central optical fibre connected to a light source and spectrometers. NIR, near-infrared spectrum; VIS, visible spectrum.
Diagnostics 13 03076 g001
Figure 2. (a) Photograph showing the DRS probe during measurements on a ~5 mm thick partial mastectomy slice. (b) Mammography image of a partial mastectomy specimen showing a malignant tumour (orange circle) and adjacent healthy tissue (purple circle). (c) Pre-operative mammography in mediolateral oblique view showing the malignant lesion, which is marked with an orange circle.
Diagnostics 13 03076 g002
Figure 3. Diffuse reflectance spectra for all measurements from malignant (orange) and adjacent healthy (purple) breast tissue. Solid lines depict the mean intensities, and grey shaded areas represent ± 1 SD. A thin line showing healthy (purple) and malignant (orange) breast tissue has been added into the respective diagrams for comparison purposes.
Diagnostics 13 03076 g003
Figure 4. Score plots of two diagnostic parameters (first and second principal components) based on LDA (left) and SVM (right), respectively. LDA, linear discriminant analysis; SVM, support vector machine. The sensitivity (SE), specificity (SP), classification rate (CR), and Matthew’s correlation coefficient (MCC) values obtained using the LDA and SVM algorithms are listed in Table 4. A direct comparison can be made between the standard wavelength range of 450–900 nm and the extended-wavelength range of 450–1550 nm, with the latter showing improved values. The ROC curves and their respective AUCs are shown in Figure 5.
Diagnostics 13 03076 g004
Figure 5. Receiver operating characteristic (ROC) obtained using LDA and SVM for the two wavelength (λ) regions, 450–900 nm (dark blue and dark pink) and 450–1550 nm (blue and pink). LDA, linear discriminant analysis; SVM, support vector machine; AUC, area under the curve.
Diagnostics 13 03076 g005
Table 1. The demographics, pre-operative radiological imaging features, and histopathological results for each subject.
Patient nrAgeBMIHRTBreast Density,
BI-RADS 5th Edi
Mammogram (MAM) Tumour Appearance, mmMAM Size, mmUS Tumour
Appearance, mm
US Size, mmBreast SpecimenHistopathological
Diagnosis
1 68 20.3 No B Spiculated 10 Ill-defined,
diffuse, hypoechoic
10 M ILC
2 84 30.5 No D Partly ill-defined 16 Ill-defined,
diffuse, hypoechoic
13 M IDC
3 70 29.8 Yes A Indistinct,
lobulated elongated
25 Hypoechoic 25 PM IPC
4 54 30.8 No A Spiculated 11 Spiculated 10 PM IDC
5 56 29.4 No B Ill-defined, diffuse 15 Ill-defined,
diffuse, hypoechoic
15 PM IDC
6 66 28.7 Yes B Ill-defined, diffuse 15 Ill-defined,
diffuse, hypoechoic
11 PM IDC
7 52 27.9 No C Spiculated, multifocal 15 + 10Multifocal, ill-defined
diffuse, hypoechoic
20 PM IDC
8 71 34.6 No A Spiculated 17 Spiculated, hypoechoic 15 PM ILC
9 77 18.5 No D Ill-defined, diffuse *Ill-defined,
diffuse, hypoechoic
30 PM IDC
10 84 29.5 No A Spiculated 18 Hypoechoic 14 PM ILC
11 57 34.3 No C Multifocal 45 Multifocal, ill-defined
diffuse, hypoechoic
36 M ILC
12 52 29.8 No B Spiculated 18 Ill-defined,
diffuse, hypoechoic
15 PM IDC
13 69 26.6 No A Ill-defined, diffuse 10 Ill-defined,
diffuse, hypoechoic
10 M TC
14 71 29.0 No B Ill-defined, diffuse 10 Ill-defined,
diffuse, hypoechoic
8 PM TC
15 73 25.1 No C Partly ill-defined 40 Ill-defined,
diffuse, hypoechoic
40 PM ILC
16 57 18.3 No D Partly ill-defined 12 Ill-defined,
diffuse, hypoechoic
12 PM IDC
17 56 32.0 No A Calcification 20 Normal * PM DCIS
18 61 26.0 No C Spiculated 12 Spiculated, hypoechoic 12 PM ILC
19 72 33.5 No C Distortion 50 Ill-defined,
diffuse, hypoechoic
60 M ILC
20 70 23.5 No B Spiculated 12 Ill-defined,
diffuse, hypoechoic
12 PM IDC
21 56 20.5 No D Distortion 12 Ill-defined,
diffuse, hypoechoic
8 PM IDC
22 61 21.0 No C Partly ill-defined 17 Ill-defined,
diffuse, hypoechoic
17 PM IDC
23 74 26.0No B Distortion 10 Ill-defined,
diffuse, hypoechoic
10 PM ILC
* Difficult-to-define borders, not measurable. BMI, body mass index; HRT, hormone replacement therapy; MAM, mammogram; US, ultrasound; OP, operation; M, mastectomy; PM, partial mastectomy; ILC, invasive lobular carcinoma; IDC, invasive ductal carcinoma; IPC, invasive papillary carcinoma; TC, tubular carcinoma; DCIS, ductal carcinoma in situ.
Table 2. Summary of the pre-operative radiological imaging features of all participants (N = 23).
Breast Density, BI-RADS 5th Edi (n, %)
A6 (26.1)
B7 (30.4)
C6 (26.1)
D4 (17.4)
Ultrasound tumour size (mm)
Minimum10
Maximum60
Mean *18.3
Mammography tumour size (mm)
Minimum10
Maximum50
Mean *18.6
* The mean is based on 22 participants due to one tumour being non-measurable in respective imaging modality.
Table 3. Number of measurement sites and generated optical measurements.
TissueNumber of Measurement Sites
(n = 207)
Number of Optical Measurements
(n = 1035)
Malignant101505
Healthy106530
Table 4. Summary of the machine learning outcome. The LDA and SVM diagnostic algorithms are represented at two wavelength ranges, the standard range between 450 and 900 nm and the extended-wavelength range between 450 and 1550 nm.
Diagnostic AlgorithmWavelength RangesSE SP CR MCC
Nm(%)
LDA450–9003370523
450–155092909182
SVM450–90040715611
450–155094919285
LDA, linear discriminant analysis; SVM, support vector machine; SE, sensitivity; SP, specificity; CR, classification rate; MCC, Matthew’s correlation coefficient.
Disclaimer/Publisher’s Note: The statements, opinions and data contained in all publications are solely those of the individual author(s) and contributor(s) and not of MDPI and/or the editor(s). MDPI and/or the editor(s) disclaim responsibility for any injury to people or property resulting from any ideas, methods, instructions or products referred to in the content.

