
Digital Competence Analysis of University Students Using Latent Classes
by
 , , and
Carmen Gloria Burgos-Videla
1,* ,
,
Wilson Andrés Castillo Rojas
1 ,
,
Eloy López Meneses
2 and
and
Javiera Martínez
3 1
Research Institute in Social Sciences and Education, University of Atacama, Copiapó 1530000, Chile
2
Department of Education and Social Psychology, Pablo de Olavide University, 41013 Sevilla, Spain
3
Asistente Instituto de Investigación en Ciencias Sociales y Educación, Universidad de Atacama, Copiapó 1530000, Chile
*
Author to whom correspondence should be addressed.
Educ. Sci. 2021, 11(8), 385; https://doi.org/10.3390/educsci11080385
Submission received: 3 June 2021
/
Revised: 5 July 2021
/
Accepted: 14 July 2021
/
Published: 27 July 2021
(This article belongs to the Special Issue Digital Ecosystems in Higher Education)
Abstract
:The objective of this study is to characterize Latent Classes emerging from the analysis of the level of digital competences, use and consumption of applications and/or services through the Internet. For this purpose, the results of the survey Basic Digital Competences (Competencias Básicas Digitales-COBADI®) applied to university students, with more than 60 categorical variables, were considered. A total of 4762 undergraduate and graduate students from five Spanish universities participated in this survey: Complutense University of Madrid (UCM), Pablo de Olavide University (UPO), Almeria University (UAL), National University of Distance Education (UNED) and Rey Juan Carlos University (URJC). The application of the questionnaire was done through the Internet, from the Institute for Research in Social Sciences and Education of University of Atacama—Chile. The methodology used is mixed, because the questions of the questionnaire provide qualitative information that can be interpreted and elaborated from the results. It is also quantitative because basic statistical techniques are used for the exploratory analysis of the data, and later Latent Class Analysis (LCA), to complement the description of the data set and the variables considered in the study, thus allowing us to group the classes of variables that do not appear explicitly in the set of observed variables, but which nevertheless affect them. The results of the study show that regardless of the gender and age range of the participants, there are four clearly differentiated groups or classes in the use and consumption of ICTs in different ways for their activities, both personal and academic, which allows for identifying different developments of digital competences. This study allows establishing a baseline in order to be able to elaborate later, in the development of the digital competences currently needed, which should be developed by university students.
1. Introduction
Higher education is undergoing constant social and cultural transformations. Each time a different model appears to face the problems that occur inside the classroom or in the field of educational management, the reception and incorporation of such models to the teaching task is noticed. Currently, and due to scientific, technological and societal advances, we are in the era of technology, with high standards of knowledge and skills that must be acquired and shown in the performance of any profession.
It has been demonstrated globally that the development of digital competences is useful for students, and these are useful for solving problems, particularly complex ones. Currently, it has become essential to teach and instruct in order to form individuals that manage knowledge [1], that are competent, skilled, creative, and critical; that use skills, solve problems, and thus demonstrate the learning obtained. These ideas are reflected in national and international educational agendas [2,3,4]. They prioritize student performance; which is clearly reflected in the acquisition of competences [5]. Taking into consideration that in this decade, an approach oriented to the development of complex skills prevails in modern society [6], it is relevant to prepare students to be able to develop and apply thinking through critical, creative, and divergent reasoning, and to know the path of logic, deduction, induction, and the scientific method in order to solve problems [7,8].
Given this dynamism, educational institutions must restructure their pedagogical practices and processes to respond to the impact that these advances have on their system. In some way, the implementation of new digital tools contributes to the preparation of students committed to their professional area, also to the formation of competent individuals able to face situations with innovative solutions; and willing to solve problems. This is part of the essential tasks that higher education institutions must take into account [2,3].
Under this context, the present research work aims to obtain a characterization and description of groups or classes, establishing the level of development of digital competences in each class, in relation to the consumption and use of ICTs by students within a university context of the 21st century. Specifically, the aim is to contrast and differentiate these digital competences in the daily use of ICTs, in all those Internet services that students use for leisure, communication, interaction, and academic work activities, which allow them to develop competences. For this, the study focuses on the five blocks of the COBADI® instrument, which is applied to 4762 students of Spanish universities.
In the analysis, statistical methods are initially used for the exploratory analysis of the data, followed by the LCA technique. The latter, is used to identify and interpret the groups according to their different levels of development of digital skills. This study will allow for establishing a baseline for a subsequent deeper analysis of the digital competences that students manage to develop, with the necessary technology to cope with their activities, both personal and academic, and the regular habit of using technologies in the teaching-learning process. The article is structured in five sections. Section 2 presents the conceptual framework necessary to understand the study, where two key concepts are defined: digital competences and latent class analysis. Section 3 presents the work methodology, population, and sample used, as well as the description of the instrument applied, which in this case is COBADI®. Section 4 provides a detailed analysis of the results of the study. Finally, Section 5 presents the final conclusions of the study, as well as proposals for future work.
2. Conceptual Framework
The definition of competence varies according to different views of the authors and the context in which it is defined; its conception has slightly varied depending on the field of study over the years [9,10,11,12,13,14,15,16,17]. Considering the established by different authors in the educational field, the definition of competence can be understood as a relationship among the actor or target audience, knowledge, and skills. In this relationship it is understood that the knowledge and skills applied together with the personal characteristics of the individual, are used in a given task, in the effective resolution of situations, and to respond to circumstances from their own context [18].
The competences currently considered as relevant include the so-called “digital competences” as a key element to be developed [19,20,21,22]. Digital competences can be understood as the ability to use technological tools effectively to improve different areas of the life of individuals, considering the critical commitment and responsibility use to learn, to work, and to participate in society, with perspectives of empowerment [20,21]. It is important to note that digital competences are not sufficient for professional and educational performance, but attitudinal aspects must be taken into consideration for their effective use [23].
In an educational context, digital competence is related to the transfer of information and creation of innovation spaces [24]. Virtual spaces have become a space for dialogic exchange and participation for meaningful learning, making a change in the current pedagogical scenario [20,21,25]. In these exchanges and the ease of access to information, spaces of autonomy are generated, thus allowing the teaching–learning process to be much more student-centered, changing the traditional learning process that is still implemented in different institutions. At the same time, these changes in educational approaches generate the need to prepare and instruct the individuals participating in the educational processes, in order to form professionals with the necessary skills and abilities to develop in the current revolution of the knowledge society [19]. The use of technological tools has become practically an obligation for the performance and fulfillment of higher education standards. Educational institutions play a fundamental role in promoting their use and achieving their educational goals through these tools, contributing to scientific and social growth [26].
Competences have become a topic of interest and concern in the world, and in recent times, it has been contextualized in the use of the competency-based curriculum approach. One of the possible causes of this concern may be the unsatisfactory results in international assessments [27].
According to Calle and Lozano [28], the digital literacy process involves the acquisition of certain competences that facilitate the construction of an individual that is capable of interacting through ICTs. One of the OECD reports on the impact of the digital era on people’s well-being points out that technology can have both, a positive and a negative impact on people’s lives [29].
There are organizations that define the standards that best describe the digital competence of teachers [30]; in addition, it is important to note that these standards are used and acknowledged at international level. Digital competences are disaggregated into six competency areas, and these, in the skills, abilities and therefore competences that come to affect the competency areas [31,32]. These are: professional engagement, digital resources, digital pedagogy, assessment and feedback, empowering learners, and facilitating competence. Moreover, the European Digital Competence Framework for Educators (DigCompEdu) describes standards that are divided into teaching profiles that should be developed throughout the professional career. In this manner, each country establishes a reference framework to develop their qualification framework for generic competences and digital competences. In Chile, five dimensions are presented for digital competence: theoretical, management, social, ethical and legal, and pedagogical responsibility and development [33,34].
The 2019 OECD report shows that in Chile, there is a lack of statistics on the use of technology. There is high exposure to risks and low exploitation of opportunities in the use of technology. Internet access is above the OECD average at 87.5%. Thus, Chile is the second country with the second least varied Internet use. Inequality of use is above the OECD average. One of the main disadvantages and risks of the country refer to low digital skills, low use of online education, high level of jobs at risk of automation, and extreme internet use among 15-year-old people (Chile occupies the first place).
From the point of view of university students and their families, there are situations of inequality, in sociocultural terms, and in terms of access to technological tools and materials, which would allow them the access, presence, and adequate management of virtuality. According to UNESCO [35], there is a low level of digital literacy among teachers, students, and families. Although the Internet access gap has been narrowing in recent years, it is still present in the most disadvantaged social groups, in addition to the gap in skills and use of digital tools [36]. According to Garrido [37], with regard to educational inequality in the context of the pandemic, the latent inequalities prior to the health emergency have only been aggravated by remote education. The author indicates that government responses in terms of public policies are still insufficient to support both, students excluded from virtual education and teachers.
Currently, higher education worldwide has been concerned with preparing students with a perspective on achieving curricular objectives with a practical and employment-focused experience, which is why the fulfillment of the graduate profiles determined by university programs must evidence the skills necessary for industry needs and the requirements for accreditation standards [38]. The new skills to be developed have undergone a fast and unforeseen change, which could affect the graduation profiles of students and, in turn, the need for new skills for employability. Given the uncertainty of the new reality, skill expectations will be dynamic and increasingly complex and interdisciplinary [39]. Given this situation, it is crucial to investigate and analyze the development of digital competences in university students. Hence, in accordance to the information collected, the next steps are the processes of continuous improvement and the enhancement of such skills and knowledge. On the other hand, it is important to note that Iberoamerica, and specifically Spain, has similarities with the processes of digital literacy that Latin America should have; however, it is possible to point out that a sustained and fluctuating progress has been experienced and identified with greater evidence in Spain. This does not mean that Chile, part of Latin America, is just beginning, but in comparison to Spain the latter has a greater implementation of blended learning and distance education through MOOC courses, etc.
A second important concept that has direct implications for this study, is the LCA, since it is the technique used for the analysis of the sample data obtained for this research. The LCA was proposed by Lazarsfeld who used the technique as a tool to construct a typology in the analysis of a set of dichotomous variables. Years later, Lazarsfeld and Henry continued using the model to segment the observed data [40]. In this regard, in quantitative analysis, it is necessary to take into account the use of measurement instruments in order to analyze causal variables that are not directly observable, thus incorporating latent constructs, such as attitudes and perceptions, where people respond through a survey of a set of questions, which are manifestations of an implicit latent variable. For this reason, a latent variable is defined as one that is not included among the variables studied, but nevertheless has an important effect on the relationship between these other variables [41].
The LCA corresponds to a statistical technique used for the analysis of categorical data with high dimensionality; it allows identifying a set of mutually exclusive latent classes from a set of observed variables [42]. They are useful to apply to data sets such as: public opinion survey results, voting data, consumer profiles, reliability studies, etc. In general, it is of interest to study the sources of confusion between the observed variables in order to identify and characterize groups of similar cases and to approximate the distribution of observations across variables. This type of analysis is obtained through the use of the LCA technique. A latent class is an unobservable subgroup, which is constructed from related cases among the observed or manifest variables, which are used to estimate the model parameters; thus, it can be seen as a probabilistic classification method that seeks to stratify in a cross-classification table of observed variables by an unobserved or latent categorical variable, which eliminates any confusion among the manifest variables [43].
In other words, the model generated by the LCA is used for the analysis of multivariate categorical data, which allows the establishment of relationships between observed variables, assuming that there is an underlying structure explained by one or more latent variables that generate this relationship. It is through this model that a number of latent classes representing response patterns of a set of manifest variables can be defined, and the probability that an observation belongs to a class can be calculated [44].
3. Methodology and Instruments
The methodology used in this study is mixed, that is, it performs descriptive and quantitative analysis. The stages are mainly based on a data analysis process and include the following:
- Data collection: This stage made it possible to obtain the sample to carry out this work, which was provided by the EDUINNOVAGOGiA® research group (HUM-971).
- Data preparation: At this stage, an exploratory analysis of the data is carried out, in which basic statistics are obtained. Then, we proceed to select the attributes or variables necessary for the analysis of latent classes, as well as to transform some variables to a required domain type. Additionally, cleaning and debugging tasks of spurious and/or missing data are addressed. Data Extraction, Transformation and Loading tools are used in this stage, such as: Data Integration of Pentaho and the R programming language.
- Tool Selection: At this stage, different tools used for latent class analysis were reviewed and tested, such as Latent Gold, MCLUST, PROC LCA of SAS, and the poLCA package of R. Finally, the latter tool was selected mainly because of its free availability and ease of generating latent classes.
- Model generation and evaluation: Preliminary latent class models are obtained and finally, through various graphs, application and analysis of ad hoc metrics (BIC, AIC, and Log-likelihood), the models with the best performance and representativeness of the sample are established.
- Results analysis: We proceed to analyze the results obtained, for which we resort to the observation and comparison of metrics provided by the techniques. Subsequently, the interpretation of latent classes and patterns obtained through the data sample is described.
3.1. COBADI® Instrument
The data are collected through the questionnaire 2.0 University Student Basic Digital Competences (”Competencias Básicas Digitales 2.0 e estudiantes universitarios”—COBADI®, registered trademark at the Spanish Patent and Trademark Office: 2970648). The COBADI® questionnaire was constructed and tested by the research group EDUINNOVAGOGiA® (HUM-971), which is recognized by the Andalusian Plan for Research, Development and Innovation and the Office for the Transfer of Research Results of the Pablo de Olavide University. The questionnaire is divided into five blocks, a general one that collects personal data of the survey participants, as well as data on technology consumption. Then, it has 4 blocks that measure digital competences from different dimensions. The COBADI® instrument and the details of its 5 dimensions can be found at the following address: (https://docs.google.com/spreadsheet/viewform?formkey=dHZhcFk5NUZEN1FDVjItX21XaGpmRnc6MQ#gid=0, accessed on 1 March 2021).
As indicated above, the general block corresponds to data related to the “Consumption and use of ICTs” in social communication and daily activities individually or in groups, composed of 26 items, and is assessed heterogeneously through different scales ranging from 1 to: 2 (yes/no), 3 (not at all/slightly/much), 4, 5, or 6 points, the latter presenting descriptive answers. In this dimension, a number of 10 out of 19 questions with 3 values prevail, and it differs from the others because it tries to establish a baseline to later analyze the digital competences that imply a previous consumption of ICTs.
Block I corresponds to “Competences in knowledge and use of ICTs in social communication and collaborative learning”, composed of 12 items, and is assessed through a Likert scale of 1–4 points, where 1 refers to “I feel completely ineffective to perform what is presented” up to 4, which represents “I feel completely effective”. Additionally, included is the option NS/NC/NA (NS = Doesn’t Know, NC = No Answer, NA = Not Applicable).
Block II, “Competences in the use of ICT for information search and processing”, refers to the self-perception of individual efficacy in the use of ICT tools. Composed of 12 items, also assessed with a Likert scale of 1–4 points, where 1 refers to “I feel completely ineffective to perform what is presented” up to 4, which represents “I feel completely effective”, and the inclusion of the options NS/NC/NA.
Block III, “Interpersonal competences in the use of ICTs in the university context”, evaluates how problems or doubts related to ICTs are solved. Composed of 5 items, in this block the rating scale is different from the previous dimensions, where the option most used by the individual to solve a doubt is the first (1), then the second, and lastly the one least used (4).
Finally, block IV corresponds to “Virtual and social communication tools of the University”, which is composed of 5 items. It is valued with a Likert scale of 1–4 points, where 1 refers to “I feel completely ineffective to perform what is presented” up to 4, which represents “I feel completely effective”, and the options NS/NC/NA are included.
3.2. Population and Sample
The sample used corresponds to a total of 4762 undergraduate and graduate students surveyed from 5 universities in Spain Complutense University of Madrid (UCM), Pablo de Olavide University (UPO), Almeria University (UAL), National University of Distance Education (UNED), and Rey Juan Carlos University (URJC). Of this sample, 81.13% were female and 18.87% were male. In the distribution by gender and its high percentage of women, an aspect which is common in the area of Education and Social Sciences, this does not prevent the development of research using gender as one of the variables of analysis [38].
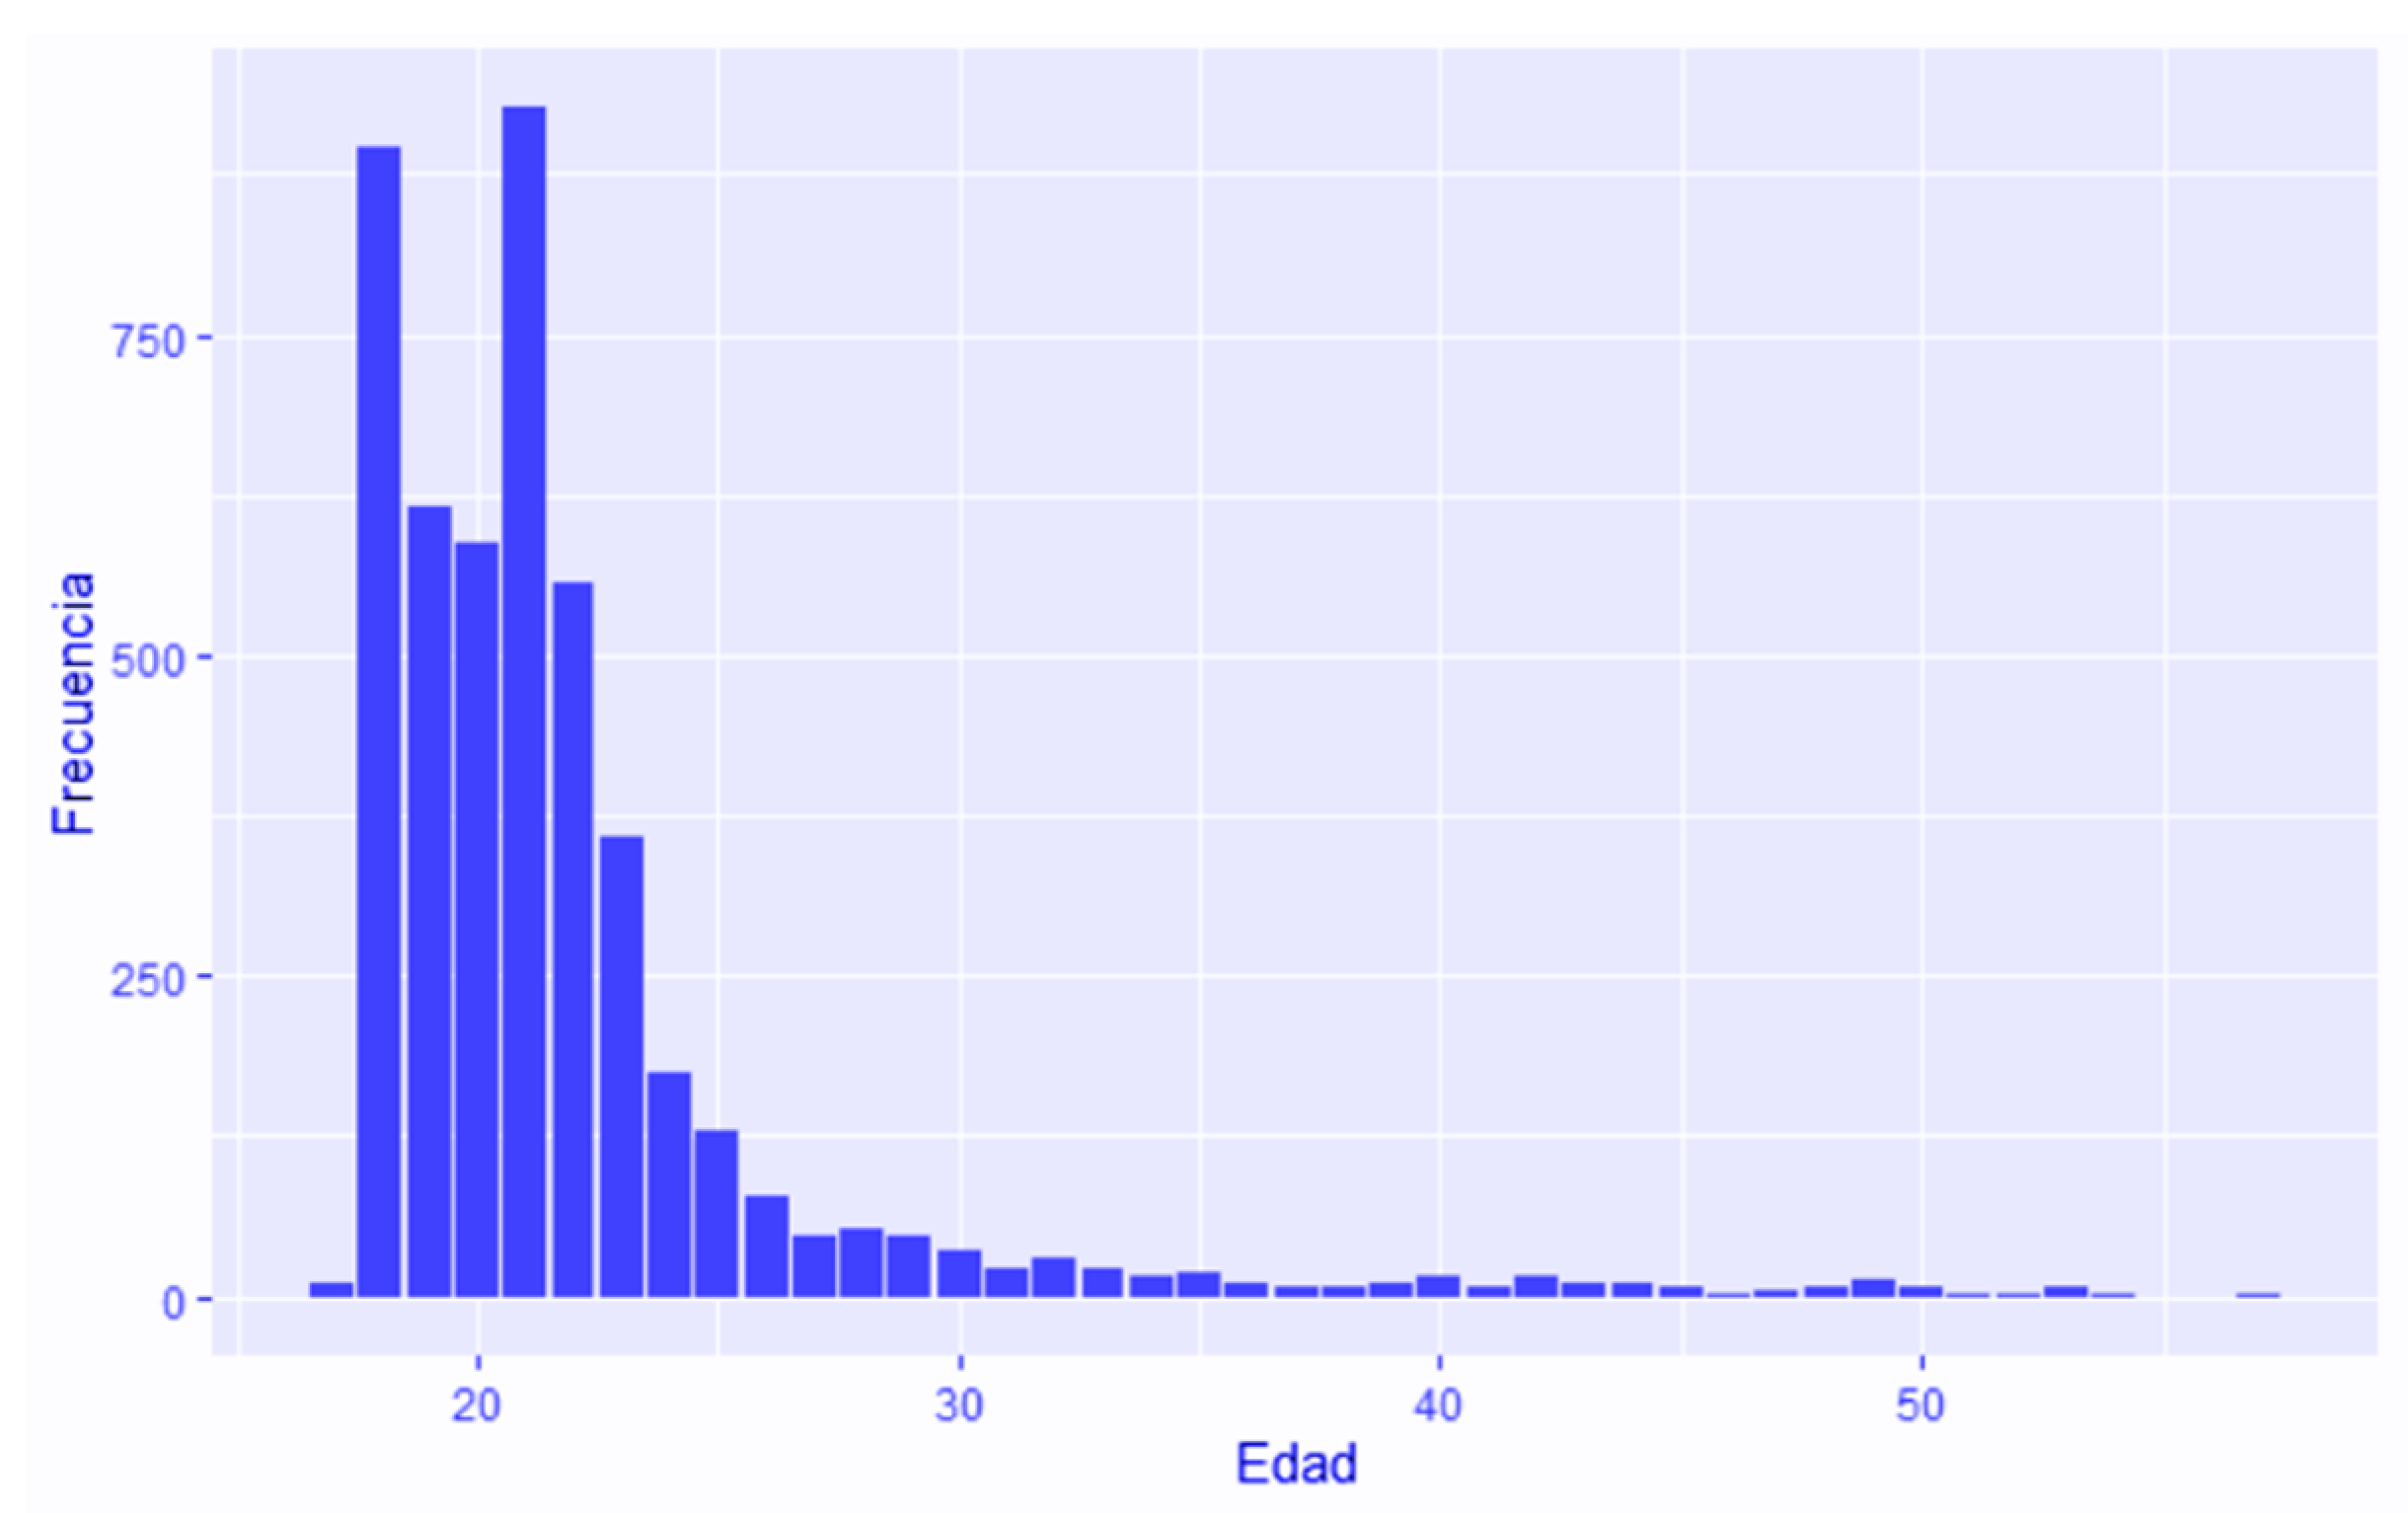
Regarding the distribution of the sample by age, Figure 1 shows that the minimum age is 17 years and the maximum is 57 years. The first quartile is 19 years, the median is 21 years and the third quartile is 22 years. This means that the age range from 17 to 22 years accumulates the largest number of students, about 75% (3591) of the observations. The age range between 23 and 57 years accumulates 25% of the observations.
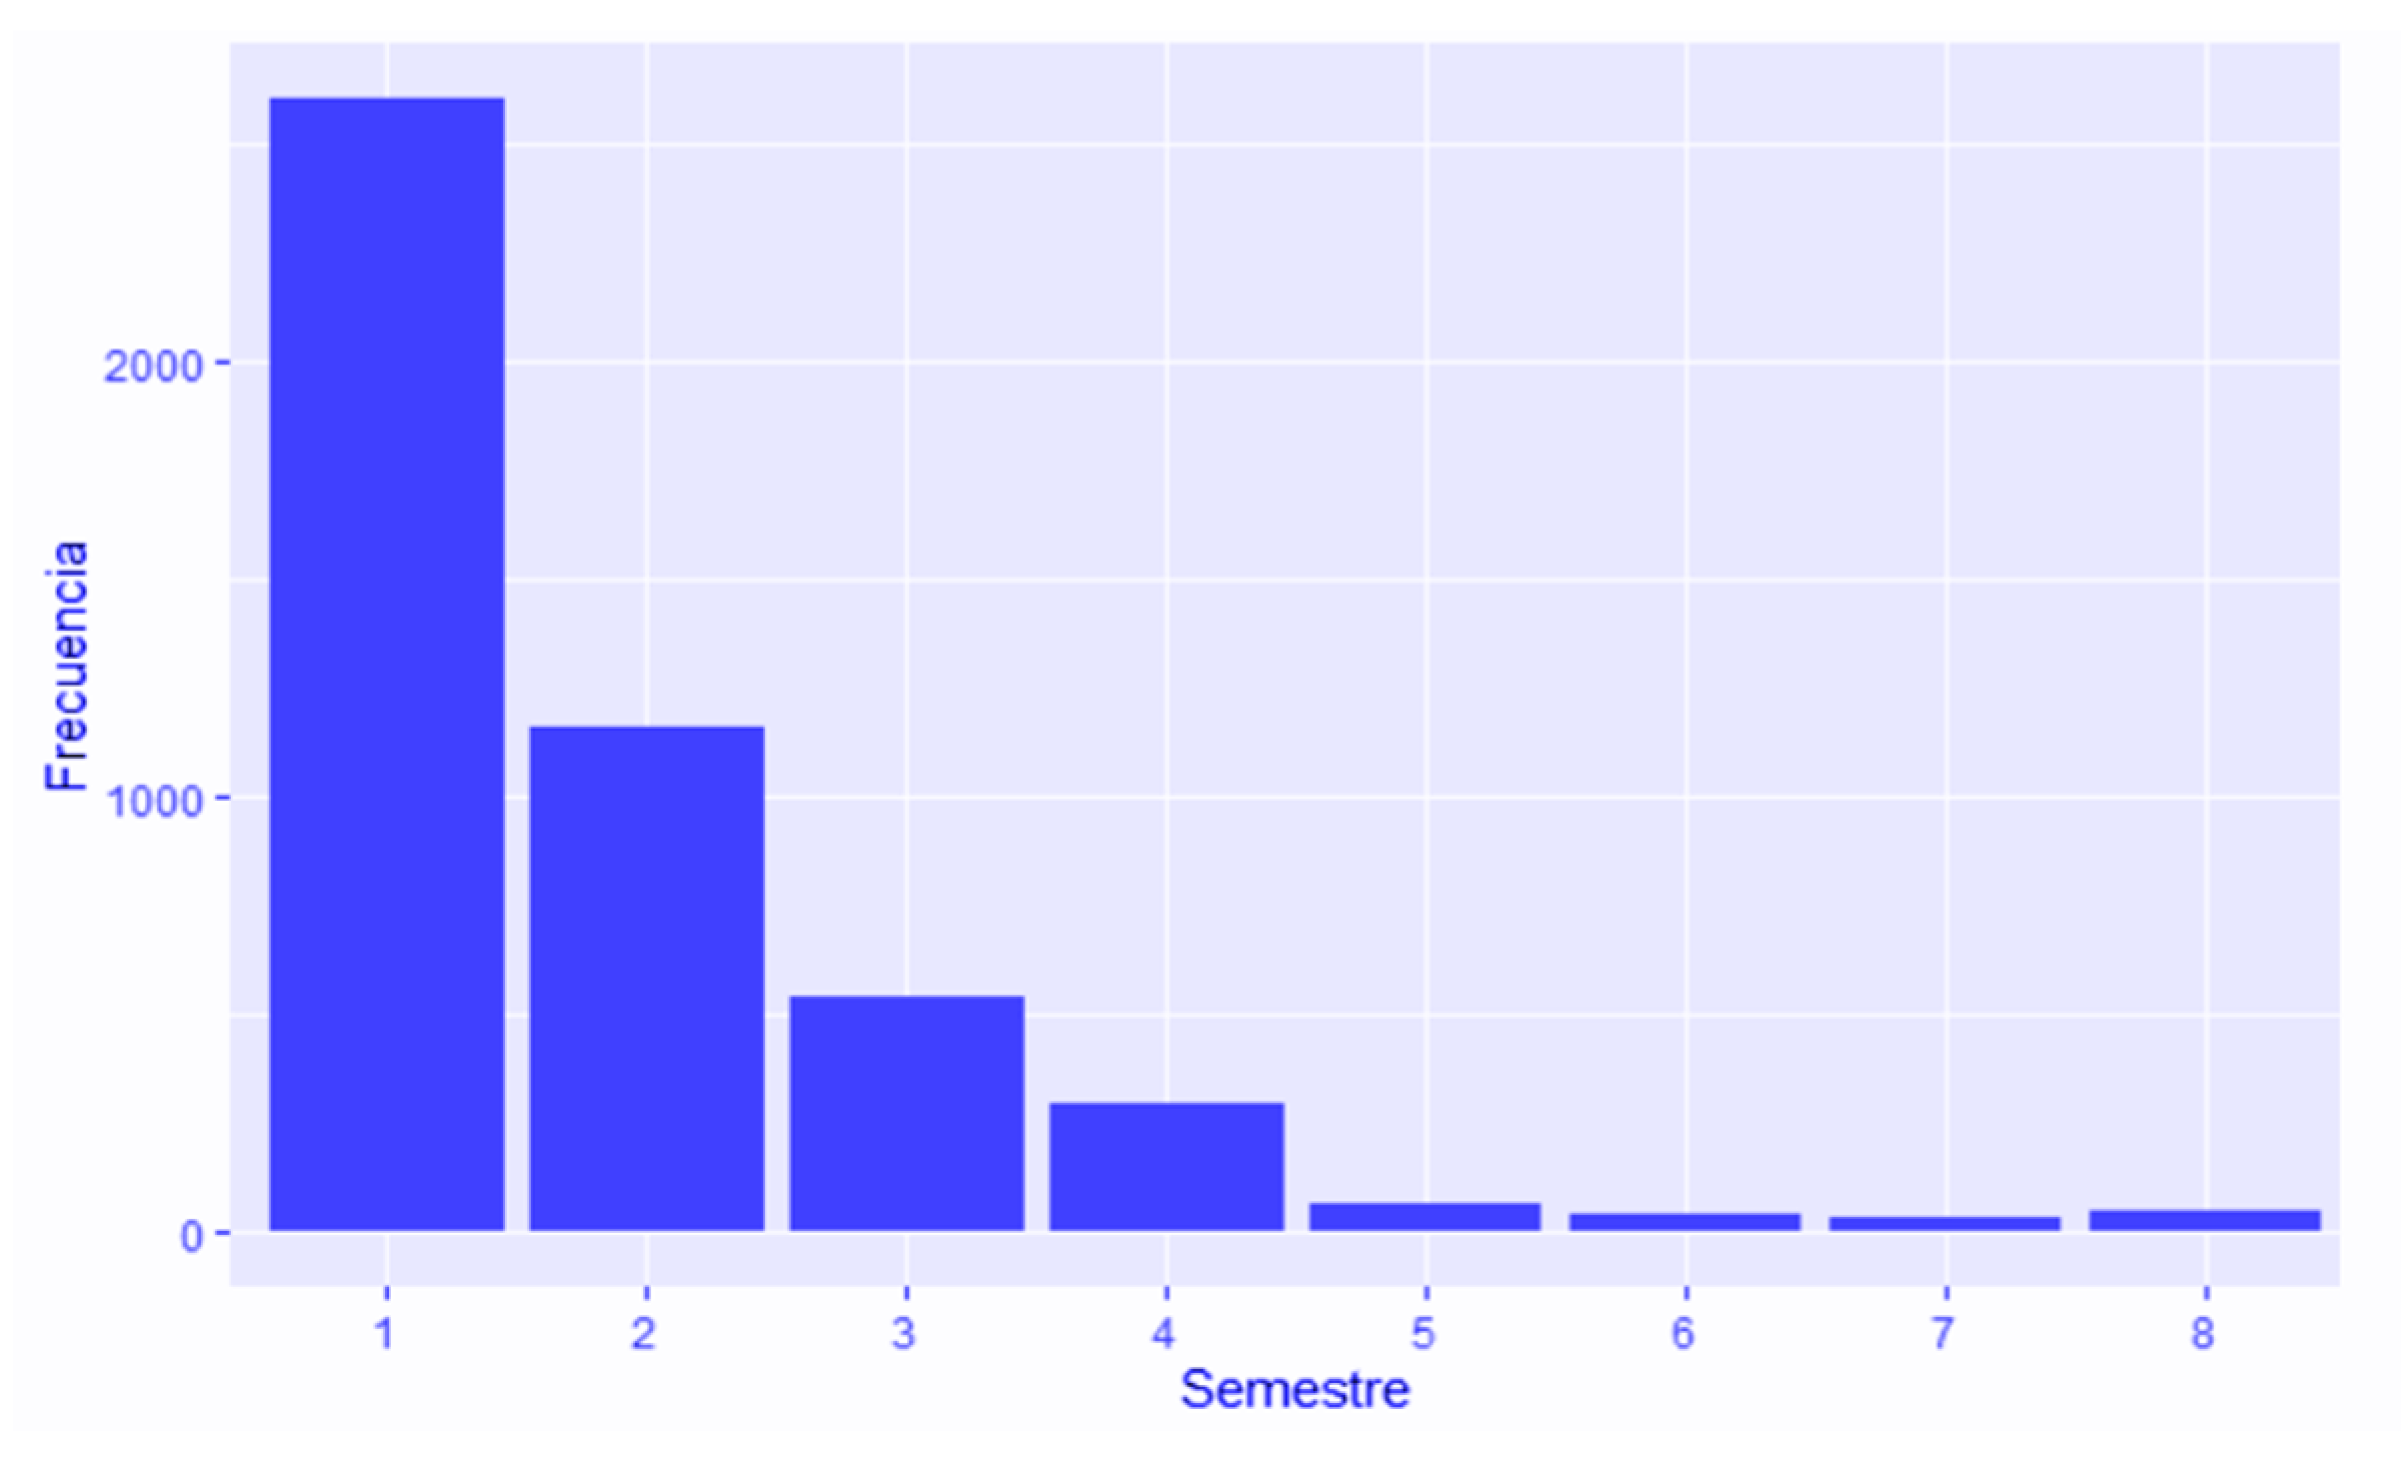
In the distribution by courses shown in Figure 2, students are arranged from the first semester and at most the eighth semester. It can be observed that the first quartile and the median are in the first semester, and the third quartile is in the second semester. With this, we have that about 75% (3760) of the observations are between the first and second semester, or first year of university, while 25% (1200) are between the third and eighth semester of university.
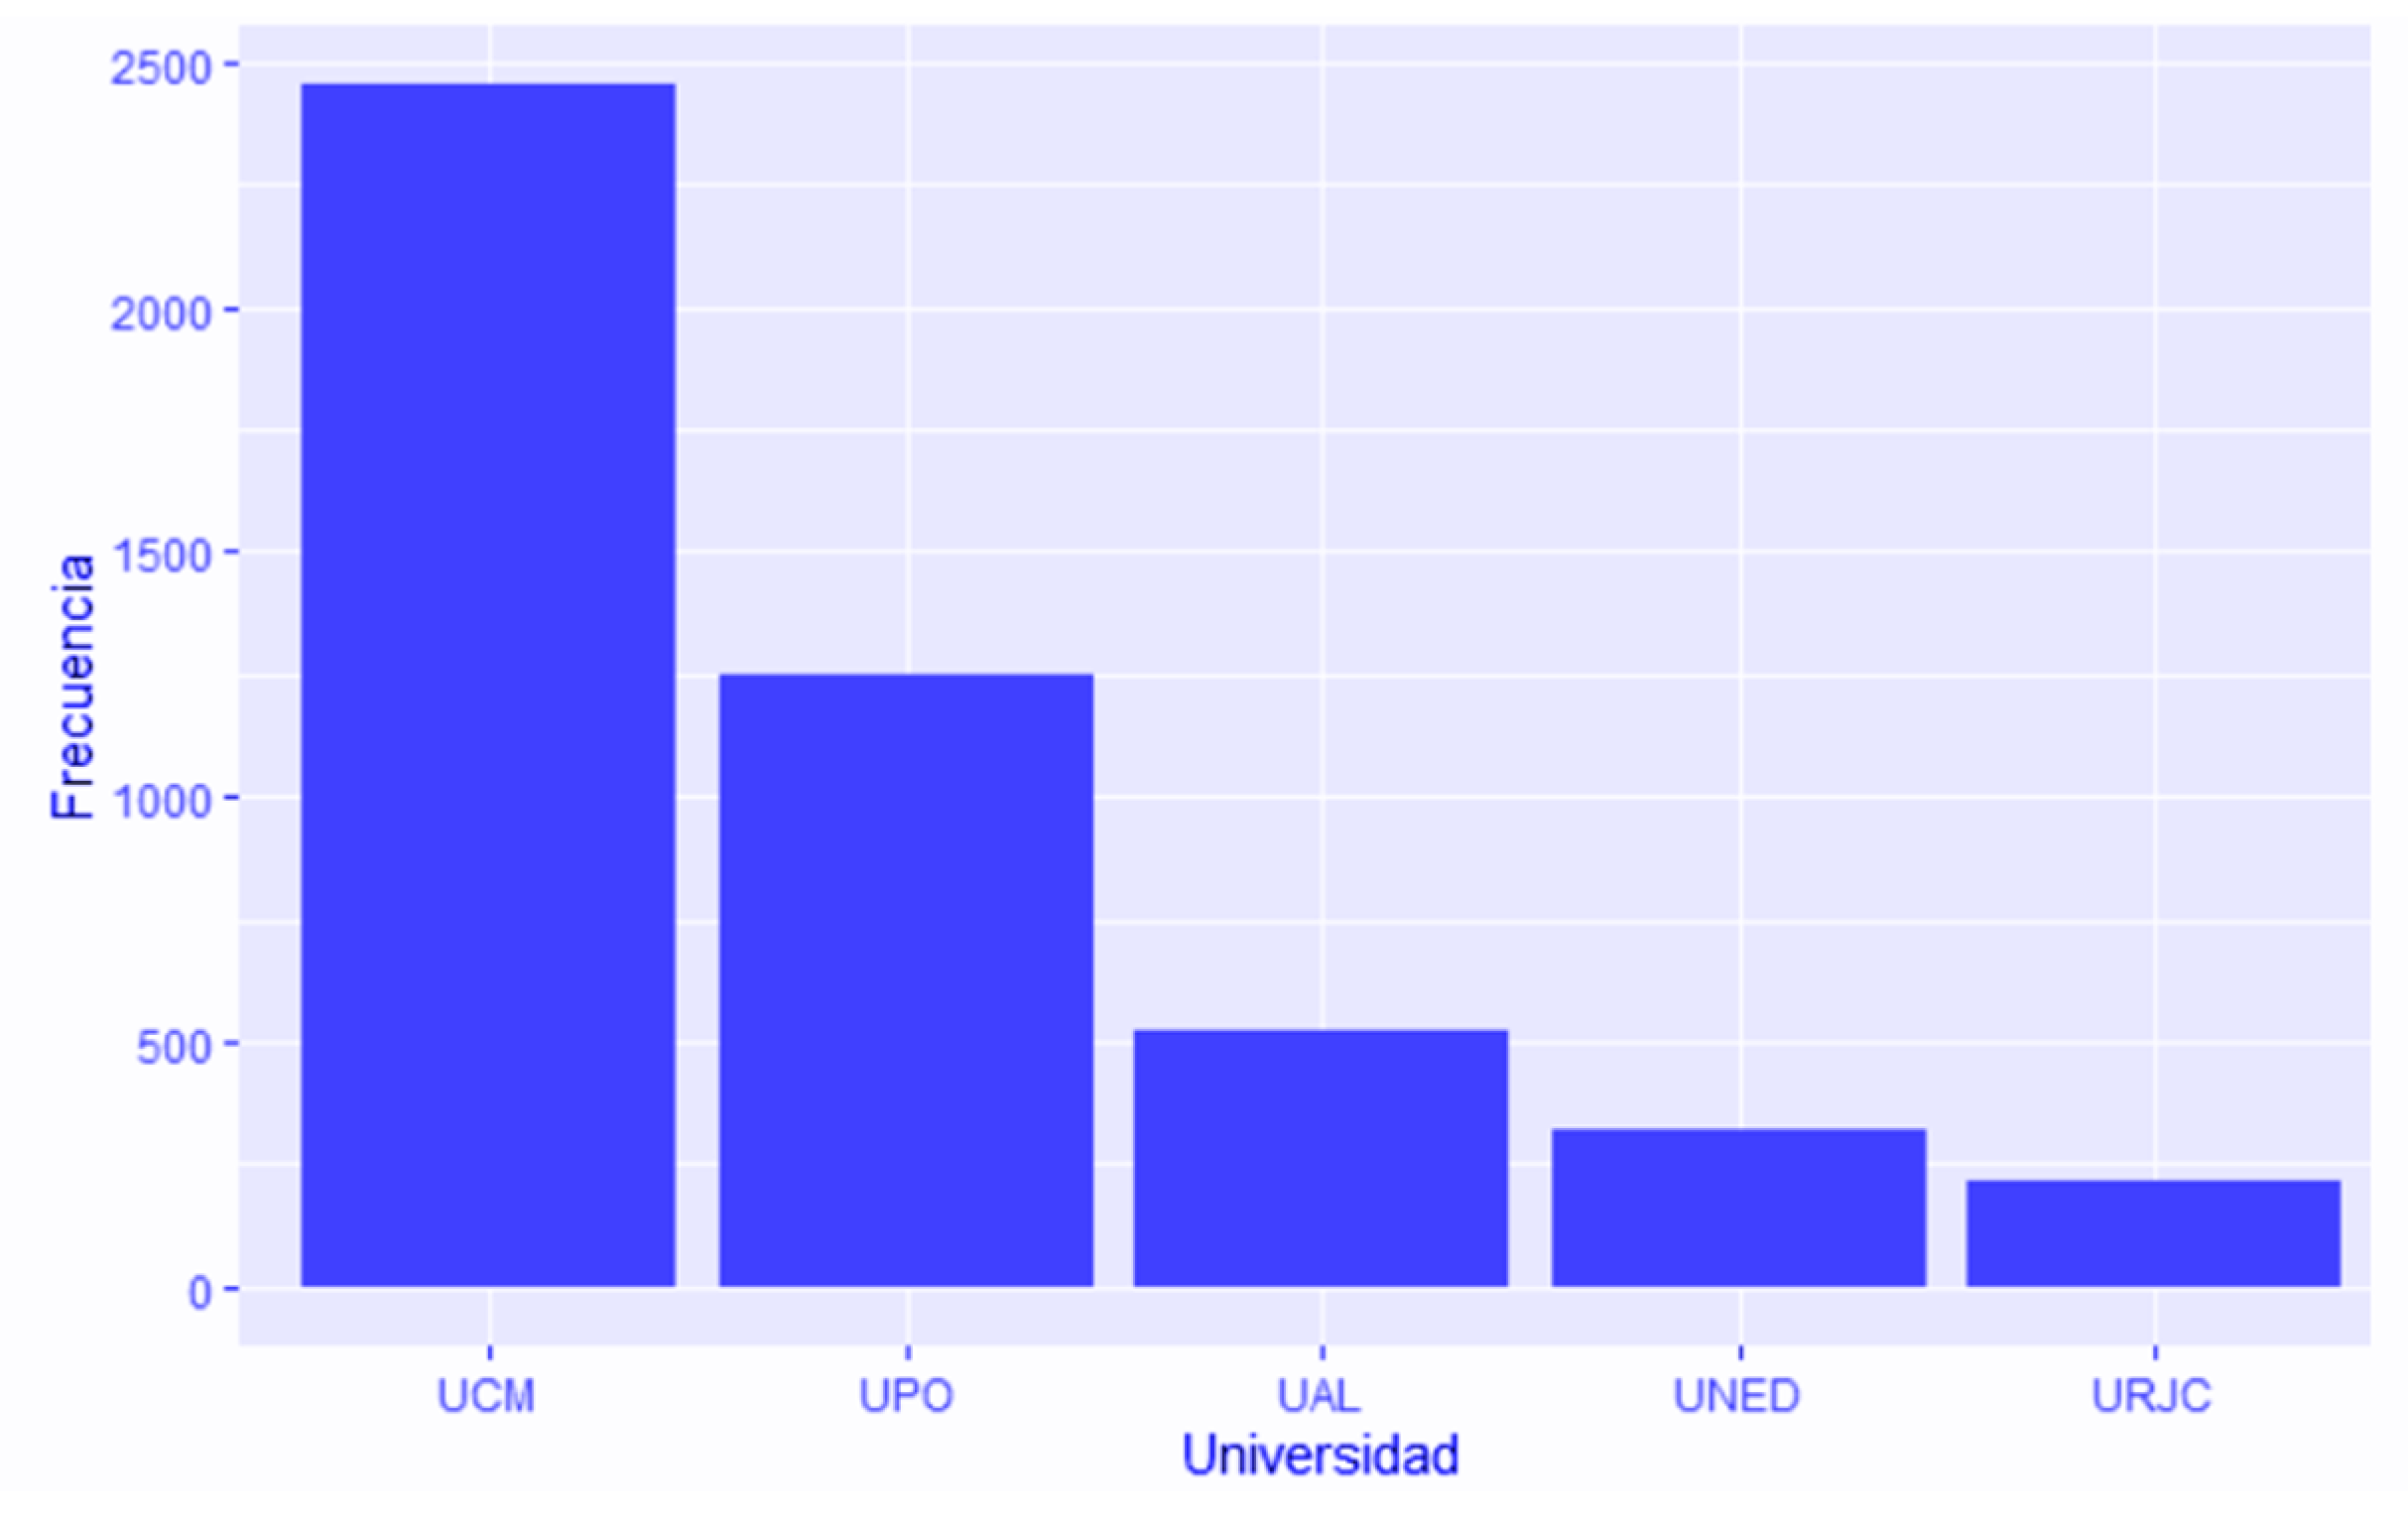
The students surveyed, as indicated above, belong to 5 Spanish universities; and the distribution by university, as shown in Figure 3, is as follows: 2452 from UCM, 1249 from UPO, 525 from UAL, 318 from UNED, and 218 from URJC.
4. Analysis of Results
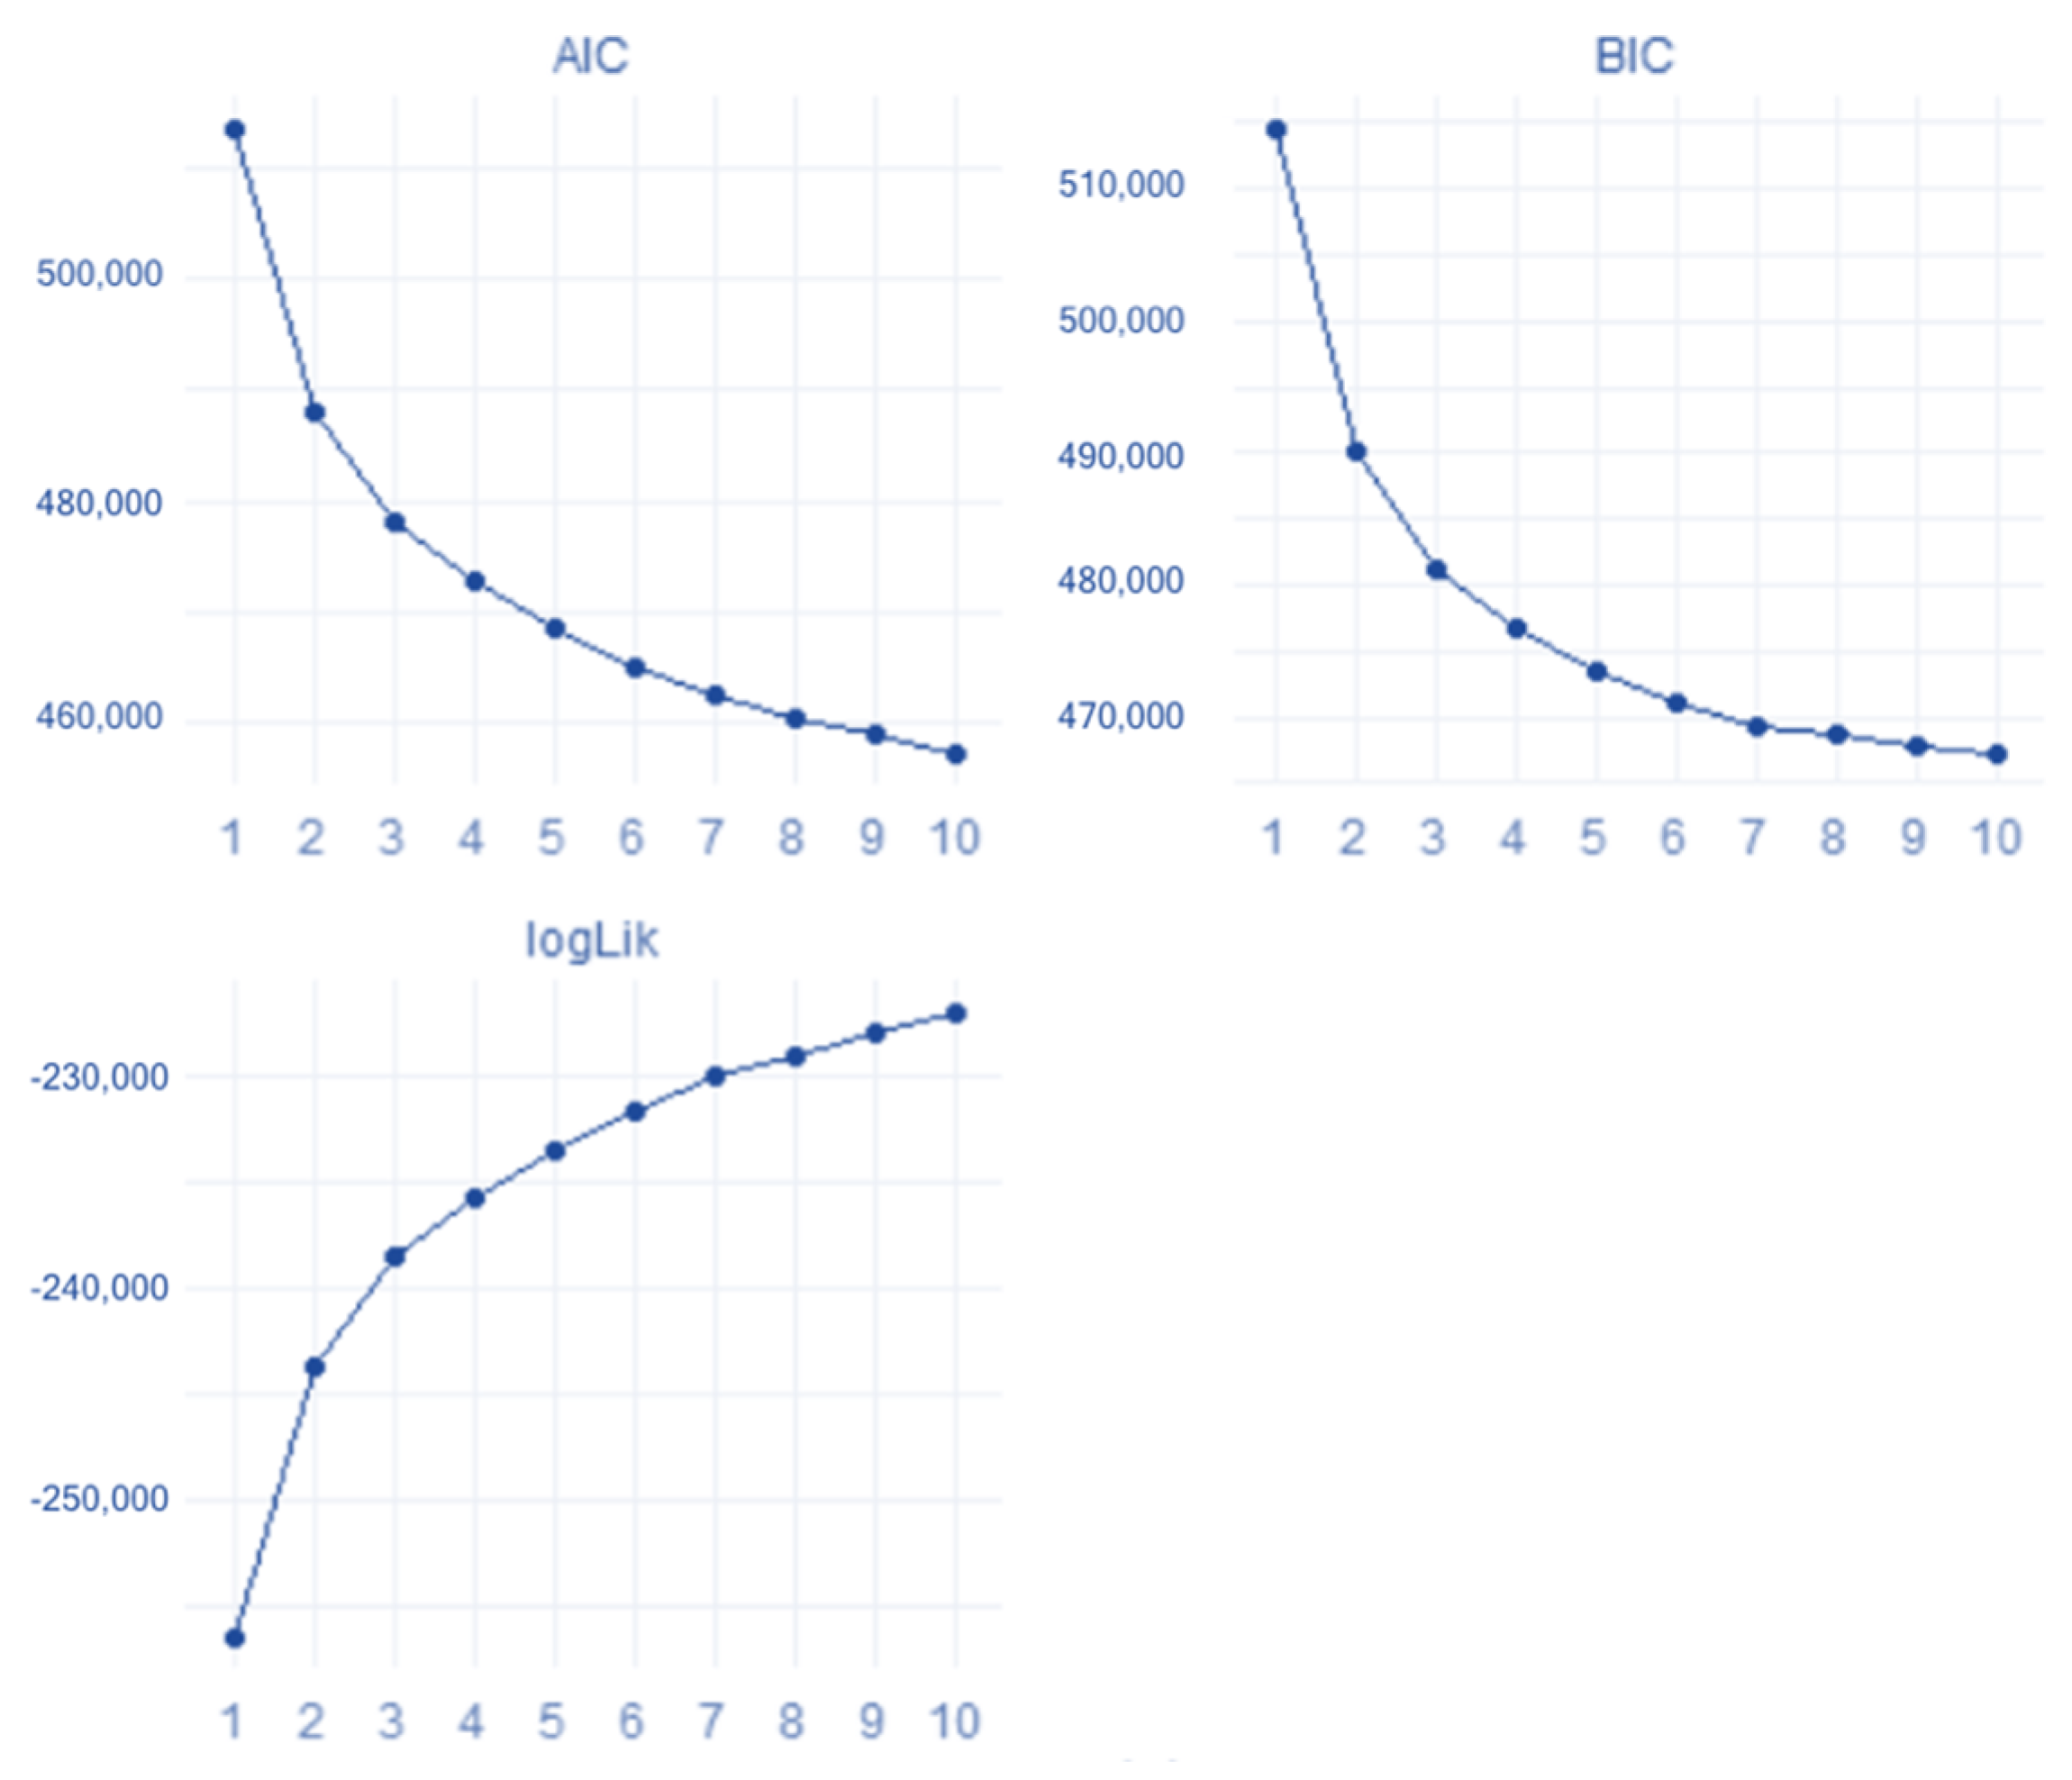
Continuing with the data analysis process, this time using the LCA technique described above, it is possible to establish that one of the benefits of using this technique is the variety of tools available to adjust the performance and determine the appropriate number of latent classes. Normally, one starts by testing a model with one class and then iteratively increases the number of classes until the appropriate model is reached. Considering a larger number of classes can improve model fit, but there may be the risk of model fit by considering spurious data or noise in the analysis. Parsimony criteria help to find the balance between overfitting. The most commonly used criteria are Bayesian Information Criterion (BIC) and Akaike Information Criterion (AIC). For this analysis, the model is fitted up to 10 classes, and it can be observed that the percentage of fit improves up to class number 10, but only in classes 4 and 5, a significant fit is achieved.
The graphs presented in Figure 4 show the behavior of each of the indicators calculated and presented in Table 1. It can be observed that when using the Elbow method, in the graph of both BIC and AIC, the curve of these indicators generates the inflection point, also known as “elbow criteria”, in which the models with 4 and 5 classes stop varying substantially and the values of these indicators tend to stabilize. Something similar occurs with the Log-Likelihood plot in the same models with 4 and 5 classes, which should be observed inversely due to the negative values of this indicator [45]. However, it is important not only to consider the values provided by the indicators shown in Table 1, but also to consider the ease of interpretation.
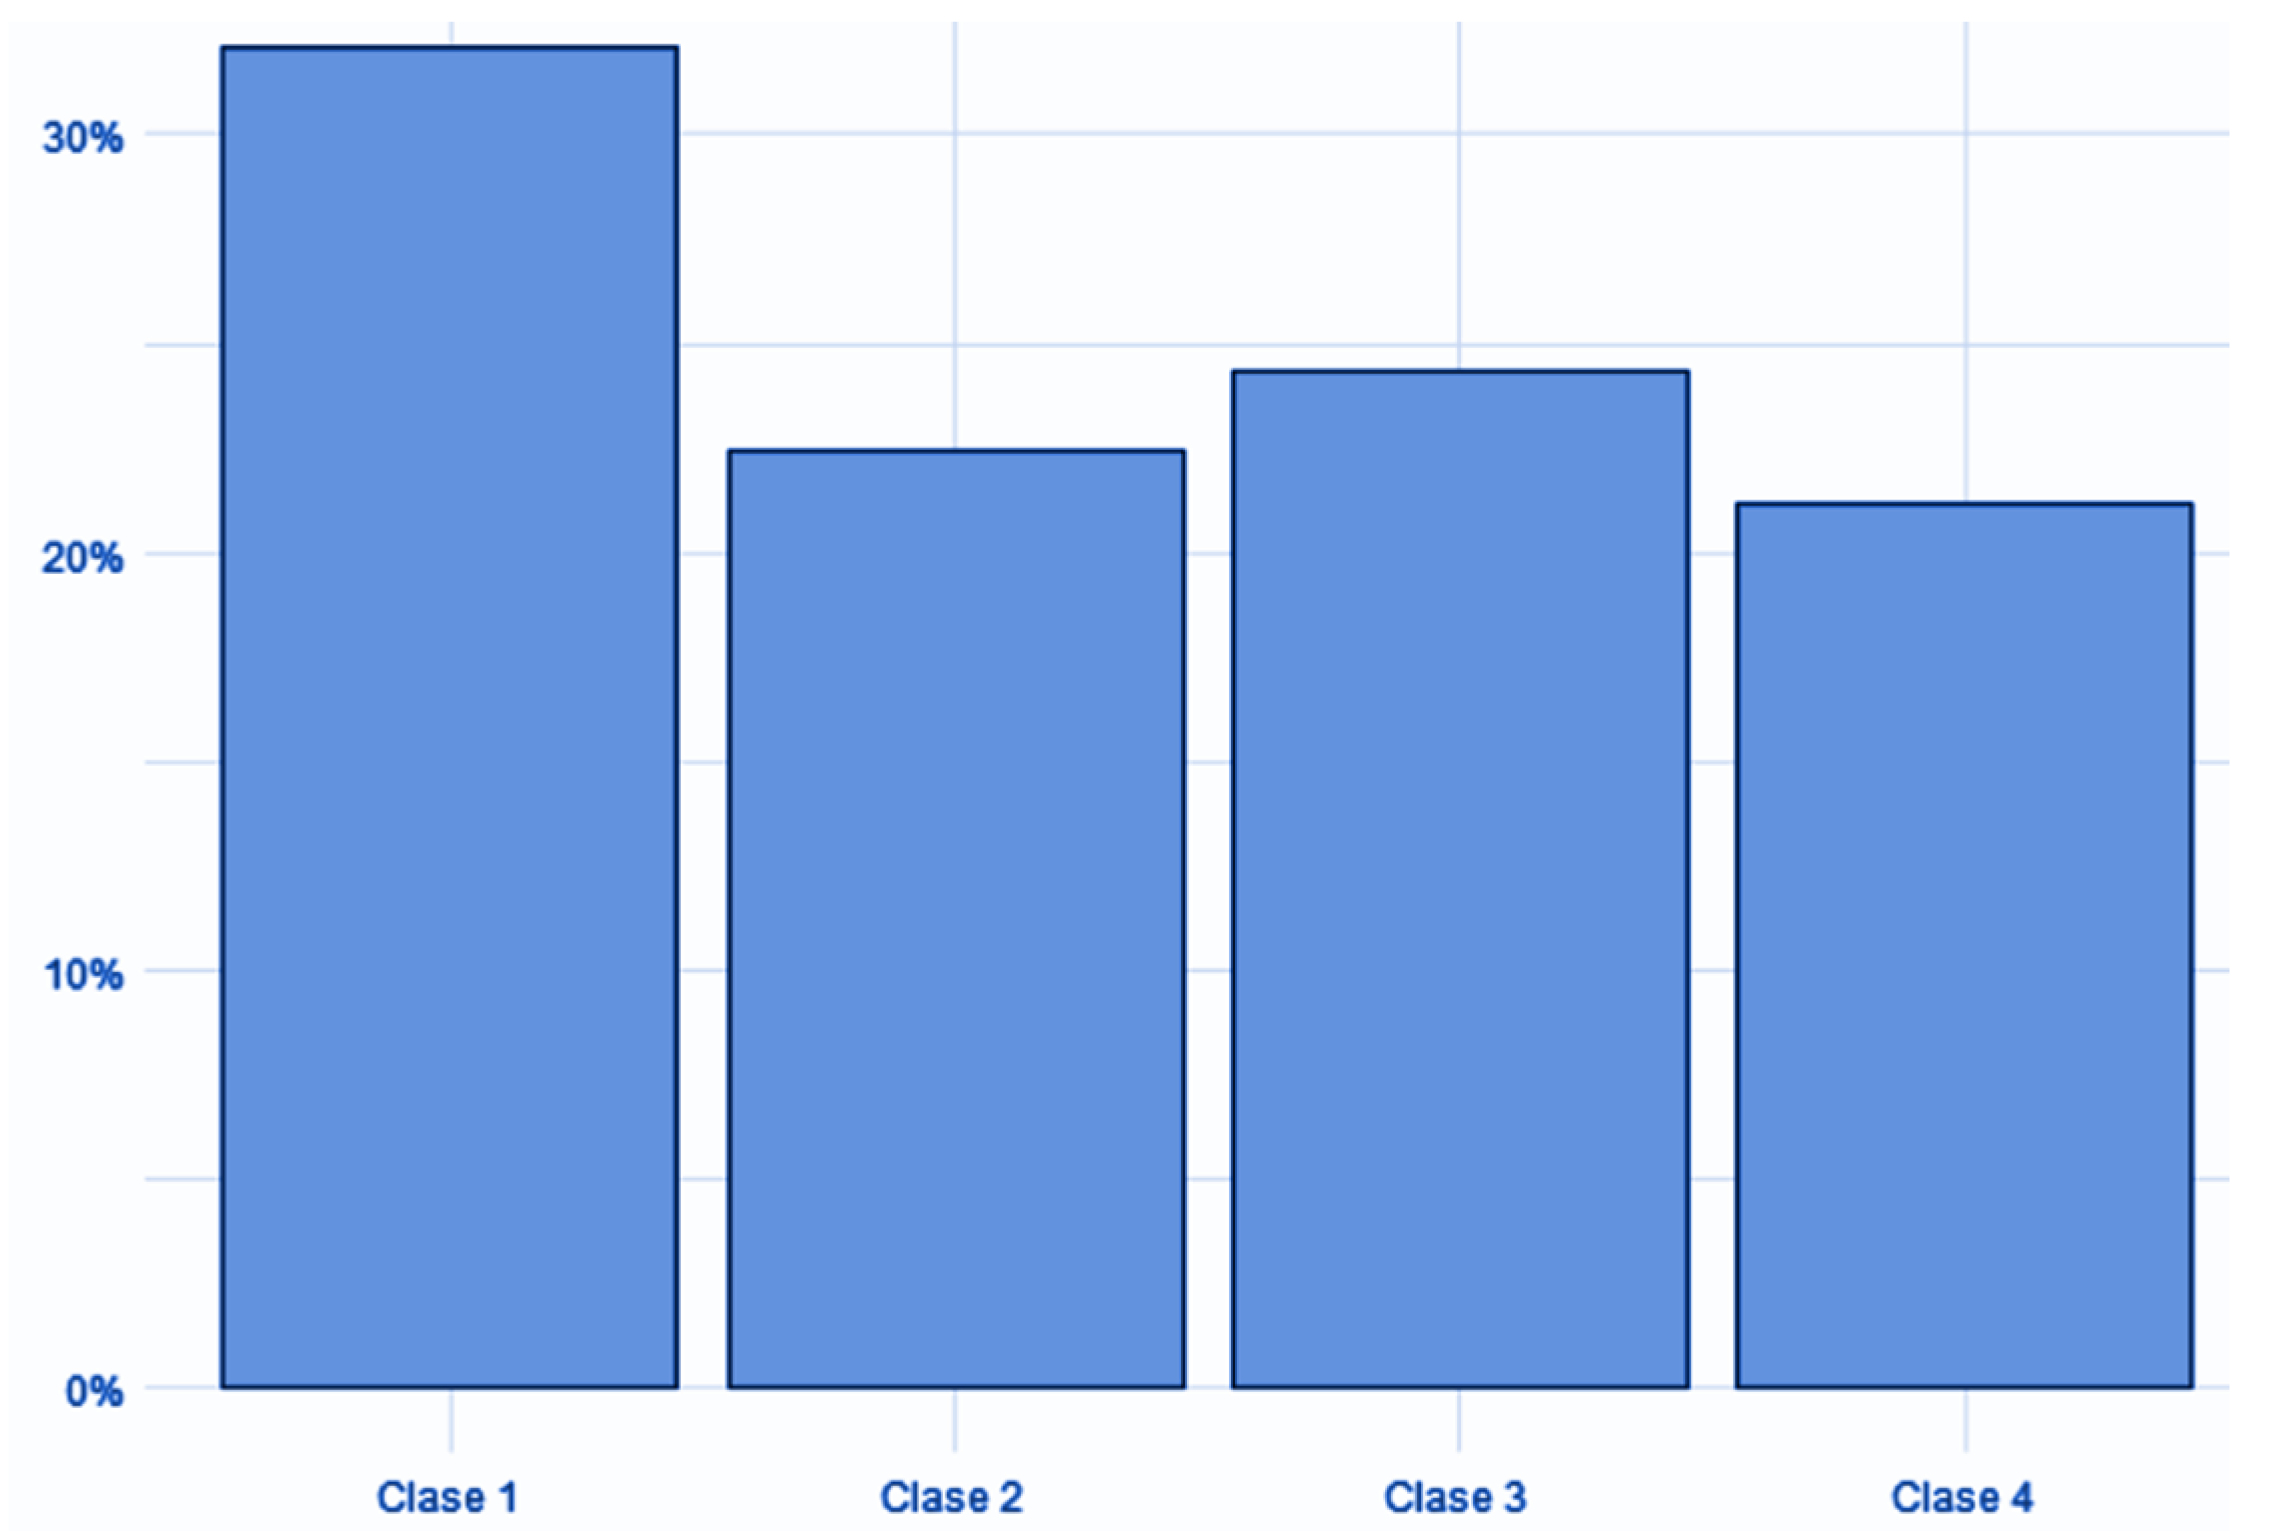
After analyzing these indicators and for a better interpretation of the results, the model with four classes were selected for this study, mainly because no major differences were observed with the model with five classes. Figure 5 shows the percentage of observations or participants per class, i.e., class 1: 1546 (32.1%), class 2: 1071 (22.4%), class 3: 1144 (24.3%), and class 4: 1001 (21.2%). This indicator shows that the classes determined are homogeneous in coverage.
It can be seen that the percentage of participants per class is uniform in classes 2, 3, and 4, while class 1 has about 10% more participation than the rest, a difference that is not of great relevance for the analysis. Subsequently, the LCA is performed by crossing the result of the observations with each of the blocks of the COBADI® instrument used and described previously in Section 3.
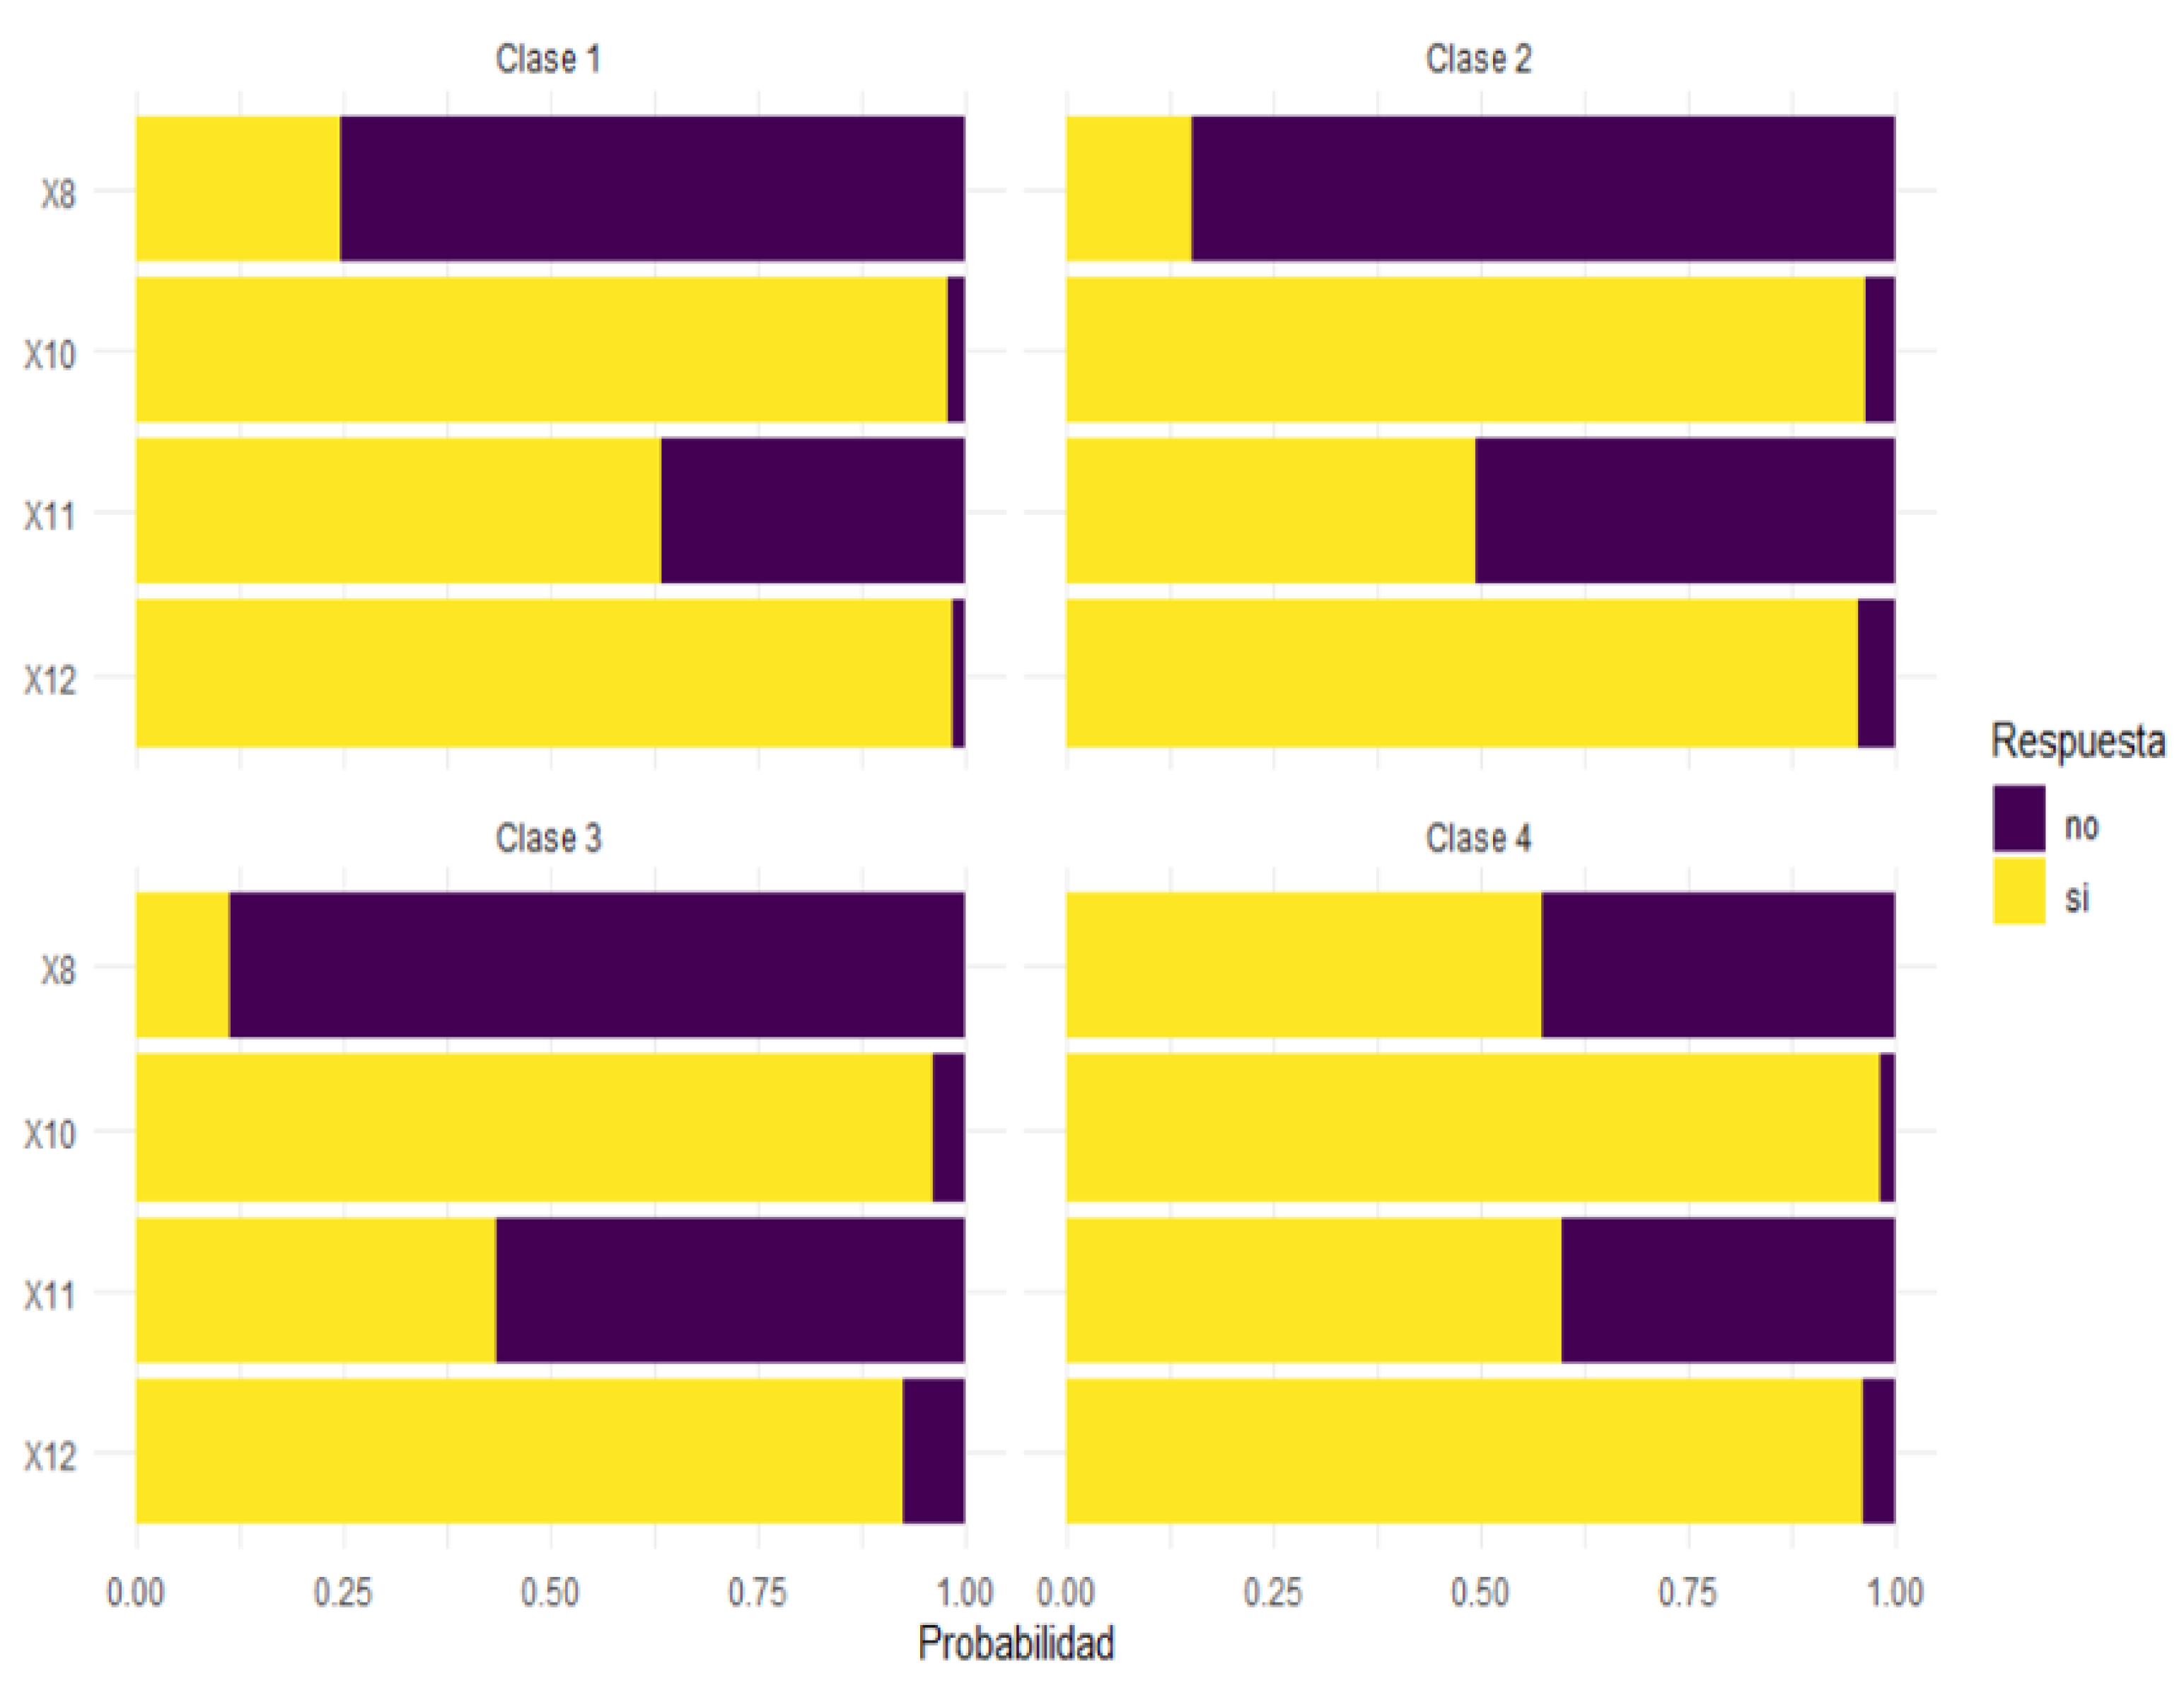
In relation to the initial or general block, which refers to technology consumption, it can be seen from the graph in Figure 6, that the most notable feature is related to question X8: Have you received training on Web 2.0 or social software? Where 57% of class 4 respond affirmatively, unlike classes 1, 2, and 3. In addition, it is important to note that in all the classes obtained, most participants report having a computer (question X10) and internet at home (question X12). In class 4, the participants connect to the Internet mainly from home and also have the highest percentage of connection through their cell phone, highlighting in the latter case the participants in class 2. In addition, those classified in class 4 are those who report spending the most time on the Internet, approximately more than 9 h a week, and those in class 3 are at the other extreme, i.e., they spend less time on the Internet, between 1 and 3 h a week.
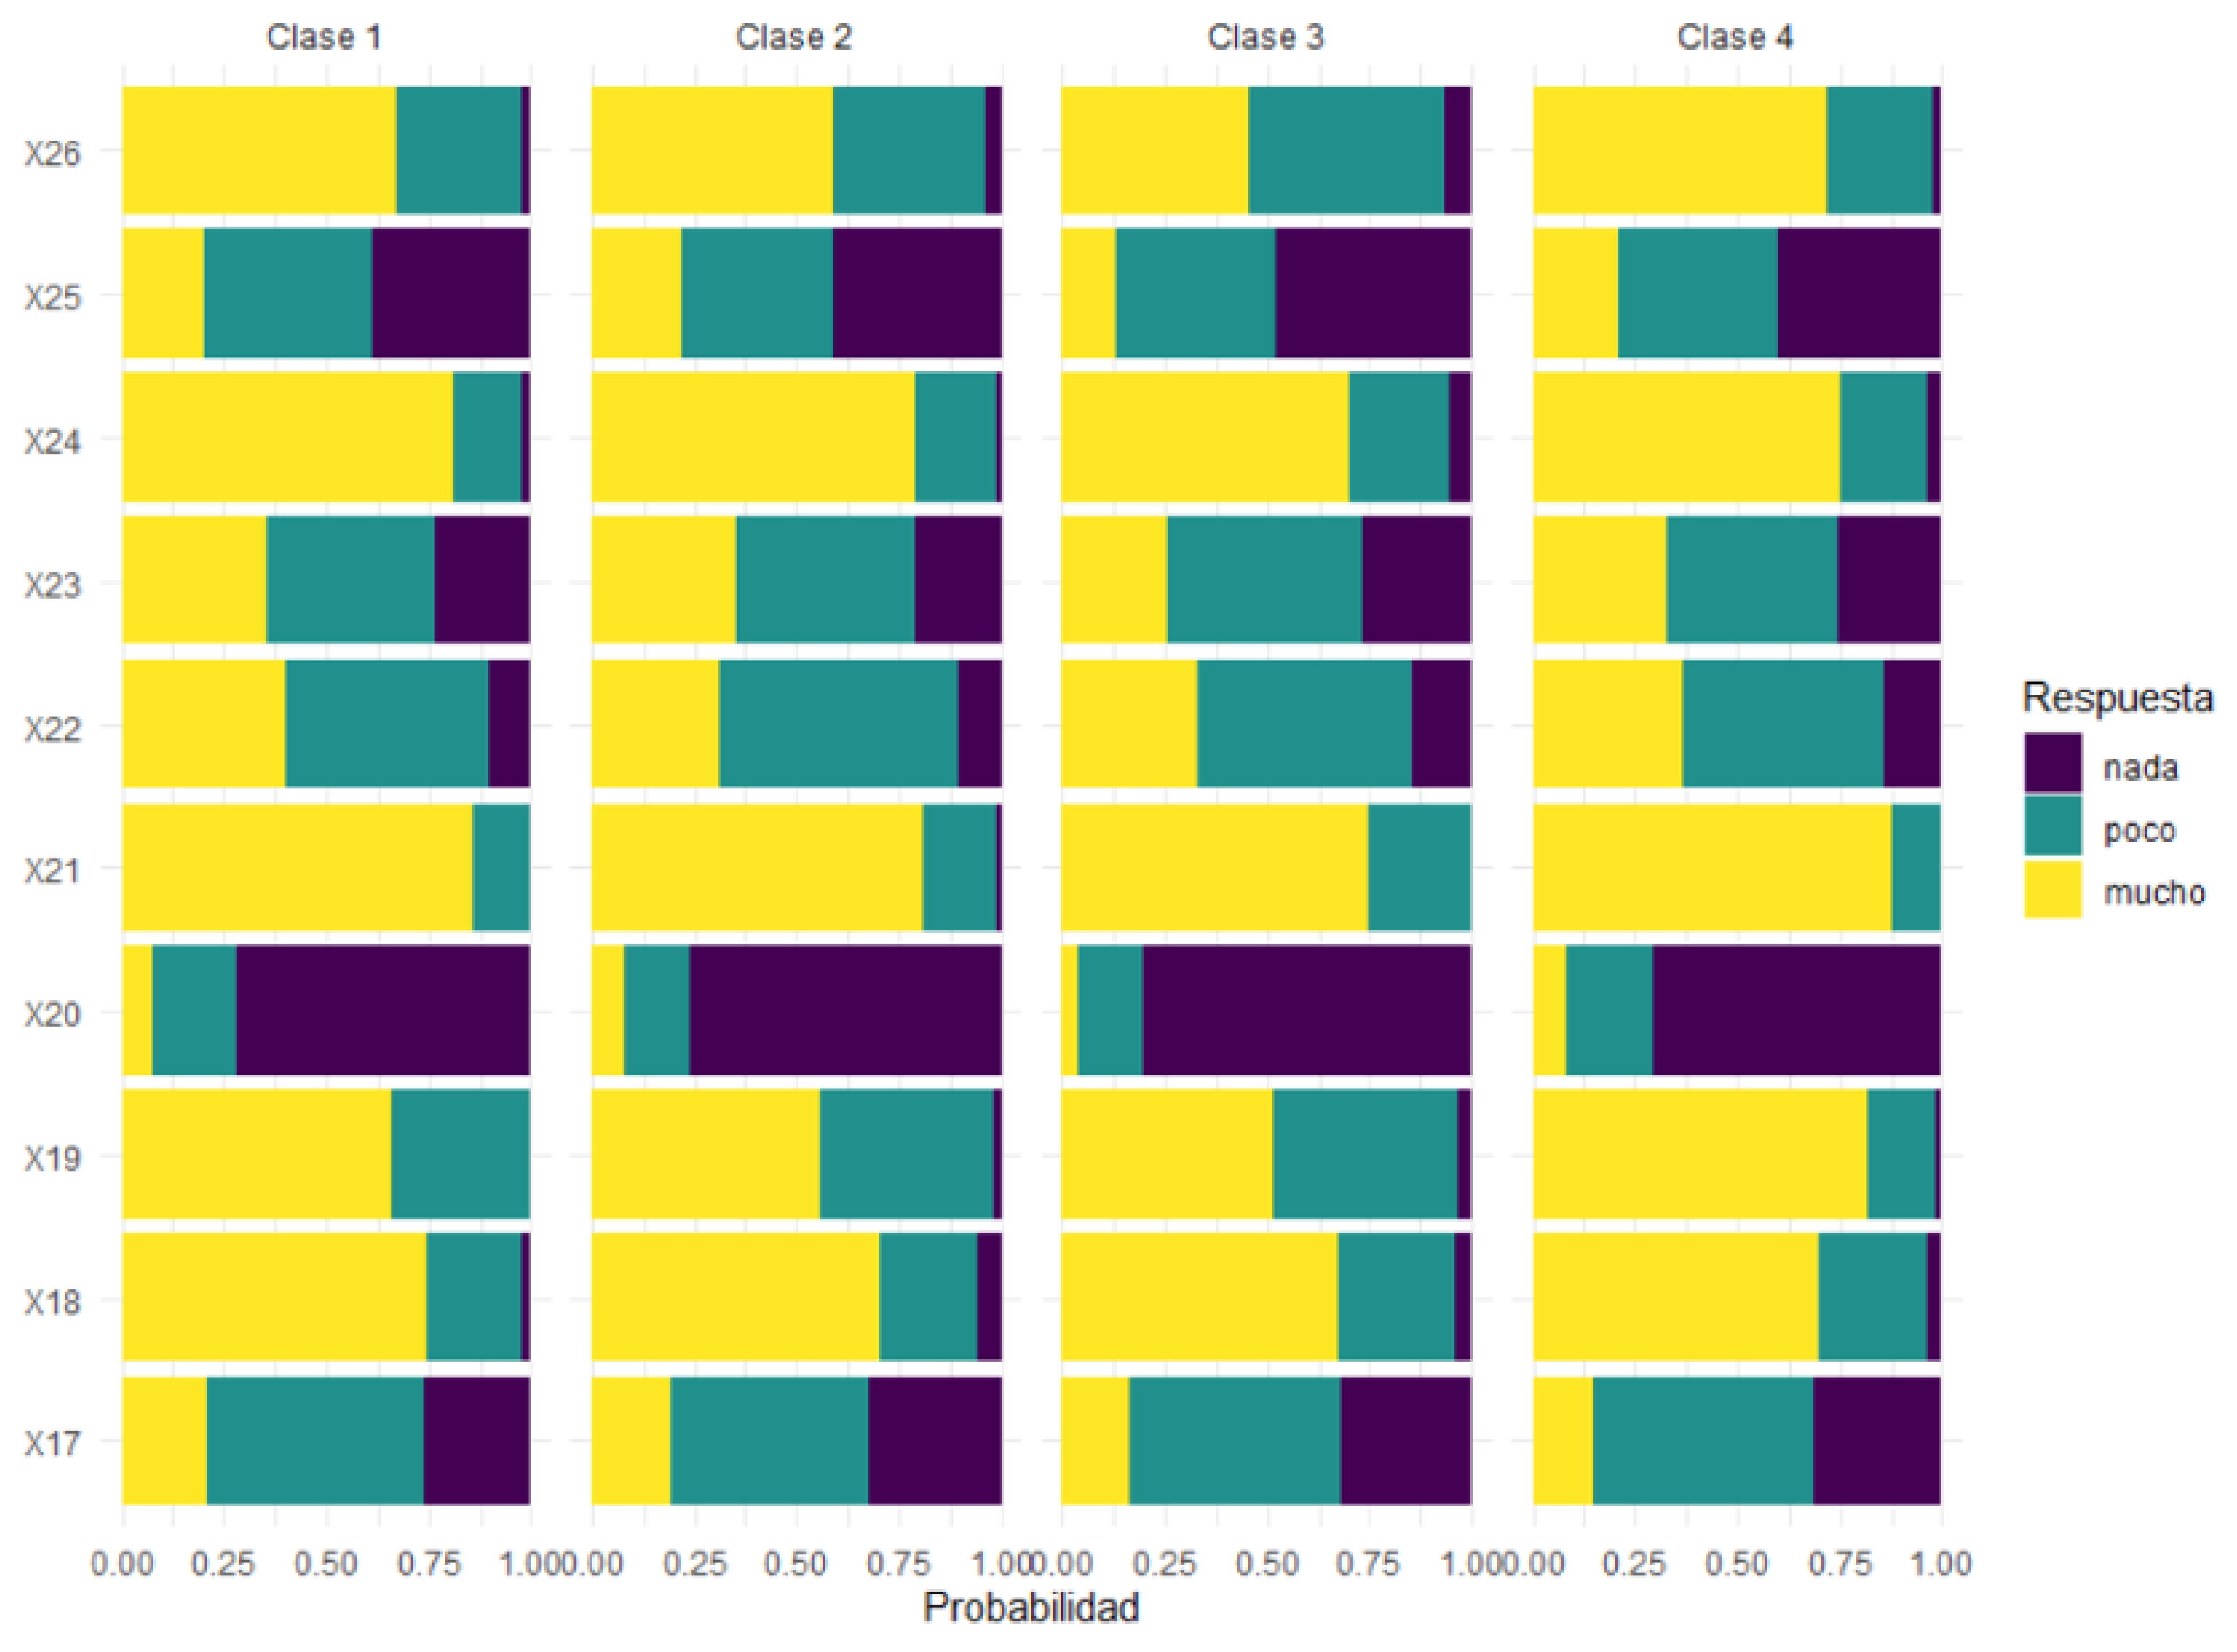
In the classes identified, it can be seen in the graph in Figure 7, that in general the participants of all classes have a similar behavior in relation to the amount of time they use to perform different daily actions; however, class 4 stands out for using more internet time to perform tasks related to their university chores, and which are related to questions X19, X21, and X26.
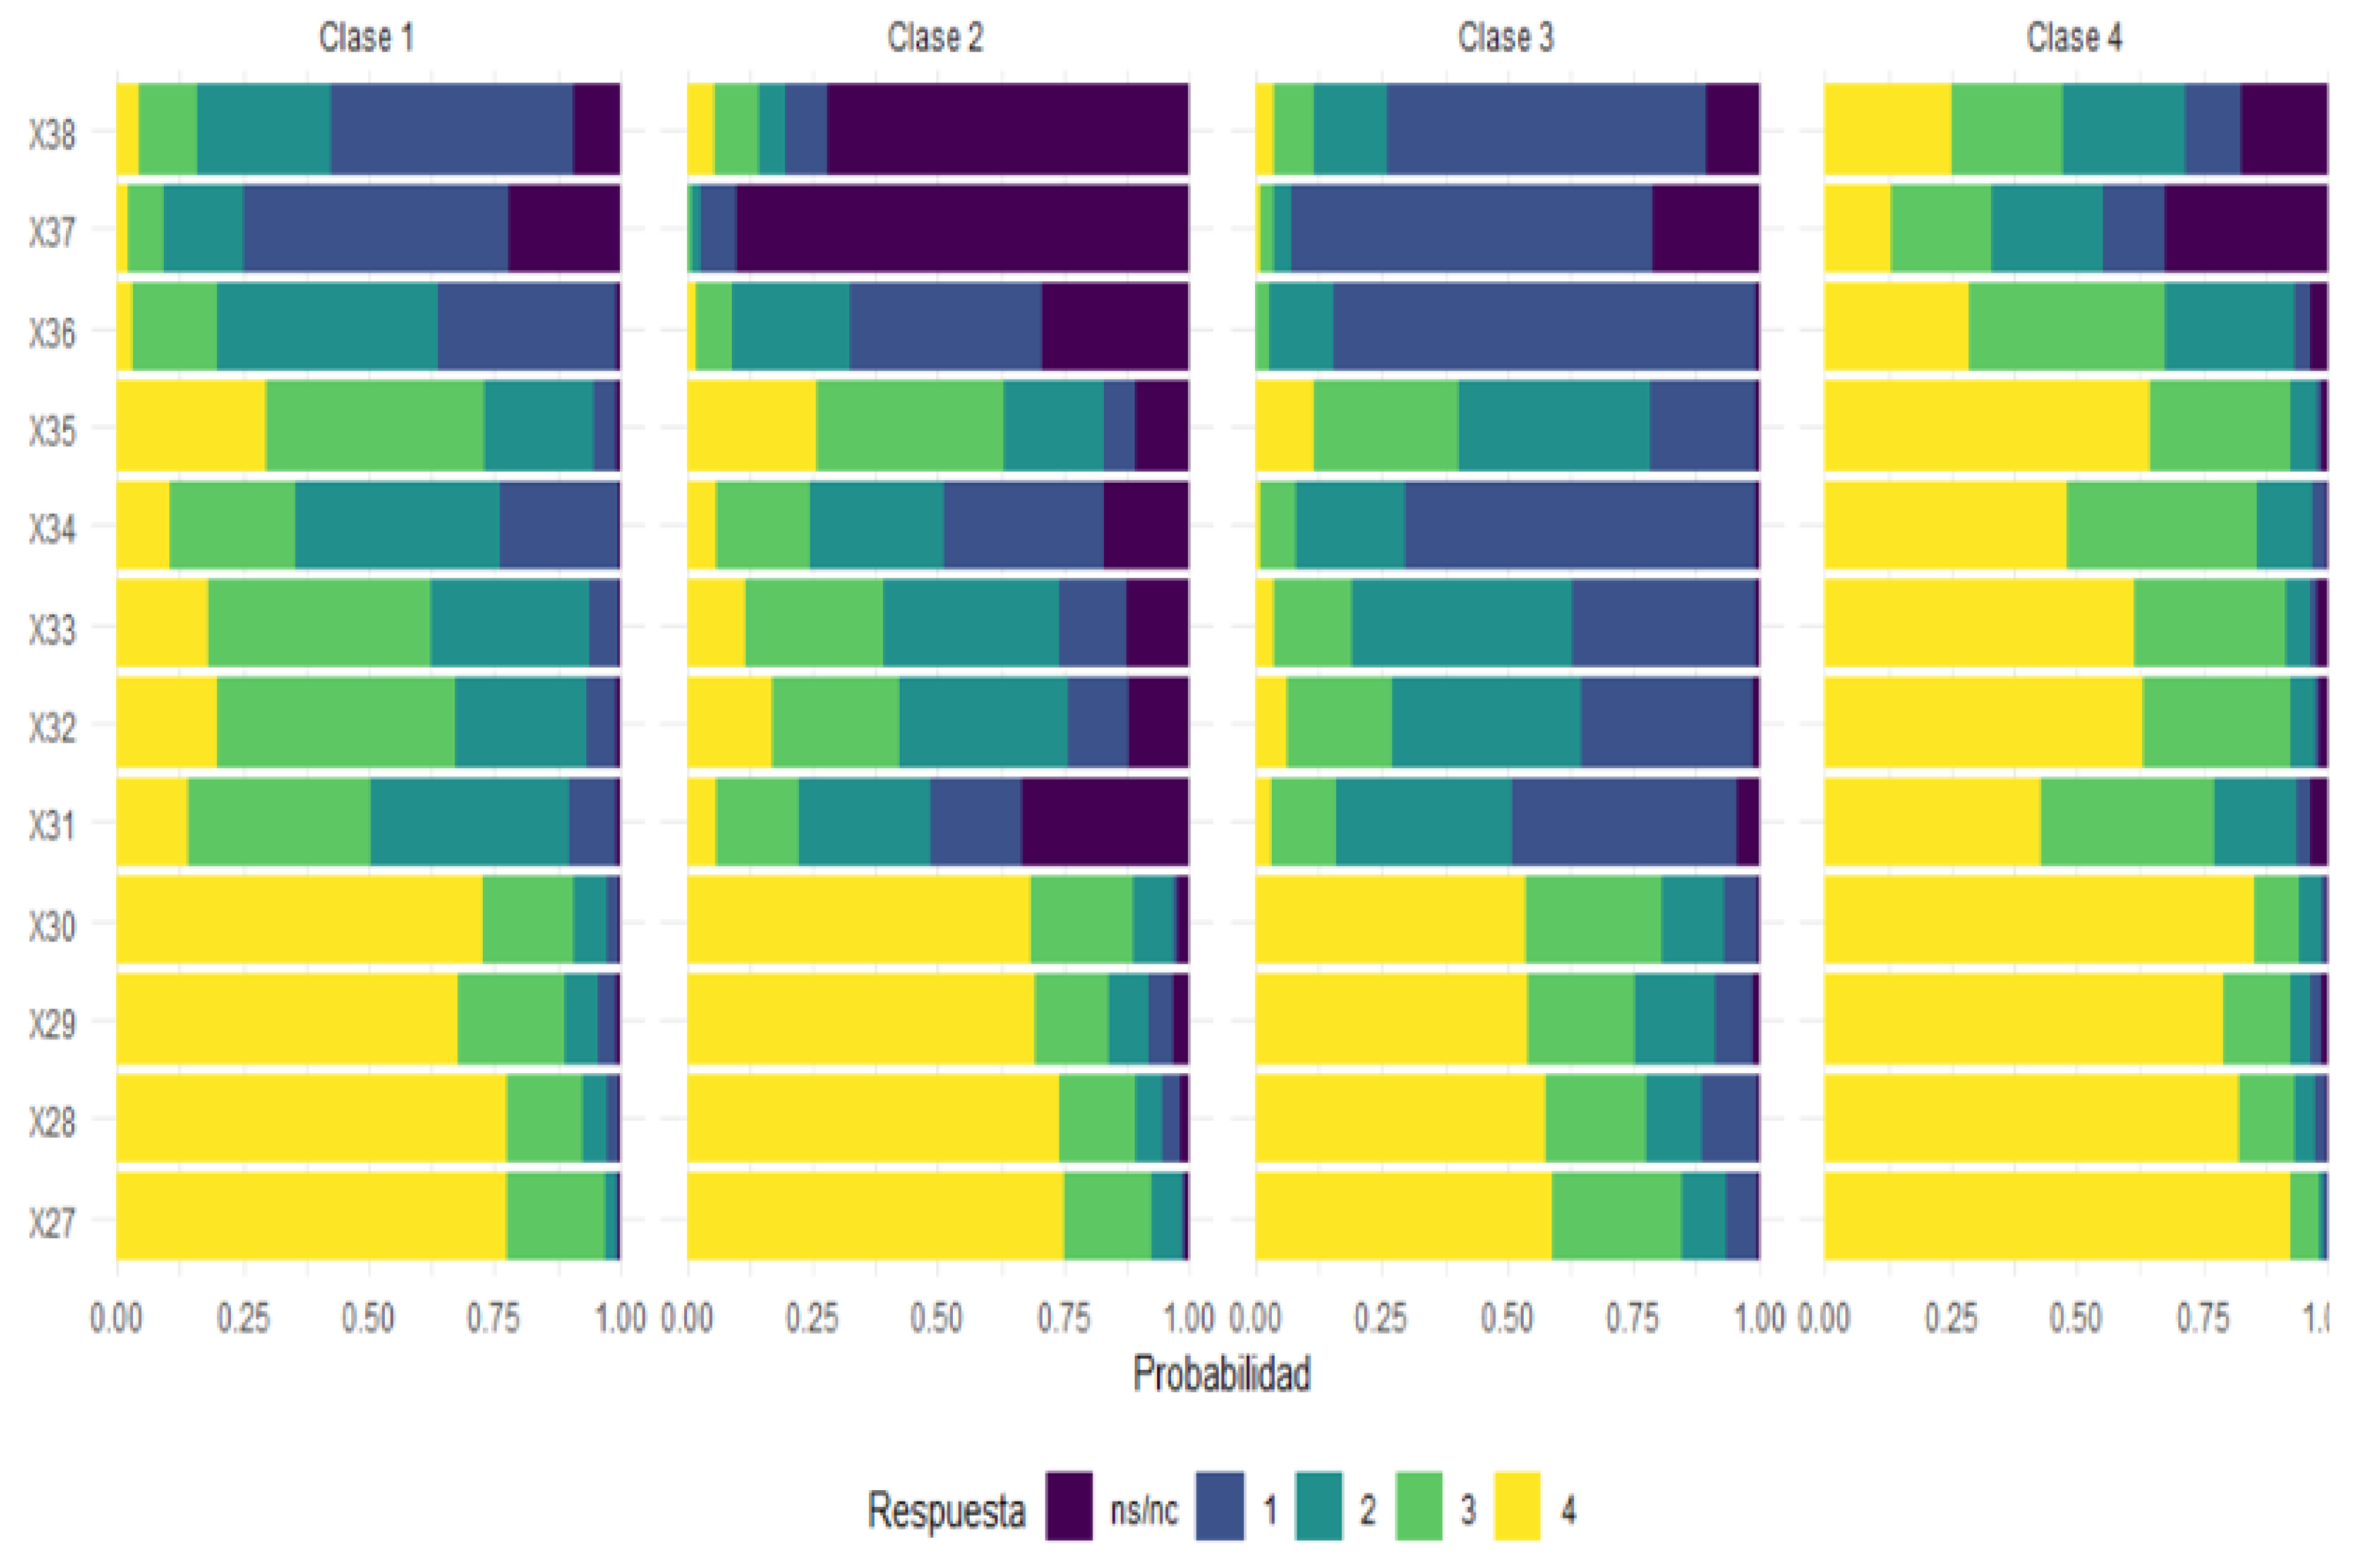
For Block I, which evaluates the competences in knowledge and use of ICT in social communication and collaborative learning, the answers vary from a scale of 1 to 4, where 1 refers to feeling completely ineffective to perform what is presented, and 4 represents that they have completely mastered it. In addition, participants can use the NS/NC option in case they do not know what is being asked. In the results shown in the graph in Figure 8, it can be clearly observed that at one extreme, the participants of class 4 have a great mastery to perform what is presented to them, and at the other extreme, we find the participants of classes 2 and 3. The participants of class 2 have a behavior of not knowing what is being asked, and those of class 3 have a high percentage of feeling completely ineffective to perform what is presented in a large part of the questions. In relation to class 1, a balance between both extremes is observed.
Another interesting pattern can be observed in questions X37 and X38, where a high degree of lack of knowledge and low level of efficiency to perform what is presented can be observed. This is totally contrary to what can be seen in questions X27, X28, X29, and X30, where the participants of all classes are completely efficient to perform what is presented.
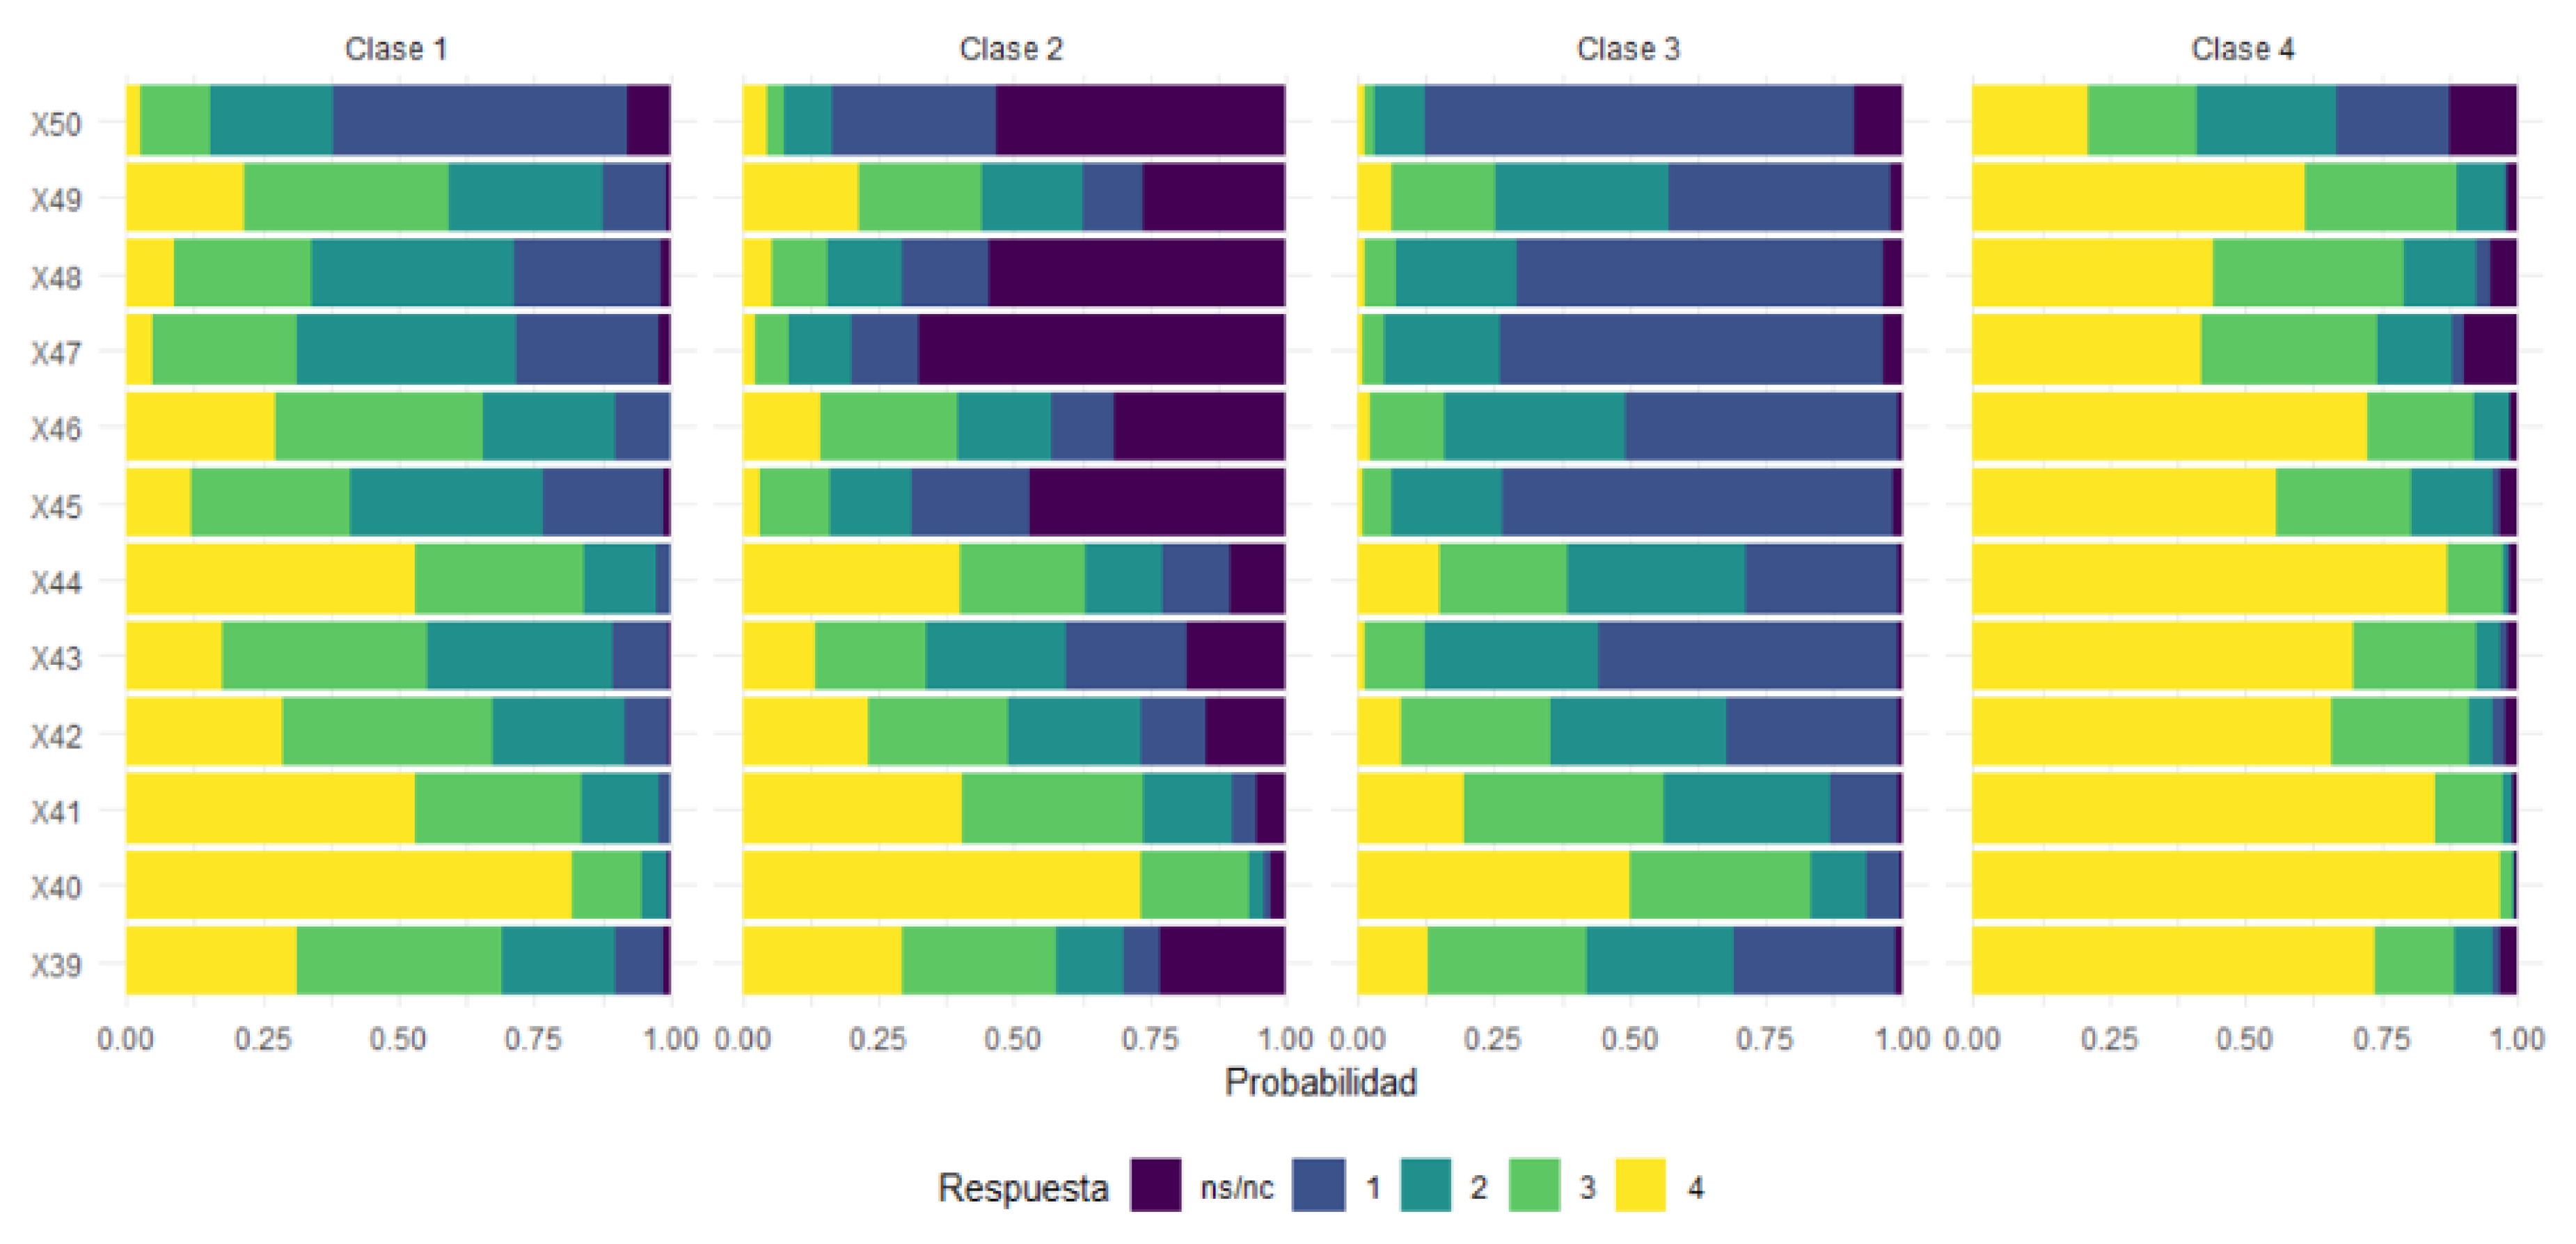
In Block II, which seeks to measure competences in the use of ICT for information search and processing, whose answers have the same scale as the previous dimension (i.e., between 1 and 4), the same behavior obtained in dimension 2 can still be observed from Figure 9, where the participants of class 4 declare to have a great mastery in most of the topics presented. On the other side, the participants of classes 2 and 3 have a low performance in the topics presented, in particular in relation to the use of QR codes to disseminate information (question X50), where they declare to have practically no capacity and knowledge in this regard. Only in question X40, the participants of all classes coincide in declaring to be effective in the use of different browsers to navigate the Internet.
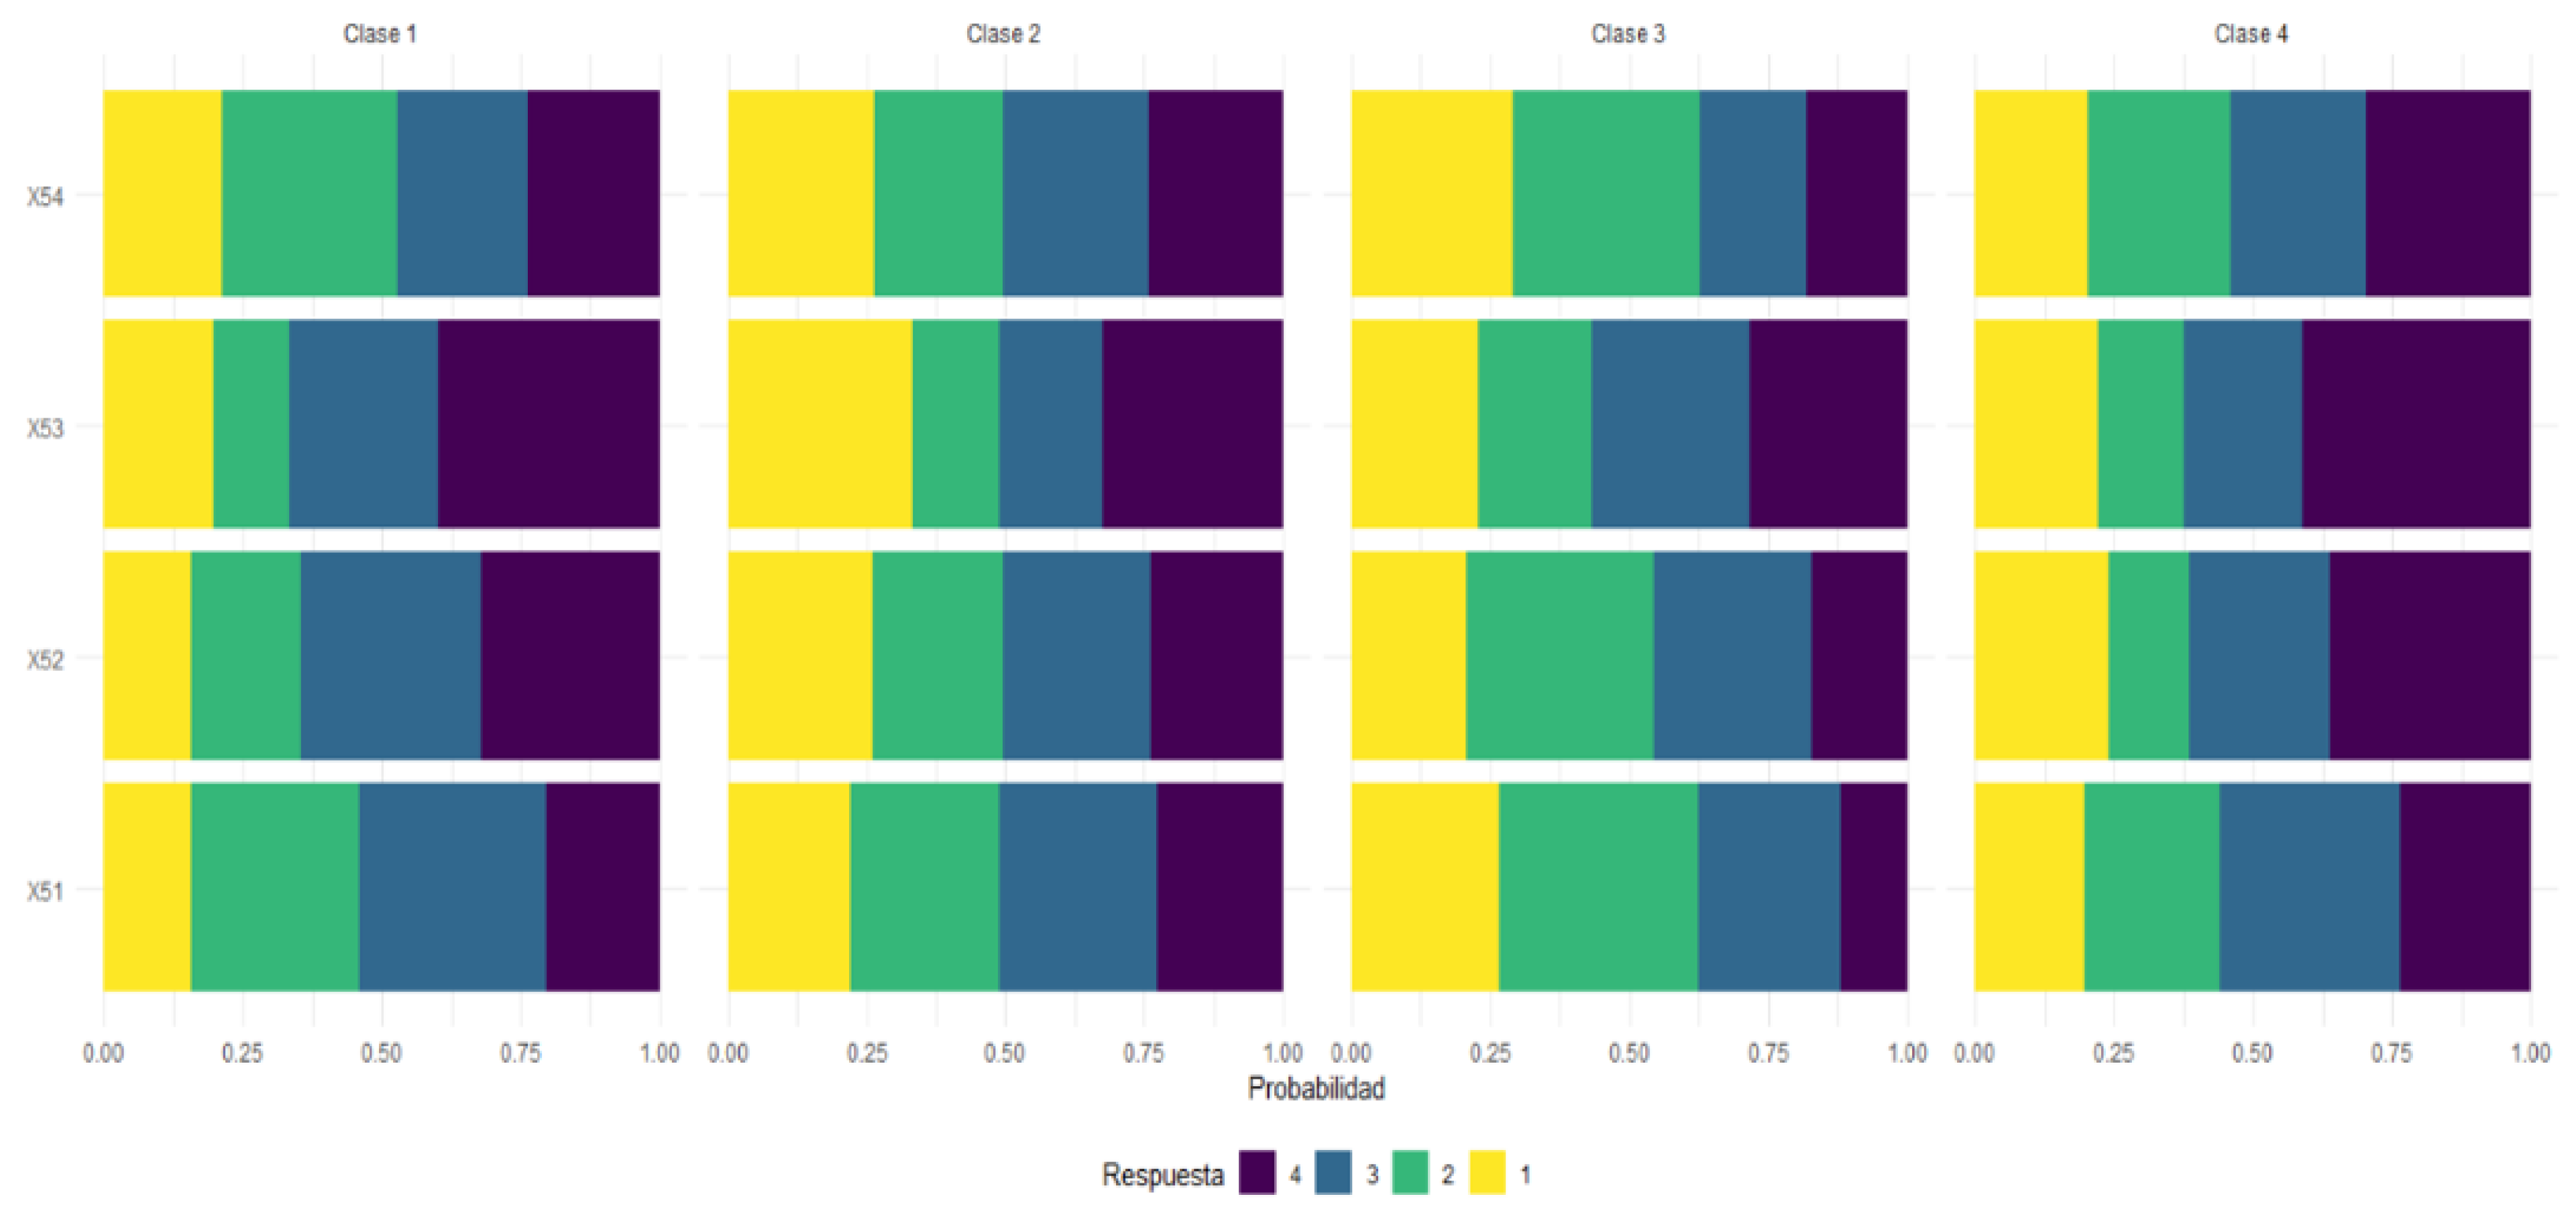
For block III, which seeks to measure interpersonal competences in the use of ICTs in the university context, and where the measurement scale has a different meaning, participants should place the options they use the most, with 1 being the most used option and 4 the least used option. In percentage terms, as can be seen in Figure 10, in general, the participants of the four classes have a homogeneous and similar behavior in the four questions measured in this block. It only stands out that for question X51: Consult the teacher for some network communication channel, and for question X54: Wait and request a face-to-face tutoring, approximately more than 75% of the participants of class 3, declare that they use this support to a greater extent when they have doubts about the use of some service or network application explained in the classroom.
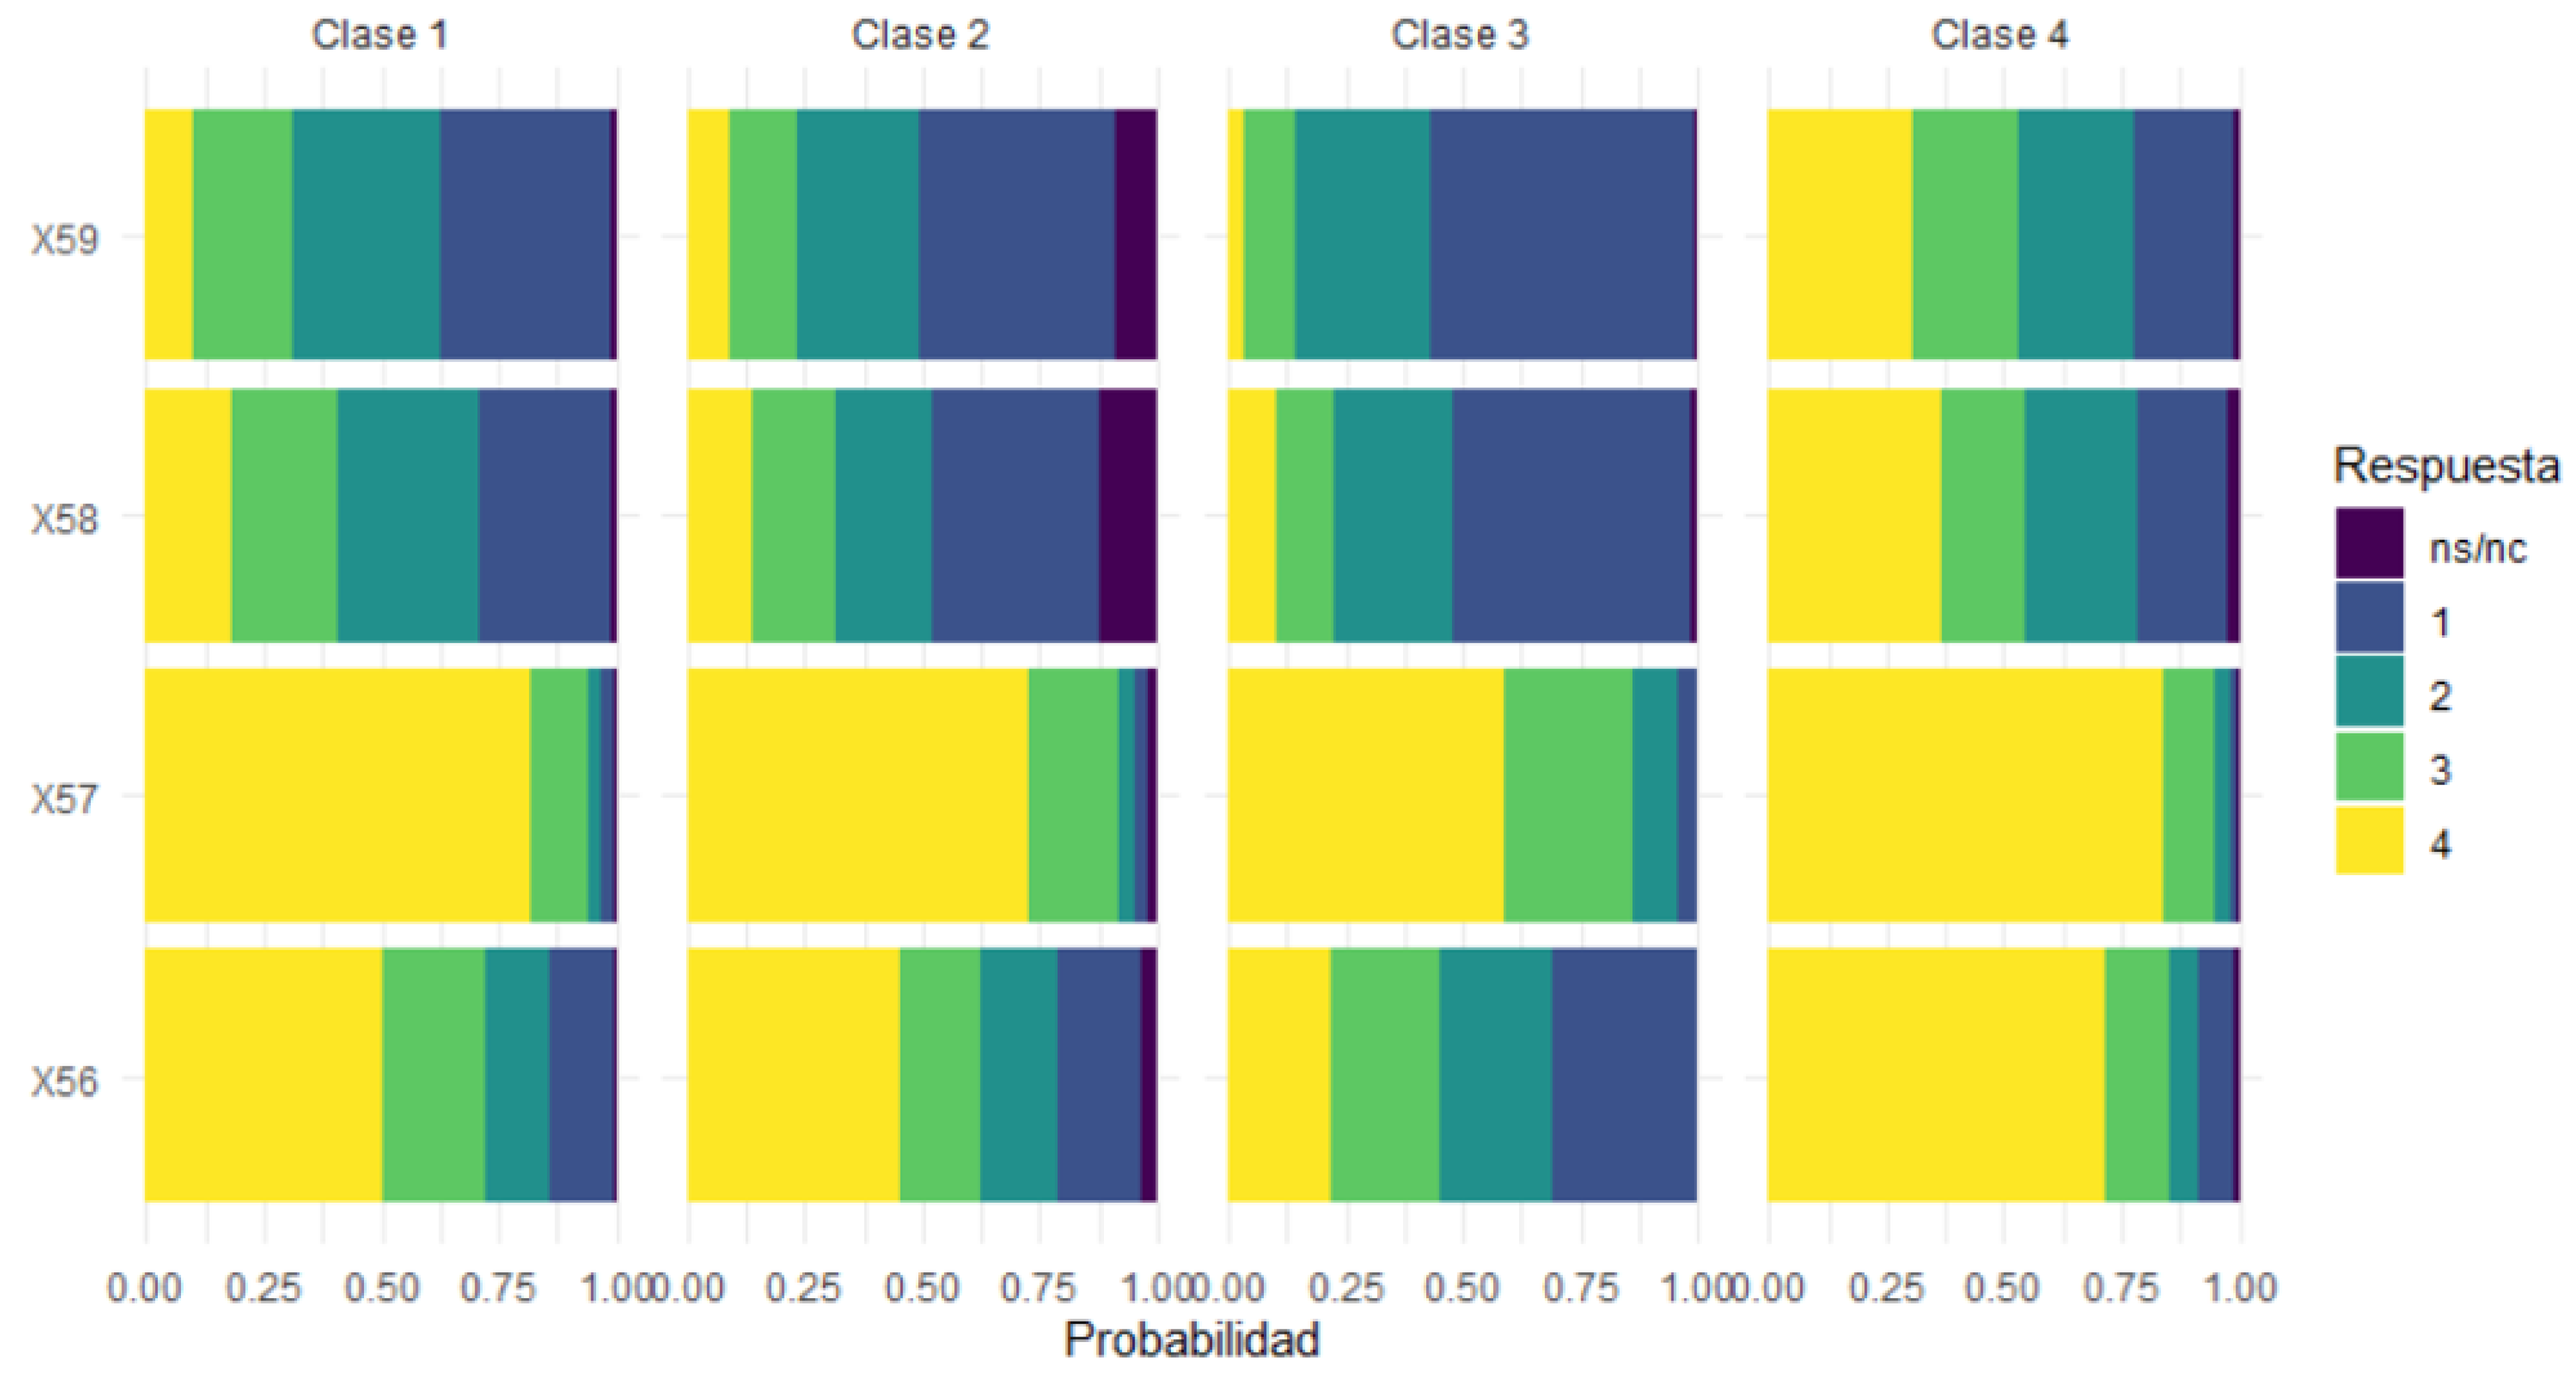
In Block IV, which measures the effectiveness in the use of virtual and social communication tools of the University, the answers have a scale from 1 to 4, where 1 refers to feeling completely ineffective to perform what is presented, and 4 is if the participant believes he/she completely masters the tool presented. In addition, the option NS/NC can be used in case they do not know what is being asked. It can be observed in Figure 11, that participants in class 4 declare to have a high mastery or effectiveness in the use of tools and social communication of the university. While those in class 2, manifest a higher degree of ignorance about what is being asked, and those belonging to class 3 are the ones who respond feeling completely ineffective for the most part. In questions X56: I use the university e-mail, and question X57: I use the university’s virtual platform, the participants of the four classes declare in their majority (more than 85%) to use both tools effectively.
Finally, according to what has been analyzed and described in each of the blocks analyzed with the LCA technique, the latent classes can be identified and interpreted according to the level of development of the observed digital competences, according to the responses of the participants of the study, that is:
- Class 1: Intermediate competences for the use of technologies.
- Class 2: Low competences and lack of knowledge in the use of technologies.
- Class 3: Low competences in the use of technologies.
- Class 4: High competences in the use of technologies.
5. Conclusions and Future Work
The new perspectives and educational transformations given through new technological advances require greater emphasis for the improvement of teaching processes, considering that digital competence is one of the key set of skills of this century [46,47,48].
Higher education institutions must rethink the ways to develop the new professional roles required in society and the new relational forms of individuals to meet the emerging occupational requirements in the knowledge society [49].
The new labor requirements and communicative demands that new technologies establish in our daily life must be considered, which also facilitates the development of future professionals [50,51,52].
There is work to be done to bridge the gaps between existing digital skills and the skills needed under the demands of the new workspaces [53,54,55,56,57].
Consequently, although this work was focused on a sample of students from Spanish universities, the study allows us to establish a baseline to be able to continue with a similar analysis of digital competences with university students from America in the future, in order to establish the existing gap in both groups.
It is important to emphasize that it is necessary to increase digital competences to impact the indicators of a complex education, which advances to competitive scenarios and where it is possible to sustain oneself only if the usefulness of technology is understood at the service of a thinking, critical and creative being.
For students in classes 2 and 3, it is recommended as an educational intervention, that they can follow ICT courses that allow them to improve their digital skills.
The LCA greatly facilitated the analysis of the COBADI® questionnaire. This type of analysis made it possible to generate an acceptable number of models and to adjust them until the appropriate model was found.
The BIC and AIC metrics proved to be good criteria for fitting the model and finding the optimal number of latent classes that can describe the data set. One of the problems of using these criteria is that sometimes they can show that there are too many numbers of latent classes, making it difficult to interpret the data. Another important aspect to take into account when selecting the correct model is to keep the model simple in order to facilitate the interpretation of the results obtained from the analysis.
poLCA proved to be the most complete and easy-to-use computational package for latent class estimation in R. This package can be found at http://CRAN.R-project.org/package=poLCA, accessed on 1 March 2021.
After performing the LCA and interpreting the results obtained, it can be deduced that the four latent classes gathered make a lot of sense and are coherent in relation to the data describing them. On the one hand, the latent class with the highest competences in the use of ICT in a university context was class 4, which had previously taken a Web 2.0 course. On the other hand, it was obtained that the class with the highest number of participants was class 1, which had intermediate competences in the use of ICT in a university context.
It is still necessary to continue adjusting the LCA performed in this work, a possibility for this, is to add covariates, and to further investigate the potential that the LCA has for the analysis of multivariate categorical data. Another important point is to re-run this analysis without adding Block III, since the way these questions are answered are not relevant for the LCA, because of their difficult interpretation.
Author Contributions
Conceptualization, C.G.B.-V. and E.L.M.; methodology and software, W.A.C.R.; validation, C.G.B.-V., W.A.C.R. and E.L.M.; formal analysis, W.A.C.R.; investigation, C.G.B.-V. and W.A.C.R.; resources, E.L.M.; writing—original draft preparation, C.G.B.-V. and W.A.C.R.; writing—review and editing, J.M.; visualization, J.M.; supervision, E.L.M. All authors have read and agreed to the published version of the manuscript.
Funding
This research received no external funding.
Institutional Review Board Statement
Not applicable.
Informed Consent Statement
Not applicable.
Data Availability Statement
Not applicable.
Conflicts of Interest
The authors declare no conflict of interest.
References
- Araneda-Guirriman, C.; Rodríguez-Ponce, E.; Pedraja-Rejas, L.; Baltazar-Martínez, C.; Soria-Lazcano, H. La gestión del conocimiento en instituciones de educación superior del norte de Chile. Rev. Pedagog. 2017, 38, 13–30. [Google Scholar]
- Rafi, M.; JianMing, Z.; Ahmad, K. Technology Integration for Students’ Information and Digital Literacy Education in Academic Libraries. IDD 2019, 47, 203–217. [Google Scholar] [CrossRef]
- Hong, A.J.; Kim, H.J. College Students’ Digital Readiness for Academic Engagement (DRAE) Scale: Scale Development and Validation. Asia Pac. Educ. Res. 2018, 27, 303–312. [Google Scholar] [CrossRef]
- UNESCO. UNESCO Education 2030 Framework for Action; UNESCO: Paris, France, 2015. [Google Scholar]
- MINEDUC. Ministerio de Educación Plan de Aseguramiento de La Calidad de La Educación 2020–2023; MINEDUC: Santiago, Chile, 2020.
- Ananiadou, K.; Claro, M. 21st Century Skills and Competences for New Millennium Learners in OECD Countries; OECD Publishing: Paris, France, 2009. [Google Scholar] [CrossRef]
- UNESCO; Miao, F. Wayne Holmes International Forum on AI and the Futures of Education, Developing Competences for the AI Era, 7–8 December 2020: Synthesis Report; United Nations Educational, Scientific and Cultural Organization: Paris, France, 2020; p. 2021. [Google Scholar]
- OECD. OECD Skills Strategy 2019; OECD: Paris, France, 2019. [Google Scholar]
- Zabalza, M. Modelos y procesos de formación en las empresas ante los retos de la globalización. In Desarrollo de las Instituciones y su Incidencia en la Innovación de la Docencia; Medina, A., Rodríguez, C., Ansoleaga, D., Eds.; UNED, Universidad Nacional de Educación a Distancia: Madrid, Spain, 2014; pp. 339–341. ISBN 978-84-7991-434-9. [Google Scholar]
- Ferrater, J. Diccionario de Filosofía; Ariel: Barcelona, Spain, 1994. [Google Scholar]
- Perrenoud, P. Construir Las Competencias, ¿es Darle La Espalda a Los Saberes? Rev. Docencia Univ. 2008, 6, 2. [Google Scholar] [CrossRef]
- Cano, M. La Evaluación Por Competencias En La Educación Superior. Profr. Rev. Currículum Form. Profr. 2008, 12, 1–16. [Google Scholar]
- Sanchez, A.; Poblete, M. Practicum y Evaluación de Competencias. Profr. Rev. Currículum Form. Profr. 2004, 8, 2. [Google Scholar]
- Sarramona, J. Las Competencias Profesionales Del Profesorado de Secundaria. Estud. Sobre Educ. 2007, 12, 31–42. [Google Scholar]
- De Miguel, M. Modalidades de Enseñanza Centradas En El Desarrollo de Competencias. Orientaciones Para Promover El Cambio Metodológico En El Marco Del EEES; Universidad de Oviedo: Oviedo, Spain, 2006. [Google Scholar]
- Medina, A. Fundamentación de las competencias discentes y docentes. In Formación y Desarrollo de las Competencias Básicas; Medina, A., Ed.; Universitas: Madrid, Spain, 2009; pp. 11–44. [Google Scholar]
- Sevillano, M. Competencias Para El Uso de Herramientas Virtuales En La Vida, Trabajo y Formación Permanentes; Pearson, Prentice Hall: Madrid, Spain, 2010. [Google Scholar]
- El Asame, M.; Wakrim, M. Towards a Competency Model: A Review of the Literature and the Competency Standards. Educ. Inf. Technol. 2018, 23, 225–236. [Google Scholar] [CrossRef]
- Almerich, G.; Díaz-García, I.; Cebrián-Cifuentes, S.; Suárez-Rodríguez, J. Estructura Dimensional de Las Competencias Del Siglo XXI En Los Estudiantes Universitarios de Educación. Relieve 2018, 24. [Google Scholar] [CrossRef] [Green Version]
- Vázquez-Cano, E.; León Urrutia, M.; Parra-González, M.E.; López Meneses, E. Analysis of Interpersonal Competences in the Use of ICT in the Spanish University Context. Sustainability 2020, 12, 476. [Google Scholar] [CrossRef] [Green Version]
- Vázquez-Cano, E.; Marín Díaz, V.; Maldonado Berea, G.A.; García-Garzón, E. La Competencia Digital Del Alumnado Universitario de Ciencias Sociales Desde Una Perspectiva de Género. Prism. Soc. 2017, 19, 347–367. [Google Scholar]
- Nemes, B. Curriculum Design in the Digital Age. A Framework for Developing Digital and Communication Competences in Undergraduate ESP Instruction. In Limbajele Specializate în Contextul Noilor Medii de Învățare: Provocări și Oportunități; Nistor, R.-M., Teglas, C., Eds.; Universitatea Babeş-Bolyai, Presa Universitară Clujeană: Cluj-Napoca, România, 2020. [Google Scholar]
- López-Meneses, E.; Sirignano, F.M.; Vázquez-Cano, E.; Ramírez-Hurtado, J.M. University Students’ Digital Competence in Three Areas of the DigCom 2.1 Model: A Comparative Study at Three European Universities. AJET 2020, 36. [Google Scholar] [CrossRef] [Green Version]
- Ordóñez-Olmedo, E.; Vázquez-Cano, E.; Arias-Sánchez, S.; López-Meneses, E. Las Competencias En El Uso de Las Tecnologías de La Información y La Comunicación En El Alumnado Universitario. Pixel Bit Rev. Medios Educ. 2021, 153–167. [Google Scholar] [CrossRef]
- Castellanos Adarme, M.E.; Nieto Sánchez, Z.C.; Parra López, H.M. Interpretación de Las Competencias Digitales Profesorales Presentes En El Contexto Universitario. Rev. Logos Cienc. Tecnol. 2020, 10, 41–51. [Google Scholar] [CrossRef]
- Serrano Rodríguez, R.; Amor Almedina, M.I.; Guzman Cedeño, Á.; Guerrero-Casado, J. Validation of an Instrument to Evaluate the Development of University Teaching Competences in Ecuador. J. Hisp. High. Educ. 2020, 19, 19–36. [Google Scholar] [CrossRef]
- Calle-Álvarez, G.; YLozano-Prada, A. La Alfabetización Digital en la Formación de Competencias Ciudadanas de la Básica primaria. Rev. Eleuthera 2019, 20, 35–54. [Google Scholar]
- OECD. How’s Life in the Digital Age; OECD: Paris, France, 2019. [Google Scholar]
- Muñoz-Repiso, A.G.-V.; Martín, S.C.Y.; Gómez-Pablos, V.M.B. Validation of an Indicator Model (INCODIES) for Assessing Student Digital Competence in Basic Education. J. New Approaches Educ. Res. 2020, 9, 110–125. [Google Scholar] [CrossRef]
- Silva, J.; Morales, M.J.; Lázaro, J.L.Y.; Gisbert, M. La competencia digital docente en formación inicial: Estudio a partir de los casos de Chile y Uruguay. Arch. Anal. Políticas Educ. 2019, 27, 93. [Google Scholar] [CrossRef] [Green Version]
- Redecker, C.Y.; Punie, Y. Digital Competence of Educators DigCompEdu; Publications Office of the European Union: Luxembourg, 2017. [Google Scholar]
- Elliot, J.; Gorichon, S.; Irigoin, M.Y.; Maurizi, M. Competencias y Estándares TIC para la Profesión Docente; Ministerio de Educación: Santiago, Chile, 2011. [Google Scholar]
- Cabero-Almenara, J.; Romero-Tena, R.; Palacios-Rodríguez, A. Evaluation of Teacher Digital Competence Frameworks through Expert Judgement: The Use of the Expert Competence Coefficient. J. New Approaches Educ. Res. 2020, 9, 275–293. [Google Scholar] [CrossRef]
- United Nations. United Nations Policy Brief: Education during COVID-19 and Beyond; United Nations: New York, NY, USA, 2020. [Google Scholar]
- Cortés, F.; De Tezanos-Pinto, P.; Helsper, E.; Lay, S.; Manzi, J.; Novoa, C. ¿Se Ha Reducido La Brecha Digital En Chile? Diferencias Entre Acceso, Uso y Factores Asociados al Empleo de Internet. Midevidencias 2020, 22, 1–6. [Google Scholar]
- Garrido, M. Educar En Tiempos de Pandemia: Acentuación de Las Desigualdades En El Sistema Educativo Chileno. Caminhos Educ. Diálogos Cult. Divers. 2020, 2, 43–69. [Google Scholar]
- Gill, R.J. Graduate Employability Skills through Online Internships and Projects during the COVID-19 Pandemic: An Australian Example. J. Teach. Learn. Grad. Employab. 2020, 11, 146–158. [Google Scholar] [CrossRef]
- Buheji, M.; Buheji, A. Planning Competency in the New Normal—Employability Competency in Post—COVID-19 Pandemic. Int. J. Hum. Resour. Stud. 2020, 10, 237–251. [Google Scholar] [CrossRef]
- Lazarsfeld, P.F.; Henry, N.W. Latent Structure Analysis; Houghton, Mifflin: New York, NY, USA, 1968; ISBN 0-395-04768-4. [Google Scholar]
- Cotrina, M. Modelo de Clases Latentes Multinivel Aplicado a un Caso. Para optar el Título Profesional de Licenciada en Estadística; Universidad Nacional Mayor de San Marcos, Facultad de Ciencias Matemáticas, Escuela Académico Profesional de Estadística: Lima, Perú, 2014. [Google Scholar]
- Goodman, L.A. Exploratory Latent Structure Analysis Using both Identifiable and Unidentifiable Models. Biometrika 1974, 61, 215–231. [Google Scholar] [CrossRef]
- Collins, L.M.; Lanza, S.T. Latent Class and Latent Transition Analysis: With Applications in the Social Behavioral, and Health Sciences; Wiley Series in Probability and Statistics; Wiley: Hoboken, NJ, USA, 2010; ISBN 978-0-470-22839-5. [Google Scholar]
- Gialamas, V.; Nikolopoulou, K.; Koutromanos, G. Student Teachers’ Perceptions about the Impact of Internet Usage on Their Learning and Jobs. Comput. Educ. 2013, 62, 1–7. [Google Scholar] [CrossRef] [Green Version]
- Chandra, P.; Ahmed, S.I.; Pal, J. Market Practices and the Bazaar: Technology Consumption in ICT Markets in the Global South. In Proceedings of the 2017 CHI Conference on Human Factors in Computing Systems, Denver Colorado, CO, USA, 2 May 2017; pp. 4741–4752. [Google Scholar]
- Shala, A.; Grajcevci, A. Digital Competences among Student Populations in Kosovo: The Impact of Inclusion, Socioeconomic Status, Ethnicity and Type of Residence. Educ. Inf. Technol. 2018, 23, 1203–1218. [Google Scholar] [CrossRef]
- Trostinskaia, I.R.; Safonova, A.S.; Pokrovskaia, N.N. Professionalization of Education within the Digital Ecnomy and Communicative Competences. In Proceedings of the 2017 IEEE VI Forum Strategic Partnership of Universities and Enterprises of Hi-Tech Branches (Science. Education. Innovations) (SPUE), St. Petersburg, Russia, 15–17 November 2017; IEEE: St. Petersburg, Russia, 2017; pp. 29–32. [Google Scholar]
- Oberländer, M.; Beinicke, A.; Bipp, T. Digital Competences: A Review of the Literature and Applications in the Workplace. Comput. Educ. 2020, 146, 103752. [Google Scholar] [CrossRef]
- Koh, J.H.L.; Chai, C.S.Y.; Tsai, C.C. Examining practicing teachers’ perceptions of technological pedagogical content knowledge (TPACK) pathways: A structural equation modeling approach. Instr. Sci. 2013, 41, 793–809. [Google Scholar] [CrossRef]
- Sancho, J.M.Y.; Brain, B. Cuando la sociedad digital solo es un eco: El caso de la formación inicial de los maestros de primaria. Digit. Educ. Rev. 2013, 24, 69–82. [Google Scholar]
- Mishra, P.Y.; Koehler, M.J. Technological Pedagogical Content Knowledge: A Framework for Teacher Knowledge. Teach. Coll. Rec. 2006, 108, 1017–1054. Available online: http://punya.educ.msu.edu/publications/journal_articles/mishra-koehler-tcr2006.pdf (accessed on 1 October 2020). [CrossRef]
- Janssen, J.Y.; Stoyanov, S. Online Consultation of Experts’ Views on Digital Competence; JCR Technical Reports; Joint Research Center: Ispra, Italy; European Commission: Luxembourg, 2012; Available online: http://ipts.jrc.ec.europa.eu/publications/pub.cfm?id=5339 (accessed on 1 January 2021).
- García-Valcaracel, A.Y.; Hernández, A. Recursos Tecnológicos para la Enseñanza e Innovación Educativa; Síntesis: Madrid, Spain, 2013. [Google Scholar]
- Pérez-Ferra, M.; Quijano, R. Capacidades Docentes del Profesor Universitario para la Gestión del Currículum; Pantoja, M., Zwvierewicz, R., Eds.; Diversidad y Adversidad en Educación: Jaén, Joxman, 2011; pp. 73–98. [Google Scholar]
- Castellanos Sánchez, A.; Sánchez Romero, C.; Calderero Hernández, J.F. Nuevos Modelos Tecnopedagógicos. Competencia Digital de los Alumnos Universitarios. Rev. Electrónica Investig. Educ. 2017, 19, 1–9. [Google Scholar] [CrossRef] [Green Version]
- Bisquerra, R.; Alzina, R.B. Metodología de Investigación Educativa; La Muralla: Madrid, Spain, 2009. [Google Scholar]
- Strijbos, J.; Engels, N.; Struyven, K. Criteria and Standards of Generic Competences at Bachelor Degree Level: A Review Study. Educ. Res. Rev. 2015, 13, 18–32. [Google Scholar] [CrossRef]
- Ferrari, A. Digital Competence in Practice: An Analysis of Frameworks. JRC Tech. Rep. Com. Eur. 2012. [Google Scholar] [CrossRef]
Figure 1.
Distribution of the sample by age (source: own elaboration).

Figure 2.
Sample distribution by course (source: own elaboration).

Figure 3.
Distribution of the sample (source: own elaboration).

Figure 4.
Model comparison up to 10 classes (source: own elaboration).

Figure 5.
Percentage of participants per class (source: own elaboration).

Figure 6.
General block results for questions X8 to X12 (source: own elaboration).

Figure 7.
General block results for questions X17 to X26 (source: own elaboration).

Figure 8.
Block I results for questions X27 to X38 (source: own elaboration).

Figure 9.
Block II results for questions X39 to X50 (source: own elaboration).

Figure 10.
Block III results for questions X51 to X54 (source: own elaboration).

Figure 11.
Block IV results for questions X56 to X59 (source: own elaboration).


Table 1.
Class selection criteria.
| Class N° | BIC | % of BIC Adjustment | AIC | % of AIC Adjustment | Log-Likelihood | % of LL Adjustment |
|---|---|---|---|---|---|---|
| 1-clase | 514,453 | - | 513,457 | - | −256,574 | - |
| 2-clase | 489,961 | 4.8 | 487,963 | 5 | −243,672 | 5 |
| 3-clase | 481,061 | 1.8 | 478,060 | 2 | −238,566 | 2.1 |
| 4-clase | 476,640 | 0.9 | 472,636 | 1.1 | −235,699 | 1.2 |
| 5-clase | 473,504 | 0.7 | 468,498 | 0.9 | −233,475 | 0.9 |
| 6-clase | 471,106 | 0.5 | 465,097 | 0.7 | −231,619 | 0.8 |
| 7-clase | 469,378 | 0.4 | 462,366 | 0.6 | −230,099 | 0.7 |
| 8-clase | 468,570 | 0.2 | 460,556 | 0.4 | −229,039 | 0.5 |
| 9-clase | 467,851 | 0.2 | 458,834 | 0.4 | −228,023 | 0.4 |
| 10-clase | 467,136 | 0.2 | 457,116 | 0.4 | −227,009 | 0.4 |
Publisher’s Note: MDPI stays neutral with regard to jurisdictional claims in published maps and institutional affiliations. |
© 2021 by the authors. Licensee MDPI, Basel, Switzerland. This article is an open access article distributed under the terms and conditions of the Creative Commons Attribution (CC BY) license (https://creativecommons.org/licenses/by/4.0/).
Share and Cite
MDPI and ACS Style
Burgos-Videla, C.G.; Castillo Rojas, W.A.; López Meneses, E.; Martínez, J. Digital Competence Analysis of University Students Using Latent Classes. Educ. Sci. 2021, 11, 385. https://doi.org/10.3390/educsci11080385
AMA Style
Burgos-Videla CG, Castillo Rojas WA, López Meneses E, Martínez J. Digital Competence Analysis of University Students Using Latent Classes. Education Sciences. 2021; 11(8):385. https://doi.org/10.3390/educsci11080385
Chicago/Turabian StyleBurgos-Videla, Carmen Gloria, Wilson Andrés Castillo Rojas, Eloy López Meneses, and Javiera Martínez. 2021. "Digital Competence Analysis of University Students Using Latent Classes" Education Sciences 11, no. 8: 385. https://doi.org/10.3390/educsci11080385
Note that from the first issue of 2016, this journal uses article numbers instead of page numbers. See further details here.