
Designing a Learning Progression about Micro-Evolution to Inform Instruction and Assessment in Elementary Science


1
Center for Teaching Innovation, Cornell University, Ithaca, NY 14850, USA
2
Graduate School of Education, University of California, Berkeley, CA 94720, USA
*
Author to whom correspondence should be addressed.
Educ. Sci. 2021, 11(10), 609; https://doi.org/10.3390/educsci11100609
Submission received: 17 August 2021
/
Revised: 20 September 2021
/
Accepted: 29 September 2021
/
Published: 2 October 2021
(This article belongs to the Section STEM Education)
Abstract
:This paper gives an example of how to address the challenge of designing a learning progression that describes student thinking, with the necessary specificity to align instructional opportunities and assessment tools. We describe the Conceptual Underpinnings of Evolution project and the iterative process of developing a novel learning progression theory, while critically testing that theory using structured interview data analyzed with Rasch models. We investigate elementary students’ capacities for reasoning in biology, specifically focusing on microevolution as a strategic core idea for students between the ages of seven and nine. The learning progression theory informed the design of two instructional modules which aimed to build on students’ intuitions. The modules provided opportunities for students to engage in scientific practices framed to develop more adequate explanations about how organisms may change over time, in accordance with environmental changes. Aligning the learning progression, instructional activities, and structured interview assessment was critical for meeting two of our underlying assumptions: that students’ reasoning capacities rely on instructional opportunities; and that students’ assessment scores must be interpretable in terms of learning progression levels. We share both initial and late-stage versions of the learning progression and describe how item-level information and Rasch analyses helped both to specify the learning progression levels and to define the two underlying dimensions.
1. Introduction
In Taking Science to School [1] experts describe learning progressions as models of how children’s thinking may develop given appropriately coordinated instruction. The report called for learning progressions to model “successively more sophisticated ways of thinking about a topic that can follow and build on one another as children learn about and investigate a topic over a broad span of time” (p. 214). Since that report, the research literature includes publications about the development of novel learning progressions across fields in science education, including topics related to astronomy, biodiversity, socioecology, energy, matter, buoyancy, and argumentation in science [2,3,4,5,6,7,8,9,10,11].
While some learning progressions are quite broad, spanning multiple grades, recent research has highlighted the need for progressions with fine-grain detail to inform instruction and classroom assessment [12]. Our project contributes to meeting that need by utilizing structured interviews to identify nuances in students’ predictions and explanations about micro-evolution. The detailed model that emerged is essential for supporting educators and researchers in “considering what these potentially complicated pictures of student knowledge mean for future instruction and learning” [12] (p. 161).
Learning progressions can benefit student learning in part by revealing nuances in students’ thinking and informing instructional supports [13], thus enabling the critical alignment between curriculum, instruction, and assessment [14]. The National Research Council report Knowing What Students Know refers to this alignment as “horizontal coherence” [15]. We see this alignment as a critical component in designing effective instructional activities and assessment tools, given that students’ understandings necessarily build on their existing intuitions, and instructional activities can strategically leverage those intuitions to encourage more accurate understandings. Because children do not progress through stages of understanding in a lockstep way, the value of learning progressions in this context is not to assign a score, but rather to document the range of ideas students express as they develop richer understandings. In this context, the empirically validated learning progression levels also provide novel evidence of students’ capabilities.
This paper presents a model for developing a complex learning progression with the power to align instructional opportunities and assessment tools within elementary science classrooms. We describe the iterative process of developing this novel learning progression theory, while critically testing that theory using qualitative methods and item response theory models. Aligning the modules, learning progression, and structured interview assessment was critical for meeting two of our underlying assumptions; students’ reasoning capacities rely on instructional opportunities, and students’ assessment scores must be interpretable in terms of learning progression levels.
This project was designed to investigate elementary students’ capacities for reasoning in biology, specifically focusing on microevolution as a strategic core idea for second and third grade students (7–9 years old). The curricular context included modules about animals and plants and their natural diversity. Students explored the organisms’ habitats, traits and needs, and their structures and functions, working up to thought experiments about environmental stressors. A set of instructional design principles guided the design of these modules as quoted below [16]:
- Frame instruction in accordance with a learning progression that systematically mines students’ intuitions and emergent ideas.
- Develop children’s conceptual understanding and explanatory power in the context of scientific knowledge-building practices.
- Design instruction to problematize key ideas within the children’s participation in scientific practices.
- Maximize the power of children’s reasoning within these practices by concentrating their inquiry on a single domain, and particular organisms within that domain that they study in-depth. (p. 3).
For students in second and third grades, the focus on microevolution enabled reasoning at smaller time scales within population systems where changes are easier to trace compared to macroevolutionary contexts. Microevolutionary concepts also allow for the basic mechanism of natural selection to be taught while mitigating some common misunderstandings about evolution, such as control by an external agent, the existence of an ideal ultimate form, or the inadequate consideration of variability. This topic also provided an opportunity to engage students in rich epistemic practices, supporting even young students to learn science by doing science as prioritized in A Framework for K-12 Science Education [17].
Designing a Learning Progression about the Conceptual Underpinnings of Evolution
A learning progression aimed at developing the extraordinarily complex conceptual terrain of evolution will need to extend far beyond this elementary school context. Thus, we defined the learning progression within a particular grade-span (7–9 year old students) for the purpose of this project, and we also considered how it will enable deeper understandings at subsequent grade levels. In our preliminary plan, we anticipated that the learning progression would foreground variation of organisms and variation of environments, with increasingly powerful explanations of the relations between the two. In the context of this relation, the progression would build understandings of the following key concepts: variation between-species and within-species, structure/function, limiting factors, survival advantage, and change over time.
The learning progression would emphasize the perspective of the relation between individual organism, population and environment. An ecological perspective would be limited to that needed to understand this relationship (e.g., the survival value of different inheritable traits of a population within a particular environment). The cellular level would be excluded, as would change beyond the scale of short-term changes, in parallel with microevolution. The progression would not aspire to have children understand the genesis of new species, but rather consider changes in the variability of a population that can occur through either differential survival or human-guided selection.
The basic idea of survival advantage is key to understanding natural selection and, in our experience—in some forms and contexts—within the reach of primary grade children. From our prior work and the work of others [18], we knew that young children can also grasp the idea that organisms even within the same species are different from one another. We contend that under some instructional conditions, children can also grapple with the idea that sometimes those differences can affect which individuals have the best chance to survive and have offspring that survive. The progression emphasizes elaboration of these ideas, as they are so central to natural selection.
Early points in the progression take up (a) the diversity of organisms within the respective kingdom and the diversity of environments where organisms live; and subsequently (b) what organisms thrive where and why, considering the limiting factors of different environments and how different organisms can be adapted to the same environment, meeting their basic needs through a broad diversity of structures. The emphasis on survival advantage as an explanatory construct gradually increases. In order to elaborate this concept, the modules develop the idea of within-species variation and add that some of these differences are inherited traits. While the initial phase of each module focuses on the relation between organisms and environment at one point in time, later investigations add the complexity of change over time in the environment and how this can affect the survival value of different inheritable traits. Finally, because we conjecture that stories of human-guided selection (as in the domestication of dogs and the introduction of Brassica rapa Fastplants) could help children understand the key contrasting case of change that may come about through the survival value of a trait in a particular environment, modules explore the parallels and differences.
Within this frame, children can begin to grapple with facets of the relation between organism and environment that are key to understanding the mechanism of natural selection at this and broader system levels. This framing is strategic for enabling some explanatory power at this early point in the progression, as well as empowering subsequent knowledge-building towards a much more complete understanding of the theory.
Beyond defining the content of the learning progression, we also specified learning progression design principles that would function as constraints and guide construction of the pedagogy (i.e., the goals and activities of the lessons and how they developed over time):
- Design the learning progression such that it supports increasingly powerful explanations, from the children’s perspective. We view this principle as crucial for several reasons, including: (a) conveying the power and purpose of science, (b) providing a basis for preferring subsequent explanations, and (c) fostering children’s interest in the discipline. Most primary school science curricula violate this criterion, with content that will only prove to have explanatory power when linked to concepts reserved for older grades.
- Focus the learning progression on the issue of the fit of organisms to their environment. This issue underlies evolutionary theory and, on a radically different level, accords with young children’s interests in why things are the way they are and the origins of things. Thus, it is a strategic focus for conceptualizing steps in a learning progression, building from children’s incoming ideas toward increasingly powerful explanations.
- Focus on biological systems at the level of organisms, populations of organisms and their environment, and change at the level of microevolution. This focus reduces the complexity and scope of changes over time that the children need to consider. Nevertheless, it enables development and application of such core ideas as biodiversity, structure/function, limiting factors, survival advantage, natural selection, and change over time. Key understandings relegated to later grades include elaboration of an ecological perspective, the cellular level, and the origin of species.
- Build knowledge of phenomenology before explanation thereof. The learning progression is designed to build increasingly powerful explanations in a way that can be supported by children’s increasingly rich knowledge of the phenomenology to which they are applying these explanations.
- Build the progression in a way that addresses core buggy conceptions and capitalizes on fruitful preconceptions.
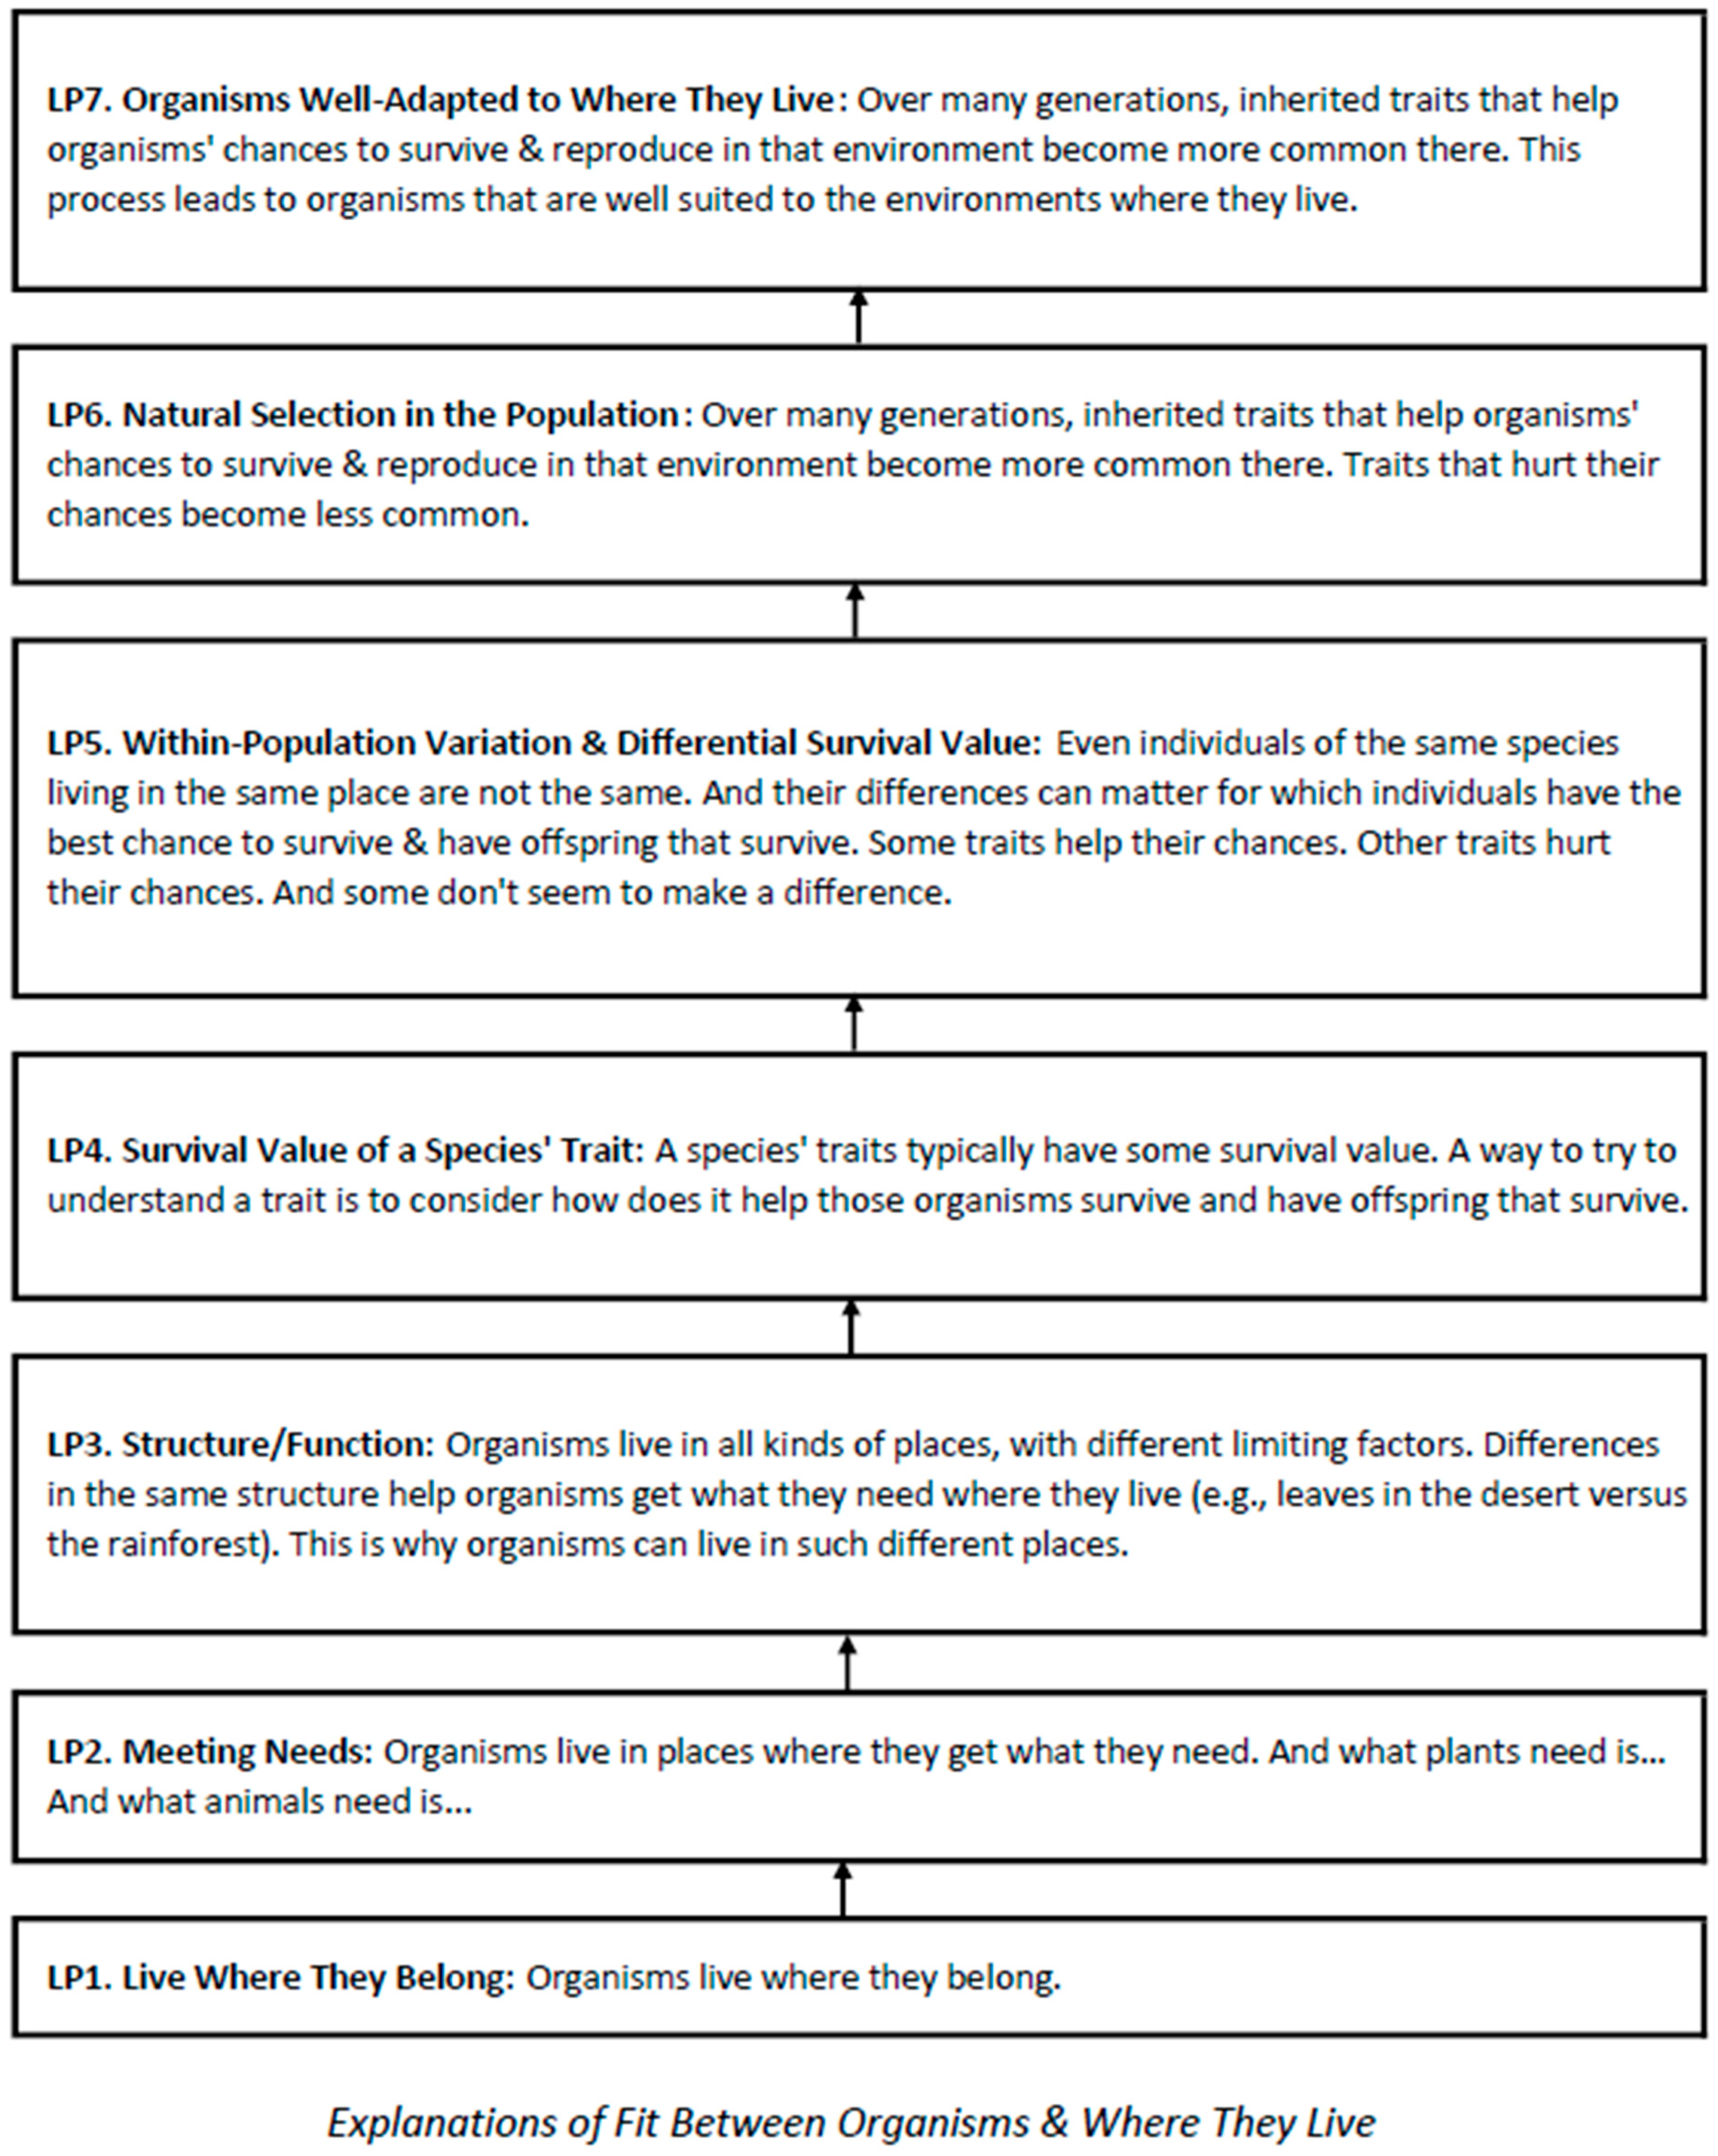
Applying these design criteria to the scope of microevolutionary concepts described above, we initially composed a sequence of seven increasingly powerful explanations of the relationship between organisms and environment that constitute the core of the learning progression shown in Figure 1.
The initial step of the learning progression, labeled LP1 at the bottom of Figure 1, is not one we expect to teach, but rather the lowest level of understanding that we anticipate observing in this student population of lower SES elementary school students. We assumed that children would come to school with some understanding of the two most basic levels: explanation of the fit in terms of the simplistic idea that organisms “Live where they belong” (Level LP1) and the more adequate idea that organisms “Live where they can get what they need” (Level LP2). While children begin school with some ideas about what organisms need, the curriculum aimed to develop these understandings further.
Level LP3 identifies the idea that differences in the same biological structure help different kinds of organisms get what they need where they live. At this level, students might explain how organisms are able to get what they need in particular environments, on the basis of the fit between their structures and the functions these structures afford (e.g., thick leaves storing water) and limiting factors of the environment where they lived (e.g., little water in the desert). The instruction could build on the early intuitions that children have about structure/function, but it also needed to substantially elaborate the structure/function idea and build knowledge of contrasting environments and their limiting factors.
Level LP4 describes the fit between organisms and their environment in terms of the survival value of a particular trait (e.g., the presence or absence of the ridge on the male crickets’ wing that enables them to chirp). Survival value or cost–benefit analysis may be intuitive at some level in some contexts; for instance, it is not unrealistic to consider that a child might wonder if it is worth trying to retrieve a ball from a playground bully. Yet, we doubted children ever considered animal or plants’ traits from this perspective. We anticipated the need for significant scaffolding at this and the following levels.
Level LP5 elaborates the idea of fit to include the big idea that the relative frequency of traits can change in the same generation, because traits conveying survival disadvantage may die off sooner. Traits can also have reproductive advantage, influencing which individuals have offspring. We assumed the children would need scaffolding to reason in terms of distributions and their relative frequency.
The next step, natural selection (Level LP6) involves conceptualizing the cumulative impact of differential survival value of traits over the course of many generations. Inherited traits that help organisms’ chances to survive and reproduce in that environment become more common there and conversely traits that hurt their chances become less common.
The highest level (Level LP7) encompasses the outcome of the mechanism of natural selection, namely organisms are well-adapted to where they live. At this point, children evoke the mechanism of natural selection to explain the state of good fit between organisms and their environment.
2. Materials and Methods
2.1. Interview Protocol and Data Collection
We assessed student understanding using a structured interview protocol that was informed by prior classroom-based research in these domains [19,20,21,22,23] and directly related to the instructional modules that were created specifically for this project. We mapped each item to levels within the learning progression and documented quotations from student responses that exemplified the learning progression levels. We coded each response in terms of these levels, noting students’ quotations that served as warrants for the coding decisions. There were 18 items spread across 10 tasks, and two of these tasks were directly related to specific organisms referenced during instruction (cricket and Brassica rapa). We administered and videotaped the interviews at the beginning and end of the curricular modules for four cohorts of students at two educational sites: (1) summer school site in year 1; (2) summer school site in year 2; (3) regular school year site in year 1; (4) regular school year site in year 2. Each cohort was administered a subset of ten tasks. Research team members who had previously worked as elementary school teachers taught the modules during the summer program, and classroom teachers took on that role during the regular school year.
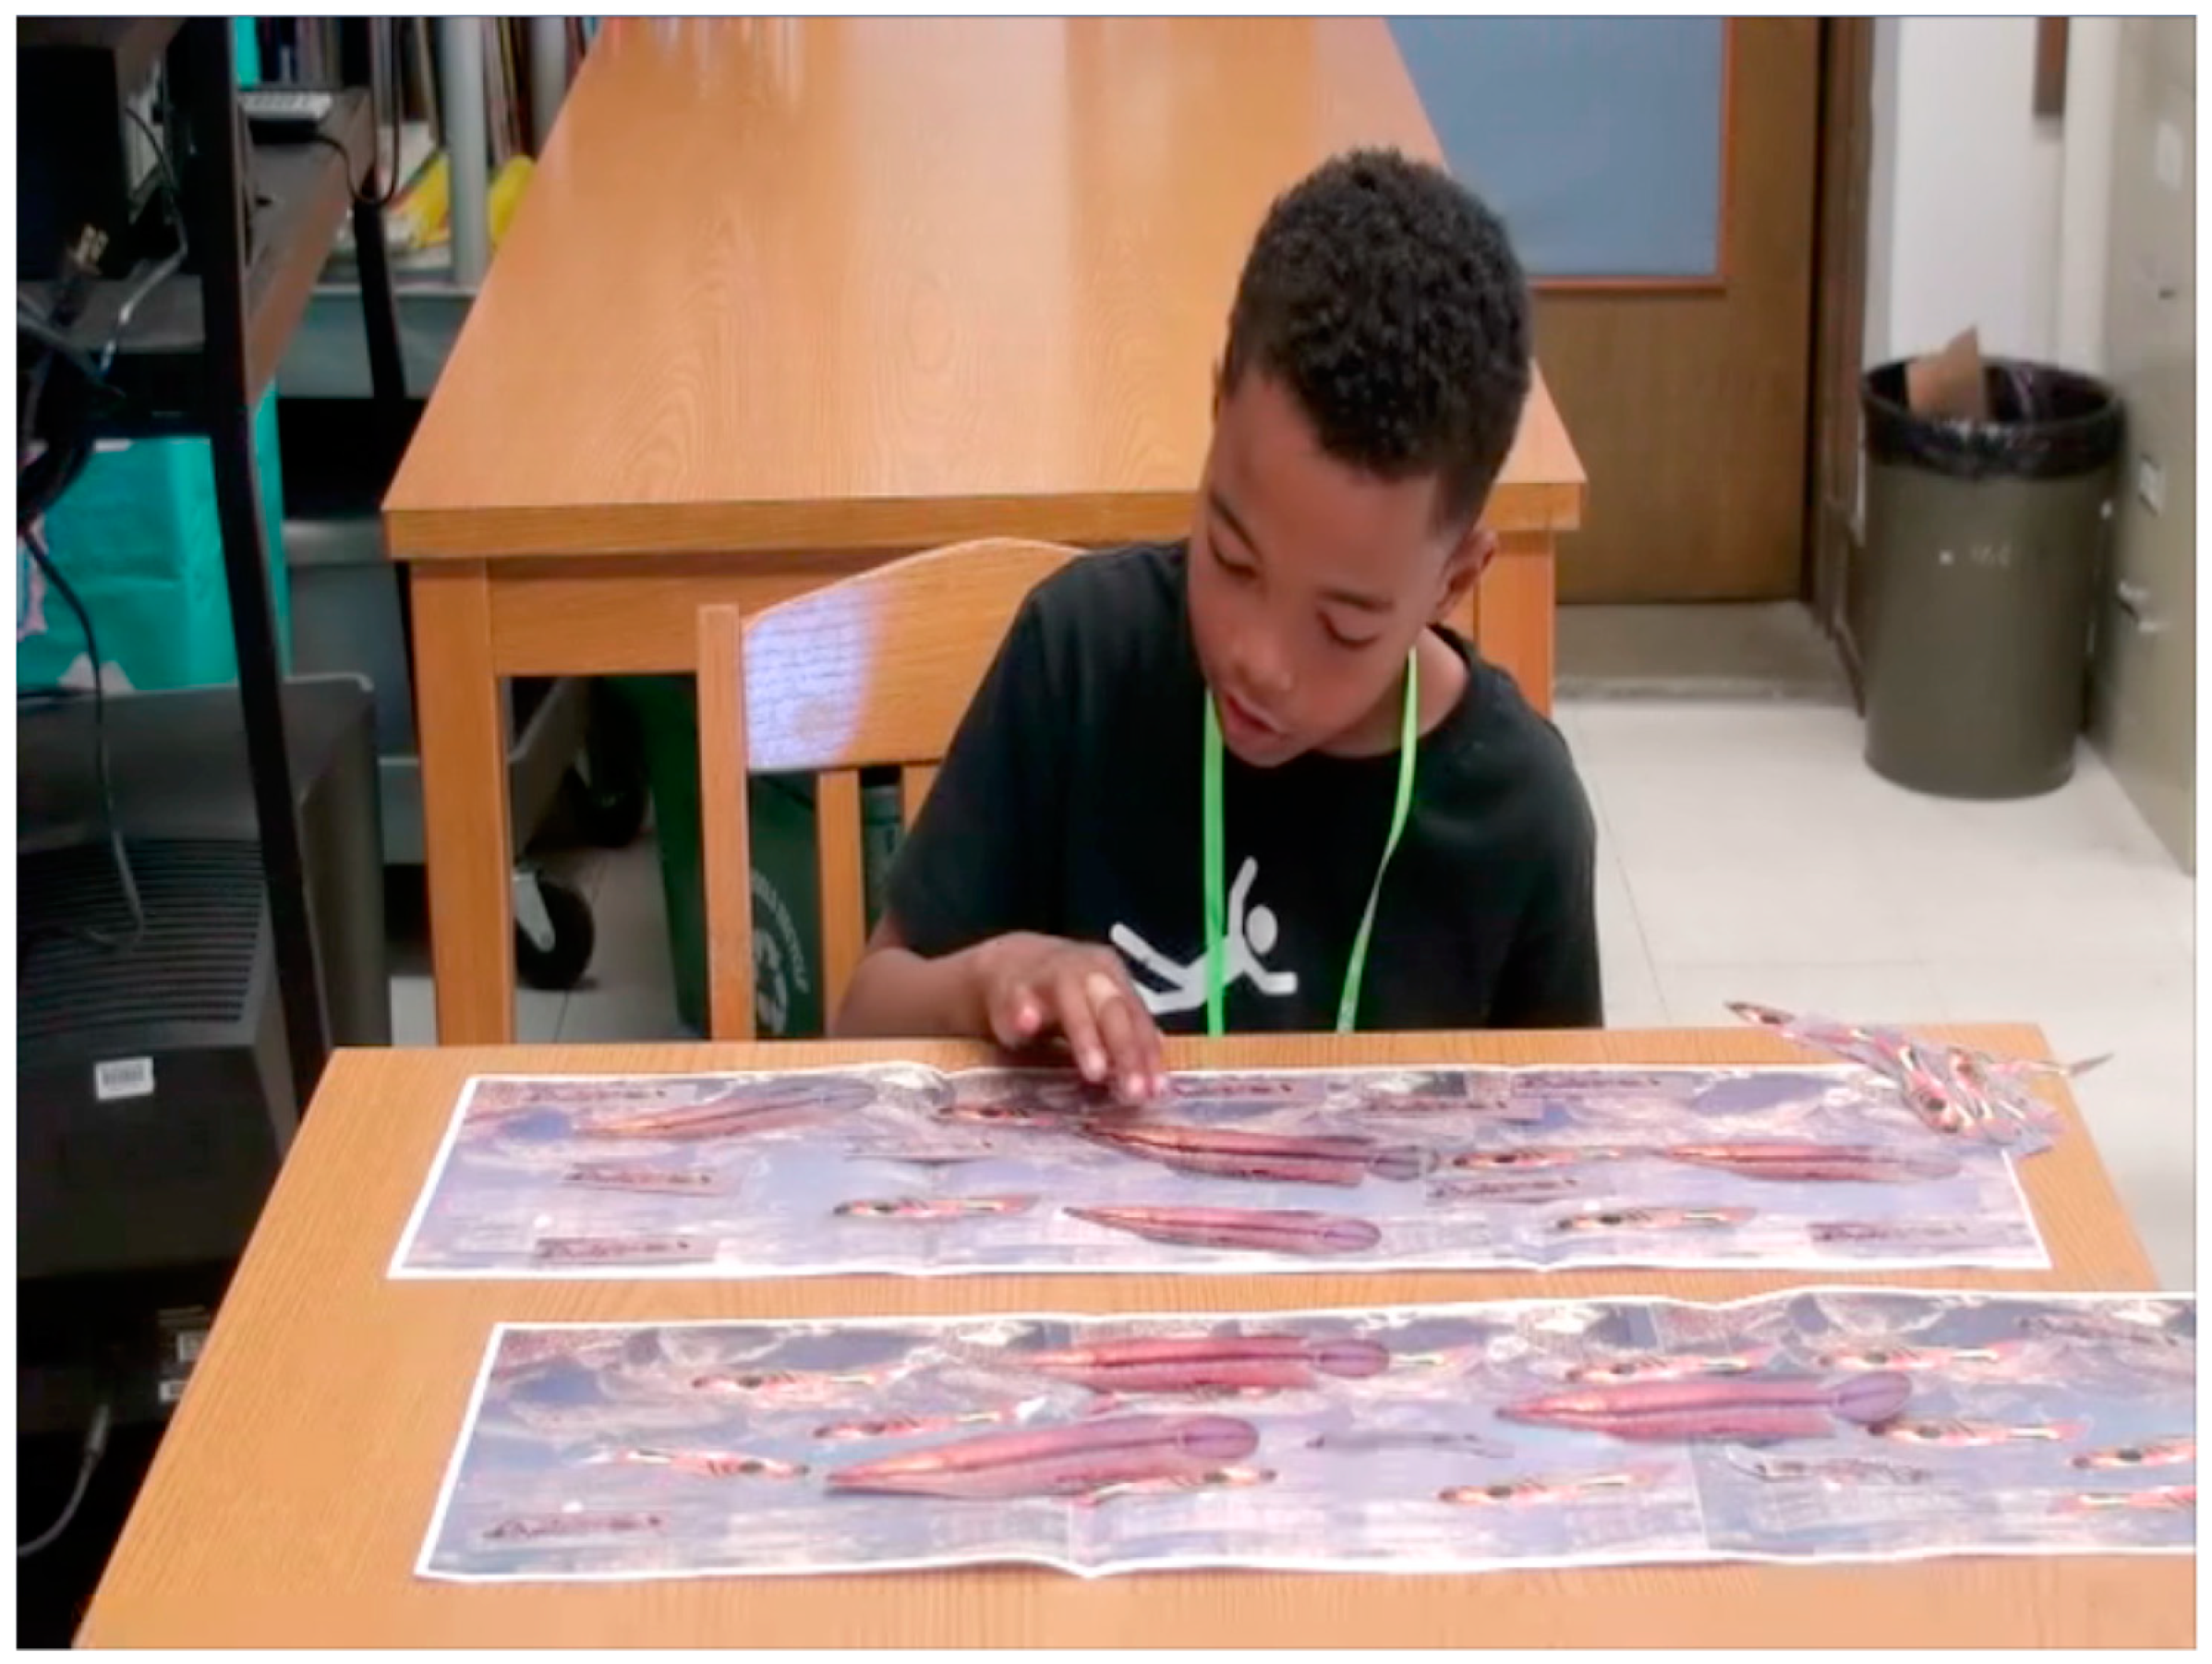
All students participated in interview questions about microevolutionary concepts in the context of Brassica rapa, cheetahs, crickets, and guppies. The questions about Brassica rapa and crickets were directly related to the instructional activities, and additional transfer items were generated by the research team [24]. For example, the Cheetah item was previously used in research [25] and the Guppy items were framed in terms of the biology research literature [26]. The three guppy items involved a pool of guppies where the prevalence of a camouflage trait changes over time depending on the introduction of a predator fish. In these items, students are asked to use manipulatives, predict, and explain how the distribution of the camouflage trait will change over time and in response to the predator (see Figure 2). In another example, students are asked about how the trait of chirping among crickets become more or less prevalent over time, also in response to a predator (see Appendix A).
For our research purposes, we ultimately coded pre and post interviews for all students at the summer school site (64 students with full pre-post data) and a subsample of students at the regular school site (70 pre-interview and 123 post-interviews). The sites were in two different urban school districts in Northern California where the percent of students who qualified for reduced or free lunch varied from 42% (summer school) to 65% (regular school site). Our early analyses included only the data from the summer school site, comprised of pre-post interviews for 64 students from the summer school site, as noted in the unidimensional findings below. Later in the project, our multi-dimensional analyses included 250 interviews across the two sites over two years. We note that these sample sizes are relatively small, but the information gleaned from the analyses was critical for our work.
We conducted a rigorous coding process where the majority of cases were double-coded and the principal investigator was involved in resolving any disagreements. Only after establishing at least 80% agreement did we single code a subset of the interviews at the end of the project. Ultimately, 61% of the final codes were double-coded. The process of coding student responses, achieving consensus on coding disagreements, and revising the coding guide to differentiate between codes and add emerging categories was a critical research activity for linking the empirical and theoretical bases for the learning progression theory.
For example, within LP4 which focused on survival value (SV), coders observed multiple conceptions among students related to the variation of a trait with SV: individuals of the same kind can have different traits at different life stages or due to sex differences (LP40); individuals of the same kind are not exactly the same across generations (LP4A); and even individuals of the same kind living together at the same point in time are not identical (LP4B). In each of these cases, students expressed only a partial understanding of the full survival value concept we classified as LP4. Considering LP4A, one student explained:
“Maybe the cheetahs long before…long before…didn’t catch that much animals. And then, then they didn’t have any more, that much energy to run. So then that’s why the cheetahs can’t run real fast, long before. And now the cheetahs are fast and they catch animals and has more energy.”
Here, we see evidence about the value of being able to catch prey to give an animal energy, but not a full articulation of survival value. See Appendix B for the related coding book excerpt with more details about the LP4A category.
While we coded student responses according to these different ways of articulating the nuances of trait variation, there were very few cases in the subcode categories within LP4, and the statistical models did not quantitatively differentiate between them. Accordingly, we include these categories in the coding book and more sophisticated versions of the LP, but we have not validated the hierarchical order of these subcodes within the LP4 level. In the future, understanding more about whether these sublevels are ordered, or not, would improve the learning progression theory and potentially provide additional useful details for teachers.
Similarly, our understanding of the structure/function level (LP3) evolved over the course of the project. Early on, we coded responses as LP3 if students included ideas about animal or plant structures and their functions helping to meet organisms’ needs and improve their chances for survival. During the coding process, the emergence of meaningful nuances within LP3 led to additional specification that we articulated in later versions of the coding book:
- LP30. Some specific function of the organism that enables it to live under particular environmental condition… no specification of structure.
- LP3A. Some structure of the organism enables particular function or behavior of the organism
- LP3B. Some structure of the organism enables organism to live under particular environmental condition(s).
- LP3C. Some structure of the organism enables particular function or behavior of that organism that enables it to live under particular environmental condition(s).
While we did not presume a conceptual order for the first three subcodes, the LP3C level required their integration which signaled a higher level on the LP. This differentiation of substeps within LP3 reflects our refined understanding of the components within the development of children’s structure-function-environment explanations, which we develop further below.
2.2. BEAR Assessment System and Item Response Theory
The early learning progression theory described above served as a basis for both instructional activities and a one-on–one structured interview protocol that was administered at the beginning and end of each curricular module. Researchers’ experiences in the classrooms and the analysis of interview responses provided information that further refined our theory about how the learning progression levels were ordered and how many unique dimensions there were. These analyses also led to additional instructional strategies for supporting students’ understanding of microevolution. Amid these adjustments, the learning progression served to connect the instructional opportunities and the structured interview questions in crucial ways.
Our analytical process followed the BEAR Assessment System [27,28]. This system is a cycle of assessment development activities that starts with (a) the specification of a learning progression, then (b) centers item development on one or more of the levels in the learning progression, which leads to (c) coding of the student responses to the items in terms of those levels, and then (d) analyses the resulting data in a way that is focused on those learning progression levels. The cycle iterates when discrepancies between the initial hypotheses and the results of the analyses are interpreted as leading to modifications in (a) through (c). This process ensures that the learning progression theory, the item design, coding, and scoring, and the analyses are aligned, which provides a firm basis for investigating validity. The BEAR assessment system provides one strategy for validating constructs, learning progressions, and related assessments, and other publications have proposed similar approaches [29,30,31,32,33]. While validation systems may vary by how they define procedural steps or stages, they each attempt to provide validity evidence through a series of analyses about the content scope, and the connections between the theory, items, and analysis which are the focus of this study. Additional validity concerns related to external variables and real-world implications are also important to note at later stages of development. We note two examples in the literature where researchers conducted studies to explicitly examine how the learning progression theory mapped to student responses before and after related instruction [34,35].
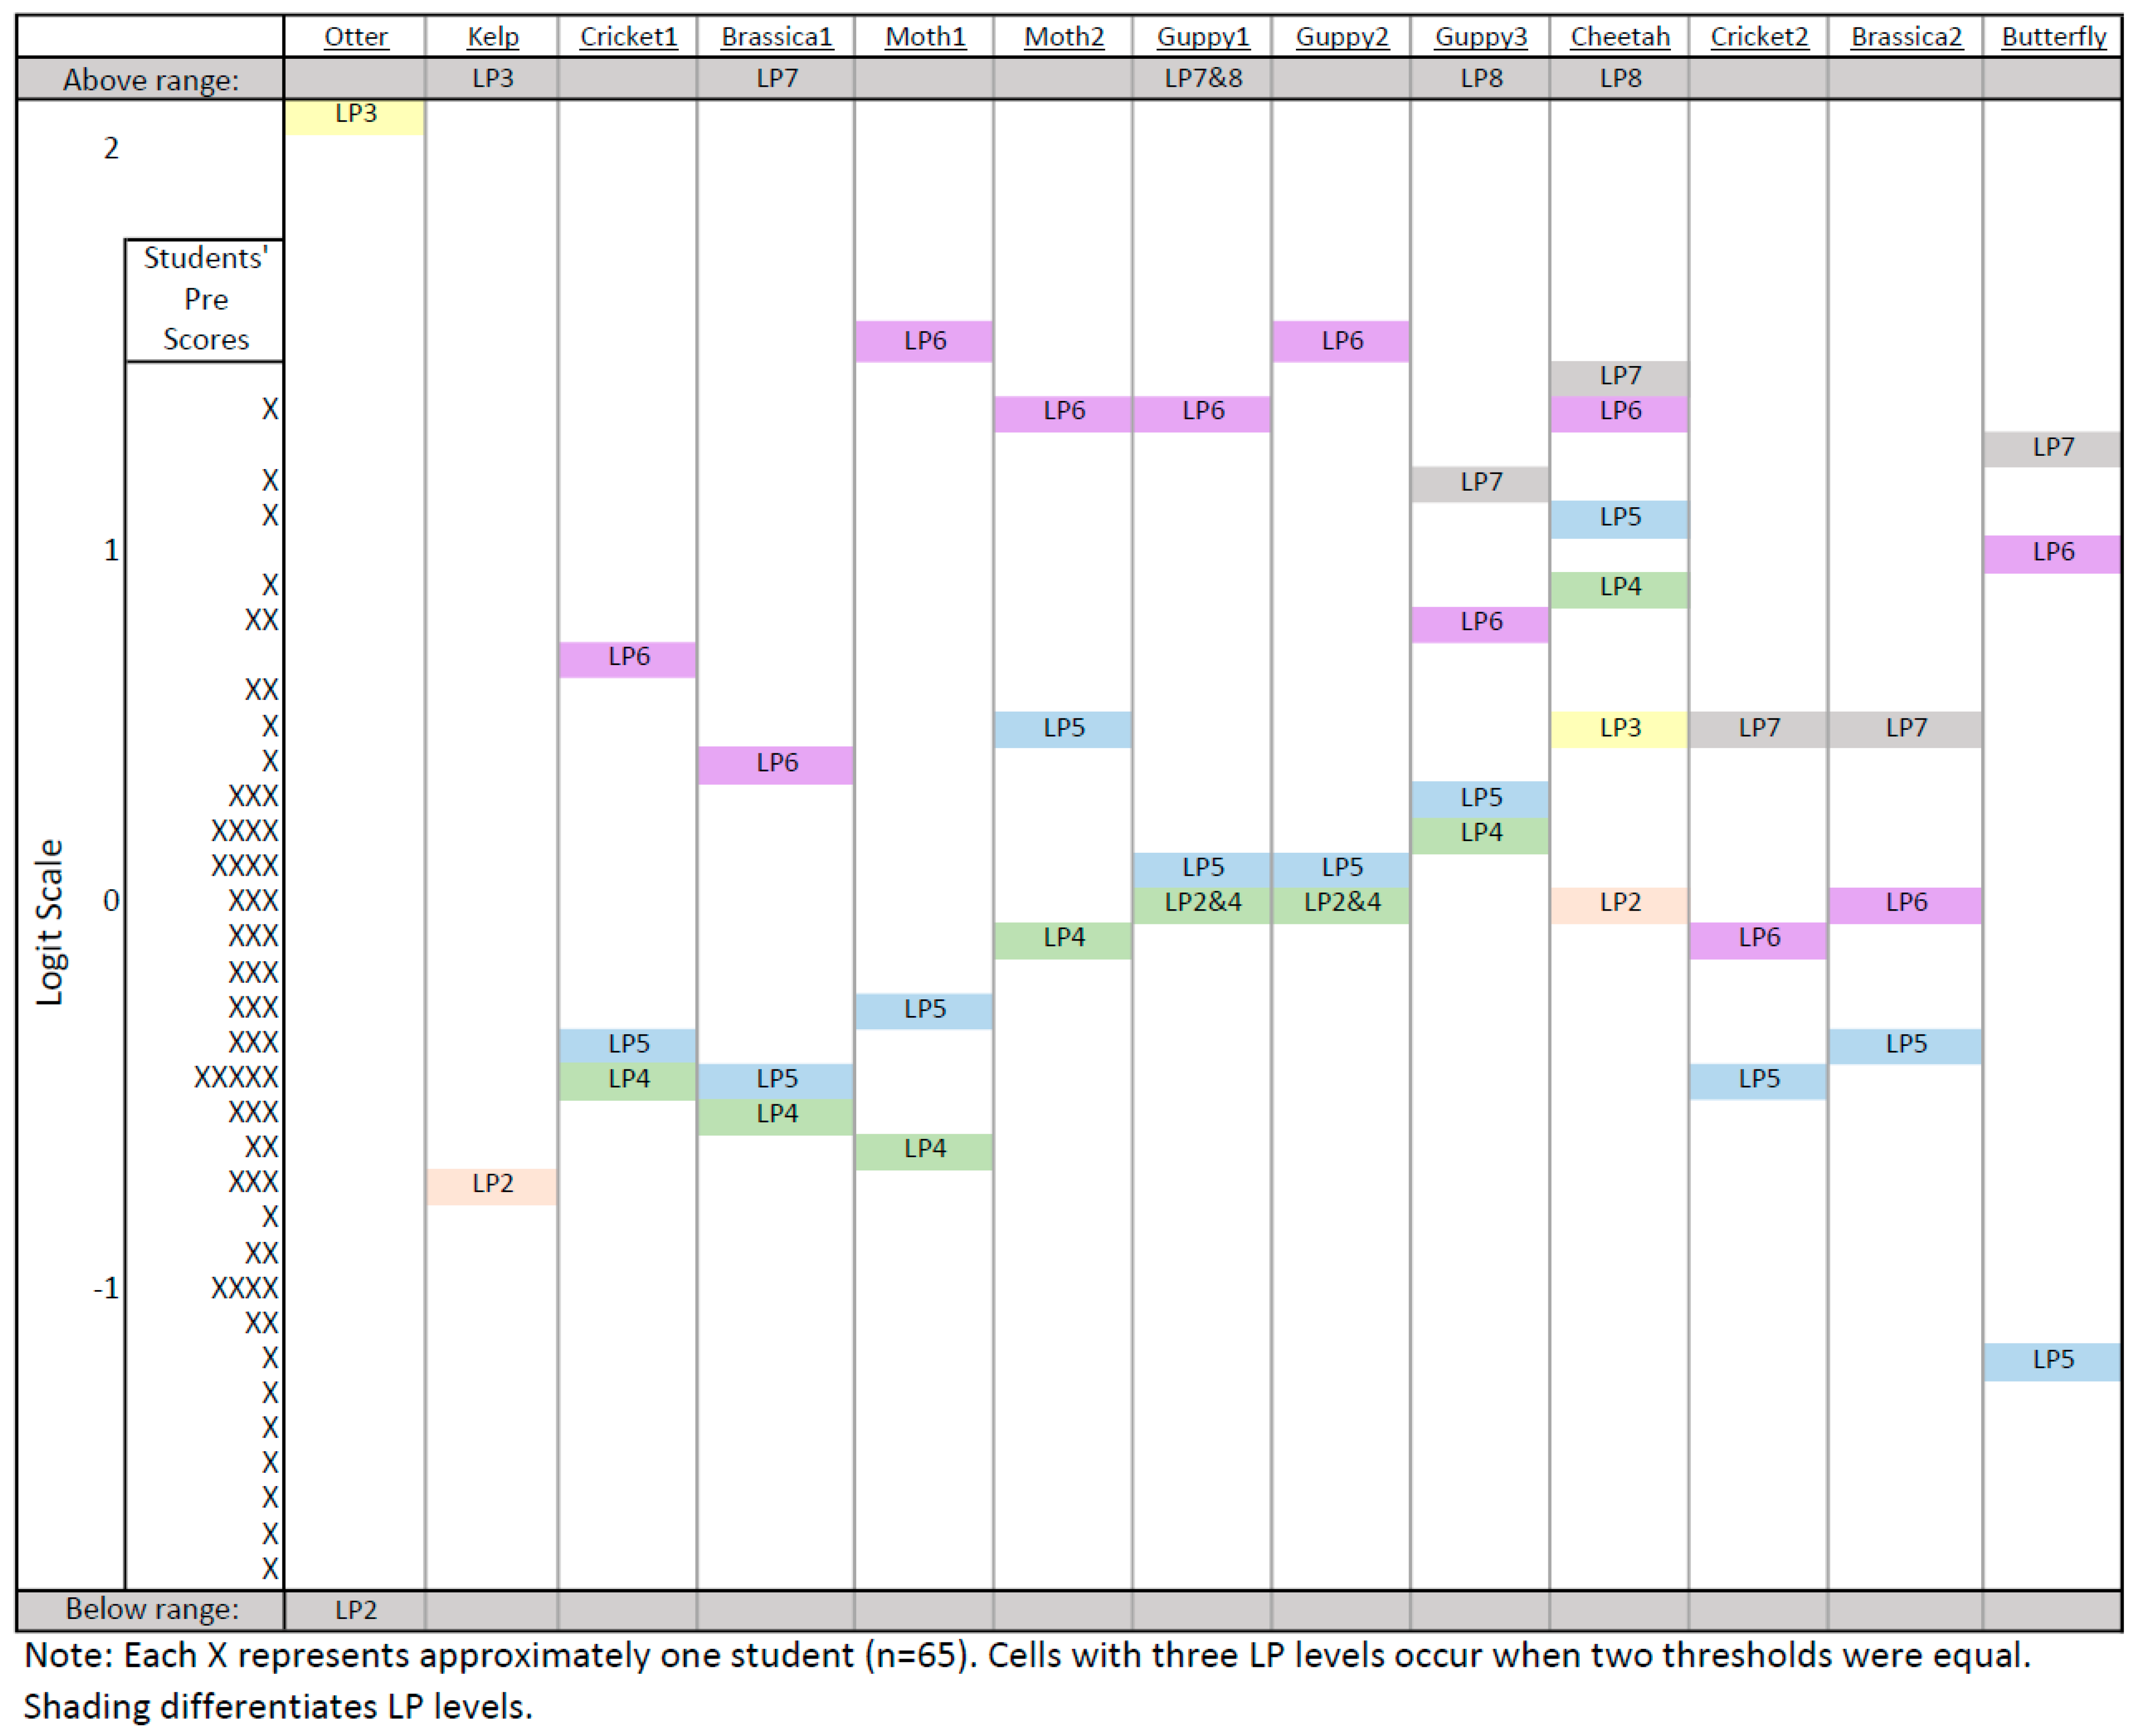
We relied on item response theory (IRT) to provide student-level and item-level findings, including statistics related to internal consistency, item fit, and item step order. Specifically, we used Rasch models to examine both unidimensional and multidimensional theories, including the partial credit item response model [28,36] and its multidimensional extension [37,38]. In this study, Rasch analysis was critical for testing the proposed learning progression structure. It was uniquely useful for providing adequate detail to examine the psychometric properties of both the items and the threshold levels within items. Compared to Classical Test Theory where analyses model individuals’ responses, IRT models analyze the probability of an individual’s responses. They produce estimates of individuals’ scaled scores, item difficulties, and threshold locations. These estimates are all reported on a logit scale, which is the basis for the Wright map; see Figure 3 for a related example that helps researchers understand relationships between individuals’ scores and the relative difficulties of thresholds across items. Calibrating these models using the ACER ConQuest program [39], we were able to estimate both item difficulties and student proficiencies simultaneously, and to produce maps that juxtapose the distribution of student scores alongside the related item threshold locations. These detailed analyses are especially critical for studying learning progressions when researchers need to examine the levels within a progression, and the corresponding response categories within an item. Of course, this usefulness depends on the alignment of item response categories with levels, an important element of the BEAR Assessment System described above.
In terms of analyzing fit, our focus is primarily on the parameters within the models, and only global in terms of comparing the one- and two-dimensional models. For that purpose, we used AIC statistics [40] to compare the two models while considering how well the theory fit the empirical data. We also examined how the levels were aligned across the two proposed dimensions by applying the Delta Dimensional Alignment (DDA) approach [41,42]. This approach is important for examining the relationship between thresholds across dimensions because the multi-dimensional model constrains the means of both dimensions to be 0. In reality, we expect that the mean for one dimension might vary from the other, and we can use information from unidimensional analyses of each dimension to better understand how the two dimensions relate. Using DDA, we rescaled the item-related parameters from the multi-dimensional model around the means from each dimension’s unidimensional model. This technique was critical later in the project when we established two dimensions in order to consider which levels on the State dimension aligned with those on the Process dimension.
3. Results
3.1. The Initial Unidimensional Model
To better understand how the items were functioning and whether response patterns supported the learning progression theory, we utilized a partial credit, unidimensional Rasch model to generate preliminary findings based on the unidimensional learning progression in Figure 1. This model was proposed early in the project when we only had coded data for one site. Our sample included coded interviews for 64 students, each with a pre and post interview.
Despite the small sample size and lack of true conditional independence between individuals’ pre and post responses, this preliminary model was critical for better understanding how trends in student responses mapped to the learning progression theory, especially with regard to the hierarchical order of learning progression levels. This model included responses to thirteen items that were coded based on the learning progression levels for 64 interviews. The items were coded from scenarios about eight organisms in the structured interview: Brassica rapa, Butterfly, Cheetah, Cricket, Guppy, Moth, Otter, and Kelp. We examined the fit of the items in this model using the weighted mean square (WMSQ) statistics [28,43]. All items had WMSQs within the expected range except for Moth2 which was unexpectedly varied (WMNSQ = 1.36). We also found a person separation reliability value of 0.76 for the expected a priori (EAP) estimates, showing moderate internal reliability; this value is the equivalent of Cronbach’s alpha, following the translation of the raw scores (used in Cronbach’s alpha) into estimates on the logit scale, based on the Rasch model calibration [28,43].
The most valuable results provided by this early analysis described how the relative difficulty of item thresholds were ordered. The hypothesized learning progression in Figure 1 presented the seven learning progression levels as a unidimensional construct in which the levels are ordered hierarchically, from least to most sophisticated response category. The threshold map produced by the IRT analysis provides a visual representation we use to examine the relationships between levels across items (see Figure 3). Because both estimated student scores and item thresholds are scaled in logits, they can be juxtaposed in powerful ways.
The Xs on the left-hand side of Figure 3 represent each students’ estimated score. Within the columns for each item, the thresholds between levels are noted. The LP3 threshold levels are shaded in yellow and show the locations where students at that logit level are equally likely to score above or below that threshold. While the learning progression model suggested that LP3 would lie below LP4, the empirical findings show it is actually located multiple levels above. Note that the LP3 thresholds for the Otter, Kelp, and Cheetah items are located above levels 4–7 on other items, discussed in more detail below.
This map informed two types of analyses that were crucial early in the project: (i) examining the degree to which learning progression levels were differentiated within an item; and (ii) examining whether learning progression level difficulties were similar across items. Regarding the first of these analyses (i), we found multiple instances where different levels were extremely close together, such as LP4 and LP5 in the Brassica1 and Cricket1 items. These categories often had too few respondents to be adequately differentiated in this model, hence we re-examined them in more detail in the larger data set later in the project.
Regarding the second type of analyses (ii), the extremely high location of LP3 (Structure/Function) on the Otter, Kelp, and Cheetah items corresponded with the coding team’s qualitative finding that it was uncommon for students to articulate how organisms’ structures relate to functions. Instead of appearing at the theorized location beneath LP4 (survival value), LP3 (structure/function) appeared at or above LP6 on all other items. This finding inspired two related questions: Would other items targeting the structure/function level elicit responses with structure/function concepts more frequently? If structure/function is qualitatively different than the other levels, does that imply that it is a second dimension? We re-examined these questions during the conceptualization of a two-dimensional version of the learning progression, described below.
Notably, the Otter and Kelp items presented images of plants and animals in their natural habitats, and asked students about why they lived there, if they could live in other places, and why or why not (see Appendix A). We found it was common for students to respond at LP2, mentioning that organisms need certain things to live, but the questions did not evoke student responses about LP3, how structures relate to functions that help organisms meet their needs (e.g., fur providing warmth), which had been expected. Accordingly, we developed additional items to elicit student responses about structure/function in more detail.
The items that were not targeted at structure/function relationships showed similar patterns with responses ranging from LP4 (survival value) up through at least LP6 (natural selection in the population). These items came from tasks about crickets, Brassica rapa, moths, and guppies, in which interviewers described a habitat with visuals and manipulatives, and students were asked to explain their predictions about how the distributions of traits would change over time given environmental stressors. They were designed to elicit children’s ideas about situations involving microevolution, where a normative interpretation would entail ideas of about how traits help or hurt organisms’ chances of survival and how the distributions of those traits would change over time (see Appendix A). For these items, it was not uncommon for students to identify the survival advantage of traits (e.g., camouflage) even at the pretest, as shown in Figure 3 where the pre-interview scores shown as X’s on the left overlap with the LP4 thresholds for each item. This map shows item thresholds located at their estimated level of difficulty (e.g., “LP3”) and estimated locations of student scores (represented by Xs).
3.2. Developing the Two-Dimensional Learning Progression via Coding Book Development
The Rasch analyses provided reliability and item fit statistics, and item threshold information that suggest the learning progression theory was generally strong overall. Yet, there were a few signaled areas where the detail or order of particular learning progression levels were not adequately supported by the empirical data, such as the unexpectedly high difficulty of the LP3 level noted above. We used these findings, as well as observations of classroom interactions and student interview responses to modify, extend, and elaborate the learning progression model to capture the full range of reasoning that children exhibited, as codified in an extensive coding book.
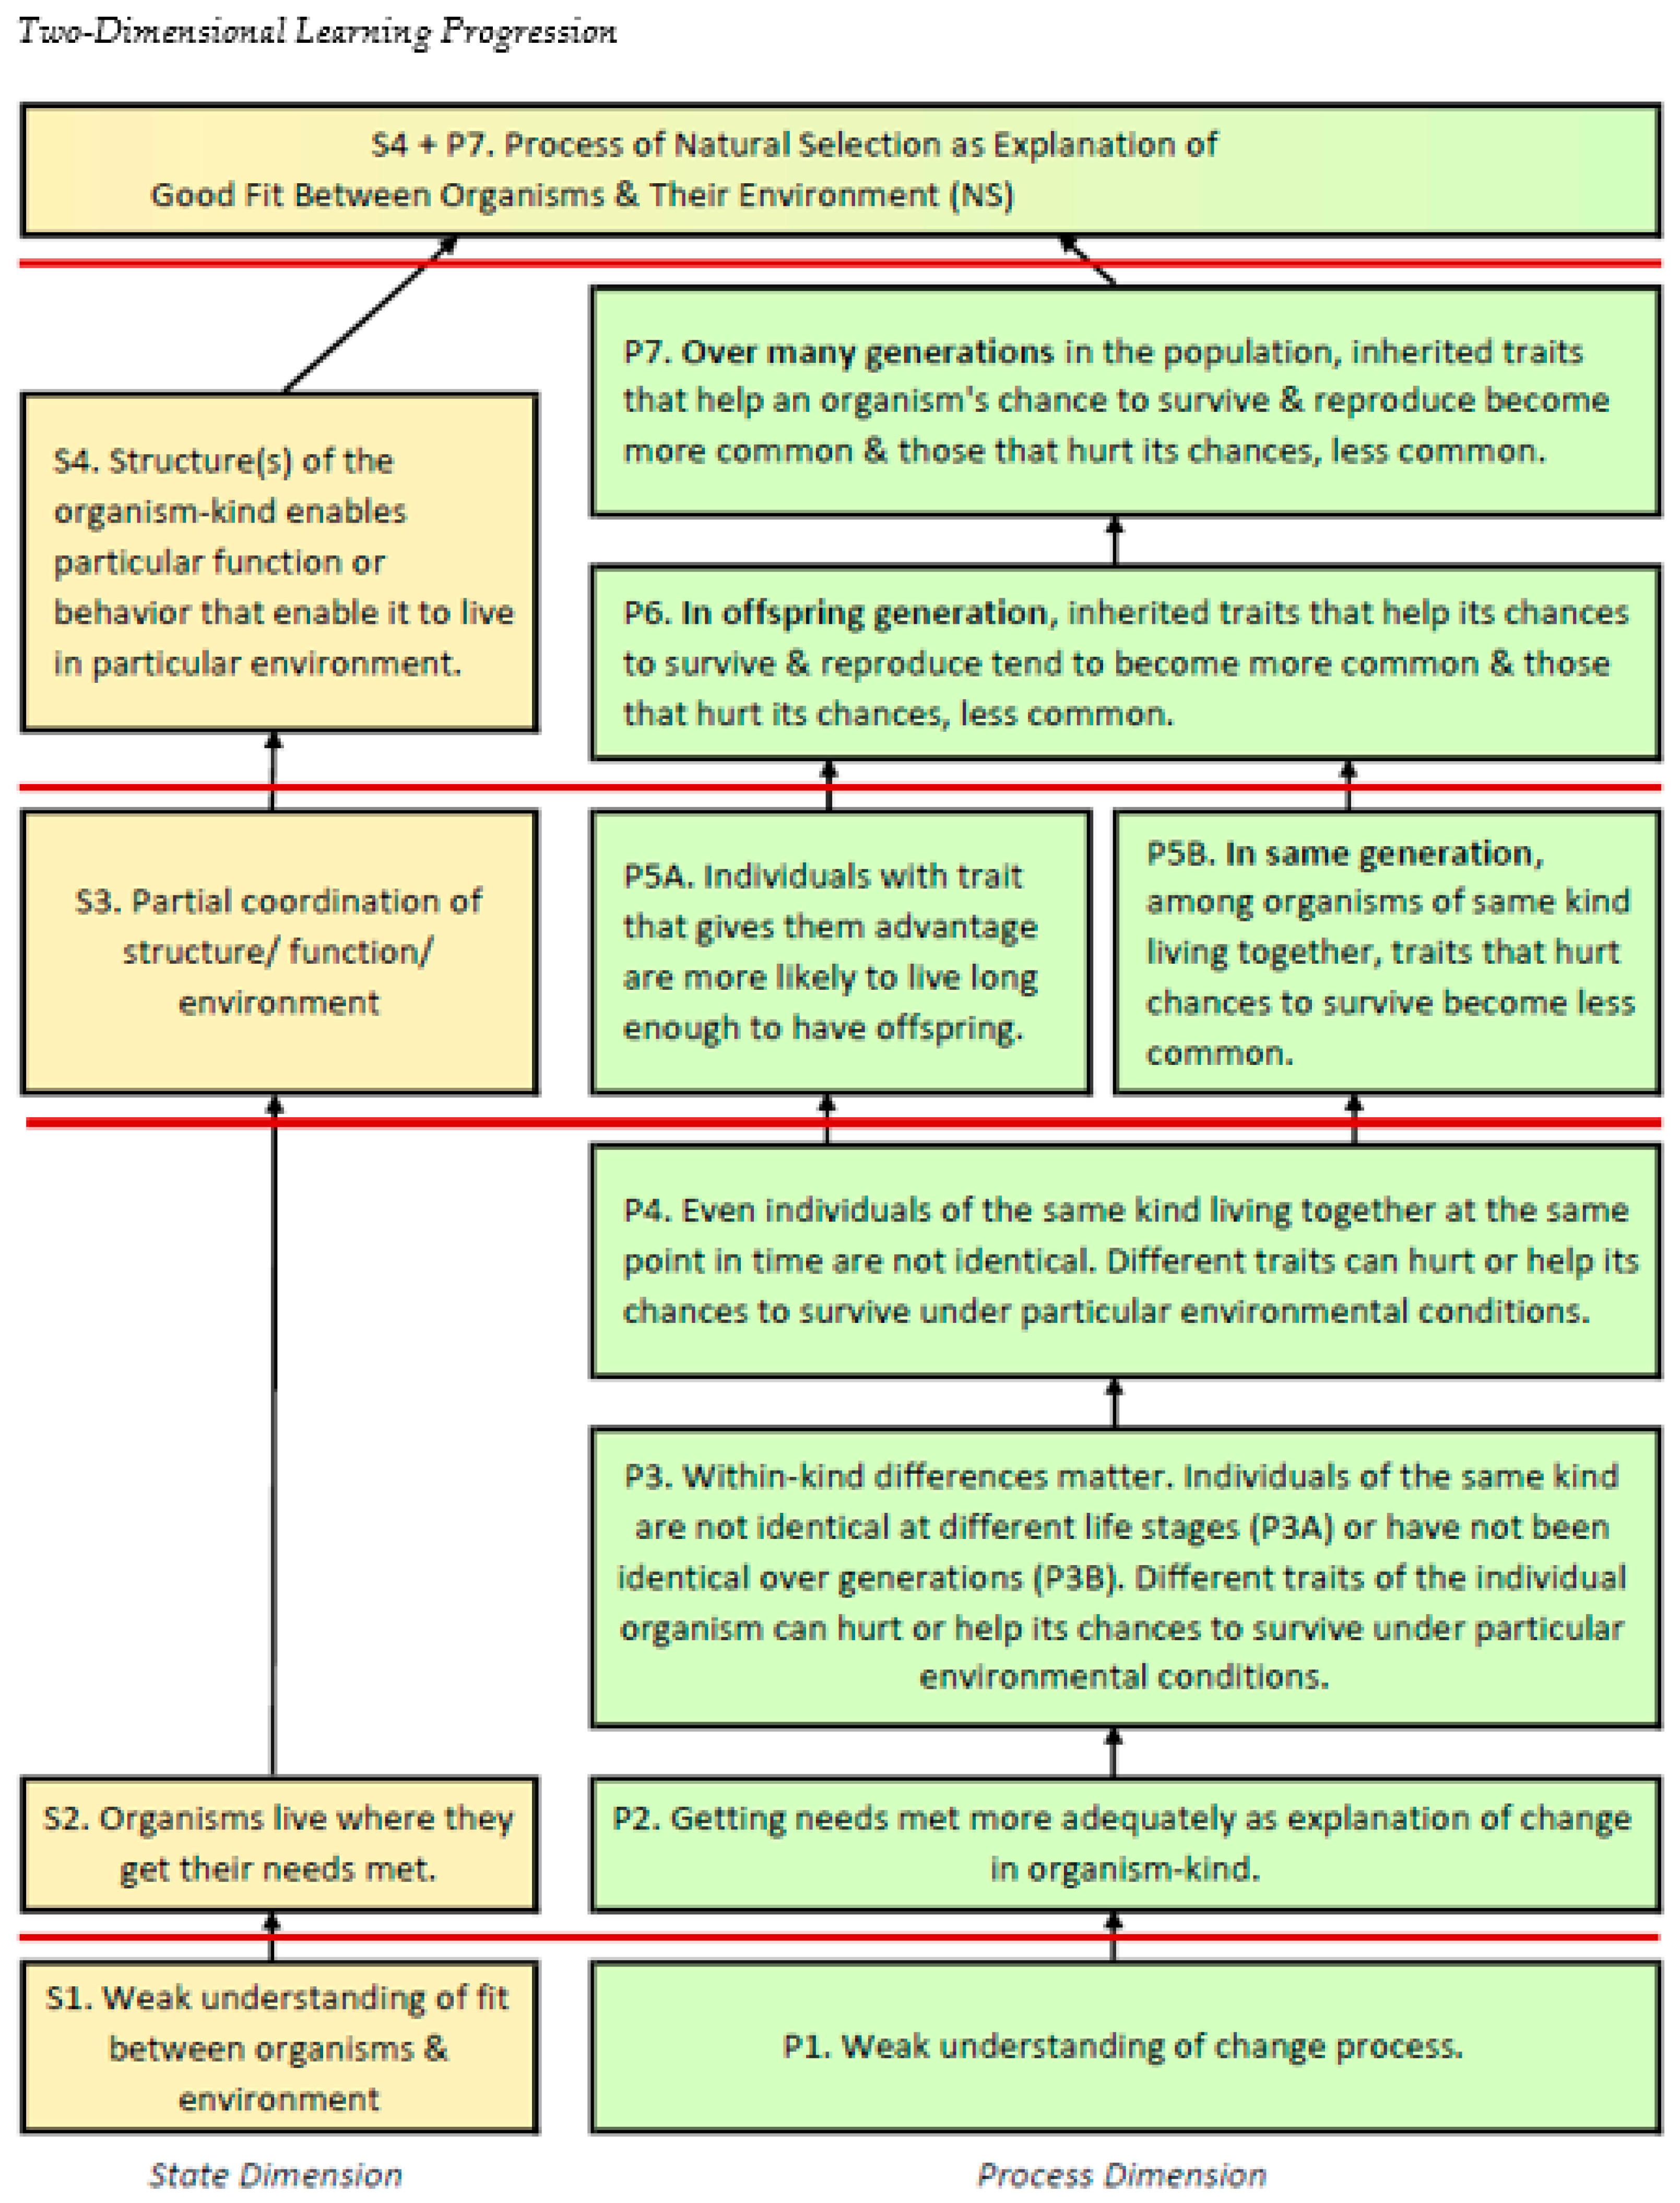
The emerging subcodes contributed to our theory of multidimensionality, in part because they clarified the different types of understandings occurring along the learning progression. We identified two dimensions within the learning progression that satisfied both the theoretical and empirical findings as shown in Figure 4. We describe the State dimension as students’ explanation about the good fit between organisms and their environment (labeled as “S”). On this dimension, students’ explanations progress from considering organisms’ needs, through noting the affordances of their physical structures, to explanations about structure-function-environment relationships, ultimately incorporating natural selection as an explanation for why organisms fit where they live. The Process dimension (labeled as “P”) involved the mechanism by which organisms become well-fitted to their environments. It is essential to identify variability in traits, and the survival value attached to those traits. Along the progression, explanations include shifting distributions across generations and ultimately address natural selection as the mechanisms for establishing good fit. Both dimensions are described in more detail in related publications about this project [16,24].
Along both dimensions, the elaboration of the coding guide reflected a more nuanced version of the learning progression. While the original LP1 idea that organisms live where they belong constituted one variant of the lowest level on the State dimension, student interview responses introduced 13 similarly rudimentary ways of thinking for LP1 on either dimension (see Appendix C). For example, even at this level of negligible understanding, students explanations were qualitatively different. When asked about where kelp can and cannot live, one type of LP1 response expressed the need for belonging, “because kelp doesn’t grow there”, while another type of response expressed its relationship with other organisms, “because some animals eat them”. (Quotations from student interview responses were documented in the CUE coding book dated 8 November 2011). In the learning progression model in Figure 4, these are labeled as S1. Weak understanding of the fit between organisms and their environment on the State dimension and P1. Weak understanding of the change process on the Process dimension.
At the next level on each dimension, children thought about needs. On the State dimension, children explained the good fit in terms of S2. Organisms live where they get their needs met. For example, at this level a child responded that otters live in the water because “they eat food that comes from the water.” On the Process dimension, children explained the process of change as differential meeting of needs or P2. Getting needs met more adequately as explanation of change in organism-kind. Considering the question about why cheetahs today would be faster then those before, a response at this level noted that “they caught more food, that gave them more energy to run more faster.”
At this point, the two dimensions diverge more dramatically. On the State dimension, reflecting a structural developmental model, the relation of structure and function (e.g., a thick stem can store water), or structure and environment (thick stems let plants live in the desert), or function and environment (a way of storing water enables survival in the desert) preceded the full explanation. We termed this transition as moving from S3. Partial coordination of structure, function, and environment to the complex idea that S4. Structure(s) of the organism-kind enables particular function or behavior that enable it to live in particular environment. At the S3 level, a child replied that otters lived in water because “mammals are hot-blooded and… usually they could go on land and water.” This response shows awareness of the organism’s structure (blood) influencing what the organism can do.
On the Process dimension, modeling advancements in children’s understanding of the process of change, the step after needs-based reasoning involved the key idea that P3. Within-kind differences matter. Close observation of children’s reasoning during the coding process led to several key changes from the early model, as described above. First, we realized that they were not thinking about the differential survival value of traits per se, but rather about the risk or advantage to an individual based on whether or not they had a particular trait. We attribute this subtle shift in framing to a tendency on the part of young children to interpret biological phenomena in terms of what they know about people, a tendency referred to as “personification” [44].
The final model also differentiated several different conceptualizations of individuals’ traits at varying degrees of sophistication, all grouped within P3. Within-kind differences matter. An understanding of natural selection requires conceptualization of traits as inherited characteristics that can vary within the same population at the same point in time. We added two alternative conceptualizations that fell short of this way of conceptualizing the traits. One form consisted of attribution of individuals’ traits and associated risks to life stage. While such differences can convey differential risk (as in the relatively transparent coloration of young guppies as opposed to mature males), this conceptualization falls short of that needed to build a robust understanding of natural selection. The other non-normative form involved conceptualization of the change of individuals’ traits as occurring over many generations, with the assumption that at any one point in time all individuals are identical. This last variant accords with a common misconception identified in the history of biology as well as the cognition research literature, where within-population variation is ignored and the change in organism-kind is assumed to occur in accordance with a changing form or “essence” over time [45].
Following conceptualization of within-kind variation, the initial learning progression model (in Figure 1) progressed to thinking through the entailments of differential survival value of traits for earlier die-off among those with the disadvantaged trait and consequently a shift in the relative distribution within the current generation. The final model (in Figure 4) included two different entailments of within-kind variation. Children could continue to think in individual-centric terms, reasoning that P5A. Individuals with the trait that gives them an advantage are more likely to live long enough to have offspring. Alternatively, they could use the idea of differential survival advantage to predict P5B. In the same generation among organisms of the same kind living together, traits that hurt individuals’ chances to survive will become less common. Note that this second variant encompassed the key idea of relative distribution, not in precise quantitative terms of changing proportions (beyond the mathematical competence of second and third graders), but in qualitative terms assessing relative decreases or increases. We identified P5B more frequently than P5A in children’s responses. For example, when explaining why they would predict fewer smooth-stemmed Brassica rapa plants over time, a child stated “because the caterpillars weren’t eating the hairy ones. And they were eating the ones that weren’t hairy.”
The initial model (in Figure 1) assumed extrapolation of the big idea of traits’ differential survival value directly to the idea of shifting relative frequencies across many generations. However, we found an interim step, where children thought through differential survival value just to the next generation: P6. In the offspring generation, inherited traits that help its changes to survive and reproduce tend to become more common. Those that hurt its chances tend to become less common. For example, considering the scenario about a pool of “dark” (camouflaged) and “regular” (non-camouflaged) guppies, a child predicted that “it was more dark guppies still because all of these, all of the regular guppies [points to a colorful one] are getting eaten, and not having a chance to have babies.”
At the next level, children articulate the big idea that P7. Over many generations in the population, inherited traits that help an organisms’ chances to survive and reproduce where they live become more common. Those traits that hurt its chances become less common. At this point, they have constructed a rudimentary model of natural selection at the system level of microevolution. Compared to the guppy response quoted above, at this level children note the ongoing change over multiple generations.For example, a child explained why there would be even more camouflaged guppies in the 5th generation compared to the 2nd generation:
“And then when they give babies, the babies will get eaten. And then when they try to hide, there’s only a very little bit, so only 1 guppy might survive and the other 2 might get eaten and then 1 gives off babies there might be a little more but there’s still going to be way more gray and black guppies.”
The top-most-level evokes the Process of natural selection as explanation of the good fit between organisms and their environment, where we propose the two dimensions converge (S4 + P7). This way of thinking requires the integration of the two dimensions, each fully elaborated. This last level essentially goes beyond the scope of microevolution in its application of the natural selection mechanism to more generally account for the state of organisms as well-adapted to where they live. For example, a child explained why cheetahs today run faster than cheetahs a long time ago:
It’s kind of like the sparrows, they adapt to where they’re living, like this gazelle, it can run up to 40 or 50 mph maybe, I’m not sure, so the cheetahs that can run 20mph, it couldn’t catch its prey, if it couldn’t catch its prey, it would die out because it couldn’t catch its prey and it wouldn’t have food. (Interviewer probes) There could be some fast ones in a cheetah herd and if a fast one, like the sparrow, if the fast one married a fast one, it would have a fast child. If that fast one married a fast one, they would have an even faster one, and if that even faster one married an even faster one, they would have an even fasterest cheetah. And so eventually there was a really fast-running cheetah and since that cheetah could survive more easilier because they can run faster, that kind of cheetah would be adapted to live in there and so there will be more and more of that and eventually the slow-running cheetah would die out.
3.3. The Multidimensional IRT Model: Confirming the State-Process Model
Based on the two-dimensional learning progression theory described above, we utilized the multidimensional extension of the partial credit IRT model to calibrate a new solution. We used the final data set with 18 items and 250 coded interviews. As noted above, we included both pre and post interviews for students which we acknowledge is a weakness. Yet, comparing the unidimensional and two-dimensional models provided feedback about the item set, and allowed us to investigate how the levels on each dimensions aligned based on the empirical data.
Each task mapped to either the State or Process dimension, except for the Cheetah task which was assigned a separate code for each dimension. Cheetah_1 codes ranged from S1–S4 on the State dimension, and Cheetah_2 codes ranged from P1–P7 on the Process dimension. There were 7 items on the State dimension, and 11 on the Process dimension. This between-item multidimensional model reported a separation reliability statistic of 0.94 and two items had high weighted mean square fit statistics (Cheetah_2 WMNSQ = 1.34; Moth_2 WMNSQ = 1.29). Both items were somewhat anomalous. Cheetah_2 was the only item that spanned the entire learning progression which is a valuable contribution to the item set. Moth_2 presented some confusion about the scenario that created obstacles for students, and we developed other items to take its place in future interviews.
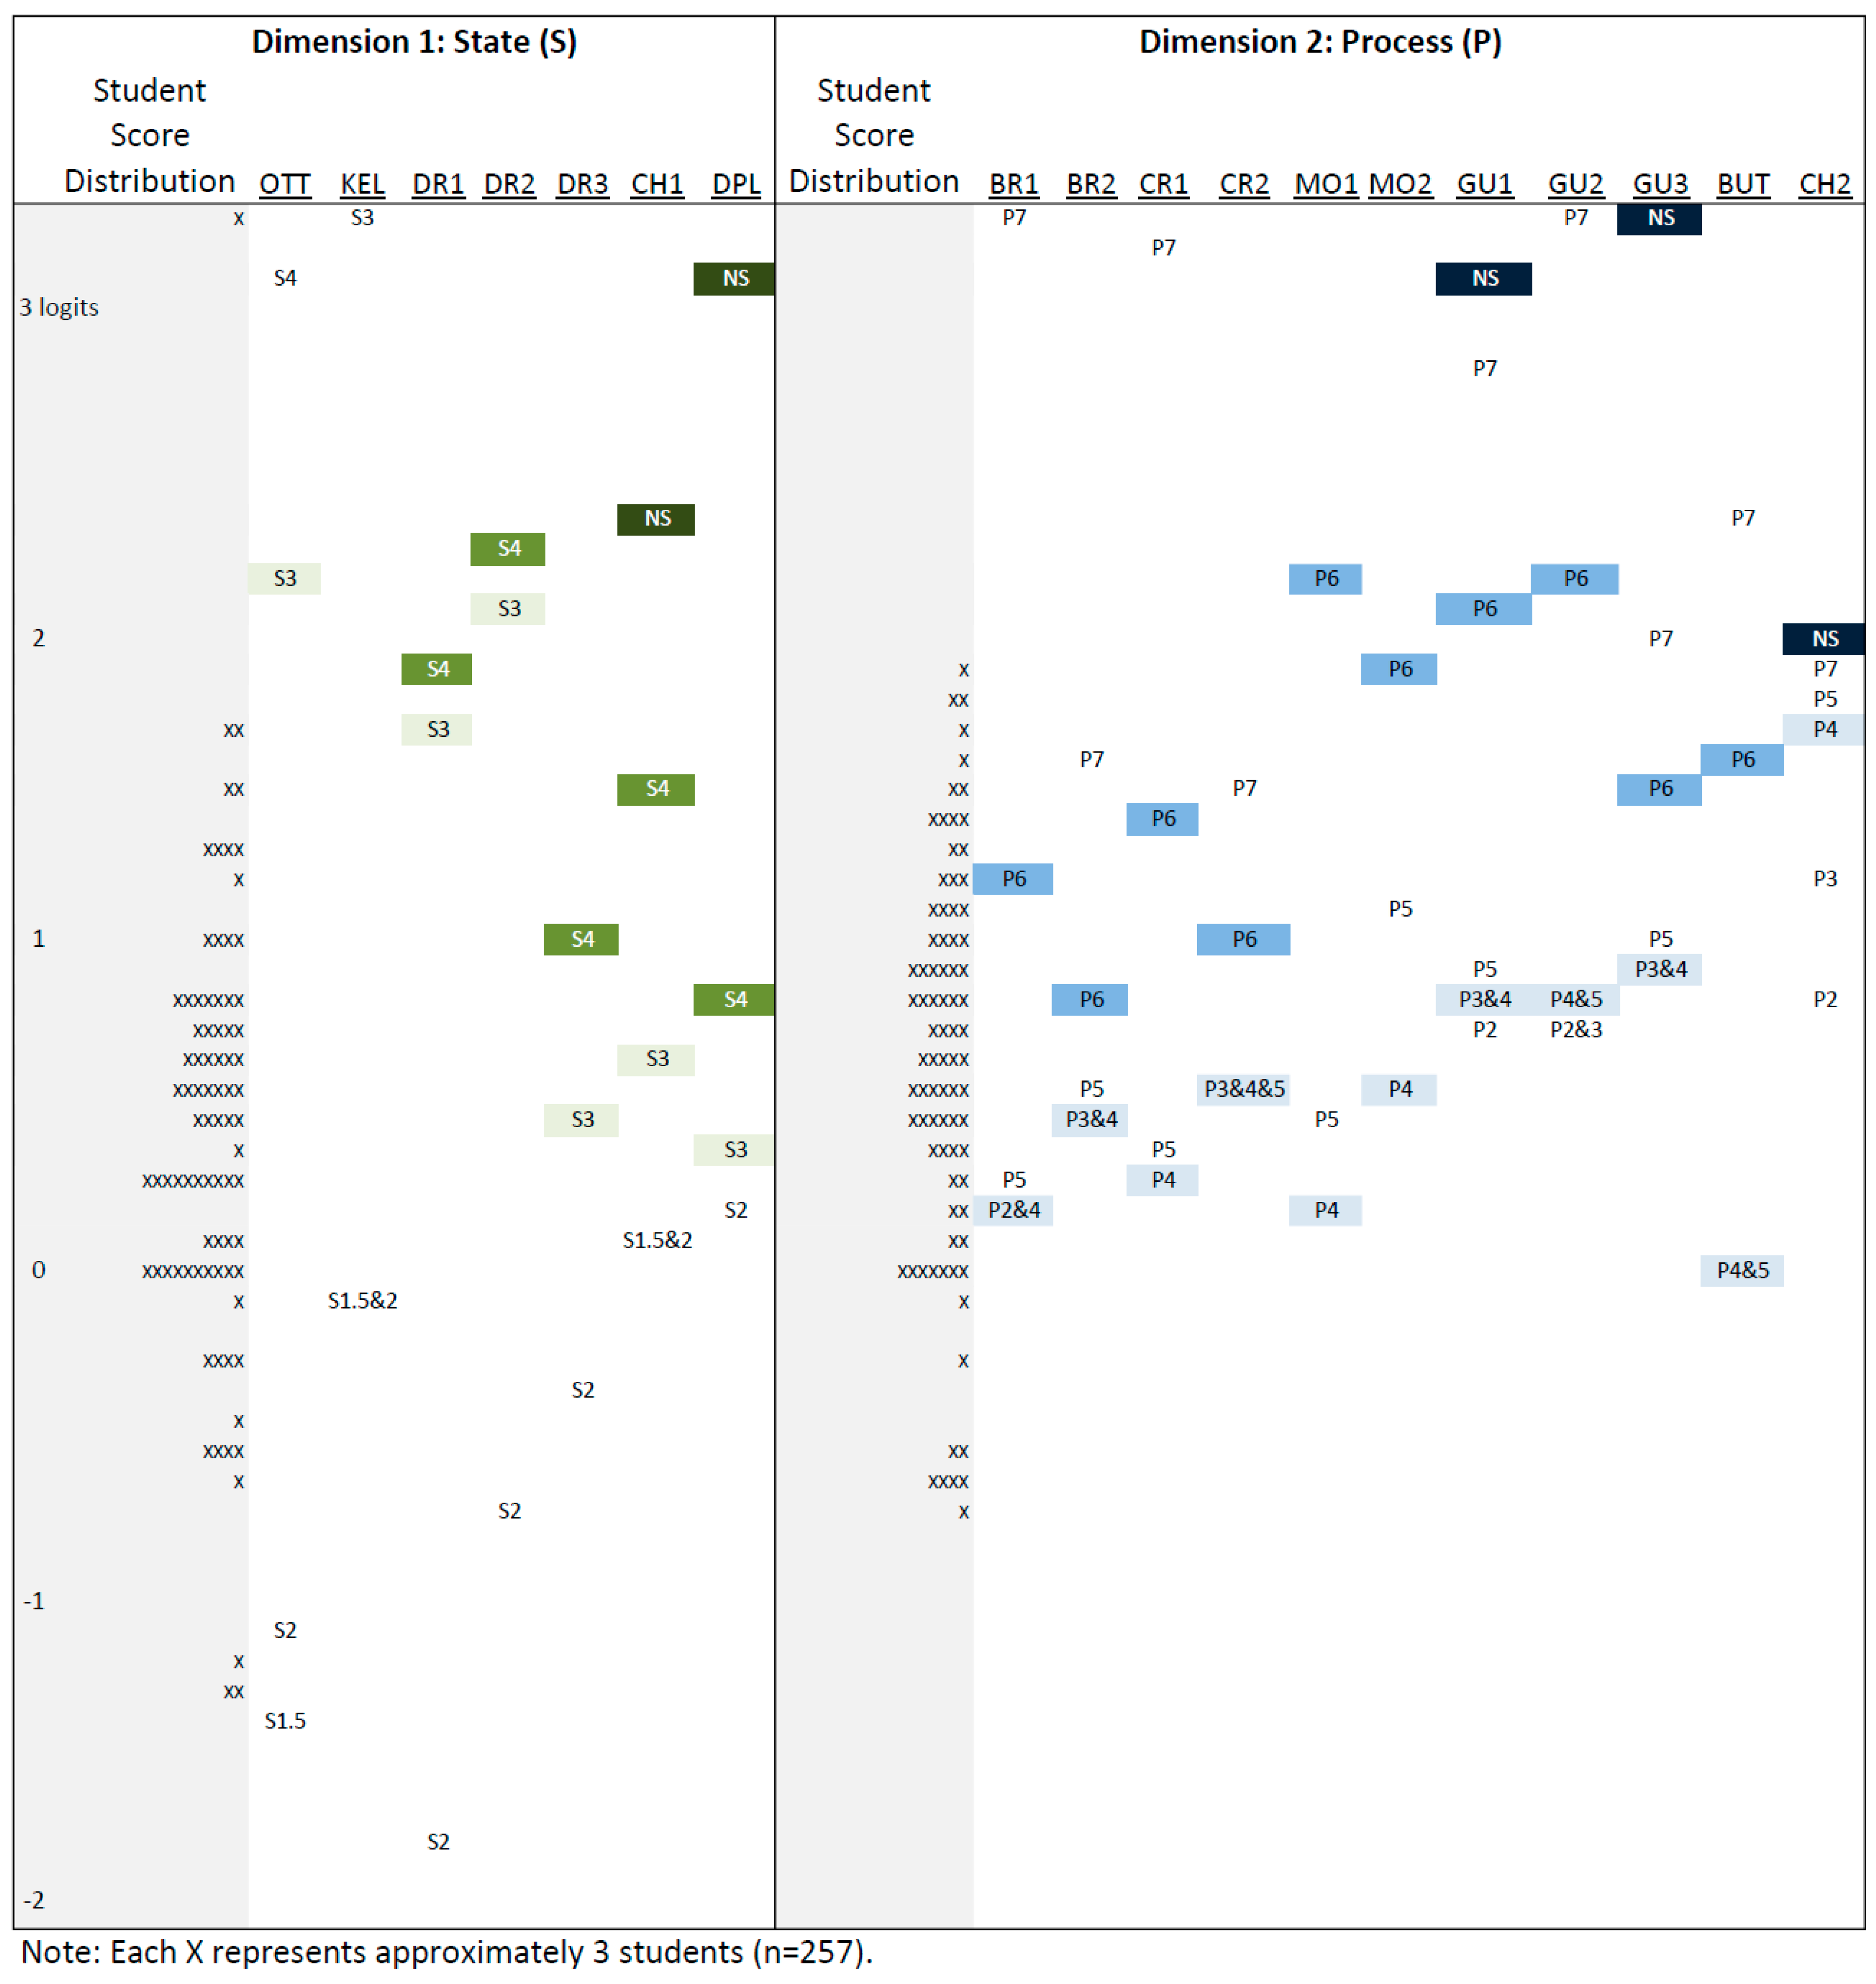
We also aligned the item threshold estimates across dimensions using the Delta Dimensional Alignment method [41,42], as shown in the two-dimensional map of student score estimates and item thresholds in Figure 5. After adding items to target the State dimension, we found that, for both State and Process dimensions, the empirical sequence of levels better matched the hypothesized sequence described in the learning progression in Figure 4.
As expected, there was some overlap between successive dimensions, but the empirical means for the thresholds for each dimension are consistent with the expected order (see Table 1). For both dimensions, the mean threshold locations show increasing difficulty from low to high. The means also show that S3 and S4 align most closely with higher levels on the Process dimension, suggesting that students tended to find that attainment of the S3 and S4 levels of the State dimension items matched (in difficulty) the attainment of the P5 and P6 levels of the Process dimension items. This alignment corresponded with our qualitative observations during coding, that while structure-function explanations (S3) were located higher on the learning progression than we originally proposed, they were not uncommon in students’ explanations after additional items were added. Considering this finding in terms of the two student distributions in Figure 5 (i.e, the two “on-the-side” histograms), there were relatively more students near that region on the Process dimension than on the State dimension. The overall distributions of student locations also suggest students are finding the State items easier than the Process items (i.e., the mean for the State student distribution is 0.39 logits, while the mean for the Process student dimension mean is 0.63 logits).
The correlation between the two dimensions was 0.71, suggesting they are in fact different despite being correlated. In line with our expectations due to the greater number of items for the Process dimension, the EAP reliabilities were 0.64 for the State dimension 0.82 for the Process dimension. Comparing the unidimensional model to the two-dimensional model, we find only a marginal improvement in the AIC scores, from 5989.18 to 5962.91. Yet, given the theoretical importance of the two dimensions, and their meaningful differences in terms of students’ understandings, we find the two-dimensional model to be more appropriate.
4. Discussion
Learning progressions have the potential to align curriculum, instruction, and assessment in powerful ways. In order to do so, learning progression levels must be specified at a grainsize that is meaningful in all three spheres. In this project, the initial levels were discerned based on previous research noted above, as well as qualitative findings during the design of the project. The iterative process of coding student interview responses and composing the related coding book was central to the learning progression refinement. Ultimately, the learning progression model became more elaborate, with two dimensions rather than one, as well as additional subcodes with many levels. This degree of specificity is crucial for modeling student understandings in ways that are both authentic to their learning experiences and also interpretable for teachers.
The elaboration of this learning progression relied on rich interview data, where the open-ended nature of student responses exposed nuances that were not previously identified in the research literature. While the extensive qualitative analyses of interview were resource-intensive, the information gleaned was crucial. For instance, the complexity of student understandings about structure-function in our two-dimensional model is a major shift from the structure-function level originally proposed in the earlier model. This elaboration can inform the design of additional instructional activities and assessment tools that will more accurately reflect student thinking. No closed-ended assessment format has this potential to reveal nuances in students’ understanding to the degree we experienced here.
Applying Rasch analyses in this context was somewhat atypical, and we found their contributions to the project critical for validating the learning progression theory. These analyses were uniquely capable of estimating item thresholds needed for validating the proposed order of levels. We described how evidence about the structure-function level contributed to the shift to a two-dimensional model. Rasch results also supported qualitative findings about the alignment of levels across dimensions, as well as refinement of the interview protocol.
In addition to our findings about student understandings about microevolution, our project presents an example of how researchers can optimize the information gleaned from student responses; we collaboratively integrated qualitative and quantitative methods in order to do so. The interview protocol evoked rich student responses, the iterative coding book design process documented nuances, and the Rasch analysis provided evidence about item thresholds and multiple dimensions. Without the interaction and integration across these particular methods, we could not have exposed the insights described above.
Author Contributions
Writing, Review, Editing, Analysis, Validation, Visualization—A.C., K.E.M. and M.W.; Data Curation, A.C. and K.E.M. Conceptualization, Methodology, Supervision, Project Administration—K.E.M. and M.W.; Investigation & Funding Acquisition—K.E.M. All authors have read and agreed to the published version of the manuscript.
Funding
This work was supported by the National Science Foundation (0814821). The opinions expressed herein are our own and not necessarily those of the National Science Foundation.
Institutional Review Board Statement
This research was conducted according to protocol approved by the Institutional Review Board at the University of California, Berkeley (CPHS #2009-1-40).
Informed Consent Statement
Informed consent was obtained from parents of all subjects in this study.
Data Availability Statement
The data presented in this study are available on request from the corresponding author. The data are not publicly available due to IRB protections.
Conflicts of Interest
The authors declare no conflict of interest.
Appendix A
Interview Protocol Excerpt for Otter, Kelp, and Cricket Items
- OTTER QUESTIONS
- Reasoning for why it lives thereWhy do you think otters live there? [point to picture as you say this][Wait for response]What are other reasons why otters they live there?What are other reasons why you think they live there? [Probe for three reasons]
- Reasoning about where else it could or couldn’t liveDo you think the otters could live in other places too?If no:
- Why not? Why couldn’t live anywhere else?
- What’s another reason you think they could just live there?
If yes:- Where else do you think they could live?
- Why do you think they could live there?
Is there a place they couldn’t live?Why couldn’t they live there?What might be another reason they couldn’t live there?
- KELP QUESTIONS
- Reasoning for why it lives thereWhat about the kelp, this stuff. Kelp is a kind of plant that lives in the sea. Why do you think it lives there?
- Reasoning about where else it could or couldn’t liveAre there other places kelp could live?If no:
- Why not? Why couldn’t kelp live anywhere else?
- What’s another reason you think it could just live there?
If yes:- Where else do you think kelp could live?
- Why do you think it could live there?
Is there a place kelp couldn’t live?Why couldn’t it live there?What might be another reason it couldn’t live there?
- CRICKET QUESTIONSMaterials:
- Cricket with ridges
- Cricket with no ridges
- Image of fly placing eggs into cricket
- Image of island with 16 crickets with ridges on wings (chirping) & 4 crickets with minimal ridges (mute)
- Template of island with flies
- Set of 16 cricket with ridge & 16 without
Introduction:
Have you ever heard crickets chirp? Did you know that male crickets chirp by rubbing their wings together?
Let me show you a picture. See, the wings look like this [show picture, pointing out ridge that allows for chirping]. They chirp by rubbing these together. This is how crickets chirp!
(Do gender match.)
A scientist went to the island where this kind of cricket lived. [S]he noticed something really interesting! Some of the male crickets don’t have this ridge on their wings, so they couldn’t chirp! Take a look at this cricket wing! This cricket can’t chirp!
These are pictures of the males crickets [s]he saw when [s]he first came to the island. [S]he noticed that most of the crickets had chirper wings and only a few of them had wings that couldn’t chirp [image with 16 chirpers & 4 non-chirpers].
Environmental Press:
Then, a new kind of fly arrived on the island, a kind of fly that laid its eggs in the crickets’ bodies! See, here’s a picture of the fly putting its eggs into the cricket. [Image] The eggs growing up in the cricket’s body kills the cricket
How do you think the flies find the crickets to lay their eggs in?
[Wait for the kids’ ideas.]
If student thinks they’ll listen for the chirp:
Yes
If student thinks otherwise:
Actually:
They listen for their chirps! That’s the way they find crickets to lay their eggs in.
The flies find crickets to lay their eggs in by listening for their chirping. The crickets that chirp are easy for the flies to find.
Generations Two through Five (with icons)
(a) Formation of prediction
So think about what the crickets on the island with the flies would look like one year later.
Even one year later, they won’t be the same crickets because they don’t live that long.
In the wild, crickets mate and have babies that grow up to become adult crickets.
So each year there is a new generation of the crickets that grow up and have babies of their own.
What do you think the crickets on this island will look like one year after the flies got there—the next generation of crickets?
Use any of this stuff you need to show your prediction.
Ask after S has completed prediction, with icon.
(b) Child’s description of their prediction
So what do you think the crickets on the island will look like one year after the flies got there, one generation later?
If student does not quantify icons,
I want to make sure I understand your idea.
What do you have here?
If student wants to adjust numbers as [s]he is in the process of quantifying, allow.
The issue here is child’s intention, not necessarily an accurate counting thereof. For example, if the child intended to put out 13 chirpers & 3 non-chirpers, that what is important, not the fact they actually put out 12 & 4]
(c) Gen. 1 > Gen. 2: Explanation of mechanism of the change
So just after the flies got there, the crickets looked like this (point to gen. 1).
And you predict that one generation later, they’ll look like this (point to gen. 2).
So how will that happen?
(d) Generation 5 (verbal)
Now think about what the crickets on the island will look like on the island 5 years after the flies got there.
So that would be 5 generations later:
That’s five cycles of cricket growing up and having babies that grow up into adult crickets.
(e) Prediction
So what’s your prediction for what the plants will look like five years after the flies got to the island, five generations later?
Do you think they’ll be the same as one generation after the flies got there [point to G 2 prediction] or do you think they’ll be different?
If student says different:
What do you think the crickets on the island will look like 5 years after the flies got there?
If student uses the materials to answer, allow it.
(f) Explanation
So how do you think that will happen?
>>>>>PROBE<<<<<
Appendix B
Coding Book Excerpt with Student Responses at the LP4A Level
POSITIVE AND NEGATIVE INSTANCES OF 4A.
| FITS 4A | Does NOT Fit 4A |
| 21:54 Maybe that a long time ago, the cheetahs couldn’t run fast and then every generation the cheetah gets faster each time. Interviewer: What do you mean every generation the cheetah gets faster each time? 22:13 Like…it’s like a plant. Like every generation the plants get taller every time. Interviewer: That’s such an interesting idea, how does that happen? 22:37 Maybe the cheetahs long before…long before…didn’t catch that much animals. And then, then they didn’t have any more, that much energy to run. So then that’s why the cheetahs can’t run real fast, long before. And now the cheetahs are fast and they catch animals and has more energy. [Fits 4A because: Energy characteristic. Changes over time. Has advantage of supporting faster running & consequently better at catching prey.] | Like since the older they got, uh, when they was 20-something miles per hour as a bike, they must have had got faster and then faster and then faster and then faster and then faster and then faster and then these ones [gestures to picture with all the cheetahs] had babies. And then these ones [gestures to same image] came up to grow and get faster. Interviewer: How’d they get faster?” 34:15 By their parents. Interviewer: By their parents? 34:19 Oh, yeah by their parents [Not 4a because: no evidence of the survival advantage of being faster.] |
Appendix C
Subcodes within LP1 (negligible understanding)
- LP 1. NEGLIGIBLE UNDERSTANDING OF FIT BETWEEN ORGANISM & ENVIRONMENT
- No consideration of the particular environment and/or the structures of their body or organisms’ needs as constraining where they live or what they do there or how well adapted they are.
- LP1 A: Live where they belong/where it grows (STATE DIMENSION)
- LP1 B: Live where they want to live /do what they want to do, without articulation of higher-level explanation of why (STATE DIMENSION)
- LP1 C: Live where another organism needs them to live. (STATE DIMENSION)
- LP1 D: God (STATE & PROCESS DIMENSIONS)
- LP1 E Mother Nature (STATE & PROCESS DIMENSIONS)
- LP1 F: Someone put them there (STATE DIMENSION)
- LP1 G: “I don’t know” or other expression of ignorance (STATE & PROCESS DIMENSIONS)
- LP1 H: Organisms “get used to” or “are used to” it (STATE & PROCESS DIMENSIONS)
- LP1 I: Adjust to where they live. (PROCESS DIMENSION)
- LP1 J: It’s made for... (designed for/born to) (STATE DIMENSION)
- LP1 L: Difference due to age or life cycle
- LP1 M: Difference in speed due to practice or “doing it a lot” (PROCESS DIMENSION)
- LP1 K: Change of trait due to effort or practice of the individual organism, whose increased capacity is passed on to offspring (PROCESS DIMENSION)Select Examples:LP 1a Live where it belongs/where it grows:Is there a place kelp couldn’t live?“The lake.”Why couldn’t it live there?“Because kelp doesn’t grow there.”LP1c Needs of another organism:Kelp is a kind of plant that lives in the sea. Why do you think it lives there?“Because some animals eat them.”LP1g: “I don’t know” or other expression of ignoranceI think they just were…I’m not really sure.LP1 (no subcategory)[In cheetah]“Because they never learned how to run.”“Because the new ones, they run faster and the old ones ran slower.”“Maybe, their ancestors got slower because they ate too much.”
References
- National Research Council. Taking Science to School: Learning and Teaching Science in Grades K-8; National Academies Press: Washington, DC, USA, 2007. [Google Scholar]
- Alonzo, A.C.; Steedle, J.T. Developing and assessing a force and motion learning progression. Sci. Educ. 2009, 93, 389–421. [Google Scholar] [CrossRef]
- Songer, N.B.; Kelcey, B.; Gotwals, A.W. How and when does complex reasoning occur? Empirically driven development of a learning progression focused on complex reasoning about biodiversity. J. Res. Sci. Teach. 2009, 46, 610–631. [Google Scholar] [CrossRef] [Green Version]
- Plummer, J.D.; Krajcik, J. Building a learning progression for celestial motion: Elementary levels from an earth-based perspective. J. Res. Sci. Teach. 2010, 47, 768–787. [Google Scholar] [CrossRef] [Green Version]
- Stevens, S.Y.; Delgado, C.; Krajcik, J.S. Developing a hypothetical multi-dimensional learning progression for the nature of matter. J. Res. Sci. Teach. 2010, 47, 687–715. [Google Scholar] [CrossRef] [Green Version]
- Gunckel, K.L.; Covitt, B.A.; Salinas, I.; Anderson, C.W. A learning progression for water in socio-ecological systems. J. Res. Sci. Teach. 2012, 49, 843–868. [Google Scholar] [CrossRef]
- Jin, H.; Anderson, C.W. A learning progression for energy in socio-ecological systems. J. Res. Sci. Teach. 2012, 49, 1149–1180. [Google Scholar] [CrossRef]
- Neumann, K.; Viering, T.; Boone, W.J.; Fischer, H.E. Towards a learning progression of energy. J. Res. Sci. Teach. 2013, 50, 162–188. [Google Scholar] [CrossRef]
- Plummer, J.D.; Palma, C.; Flarend, A.; Rubin, K.; Ong, Y.S.; Botzer, B.; McDonald, S.; Furman, T. Development of a learning progression for the formation of the solar system. Int. J. Sci. Educ. 2015, 37, 1381–1401. [Google Scholar] [CrossRef] [Green Version]
- Osborne, J.F.; Henderson, J.B.; MacPherson, A.; Szu, E.; Wild, A.; Yao, S.Y. The development and validation of a learning progression for argumentation in science. J. Res. Sci. Teach. 2016, 53, 821–846. [Google Scholar] [CrossRef]
- Gao, Y.; Zhai, X.; Andersson, B.; Zeng, P.; Xin, T. Developing a learning progression of buoyancy to model conceptual change: A latent class and rule space model analysis. Res. Sci. Educ. 2020, 50, 1369–1388. [Google Scholar] [CrossRef] [Green Version]
- Gotwals, A.W. Where are we now? Learning progressions and formative assessment. Appl. Meas. Educ. 2018, 31, 157–164. [Google Scholar] [CrossRef]
- Shepard, L.A. Learning progressions as tools for assessment and learning. Appl. Meas. Educ. 2018, 31, 165–174. [Google Scholar] [CrossRef]
- Black, P.; Wilson, M.; Yao, S.Y. Road maps for learning: A guide to the navigation of learning progressions. Meas. Interdiscip. Res. Perspect. 2011, 9, 71–123. [Google Scholar] [CrossRef]
- National Research Council. Knowing What Students Know: The Science and Design of Educational Assessment; National Academies Press: Washington, DC, USA, 2001. [Google Scholar]
- Metz, K.E.; Cardace, A.; Berson, E.; Ly, U.; Wong, N.; Sisk-Hilton, S.; Metz, S.E.; Wilson, M. Primary grade children’s capacity to understand microevolution: The power of leveraging their fruitful intuitions and engagement in scientific practices. J. Learn. Sci. 2019, 28, 556–615. [Google Scholar] [CrossRef]
- National Research Council. A Framework for K-12 Science Education: Practices, Crosscutting Concepts, and Core Ideas; National Academies Press: Washington, DC, USA, 2012. [Google Scholar]
- Lehrer, R.; Schauble, L. Modeling natural variation through distribution. Am. Educ. Res. J. 2004, 41, 635–679. [Google Scholar] [CrossRef]
- Metz, K.E. Young children’s inquiry in biology: Building the knowledge bases to empower independent inquiry. In Inquiry into Inquiry Learning and Teaching in Science; Minstrell, J., van Zee, E.H., Eds.; American Association for the Advancement of Science: Washington, DC, USA, 2000; pp. 371–404. [Google Scholar]
- Metz, K.E. Children’s understanding of scientific inquiry: Their conceptualization of uncertainty in investigations of their own design. Cogn. Instr. 2004, 22, 219–290. [Google Scholar] [CrossRef]
- Metz, K.E. The knowledge building enterprises in science and elementary school science classrooms. In Scientific Inquiry and Nature of Science; Springer: Dordrecht, The Netherlands, 2006; pp. 105–130. [Google Scholar]
- Metz, K.E. Narrowing the gulf between the practices of science and the elementary school classroom. Elem. Sch. J. 2008, 109, 138–161. [Google Scholar] [CrossRef]
- Metz, K.E. Disentangling robust developmental constraints from the instructionally mutable: Young children’s epistemic reasoning about a study of their own design. J. Learn. Sci. 2011, 20, 50–110. [Google Scholar] [CrossRef]
- Cardace, A. The Affordances of Item Response Theory: The Case of a Complex Learning Progression about Evolution; University of California: Berkeley, CA, USA, 2018. [Google Scholar]
- Asterhan, C.S.; Schwarz, B.B. The effects of monological and dialogical argumentation on concept learning in evolutionary theory. J. Educ. Psychol. 2007, 99, 626. [Google Scholar] [CrossRef] [Green Version]
- Endler, J. Natural selection on color patterns in Poecillia reticulata. Evolution 1980, 34, 76–91. [Google Scholar] [CrossRef]
- Wilson, M.; Sloane, K. From principles to practice: An embedded assessment system. Appl. Meas. Educ. 2000, 13, 181–208. [Google Scholar] [CrossRef]
- Wilson, M. Constructing Measures: An Item Response Modeling Approach; Lawrence Erlbaum Associates: Mahwah, NJ, USA, 2005. [Google Scholar]
- Steedle, J.T.; Shavelson, R.J. Supporting valid interpretations of learning progression level diagnoses. J. Res. Sci. Teach. 2009, 46, 699–715. [Google Scholar] [CrossRef]
- Wilson, M. Measuring progressions: Assessment structures underlying a learning progression. J. Res. Sci. Teach. 2009, 46, 716–730. [Google Scholar] [CrossRef]
- Gotwals, A.W.; Songer, N.B. Validity evidence for learning progression-based assessment items that fuse core disciplinary ideas and science practices. J. Res. Sci. Teach. 2013, 50, 597–626. [Google Scholar] [CrossRef] [Green Version]
- Jin, H.; van Rijn, P.; Moore, J.C.; Bauer, M.I.; Pressler, Y.; Yestness, N. A validation framework for science learning progression research. Int. J. Sci. Educ. 2019, 41, 1324–1346. [Google Scholar] [CrossRef]
- Graf, E.A.; van Rijn, P.W.; Eames, C.L. A cycle for validating a learning progression illustrated with an example from the concept of function. J. Math. Behav. 2021, 62, 100836. [Google Scholar] [CrossRef]
- Plummer, J.D.; Palma, C.; Rubin, K.; Flarend, A.; Ong, Y.S.; Ghent, C.; Gleason, T.; McDonald, S.; Botzer, B.; Furman, T. Evaluating a learning progression for the solar system: Progress along gravity and dynamical properties dimensions. Sci. Educ. 2020, 104, 530–554. [Google Scholar] [CrossRef]
- Castro-Faix, M.; Duncan, R.G.; Choi, J. Data-driven refinements of a genetics learning progression. J. Res. Sci. Teach. 2021, 58, 3–39. [Google Scholar] [CrossRef]
- Wright, B.D.; Masters, G.N. Rating Scale Analysis; MESA Press: San Diego, CA, USA, 1982. [Google Scholar]
- Adams, R.; Wilson, M.; Wang, W. The multidimensional random coefficients multinomial logit model. Appl. Psychol. Meas. 1997, 21, 1–23. [Google Scholar] [CrossRef]
- Briggs, D.; Wilson, M. An introduction to multidimensional measurement using Rasch models. J. Appl. Meas. 2003, 4, 87–100. [Google Scholar]
- Adams, R.; Wu, M.; Wilson, M. ACER conquest. In Handbook of Item Response Theory; Chapman and Hall/CRC: Boca Raton, FL, USA, 2017; pp. 495–506. [Google Scholar]
- Akaike, H. Information theory and an extension of the maximum likelihood principle. In Selected Papers of Hirotugu Akaike; Springer: New York, NY, USA, 1998; pp. 199–213. [Google Scholar]
- Feuerstahler, L.; Wilson, M. Scale alignment in between-item multidimensional Rasch models. J. Educ. Meas. 2019, 56, 280–301. [Google Scholar] [CrossRef]
- Schwartz, R.; Ayers, E.; Wilson, M. Mapping a data modeling and statistical reasoning learning progression using unidimensional and multidimensional item response models. J. Appl. Meas. 2017, 18, 268–298. [Google Scholar] [PubMed]
- Masters, G.N. A Rasch model for partial credit scoring. Psychometrika 1982, 47, 149–174. [Google Scholar] [CrossRef]
- Inagaki, K.; Hatano, G. Young children’s recognition of commonalities between animals and plants. Child Dev. 1996, 67, 2823–2840. [Google Scholar] [CrossRef] [PubMed]
- Shtulman, A. Qualitative differences between naïve and scientific theories of evolution. Cogn. Psychol. 2006, 52, 170–194. [Google Scholar] [CrossRef] [PubMed]
Figure 1.
Initial Learning Progression.

Figure 2.
Guppy Task Image. Note: The child uses guppy manipulatives to show their prediction about the shifting distribution of the camouflage trait over generations.
Figure 2.
Guppy Task Image. Note: The child uses guppy manipulatives to show their prediction about the shifting distribution of the camouflage trait over generations.

Figure 3.
Map of Student Score Estimates and Item Thresholds.

Figure 4.
Two-Dimensional Learning Progression. Note: The multi-dimensional learning progression shows a State dimension and a Process dimension. The red lines show thresholds between bands across the dimensions, illustrating how the levels are aligned.
Figure 4.
Two-Dimensional Learning Progression. Note: The multi-dimensional learning progression shows a State dimension and a Process dimension. The red lines show thresholds between bands across the dimensions, illustrating how the levels are aligned.

Figure 5.
Two-Dimensional Map of Student Score Estimates and Item Thresholds.


Table 1.
Means of Thresholds Locations for Each Level of the State and Process Dimensions (logits).
| State Dimension | Process Dimension | ||
|---|---|---|---|
| Level | Mean Location | Level | Mean Location |
| S2 | −0.69 | P2 | ** |
| P3 | ** | ||
| P4 | 0.51 | ||
| S3 | 1.15 | P5 | 0.60 |
| S4 | 1.49 | P6 | 1.59 |
| P7 | 2.70 | ||
| Top | 3.05 | Top | ** |
Note: ** indicates insufficient data.
Publisher’s Note: MDPI stays neutral with regard to jurisdictional claims in published maps and institutional affiliations. |
© 2021 by the authors. Licensee MDPI, Basel, Switzerland. This article is an open access article distributed under the terms and conditions of the Creative Commons Attribution (CC BY) license (https://creativecommons.org/licenses/by/4.0/).
Share and Cite
MDPI and ACS Style
Cardace, A.; Wilson, M.; Metz, K.E. Designing a Learning Progression about Micro-Evolution to Inform Instruction and Assessment in Elementary Science. Educ. Sci. 2021, 11, 609. https://doi.org/10.3390/educsci11100609
AMA Style
Cardace A, Wilson M, Metz KE. Designing a Learning Progression about Micro-Evolution to Inform Instruction and Assessment in Elementary Science. Education Sciences. 2021; 11(10):609. https://doi.org/10.3390/educsci11100609
Chicago/Turabian StyleCardace, Amy, Mark Wilson, and Kathleen E. Metz. 2021. "Designing a Learning Progression about Micro-Evolution to Inform Instruction and Assessment in Elementary Science" Education Sciences 11, no. 10: 609. https://doi.org/10.3390/educsci11100609
Note that from the first issue of 2016, this journal uses article numbers instead of page numbers. See further details here.