
Target Object Detection from Unmanned Aerial Vehicle (UAV) Images Based on Improved YOLO Algorithm

 , , , , ,
Abstract
:1. Introduction
1.1. Background
1.2. Literature Review
2. Methodology
2.1. Principle Feature Extraction Network Darknet 19
2.2. YOLO
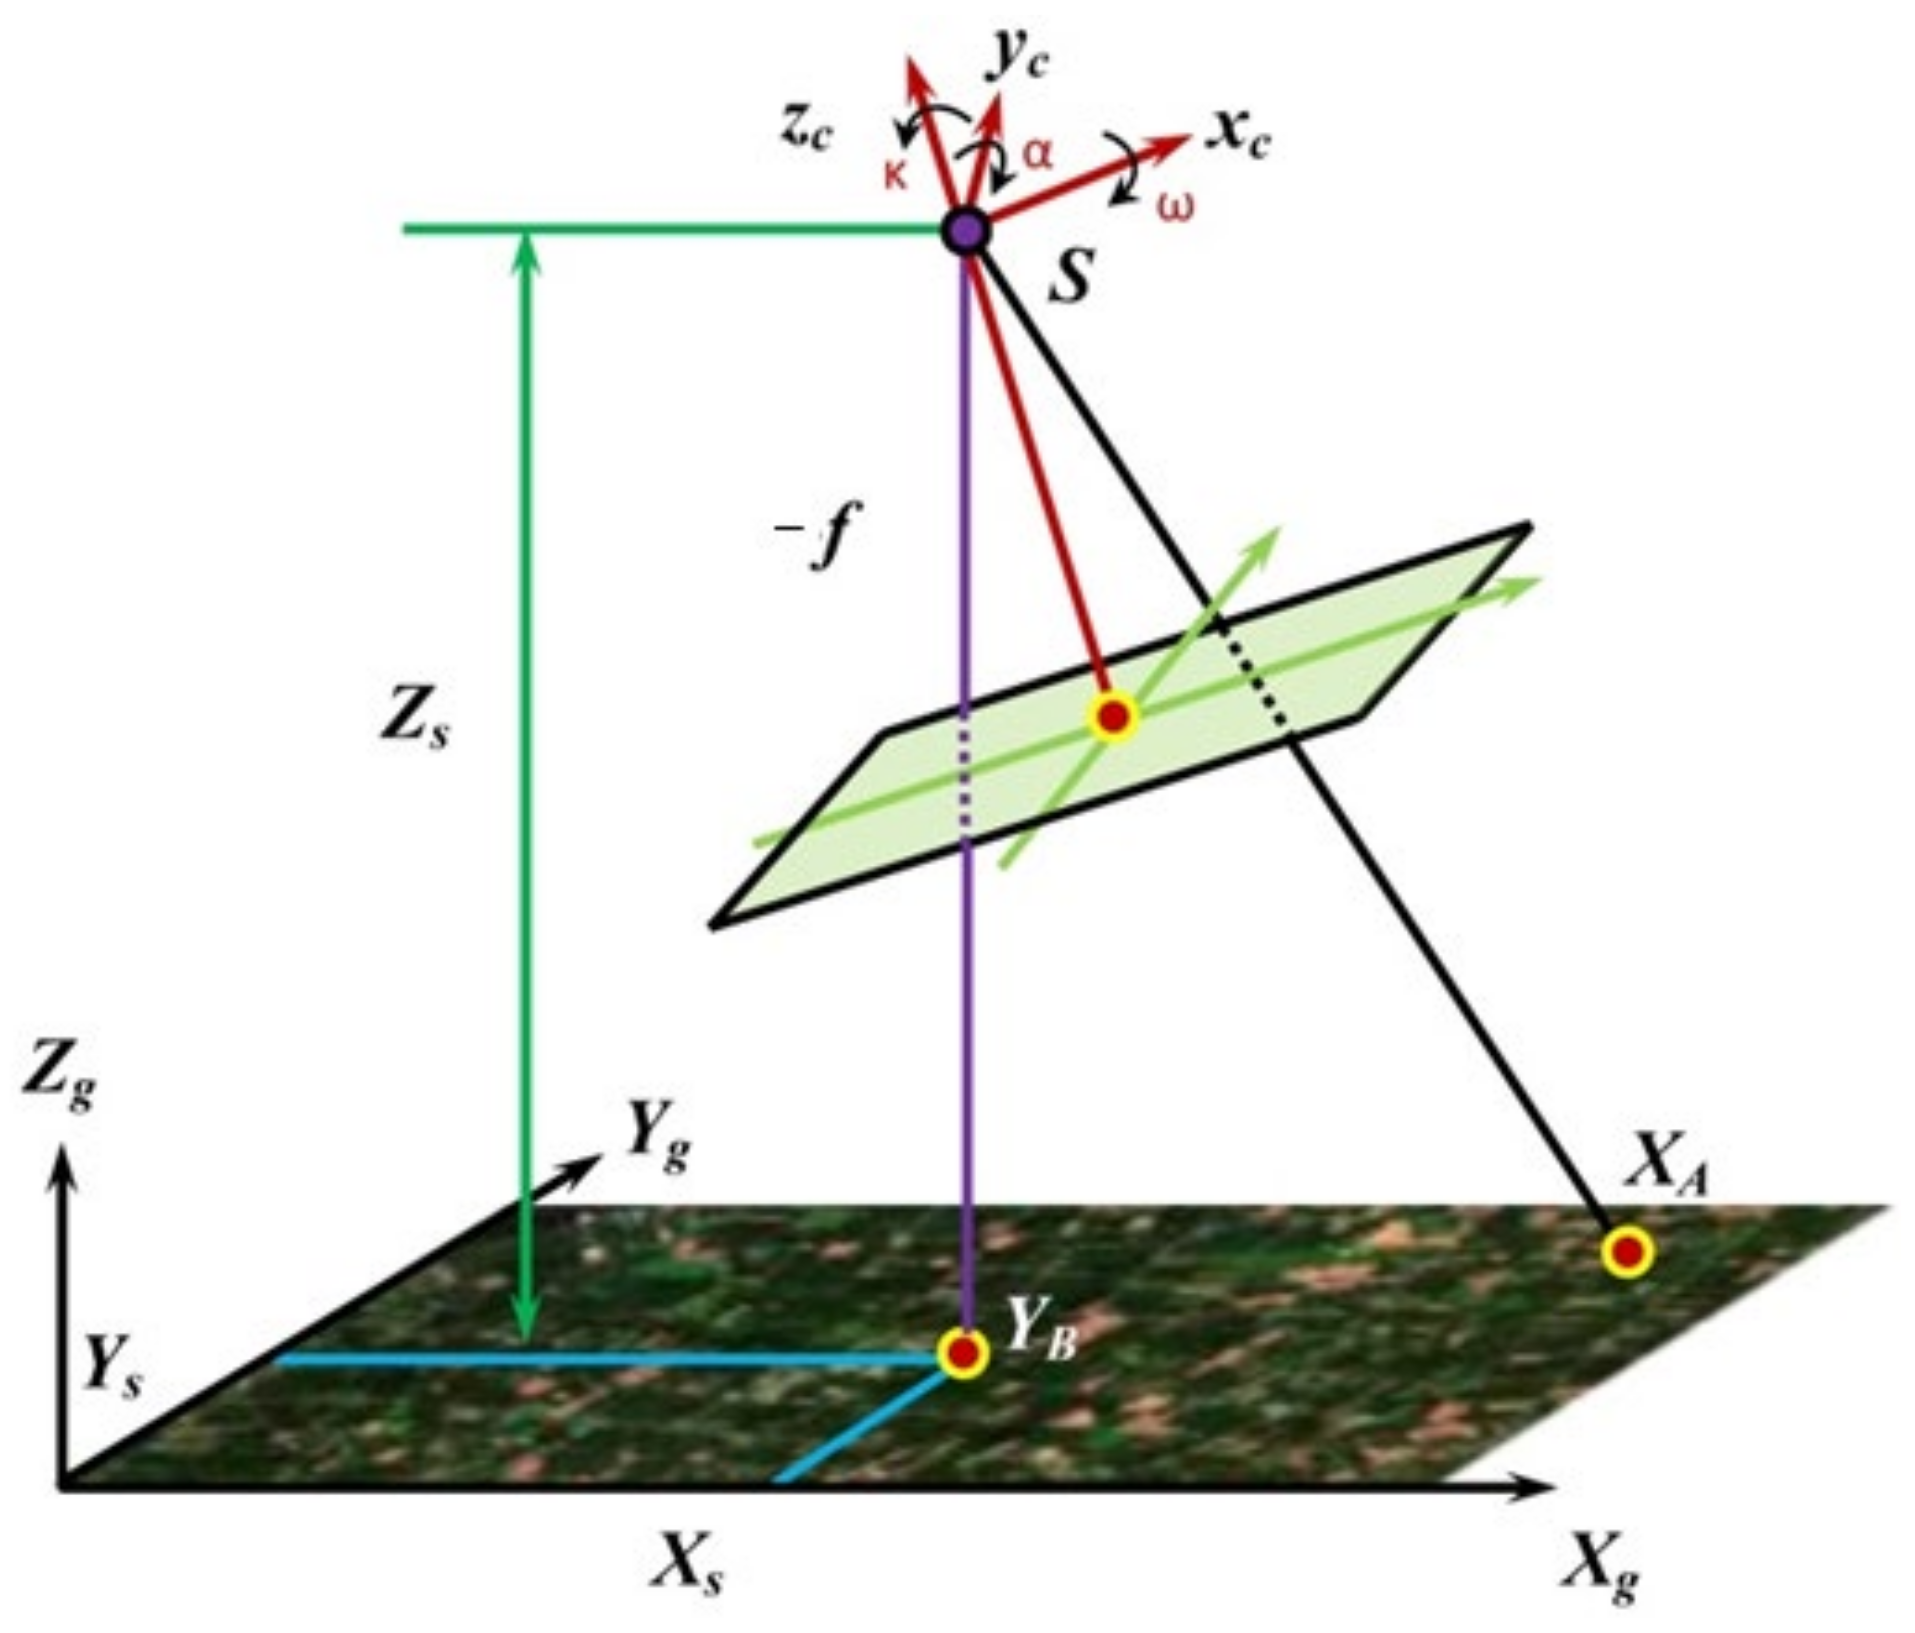
2.3. Coordinate Transformation
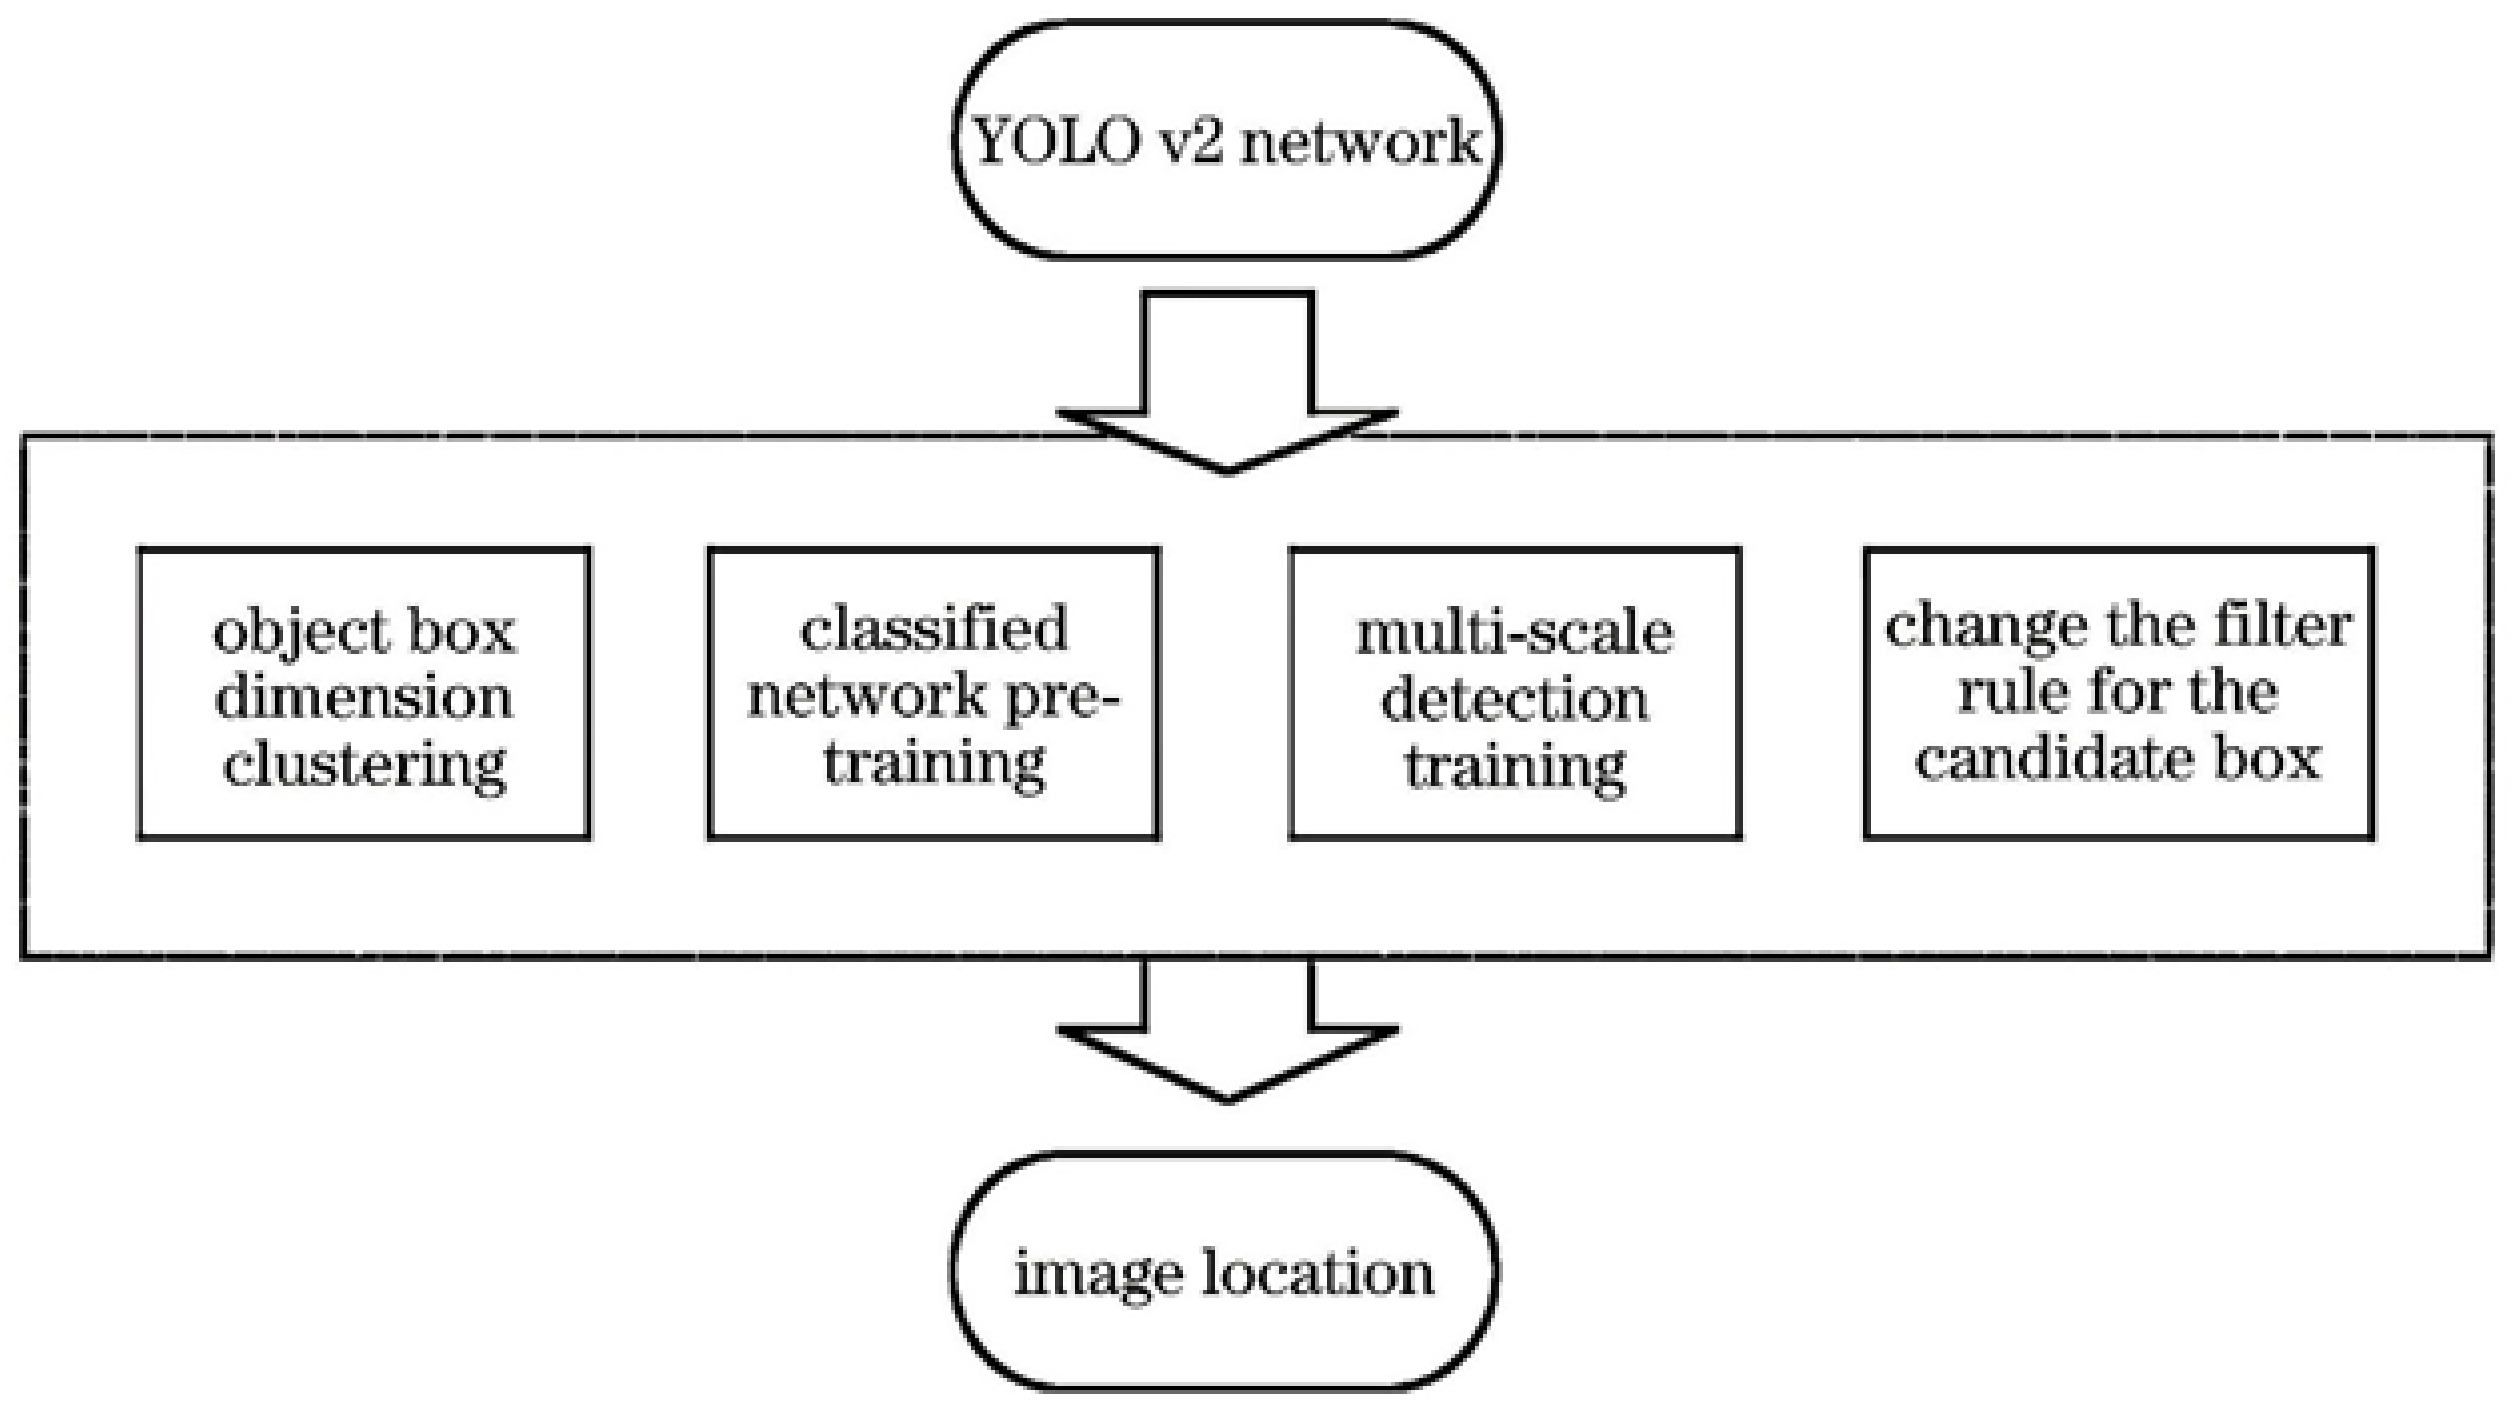
3. Improved Method
- (1)
- The target frame of the self-made data set dimension clustering determines the anchor parameters of YOLOv2 are determined by clustering of VOC2007 and VOC2012datasets. The determined parameters of YOLOv2 are universal but not suitable for specific detection tasks; therefore, it is necessary to re-clustering operation in the self-made aerial image detection data set.
- (2)
- Fine-tune the network using a different set of self-made data in classification network training. Like the YOLO, the first use of ImageNet dataset for pre-training, and the difference is the use of homemade resolution different image classification data set, can get a better fine-tuning effect.
- (3)
- During the training process, every ten rounds change the input size of the model, and therefore, the model of different scales of the image becomes robust. The input data is self-made aerial image detection data set.
- (4)
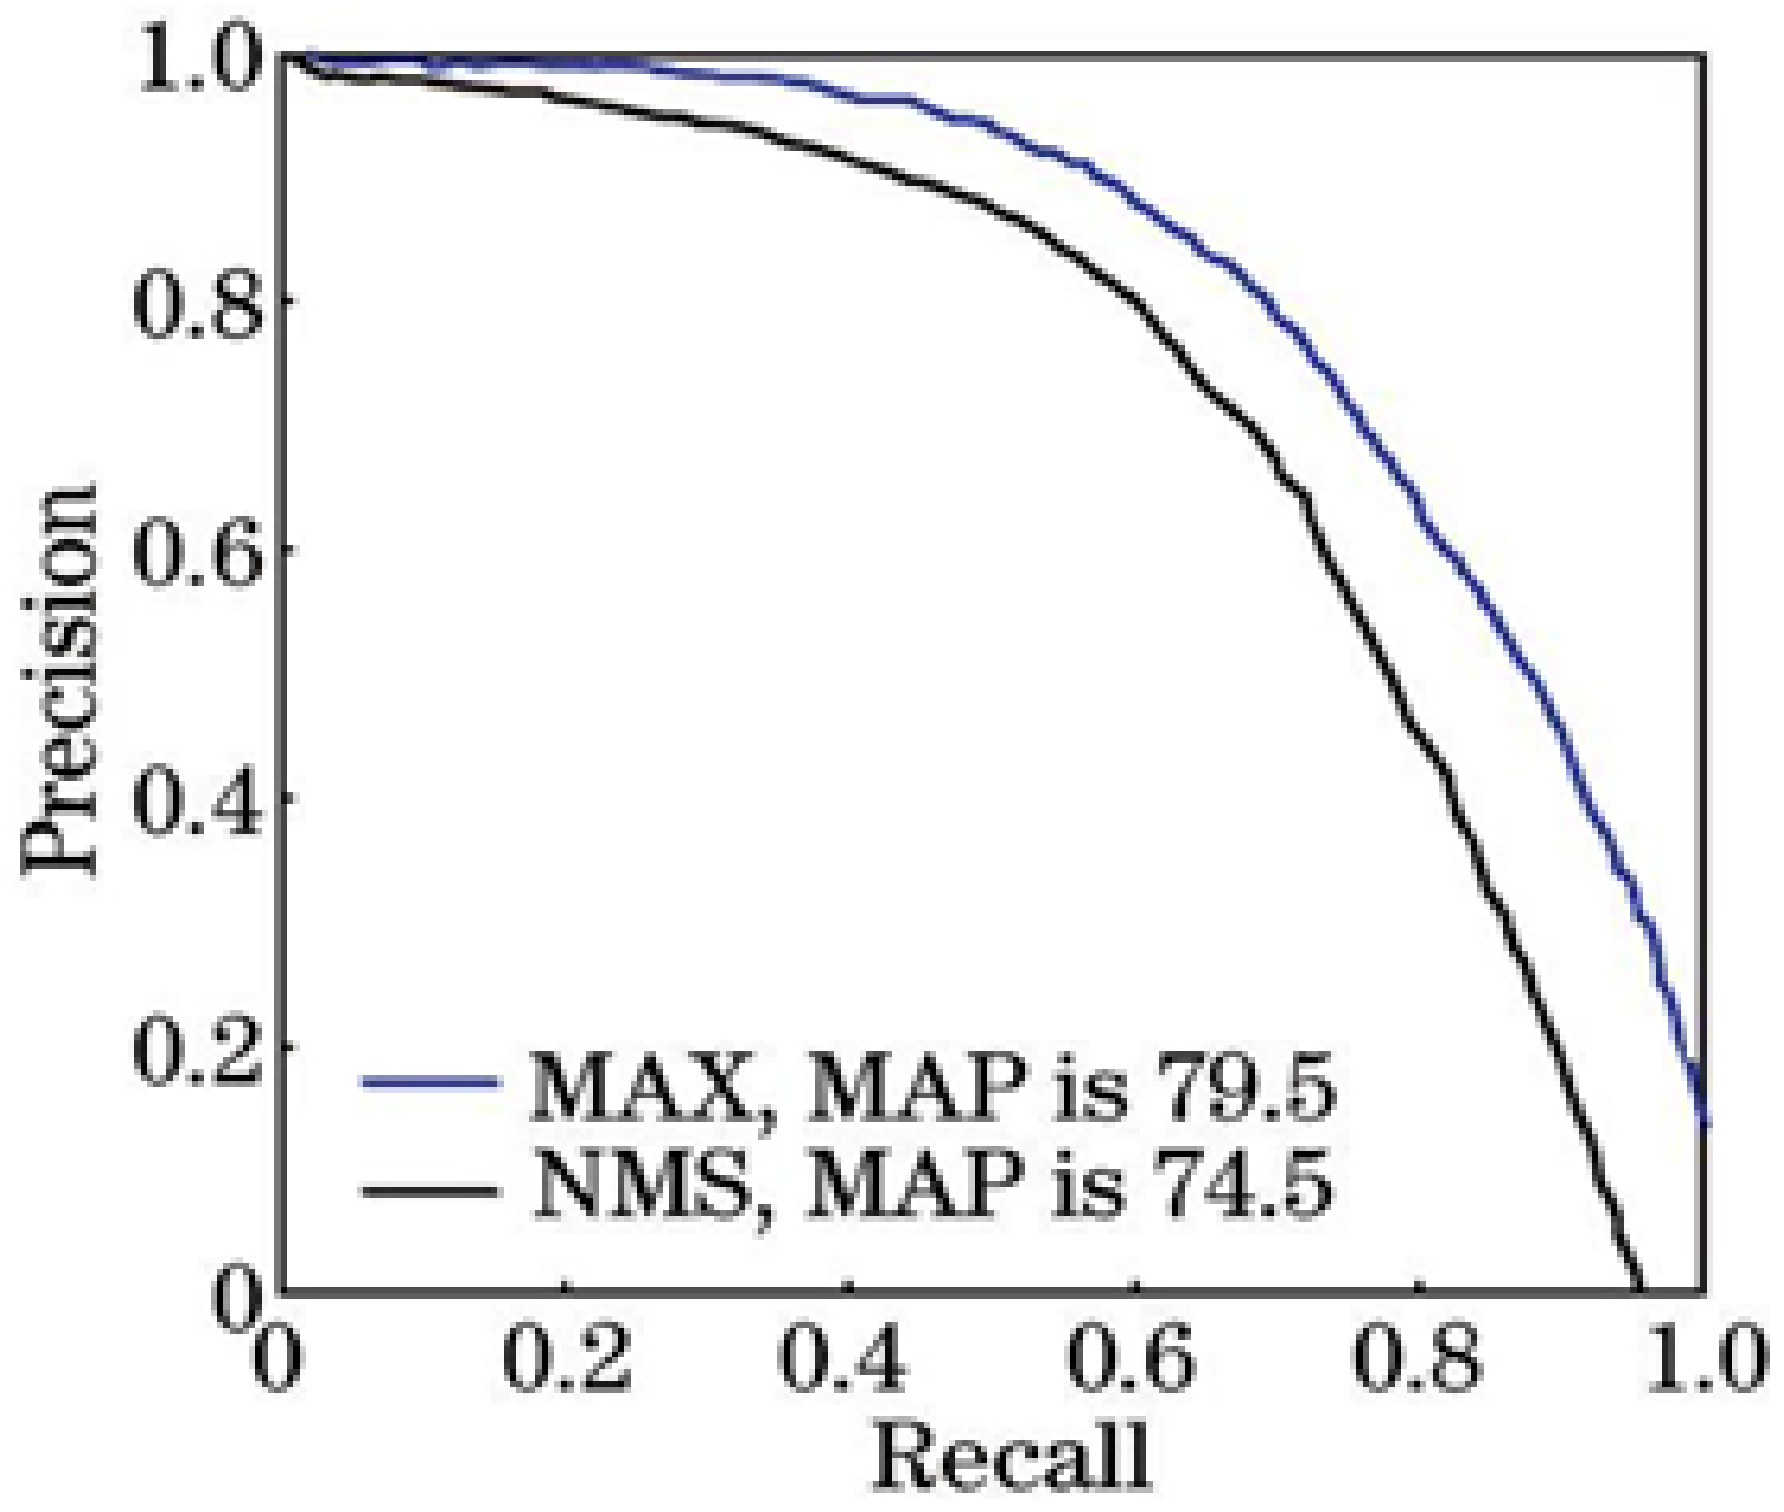
- Modify the filter rules of the candidate box to change the non-Maxima suppression (NMS) operation to the maximum value. The screening rule of the candidate frame in YOLO is NMS operation, but the maximum value operation can be carried out directly on the image positioning problem in this work to improve the detection effect.

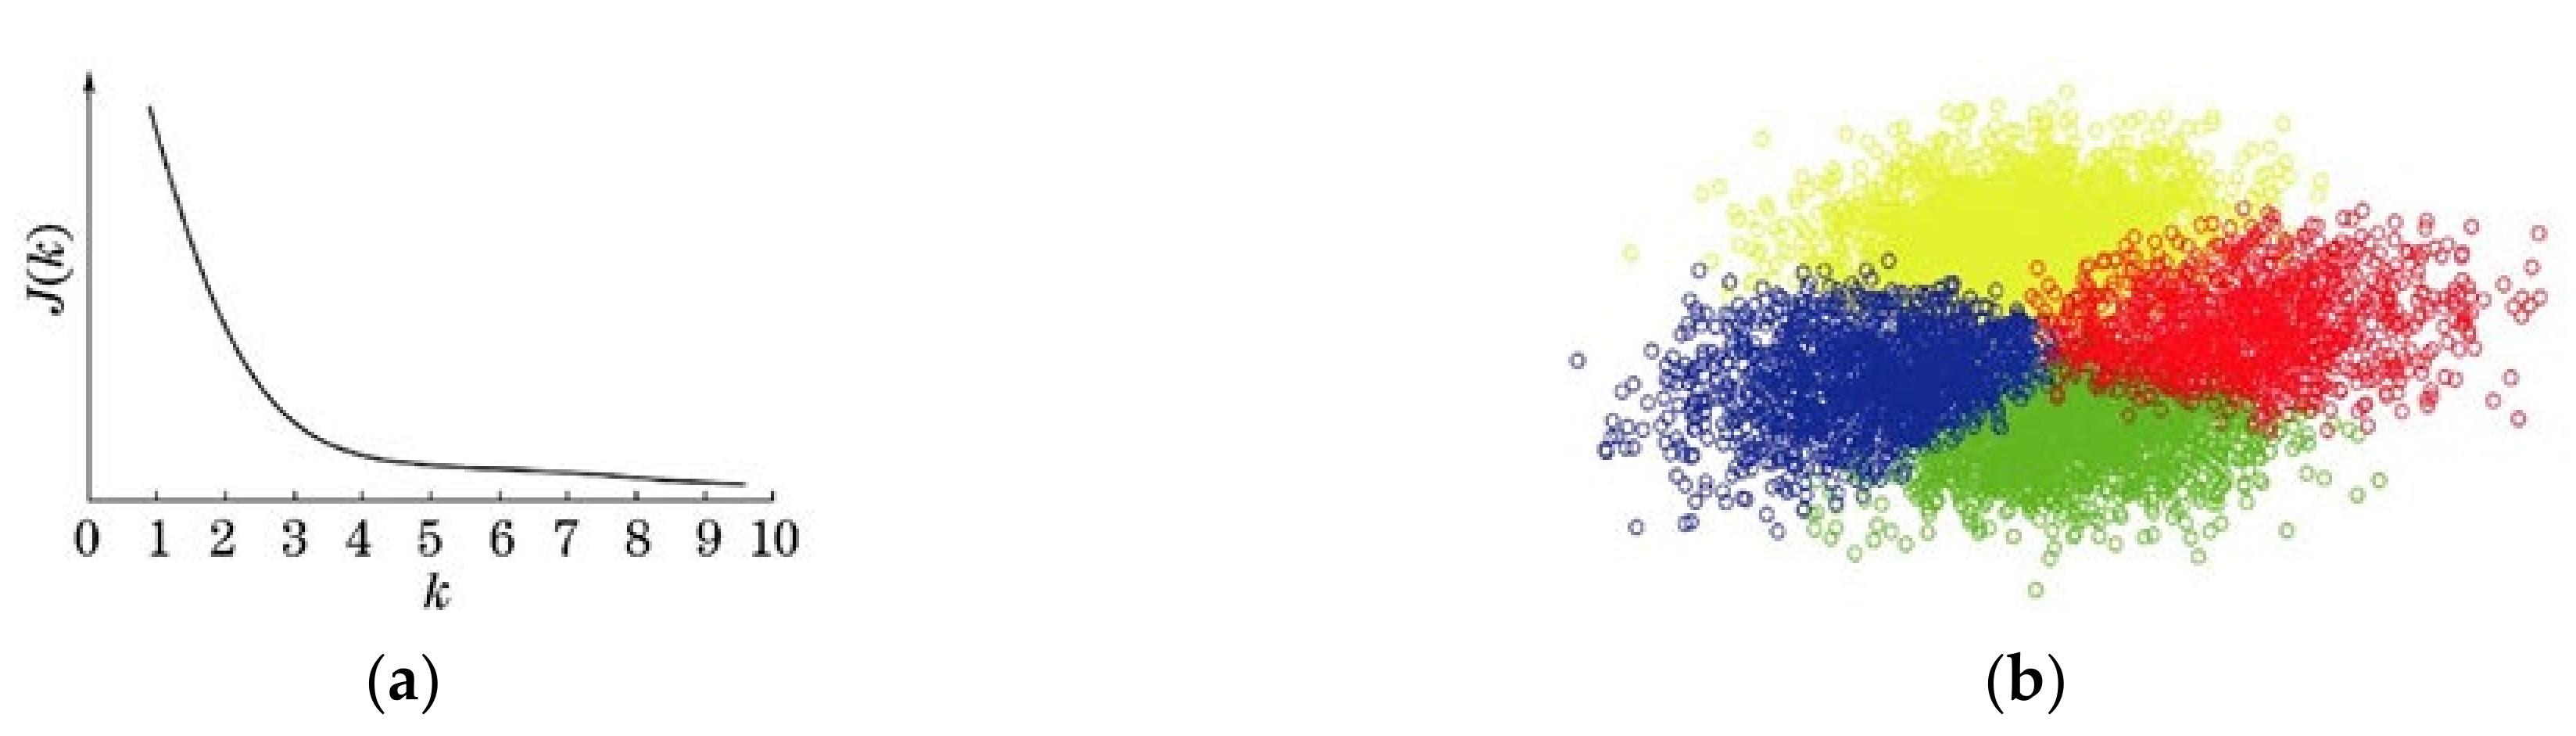
3.1. Target Box Dimension Clustering
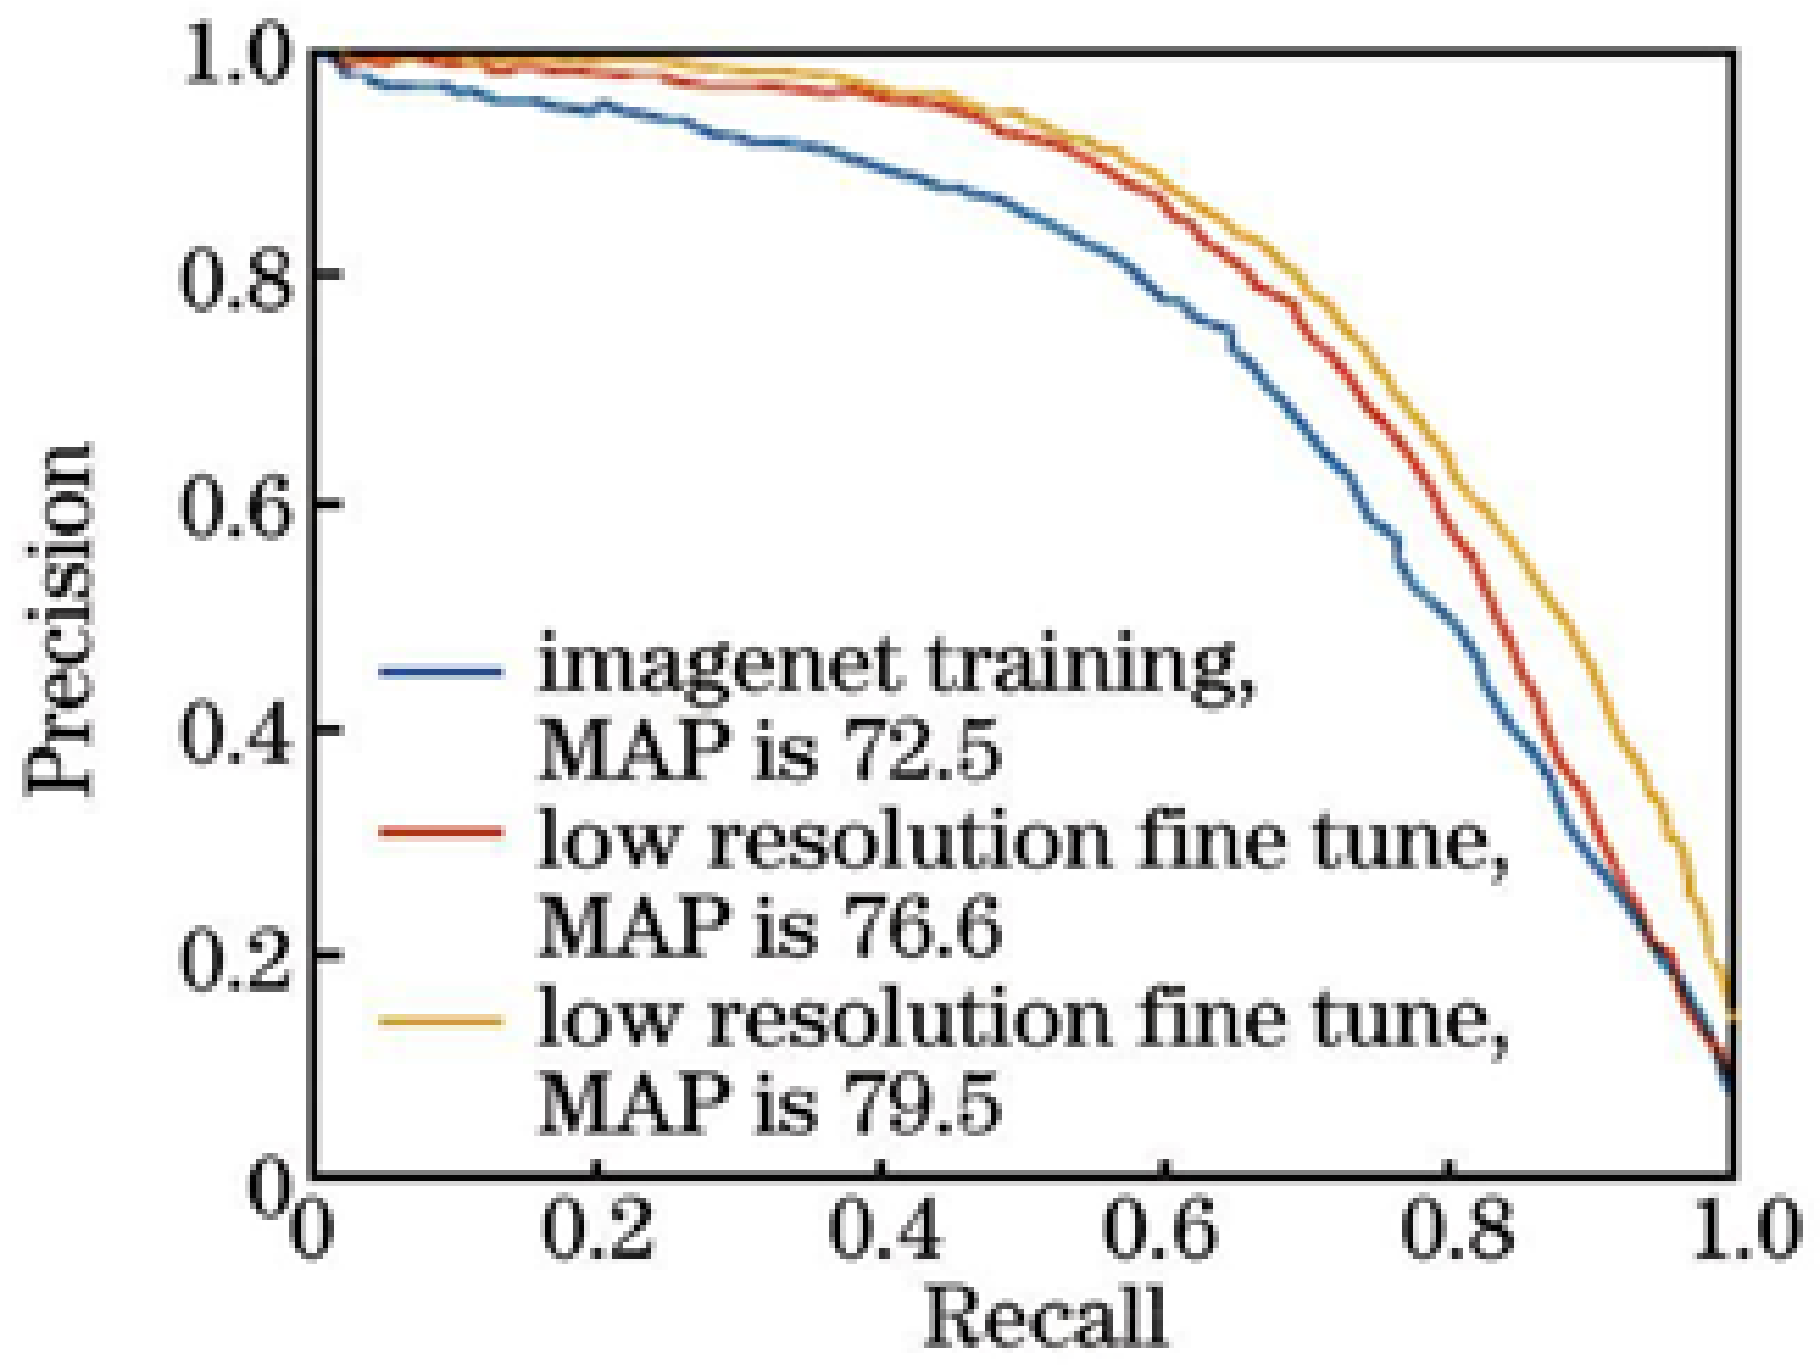
3.2. Classification Network Pre-Training
3.3. Multi-Scale Detection Training
3.4. Change the Candidate Box
4. Results and Discussions
4.1. Experimental Data
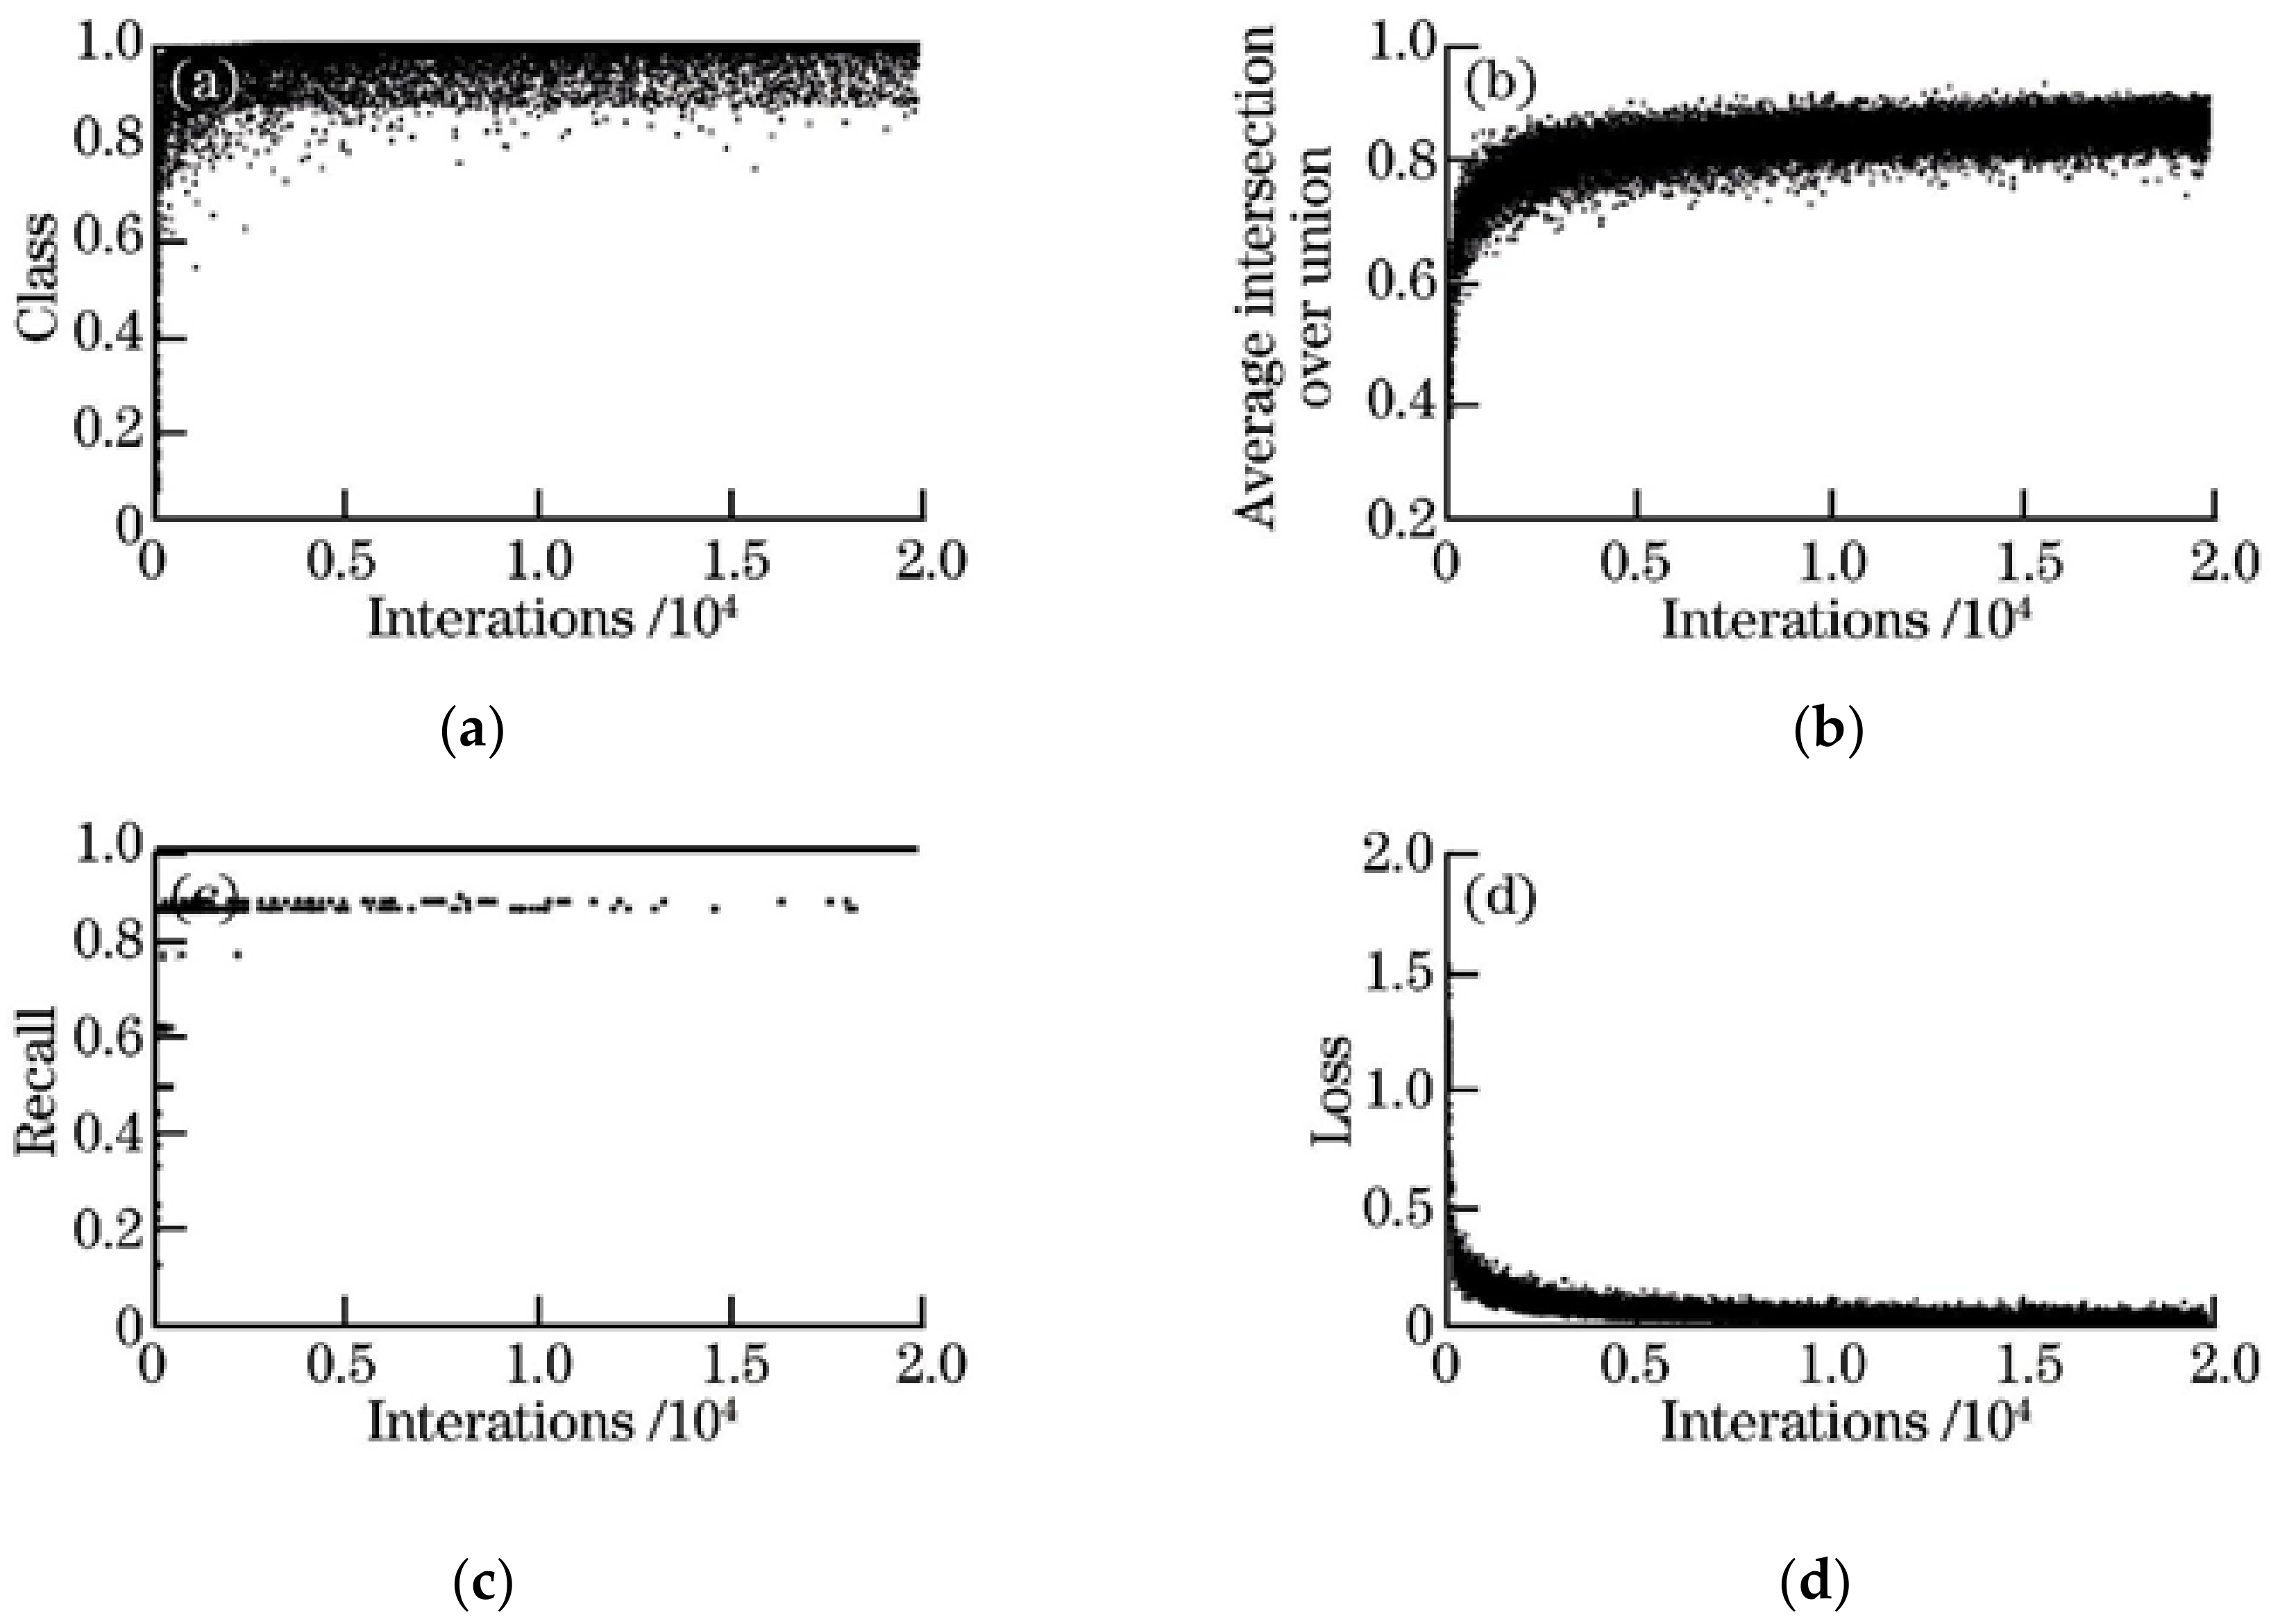
4.2. Configuration and Training Results
4.3. Performance Comparison
4.3.1. Candidate Frame Generation Scheme
4.3.2. Classification Network Pre-Training Method Comparison
4.3.3. Performance Measure between Different Networks
4.3.4. Change Candidate Box Filtering Rules
4.3.5. Determining Optimal Threshold and Detection Validation Set
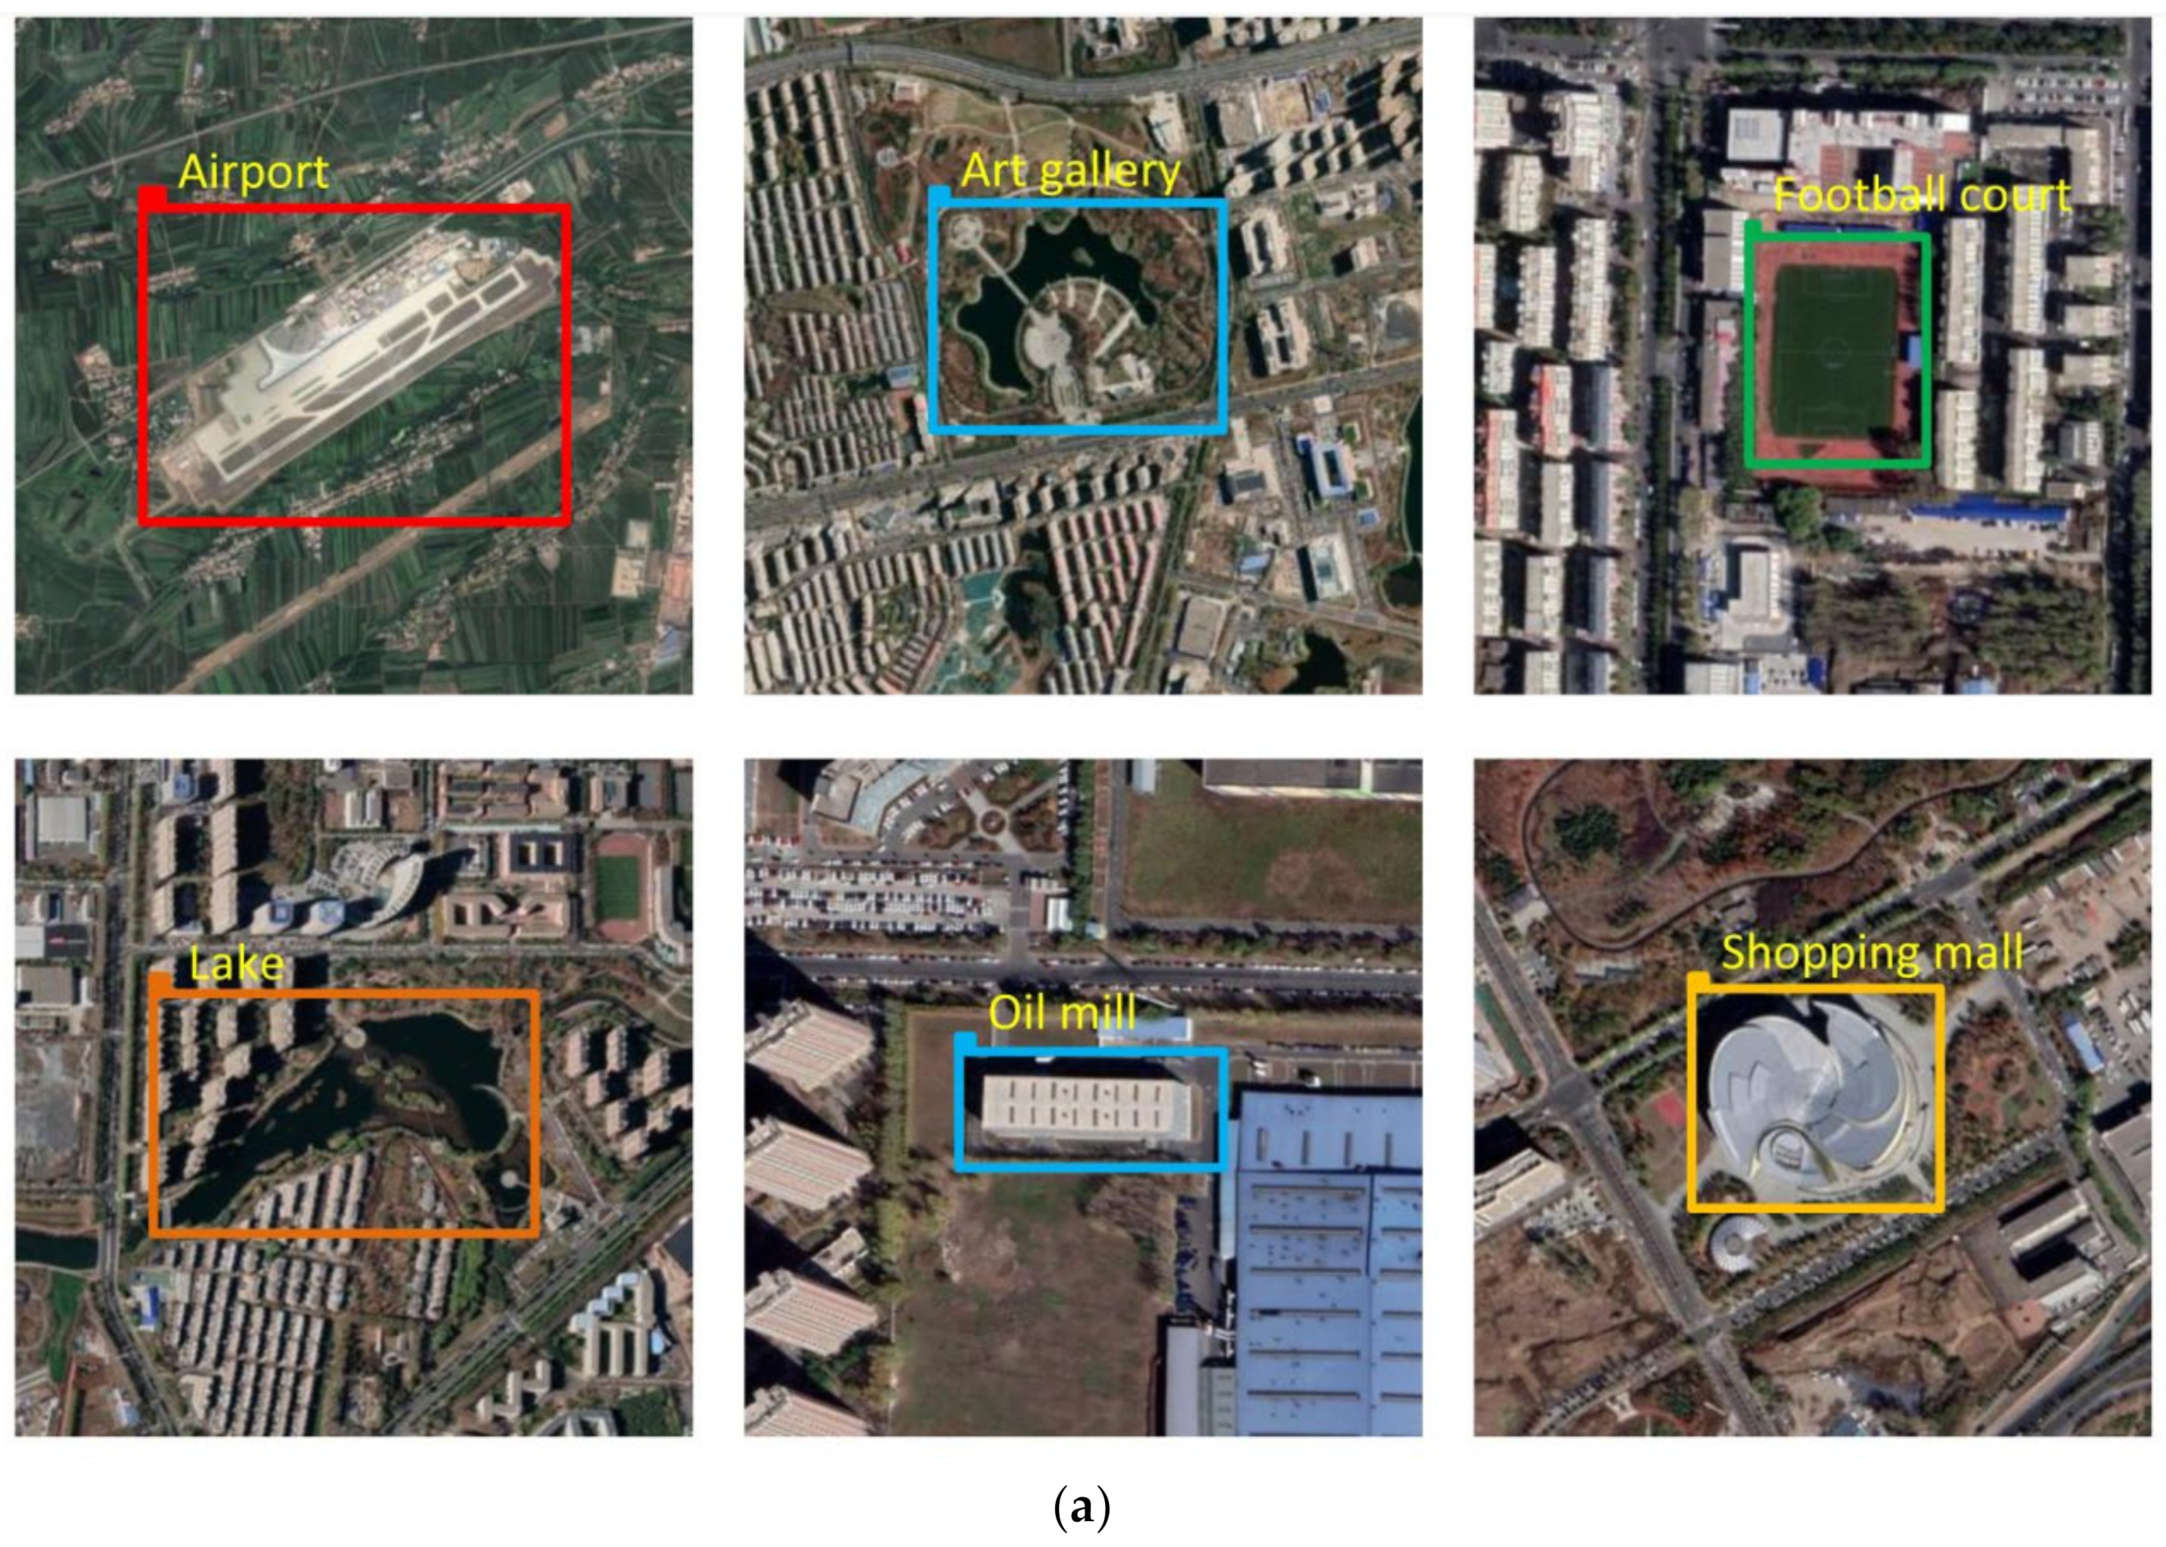
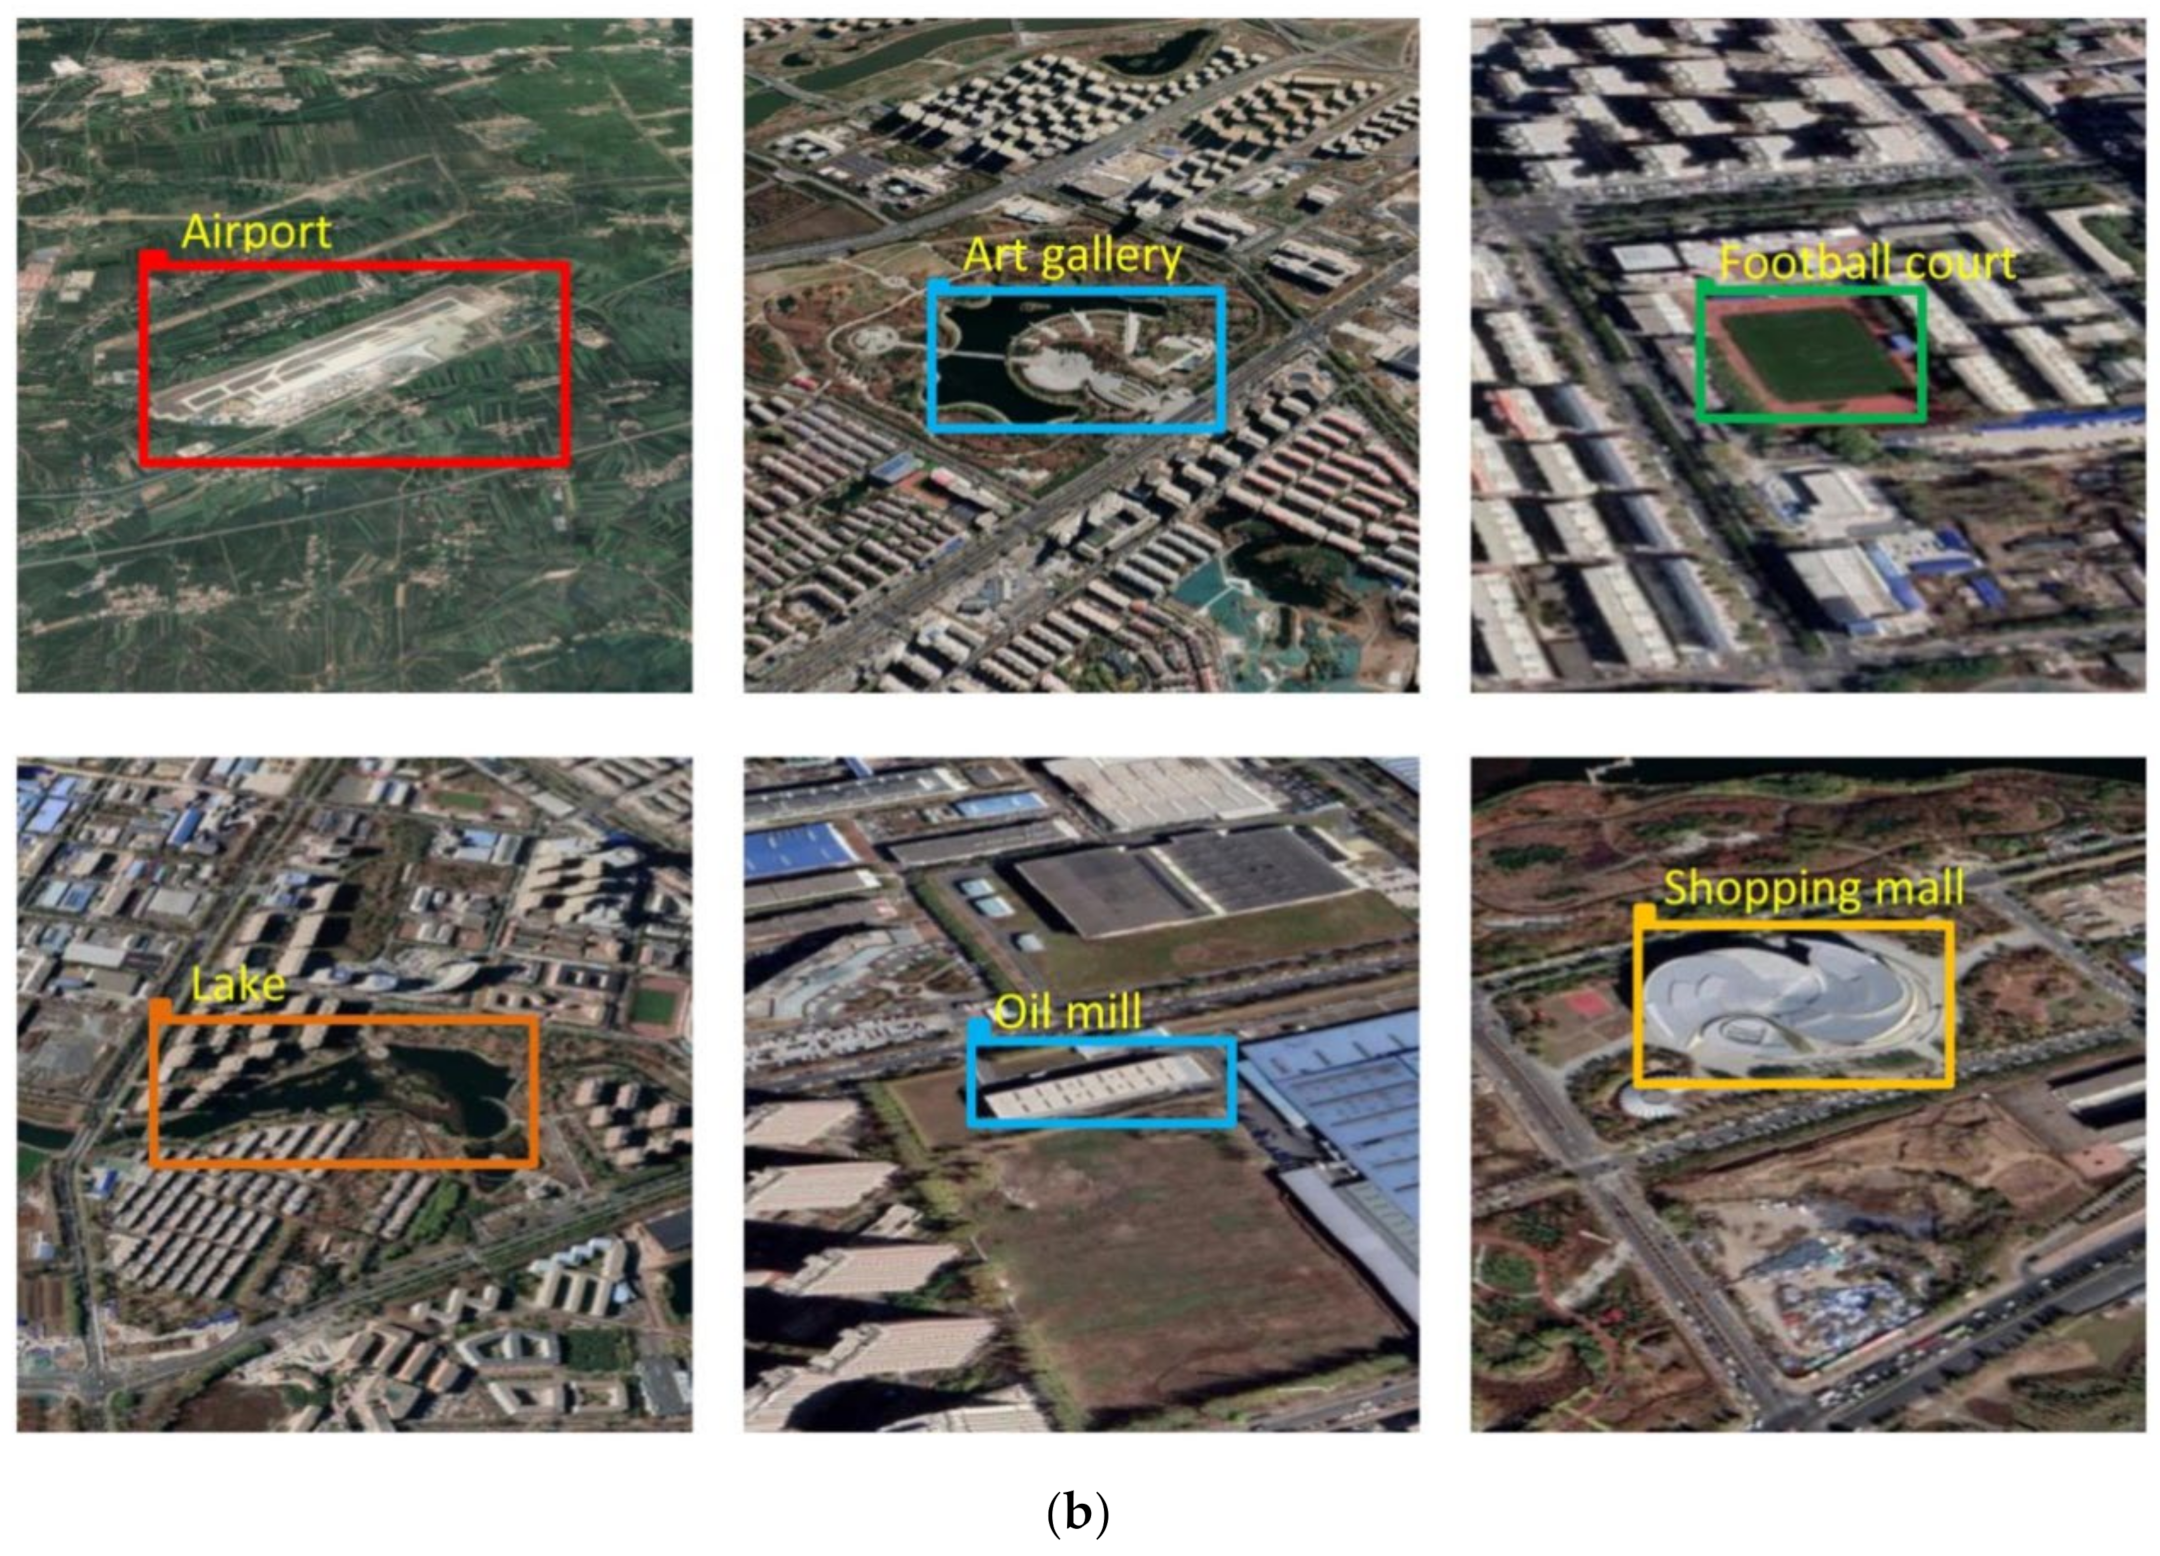
4.4. Simulation Verification
5. Conclusions
Author Contributions
Funding
Informed Consent Statement
Data Availability Statement
Conflicts of Interest
References
- Ramachandran, R.; Sangaiah, A.K. A review on object detection in unmanned aerial vehicle surveillance. Int. J. Cogn. Comput. Eng. 2021, 2, 215–228. [Google Scholar] [CrossRef]
- Liu, M.; Wang, X.; Zhou, A.; Fu, X.; Ma, Y.; Piao, C. UAV-YOLO: Small Object Detection on Unmanned Aerial Vehicle Perspective. Sensors 2020, 20, 2238. [Google Scholar] [CrossRef] [PubMed] [Green Version]
- Lo, L.-Y.; Yiu, C.H.; Tang, Y.; Yang, A.-S.; Li, B.; Wen, C.-Y. Dynamic Object Tracking on Autonomous UAV System for Surveillance Applications. Sensors 2021, 21, 7888. [Google Scholar] [CrossRef] [PubMed]
- LeCun, Y.; Bengio, Y.; Hinton, G. Deep learning. Nature 2015, 521, 436–444. [Google Scholar] [CrossRef] [PubMed]
- Girshick, R.; Donahue, J.; Darrel, T.; Malik, J. Rich feature hierarchies for accurate object detection and semantic segmentation C. In Proceedings of the IEEE Conference on Computer Vision and Pattern Recognition, Columbus, OH, USA, 23–28 June 2014; pp. 580–587. [Google Scholar]
- Girshick, R. Fast R-CNN. In Proceedings of the 2015 IEEE International Conference on Computer Vision (ICCV), Santiago, Chile, 7–13 December 2015; pp. 1440–1448. [Google Scholar] [CrossRef]
- Ren, S.; He, K.; Girshick, R.; Sun, J. Faster RCNN towards real time object detection with region proposal networks. Adv. Neural Inf. Process. Syst. 2015, 28, 91–99. [Google Scholar]
- Redmon, J.; Divvala, S.; Girshick, R.; Farhadi, A. You only look once: Unified real time object detection. In Proceedings of the IEEE Conference on Computer Vision and Pattern Recognition, Las Vegas, NV, USA, 27–30 June 2016. [Google Scholar]
- Liu, W.; Anguelov, D.; Erhan, D.; Szegedy, C.; Reed, S.; Fu, C.Y.; Berg, A.C. SSD single shot multibox detector. In Proceedings of the European Conference on Computer Vision, Amsterdam, The Netherlands, 8–16 October 2016. [Google Scholar]
- Redmon, J.; Farhadi, A. YOLO9000: Better, Faster, Stronger. In Proceedings of the 30th IEEE Conference on Computer Vision and Pattern Recognition, Honolulu, HI, USA, 21–26 July 2017; pp. 6517–6525. [Google Scholar] [CrossRef] [Green Version]
- Kyrkou, C.; Plastiras, G.; Theocharides, T.; Venieris, S.I.; Bouganis, C.-S. DroNet: Efficient convolutional neural network detector for real-time UAV applications. In Proceedings of the 2018 Design, Automation & Test in Europe Conference & Exhibition (DATE), Dresden, Germany, 19–23 March 2018. [Google Scholar] [CrossRef] [Green Version]
- Yong, S.P.; Yeong, Y.C. Human object detection in forest with deep learning based on drone’s vision. In Proceedings of the 2018 4th International Conference on Computer and Information Sciences (ICCOINS), Kuala Lumpur, Malaysia, 13–14 June 2018; pp. 1–5. [Google Scholar]
- Perera, A.G.; Al-Naji, A.; Law, Y.W.; Chahl, J. Human Detection and Motion Analysis from a Quadrotor UAV. In IOP Conference Series: Materials Science and Engineering; IOP Publishing: Bristol, UK, 2018; Volume 405, p. 012003. [Google Scholar] [CrossRef]
- Cai, Y.; Du, D.; Zhang, L.; Wen, L.; Wang, W.; Wu, Y.; Lyu, S. Guided attention network for object detection and counting on drones. arXiv 2019, arXiv:1909.11307. [Google Scholar]
- Mishra, B.; Garg, D.; Narang, P.; Mishra, V. Drone-surveillance for search and rescue in natural disaster. Comput. Commun. 2020, 156, 1–10. [Google Scholar] [CrossRef]
- Gonzalez-Trejo, J.; Mercado-Ravell, D. Dense Crowds Detection and Surveillance with Drones using Density Maps. In Proceedings of the 2020 International Conference on Unmanned Aircraft Systems (ICUAS), Athens, Greece, 1–4 September 2020. [Google Scholar] [CrossRef]
- Sien, J.P.T.; Lim, K.H.; Au, P.-I. Deep Learning in Gait Recognition for Drone Surveillance System. In IOP Conference Series: Materials Science and Engineering; IOP Publishing: Bristol, UK, 2019; Volume 495, p. 012031. [Google Scholar] [CrossRef] [Green Version]
- Hong, S.-J.; Han, Y.; Kim, S.-Y.; Lee, A.-Y.; Kim, G. Application of Deep-Learning Methods to Bird Detection Using Unmanned Aerial Vehicle Imagery. Sensors 2019, 19, 1651. [Google Scholar] [CrossRef] [PubMed] [Green Version]
- Yuan, W.; Choi, D. UAV-Based Heating Requirement Determination for Frost Management in Apple Orchard. Remote Sens. 2021, 13, 273. [Google Scholar] [CrossRef]
- Chen, C.-J.; Huang, Y.-Y.; Li, Y.-S.; Chen, Y.-C.; Chang, C.-Y.; Huang, Y.-M. Identification of Fruit Tree Pests with Deep Learning on Embedded Drone to Achieve Accurate Pesticide Spraying. IEEE Access 2021, 9, 21986–21997. [Google Scholar] [CrossRef]
- Simonyan, K.; Zisserman, A. Very deep convolutional networks for large scale image recognition. In Proceedings of the International Conference on Learning Representations, San Diego, CA, USA, 7–9 May 2015; pp. 1–14. [Google Scholar]
- Szegedy, C.; Liu, W.; Jia, Y.; Sermanet, P.; Reed, S.; Anguelov, D.; Erhan, D.; Vanhoucke, V.; Rabinovich, A. Going deeper with convolutions. In Proceedings of the IEEE Conference on Computer Vision and Pattern Recognition, Boston, MA, USA, 7–12 June 2015. [Google Scholar]
- Lin, M.; Chen, Q.; Yan, S.C. Network in network. arXiv 2013, arXiv:1312.4400. [Google Scholar] [CrossRef]
- Krizhevsky, A.; Sutskever, I.; Hinton, G.E. Imagenet classification with deep convolutional neural networks. Adv. Neural Inf. Process. Syst. 2012, 25, 1–9. [Google Scholar] [CrossRef]
- Zhang, S.; Zhao, H. Algorithm research of optimal cluster number and initial cluster center. J. Appl. Res. Comput. 2017, 34, 1617–1620. [Google Scholar]
- Li, L. Terrain Reconstruction Based on Unmanned Aerial Vehicle Sequence Imaging and Its Application in Navigation. Ph.D Thesis, Changsha National University of Defense Technology, Changsha, China, 2009. [Google Scholar]
- Zhang, L.; Chen, J.; Qiu, B. Region-of-Interest Coding Based on Saliency Detection and Directional Wavelet for Remote Sensing Images. IEEE Geosci. Remote Sens. Lett. 2016, 14, 23–27. [Google Scholar] [CrossRef]
- Liu, D.; Han, L.; Han, X. High spatial resolution remote sensing image classification base do depth learning Act. Acta Opt. Sin. 2016, 36, 0428001. [Google Scholar] [CrossRef]
- Shu, C.; He, Y.; Sun, Q. Point Cloud Registration Based on Convolutional Neural Network. Laser Optoelectron. Prog. 2017, 54, 31001. [Google Scholar]
- Arunnehru, J.; Geetha, M.K. A Quantitative Real-Time Analysis of Object Tracking Algorithm for Surveillance Applications. Int. J. Emerg. Technol. Adv. Eng. 2013, 3, 234–240. [Google Scholar]
- Arunnehru, J.; Geetha, M.K. Motion Intensity Code for Action Recognition in Video Using PCA and SVM. In Mining Intelligence and Knowledge Exploration; Springer: Cham, Switzerland, 2013; Volume 8284, pp. 70–81. [Google Scholar]
- Arunnehru, J.; Geetha, M.K. Vision-Based Human Action Recognition in Surveillance Videos Using Motion Projection Profile Features; Springer: Cham, Switzerland, 2015; Volume 9468, pp. 307–316. [Google Scholar]
- Arunnehru, J.; Geetha, M.K. An efficient multi-view based activity recognition system for video surveillance using random forest. In Smart Innovation, Systems and Technologies; Springer: Cham, Switzerland, 2014; Volume 32, pp. 111–122. [Google Scholar]


| Ref. No | Methodologies | Inferences | Limitations |
|---|---|---|---|
| [11] | Single Shot Multi-Box Detector (SSD) | - Used for vehicle detection. - Deep learning approach was adapted. - Found to be faster than other compared models | - Sensitivity and precision scales were decreased. |
| [12] | RCNN and HOG | - Adapted to identify the human presence. - Deep learning schemes were used. - The overall performance showed superior compared with other conventional schemes. | - The proposed approach is not suitable for real-time scenarios. |
| [13] | GANet | - Used to detect the human and pose estimation. - Deep learning model was adapted. - It offered ideal accuracy in detection. | - Training descriptions are clutter-free, contextual, and inappropriate for real-time scenarios. |
| [14] | MobileNet and SSD | - Object detection was carried out using the proposed method. - Deep learning approach was considered. - It offered best better accuracy with the foreground and background attention model. | - This work failed to demonstrate multi-objects. |
| [15] | CNN | - Human action detection was carried out using the considered model. - Deep learning approach was adopted. - It detected the multiple actions of humans with good accuracy. | - Waving hand action was concentrated more than the other movements. |
| [16] | YOLO, SSD and RCNN | - Human detection and their counts were performed effectively. - Deep learning approach was used to study the performance. - It offered good accuracy in counting the humans. | - This work failed to focus on more crowd patterns with improved accuracy. |
| [17] | CNN | - This work demonstrated the recognition of human activity. - Deep learning approach was used. - This pipeline scheme improved the accuracy and speed of the detection. | - It failed to recognize the human action from different camera angles. |
| [18] | Human shape validation filter | - This work identified the birds using the proposed method. - Deep learning approach was considered. - The detection shows better accuracy than other methods. | - It showed some difficulties in detecting the smaller birds. |
| [19] | YOLOv4 | - This model was adapted to detect the apple flower bud. - Deep learning approach was considered. - It helped to determine the heat requirement based on feasible detection. | - The classification performance showed average results. |
| [20] | Tiny YOLO | - This work provided optimized performance in both terms FPS and mAP. - Used the own dataset for training the data. - Applied to detect the pest using the proposed approach. | - This scheme offered less accuracy for low-resolution images. |
| Model | Top—1/% | Top—5/% | GPU/ms | CPU/s |
|---|---|---|---|---|
| Alexnet | 57 | 80.3 | 1.5 | 0.3 |
| VGG-16 | 70.5 | 90 | 10.7 | 4.9 |
| DarkNet-19 | 72.9 | 91.2 | 6.0 | 0.66 |
| Detection Network | Fast R-CNN | Faster R-CNN VGG-16 | Faster R-CNN Resnet | YOLO | SSD 300 | SSD 500 | YOLO 288 × 288 | YOLO 544 × 544 |
|---|---|---|---|---|---|---|---|---|
| mAP | 70 | 73.2 | 76.4 | 63.4 | 74.3 | 76.8 | 69.0 | 78.6 |
| FPS | 0.5 | 7 | 5 | 45 | 46 | 19 | 91 | 40 |
| Candidate Box | Anchors Generated | Average Overlap Rate |
|---|---|---|
| Faster Region based-CNN | 7 | 0.77 |
| YOLO | 5 | 0.79 |
| Dimension Clustering | 4 | 0.83 |
| Detection of Dataset/(Pixel × Pixel) | Multi-Scale Network | Single-Scale Network | ||
|---|---|---|---|---|
| Detection Time/s | mAP | Detection Time/s | mAP | |
| 224 × 224 | 0.01 | 71.1 | 0.013 | 70.3 |
| 320 × 320 | 0.012 | 74.8 | 0.014 | 74.2 |
| 416 × 416 | 0.015 | 77.5 | 0.015 | 77.8 |
| 512 × 512 | 0.018 | 79.4 | 0.016 | 78.4 |
| 608 × 608 | 0.029 | 80.9 | 0.018 | 78.9 |
| Threshold | Region Proposals/Image (Rps/Img) | Recall% | Precision% |
|---|---|---|---|
| 0.001 | 7.75 | 100 | 12.07 |
| 0.005 | 3.13 | 86.78 | 50.27 |
| 0.025 | 1.56 | 69.91 | 80.45 |
| 0.45 | 1.17 | 50.29 | 93.73 |
| 0.8 | 0.12 | 12.03 | 100 |
| Track Number | Number of Sequences | Proportion of Object Area (%) | Number of a Correct Object Area | Number of a Wrong Object Area | Accuracy Rate of Location (%) |
|---|---|---|---|---|---|
| 1 | 276 | 45 | 136 | 25 | 84.5 |
| 2 | 355 | 38 | 144 | 31 | 82.3 |
| 3 | 210 | 54 | 130 | 17 | 88.4 |
| 4 | 395 | 46 | 202 | 34 | 85.6 |
Publisher’s Note: MDPI stays neutral with regard to jurisdictional claims in published maps and institutional affiliations. |
© 2022 by the authors. Licensee MDPI, Basel, Switzerland. This article is an open access article distributed under the terms and conditions of the Creative Commons Attribution (CC BY) license (https://creativecommons.org/licenses/by/4.0/).
Share and Cite
Jawaharlalnehru, A.; Sambandham, T.; Sekar, V.; Ravikumar, D.; Loganathan, V.; Kannadasan, R.; Khan, A.A.; Wechtaisong, C.; Haq, M.A.; Alhussen, A.; et al. Target Object Detection from Unmanned Aerial Vehicle (UAV) Images Based on Improved YOLO Algorithm. Electronics 2022, 11, 2343. https://doi.org/10.3390/electronics11152343
Jawaharlalnehru A, Sambandham T, Sekar V, Ravikumar D, Loganathan V, Kannadasan R, Khan AA, Wechtaisong C, Haq MA, Alhussen A, et al. Target Object Detection from Unmanned Aerial Vehicle (UAV) Images Based on Improved YOLO Algorithm. Electronics. 2022; 11(15):2343. https://doi.org/10.3390/electronics11152343
Chicago/Turabian StyleJawaharlalnehru, Arunnehru, Thalapathiraj Sambandham, Vaijayanthi Sekar, Dhanasekar Ravikumar, Vijayaraja Loganathan, Raju Kannadasan, Arfat Ahmad Khan, Chitapong Wechtaisong, Mohd Anul Haq, Ahmed Alhussen, and et al. 2022. "Target Object Detection from Unmanned Aerial Vehicle (UAV) Images Based on Improved YOLO Algorithm" Electronics 11, no. 15: 2343. https://doi.org/10.3390/electronics11152343