Article

Optimized Torque Performance of a 7-Phase Outer-Rotor Surface-Mounted Permanent Magnet Synchronous Machine for In-Wheel E-Motorcycle Application

by
Hamidreza Ghorbani
1,
Mohammadreza Moradian
1,2,* and
Mohamed Benbouzid
3,*
1
Department of Electrical Engineering, Najafabad Branch, Islamic Azad University, Najafabad 8514143131, Iran
2
Smart Microgrid Research Center, Najafabad Branch, Islamic Azad University, Najafabad 8514143131, Iran
3
Institut de Recherche Dupuy de Lôme (UMR CNRS 6027), University of Brest, 29238 Brest, France
*
Authors to whom correspondence should be addressed.
Electronics 2022, 11(19), 3192; https://doi.org/10.3390/electronics11193192
Submission received: 6 September 2022 / Revised: 26 September 2022 / Accepted: 28 September 2022 / Published: 5 October 2022
(This article belongs to the Special Issue Feature Papers in Industrial Electronics)

Abstract

:
Four outer rotor surface-mounted permanent magnet synchronous machines (SMPSM), supplied by a seven-phase drive system, are proposed in this study, considering different q (number of stator slot per phase per pole ratio) to achieve a satisfying value of electromagnetic torque and Back-Electromotive Force (Back-EMF) with lower torque pulsation. Accordingly, the proposed configurations are investigated, and results are comparatively reported. Thus based on the results, the best-performing configuration, the candidate model, which presents the lowest torque pulsation with a desirable value of Tavg and Back-EMF is selected. In order to demonstrate the advantages of this candidate model, an optimization analysis is performed using 2D Finite Element Analysis (FEA). The resultant values of the variables are applied, designing three optimized models. Performance results of the optimized models demonstrate that TCog reduced noticeably and TRipple declined below 5%. The Artemis Drive-Cycles analysis results are also included for the best-optimized model, considering E-Motorcycle requirements and properties for urban, rural, and motorway driving conditions. Accordingly, in terms of In-Wheel application of the optimized machine, high torque/power density along with high values of PF and efficient performance are provided for E-Motorcycle application.

1. Introduction

In terms of electric vehicle (EV) propulsion application, enormous studies have been conducted on transportation electrification technologies, requirements, policies, and electric machine topologies [1,2,3,4]. Permanent magnet synchronous machine (PMSM) is one of the major alternatives widely investigated for vehicular application [5,6,7,8,9,10]. PMSM topologies mostly benefit from a laminated cylindrical slotted stator with a 3-Phase winding, are supplied by an inverter set-up, and utilize a permanent magnet (PM) rotor. In comparison with induction machine (IM) technologies, PMSM provides advantages as outlined [4,5,11,12,13,14]: (i) higher power density, (ii) higher efficiency, (iii) high power factor, (iv) high ratio of output torque to weight and (v) more reliability. PMSM rotor structure is mainly introduced as interior/surface mounted PMSM (IPMSM and SPMSM respectively), located on the inner or outer side of the stator (IR or OR-SPMSM, respectively) [15,16]. Due to features of the external location of the rotor and corresponding high inertia, OR-SPMSM demonstrates constant speed operation rather than acceleration operation [4,10,15,16,17]. However, SPMSM machines suffer from high values of torque ripple, particularly when operating at low speed, and it is an urgent issue to be tackled which is studied in the majority of the literature considering topological design optimizations [12,16,18]. Optimizing the dimension of PMs and slot entrance designs, along with an optimal selection of slot/pole combinations for OR-SPMSM, has a high impact on the slotting effect and air-gap flux density of the machine and hence effectively results in the cogging torque reduction. In addition, with the advent of power electronic converters, the multiphase drive system, with advantages such as reduction of torque pulsation and providing higher torque pulsation frequencies, can apply to electric motor drive systems [19,20,21,22,23,24,25,26]. Marmaras et al. [3] studied the behavior of the EV drivers and their impact on electricity and transport electrification systems. About 1000 EV agents have been investigated while being unaware/aware of the test. Consequently, it has been found that their behavior directly and indirectly affects both the road transport system and the electricity grid, traffic on the roads, the distribution network’s stress and the usage of the charging-related infrastructure. Wu et al. [8] focus on design considerations of an OR-SPMSM with fractional concentrated winding configuration for In-Wheel applications, employing particle swarm optimization (PSO). Eight rotor pole numbers for a 48-slot stator are considered in this study. According to the applied PSO and 2D FEA results, the 48Slot/44Pole OR-SPMSM with about 10 Nm of torque ripple and 0.5 Nm of cogging torque provided the best performance in terms of EV application. A territory PSO (TPSO) is proposed by Ahn et al. [12] for design optimization of a SPMSM for unmanned aerial vehicle application (UAV). Accordingly, the torque performance of the proposed SPMSM model is reduced, whereas it has to be more precisely investigated because the model was applied to low-power SPMSM (below 0.5 kW). In addition, the optimum model still suffers from about 3% torque ripple for only 2.6 Nm of average torque. A numerical-based comparative analysis for OR brushless DC machine (BLDC) and SPMSM is studied by Lee et al. [15], as a low-voltage OR-BLDC and -SPMSM were analyzed using 3D FEA. The results demonstrated that the proposed OR-SPMSM presents lower value of torque fluctuations due to a reduction of stack length (torque ripple reduced by 78%) in comparison with the proposed OR-BLDC. Zhao et al. [16] designed and optimized an OR-SPMSM with reverse step shape PMs. Based on theoretical results, the air-gap flux harmonics decreased in comparison with the conventional SPMSM. Although, torque ripple value is reduced for the proposed OR-SPMSM, the optimized models a faced drop in torque density. Refs. [23,25] addresses the design of a 7-P SPMSM with tooth-concentrated winding using a maximum torque per ampere (MTPA) control strategy. Scuiller [23] focused on the design of two radially magnetized PMs to reduce torque ripple. In addition, by injecting the fifth harmonic current, the produced torque can develop without increasing torque fluctuations. While Scuiller et al. [25] investigated the simplicity and fault-tolerant ability of a 7-phase SPMSM.
Therefore, to study tackling the high values of torque ripple in a SPMSM, this paper aims to investigate an OR-SPMSM supplied by a 7-phase drive system with four winding configurations, particularly for low torque ripple In-Wheel E-Motorcycle application. Results are comparatively reported and the best-performing configuration, providing a desirable amount of torque density with low fluctuations, is selected to be precisely studied. Hence, to aim for this goal and for clearing the strengths of the machine, a 2D FEA is applied to 1000 structural designs considering the best-performed winding pattern. The final optimized models, meeting the objective function constraints, are determined and results have been compared. Finally, the model presenting the best performance is analyzed under the standard Artemis Drive Cycle test and results reported for urban, road, and motorway operation. Accordingly, the optimized OR-SPMSM presents high torque density with at most 135 mm outer diameter, which makes it suitable to be placed in motorcycle wheels of an average size as specified in Section 4.5, in which the constraints for practically utilizing the proposed optimized model are discussed and studied. Other constraints about such application are also listed and theoretical principle is discussed. Moreover, the operating outputs for such applications are reported, including avg. and max. operating speeds, losses, in-output energies and operational efficiencies.

2. System Equations Review

In the following sections, summarized design formulation and performance equations for multi-phase PM machines and proposed models are presented.

2.1. Multiphase PM-Machine Equations

Generally, for any multi-phase electrical machine, power, Pe, and torque, Te, can be expressed as [27]:
P e = m T 0 T e t i t d t
T e = P e Ω = m Ω T 0 T e t i t d t
where Ω is the rotational angular speed, m is the number of phases, T is the cycle period of Back-EMF, e(t) and i(t) are one phase Back-EMF and current, respectively. To enhance torque density in the m-phase system, current harmonic orders less than m can be injected into the system [19,27]. Hence, assuming the same harmonic orders for Back-EMF [27]:
e t = υ m 2 E υ S i n υ ω t
i t = κ = 1 m 2 I κ S i n κ ω t
where Eυ and Iκ are υth and κth harmonic peak values of Back-EMF and current, respectively, and ω is the electrical angular frequency. Accordingly, the torque equation can be rewritten as [27]:
T e = κ = 1 m 2 m 2 Ω E κ I κ
and Eκ, the peak value of Back-EMF is given by:
E κ = Ω K e κ B κ N t D g L
where κth harmonic of winding factor and air-gap flux density are K and Bκ, respectively. Nt is the number of turns per phase and Dg and L are the air-gap diameter and stack length of the machine, respectively. In order to achieve torque enhancements, the RMS value of phase current (including peak values of current harmonics) can be given as [27]:
I r m s = I 1 2 K e κ B 1 κ = 1 m 2 K e κ B κ 2
where I1 is the peak value of 1st current harmonic, Ke1 and B1 are the corresponding winding factor and air-gap flux density harmonics, respectively. Inserting electrical loading, A, as [27]:
A = 2 m N t I r m s π D g
into (7), one can obtain:
I 1 = π A D g K e 1 B 1 2 m N t κ = 1 m 2 K e κ B κ 2
and
I κ = K e κ B κ K e 1 B 1 I 1
Thus, the electromagnetic torque can be expressed as [25]:
T e = π A D g 2 L 2 2 υ = 1 m 2 K e υ B υ 2 κ = 1 m 2 K e κ B κ 2
Calculating Do, outer diameter, by
λ o = D g D o
Torque equation based on sizing equation, Do2L, for a multiphase PM machine can be expressed as Equation (13):
T e = π A λ o D o 2 L 2 2 υ = 1 m 2 K e υ B υ 2 κ = 1 m 2 K e κ B κ 2

2.2. Winding Types

Considering the value of q, the number of stator slots per rotor pole per phase, two main types of winding can be introduced [28,29]:
(i)
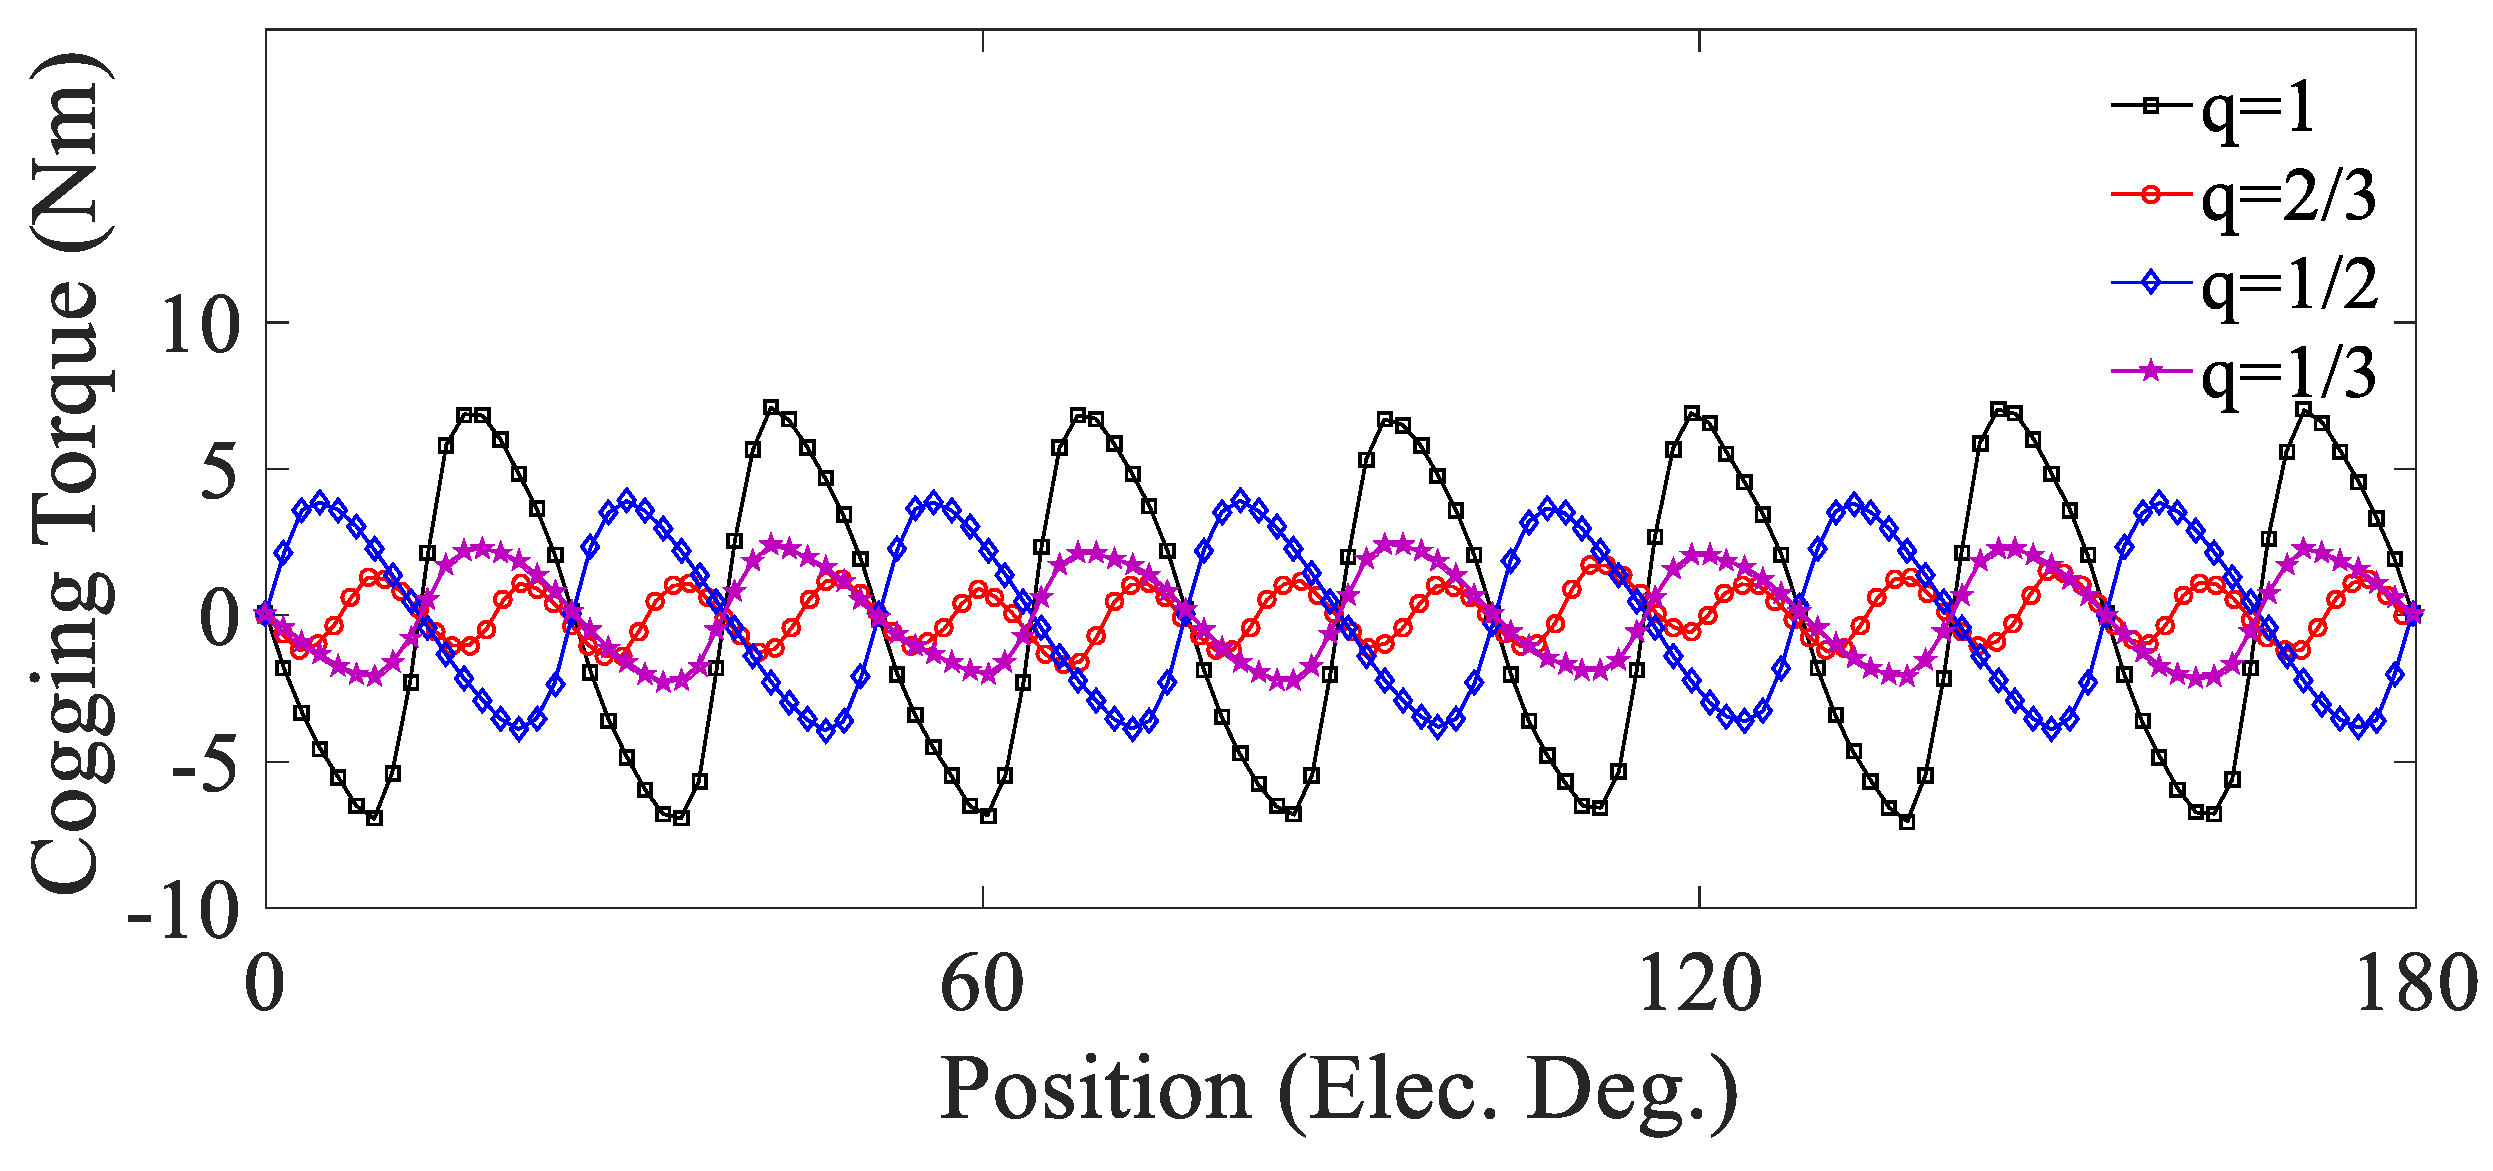
q is an integer, distributed-winding type: conventionally used in electric machines, where greater value of q results in more sinusoidal magnetomotive force (MMF) wave produced.
(ii)
q is not an integer, concentrated-winding type: this type is mostly wounded in single or double layers, for which the comparison is given in Table 1.
It can be found from Equation (13) that the variation in air-gap flux density and the value of m has a high impact on the torque performance of the machine. In addition, based on the q ratio as:
q = N s m N p
the values of Ns, Np, and m have a direct effect on the winding pattern, corresponding winding factor and MMF. Overall, Bg is influenced by the ratio of slot/pole combination along with the number of phases and the value of PMs flux linkage in the rotor. Therefore, it directly affects the electromagnetic torque of the PM machine.

3. Proposed Model

In this study, based on the former introduction in Section 2, four winding patterns and corresponding Ns for a six-pole seven-phase outer-rotor SPM machine (Figure 1) are investigated for In-Wheel application in an E-Motorcycle. The proposed models are designed and analyzed under the same condition, assuming 40 °C of ambient temperature.

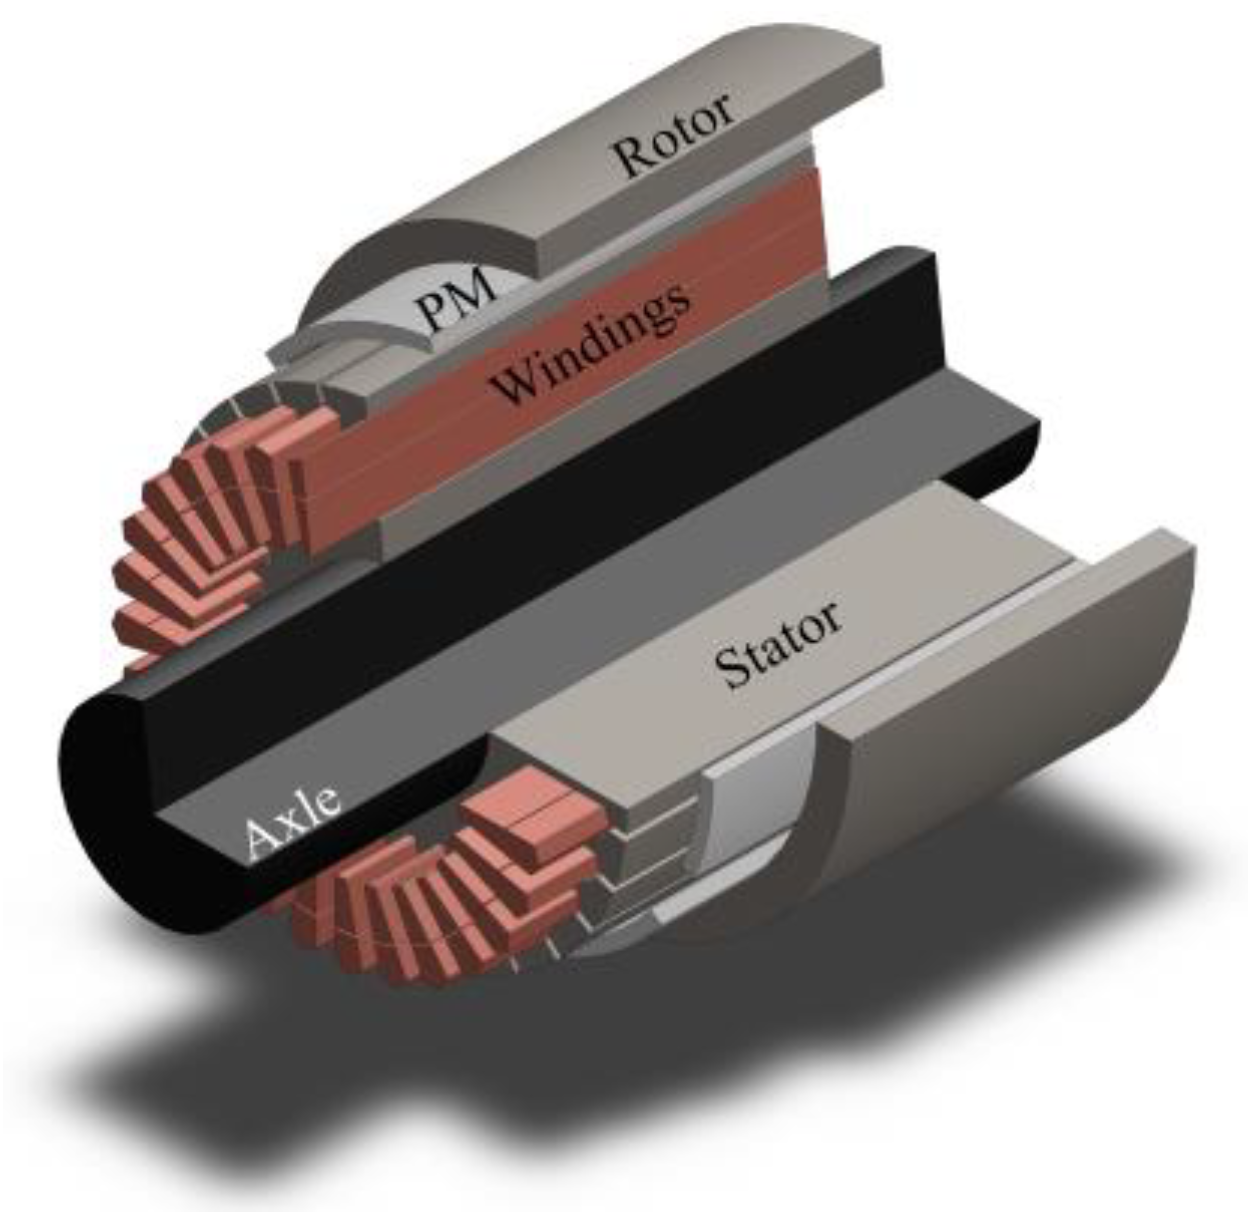
3.1. Configuration and Design Parameters

Four Ns/Np ratios, namely 42/6, 28/6, 21/6, and 14/6, are considered in this study, resulting in q equal to 1, ⅔, ½, and ⅓, respectively. The initial values of design parameters are given in Table 2. The winding patterns and the objective function of this study are as follow.

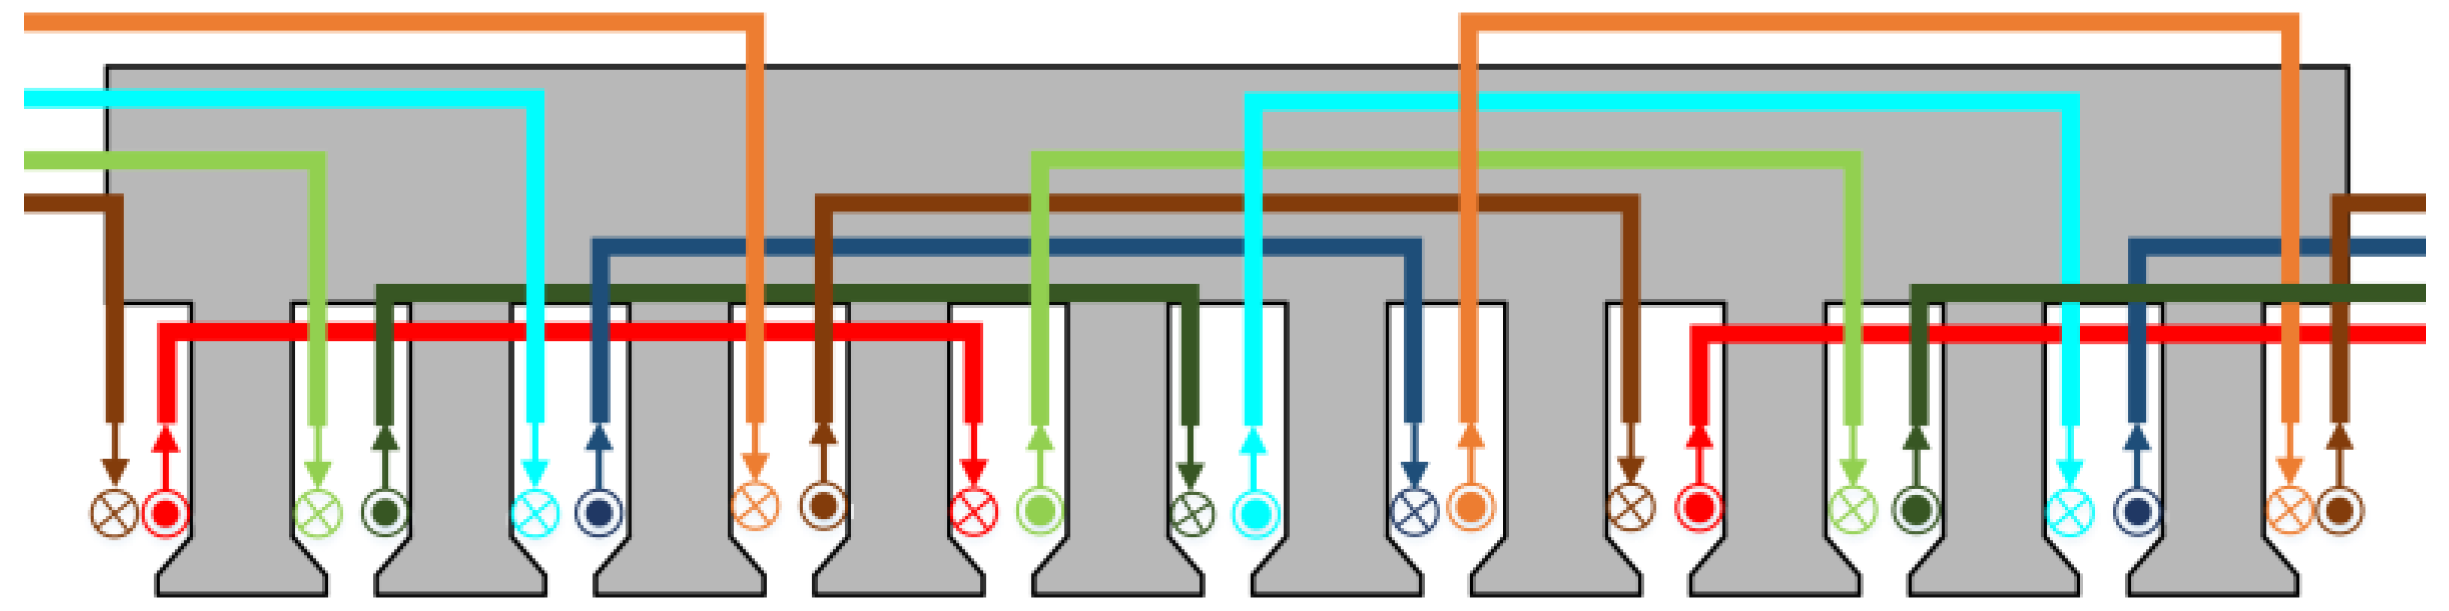
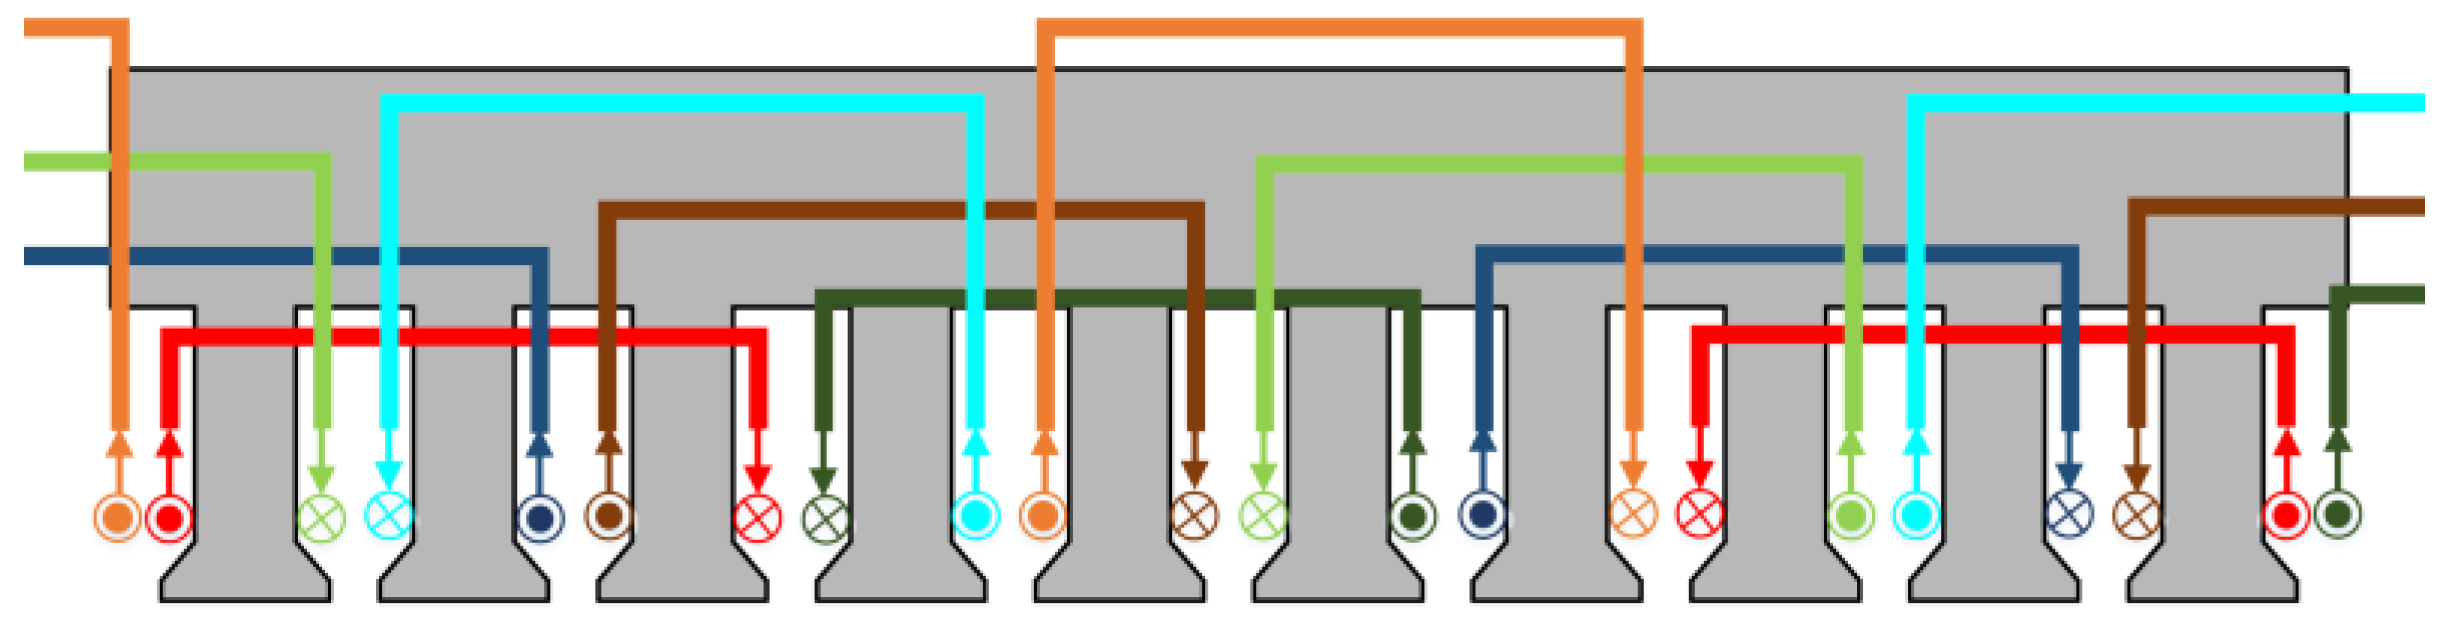
3.2. Winding Pattern

According to the value of q in Table 2, four concentrated winding patterns and selected Ns values as shown in Figure 2, Figure 3, Figure 4 and Figure 5 are considered. The corresponding winding factor and winding harmonics of each q are presented in Figure 6 and Figure 7, respectively.

3.3. Variables and Objective Function

The objective function of this study is to enhance torque performance of the machine for electric vehicle application. Accordingly, the following development processes are considered to be investigated using 2D Finite Element Analysis (FEA). The initial design parameters are presented in Table 2, and the variables considered for sensitivity analysis of the candidate model are illustrated in Figure 8.
Initial Configurations
Objective Function:
minimum torque pulsation, satisfying torque density and Back-EMF: determination through q selection
Constraints:
initial design parameters in Table 2.
Candidate Model
Objective Function:
minimize torque pulsation and maximize torque: for determination of the best-performing model through FE sensitivity analysis
Constraints:
WPM = 4 mm, LSSD = 25 mm, WST = 5 mm, TCog ≤ 1 Nm, TRipple < 5%, Tavg ≥ 80 Nm
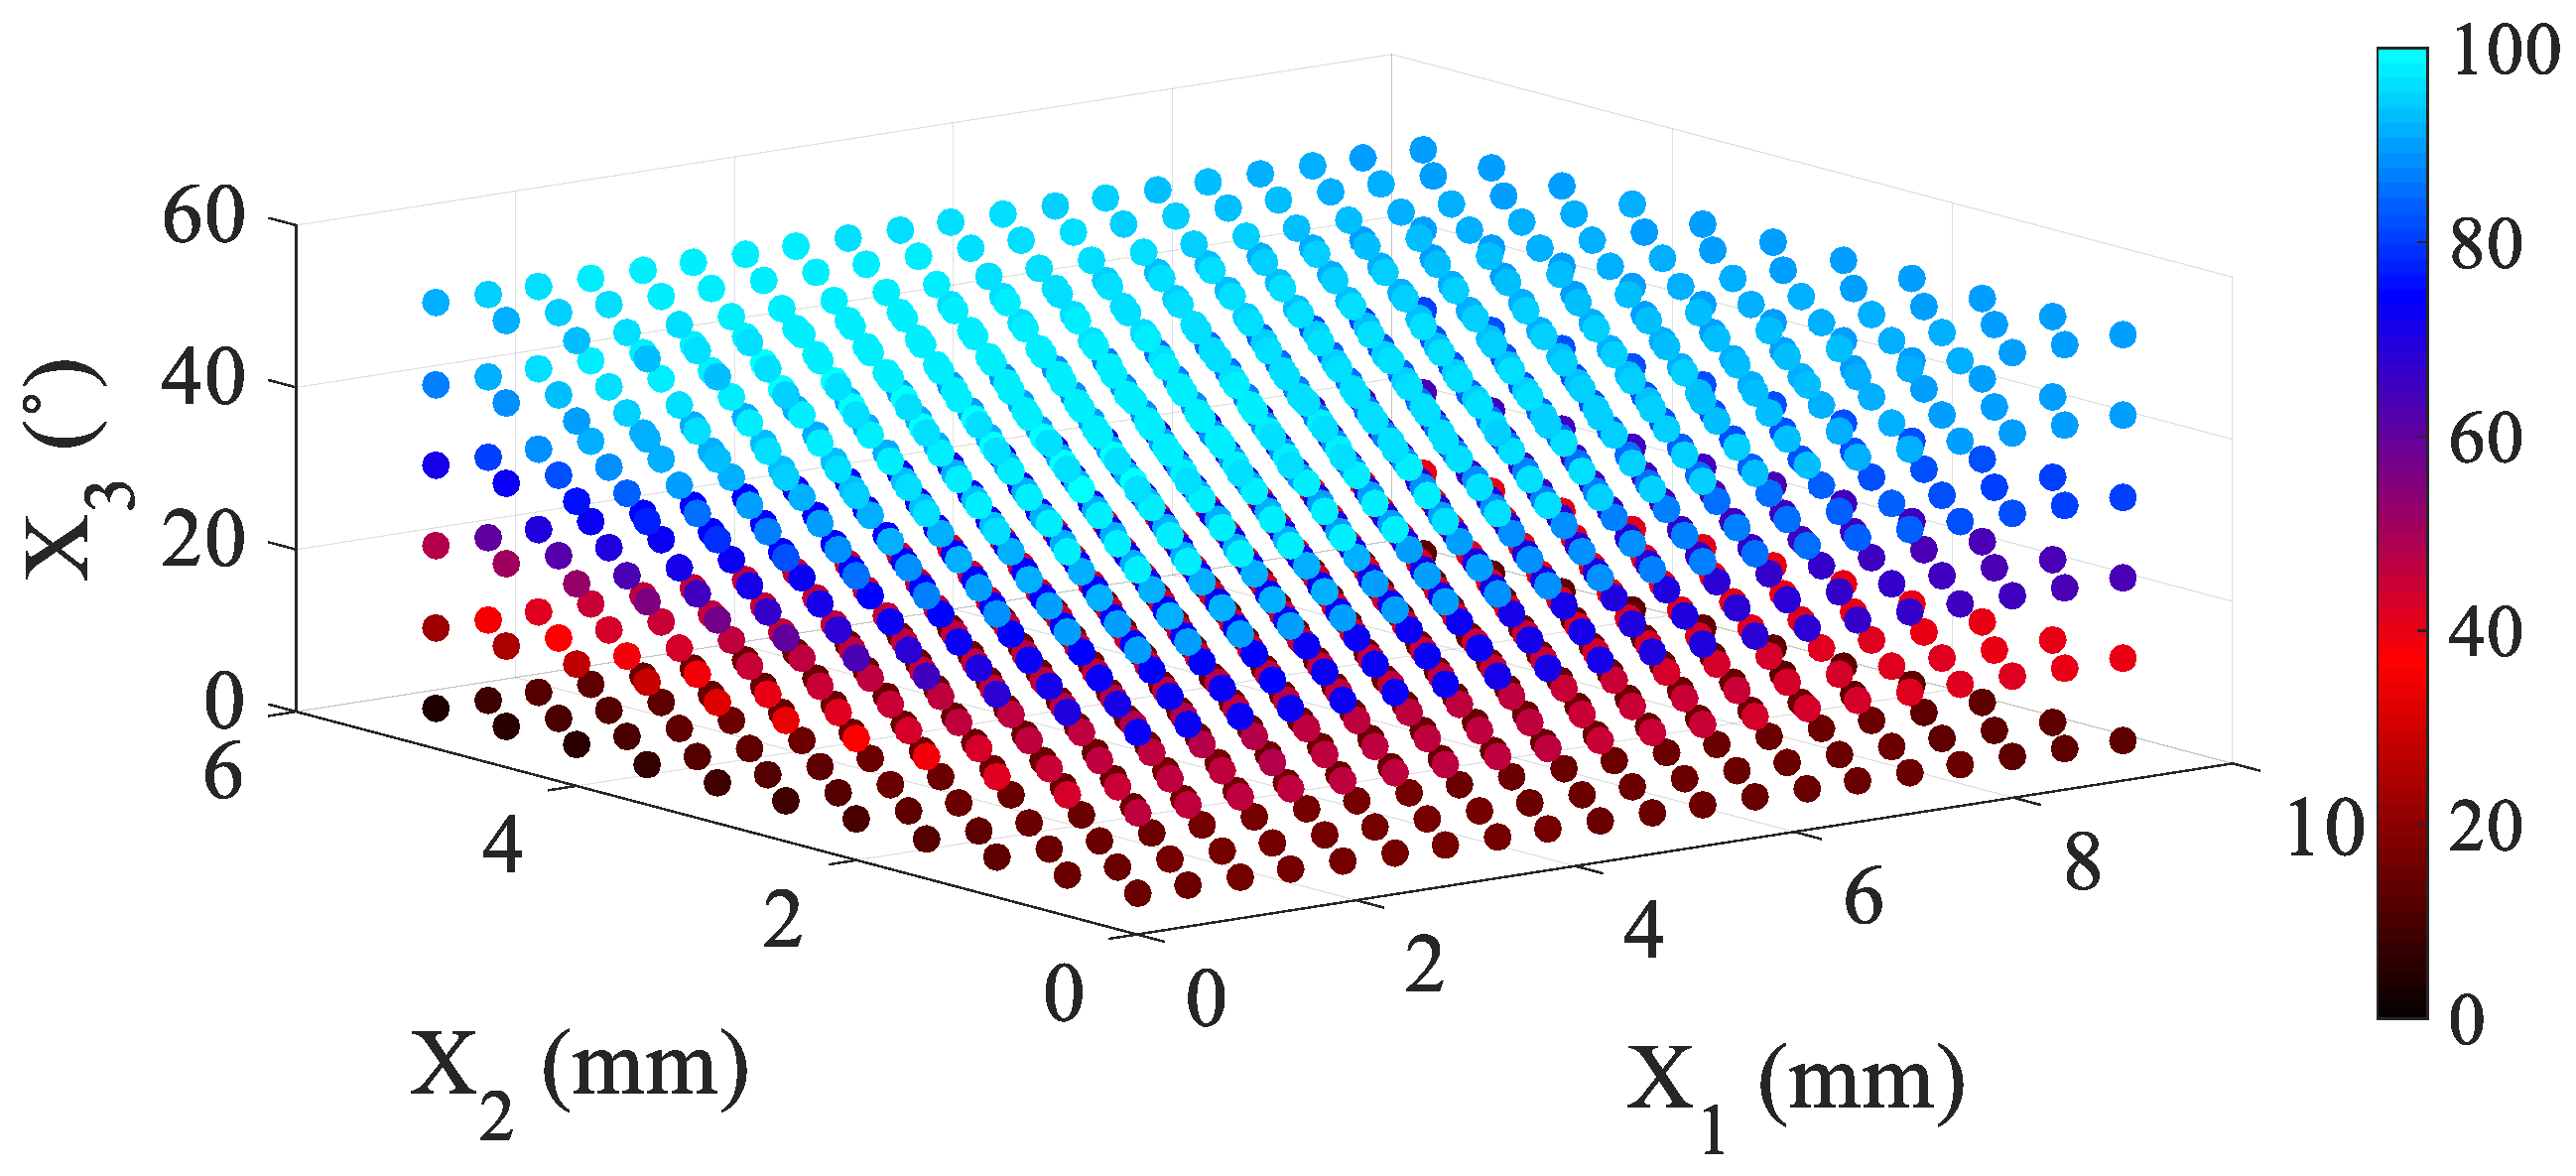
PM Dimension and slot entrance design variables:
0 mm ≤ X1 ≤ 9 mm, 0 mm ≤ X2 ≤ 5 mm, 5° ≤ X3 ≤ 55°

4. E-Magnetic Results

By applying 2D FEA to the proposed structures, the following results have been achieved, so that in Section 4.1, initial models are investigated in order to select the candidate model, which provides a satisfying and desirable amount of torque and Back-EMF amplitude. Then the resultant candidate model is sensitively analyzed with constraints mentioned for X1, X2, and X3, with results illustrated in Section 4.2. Optimized models, providing highest Tavg, lowest TCog and TRipple are introduced in Section 4.3, where comparative results are reported. In Section 4.4 efficiency and power factor maps of the best-optimized model are reported. Finally, Section 4.5 displays results of Drive-Cycle torque graph for In-Wheel application of an E-Motorcycle, adopting the best-performing model.

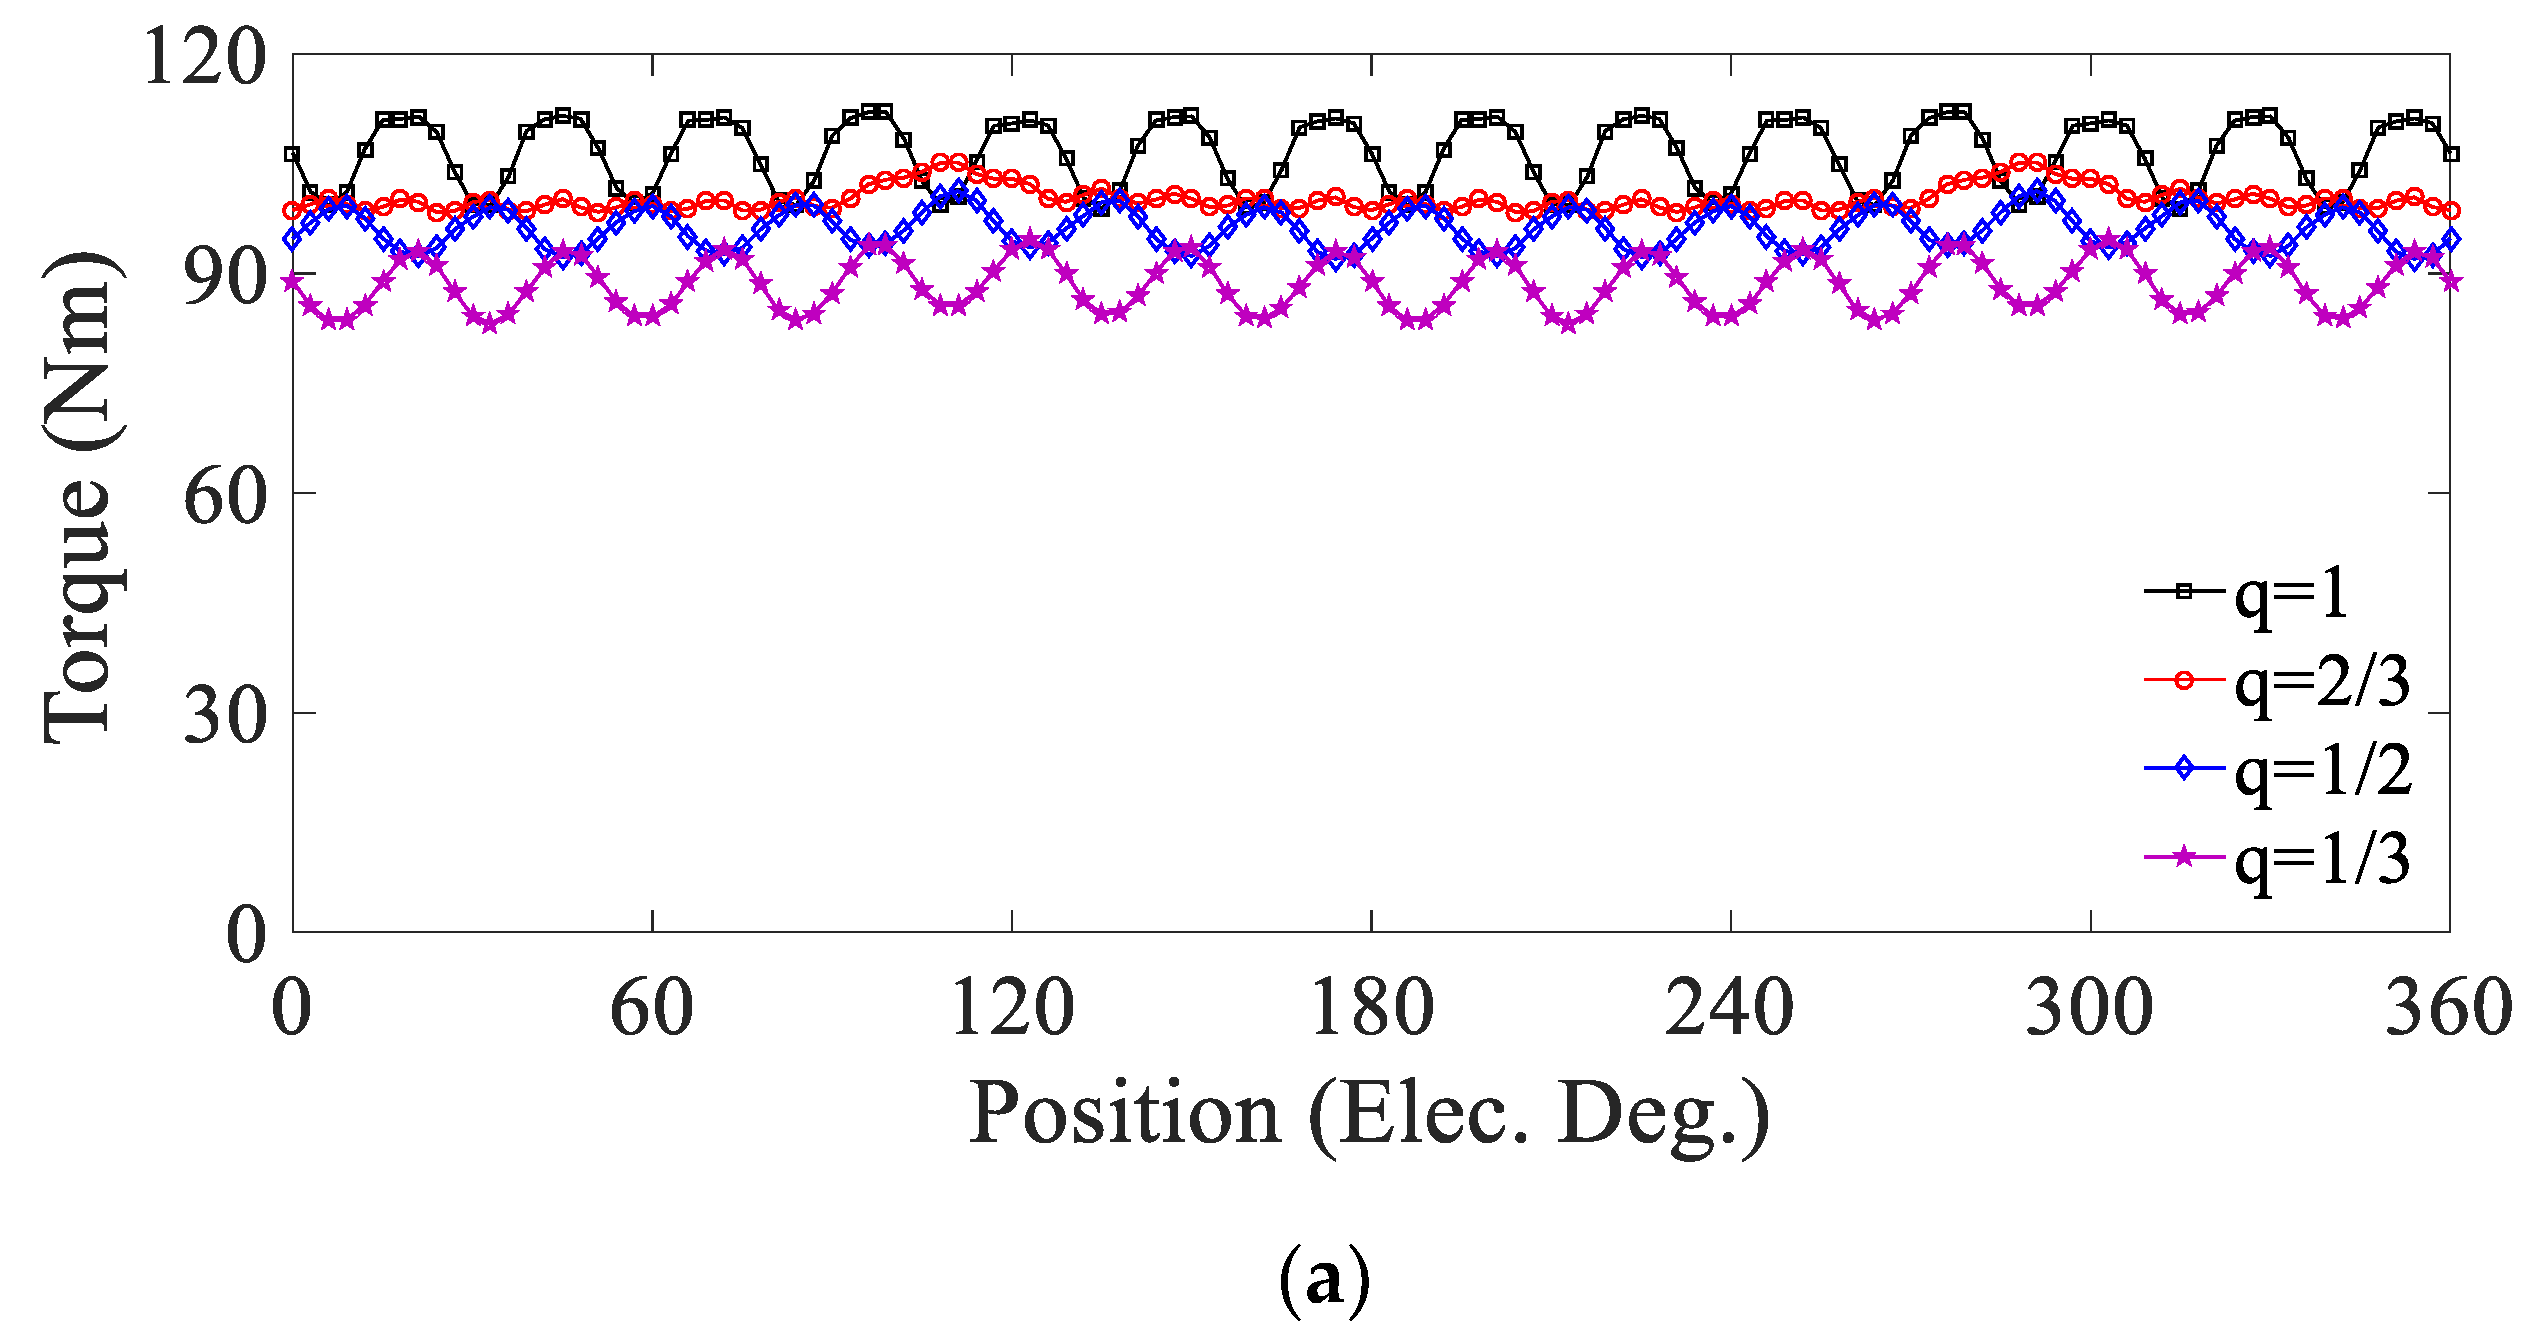
4.1. Analysis of the Initial Models

Figure 9, Figure 10, Figure 11 and Figure 12 demonstrate the analysis results of the average torque, cogging torque, torque ripple, and back-EMF for the initial configurations, respectively.
As shown in Figure 9a, the greater the value of q, the more average torque is produced by the proposed 7-P SPMSM. As a result, according to torque FFT analysis shown in Figure 9b, the amplitude of the fundamental harmonic increases as q grows.
Based on TCog results, illustrated in Figure 10, the cogging torque does not follow the same path the average torque did, thus, the growing value of q does not directly affect TCog. This means, for q = ⅓ and ⅔, the peak-to-peak cogging torque is approximately 50% less than q = 1 and ½, respectively, where q = ⅔ presents the lowest TCog (less than 2 Nm).
On the contrary, TRipple is reduced for q ≤ ⅔, reaching from 13% in q = ⅓ to 7% in q = ⅔; however, it is suddenly doubled in q = 1 (Figure 11).
The one-phase back-EMF and the corresponding FFT analysis results of the proposed models are presented in Figure 12a,b, respectively. Accordingly, the peak value of the phase back-EMF increased along with the increasing value of q, from 50 V to 70 V for q = ⅓ to q = 1, respectively. The amplitude of harmonics for q = ⅔ continuously decreased to about zero for n ≥ 7th harmonic, whereas other q values suffer from n > 7 harmonic orders. Thus, the phase back-EMF, produced by the q = ⅔ model, presents fewer fluctuations with desirable peak values.
Based on results discussed and demonstrated in Figure 9, Figure 10, Figure 11 and Figure 12, the proposed 28/6 initial model with q = ⅔ provides a satisfying average torque value of 95 Nm, TCog less than 2 Nm, 7% of TRipple and 67 V of phase back-EMF, and is selected as the candidate model. Hence, in order to achieve the goal of this study, reduction of torque pulsation, a sensitivity analysis is performed considering the variables shown in Figure 8. The flux density distribution of the initial models is illustrated in Appendix A.

4.2. Sensitivity Analysis of the Candidate Model

As depicted in Figure 8, the analysis variables, namely X1, X2, and X3, are sensitively analyzed for the candidate model from Section 4.1, considering the constraints in the objective function. Torque, cogging torque, and torque ripple results of this sensitivity analysis are illustrated in Figure 13, Figure 14 and Figure 15. As depicted in Figure 13, decreasing value of X1 and X2 along with an increase in X3 value increases Tavg, so that Tavg-Max produced equals 96.2 Nm for X1 = 2.5 mm, X2 = 3.5 mm, and X3 = 45°. TCog results are illustrated in Figure 14, where X1 and X2 should move in opposite directions in order to provide lower cogging torque. For X3, TCog fluctuates in the way that the lowest TCog produced is 0.018 Nm as X1 = 0 mm, X2 = 5 mm and X3 = 5°. Lower TRipple is presented by increasing values of X2 and X3, where X1 causes fluctuations in torque ripple. However, TRipple-Min is provided by values of X1 = 0 mm, X2 = 4.5 mm and X3 = 45°, which equal to 1.7%. Based on the results shown in Figure 13, Figure 14 and Figure 15, and resultant values for X1 to X3, the best-performing models are categorized. They are those which provide maximum average torque (Model-I), minimum cogging torque (Model-II), and minimum torque ripple (Model-III), respectively. Corresponding results for the optimized models are reported in Table 3.

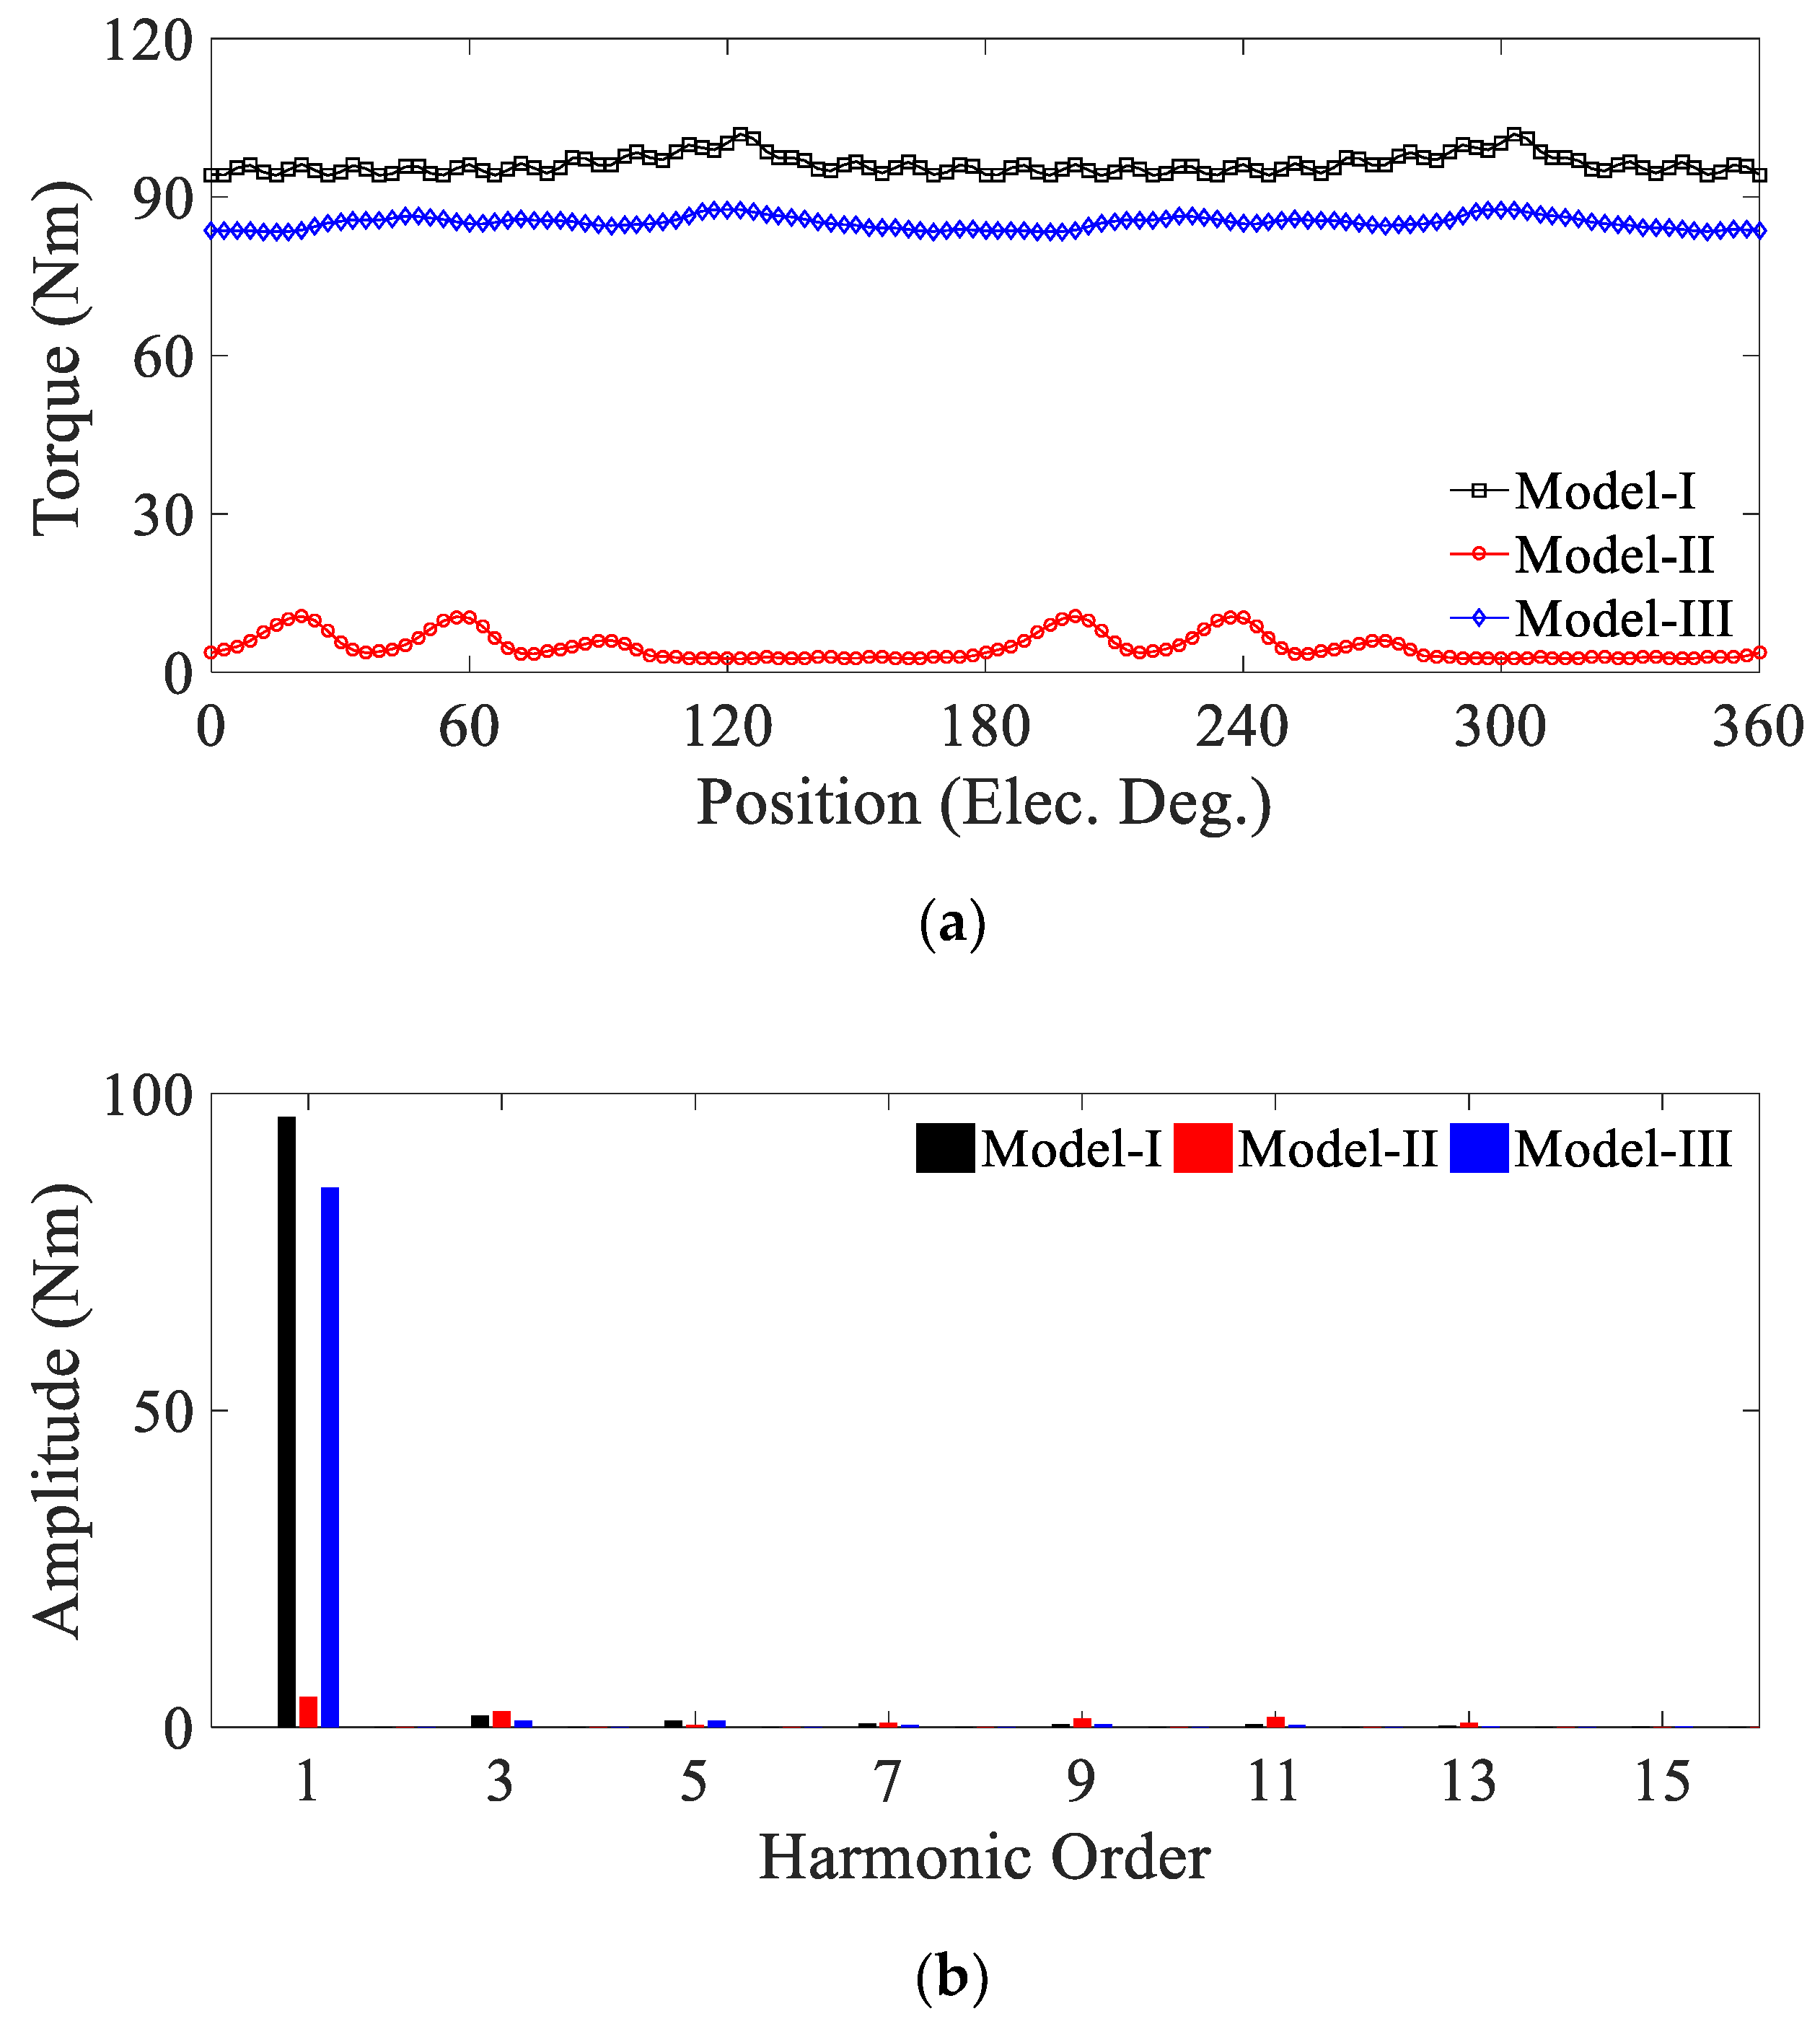
4.3. Analysis of the Optimized Models

With regard to the goal of this paper, a comparative study is performed for the models designed by means of X values in Table 3, and the results are presented in Figure 16, Figure 17, Figure 18 and Figure 19.
It can be obtained from Figure 16a,b that the Model-II presents poor torque density. However, it produced TCog close to zero which is desirable. The Model-I provides the highest electromagnetic torque, whereas it suffers from high fluctuations in comparison with the Model-III, visiting the objective function constraints (Tavg ≥ 80 Nm) with low pulsations.
Accordingly, TCog and TRipple are depicted in Figure 17 and Figure 18 respectively, where the Model-III produced significantly low pulsations in comparison with other models and the initial q = ⅔ configuration, as desired in the objective function (TCog ≤ 1 Nm and TRipple ≤ 5%). Meanwhile, Model-I and –II present the highest TCog and TRipple, respectively.
Figure 19a,b demonstrates the phase back-EMF and corresponding FFT analysis of the proposed models in Table 3. It can be determined that in comparison with the candidate model, the amplitude of phase back-EMF harmonics in the Model-I to -III faced a noticeable reduction. Although the phase back-EMF amplitude is low in the Model-II and -I, containing higher harmonics amplitude and even suffers from 9th harmonic order, the Model-III produces an acceptable peak-to-peak phase back-EMF value of 67.2 V with lower amplitude harmonic orders, damped for n ≥ 5th harmonic.
Thus, the proposed Model-III provides the best performance and meets the established constraints, producing 85.1 Nm of torque with low pulsation, as TCog = 0.26 Nm and TRipple = 1.7%. Flux density distribution of the optimized models are shown in Appendix A.

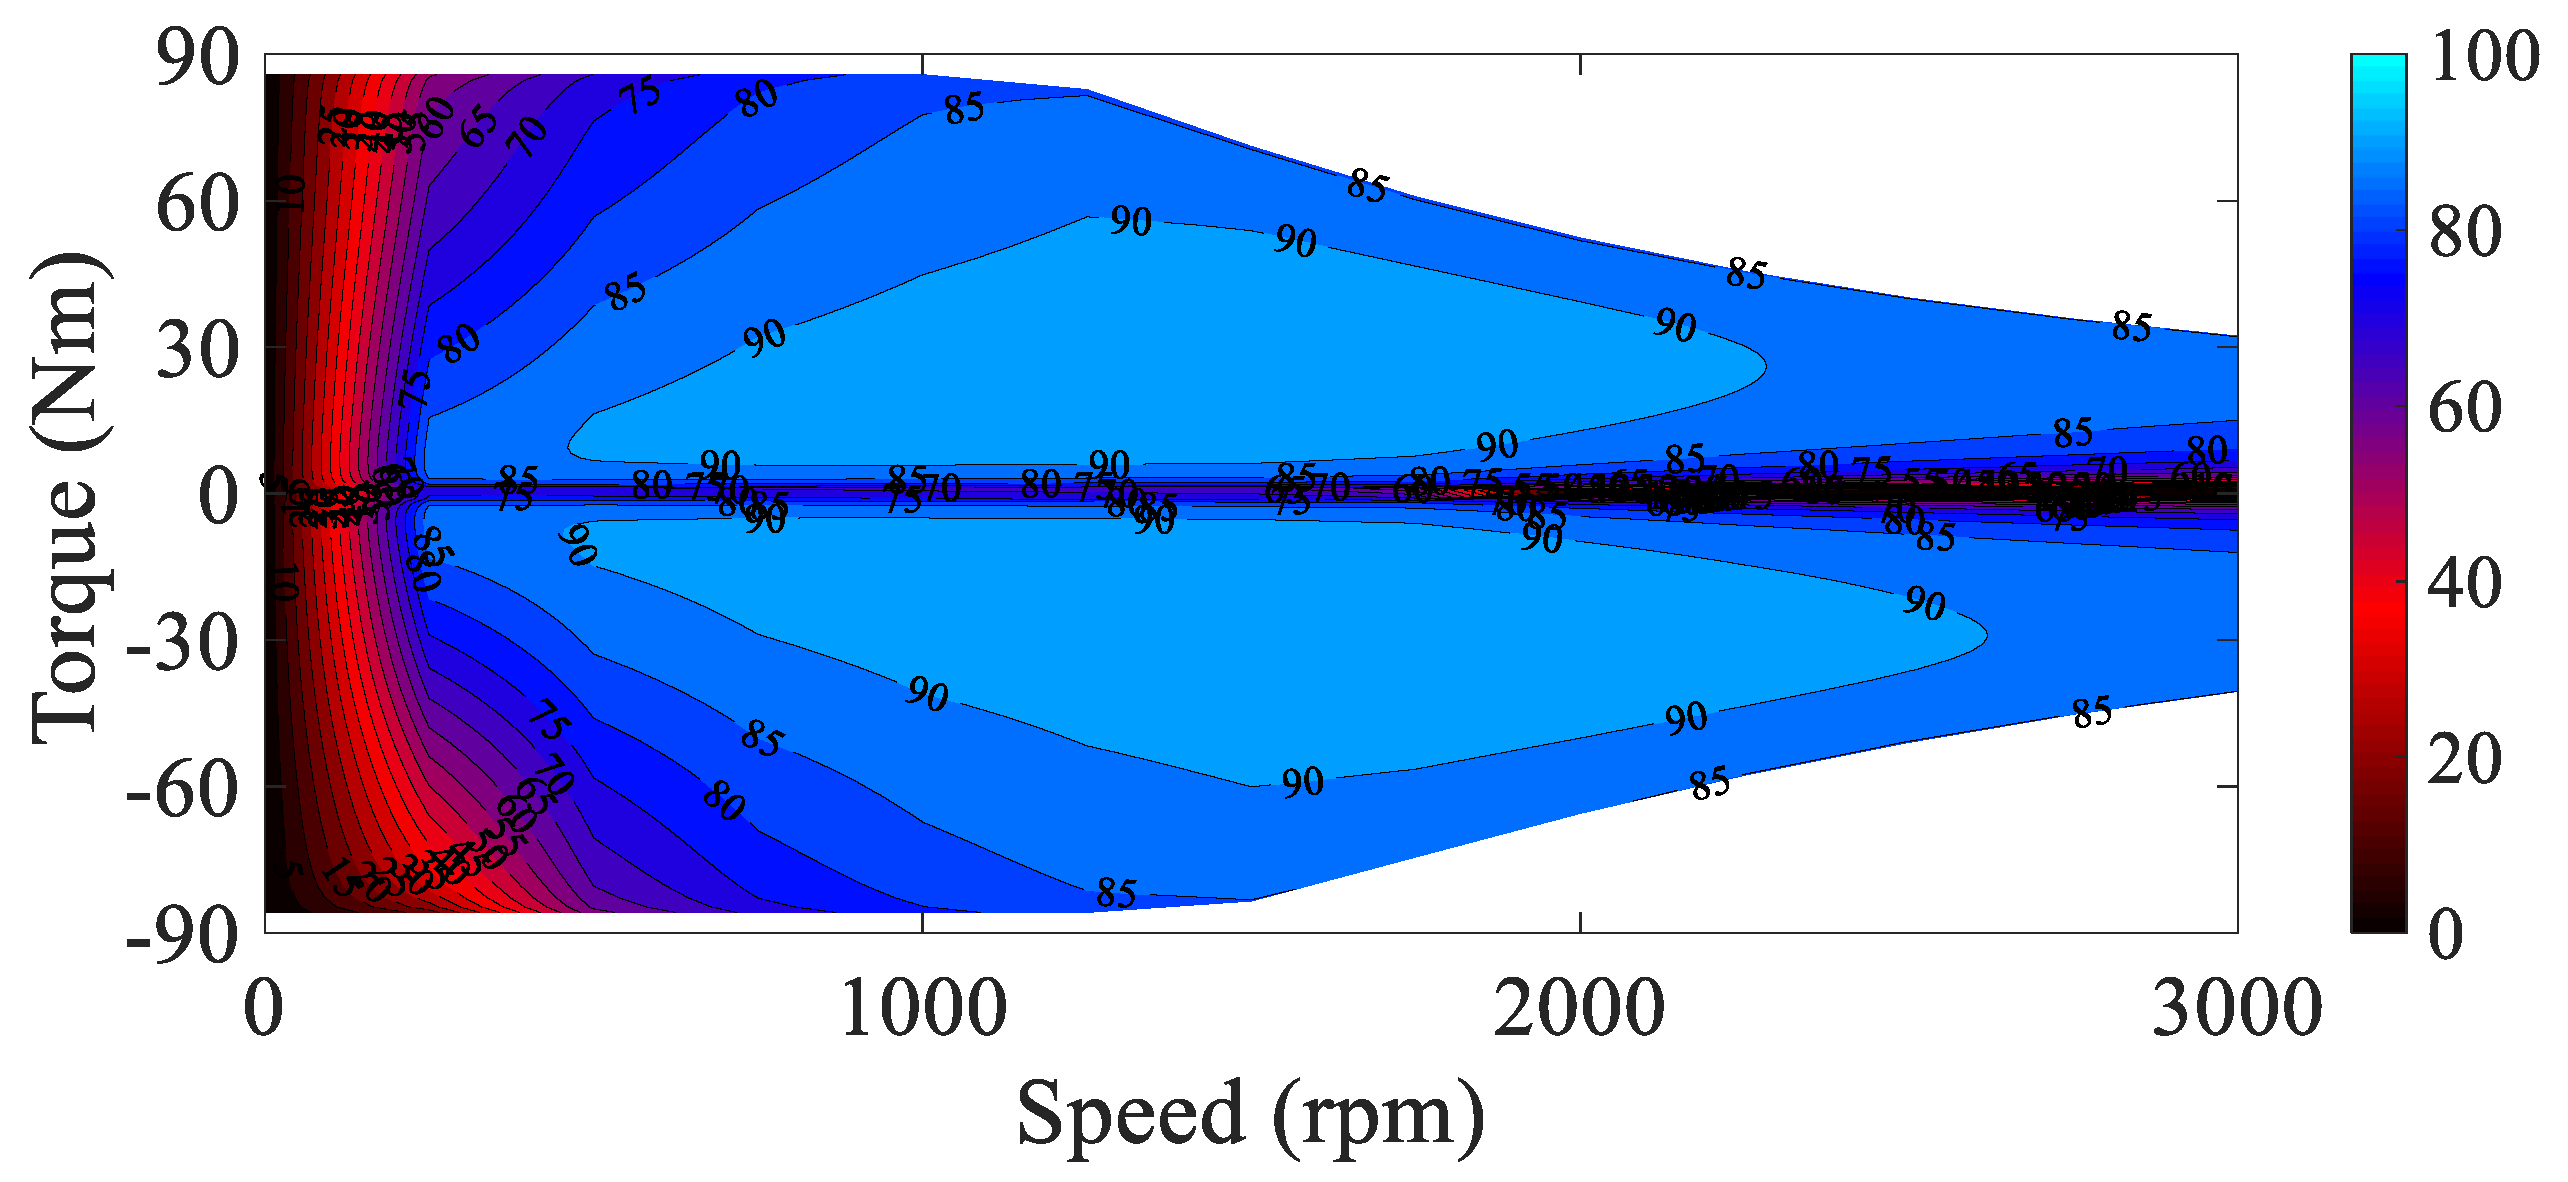
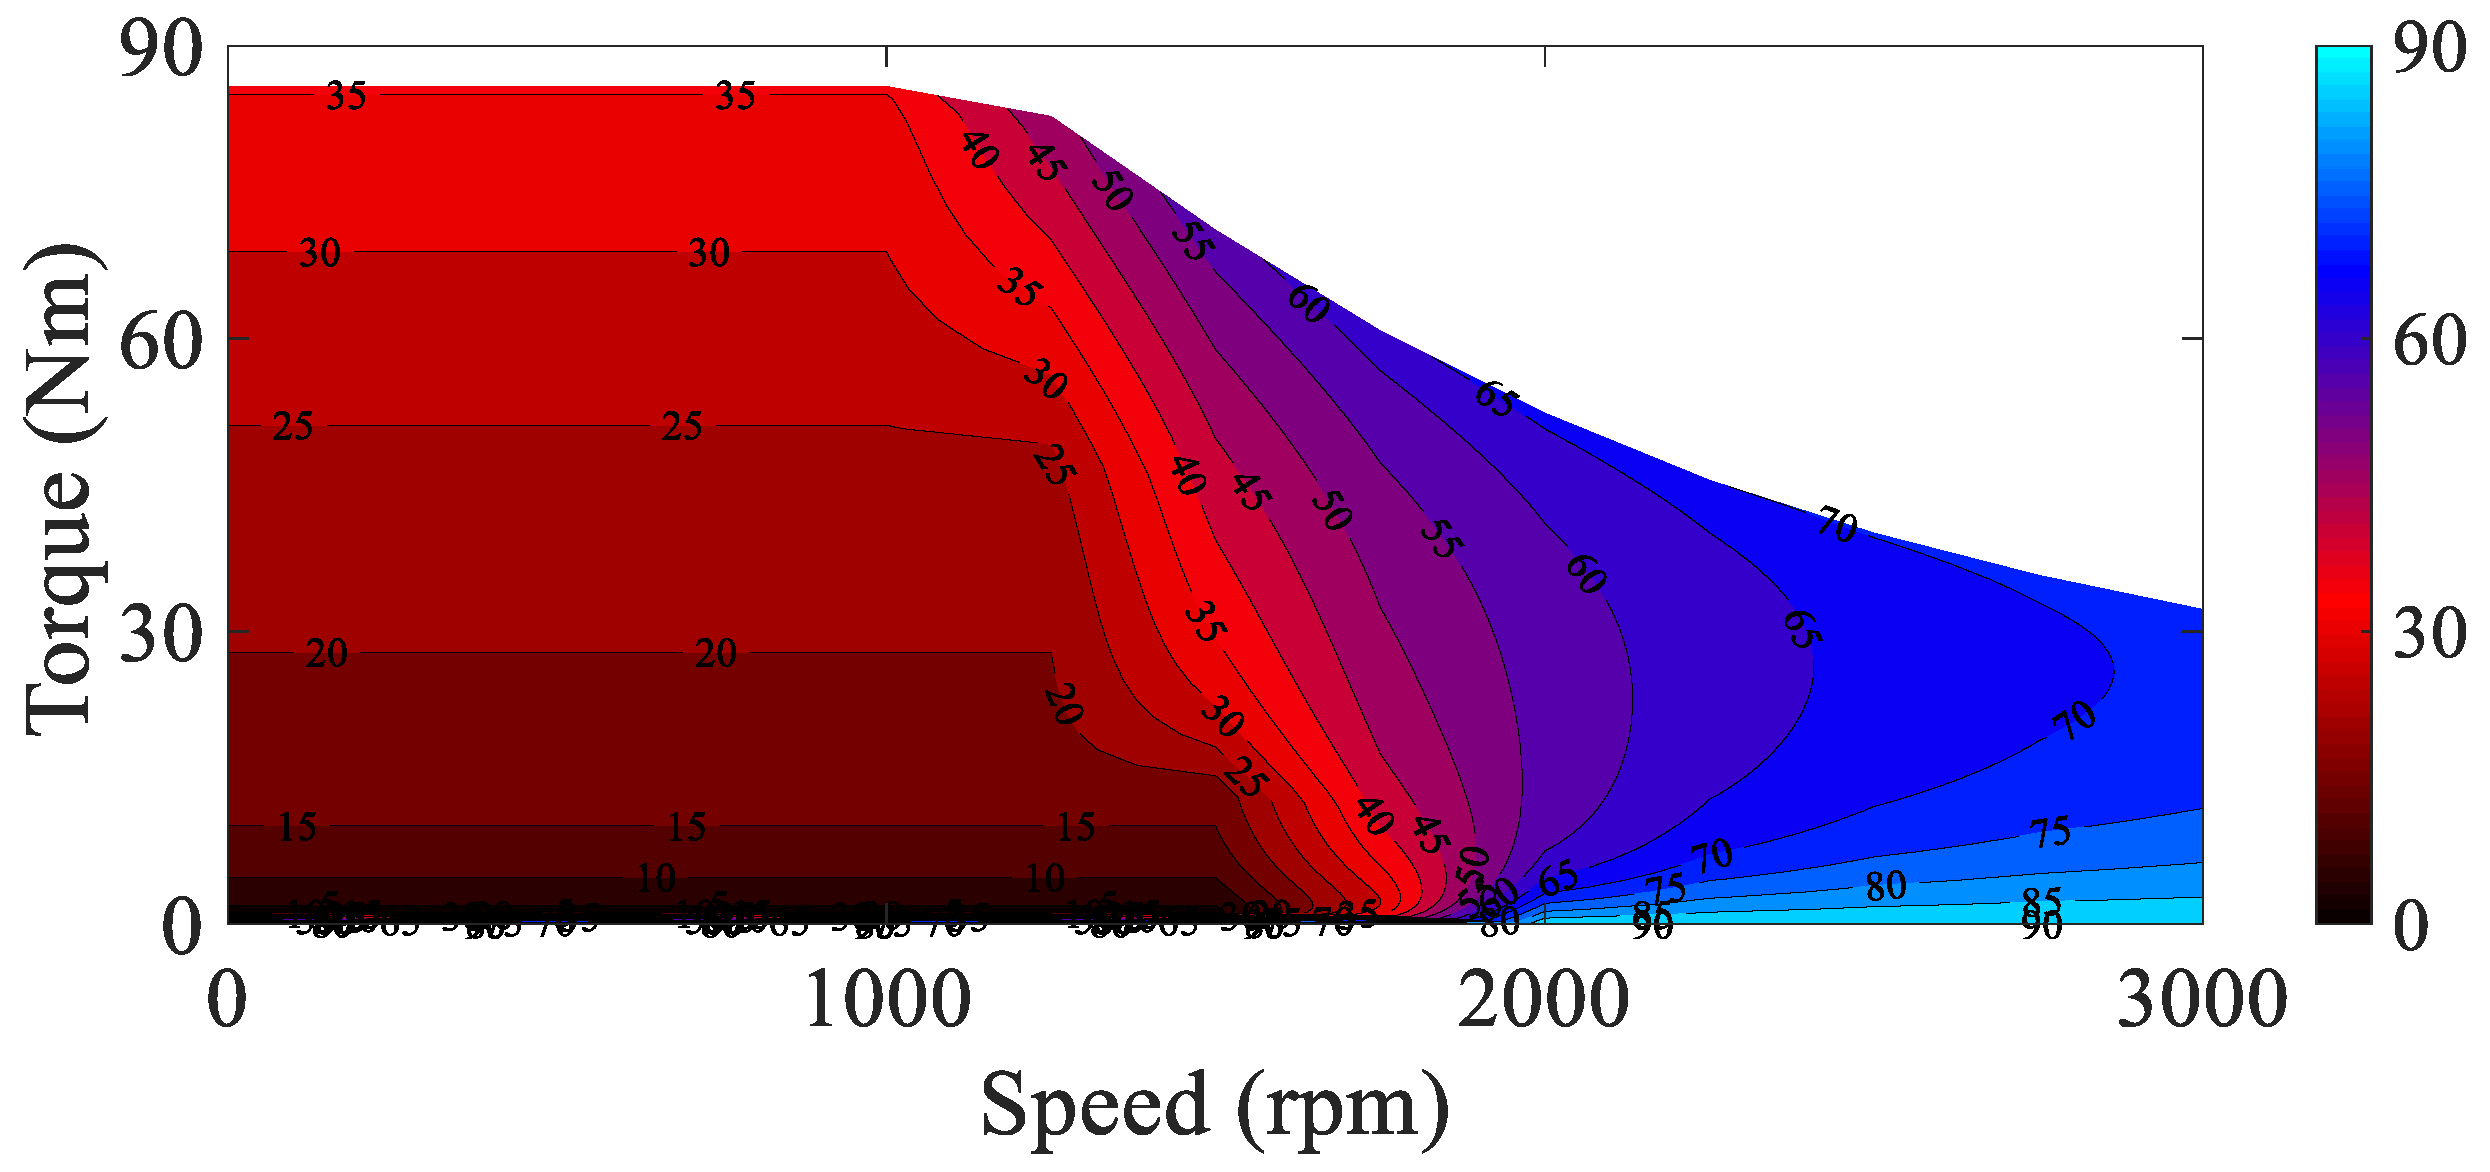
4.4. Efficiency and Power Factor Map

As shown in Figure 20 in terms of the efficiency map of the Model-III, considering Motoring (M) and Generating (G) modes of operation, constant torque region is provided with up to 1500 rpm of speed and with 85 Nm of torque. When in generating mode, a wider region of high efficiency is determined. Hence, constant torque above 80 Nm with an efficiency value of 80% is achievable when speed ≥ 900 rpm in M operation and speed ≥ 1100 rpm in G mode. However, efficiency ≥ 90% is provided for 500 ≤ speed ≤ 2200 and 500 ≤ speed ≤ 2500 rpm in M and G mode respectively, producing at most 60 Nm of average torque.
Based on the Model-III power factor (PF) map illustrated in Figure 21, a higher power factor (above 0.7) is determined for P ≥ 5 kW. As shown in Figure 21, for both M and G modes of operation, unlike the constant torque region, PF is increasing along with an increase in P for the constant power region. Conversely, in the constant torque region it declines from 0.99 to 0.7 and 0.5 in M and G mode, respectively, while in the constant power region it reaches from 0.15 to above 0.8 for both M and G operational modes.
Figure 22 demonstrates the corresponding phase advance (PA) analysis results for the M mode of the Model-III. Accordingly, for 0° ≤ PA ≤ 35° a constant torque region is provided, where speed ≤ 1500 rpm and TAvg ≤ 85 Nm. The constant power region is achieved for 35° ≤ PA ≤ 90° for speed values above 1500 rpm, providing average torque below 80 Nm.
Overall, based on the results reported, not only has the 3rd Model designed based on the optimization processes met the constraints mentioned in the objective function, but it also presents desirable torque, power, PF, and efficiency performance. These factors make Model-III the best-performed model to be adapted for an E-Motorcycle application.

4.5. Artemis Drive-Cycle Analysis

Measuring vehicle speed over time as data series in form of drive cycles (DCs) are created theoretically or based on real-world driving records. Due to developments of EV industries, DCs are mainly utilized in order to test fuel consumption and CO2 emissions of a vehicle, and recently have begun being used to size electrical powertrain components [11].
The sizing of the powertrain is heavily dependent on vehicular and conditional parameters such as (Figure 23) [11]:
Air resistance, which is defined as Fair in Figure 23, representing the main force to overcome when driving on a flat road. Fair is proportional to air density (ρ), the square form of vehicle’s velocity (υ2), a drag coefficient (Cd) and frontal cross-sectional area of the vehicle (A):
F a i r = 1 2 ρ A C d υ 2
Rolling resistance, defined as Froll, occurs due to interaction between the surface of tires and road surface. Froll is proportional to vehicle mass (m), gravity acceleration (g), road gradient (α), and a rolling coefficient (Cr):
F r o l l = C r m g cos α
Grading force, Fgrade, is the force required for up/downhill movement. Fgrade can be either be positive or negative, thus it can be considered as resistive or supportive force and it can be determined by multiplication of m, g, and sin(α):
F g r a d e = m g sin α
Acceleration force, FAcc is a major parameter in electrical machine sizing and has a significant contribution in total traction force, calculating by-product of m and derived velocity over time (/dt).
F A c c = m d υ d t
Traction force, Ftrac, is the summation of the above forces in which the desired torque of the machine has a direct relation with the total traction force.
F t r a c = F A c c + F r o l l + F g r a d e + F a i r
A complete drive cycle study based on the Volvo XC90 and S60 cars can be found in [11] using a real-world database and dynamic model of the proposed cars.
Assessment and Reliability of Transport Emission Models and Inventory Systems (Artemis) is a European standard project based on a large database of European real-world driving patterns [30]. In this study, standardized Artemis DC is utilized consisting of three driving conditions:
-
Urban Cycle: 991 s of operation with an average speed of 17.7 km/h, displacement value of 4.9 km, and Max. speed of 57.3 km/h
-
Rural Road Cycle: 17.3 km rural road trip in 1080 s with an average speed equal to 57.5 km/h reaching its Max. at 111.1 km/h.
-
Motor Way130 Cycle: 96.9 km/h average speed (Max. 131.4 km/h) in 1066 s for 28.75 km motorway trip.
The corresponding drive-cycle speed is illustrated in Figure 24a. For an E-Motorcycle concept design shown in Figure 23 with properties listed in Table 4, and by applying the Artemis DCs to the Model-III of this study, DC torque and DC operational data points are demonstrated in Figure 24b,c. Table 5 reports the drive cycle analysis results of each Artemis cycle applied to the Model-III.
Overall, according to Table 5, for E-Motorcycle application the studied Model-III operates efficiently with high values of torque/power density and power factor in different conditions of driving.

5. Conclusions

The goal of this paper is to investigate outer-rotor surface-mounted permanent magnet synchronous machines (OR-SPMSM) for E-Motorcycle application capable of low torque fluctuations and high torque–power density. Four winding patterns (q = 1, ⅔, ½, ⅓) are proposed and applied to the OR-SPMSM. Results are comparably reported and demonstrated that OR-SPMSM with q = ⅔ presents the best performance in terms of low torque pulsation. In order to investigate the advantages of this configuration and reaching enhanced design, a parameter optimization process is considered with three design parameters involved, resulting in three optimized models, producing Tavg-Max (Model-I), TCog-Min (Model-II), and Tripple-Min (Model-III). The results referencing each model are reported, where the Model-III provides the best performance in meeting the objective function constraints with low torque fluctuations. The Artemis Drive Cycles are applied to the Model-III in order to simulate the performance of the proposed machine for urban, road, and motorway applications of an E-Motorcycle. Accordingly, due to high torque density with low torque pulsations and efficient operation under high values of power factor, the Model-III presents the best performance and can be considered as a vital alternative for In-Wheel Light-Weight EV applications.

Author Contributions

Conceptualization, H.G. and M.M.; software, H.G. and M.M.; validation, M.M., and M.B.; writing—original draft preparation, H.G.; writing—review and editing, M.M. and M.B.; supervision, M.M. and M.B.; All authors have read and agreed to the published version of the manuscript.

Funding

This research received no external funding.

Conflicts of Interest

The authors declare no conflict of interest.

Appendix A

Figure A1. Flux density distribution in the initial models: (a) 42/6 and q = 1, (b) 28/6 and q = ⅔, (c) 21/6 and q = ½, (d) 14/6 and q = ⅓.
Electronics 11 03192 g0a1
Figure A2. Flux density distribution in the optimized models: (a) Model-I, (b) Model-II, (c) Model-III.
Electronics 11 03192 g0a2

References

  1. Zeraoulia, M.; Benbouzid, M.; Diallo, D. Electric Motor Drive Selection Issues for HEV Propulsion Systems: A Comparative Study. IEEE Trans. Veh. Technol. 2006, 55, 1756–1764. [Google Scholar] [CrossRef] [Green Version]
  2. Li, X.; Xue, Z.; Zhang, L.; Hua, W. A low-complexity three-vector-based model predictive torque control for SPMSM. IEEE Trans. Power Electron. 2021, 36, 13002–13012. [Google Scholar] [CrossRef]
  3. Marmaras, C.; Xydas, E.; Cipcigan, L. Simulation of electric vehicle driver behaviour in road transport and electric power networks. Transp. Res. Part C Emerg. Technol. 2017, 80, 239–256. [Google Scholar] [CrossRef]
  4. Ghorbani, H.R.; Moradian, M.R. Torque Pulsation Reduction in five-phase PMSyncRMs. J. Power Electron. 2021, 22, 128–137. [Google Scholar] [CrossRef]
  5. Moradian, M.R.; Soltani, J.; Najjar-Khodabakhsh, A.; Arab Markadeh, G.R. Adaptive Torque and Flux Control of Sensorless IPMSM Drive in the Stator Flux Field Oriented Reference Frame. IEEE Trans. Ind. Inform. 2019, 15, 205–212. [Google Scholar] [CrossRef]
  6. Jing, L.; Pan, Y.; Wang, T.; Qu, R.; Cheng, P.-T. Transient Analysis and Verification of a Magnetic Gear Integrated Permanent Magnet Brushless Machine with Halbach Arrays. IEEE J. Emerg. Sel. Top. Power Electron. 2022, 10, 1881–1890. [Google Scholar] [CrossRef]
  7. Jing, L.; Tang, W.; Wang, T.; Ben, T.; Qu, R. Performance Analysis of Magnetically Geared Permanent Magnet Brushless Motor for Hybrid Electric Vehicles. IEEE Trans. Transp. Electrif. 2022, 8, 2874–2883. [Google Scholar] [CrossRef]
  8. Wu, D.; Fei, W.; Luk, P.C.K.; Xia, B. Design considerations of outer-rotor permanent magnet synchronous machines for in-wheel electric vehicle applications using particle swarm optimization. In Proceedings of the 7th International Conference on Power Electronics, Machines and Drives (PEMD), Manchester, UK, 8–10 April 2014. [Google Scholar] [CrossRef]
  9. Gundogdu, T.; Zhu, Z.-Q.; Mipo, J.-C. Analysis of coil pitch in induction machines for electric vehicle applications. IET Electr. Power Appl. 2020, 14, 2525–2536. [Google Scholar] [CrossRef]
  10. Tumbek, M.; Kesler, S. Design and implementation of a low power outer-rotor line-start permanent magnet synchronous motor for ultra-light electric vehicles. Energies 2019, 12, 3174. [Google Scholar] [CrossRef]
  11. Raghuraman, B.; Gyllensten, T. Electric Machine Design Based on Drive Cycle Analysis. Master’s Thesis, Chalmers University of Technology, Gothenburg, Sweden, 2019. [Google Scholar]
  12. Ahn, J.-M.; Son, J.-C.; Lim, D.-K. Optimal design of outer-rotor surface mounted permanent magnet synchronous motor for cogging torque reduction using territory particle swarm optimization. J. Electr. Eng. Technol. 2021, 16, 429–436. [Google Scholar] [CrossRef]
  13. Fang, S.; Liu, H.; Wang, H.; Yang, H.; Lin, H. High power density PMSM with lightweight structure and high-performance soft magnetic alloy core. IEEE Trans. Appl. Supercond. 2019, 29, 0602805. [Google Scholar] [CrossRef]
  14. Ghorbani, H.R.; Majidi, B. Power Density Optimization Through Optimal Selection of PM properties in a PM-SyncRM Using FEM Analysis. In Proceedings of the 10th Annual International Power Electronics, Drive Systems and Technologies Conference (PEDSTC), Shiraz University, Shiraz, Fars, Iran, 12–14 February 2019. [Google Scholar] [CrossRef]
  15. Lee, T.-Y.; Seo, M.-K.; Kim, Y.-J.; Jung, S.-Y. Motor design and characteristics comparison of outer-rotor type BLDC motor and BLAC motor based on numerical analysis. IEEE Trans. ASupercond. 2016, 26, 5205506. [Google Scholar] [CrossRef]
  16. Zhao, J.; Zhao, S.; Yin, H.; Yang, X.; Cao, J.; Zeng, G. Design and optimization of an outer-rotor SPMSM with permanent magnets of revers step shape. In Proceedings of the 22nd International Conference on Electrical Machines and Systems (ICEMS), Harbin, China, 11–14 August 2019. [Google Scholar] [CrossRef]
  17. He, C.; Wu, T. Analysis and design of surface permanent magnet synchronous motor and generator. CES Trans. Electr. Mach. Sys. 2019, 3, 94–100. [Google Scholar] [CrossRef]
  18. Bonthu, S.S.R.; Tarek, M.T.; Choi, S. Optimal torque ripple reduction technique for outer rotor permanent magnet synchronous reluctance motors. IEEE Trans. Energy Convers. 2018, 33, 1184–1192. [Google Scholar] [CrossRef]
  19. Bonthu, S.S.R.; Choi, S.; Baek, J. Comparisons of three-phase and five-phase permanent magnet assisted synchronous reluctance motors. IET Electr. Power Appl. 2016, 10, 347–355. [Google Scholar] [CrossRef]
  20. Toliyat, H.; Waikar, S.P.; Lipo, T.A. Analysis and simulation of five-phase synchronous reluctance machines including third harmonic of airgap MMF. IEEE Trans. Ind. Appl. 1998, 34, 332–339. [Google Scholar] [CrossRef] [Green Version]
  21. Toliyat, H.; Xu, L.; Lipo, T.A. A five phase reluctance motor, with high specific torque. In Proceedings of the Conference Record of the IEEE Industry Applications Society Annual Meeting, Seattle, WA, USA, 7–12 October 1990. [Google Scholar] [CrossRef]
  22. Barrero, F.; Duran, J. Recent advances in the design, modelling and control of multiphase machines-Part 1. IEEE Trans. Ind. Electr. 2016, 63, 449–458. [Google Scholar] [CrossRef]
  23. Scuiller, F. Design of a 7-phase surface-mounted PM machine tooth-concentrated winding. In Proceedings of the XIII International Conference on Electrical Machines (ICEM), Alexandroupoli, Greece, 3–6 September 2018. [Google Scholar] [CrossRef]
  24. Zhang, H.; Zhao, B.; Gong, J.; Zu, Y.; Vu, D.-T.; Nguyen, N.-K.; Semail, E.; Moraes, T.-J. Torque optimization of a seven-phase Bi-harmonic PMSM in healthy and degraded mode. In Proceedings of the 22nd International Conference on Electrical Machines and Systems (ICEMS), Harbin, China, 11–14 August 2019. [Google Scholar] [CrossRef] [Green Version]
  25. Scuiller, F.; Becker, F.; Zahr, H.; Semail, E. Design of a Bi-harmonic 7-phase PM machine with tooth-concentrated winding. IEEE Trans. Energy Conv. 2020, 35, 1567–1576. [Google Scholar] [CrossRef] [Green Version]
  26. Ghorbani, H.; Moradian, M.; Benbouzid, M. On the Optimal Selection of Flux Barrier Reconfiguration for a Five-Phase Permanent Magnet Assisted Synchronous Reluctance Machine for Low-Torque Ripple Application. Electronics 2022, 11, 41. [Google Scholar] [CrossRef]
  27. Wang, J.; Qu, R.; Zhou, L. Dual-rotor multiphase permanent magnet machine with harmonic injection to enhance torque density. IEEE Trans. Appl. Supercond. 2012, 22, 5202204. [Google Scholar] [CrossRef]
  28. Jussila., H.; Salminen, P.; Niemela, M.; Pyrhonen, J. Guidelines for designing concentrated winding fractional slot permanent magnet machines. In Proceedings of the International Conference on Power Engineering, Energy and Electrical Drives, Setubal, Portugal, 12–14 April 2007. [Google Scholar] [CrossRef]
  29. Martinez, D. Design of a Permanent-Magnet Synchronous Machine with Non-Overlapping Concentrated Windings for the Shell Eco Marathon Urban Prototype. Master’s Thesis, Royal Institute of Technology (KTH), Stockholm, Sweden, 2012. [Google Scholar]
  30. Common Artemis Driving Cycles (CADC)-Emission Test Cycles. Available online: https://dieselnet.com/standards/cycles/artemis.php (accessed on 1 December 2018).
Figure 1. 3D-View of an OR-SPMSM.
Electronics 11 03192 g001
Figure 2. Winding pattern for Np = 6, Ns = 42 (q = 1).
Electronics 11 03192 g002
Figure 3. Winding pattern for Np = 6, Ns = 28 (q = ⅔).
Electronics 11 03192 g003
Figure 4. Winding pattern for Np = 6, Ns = 21 (q = ½).
Electronics 11 03192 g004
Figure 5. Winding pattern for Np = 6, Ns = 14 (q = ⅓).
Electronics 11 03192 g005
Figure 6. Winding factor.
Electronics 11 03192 g006
Figure 7. Winding harmonics.
Electronics 11 03192 g007
Figure 8. Variables of sensitivity analysis.
Electronics 11 03192 g008
Figure 9. Initial models: (a) Average torque, (b) Torque FFT analysis.
Electronics 11 03192 g009aElectronics 11 03192 g009b
Figure 10. Cogging torque of the initial models.
Electronics 11 03192 g010
Figure 11. Torque ripple of the initial models.
Electronics 11 03192 g011
Figure 12. Initial models: (a) Phase Back-EMF, (b) Back-EMF FFT.
Electronics 11 03192 g012
Figure 13. Tavg (Nm) vs. X1 vs. X2 vs. X3.
Electronics 11 03192 g013
Figure 14. TCog (Nm) vs. X1 vs. X2 vs. X3.
Electronics 11 03192 g014
Figure 15. TRipple (%) vs. X1 vs. X2 vs. X3.
Electronics 11 03192 g015
Figure 16. Optimized models:(a) Average torque, (b) Torque FFT.
Electronics 11 03192 g016
Figure 17. Cogging torque of the optimized models.
Electronics 11 03192 g017
Figure 18. Torque ripple of the optimized models.
Electronics 11 03192 g018
Figure 19. Optimized models: (a) Phase Back-EMF, (b) Back-EMF FFT.
Electronics 11 03192 g019
Figure 20. Efficiency (%) map of the Model-III.
Electronics 11 03192 g020
Figure 21. Power factor map of the Model-III.
Electronics 11 03192 g021
Figure 22. Phase Adv. (°) map of the Model-III.
Electronics 11 03192 g022
Figure 23. Dynamic traction forces of E-Motorcycle (Honda concept).
Electronics 11 03192 g023
Figure 24. The Artemis DC of the Model-III: (a) speed, (b) torque, and (c) operational data points under Artemis DCs.
Electronics 11 03192 g024
Table 1. Concentrated Single- and Double-layer winding Properties [29].
Winding LayersSingleDouble
Fundamental winding factor (kw)highlow
End Windingslongshort
Eddy Currenthighlow
Over-load Torque Capabilityhighlow
Back-EMF Harmonicshighlow
Torque Ripple (TRipple)highlow
Table 2. Initial Design Parameters.
QuantitySym.ValueUnit
Num. Phasesm7---
Rated VoltageVn120V
Rated CurrentIn70A
Rated Speednr1500rpm
Motor LengthLM100mm
Stator Outer DiameterDSO135mm
Stator Slot DepthLSSD25mm
Rotor Outer DiameterDRO165mm
Rotor Back IronDRBI10mm
Axle DiameterDA55mm
Num. Stator SlotsNs42, 28, 21, 14---
Num. Rotor PolesNp6---
Ratios of Ns/mNpq1, ⅔, ½, ⅓---
Air-gap LengthLg1mm
Stator Tooth WidthWST5mm
Stator Slot OpeningLSO2mm
Stator Tooth Tip DepthLTTD1mm
PM LengthLPM50°
PM ThicknessWPM4mm
PM Type---N42SH---
Steel Type---M400-50A---
Table 3. Output Data of the Optimized Models.
ParameterModel-IModel-IIModel-III
X1 (mm)2.500
X2 (mm)354.5
X3 (°)45545
TAvg (Nm)96.24.7385.1
TCog (Nm)8.50.0180.26
TRipple (%)7.88.531.7
Eff. (%)88.522.9486.75
PF0.90.180.82
B-EMF (V)114.78.267.2
Table 4. Drive-Cycle Properties.
Vehicle PropertiesValue
Mass (kg)80
Rolling Resistance Coefficient0.005
Air-Density (kg/m3)1.225
Frontal Area (m2)1.5
Drag Coefficient0.26
Wheel Radius (m)0.3
Mass Correction Factor1.04
Motoring (M) Torque Ratio1
Generating (G) Torque Ratio1
Table 5. Artemis Drive-Cycle Data for the Model-III.
Drive CycleUrbanRuralM. Way
DataValueValueValueUnit
Time99110801066s
Distance4.917.328.75km
Avg. Speed17.757.596.9km/h
Max. Speed57.3111.1131.4km/h
Avg. Efficiency71.6585.282.33%
Input Energy80.71558.52291.3Wh
Output Energy13.5311.47.54Wh
M. Energy60.19478.31887.4Wh
G. Energy22.1716.3510.3Wh
Total Loss29.1785.1406.6Wh
Copper Loss24.4866.4369.9Wh
Iron Loss2.5411.0423.99Wh
Magnet Loss000.02Wh
Mechanical Loss2.157.6412.7Wh
M. Operation77.891.294.5%
G. Operation22.28.85.53%
Publisher’s Note: MDPI stays neutral with regard to jurisdictional claims in published maps and institutional affiliations.

