
A Scientometric Analysis of Deep Learning Approaches for Detecting Fake News


1
Institute of Engineering and Technology, Chitkara University, Punjab 140601, India
2
School of Creative Technologies, University of Bolton, A676 Deane Rd., Bolton BL3 5AB, UK
3
School of Information Technology and Engineering, Vellore Institute of Technology, Vellore 632014, India
*
Author to whom correspondence should be addressed.
Electronics 2023, 12(4), 948; https://doi.org/10.3390/electronics12040948
Submission received: 15 November 2022
/
Revised: 30 December 2022
/
Accepted: 2 January 2023
/
Published: 14 February 2023
(This article belongs to the Section Computer Science & Engineering)
Abstract
:The unregulated proliferation of counterfeit news creation and dissemination that has been seen in recent years poses a constant threat to democracy. Fake news articles have the power to persuade individuals, leaving them perplexed. This scientometric study examined 569 documents from the Scopus database between 2012 and mid-2022 to look for general research trends, publication and citation structures, authorship and collaboration patterns, bibliographic coupling, and productivity patterns in order to identify fake news using deep learning. For this study, Biblioshiny and VOSviewer were used. The findings of this study clearly demonstrate a trend toward an increase in publications since 2016, and this dissemination of fake news is still an issue from a global perspective. Thematic analysis of papers reveals that research topics related to social media for surveillance and monitoring of public attitudes and perceptions, as well as fake news, are crucial but underdeveloped, while studies on deep fake detection, digital contents, digital forensics, and computer vision constitute niche areas. Furthermore, the results show that China and the USA have the strongest international collaboration, despite India writing more articles. This paper also examines the current state of the art in deep learning techniques for fake news detection, with the goal of providing a potential roadmap for researchers interested in undertaking research in this field.
1. Introduction
Fake news is one of the ways to create myths today [1]. Fake news is not only the absence of truth but also the presence of lies mixed with accurate information. Therefore, the news may be completely false or partially true [2]. Fake news has been spreading since mankind began; in fact, it is as old as humanity itself [3]. In layman’s terms, fake news, which is all the rage these days, pertains to the intentional or unintentional dissemination of counterfeit information meant to deceive or mislead, as well as create confusion, tension, and disbelief [4]. The contamination of irrelevant, inaccurate content with this information has been become a global level issue, known as information pollution or infollution [5]. It is not a new concept [6]; however, in the digital age, fake news has gathered new momentum and become a worldwide issue to address [7]. In today’s digital era, the internet has become a pool of information for everyone. However, one should know that not everything available on the internet is credible. Only knowledge can light our way to recognizing real content; otherwise, we will be led to undesirable situations [8], as it may lead to a general lack of trust in what we see and hear online [9]. The emergence of online social platforms added fuel to this flame, as the use of social media has become a part of everyone’s routine for interacting with each other, as well as to obtain news. Information is spread out because of cloud networking in collaboration with the IoT [10]. Social networking platforms [11,12,13,14] such as Facebook, WhatsApp [11], and many more [12] enable people to create friend groups or family groups to share content; subsequently, when they get novel or emotional news, they do not always take the time to fact-check before sharing or commenting. Because of the speed at which information spreads online, users can influence various communities with both true and false information [13]. This leads to the unknowing spread of forged news. It is a fact that the majority of fake content is more eye-catching as compared to real news and, thus, spreads more quickly [14]. A recent study from the Massachusetts Institute of Technology (MIT) discovered that fake news on Twitter disseminates six times more quickly than real news pieces and is 70% more likely to be retweeted [15]. Misinformation, lies, and conspiracy theories predominate on many social media platforms. The real-world consequences of this toxic online environment range from genocide to election meddling and threats to global public health. According to studies, during the 2016 presidential elections in the United States, social media was flooded with fake news that was widely shared and heavily favored Donald Trump [16]. Most of us have witnessed fake news and misinformation being spread in large numbers during these COVID-19 times [17], adding to the confusion in an already difficult situation. This consists of an abundance of information about disease spread, some of which is accurate and some of which is not [18]. In an effort to tackle the COVID-19 infodemic, the WHO and the UK worked together on a study, revealing that, in the first 3 months of 2020, coronavirus misinformation led to the hospitalization of approximately 6000 persons globally [19]. During this time period, researchers also suspected that it killed at least 800 people [20]. Additionally, by mid-May 2020, in the middle of a worldwide epidemic, 28% of Americans thought Bill Gates intended to utilize COVID-19 to deploy a mandated vaccine equipped with tracking microchips. The general public still holds this absurd claim to be true [21].
Information Disorders: Incident Response in India
The affordable availability of smartphones and access of internet have contributed to heavy mobile internet access in both urban and rural regions in India. According to statista.com, India was the second largest online market after China in 2019. In 2020, India had 749 million internet users, increasing to 846 million in 2021; this is estimated to reach 932 million in 2022. During COVID-19, the trends of online education and working from home resulted in a rapidly growth of the digital population in India. India is a gregarious country; hence, its social networking apps are particularly popular. Additionally, video-sharing platforms are very popular. In 2020, India was the country with the highest number of WhatsApp and TikTok app downloads. There is over 160 billion INR worth of digital advertising in India, which is expected to hit 560 billion INR by 2023. There are over 480 million users on WhatsApp, make it the leading social media network in India. With more than 200 million prominent users in India and an expanding user base, WhatsApp is a preferred choice for spreading fake news due to its ubiquity and functionality [11]. A major factor in the proliferation of information disorders, i.e., misinformation, disinformation, and mal-information, in the country [22] is the widespread usage of social media platforms [1]. In India, there have been many instances of fake news proliferation, as shown in the timeline below (Figure 1).
Some examples can be given, such as in 2016, when there were rumors stating that 10 INR coins were invalid and that fake coins were in circulation. This caused a ruckus, as people started saying that the coins without the rupee symbol and having 10 lines were fake. This caused extensive confusion and problems. Then, a senior bank official in Vellore clarified that neither the Reserve Bank of India nor the Government of India had declared the 10 INR coins invalid. This was false information, and the 10 INR coins were legal tender [23]. Another incident involved the 2000 INR bill said to be outfitted with surveillance equipment allows tracking 120 m below the surface of the planet [4]. Everyone who is familiar with the demonetization problem is aware of the early 2017 fraud that engulfed the Indian public. Because similar accusations were being circulated on social media platforms at the time, a crowd in the Indian state of Karnataka attacked three men in July 2018 and killed one of them. The mob believed the men were kidnappers of children [1]. Various riots (e.g., the Delhi riots of 2019 against the Citizenship (Amendment) Act 2019) have occurred due to fake news. The Election Commission of India (ECI) reported 154 instances of fake news or misinformation on social media platforms during the 2019 Lok Sabha Elections [24]. During the 2020–2021 Indian farmers’ protest, social media was flooded with fake information. Violence erupted across the country on the day of Ram Navami (10 April 2022). After this, the hashtag “Indian Muslims Under Attack” began trending on social media. A bogus story was seeded on social media on 12 April 2022. According to the story, Muslims in India were in danger. However, in helping governments hasten the broadcast of information about the emergency response during disasters, these new media platforms also helped alleviate this issue [25].
The major contributions of this work are as follows:
- It discusses the different research publishing categories for fake news detection.
- It analyzes various linguistic style used in publications, as well as the implementation of these styles in future work.
- It elaborates different publication trends based on the year of the different studies.
- It illustrates the diverse regions or nations that have contributed more to the topic.
- It discusses the role of authors who contribute significantly to the detection of fake news.
- It discusses numerous publishing trends based on connections (colleges/organizations).
- It illustrates citation counts for each of the contributions related to fake news detection methods and techniques.
This study is organized as follows: Section 2 discusses the need for bibliometric research and its tools. Section 3 provides the required related work. The methodology is discussed in Section 4. The statistics and results are covered in Section 5, while the scientific mapping is covered in Section 6. The social and intellectual structures are covered in Section 7 and Section 8, respectively. Lastly, the paper is concluded in Section 9.
2. Need for Bibliometric Study
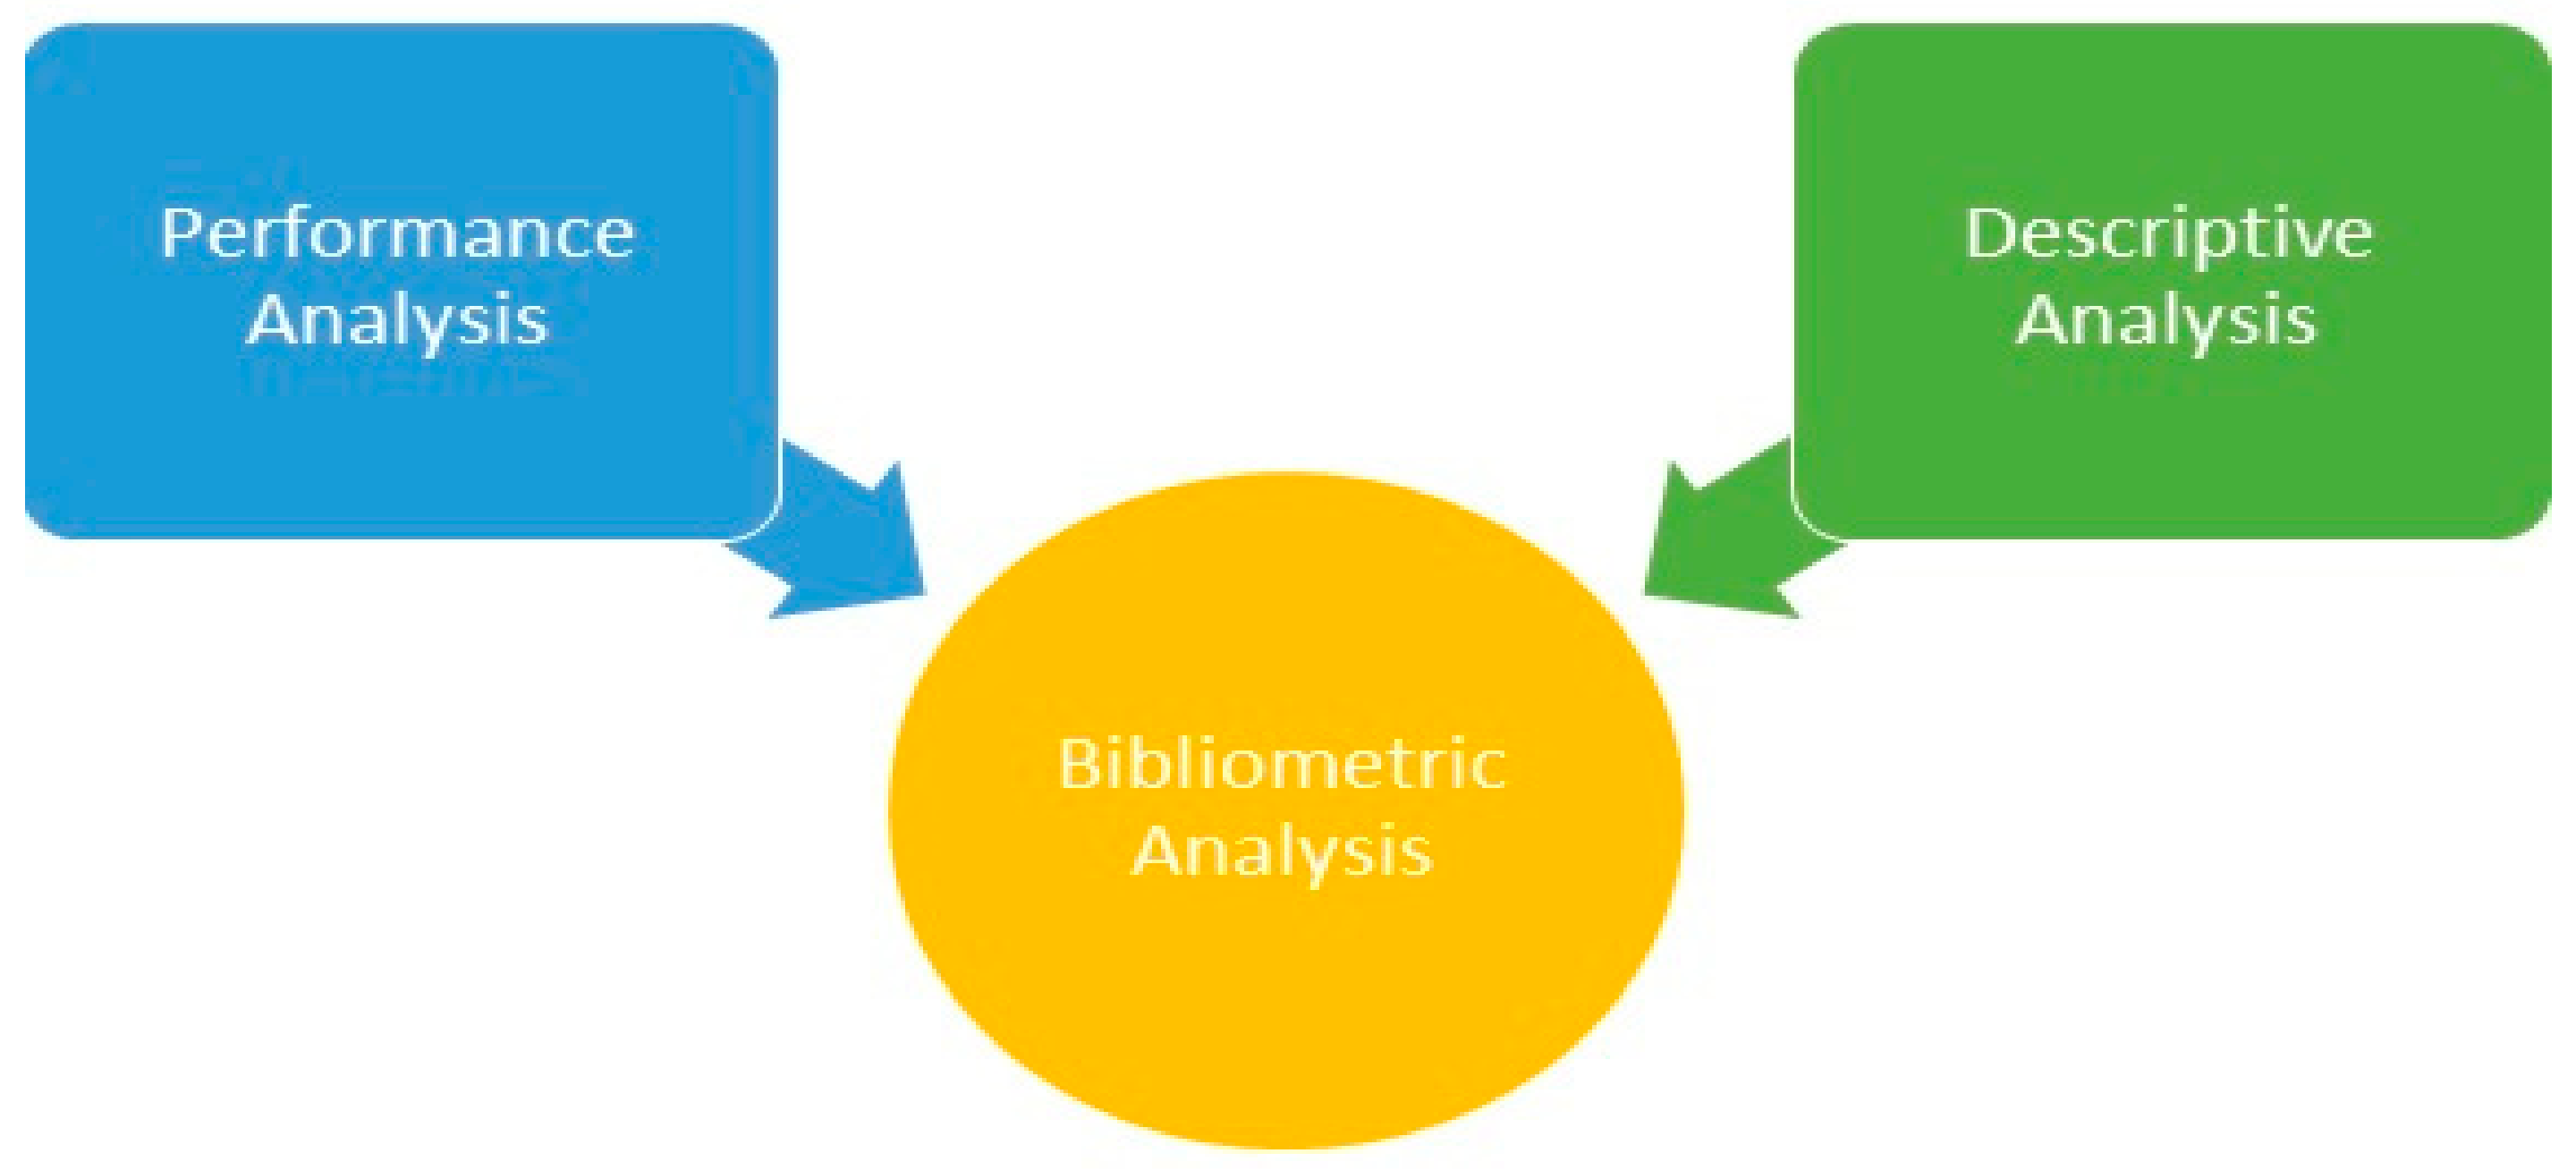
Bibliometric analysis is a quantitative approach that uses statistics to analyze bibliometric data such as keywords, citations, authors, and country distribution retrieved from scientific databases such as Web of Science, DBLP [26,27], PubMed, and Scopus [28], to name a few [29,30]. It is also useful for determining current trends and future interest in a specific area. Bibliometric analysis includes two components:
- Performance analysis is regarded as the hallmark of bibliometric study, i.e., the process of examining the performance of authors, countries, or journals.
- Scientific mapping is a process that examines the relationships among the research constituents mentioned above. Keyword analysis, collaboration analysis, citation analysis, etc. fall under this umbrella [31].
Bibliometric Tools
There are various tools available to conduct bibliometric reviews, with each having its unique features. As we know, graphical representation is more eye-catching as compared to plain text. Graphical representation or scientific map representation aids bibliometric analysis in clarifying the relationships among research constituents. There are various options available, such as Biblioshiny, CiteSpace, SciMat, and VOSviewer. A description of these tools is given below as.
Bibliometrix [32] is a special tool that was created using the logical bibliometric workflow in the statistical computing and graphics language R. It enables the bibliometric analysis of bibliographic information from Clarivate Analytics’ Web of Science, Scopus, PubMed, Digital Science Dimensions, and Cochrane databases, as well as the creation of data matrices for co-citation, scientific cooperation analysis, coupling, and co-word analysis. A web app called Biblioshiny makes Bibliometrix easy to use, even for those without coding skills. Biblioshiny enables scholars to easily use Bibliometrix’s main features, such as data import, analytics, and plots for four different levels of metrics: sources, authors, documents, and clustering by coupling. Moreover, it enables users to analyze three types of knowledge structures (k-structures), i.e., conceptual, intellectual, and social, using data files from WoS, Scopus, PubMed, Lens, and dimensions [32].
CiteSpace is a scientific mapping analysis tool developed by Drexel University. It is used to generate tree rings and geospatial maps using various bibliometric databases such as WoS, Scopus, Dimensions, Crossref, and PubMed [33,34].
SciMat is an open-source platform for bibliometric analysis and visualization that was created by the Secaba Lab at the University of Granada (Spain) and is currently maintained by the IntellSOK group at the University of Cadiz (Spain). The visualization created by this tool builds a report in HTML or LaTex format [35,36].
VOSviewer is a free online GUI-based software for scientific mapping developed by Leiden University in the Netherlands. Data are added from files downloaded from WoS, Scopus, Dimensions, PubMed, and RIS. This software’s visualization provides a thorough analysis of the relationships among various research constituents. The visualization capabilities are developed on the basis of network data, bibliographic data, and text data. This software supports the database files for Web of Science, Scopus, Dimensions, Lens, and PubMed [37].
3. Literature Review
3.1. Literature Review of Bibliometric Analysis on Fake News Detection Using Artificial Intelligence
This section reviews the literature for various studies on fake news and related subjects. A bibliometric study on 479 academic articles on fake news that were indexed in the Web of Science database was carried out using VOSviewer software [34]. There are three topologies provided: misinformation, mal-information, and disinformation [38]. Despite having similar sounds, these terms differ in some ways. Misinformation [21,36,38] is the unintentional dissemination of false information. It is not intended to deceive others. As an example, during COVID-19 times, the internet was inundated with information regarding precautions and home remedies. In contrast, disinformation [39,40] involves spreading bogus information with the intention of deceiving others. Contrarily, “misinformation” [41] is information that is grounded in reality but is utilized to hurt a victim, group, organization, or nation, e.g., revenge porn. It is recommended that further research be conducted on misinformation.
In order to focus on the use of an interdisciplinary approach contributing to scholarship and to comprehend the role of mobile and social media, as well as how the outcome of the 2016 US Presidential Election pushed the research community toward fake news detection, the authors in [36] used Google Scholar to examine 142 academically published articles. Google Scholar automatically keeps track of new articles as they are posted online. It has been found that prospective examiners should pay more attention to how people create, consume, and spread false information. To ascertain how the term “fake news” came to be a search subject, another bibliometric study explored 640 scientific articles that were taken from the WoS database [37]. These chosen articles were analyzed using Excel, SciMAT, and VOSviewer for scientific mapping. The authors came to the conclusion that educational practices must be promoted to stop the spread of false information.
Fake news goes by many names. The authors in [42] evaluated 387 fake news-related papers published on WOS between 2000 and 2019 to determine the overlap of and differences among phrases. They also recorded the distribution of publication years, author nations, and publications associated with these studies. This fake news study had nothing to do with people’s views, fact-checking, or research on disinformation. Some studies on misinformation [19] simply discussed misinformation in their research fields.
Because traditional and online media were inundated with information about COVID-19, the WHO dubbed it an “infodemic”. In 2020, one in six COVID-19 information pieces produced in India were false, making India the country from which the majority of COVID-19 false information originated [7,39]. Consequently, in January 2021, a concept map was created using 414 entries in the Web of Science (WoS) database, utilizing issues relevant to infodemics, misinformation, and disinformation to map the related literature [20]. Future research is also proposed with regard to useful research questions.
The rise of online media has hastened the spread of rumors and propaganda. Because these are forms of fake news, researchers have been motivated to work in this field. Some studies conducted bibliometric reviews to get a more in-depth look at this topic. The authors in [41] conducted an empirical study of peer-reviewed articles published in the WoS database from 1965 to 2019 and concluded that, despite an increase in publications and citations, propaganda cannot be considered an autonomous research field. Similarly, the authors in [7] used CiteSpace software to conduct a bibliometric review of 970 articles from the WoS database from 1989 to 2019 and concluded that rumors are spreading more quickly as a result of the development of various social networking platforms.
3.2. Deep Learning in Fake News Detection
Recent years have seen an explosion of research on fake news detection, which has resulted in numerous studies in the field. In the past, research on fake information detection focused on two main approaches: (a) categorizing false news in the context of unimodality (textual or visual); (b) exploiting multimodality (textual and visual) [43]. An overview of the use of DL in fake news detection is shown in Figure 2.
As it is known, computers cannot understand human language, and users express themselves in human language; thus, a subfield of AI known as NLP has emerged to fill this void. It enables machines to understand human communication languages. As a result, before using ML or DL, data should be preprocessed with NLP. The dataset is split into training and testing after this preprocessing step (2). A deep learning model is modeled using the training set (step 4), while it is tested using the test set (step 5). Finally, in step 6, news is classified as either true or false.
Researchers from all over the world have helped to tackle the problem of fake news. An AI model using NLP and conventional ML was created to categorize classified text as fake news [42]. Experiments were carried out using the Kaggle dataset and articles pulled from the internet. When compared to other ML and DL models, the findings showed that random forest and CNN with global max pooling had high accuracy. Machine learning models were found to be roughly 6% less accurate than neural network models.
To indicate that people are more likely to forward news items immediately if the content is novel and emotionally appealing [43], the authors in [44] used a multilayer perceptron (MLP) neural network and a novelty and emotion-based representation of news to countermeasure the spread of fake news. During COVID-19 times, the internet was flooded with information related to home remedies and precautions; then, due to care, love, and fear of losing their loved ones, people shared this information through social media without checking whether it was true or false. This is how the spread of misinformation happens [45]. To implement this approach, four datasets were used, and statistically significant improvements in accuracy were recorded [44]. A hybrid DL framework (BerConvoNet) proposed by [46], combining BERT and CNN based on the news embedding block (NEB) and multiscale feature block (MSFB), was used to classify whether a given news article is genuine or not. However, it is yet to be explored how multimodal learning works.
A deep triple network (DTN) along with an entity-based attention network (EAN) developed in [47] can not only detect if a news article is true or false but also explain why it is. In this direction, the authors in [48] also attempted to work on a BERT-based model using two explanation methods, LIME [49] and Anchors, with the goal of detecting fake news while also attempting to explain it. The results supported the use of multiple surrogate-type methodologies to derive explanations using the Kaggle dataset, containing 44,848 news items. Because Anchors were not always able to provide an explanation, other explainability methods [41,42] will be applied in the future.
Another approach to solving the problem of falsified news was investigated in [50], i.e., a triple-branch BERT network for both binary and multilabel classification of fake news. Two datasets, LIAR and LIAR PLUS, were deployed; as compared with previously explored models, the accuracy was improved significantly using binary classifiers, but only marginally using multilabel classifiers.
GANs [44,45] are popular for content synthesis, i.e., for creating deep fakes. They consist of two architectures, a generator and a discriminator, competing against each other in multiple iterations to create more realistic content and to distinguish it from real content. In this context, a comprehensive review [51] was performed to analyze and identify existing approaches to deep fake creation and detection. Various deep fake tools such as Faceswap, DFaker, FSGAN, StyleGAN, and Face2Face, in addition to existing solutions based on the ML and DL techniques CNN, LSTM, RCN, and VGG16, as well as ResNet models and existing databases, were discussed.
To differentiate between fake (spoof) and real (bona fide) speech, a solution based on classical supervised learning pipeline was proposed [52]. The publicly available ASVspoof 2019 dataset was used to validate the proposed method. The authors of [53] used the FakeAVCeleb dataset to demonstrate that the ensemble-based method outperformed multimodal methods for detecting deep fakes of multiple modalities, i.e., video and audio. Along with deep fake movies, this collection also contained fake audio that was created artificially.
Examining the liaison between text and visual information made use of the cosine similarity notion. The processing of picture data was performed using a trained image2sentence model, and the representation of text representations was performed using a text-CNN with an additional fully connected layer [54]. F1 scores of 89.6% and 89.5% were recorded for the PolitiFact and GossipCop datasets, respectively. The authors of [55] used the latent Dirichlet allocation (LDA) to model online posts for fake news detection in an Indian context. Images were analyzed using VGG16 and Resnet-50, while text was analyzed using several ML and DL models. The implementation showed 74% accuracy.
To detect fake news, the authors created SpotFake [56]: a multimodal framework that combines language models with a VGG-19 model pretrained on ImageNet to incorporate contextual information. Using the concatenation technique, text and visual features were combined to form a multimodal fusion module. The investigation’s findings presented 77.77% and 89.23% accuracy on publicly available datasets Twitter and Weibo, respectively. Inspired by [56], the authors proposed SpotFake+ [57], an advanced version of SpotFake, where transfer learning was used to extract semantic and contextual information from lengthy news articles and images.
Despite the fact that the aforementioned papers concentrated on broad findings related to fake news identification, there is still room for update and expansion as a result of the sharp rise in quantity of topical publications. This article addresses this gap by including all disciplines from 2012 to 2022 (until July), instead of focusing on a particular discipline.
4. Research Methodology
This section describes the research methodology used in this study. The research methodology used was bibliometric analysis, involving statistical analysis and visualization of the field’s research output. Before beginning analysis, the first step was to define research questions, and then the appropriate research methodology was chosen to find answers. This study addresses the following research questions:
- RQ1: How have publications and citations in the field of identifying fake news using deep learning evolved?
- RQ2: What are the most relevant and influential sources, countries, and publications on deep learning for fake news detection and classification?
- RQ3: What are the most popular research topics and keyword trends in using deep learning to combat the spread of fake news?
- RQ4: What are the main clusters of co-citations related to deep learning for fake news detection?
- RQ5: What is the country collaboration network for detecting fake news using deep learning?
These research questions are addressed using descriptive, conceptual, intellectual, and network analysis using the Biblioshiny application and VOSviewer [58] version 1.6.18. The selection of the database was the next step in the analysis for this study, which was then followed by data collection using the search strategy, as depicted in Figure 3.
4.1. Data Collection
A database is a structured collection of data. It is classified as field-specific and mul–tidisciplinary. The data used for this study came from Elsevier’s multidisciplinary Scopus database between 2012 and 2022 (until July). Scopus is a peer-reviewed literature abstract and citation database launched in 2004 that includes scientific journals, conference proceedings, and books. It provides a thorough overview of global multidisciplinary research output. Over 3000 academic, governmental, and corporate entities use Scopus, which serves as the main data source for the Elsevier Research Intelligence portfolio [59].
4.2. Preparing Data for Analysis
To meet the needs of the software, data were downloaded from Scopus in an unencrypted manner. Using the below-described search parameters, documents were picked for shortlisting on 8 July 2022.
Search String: Keywords are the basic and short terms that describe the content. For fake news, various terms are used. The terms fake and false were used interchangeably in the majority of the research contributions. The title and abstract are critical in understanding what an article is about. The keyword search criteria were used to find scientific information about fake news detection, and 738 documents were initially extracted. The following is a presentation of the search string used for this study: (fake OR false AND news OR content OR misinformation OR disinformation AND detection AND deep AND learning).
Year Span: All years in the range 2012–2022 were considered.
Subject Area or Categories: Fake news is not confined to politics or entertainment. All aspects of life are affected; as a result, all domains were taken into account.
Document Type: Articles, conference papers, conference reviews, data papers, and reviews were considered.
Source Type: Journals, books, etc. were considered.
Country: As fake news is a global issue; all countries were considered.
Language: In addition to English, five Chinese documents, one Portuguese document, and one Spanish document were also available. In order to generate the final dataset of 569 papers, shortlisted materials were screened using an English language filter. The title, authors, abstract, and keyword information from these papers were imported into Biblioshiny in csv format.
Tools Used for Data Analysis and Visualization: VOSviewer and Biblioshiny were the tools used to create figures in this study. Although there are other tools available for this purpose, we chose these two because they provide a relatively simple way to obtain the basic functionality required for visualizing bibliometric networks. Biblioshiny’s analysis options are diverse and are divided into seven categories, which are reflected in the analytics and graphs: (1) the overview; (2) the sources; (3) the authors; (4) the documents; (5) the conceptual structures; (6) the intellectual structure; (7) the social structure. Graphs and performance analyses can also be exported to a variety of file formats, including Pajek and HTML, and tables can be copied to the clipboard, saved as Excel or PDF files, or printed. In contrast, VOSviewer accepts inputs from a wide variety of bibliometric sources including Web of Science, Scopus, PubMed, Lens.org, Dimensions, Semantic Scholar, and COCI. It also accepts, as input, exports from standardized formats and popular networking tools such as GML, JSON, and Pajek, and it provides four types of citation-based analysis, co-authorship, citation, bibliometric coupling, and co-citation at multiple levels of analysis (e.g., author, journal, organization, and country), as well as keyword co-occurrence and term (title + abstract) co-occurrence maps. The online feature allows sharing interactive visualizations created using VOSviewer with data files stored in Google Drive, Dropbox, or OneDrive. In addition to the standard network view, each map includes a density overview and an overlay overview.
5. Data Analysis and Results
5.1. Performance Analysis
The technique of analyzing the performance of authors, nations, or journals using bibliometric data gleaned from academic databases such as WoS, Scopus, and DBLP Computer Science Bibliography [26] is known as “performance analysis” [60], which is regarded as the defining characteristic of bibliometric research.
5.2. Descriptive Analysis
When used as a descriptive tool, bibliometric analysis can cover a range of topics, including sources, authors, and documents (Figure 5). All elements of a document, including global and local referenced documents, reference spectroscopy, trending topics, word dynamics, and most frequently used terms, to name a few, are grouped under the document tile.
5.2.1. The Dataset
Table 1 provides an overview of the bibliometric data frame of the 569 publications that were selected using a thorough search query on the Scopus database. These documents had an average citation score of 10.52 and worldwide co-authorship percentage of 18.1%, and they were published in 358 sources, indicating that they were the subject of extensive prior research, including researcher collaboration. Table 1 provides an overview of all the data chosen for our investigation. Firstly, the key material, which spans the years 2012 to 2022, is presented. There was a total of 358 sources, including books and journal articles. The average age of the 569 papers was 1.55, and the overall growth rate was 59.71. The entire dataset had 19,963 references and 1052 citations. Secondly, the summary included detailed information about the keywords, e.g., 1150 at-risk keywords combined with 2779 other keywords. Thirdly, the summary revealed that 37 documents had a single author, whereas 3.52 coauthors on average collaborated on the texts. Lastly, the summary lists the types and numbers of publications, including 238 articles, 294 conference papers, 18 conference reviews, three data papers, and 16 reviews.
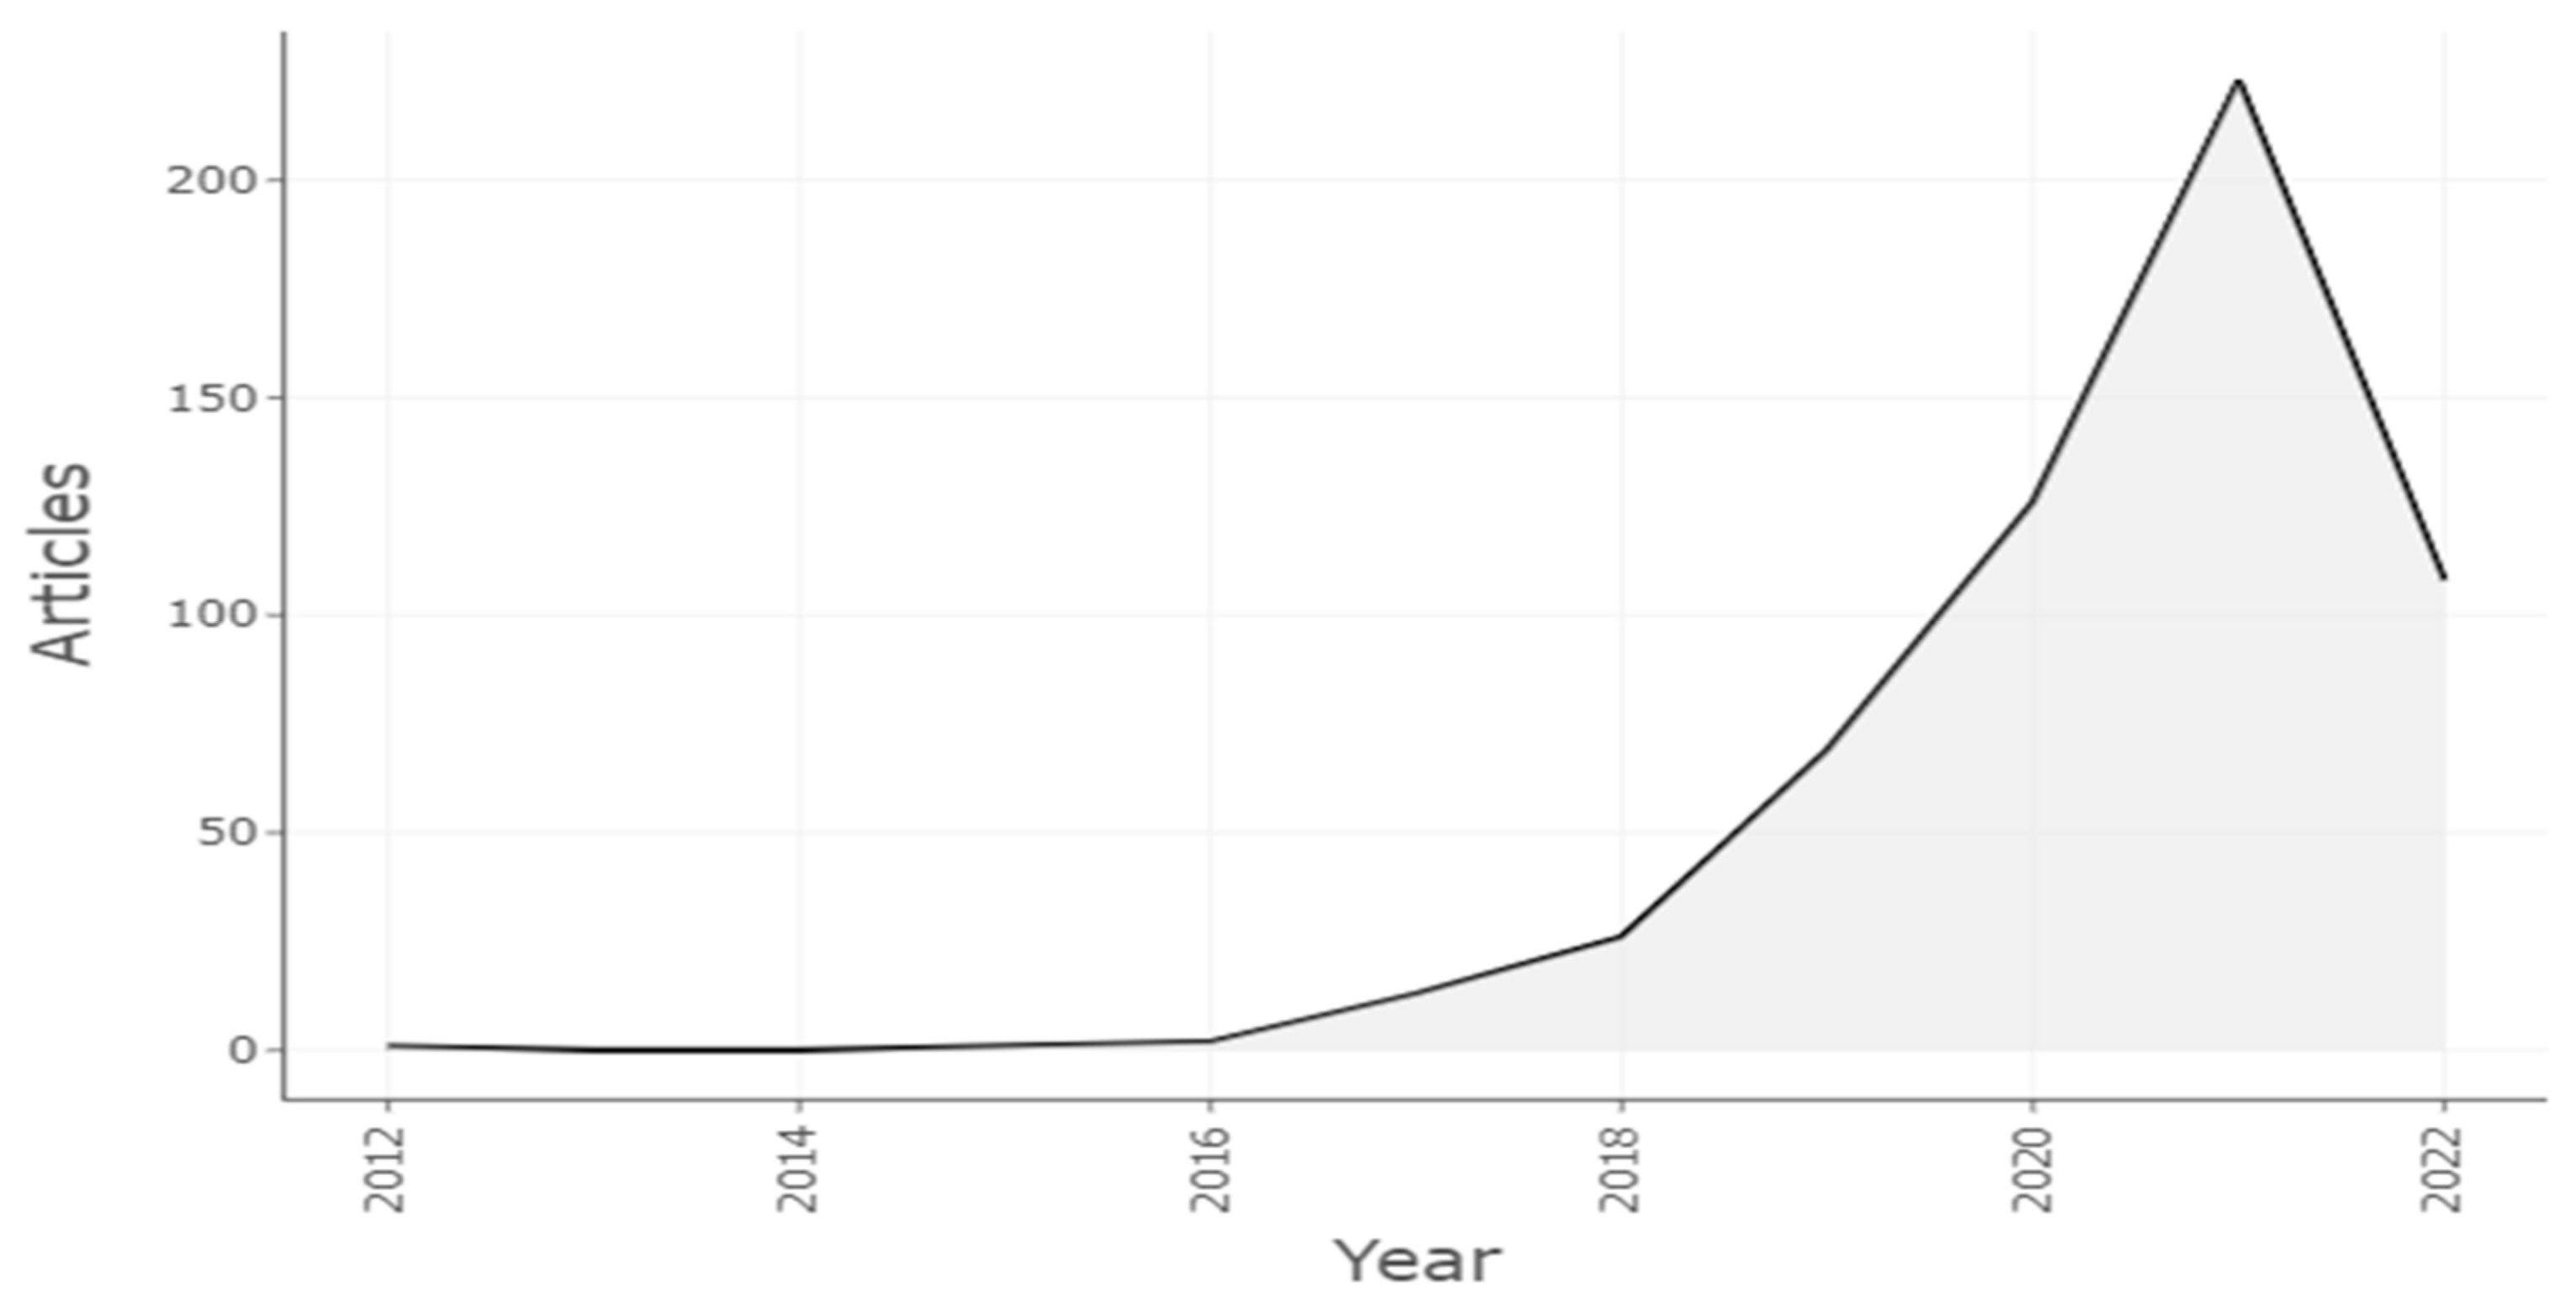
5.2.2. Publication and Citation Structure
For this study, documents related to fake news were retrieved throughout the past 11 years, from 2012 to 2022 (July). Figure 6 shows the trends in fake news publications every year, revealing that the field is still in its infancy, with more contributions after 2016. Despite the fact that the number of publications in 2022 is not complete (the search was conducted during this year), we are able to see a clear trend of increasing numbers since 2016. As a result, this subject is not only receiving more attention but is also relatively new.
Table 2 displays the citation years, average total citations per article, and number of articles published annually. In terms of citation structure, there was no clear trend, aside from the obvious fact that older publications were more cited.
5.2.3. Three-Field Plots
Using Sankey Plots (Figure 7), three fields were illustrated in relationship with one another, proportional to the node’s value. The authors, keywords, and sources that were chosen for analysis are listed in the left, middle, and right rows, respectively. Deep learning, machine learning, fake news, social media, fake news detection, natural language processing, LSTM, and deep fake were prominent keywords displayed in each item. On the basis of these keywords, all 10 influential journals featured these topics covered by influential authors. IEEE Access secured the top position, followed by Expert Systems with Applications.
5.2.4. Relevant Sources
Using citations as a measure of a journal’s reputation, Figure 8 shows the top 10 high-impact-factor journals. IEEE Access was the most popular journal for researchers seeking high-quality papers, followed by CEUR Workshop Proceedings and ACM International Conference Proceeding Series.
5.2.5. Local Cited Sources
Citations received by a document or author from a document already included in the current study were called local citations. By contrast, global citations [61] refer to the total number of citations (TC) that a critique has accrued from documents indexed in a bibliographic database [62]. According to Figure 9, IEEE ACCESS was in first place with 252 local citations, followed by Science (102) and Expert Systems with Applications (83).
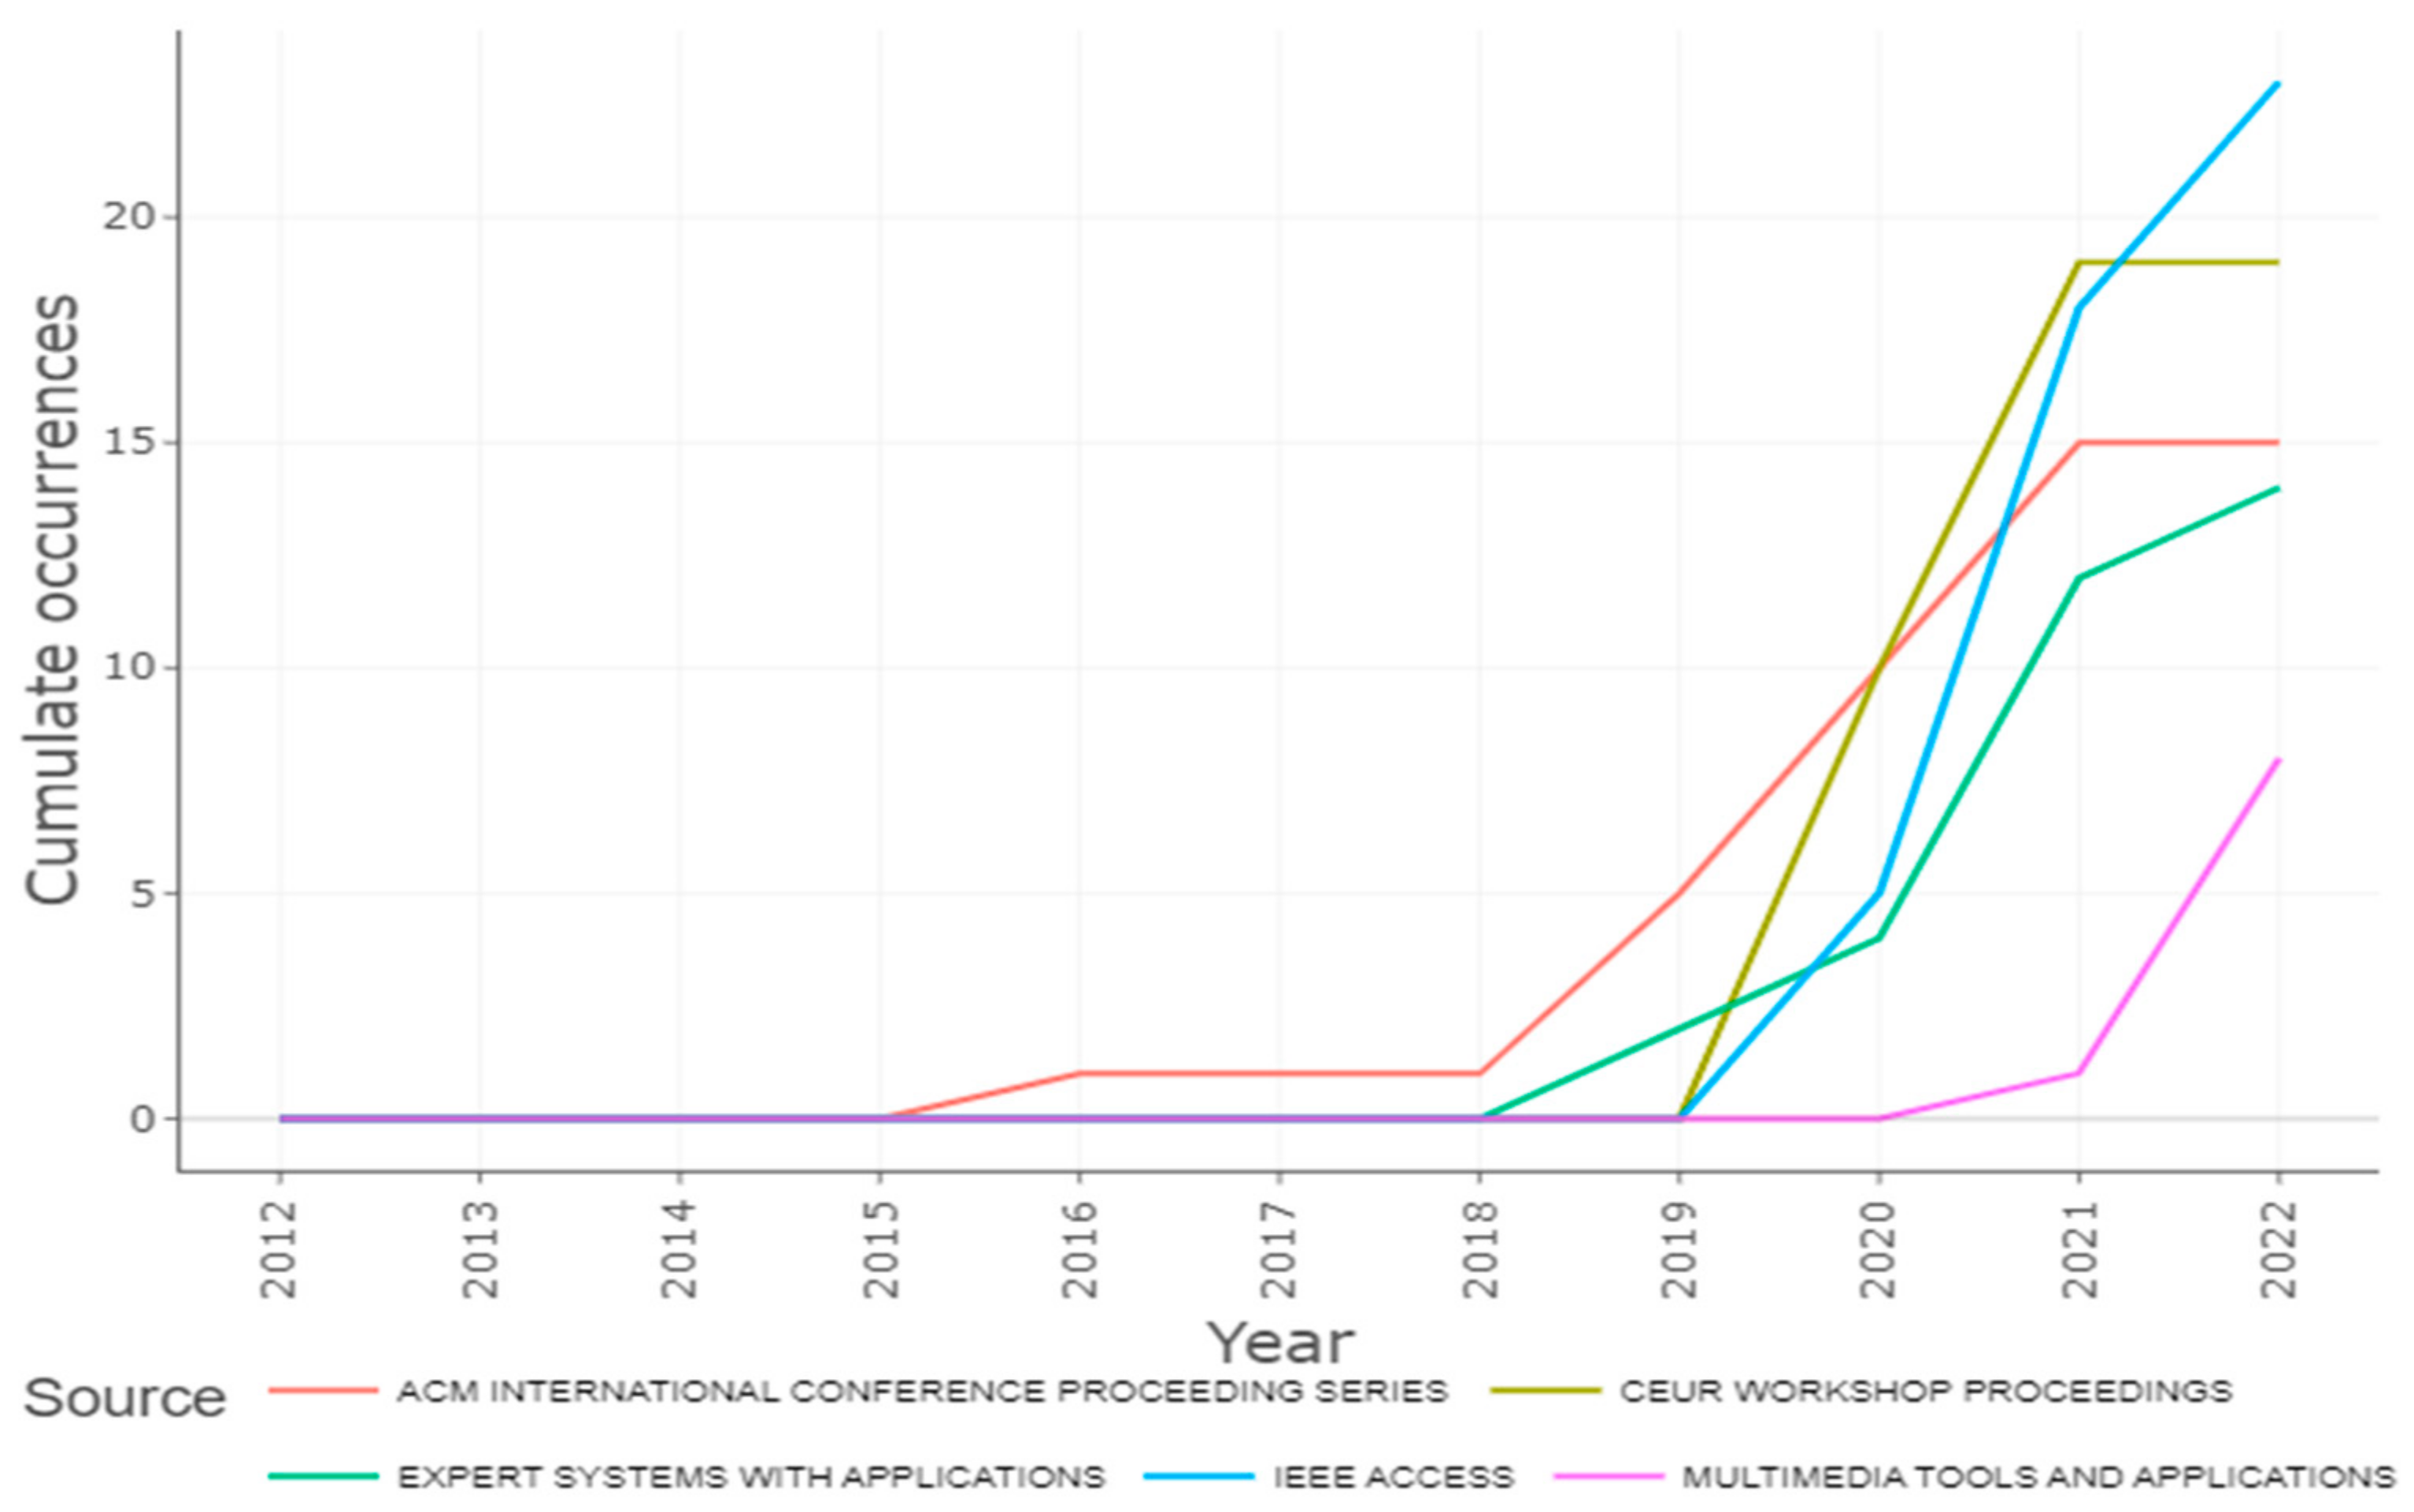
5.2.6. Source Dynamics
LOESS (locally estimated scatterplot smoothing) was used to represent the source growth of the top five journals to depict the number of publications over time. This statistic indicates that studies on fake news began in 2016 onward. The number of publications in the ACM International Conference Proceeding Series has rapidly increased since 2016. After COVID-19, when the internet was overflowing with data, there was an increase in publishing across the board. In this way, an interdisciplinary study domain may have emerged. Considering the substantial number of journals covering the research area, a broader diversity of study issues and a multidisciplinary nature are implied. It can be seen in Figure 10 that the number of publications in IEEE Access increased dramatically in 2021 with 13 papers; so far in 2022 (until July), there have been five papers published.
5.2.7. Most Relevant Affiliations
A citation is not only a way to link documents, but also a way to link ideas [43]. As a result, citation analysis can be used to evaluate the sway of various factors on the research stage, such as nations, universities, research institutes, or journals, as well as to track changes in their performance over time. Figure 11 displays the institutions with the highest citation rates for papers written by people affiliated with them. China was discovered to dominate in terms of citations; Beijing University of Posts and Telecommunications earned 14 citations, while the University of Electronics Science and Technology of China received a maximum of 18 citations. The top 10 associations for identifying fake news using artificial intelligence are shown in the graph, ranked by the quantity of publications.
5.2.8. Countries or Regional Distributions
The dissemination of fake news is a global problem that has an impact on all facets of society because it is not exclusive to just one area or nation. As a result, it has been the focus of research from all around the world. Table 3 shows the frequency of publication by country, and it can be concluded that three countries, India, the United States, and China, dominate this field.
Table 4 shows the total citations acquired by the country and the average article citations received.
5.2.9. Country’s Production over Time
Figure 12 shows that the detection of fake news has shifted significantly in India. During the 2016 US presidential election campaign, various websites disseminated biased or inaccurate information in an effort to profit from social media advertising. As a result, the United States began to address this serious issue more rapidly after 2016. China placed third in terms of production.
5.2.10. Documents
Global citations, which can also be used to identify highly cited publications, were utilized to calculate a document’s total number of citations from all the articles in the database. The number of citations a document obtained from the papers in the collection under review was calculated using local citations. The most frequently referenced papers, according to Scopus, are shown in Figure 13. The top 10 locally cited articles garnered 24,299 citations, equating to the top 10 most important papers contributing to 12.84% of total local citations.
5.2.11. Word Cloud
Word clouds, often referred to as tag clouds, wordles, or word collages, are graphic representations of words having more frequent occurrences with more emphasis [63]. The most popular words are highlighted in this style of visualization, which allows future researchers to understand what is happening with the chosen topic. From an extracted Scopus csv file utilizing the top 50 authors’ keywords and keywords plus, a wordcloud was produced, as shown in Figure 14.
5.2.12. TreeMap
Indexers and search engines use keywords in articles to find relevant articles. The manuscript becomes accessible to readers if database search engines can locate the authors’ keywords. This results in more people reading the manuscript and, as a result, more citations. With the aid of these data, it is possible to spot research trends, knowledge gaps, and potentially interesting areas for future study. A word TreeMap [33] displays the top 50 most frequently used keywords in the articles. The combination of prospective keywords, deep learning, and fake news is depicted in the TreeMap in Figure 15. Deep learning was the most popular keyword, while machine learning was the least popular. Social media also played a significant role in fake news dissemination. Deep learning in data mining and image classification for fake detection are two potential research areas.
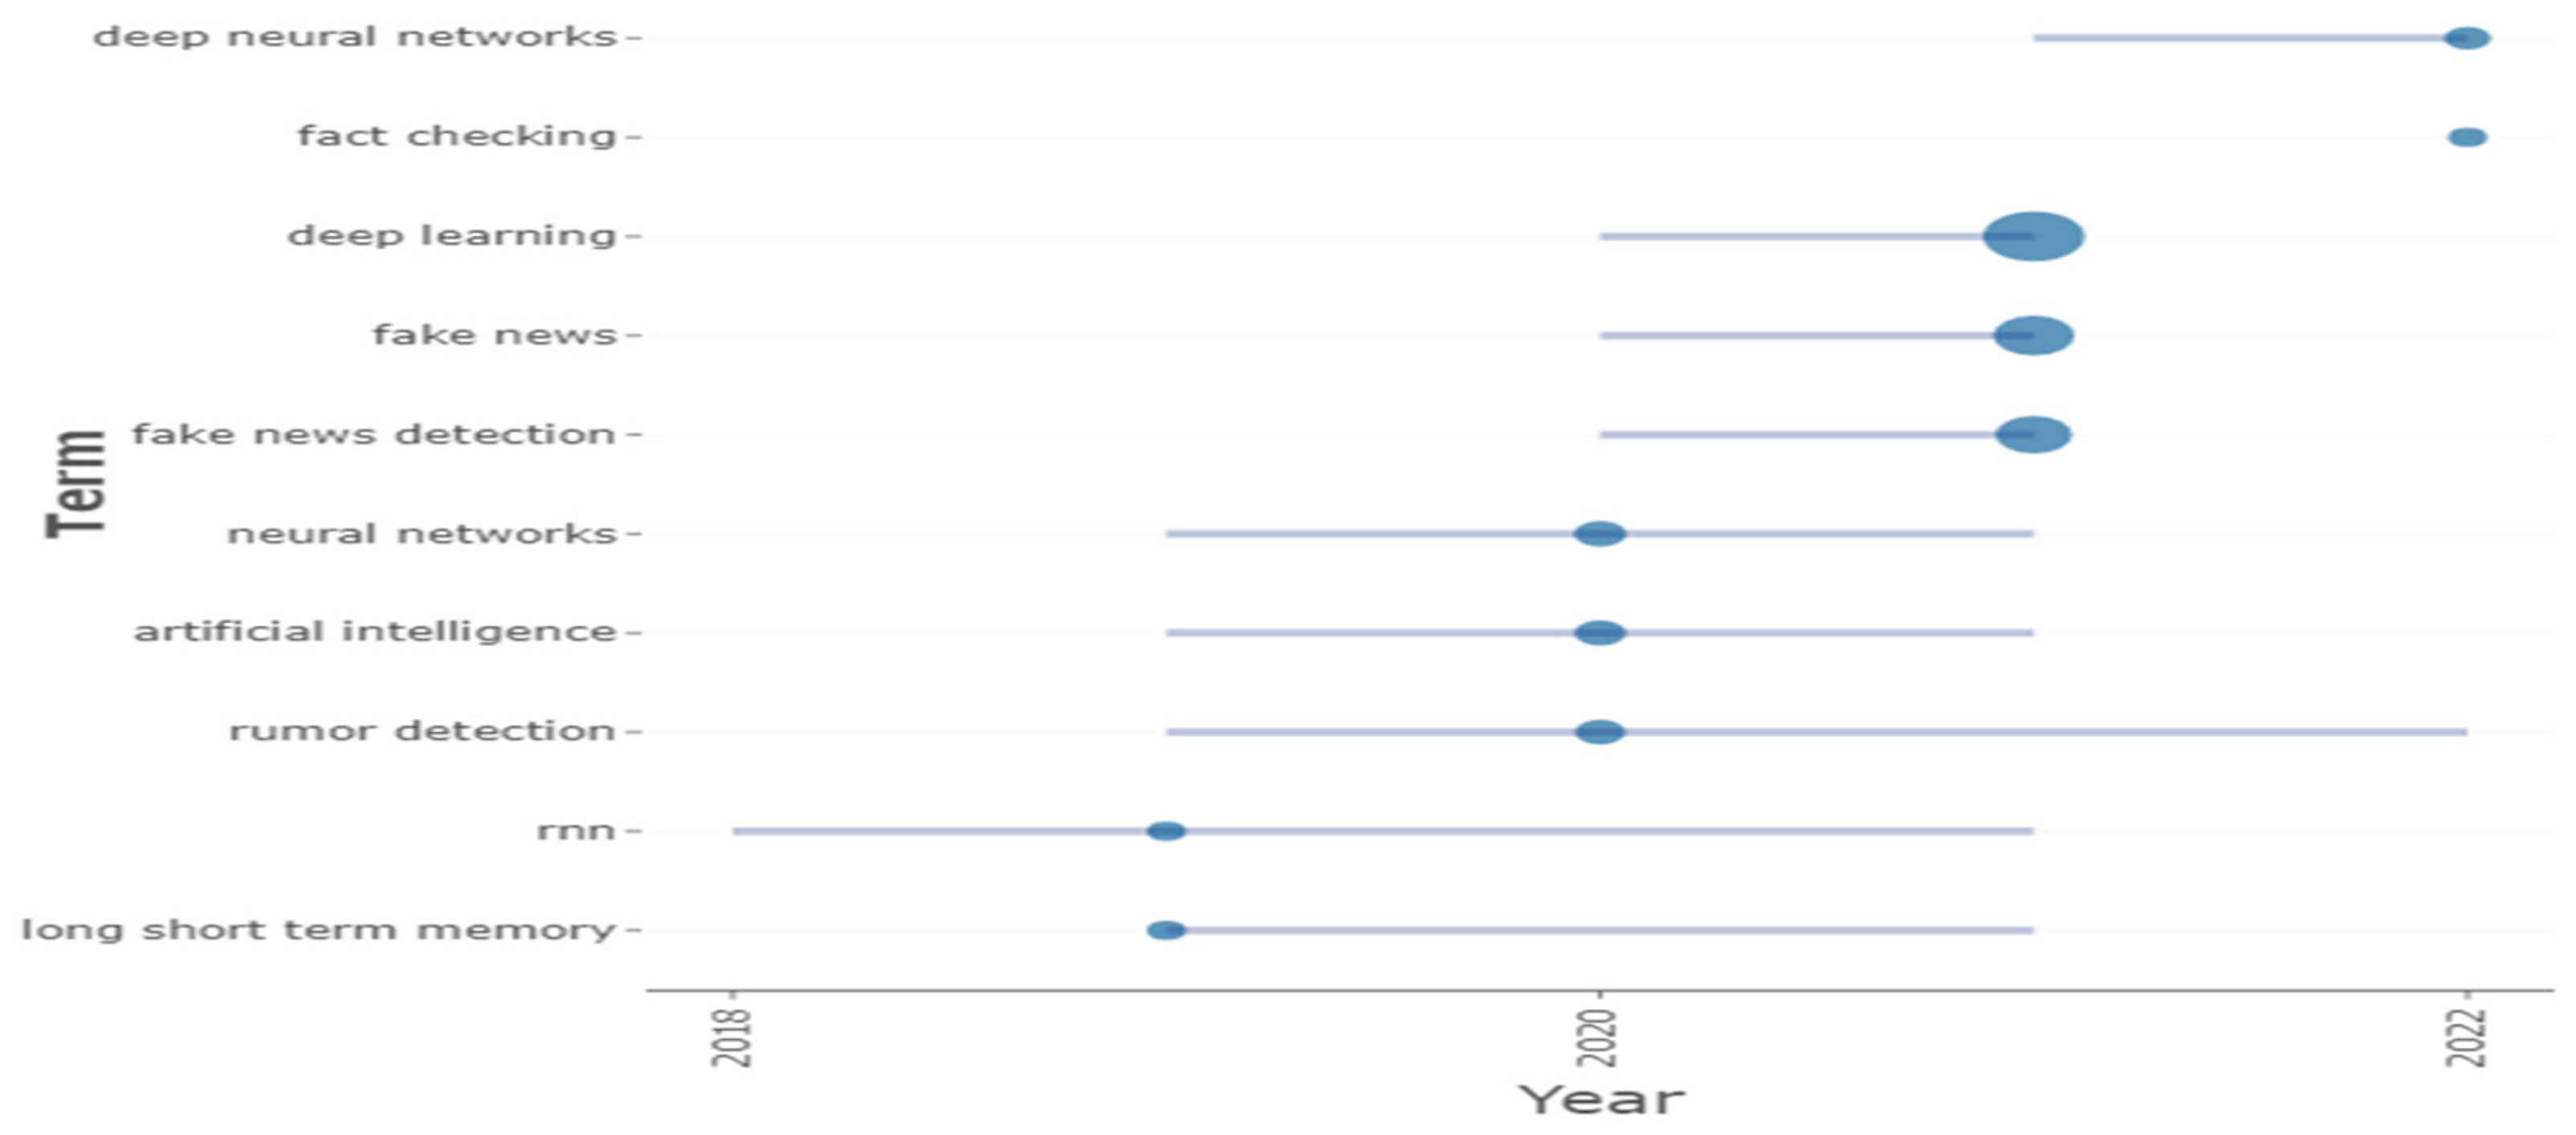
5.2.13. Trend Topics
Figure 16 depicts the authors’ keyword search trends between 2018 and 2022. Year q1, year med, and year q3 represent the various time periods. A trending topic, say X, can be represented as a line; a bubble in a given year indicates that at least one document on that trending topic was published that year, while the bubble size is proportional to the number of articles published on the topic that year. RNN appeared five times between 2018 and 2021, rumor detection appeared 14 times between 2019 and 2022, and fake news detection appeared 102 times between 2020 and 2021.
6. Scientific Mapping
Scientific mapping is a process to examine the relationships among the abovementioned research constituents. The goal is to identify the intellectual interactions and structural connections that exist between and within research constituents. Citation analysis is used in scientific mapping techniques [67] to determine the relationships among publications and to identify the most influential publication. Keywords are the basic and short terms that define what the content is about. Scientific mapping based on text data (keywords) including title and abstract, i.e., co-word analysis, is used to reveal the trends in research. Co-authorship analysis is used to identify collaborations among authors. Bibliographic coupling is useful to determine relationships among cited publications [68].
6.1. Conceptual Approach
To identify the most relevant and most recent topics, scholars often use conceptual structures to comprehend topics sheltered by scholars (so-called research fronts) [69,70]. By using correspondence analysis (CA), multiple correspondence analysis (MCA) [60], or metric multidimensional scaling (MDS), as well as clumping a bipartite network of terms collected from keywords, titles, or abstracts, a conceptual structure can shed light on the topology of a scientific area.
6.1.1. Network Approach
A bibliometric analysis reveals various network forms, primarily citation networks (in which links denote bibliographic citations) and collaboration networks (in which links denote article co-authorships). The networkPlot function visualizes a network built by biblioNetwork using VOSviewer or R scripts. The role of bibliometric units such as scholars and journals are explicitly looked at in order to capture important aspects of the underlying research system.
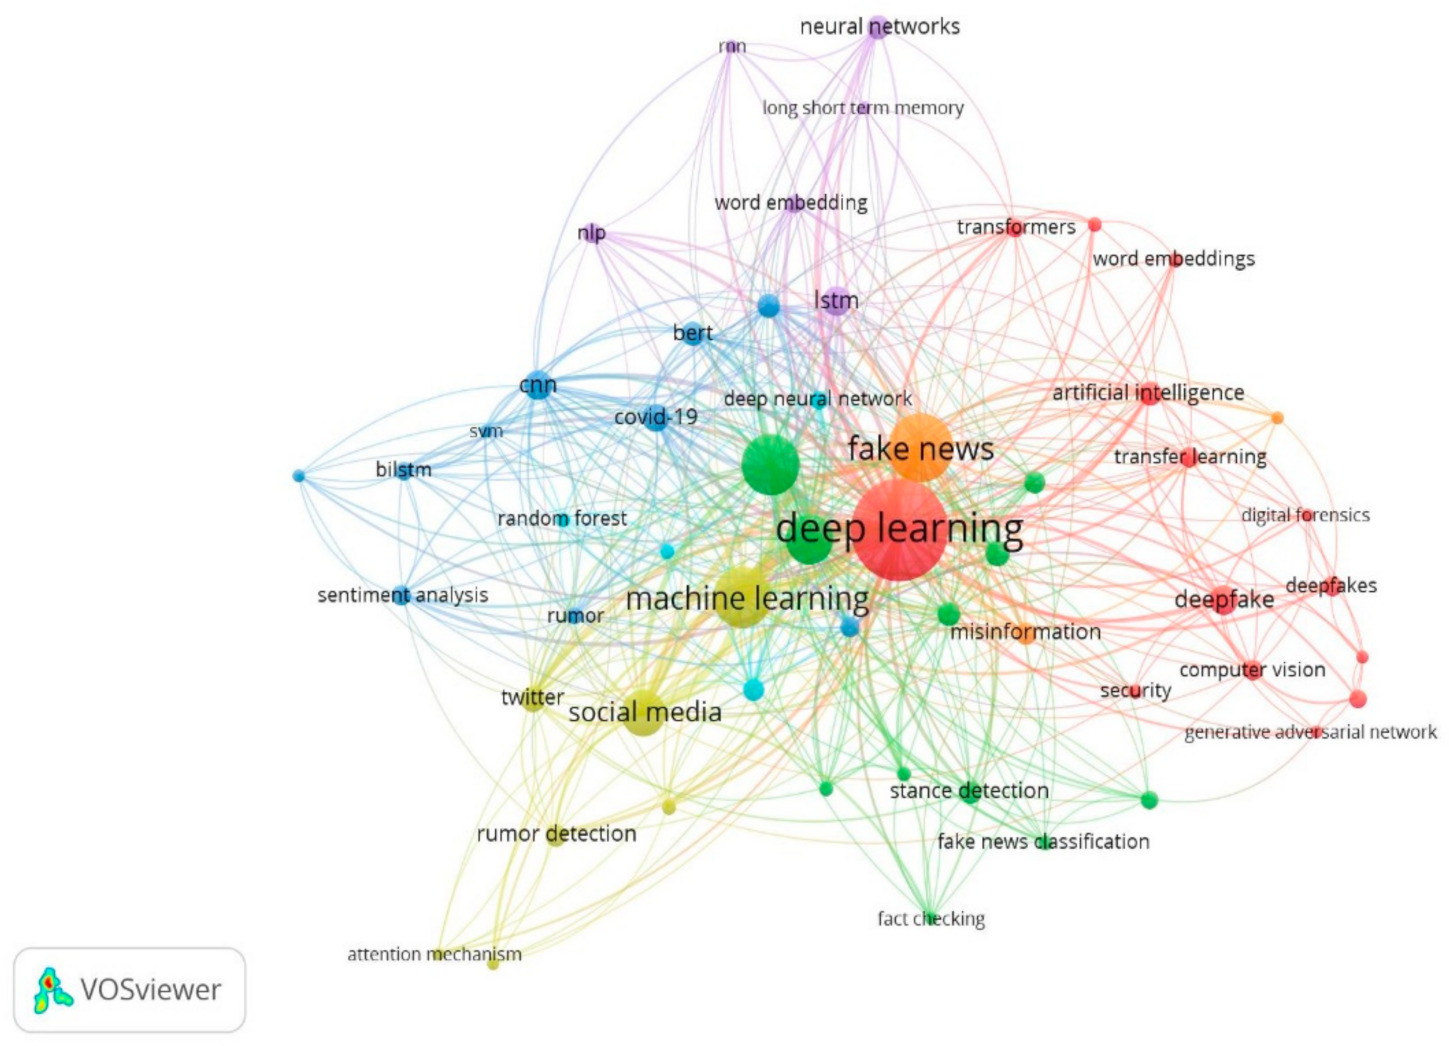
6.1.2. Keyword Co-Occurrence Network
Keywords are the basic terms that define the content [34]. Using scientific mapping based on text data (keywords), including the title and abstract, we can obtain a network visualization map. In this network, a keyword is represented by a node, and the co-word network is represented by edges between these nodes. If there is a link between two nodes (keywords), it means that a correlation exists. Closer nodes indicate a higher correlation, and vice versa. A larger node indicates a greater weight carried by that particular node. In this analysis, five was selected as the minimum occurrence of a term; out of 1150 keywords, 55 meet this selected baseline. The 60% most relevant terms were considered the default choice for selecting the most relevant keywords; using this criterion, a total of 55 keywords or nodes (n) in this study of 569 articles were mapped into seven clusters, as shown in Figure 17.
Cluster analysis of the built clusters in the network visualization map was also performed to reveal research trends. All clusters were represented by different colors. Artificial intelligence, computer vision, deep learning, deep fake detection, digital forensics, forgery detection, generative adversarial networks, misinformation detection, security, transfer learning, transformers, word embeddings, and deep learning came under the red cluster (n = 14), which was dominated by deep learning. The green cluster (n = 11) was dominated by the convolutional neutral network and its applications. BERT, BiLSTM, CNN, COVID-19, neural network, rumor, sentiment analysis, social network analysis, and SVM were in the blue cluster (n = 10), focusing on the spread of misinformation during COVID-19. Machine learning, rumor detection, social media, and Twitter keywords fell under the golden cluster (n = 7). The purple cluster (n = 6) contained long short-term memory (LSTM), neural networks, NLP, RNN, and word embedding keywords. The sky-blue cluster (n = 4) featured classification, deep neural network, random forest, and support vector machine. Lastly, the orange cluster (n = 3) contained disinformation, fake news, and misinformation keywords.
On the basis of examination of the co-occurring keywords in the title and abstract, the following insights can be derived in future research:
- How do deep fakes operate, and how do they compromise authenticity?
- What roles do deep learning technology and face forensics play in detecting deep fakes?
- What databases are available for deep fake and misinformation or disinformation detection?
- Which characteristics help distinguish between genuine and fake?
- Can artificial intelligence threaten individual privacy?
- What roles do sentiments play in spreading misinformation?
- What are the trends in artificial intelligence that pose a threat to people’s privacy?
- In what ways does the ineffective use of AI deceive society?
- What is the relationship between deep fake technologies and misinformation?
- Can forgeries spread false information? What are the state-of-the-art countermeasures?
- In what ways does novel content trigger the spread of misinformation?
- Is it possible to generate deep fakes other than images using GANs?
- What role does CNN play in combating bogus news?
- What methods can GANs use to detect deep fakes created by GANs?
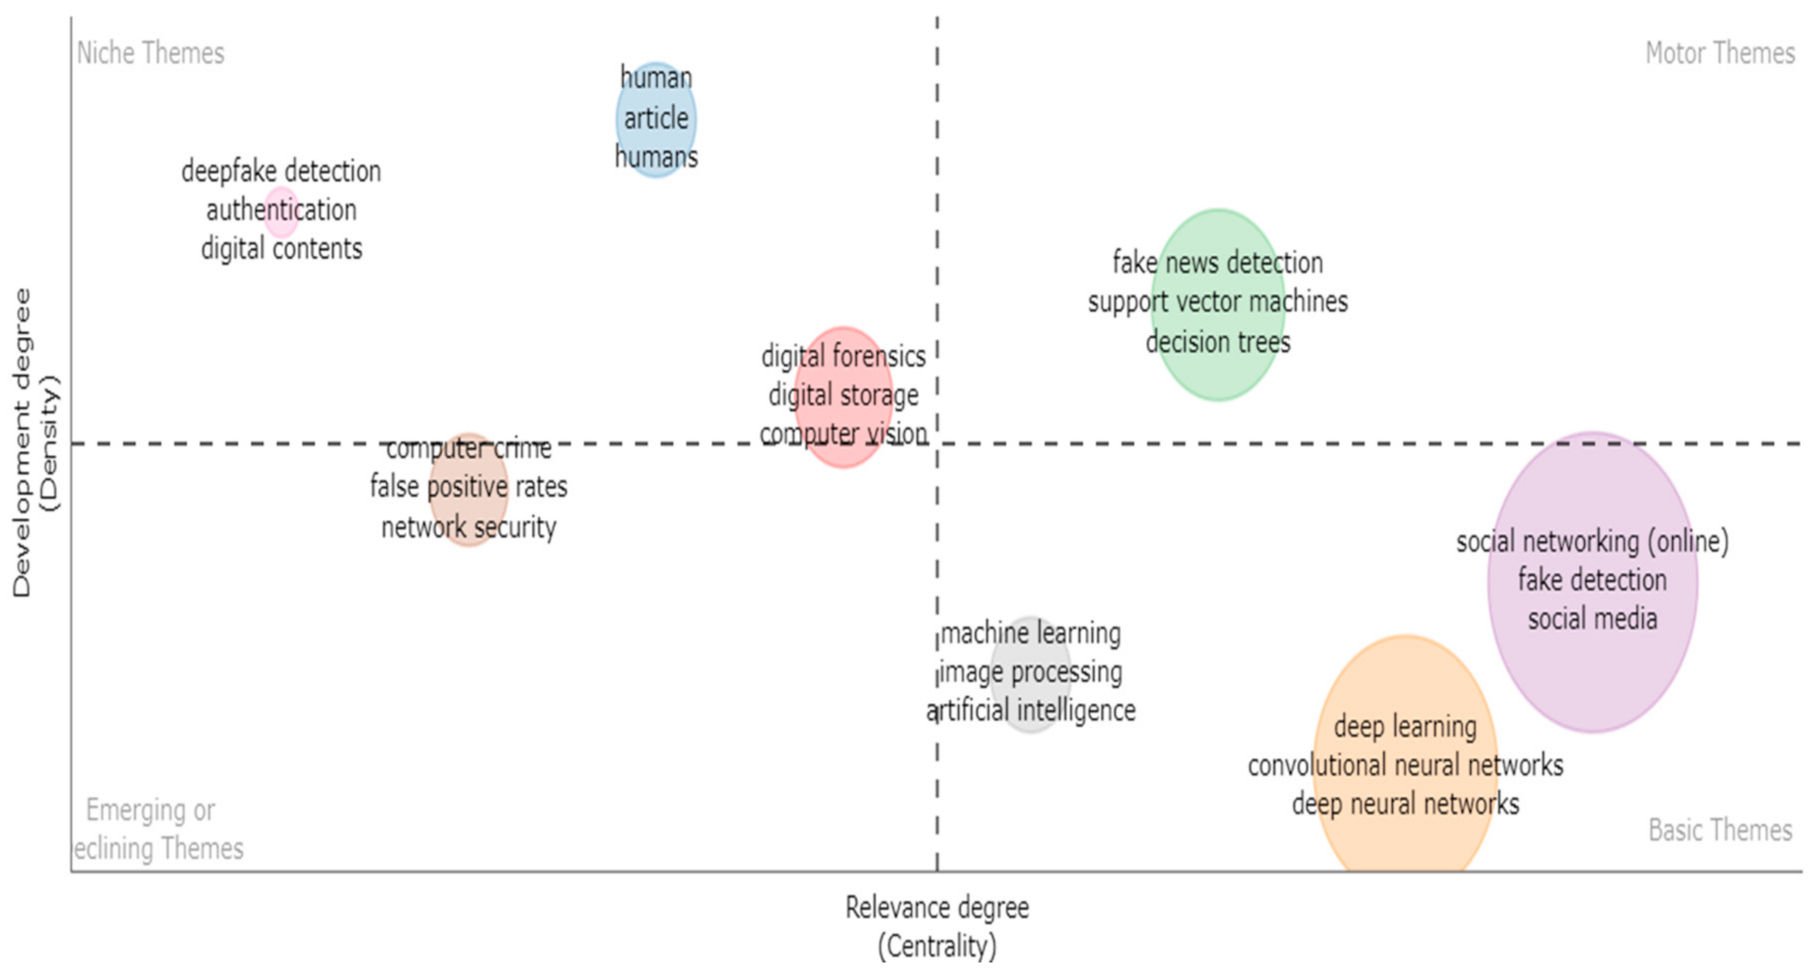
6.1.3. Thematic Map
A thematic map is a two-dimensional plot that depicts the typological themes [60,61,71]. Keyword clusters are identified using co-word analysis, resulting in themes in the research domain. On a two-dimensional network where centrality and density serve as the two dimensions, these motifs can be divided into four quadrants. Each theme is represented on the graph by a bubble in the map (Figure 18). Fake news identification, support vector machines, and decision trees were the topics addressed most frequently, and they had the largest density and centrality in the upper right quadrant of the diagram. Social media, social networking (online), fake detection, and convolutional neural networks were basic themes in the lower right quadrant, indicating important but underdeveloped areas. The upper left quadrant represented niche themes, such as deep fake detection, digital contents, digital forensics, computer vision, and human articles, which were well developed, but weak and of marginal significance in terms of external ties. Computer crime was located on the dividing line between the second and third quadrants. Despite its importance, network security was underdeveloped, representing both emerging and declining ties.
6.1.4. Factorial Analysis
Bibliometrix examines terms from article titles and abstracts in addition to keywords Through the use of network analysis, correspondence analysis (CA), and multiple correspondence analysis (MCA) [70,71,72,73]. CA and MCA depict the conceptual structure in a two-dimensional layout (Figure 19).
Deep learning, social networking, fake detection, social media, information classif-cation, learning system, recurrent neural network, convolutional neural network, deep neural network, fake news, natural language processing system, feature extraction, learning model, social media platform, state of the art, semantics, sentiment analysis, embedding, machine learning, news, articles, transfer learning, and network architecture were all covered by Cluster 1 (red). These keywords are associated with deep learning techniques for natural language processing and the detection of fake news. Cluster 2 (blue) introduced concepts such as support vector machine, decision tree, machine learning, and COVID-19. These terms refer to machine learning techniques for detecting COVID-19-related news.
7. Intellectual Structure
By analyzing the interactions between writers and nations, the intellectual structure enables developing deductions about how various authors influence the scientific community. Collaboration of the research fraternity, as well as the affiliations of these groups with various institutions, can be derived from an analysis of citations and co-citations.
7.1. Bibliographic Coupling with Countries
Co-citations and bibliographic coupling are the opposites of each other. Two publications are bibliographically coupled if there is a third publication that is cited by both publications. In other words, “bibliographic coupling” refers to the practice of two studies citing a third publication in their bibliographies. This refers to an overlap in the reference lists of publications. A stronger bibliographic coupling between two publications indicates that they share more references. The Create Map Wizard in VOSviewer allows creating a bibliographic coupling map using documents, sources, authors, organizations, and countries [37]. Since the theme clusters in this situation are created by the citing publications, canonical symbiosis can make specialized and current articles more noticeable (unlike co-citation analysis). The analysis, thus, captures the current condition of the research area.
7.2. Document X Citations
The number of citations and document magnitude for each country were both set to 50; only 28 of the 91 countries met these requirements. For each of the 28 countries, the overall strength of the bibliographic coupling ties with other nations was determined (Table 6 and Figure 20).
India had the most articles written, followed by the United States, China, Pakistan, and South Korea. The United States, Italy, India, China, South Korea, and Pakistan received the most citations. The cluster analysis revealed five groups of countries.
7.3. Co-Citation Analysis
Co-citation is the process of citing two documents frequently together in other papers. These documents are said to be co-cited if at least one other document cites both of them [36]. A superior co-citation potency of two documents indicates a greater likelihood of them being semantically related, thus receiving more co-citations. This allows us to highlight subfields and emerging research fronts in the research field, as well as their connections with other specialties. Co-citations of papers are used to conduct searches on related documents. When collection administrators build core journal lists, select journals, and evaluate collections, journal co-citation is crucial. The intellectual structure of a study domain was analyzed using author co-citation analysis [74,75]. The unit of analysis for co-citation analysis can be cited references, cited sources, or cited authors. Figure 21 depicts the connections among sources in six clusters. In the VOSviewer visualization, each circle represents a source [58]. More sources are considered to match the analysis criteria when the circle is larger. In this instance, the required minimum of 20 citations for a source was met by 78 of the 9902 sources. The total potency of the co-citation links with the other 78 sources was evaluated for each case. IEEE Access had 256 citations and 1880 total links, followed by Expert Systems with Applications with 112 citations and 996 total links.
Co-Citation Author
Figure 22 depicts the relationships among three clusters of authors. A total of 158 out of the 20,369 authors had at least 50 citations, satisfying the criterion. For each of the 158 authors, the co-citation link strength was calculated.
This visualization was created by VOSviewer, where each circle represents a different author. A circle’s proximity is correlated with the strength of its linkage. In this analysis, Liu H (the red cluster) was determined to be consist of the authors with the greatest impact with 394 citations, followed by Li Y (the green cluster) with 225 citations, and Zeng L with 52 citations.
8. Social Structure
The social structure of the field of false news detection exposes the relationships among authors, institutions, or nations [60].
8.1. Collaboration Network
Research collaboration has gained popularity over the past few decades [76]. Some evidence for increased research collaboration can be found in the observed rise in co-authorship. Researchers work together for a variety of reasons, such as the need to solve challenging research problems, the desire to advance knowledge and productivity in the area, the need to cut costs associated with their work, and the need for intellectual stimulation [77,78]. As research methods and theories have become increasingly complex, scholars have begun collaborating more frequently [79]. Research can be improved by collaboration among scholars; for example, different perspectives can provide greater clarity and deeper insight. Collaboration among authors can inevitably result in collaboration among institutions and nations, as depicted in the figures below.
8.1.1. Author-Wise Collaboration
The most typical form of social organization is a co-authorship arrangement. Co-authorship networks, in accordance with [27], enable the discovery of communities of regular and significant writers, pertinent institutions in a specific study field, regional collaboration, and more. The network of co-authorship relationships among the authors of publications or those who have collaborated with them is shown in Figure 23. Author clusters with strong co-authorship ties are color-coded.
The Biblioshiny app employs Walktrap as a clustering algorithm to generate the abovementioned diagram. Each node represents a researcher, and clusters are formed by grouping these nodes. Connecting lines between nodes and clusters indicate a co-authorship relationship. Liu H, Chen H, Zhang H, Cui L, Li F, and Li J formed a cluster (red) and collaborated with the authors of the blue cluster, Wang Y, Li X, Zhang Y, Du J, Gao J, Ma F, and Wang H This blue cluster was connected to the orange cluster, which included Liu X, Liu Y, and Zhang X.
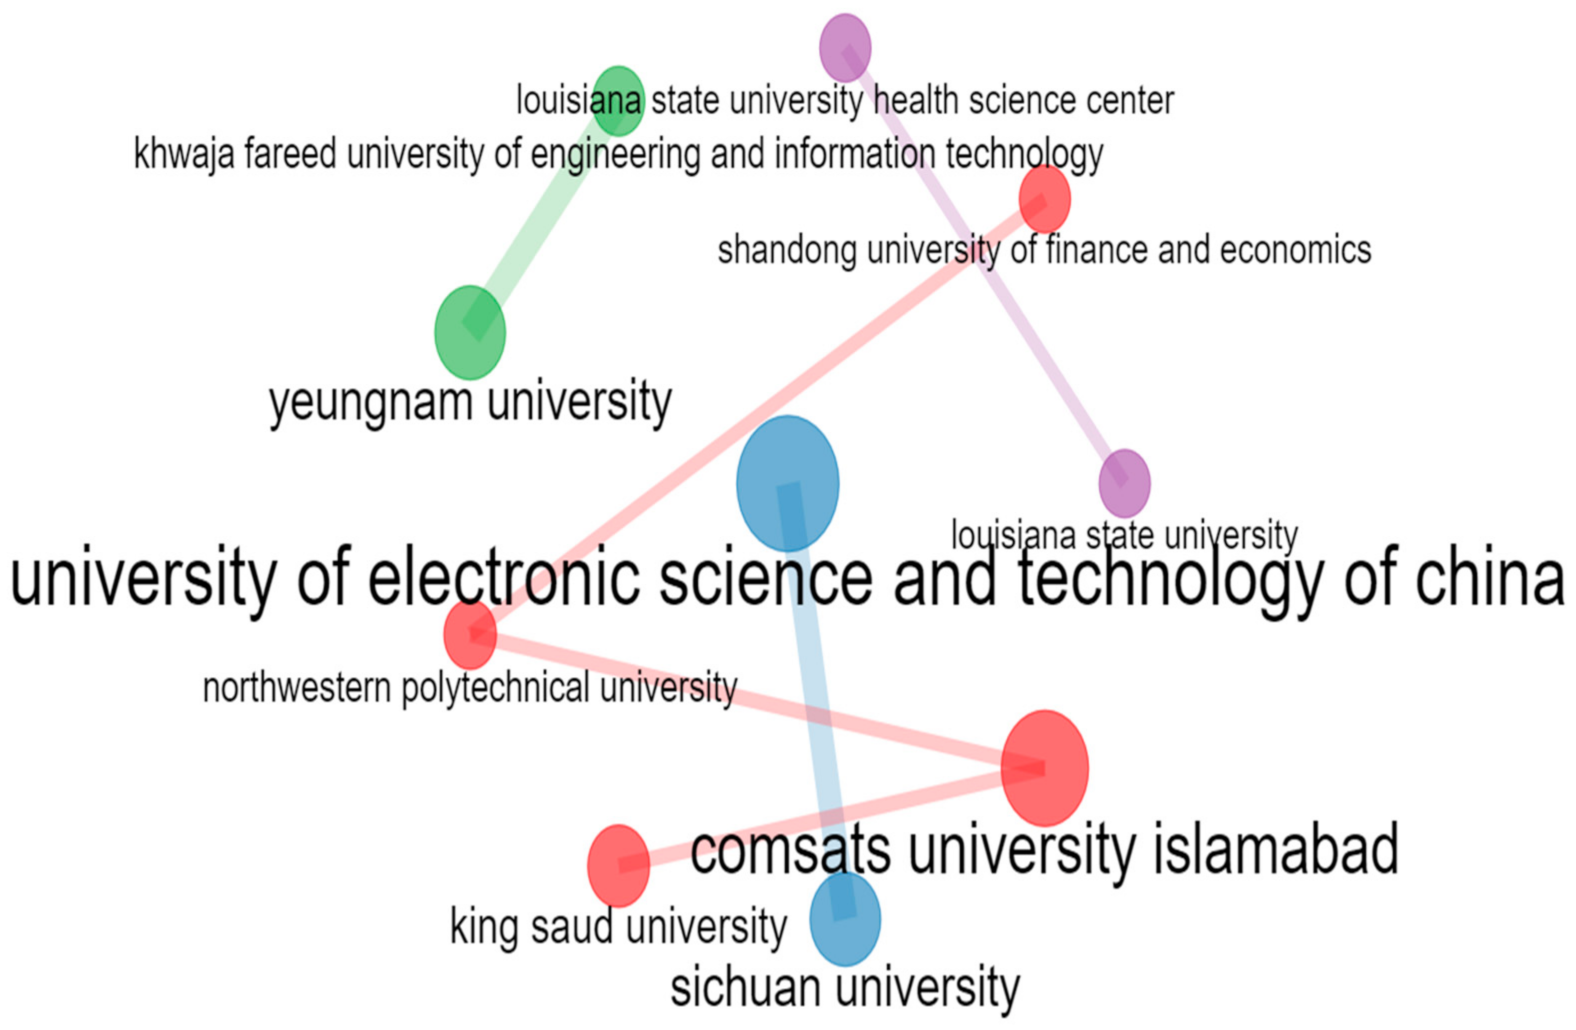
8.1.2. Institute-Wise Collaboration
The word collaboration implies that a group of independent researchers are working together to accomplish a common objective. Collaboration between institutions enables researchers to interact with peers who are experts in a particular field of study, gain access to necessary resources such as databases, staff, equipment, and study populations, and gain credibility from the well-known names of eminent researchers, departments, and institutions [32].
When addressing research questions, the practice of collaborating with teams from various institutions can provide new perspectives. Collaboration between institutions offers a way to grow one’s network of research contacts, which could eventually result in additional collaboration. Figure 24 depicts the network of affiliations among institutes that have co-authored articles. Author clusters with strong network connections are color-coded. Clear collaborations could be observed among Comsats University Islamabad, King Saud University, Northwestern Polytechnical University, and Shandong University of Finance and Economics, as they were all included in the same cluster (red).
8.2. Collaboration World Map
International collaboration in academic research is becoming more common. Researchers are contacting their peers all over the world, which is beneficial to their work, whether it is to acquire specialized equipment, develop new ideas, or gain access to new funding sources [80]. During the pandemic, scientists and researchers across borders and disciplines came together in inspiring ways. In Figure 25, it can be seen how the world is working together to combat fake news.
This diagram was generated using Biblioshiny, an online application that offers a Bibliometrix web interface. Mathematically, an edge in a network (or graph) refers to a connection between two nodes (or vertices). In this instance, the country serves as the node, and the cooperation between two countries serves as the edge. The minimum edge frequency was set to two. Table 7 illustrates some of the collaborations. The US and China had the most collaboration links (n = 13), followed by India and Australia (n = 3), and China and Italy (n = 2).
9. Conclusions and Future Directions
Fake news has a negative impact on politics, health, and the economy. A bibliometric analysis was used in this paper to visualize studies on fake news detection using a deep learning approach between 2012 and mid-2022. The Bibliometrix R-package and VOSviewer were chosen as tools for this work due to their adaptability and user-friendliness. Other bibliometric databases, such as Scopus, Web of Science, PubMed, and DBLP, are also available; some are free, while others require a subscription. As real-time mapping was provided; individuals often use Google Scholar for this purpose, but there is no way to check for predatory journals on Google Scholar. A research article’s profile is also impacted if it cites a phony journal. When a phony journal is cited in a research article, its reputation suffers. The formal organization, excellent research sources, software compatibility, and access to the Scopus database were considered in generating the dataset for this study. The findings of this study demonstrate that the investigative industry is still young and that it has made more contributions since the 2016 presidential campaign, when the term “fake news” was first coined. In recent years, the proliferation of articles, particularly on fake news, demonstrates that fake news detection has taken center stage in scholarly attention. India has produced the most articles on this topic in the world. IEEE Access is the most popular journal for researchers looking for high-quality papers, while the number of publications in the ACM International Conference Proceeding Series has rapidly increased since 2016. There was an increase in publishing across the board after COVID-19, when the internet was overflowing with information. As a result, an interdisciplinary study domain emerged. Deep learning, fake news detection, social media, natural language processing, LSTM, and deep fake were prominent keywords. Furthermore, aspiring researchers can identify new research opportunities by examining publication trends in terms of keywords, authors, citations, sources, and countries, high-impact publications by highly regarded authors, international collaboration, and thematic progression using bibliometric analysis. Insight into future research questions can also be provided by using co-occurring keywords in titles and abstracts, thus also benefiting future researchers.
Because this bibliometric study only considered Scopus, there is still room for improvement. Articles from the Science Citation Index may also be used in future research. Another limitation of this study is that the results were limited to the keywords listed in Section 4.2. To include more articles relevant to this subject in the study, the keyword search could be expanded to include more keywords. Because this study was strictly correlational and quantitative in nature, its conclusions may be strengthened by qualitative analysis of articles via in-depth reading of the entire text for a more comprehensive understanding of the research topic. To overcome the black-box nature of AI systems, several researchers have become interested in using explainable artificial intelligence (XAI) to provide explanations for predictions. Future research may look into and evaluate XAI’s role in deep learning-based natural language processing.
Author Contributions
Conceptualization, P.D. and A.K.; methodology, P.D. and A.K.; software, A.K. and C.I.; validation, P.D. and S.K.M.; formal analysis, P.D. and A.K.; investigation, C.I. and S.K.M.; resources, A.K. and S.K.M.; data curation, C.I. and S.K.M.; writing—original draft preparation, P.D.; writing—review and editing, P.D., A.K., C.I. and S.K.M.; visualization, P.D.; supervision, A.K.; project administration, S.K.M. and C.I.; funding acquisition, C.I. All authors have read and agreed to the published version of the manuscript.
Funding
This research received no external funding.
Institutional Review Board Statement
Not applicable.
Informed Consent Statement
Not applicable.
Data Availability Statement
Not applicable.
Conflicts of Interest
The authors declare no conflict of interest.
Acronyms
| BERT | Bidirectional encoder representations from transformers |
| CNN | Convolutional neural network |
| DL | Deep learning |
| EAN | Entity-based attention network |
| LDA | Latent Dirichlet allocation |
| LIME | Local interpretable model-agnostic explanations |
| LSTM | Long short-term memory |
| ML | Machine learning |
| MLP | Multilayer perceptron |
| NFB | News embedding block |
| NLP | Natural language processing |
| VGG | Visual geometry group |
| XAI | Explainable artificial intelligence |
References
- Rajan, B. New Mythologies of Fake News. In Handbook of Research on Deception, Fake News, and Misinformation Online; IGI Global: Hershey, PA, USA, 2019; pp. 192–208. [Google Scholar] [CrossRef]
- Egelhofer, J.L.; Lecheler, S. Fake news as a two-dimensional phenomenon: A framework and research agenda. Ann. Int. Commun. Assoc. 2019, 43, 97–116. [Google Scholar] [CrossRef]
- Lahby, M.; Yassine, M. Combating Fake News with Computational Intelligence Techniques; Springer: Berlin/Heidelberg, Germany, 2022; Volume 1001. [Google Scholar] [CrossRef]
- Sharma, S.; Sharma, D.K. Fake News Detection: A Long Way to Go. In Proceedings of the 2019 4th International Conference on Information Systems and Computer Networks (ISCON), Mathura, India, 21–22 November 2019; pp. 816–821. [Google Scholar] [CrossRef]
- Bran, R.; Tiru, L.; Grosseck, G.; Holotescu, C.; Malita, L. Learning from each other—A bibliometric review of research on information disorders. Sustainability 2021, 13, 94. [Google Scholar] [CrossRef]
- Sharma, D.K.; Garg, S.; Shrivastava, P. Evaluation of Tools and Extension for Fake News Detection. In Proceedings of the 2021 International Conference on Innovative Practices in Technology and Management (ICIPTM), Noida, India, 17–19 February 2021; pp. 227–232. [Google Scholar] [CrossRef]
- Al-Zaman, M.S. COVID-19-Related Social Media Fake News in India. J. Media 2021, 2, 100–114. [Google Scholar] [CrossRef]
- Zhang, X.; Ghorbani, A.A. An overview of online fake news: Characterization, detection, and discussion. Inf. Process. Manag. 2020, 57, 102025. [Google Scholar] [CrossRef]
- Agarwal, S.; Farid, H. Detecting Deep-Fake Videos from Aural and Oral Dynamics. In Proceedings of the IEEE/CVF Conference on Computer Vision and Pattern Recognition (CVPR) Workshops, Nashville, TN, USA, 19–25 June 2021; pp. 981–989. [Google Scholar] [CrossRef]
- Bonkra, A.; Dhiman, P. IoT Security Challenges in Cloud Environment. In Proceedings of the 2021 2nd International Conference on Computational Methods in Science & Technology (ICCMST), Mohali, India, 17–18 December 2021; pp. 30–34. [Google Scholar] [CrossRef]
- Farooq, G. Politics of fake news: How WhatsApp became a potent propaganda tool in India. Media Watch 2018, 9, 106–117. [Google Scholar] [CrossRef]
- Clarke, J.; Chen, H.; Du, D.; Hu, Y.J. Fake news, investor attention, and market reaction. Inf. Syst. Res. 2021, 32, 35–52. [Google Scholar] [CrossRef]
- Ramezani, M.; Rafiei, M.; Omranpour, S.; Rabiee, H.R. News Labeling as Early as Possible: Real or Fake? In Proceedings of the 2019 IEEE/ACM International Conference on Advances in Social Networks Analysis and Mining (ASONAM), Vancouver, BC, Canada, 27–30 August 2019; pp. 536–537. [Google Scholar] [CrossRef]
- Osatuyi, B.; Hughes, J. A Tale of Two Internet News Platforms-Real vs. Fake: An Elaboration Likelihood Model Perspective. In Proceedings of the 51st Hawaii International Conference on System Sciences, Hilton Waikoloa Village, HI, USA, 3 January 2018; Volume 2018, pp. 3986–3994. [Google Scholar] [CrossRef]
- Wang, Z.; Zhao, H.; Nie, H. Bibliometric Analysis of Rumor Propagation Research Through Web of Science from 1989 to 2019. J. Stat. Phys. 2020, 178, 532–551. [Google Scholar] [CrossRef]
- Allcott, H.; Gentzkow, M. Social media and fake news in the 2016 election. J. Econ. Perspect. 2017, 31, 211–236. [Google Scholar] [CrossRef]
- Pool, J.; Fatehi, F.; Akhlaghpour, S. Infodemic, misinformation and disinformation in pandemics: Scientific landscape and the road ahead for public health informatics research. In Public Health and Informatics; IOS Press: Amsterdam, The Netherlands, 2021; pp. 764–768. [Google Scholar] [CrossRef]
- Wang, Y.; McKee, M.; Torbica, A.; Stuckler, D. Systematic Literature Review on the Spread of Health-related Misinformation on Social Media. Soc. Sci. Med. 2019, 240, 112552. [Google Scholar] [CrossRef]
- Lee, S.; Nah, K. A Counterattack of Misinformation: How the Information Influence to Human Being. In Intelligent Human Systems Integration; AISC, no. Ihsi; Springer: Cham, Switzerland, 2020; Volume 1131, pp. 600–604. [Google Scholar] [CrossRef]
- WHO. Fighting Misinformation in the Time of COVID-19, One Click at a Time; World Health Organisation (WHO): Geneva, Switzerland, 2021. Available online: https://www.who.int/news-room/feature-stories/detail/fighting-misinformation-in-the-time-of-covid-19-one-click-at-a-time (accessed on 11 January 2022).
- Sehgal, V.; Peshin, A.; Afroz, S.; Farid, H. Mutual Hyperlinking Among Misinformation Peddlers. arXiv 2021, arXiv:2104.11694. Available online: http://arxiv.org/abs/2104.11694 (accessed on 30 March 2022).
- Fake Online News Spreads Through Social Echo Chambers—Scientific American. Available online: https://www.scientificamerican.com/article/fake-online-news-spreads-through-social-echo-chambers/ (accessed on 14 March 2022).
- Rs.10 Coins Pile up as Rumours Take Toll—The Hindu. Available online: https://www.thehindu.com/news/national/tamil-nadu//article60625912.ece (accessed on 21 August 2022).
- During the 2019 Lok Sabha Elections, Only about 150 Cases of Fake News Reported to Social Media Platforms by ECI. Available online: https://factly.in/during-the-2019-lok-sabha-elections-only-about-150-cases-of-fake-news-reported-to-social-media-platforms-by-eci/ (accessed on 24 February 2022).
- Vosoughi, S.; Roy, D.; Aral, S. The spread of true and false news online. Science 2018, 359, 1146–1151. [Google Scholar] [CrossRef]
- Ley, M. The DBLP computer science bibliography: Evolution, research issues, perspectives. In International Symposium on String Processing and Information Retrieval; Lecture Notes in Computer Science; Springer: Berlin/Heidelberg, Germany, 2002; Volume 2476, pp. 1–10. [Google Scholar] [CrossRef]
- Biryukov, M.; Dong, C. Analysis of computer science communities based on DBLP. In International Conference on Theory and Practice of Digital Libraries; Lecture Notes in Computer Science; Springer: Berlin/Heidelberg, Germany, 2010; Volume 6273, pp. 228–235. [Google Scholar] [CrossRef]
- Pranckutė, R. Web of science (Wos) and scopus: The titans of bibliographic information in today’s academic world. Publications 2021, 9, 12. [Google Scholar] [CrossRef]
- Donthu, N.; Kumar, S.; Mukherjee, D.; Pandey, N.; Lim, W.M. How to conduct a bibliometric analysis: An overview and guidelines. J. Bus. Res. 2021, 133, 285–296. [Google Scholar] [CrossRef]
- Chen, C.; Dubin, R.; Schultz, T. Science Mapping. Encycl. Inf. Sci. Technol. Third Ed. 2014, 10, 4171–4184. [Google Scholar] [CrossRef]
- Aria, M.; Cuccurullo, C. bibliometrix: An R-tool for comprehensive science mapping analysis. J. Informetr. 2017, 11, 959–975. [Google Scholar] [CrossRef]
- Moral-Muñoz, J.A.; Herrera-Viedma, E.; Santisteban-Espejo, A.; Cobo, M.J. Software tools for conducting bibliometric analysis in science: An up-to-date review. Prof. De La Inf. 2020, 29, 1–20. [Google Scholar] [CrossRef]
- Chen, C. Nova Science Publishers: Hauppauge, NY, USA. 2016. Available online: http://cluster.cis.drexel.edu/~cchen/citespace/books/ (accessed on 3 May 2022).
- Zardari, S.; Alam, S.; Al Salem, H.; Al Reshan, M.; Shaikh, A.; Malik, A.K.; Ur Rehman, M.M.; Mouratidis, H. A Comprehensive Bibliometric Assessment on Software Testing (2016–2021). Electronics 2022, 11, 1984. [Google Scholar] [CrossRef]
- Cobo, M.J.; Lõpez-Herrera, A.G.; Herrera-Viedma, E.; Herrera, F. SciMAT: A new science mapping analysis software tool. J. Am. Soc. Inf. Sci. Technol. 2012, 63, 1609–1630. [Google Scholar] [CrossRef]
- López-Robles, J.R.; Cobo, M.J.; Gutiérrez-Salcedo, M.; Martínez-Sánchez, M.A.; Gamboa-Rosales, N.K.; Herrera-Viedma, E. 30th Anniversary of Applied Intelligence: A combination of bibliometrics and thematic analysis using SciMAT. Appl. Intell. 2021, 51, 6547–6568. [Google Scholar] [CrossRef]
- Van Eck, N.J.; Waltman, L. VOSviewer Manual; Univeristeit Leiden: Leiden, The Netherlands, 2013; Available online: http://www.vosviewer.com/documentation/Manual_VOSviewer_1.6.1.pdf (accessed on 15 June 2022).
- Ireton, C.; Posetti, J. Journalism, ‘Fake News’ & Disinformation; United Nations Educational, Scientific and Cultural Organization: Paris, France, 2018.
- Islam, M.R.; Liu, S.; Wang, X.; Xu, G. Deep learning for misinformation detection on online social networks: A survey and new perspectives. Soc. Netw. Anal. Min. 2020, 10, 1–20. [Google Scholar] [CrossRef]
- Ilie, V.I.; Truica, C.O.; Apostol, E.S.; Paschke, A. Context-Aware Misinformation Detection: A Benchmark of Deep Learning Architectures Using Word Embeddings. IEEE Access 2021, 9, 162122–162146. [Google Scholar] [CrossRef]
- Nightingale, S.; Farid, H. Examining the Global Spread of COVID-19 Misinformation. 2020, pp. 1–12. Available online: http://arxiv.org/abs/2006.08830 (accessed on 13 July 2022).
- Lai, C.M.; Chen, M.H.; Kristiani, E.; Verma, V.K.; Yang, C.T. Fake News Classification Based on Content Level Features. Appl. Sci. 2022, 12, 1116. [Google Scholar] [CrossRef]
- Kaur, G.; Kaur, P.A.; Khurana, M. A Review of Opinion Mining Techniques. ECS Trans. 2022, 107, 10125. [Google Scholar] [CrossRef]
- Kumari, R.; Ashok, N.; Ghosal, T.; Ekbal, A. What the fake? Probing misinformation detection standing on the shoulder of novelty and emotion. Inf. Process. Manag. 2022, 59, 102740. [Google Scholar] [CrossRef]
- Rangra, K.; Kapoor, M. Exploring the mel scale features using supervised learning classifiers for emotion classification. Int. J. Appl. Pattern Recognit. 2021, 6, 232. [Google Scholar] [CrossRef]
- Choudhary, M.; Chouhan, S.S.; Pilli, E.S.; Vipparthi, S.K. BerConvoNet: A deep learning framework for fake news classification. Appl. Soft Comput. 2021, 110, 107614. [Google Scholar] [CrossRef]
- Liu, J.; Wang, C.; Li, C.; Li, N.; Deng, J.; Pan, J.Z. DTN: Deep triple network for topic specific fake news detection. J. Web Semant. 2021, 70, 100646. [Google Scholar] [CrossRef]
- Szczepański, M.; Pawlicki, M.; Kozik, R.; Choraś, M. New explainability method for BERT-based model in fake news detection. Sci. Rep. 2021, 11, 1–13. [Google Scholar] [CrossRef]
- Dieber, J.; Kirrane, S. Why model why? Assessing the strengths and limitations of LIME. no. iii. 2020. Available online: http://arxiv.org/abs/2012.00093 (accessed on 2 May 2022).
- Mehta, D.; Dwivedi, A.; Patra, A.; Kumar, M.A. A transformer-based architecture for fake news classification. Soc. Netw. Anal. Min. 2021, 11, 39. [Google Scholar] [CrossRef]
- Nguyen, T.; Nguyen, Q.H.; Nguyen, D.; Nguyen, D.; Huynh-The, T.; Nahavandi, S.; Nguyen, T.; Pham, Q.-V.; Nguyeng, C. Deep Learning for Deepfakes Creation and Detection: A Survey. SSRN Electron. J. 2022, 223, 103525. [Google Scholar] [CrossRef]
- Borrelli, C.; Bestagini, P.; Antonacci, F.; Sarti, A.; Tubaro, S. Synthetic speech detection through short-term and long-term prediction traces. Eurasip J. Inf. Secur. 2021, 2021, 2. [Google Scholar] [CrossRef]
- Khalid, H.; Kim, M.; Tariq, S.; Woo, S.S. Evaluation of an Audio-Video Multimodal Deepfake Dataset using Unimodal and Multimodal Detectors. In Proceedings of the ADGD 2021—Proceedings of the 1st Workshop on Synthetic Multimedia—Audiovisual Deepfake Generation and Detection, New York, NY, USA, 24 October 2021; co-located with ACM MM 2021. pp. 7–15. [Google Scholar] [CrossRef]
- Zhou, X.; Wu, J.; Zafarani, R. SAFE: Similarity-Aware Multi-Modal Fake News Detection; Springer International Publishing: Berlin/Heidelberg, Germany, 2020. [Google Scholar] [CrossRef]
- Sharma, D.K.; Garg, S. IFND: A benchmark dataset for fake news detection. Complex Intell. Syst. 2021, 7, 2199–2210. [Google Scholar] [CrossRef]
- Singhal, S.; Shah, R.R.; Chakraborty, T.; Kumaraguru, P.; Satoh, S. SpotFake: A multi-modal framework for fake news detection. In Proceedings of the 2019 IEEE Fifth International Conference on Multimedia Big Data (BigMM), Singapore, 11–13 September 2019; pp. 39–47. [Google Scholar] [CrossRef]
- Singhal, S.; Kabra, A.; Sharma, M.; Shah, R.R.; Chakraborty, T.; Kumaraguru, P. SpotFake+: A Multimodal Framework for Fake News Detection via Transfer Learning (Student Abstract). In Proceedings of the AAAI Conference on Artificial Intelligence, New York, NY, USA, 7–12 February 2020; pp. 13915–13916. [Google Scholar] [CrossRef]
- Van Eck, N.J.; Waltman, L. Software survey: VOSviewer, a computer program for bibliometric mapping. Scientometrics 2010, 84, 523–538. [Google Scholar] [CrossRef]
- Schotten, M.; Meester, W.J.; Steiginga, S.; Ross, C.A. A Brief History of Scopus: The World’s Largest Abstract and Citation Database of Scientific Literature. In Research Analytics, 1st ed.; Cantu-Ortiz, F.J., Ed.; Auerbach Publications: New York, NY, USA, 2017; p. 28. [Google Scholar] [CrossRef]
- Castañeda, K.; Sánchez, O.; Herrera, R.F.; Mejía, G. Highway Planning Trends: A Bibliometric Analysis. Sustainability 2022, 14, 5544. [Google Scholar] [CrossRef]
- Chughtai, G.R.; Lee, J.; Khan, M.M.A.; Abbasi, R.; Kabir, A.; Hassan, M.A.S. Global citation impact rather than citation count. Int. J. Adv. Comput. Sci. Appl. 2018, 9, 246–253. [Google Scholar] [CrossRef]
- Massimo Aria, C.C. bibliometrix. 2022. Available online: https://cran.r-project.org/web/packages/bibliometrix/bibliometrix.pdf (accessed on 23 October 2022).
- DePaolo, C.A.; Wilkinson, K. Get Your Head into the Clouds: Using Word Clouds for Analyzing Qualitative Assessment Data. TechTrends 2014, 58, 38–44. [Google Scholar] [CrossRef]
- Zhang, J.; Yu, Q.; Zheng, F.; Long, C.; Lu, Z.; Duan, Z. Comparing keywords plus of WOS and author keywords: A case study of patient adherence research. J. Assoc. Inf. Sci. Technol. 2016, 67, 967–972. [Google Scholar] [CrossRef]
- Tripathi, M.; Kumar, S.; Sonker, S.K.; Babbar, P. Occurrence of author keywords and keywords plus in social sciences and humanities research: A preliminary study. COLLNET J. Sci. Inf. Manag. 2018, 12, 215–232. [Google Scholar] [CrossRef]
- Garfield, E. KeyWords Plus: ISI’s Breakthrough Retrieval Method. Part 1. Expanding Your Searching Power. Curr. Contents Disk. 1990, 32, 3–7. [Google Scholar]
- Meho, L.I.; Rogers, Y. Citation counting, citation ranking, and h-index of human-computer interaction researchers: A comparison of scopus and web of science. J. Am. Soc. Inf. Sci. Technol. 2008, 59, 1711–1726. [Google Scholar] [CrossRef]
- Noyons, E.C.M.; Moed, H.F.; Van Raan, A.F.J. Integrating research performance analysis and science mapping. Scientometrics 1999, 46, 591–604. [Google Scholar] [CrossRef]
- Aria, M.; Cuccurullo, C. Science Mapping Analysis with Bibliometrix R-Package: An Example Install and Load Bibliometrix R-Package. 2022, pp. 2007–2017. Available online: https://bibliometrix.org/documents/bibliometrix_Report.html#section-1-descriptive-analysis (accessed on 17 March 2022).
- Cobo, M.J.; Jürgens, B.; Herrero-Solana, V.; Martínez, M.A.; Herrera-Viedma, E. Industry 4.0: A perspective based on bibliometric analysis. Procedia Comput. Sci. 2018, 139, 364–371. [Google Scholar] [CrossRef]
- Bhatt, K.; Seabra, C.; Kabia, S.K.; Ashutosh, K.; Gangotia, A. COVID Crisis and Tourism Sustainability: An Insightful Bibliometric Analysis. Sustainability 2022, 14, 12151. [Google Scholar] [CrossRef]
- Kaushal, C.; Refat, M.A.R.; Amin, M.A.; Islam, M.K. Comparative Micro Blogging News Analysis on the COVID-19 Pandemic Scenario. Lecture Notes in Networks and Systems. In Proceedings of the International Conference on Data Science and Applications, Kolkata, India, 10–11 April 2021; Volume 148, pp. 241–248. [Google Scholar]
- Surwase, G.; Sagar, A.; Kademani, B.S.; Bhanumurthy, K. Co-citation Analysis: An Overview. In Proceedings of the Beyond Librarianship: Creativity, Innovation and Discovery, Mumbai, India, 16–17 September 2011; p. 9. [Google Scholar]
- Jeong, Y.K.; Song, M.; Ding, Y. Content-based author co-citation analysis. J. Informetr. 2014, 8, 197–211. [Google Scholar] [CrossRef]
- Katz, J.S.; Martin, B.R. What is research collaboration? Res. Policy 1997, 26, 1–18. [Google Scholar] [CrossRef]
- Lewis, Y. Research collaborations bring big rewards: The world needs more. Nature 2021, 594, 301–302. [Google Scholar] [CrossRef]
- Huang, J.S. An Interpersonal Perspective for Research Capacity Building. J. Res. Adm. 2014, 42, 89–112. [Google Scholar]
- Michailidis, P.D. Visualizing Social Media Research in the Age of COVID-19. Information 2022, 13, 372. [Google Scholar] [CrossRef]
- Bansal, S.; Mahendiratta, S.; Kumar, S.; Sarma, P.; Prakash, A.; Medhi, B. Collaborative research in modern era: Need and challenges. Indian J. Pharmacol. 2019, 51, 137–139. [Google Scholar] [CrossRef]
- Aria, M.; Alterisio, A.; Scandurra, A.; Pinelli, C.; D’Aniello, B. The scholar’s best friend: Research trends in dog cognitive and behavioral studies. Anim. Cogn. 2021, 24, 541–553. [Google Scholar] [CrossRef]
Figure 1.
Timeline: many instances of fake news proliferation.

Figure 2.
DL in news classification.

Figure 3.
Research methodology.

Figure 4.
Bibliometric analysis: aspects.

Figure 5.
Descriptive analysis.

Figure 6.
Annual scientific production.

Figure 7.
Three-field plot.

Figure 8.
Relevant sources.

Figure 9.
Local cited sources.

Figure 10.
Dynamics of sources.

Figure 11.
Relevant affiliations.

Figure 12.
Country’s production over time.

Figure 13.
Global citations.

Figure 14.
Word cloud: (a) keywords plus; (b) authors’ keywords.

Figure 15.
TreeMap.

Figure 16.
Trend topics.

Figure 17.
Keyword co-occurrence network.

Figure 18.
Thematic map.

Figure 19.
Factorial analysis.

Figure 20.
Document X citations.

Figure 21.
Co-citation sources.

Figure 22.
Co-citation authors.

Figure 23.
Network of co-authorship relationships among authors of publications.

Figure 24.
Co-authorship relationships among institutes.

Figure 25.
Worldwide collaboration.


Table 1.
Dataset summary.
| Description | Results |
|---|---|
| Main Information about Data | |
| Timespan | 2012–2022 |
| Sources (journals, books, etc.) | 358 |
| Documents | 569 |
| Annual growth rate % | 59.71 |
| Document average age | 1.55 |
| Average citations per document | 10.52 |
| References | 19,963 |
| Document Contents | |
| Keywords plus (ID) | 2779 |
| Authors’ keywords (DE) | 1150 |
| Authors | 1678 |
| Authors of single-authored documents | 20 |
| Author Collaboration | |
| Single-authored documents | 37 |
| Co-authors per document | 3.52 |
| International co-authorships % | 18.1 |
| Document Types | |
| Article | 238 |
| Conference paper | 294 |
| Conference review | 18 |
| Data paper | 3 |
| Review | 16 |
Table 2.
Annual total citation per year.
| Year | N | MeanTCperArt | MeanTCperYear | CitableYears |
|---|---|---|---|---|
| 2012 | 1 | 135.00 | 13.50 | 10 |
| 2013 | 0 | 0.00 | 0.00 | 0 |
| 2014 | 0 | 0.00 | 0.00 | 0 |
| 2015 | 1 | 36.00 | 5.14 | 7 |
| 2016 | 2 | 10.50 | 1.75 | 6 |
| 2017 | 13 | 89.62 | 17.92 | 5 |
| 2018 | 26 | 27.85 | 6.96 | 4 |
| 2019 | 69 | 25.17 | 8.39 | 3 |
| 2020 | 126 | 11.16 | 5.58 | 2 |
| 2021 | 223 | 3.29 | 3.29 | 1 |
| 2022 | 108 | 0.24 | 0 |
Table 3.
Country’s Scientific Production.
| Region | Publication Frequency |
|---|---|
| India | 398 |
| USA | 282 |
| China | 266 |
| Pakistan | 68 |
| Bangladesh | 62 |
| South Korea | 62 |
| Italy | 61 |
| Spain | 44 |
| Brazil | 35 |
| Australia | 34 |
| Germany | 32 |
| Iran | 32 |
| Canada | 31 |
| Saudi Arabia | 31 |
| France | 28 |
| Malaysia | 28 |
| UK | 28 |
| Sri Lanka | 23 |
| Greece | 19 |
| Turkey | 17 |
| Czech Republic | 16 |
| Egypt | 16 |
| Indonesia | 15 |
| Jordan | 15 |
| Romania | 15 |
Table 4.
Most cited countries.
| Country | TC | Average Article Citations |
|---|---|---|
| India | 559 | 10.35 |
| USA | 490 | 28.82 |
| Italy | 353 | 44.13 |
| China | 251 | 6.61 |
| Korea | 190 | 11.88 |
| Spain | 161 | 17.89 |
| Brazil | 153 | 51.00 |
| Greece | 81 | 16.20 |
| Australia | 79 | 19.75 |
| Pakistan | 58 | 6.44 |
| Georgia | 57 | 57.00 |
| United Kingdom | 39 | 13.00 |
| Czech Republic | 38 | 19.00 |
| Germany | 23 | 5.75 |
| Switzerland | 18 | 18.00 |
| Colombia | 14 | 7.00 |
| Malaysia | 14 | 4.67 |
| Saudi Arabia | 11 | 2.20 |
| Norway | 9 | 4.50 |
| Egypt | 7 | 1.75 |
| Iran | 7 | 0.88 |
| Canada | 6 | 3.00 |
| Belgium | 5 | 2.50 |
| Portugal | 4 | 2.00 |
| Thailand | 4 | 2.00 |
Table 5.
Top 10 authors’ keywords and keywords plus.
| Author’s Keyword | Keyword Plus | ||
|---|---|---|---|
| Terms | Frequency | Terms | Frequency |
| Deep learning | 275 | Deep learning | 436 |
| Fake news | 128 | Social networking (online) | 171 |
| Fake news detection | 102 | Fake detection | 139 |
| Machine learning | 99 | Social media | 115 |
| Natural language processing | 68 | Classification (of information) | 103 |
| Social media | 57 | Learning systems | 103 |
| Deep fake | 25 | Convolutional neural networks | 80 |
| LSTM | 24 | Long short-term memory | 79 |
| CNN | 23 | Deep neural networks | 78 |
| COVID-19 | 22 | Fake news | 72 |
Table 6.
Country connections in the literature.
| Country | Documents | Citations | Total Link Strength |
|---|---|---|---|
| India | 143 | 941 | 14,705 |
| China | 76 | 719 | 10,676 |
| United States | 85 | 2044 | 10,080 |
| Pakistan | 22 | 206 | 4866 |
| Italy | 19 | 987 | 3601 |
| Saudi Arabia | 17 | 36 | 2732 |
| Iran | 12 | 13 | 2664 |
| Australia | 13 | 167 | 2533 |
| Canada | 16 | 123 | 2318 |
| South Korea | 22 | 211 | 2272 |
Table 7.
Collaboration frequency at the global level.
| From | To | Frequency |
|---|---|---|
| Australia | Indonesia | 1 |
| Bangladesh | Australia | 2 |
| Bulgaria | Qatar | 2 |
| Canada | Netherlands | 1 |
| China | Hong Kong | 3 |
| China | Italy | 2 |
| China | Japan | 2 |
| China | United Kingdom | 4 |
| Czech Republic | Iraq | 1 |
| Egypt | Yemen | 2 |
| India | Australia | 3 |
| India | China | 3 |
| India | Czech Republic | 3 |
| India | Pakistan | 2 |
| India | Romania | 1 |
| India | Saudi Arabia | 2 |
| Pakistan | United Kingdom | 1 |
| Saudi Arabia | Egypt | 3 |
| Saudi Arabia | France | 1 |
| Spain | Poland | 1 |
| Turkey | Nigeria | 1 |
| United Kingdom | Japan | 1 |
| USA | Brazil | 1 |
| USA | China | 13 |
| USA | Colombia | 1 |
| USA | Germany | 1 |
| USA | Israel | 1 |
| USA | Korea | 2 |
Disclaimer/Publisher’s Note: The statements, opinions and data contained in all publications are solely those of the individual author(s) and contributor(s) and not of MDPI and/or the editor(s). MDPI and/or the editor(s) disclaim responsibility for any injury to people or property resulting from any ideas, methods, instructions or products referred to in the content. |
© 2023 by the authors. Licensee MDPI, Basel, Switzerland. This article is an open access article distributed under the terms and conditions of the Creative Commons Attribution (CC BY) license (https://creativecommons.org/licenses/by/4.0/).
Share and Cite
MDPI and ACS Style
Dhiman, P.; Kaur, A.; Iwendi, C.; Mohan, S.K. A Scientometric Analysis of Deep Learning Approaches for Detecting Fake News. Electronics 2023, 12, 948. https://doi.org/10.3390/electronics12040948
AMA Style
Dhiman P, Kaur A, Iwendi C, Mohan SK. A Scientometric Analysis of Deep Learning Approaches for Detecting Fake News. Electronics. 2023; 12(4):948. https://doi.org/10.3390/electronics12040948
Chicago/Turabian StyleDhiman, Pummy, Amandeep Kaur, Celestine Iwendi, and Senthil Kumar Mohan. 2023. "A Scientometric Analysis of Deep Learning Approaches for Detecting Fake News" Electronics 12, no. 4: 948. https://doi.org/10.3390/electronics12040948
Note that from the first issue of 2016, this journal uses article numbers instead of page numbers. See further details here.