Non-Intrusive Tank-Filling Sensor Based on Sound Resonance
by
 , , and
Adrián García
, 
Víctor Toral
,
Álvaro Márquez
,
Antonio García
 ,
,
Encarnación Castillo
,
Luis Parrilla
* and
Diego P. Morales
Department of Electronics and Computer Technology, University of Granada, 18071 Granada, Spain
*
Author to whom correspondence should be addressed.
Electronics 2018, 7(12), 378; https://doi.org/10.3390/electronics7120378
Submission received: 31 October 2018
/
Revised: 26 November 2018
/
Accepted: 29 November 2018
/
Published: 3 December 2018
(This article belongs to the Section Systems & Control Engineering)
Abstract
:Different types of fill-level measurement systems exist in the market, but most of them imply some type of intrusion in the tank itself. In this paper, a reconfigurable system based on sound resonance for measuring the fill-level of a tank from the exterior is presented. A relation between sound resonance frequencies and the content of the tank has been found, especially as the tank gets closer to being full. A prototype has been created using reconfigurable technologies combined with wireless communications in order to control the system from an ad hoc application. With this prototype, the fill-level of different tanks has been measured with good resolution, especially when the tank is over half of its capacity.
1. Introduction
The automatization of industries, such as those related to agriculture or food, is under permanent development. These industries require new technologies to improve their operations, whether it be for an increase in production or for security reasons [1]. In this context, accurate tank level monitoring is of special interest. There are many studies addressing this issue, with some based on the use of the fluid as a dielectric of two capacitor plates [2], and others using IR image processing [3] for detecting the tank level, or even based on the use of an optical fiber [4] whose signal is modulated according to the fluid level. Moreover, most of these methods require the introduction of part of the instrument into the tank and its direct interaction with the monitored fluid. In the case of thermal imaging, the cost of these systems makes them unpractical, as they require a thermal camera and intensive image processing computation [3]. Besides, the immersion of a probe in the liquid is, in many cases, unsuitable due to the measurement conditions (such as the presence of acids, high pressure or temperatures, corrosion, and contamination risks).
Other methods make use of radar or waveguides that are based on the reflection of signals in the liquid, as in References [5,6,7]. However, these systems are also expensive and need sophisticated technologies, and in the case of waveguides [7], they do not avoid the interaction between the content and the measuring system. Systems using capacitive arrays have also been developed for non-liquid contents like grain. For example, capacitive measurements are used in References [8,9] to measure the content flow and content level in pipes or tanks.
Acoustic signals and resonance are resources used in several works, such as in Reference [10], where a speaker and a microphone inside a pipe are used to measure the level of a tank. A Helmholtz resonator is used in Reference [11] to determine the liquid volume inside the tank. In Reference [12], the tank response to an acoustic excitation is used as a measurement of the level and density of the content.
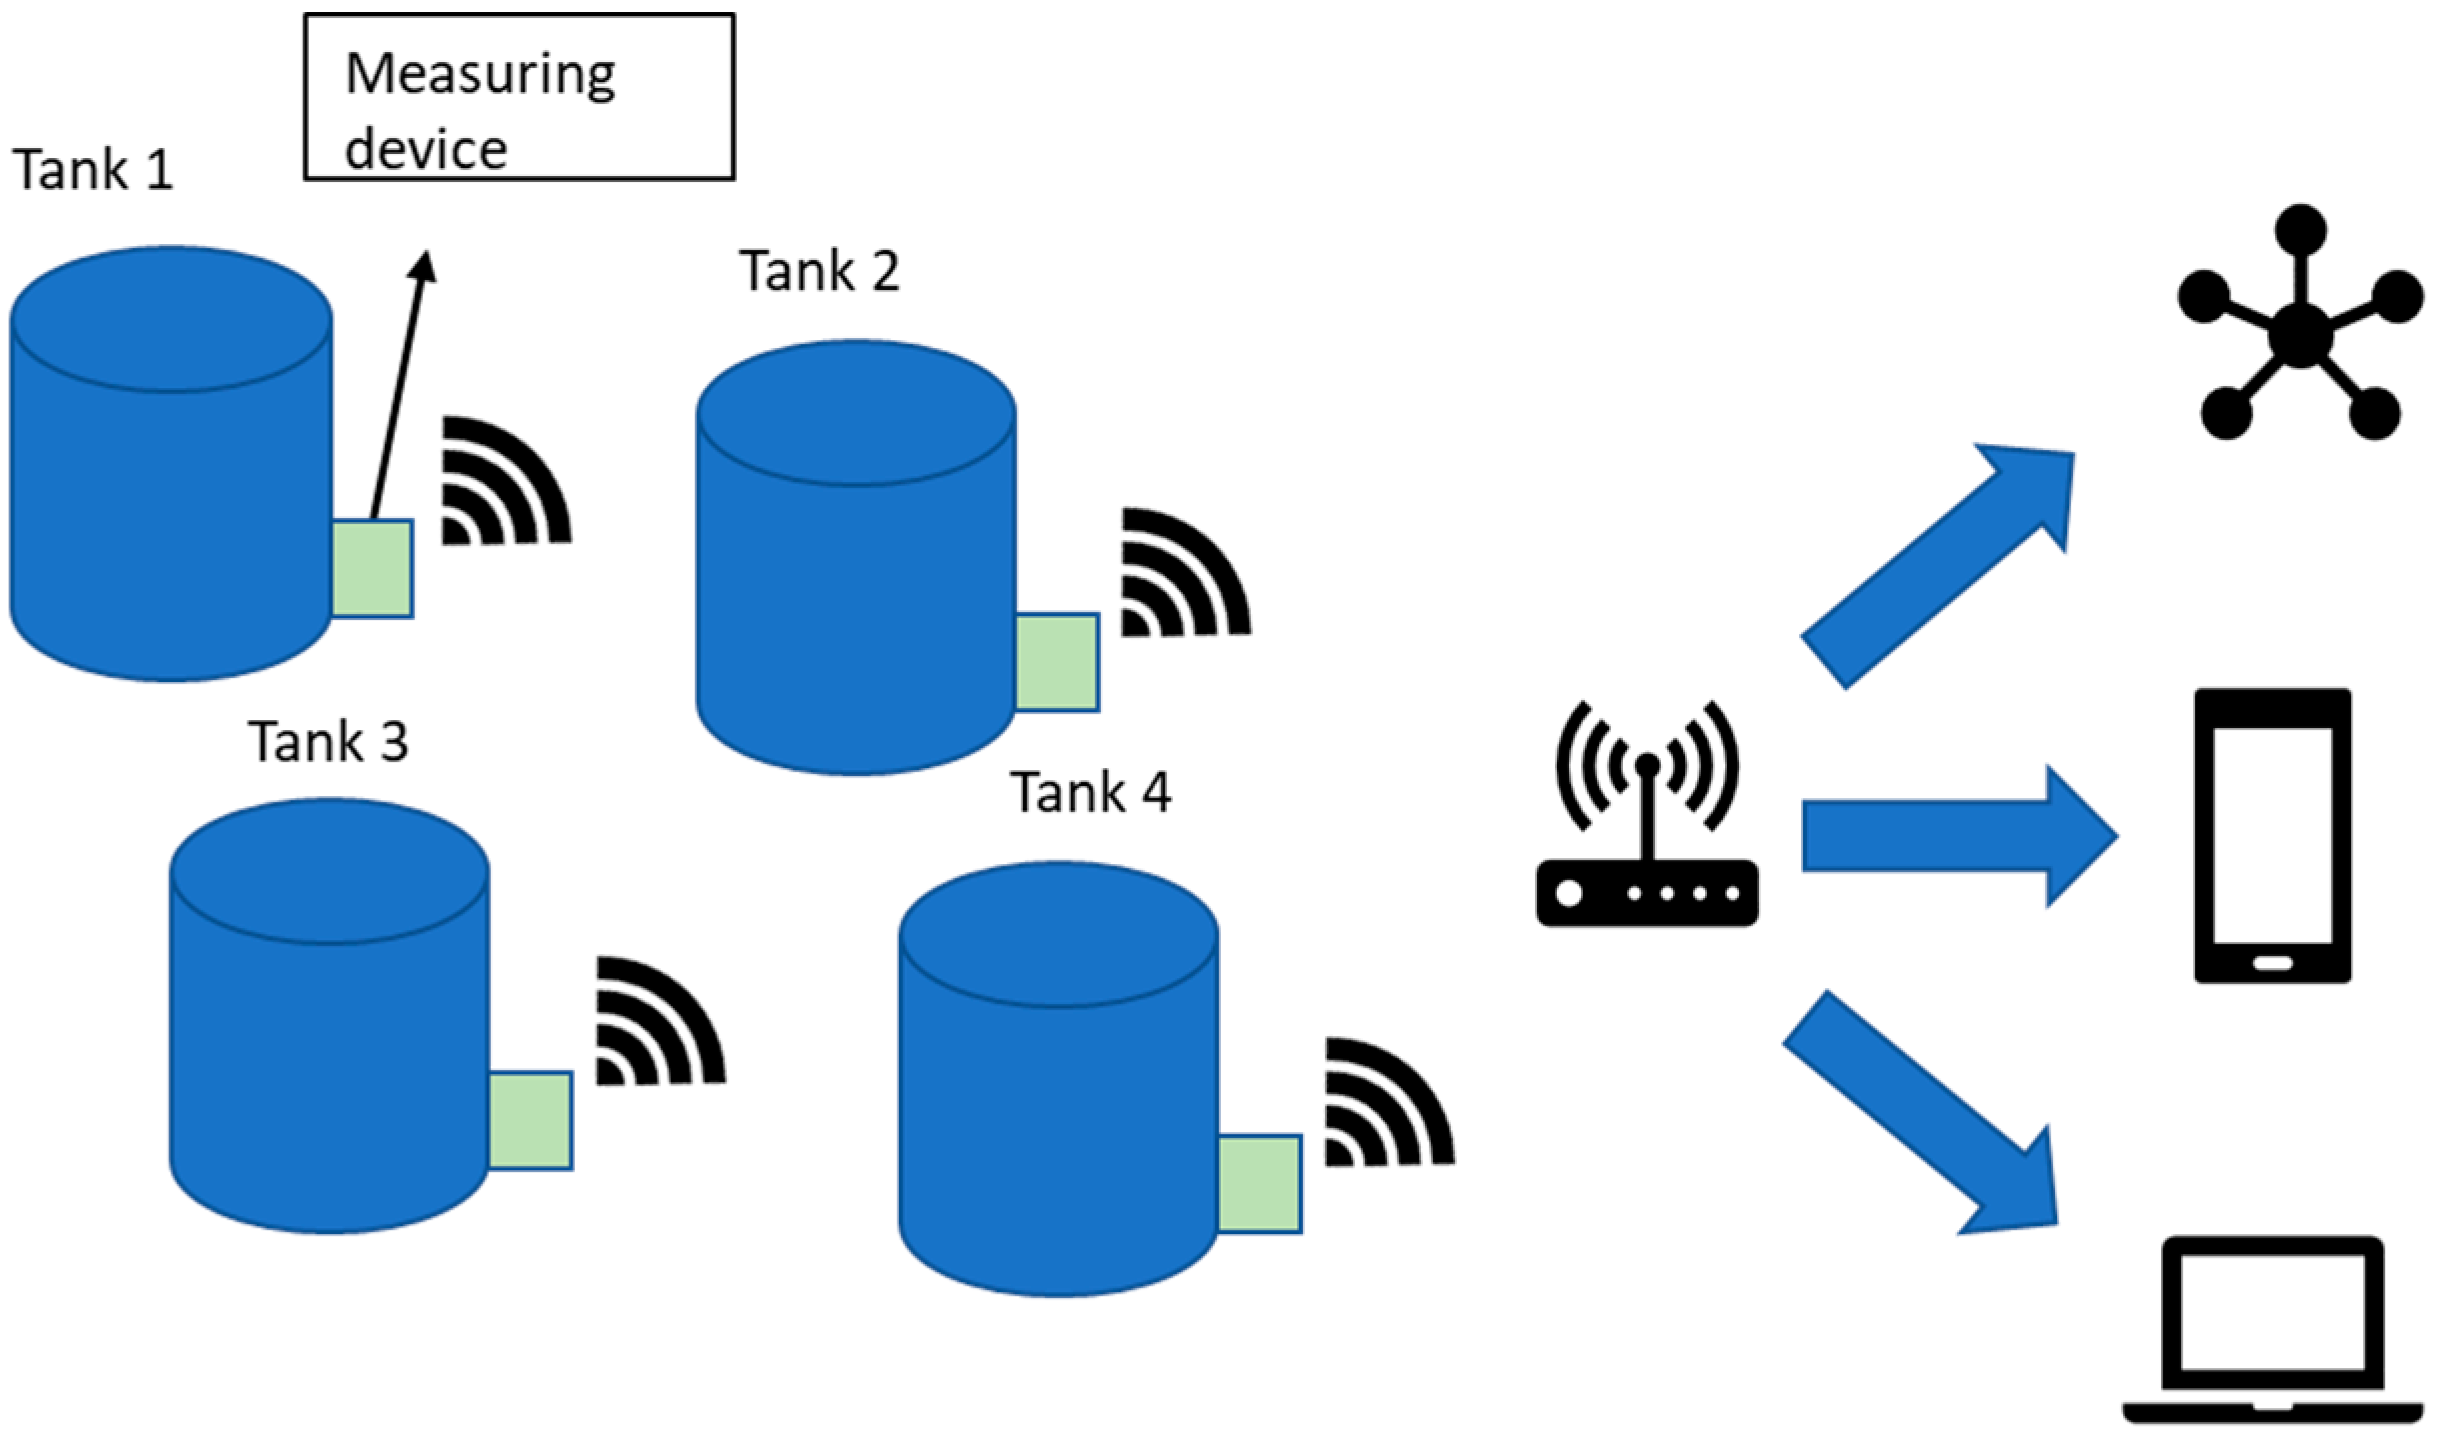
This paper proposes a device that introduces advantages over these solutions, since it is a wireless measurement technique which obtains the liquid volume inside the tank in a non-intrusive way based its relationship with the resonance frequency. While the proposed solution is based on similar concepts to those used in Reference [12], this last solution requires two separated transducers, which makes such a system complex to scale to big tanks. Thus, while there are already similar measurement systems, as seen in References [11,12], these systems imply higher costs than the proposed system. Additionally, the particular case of Reference [11] requires a specific tank size and geometry, while the proposed system is useful for any type of tank geometry and also for different tank materials. Moreover, the proposed system directly provides volume measurements rather than fluid height readings, which are usually provided by most systems. Therefore, the proposed system is a low-power, scalable solution for those industries in which continuous tank level monitoring is necessary. This device can be used in a distributed measuring system. Thus, each tank in an industry can have a measuring device connected via Bluetooth, WiFi or any other suitable protocol to a central node from which it is possible to read the load of each tank. In Figure 1, a conceptual graph of the proposed system is shown.
The olive oil industry can be used to demonstrate the advantages of this system. In this industry, the level of the tanks is checked on a daily basis through visual checks of a marked glass level meter. This time-consuming process can be reduced to checking in a smartphone or PC the state of all the tanks at the same time, even from a place far apart from the tanks.
The manuscript is divided into four parts. Following this introduction, Section 2 is devoted to the materials and methods involved in the implementation. Section 3 includes the results, which confirm the feasibility of the presented device, as well as the corresponding discussion. Finally, the main conclusions are presented in Section 4.
2. Materials and Methods
2.1. Physical Phenomena Involved and Model Derivation
The proposed system is based on acoustic waves generated in the tank-fluid system when the tank is hit by an instrument (described in the following), in a similar way to how bells are rung. Thus, the vibration frequencies observed on the tank’s surface will depend on, in this case, the tank geometry and material, the fluid filling the tank and its physical properties, and the corresponding fill-level of the tank. This results in a complex mathematical model, mainly derived from two different phenomena. First is the vibration of the tank itself, which can be described through the theory of vibration of solids. This is of interest for a variety of fields, from the automotive industry to aerospace research, also including civil engineering and musical instruments. However, this is a mathematically complex field, as shown by the general equation describing the vibration of a solid cylindrical shell, derived by Love [13] in 1888. In the case of generic tanks, the model will be even more complicated due to more complex geometries. Moreover, the presence of fluid in the tank further complicates the system’s mathematical description, as it could be modeled as two separate tanks–one filled with fluid and the other filled with air–or with any other gas used in the system under measure.
On the other hand, the resonant cavities formed inside the tank, once again corresponding to both fluid and air, are a second source of acoustic vibration in the presented system. The geometric parameters of these cavities depend on the fill-level of the tank and the tank geometry, with one cavity size increasing as the tank is depleted, and the other one decreasing in volume, and vice versa. Simplifying the model of this sound resonance in the tank to a Helmholtz resonator [14], and assuming a cylindrical tank, resonance frequencies could be simply described [15] to be proportional to the sound propagation speed, and inversely proportional to the length of the cavities.
However, the phenomena described above are not independent, and the mathematical analysis of the acoustic resonance in the tank is a very complex problem due to the different interactions between the vibration of the tank, the sound transmission in the fluid, the interface between fluid and gas inside the tank, the fluid-tank and gas-tank interfaces, and the tank geometry. Additionally, physical parameters of the tank material and fluid, such as rigidity, density, bulk modulus, viscosity, and others, will also be factors in the mathematical model of the whole system. Thus, the presented instrument relies on a so-called calibration process of the tank under measurement, as it will be described in Section 3.1. This calibration process, which requires only to perform a series of acoustic measurements for a number of controlled fill-levels, will produce a model relating the volume of fluid to the resonance frequency, which will be later used as a transfer function relating excitation (knock) and response (acoustic vibration on the outer tank surface). The selected resonance frequency will simply be the one with higher amplitude, as discussed below, of those acoustically observed on the tank surface after the knock. Apart from its non-intrusive nature, simplicity, and applicability to any tank geometry, this procedure does not require the conversion from fluid height to fluid volume, which is usually needed for most alternative systems. The presented instrument directly measures the fluid volume.
2.2. Measurement Procedure
As will be further elaborated in Section 3.1, once the calibration process described above has been carried out and the model of the tank relating frequency and volume is available, the measurement process is composed of three stages:
- Knock: In this stage the tank is beaten, so it starts resonating at the fundamental frequency and its harmonics. The hit must be a fast, dry blow, in order to create a sound as clean as possible with no dumping of vibrations.
- Sampling: After the hit, using a piezoelectric microphone, the sound is captured and later digitized with an ADC (Analog-to-Digital Converter).
- Analysis: Finally, FFT (Fast Fourier Transform) is applied to the digital signal, which is analyzed to obtain the resonance frequency that is later compared to the tank resonance model in order to determine the fill-level of the tank.
The FFT Algorithm
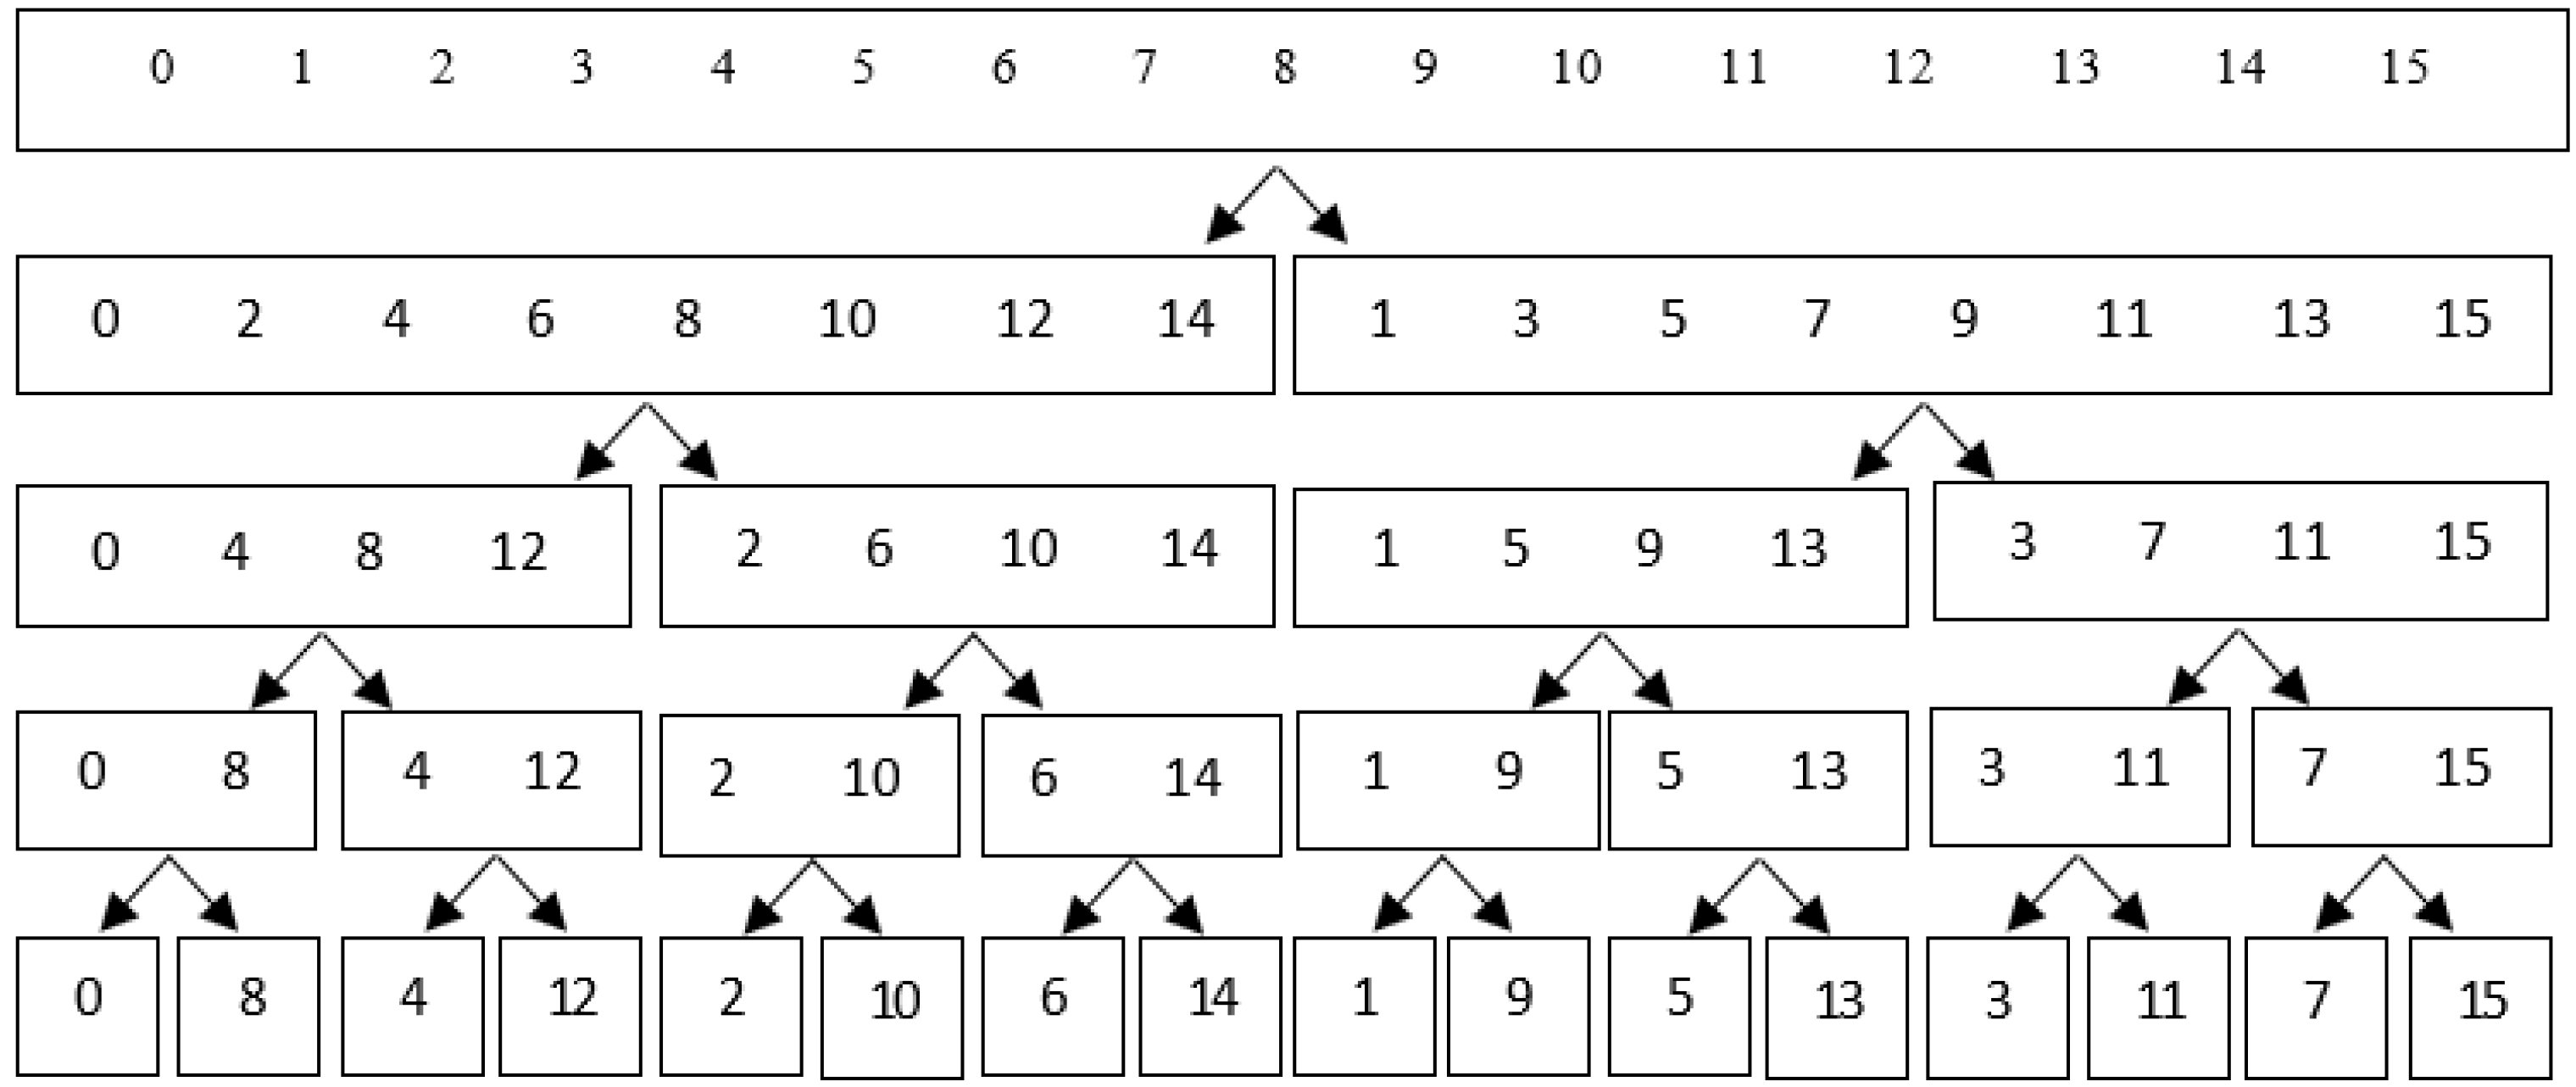
For the FFT analysis, the chosen algorithm is a butterfly algorithm with decimation in time (DIT FFT), which is based on the decomposition of the N-point signal into two vectors with the pair and odd positions of the original vector [16]. This process is repeated until N scalar signals are obtained. Figure 2 illustrates this process.
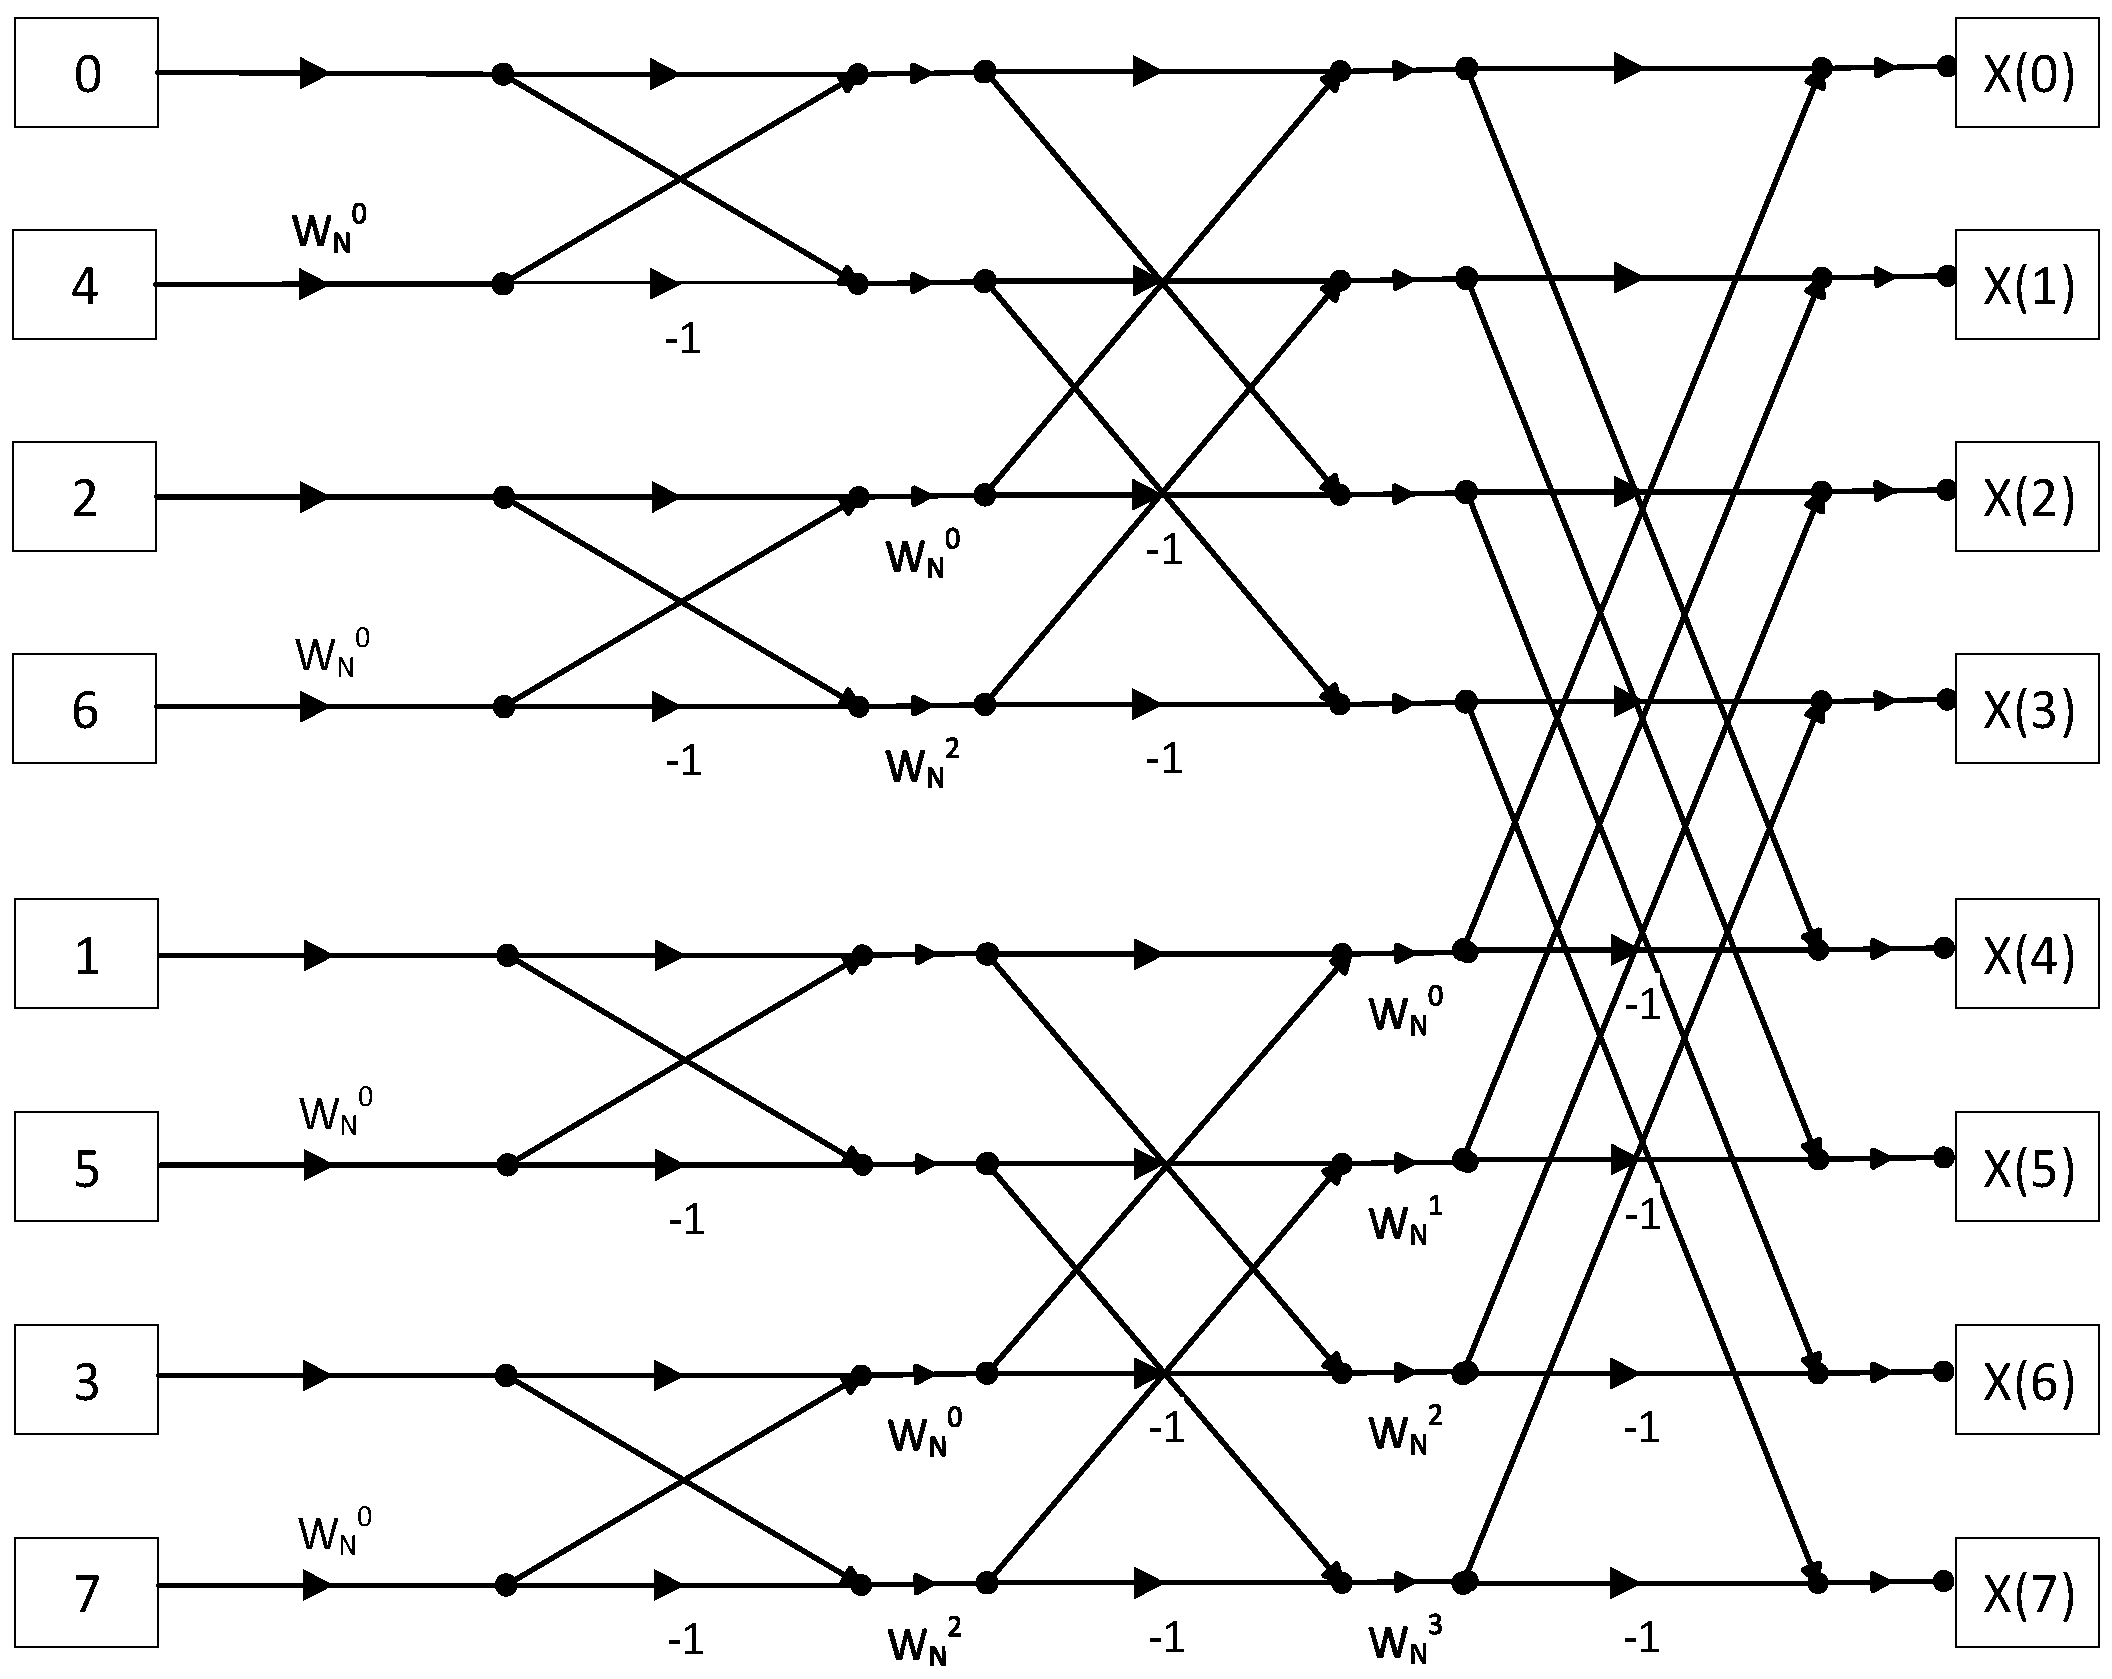
After that, it is possible to obtain the FFT combining the results with a sinus function that, as the discrete space is used, are the N-th roots of unity, . Then the reconstruction of the spectrum is made, as shown in Figure 3.
2.3. Device Prototype
As a proof of concept of the proposed method, a portable prototype using reconfigurable electronics has been developed. Analog and digital reconfigurable technologies have been shown as ideal candidates for the implementation of smart instruments for biosignal acquisition and processing [17], while new SoC devices, such as Cypress PSoC, are the core of low-cost reconfigurable platforms that can be used in different instrumentation applications [18]. In this way, thanks to its reconfigurable nature, the developed device can be adapted to different scenarios depending on the needs of calibration, alternative sensors or actuators, or even different tank sizes and materials. The main unit of the device is a PSoC 5 LP [19], which integrates an ARM Cortex-M3 combined with FPAA-like and FPGA-like resources, thus providing a versatile and reconfigurable System-on-Chip approach. This main unit oversees the following tasks:
- Communication with the computer or mobile device via Bluetooth;
- control of the hit system to synchronize the moment of impact;
- acquire the sound signal and store it in the memory to transmit it later;
- analyze the signal and compute the filling level.
As the used kit board of PSoC [20] does not include Bluetooth and external memory is also needed, a shield for the development kit was designed so the full device follows the scheme shown in Figure 4.
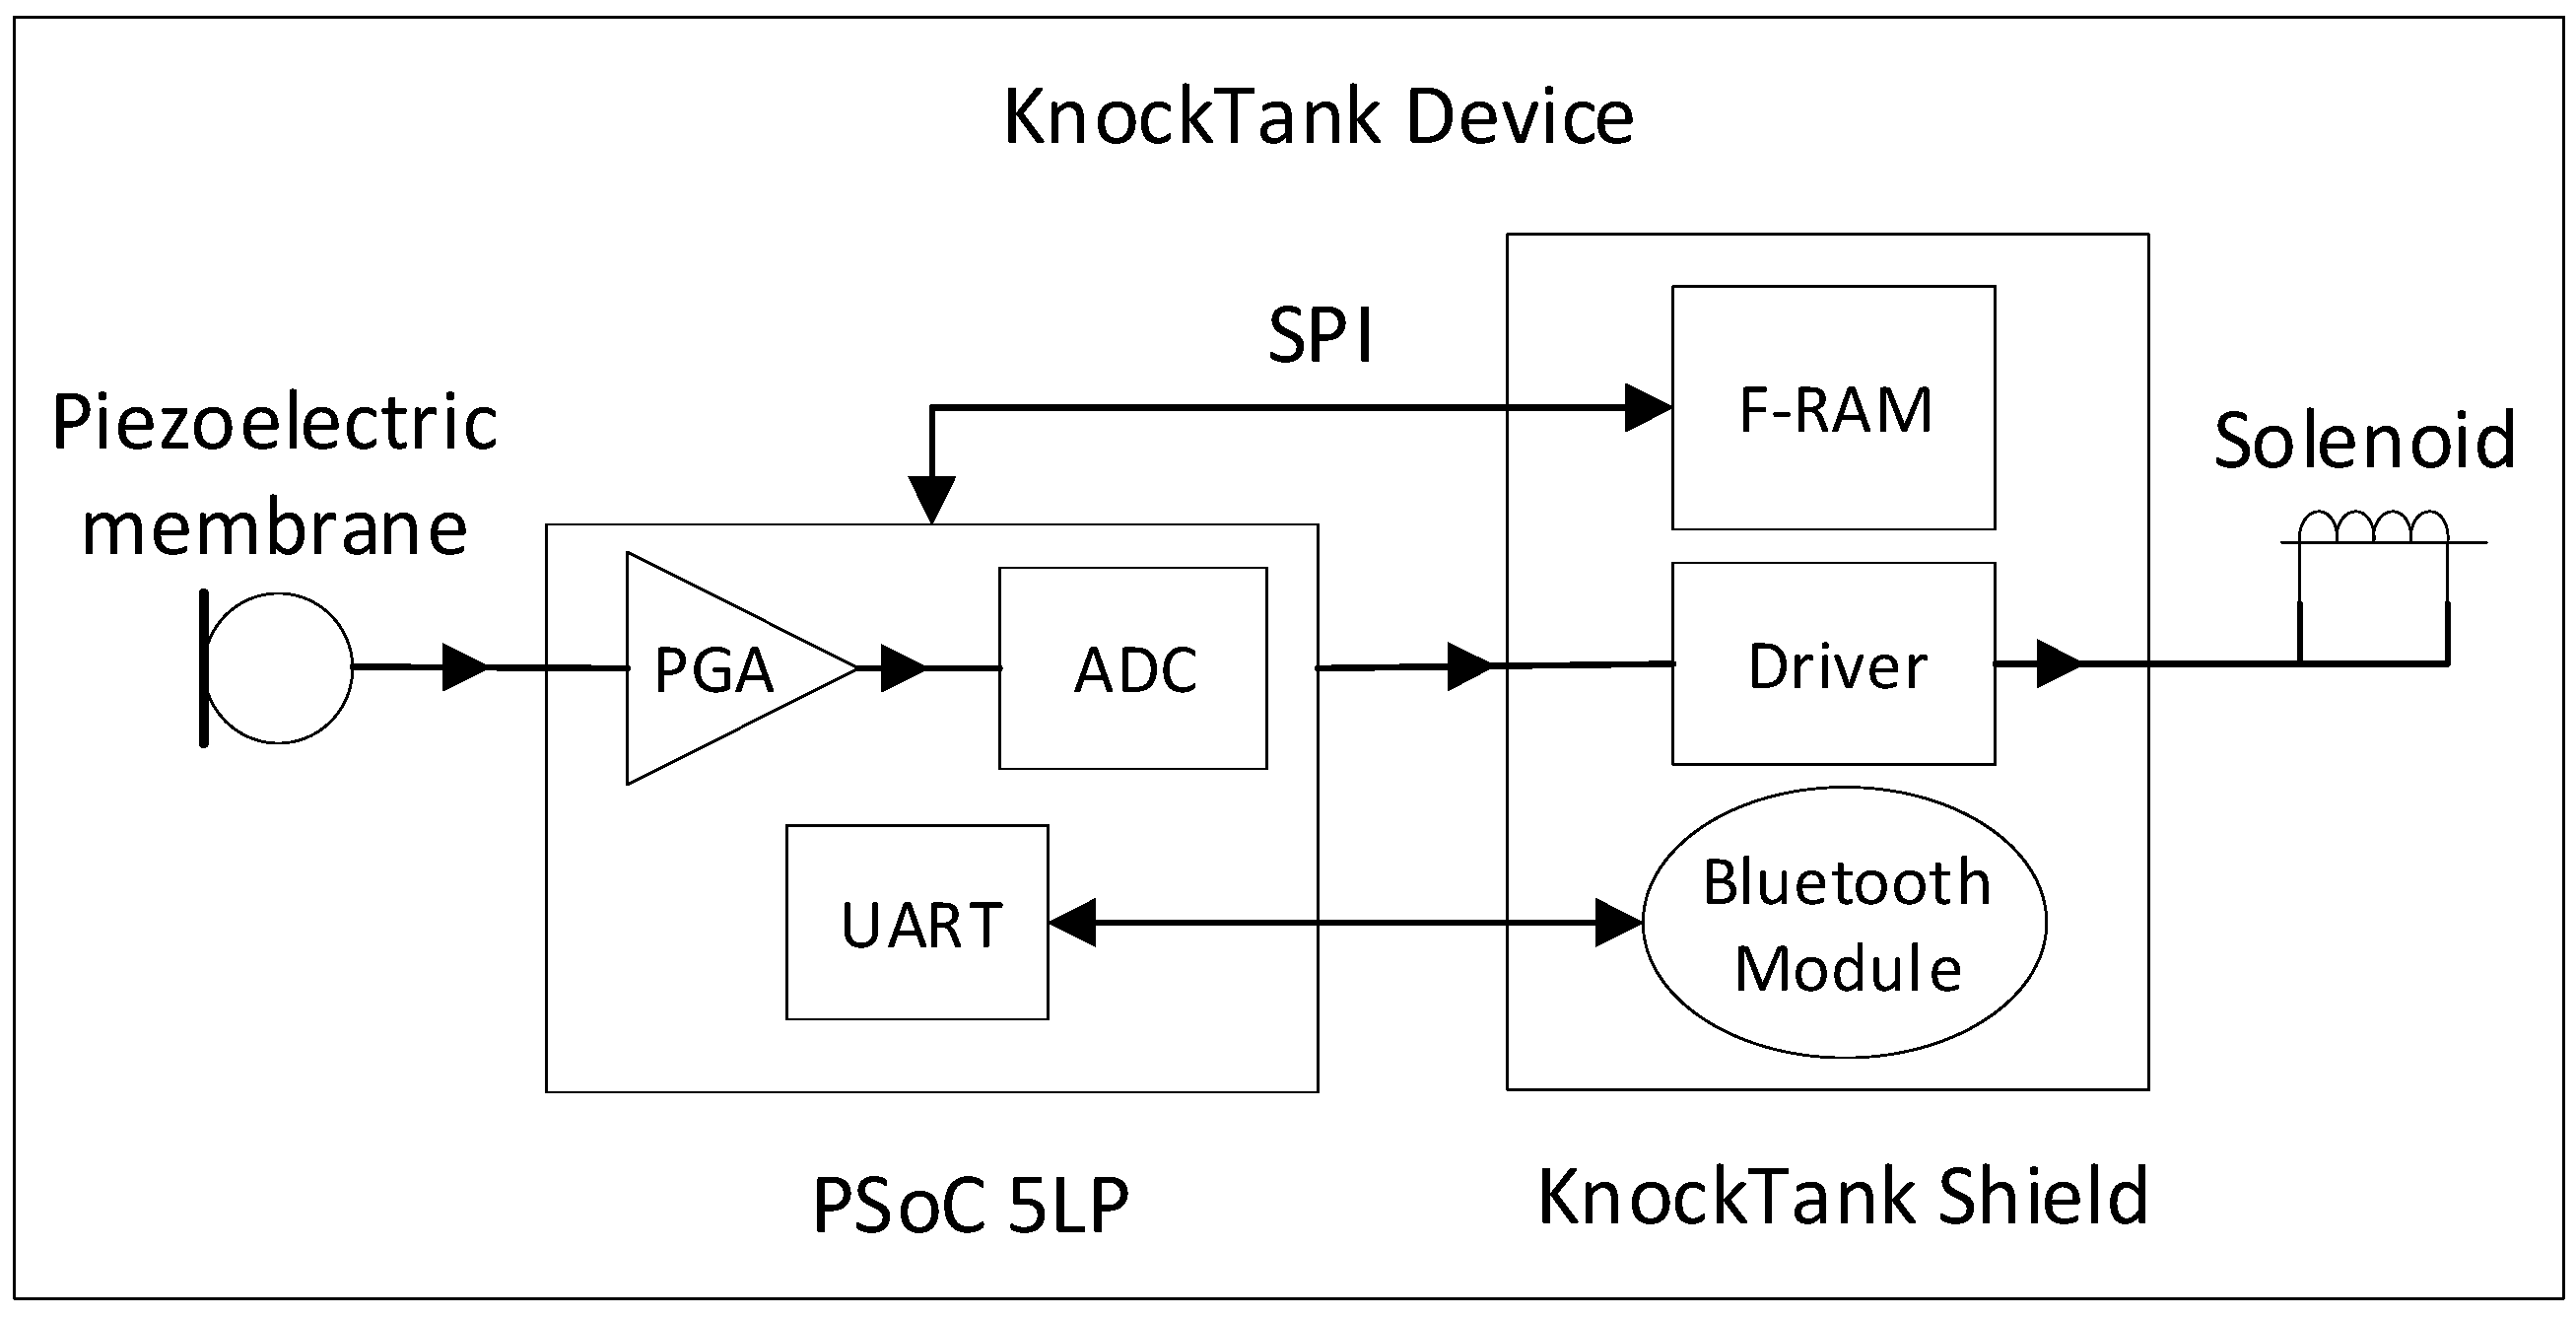
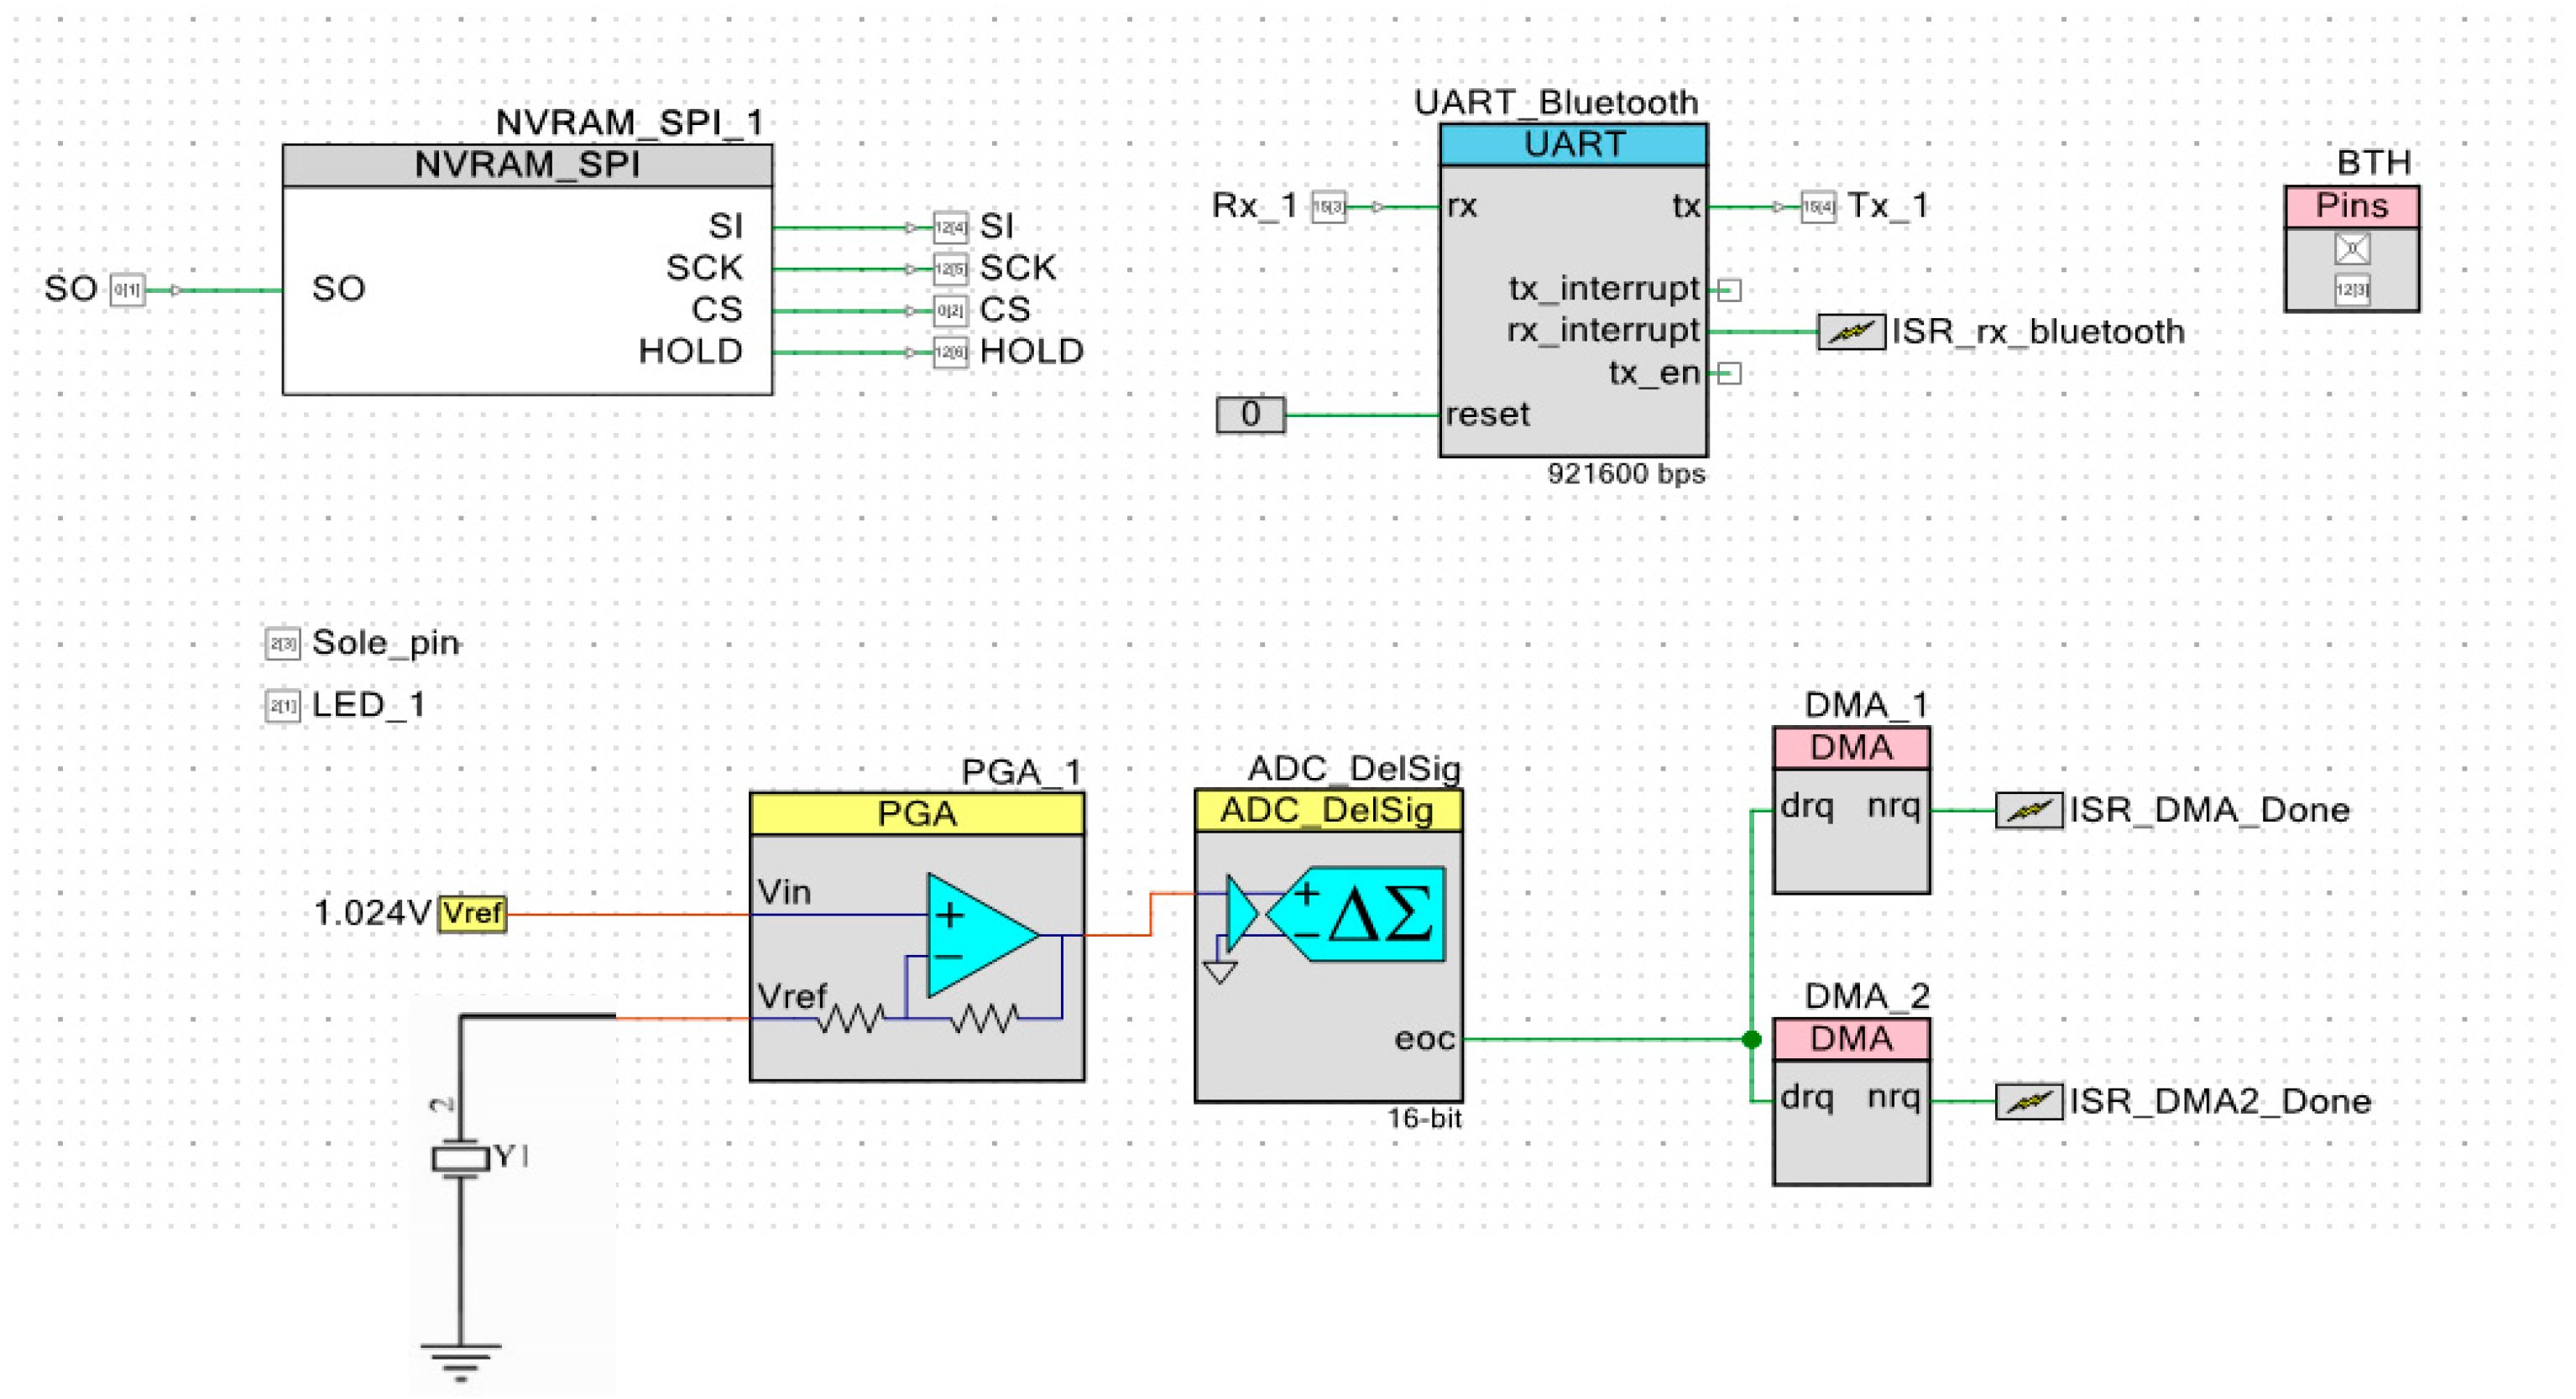
The internal configuration of the PSoC 5LP device is illustrated in Figure 5. As it is shown, the device configuration includes a PGA (Programmable Gain Amplifier) to amplify the signal received prior to the ADC. The ADC used is a Delta-Sigma type with 16-bit resolution. After that, 2 DMA (Direct Memory Access) channels are configured to transfer data to the memory without using CPU resources.
Also, a NVRAM (Non-Volatile RAM) block is configured to manage the data transfer between the PSoC and the external RAM through an SPI protocol. A UART (Universal Asynchronous Receiver-Transmitter) for Bluetooth communication has been configured for 921,600 bps and full-duplex mode.
2.3.1. The Knock Subsystem
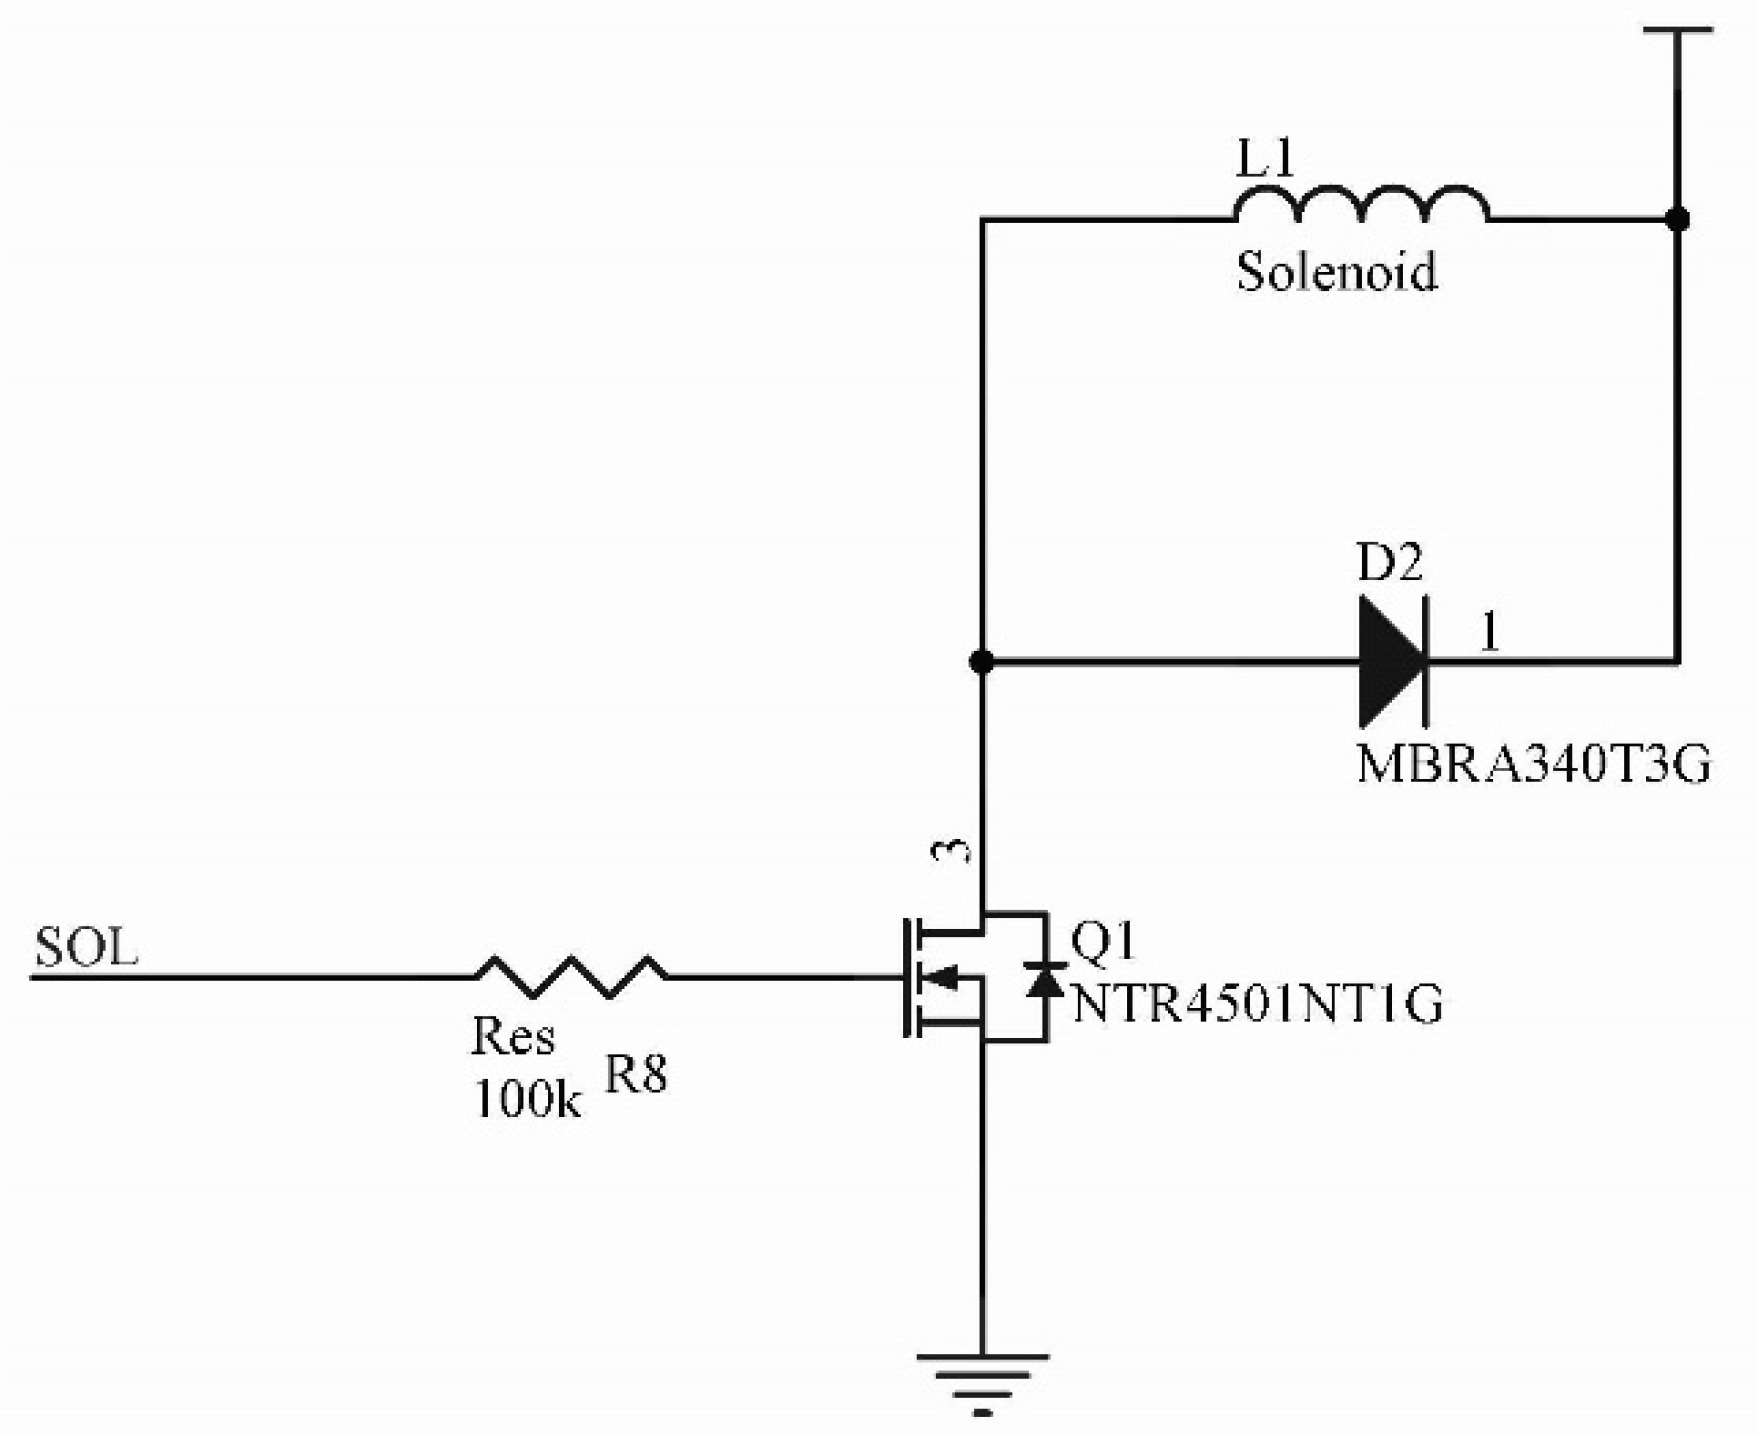
The knock subsystem is composed of a small driver and a solenoid, as it is shown in Figure 6. The used MOSFET is an NTR4501 and the solenoid is the ZYE0530Z. When the MOSFET is activated through the resistance, the solenoid inductor creates a magnetic field, so the plunger goes backward. Once the MOSFET is turned off, the inductor is discharged through the Schottky diode, releasing the plunger quickly to generate an appropriate knock to the tank.
2.3.2. The Sound Subsystem
In order to capture the vibrations generated by the knock, a piezoelectric membrane is used. This membrane has one contact on each side with a piezoelectric PZT ceramic plate in between. The diameter of the sensor is 25 mm in the front side contact, and the diameter of the piezoelectric material is 17 mm. The piezoelectric membrane thickness is 0.2 mm. The resonance frequency of this sensor is 4.6 kHz, with a maximum resonance impedance of 300 Ω. This piezoelectric membrane is connected as shown in Figure 5, so the signal is first amplified with a PGA and later is digitalized using a Delta-Sigma ADC. In order to have a correct acquisition, it is important to avoid dissipation of vibration within the housing of the membrane, so the backside should be firmly adhered to the prototype case.
2.3.3. The Final Prototype
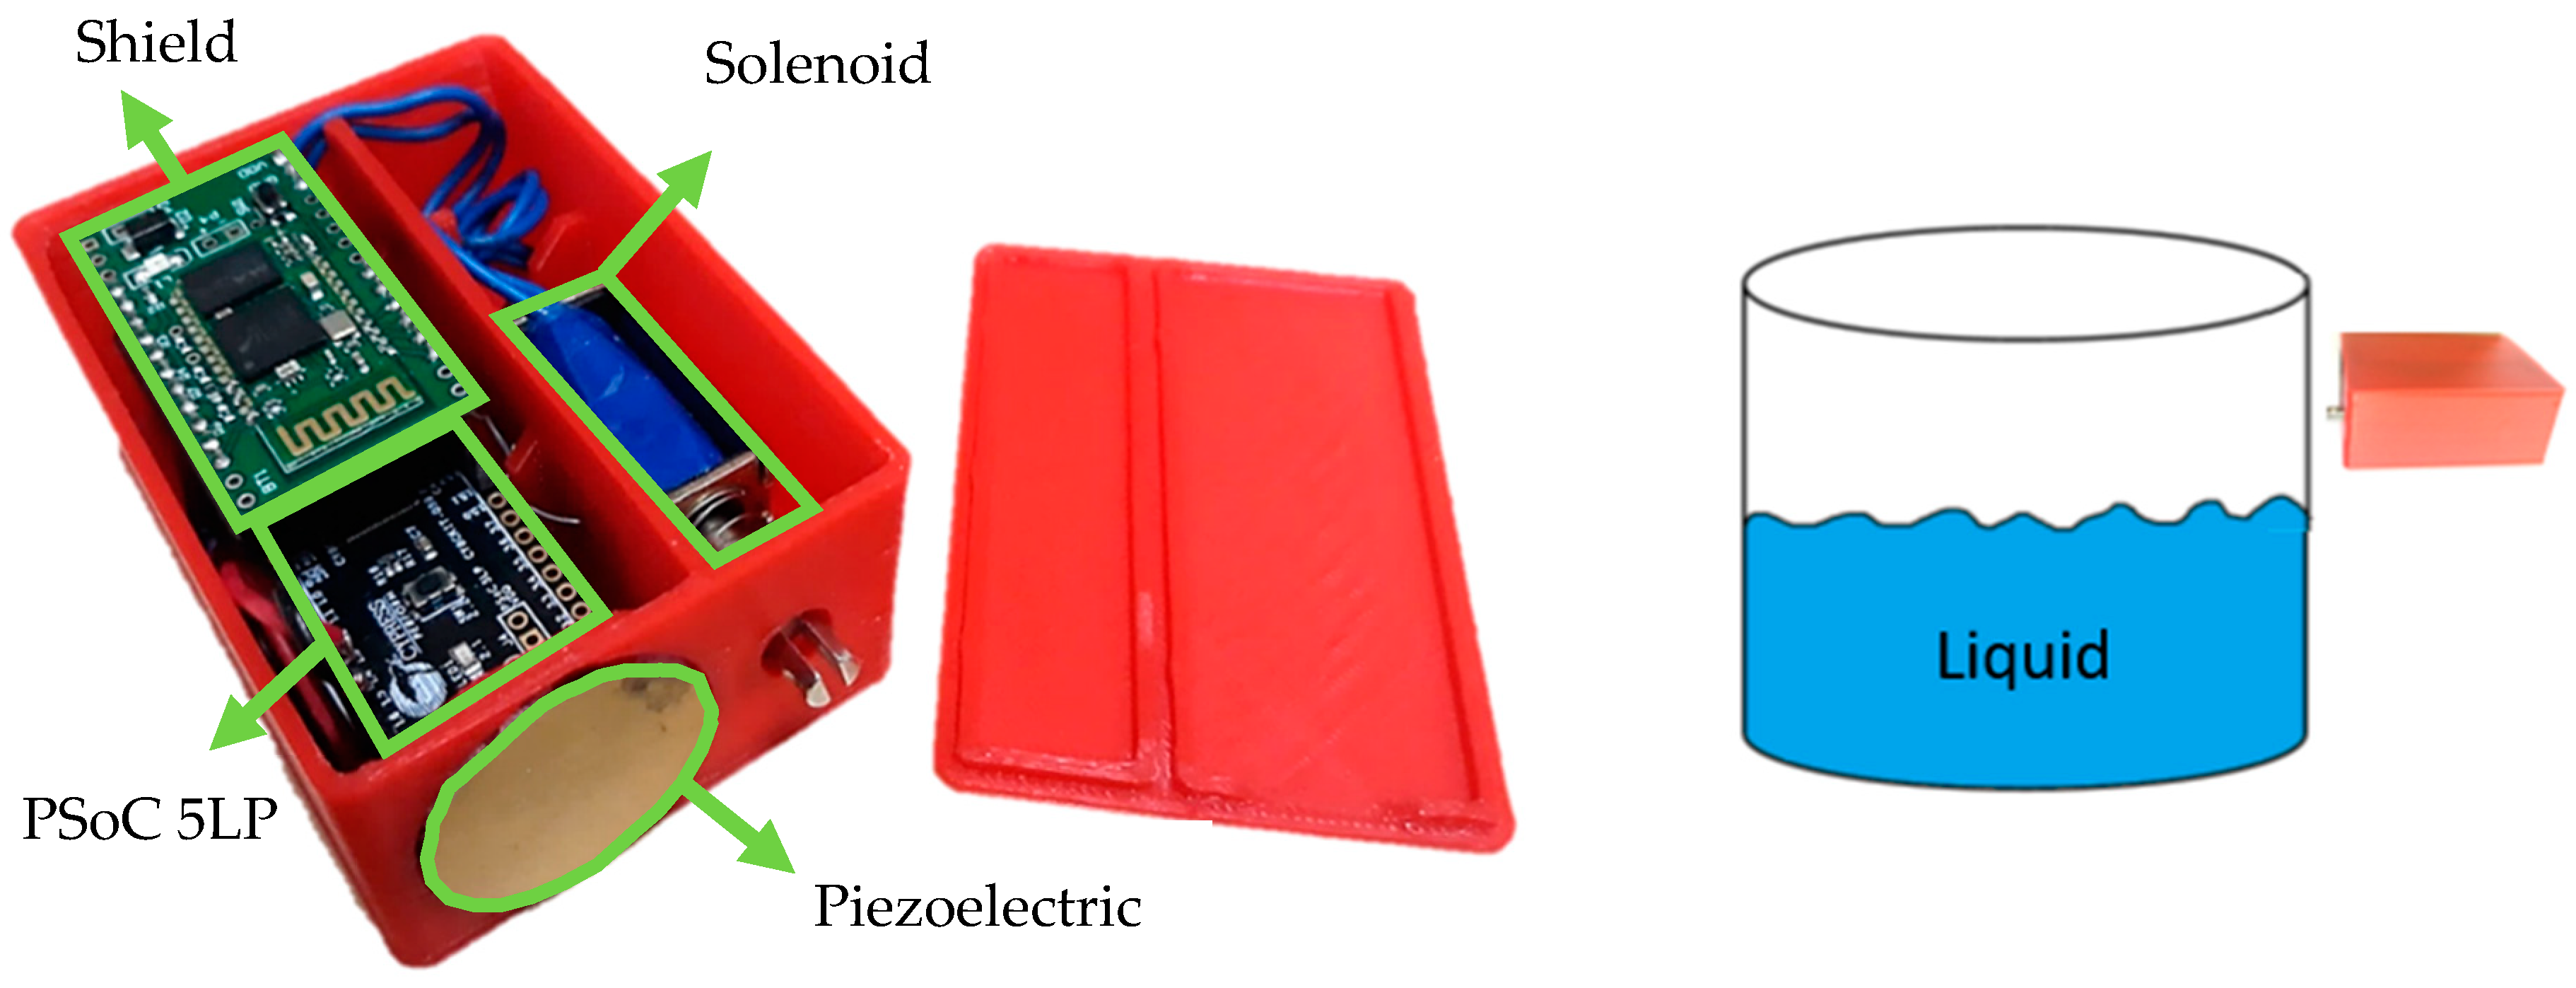
For the final prototype, a housing case was designed in order to have a compact device. The housing has been fabricated using 3D printing and has two separated compartments, one for the electronics and the other one for the solenoid for better encapsulation and mechanical mounting of the components. In Figure 7, a picture of the complete prototype in this housing case is shown, as well as an illustration of its positioning for measurement. It must be noted that, as deduced from the tests carried out, the exact position of the instrument does not noticeably influence the measurement results, while calibration for specific positions in the case of complex geometries is always possible.
2.4. Mobile APP and MATLAB GUI
As detailed above, the device allows for autonomous measuring of the level of the tank, sending the captured signal to an external device that acts as user interface. In order to use this functionality, two different applications have been developed: An Android application and a MATLAB-based GUI (graphical user interface).
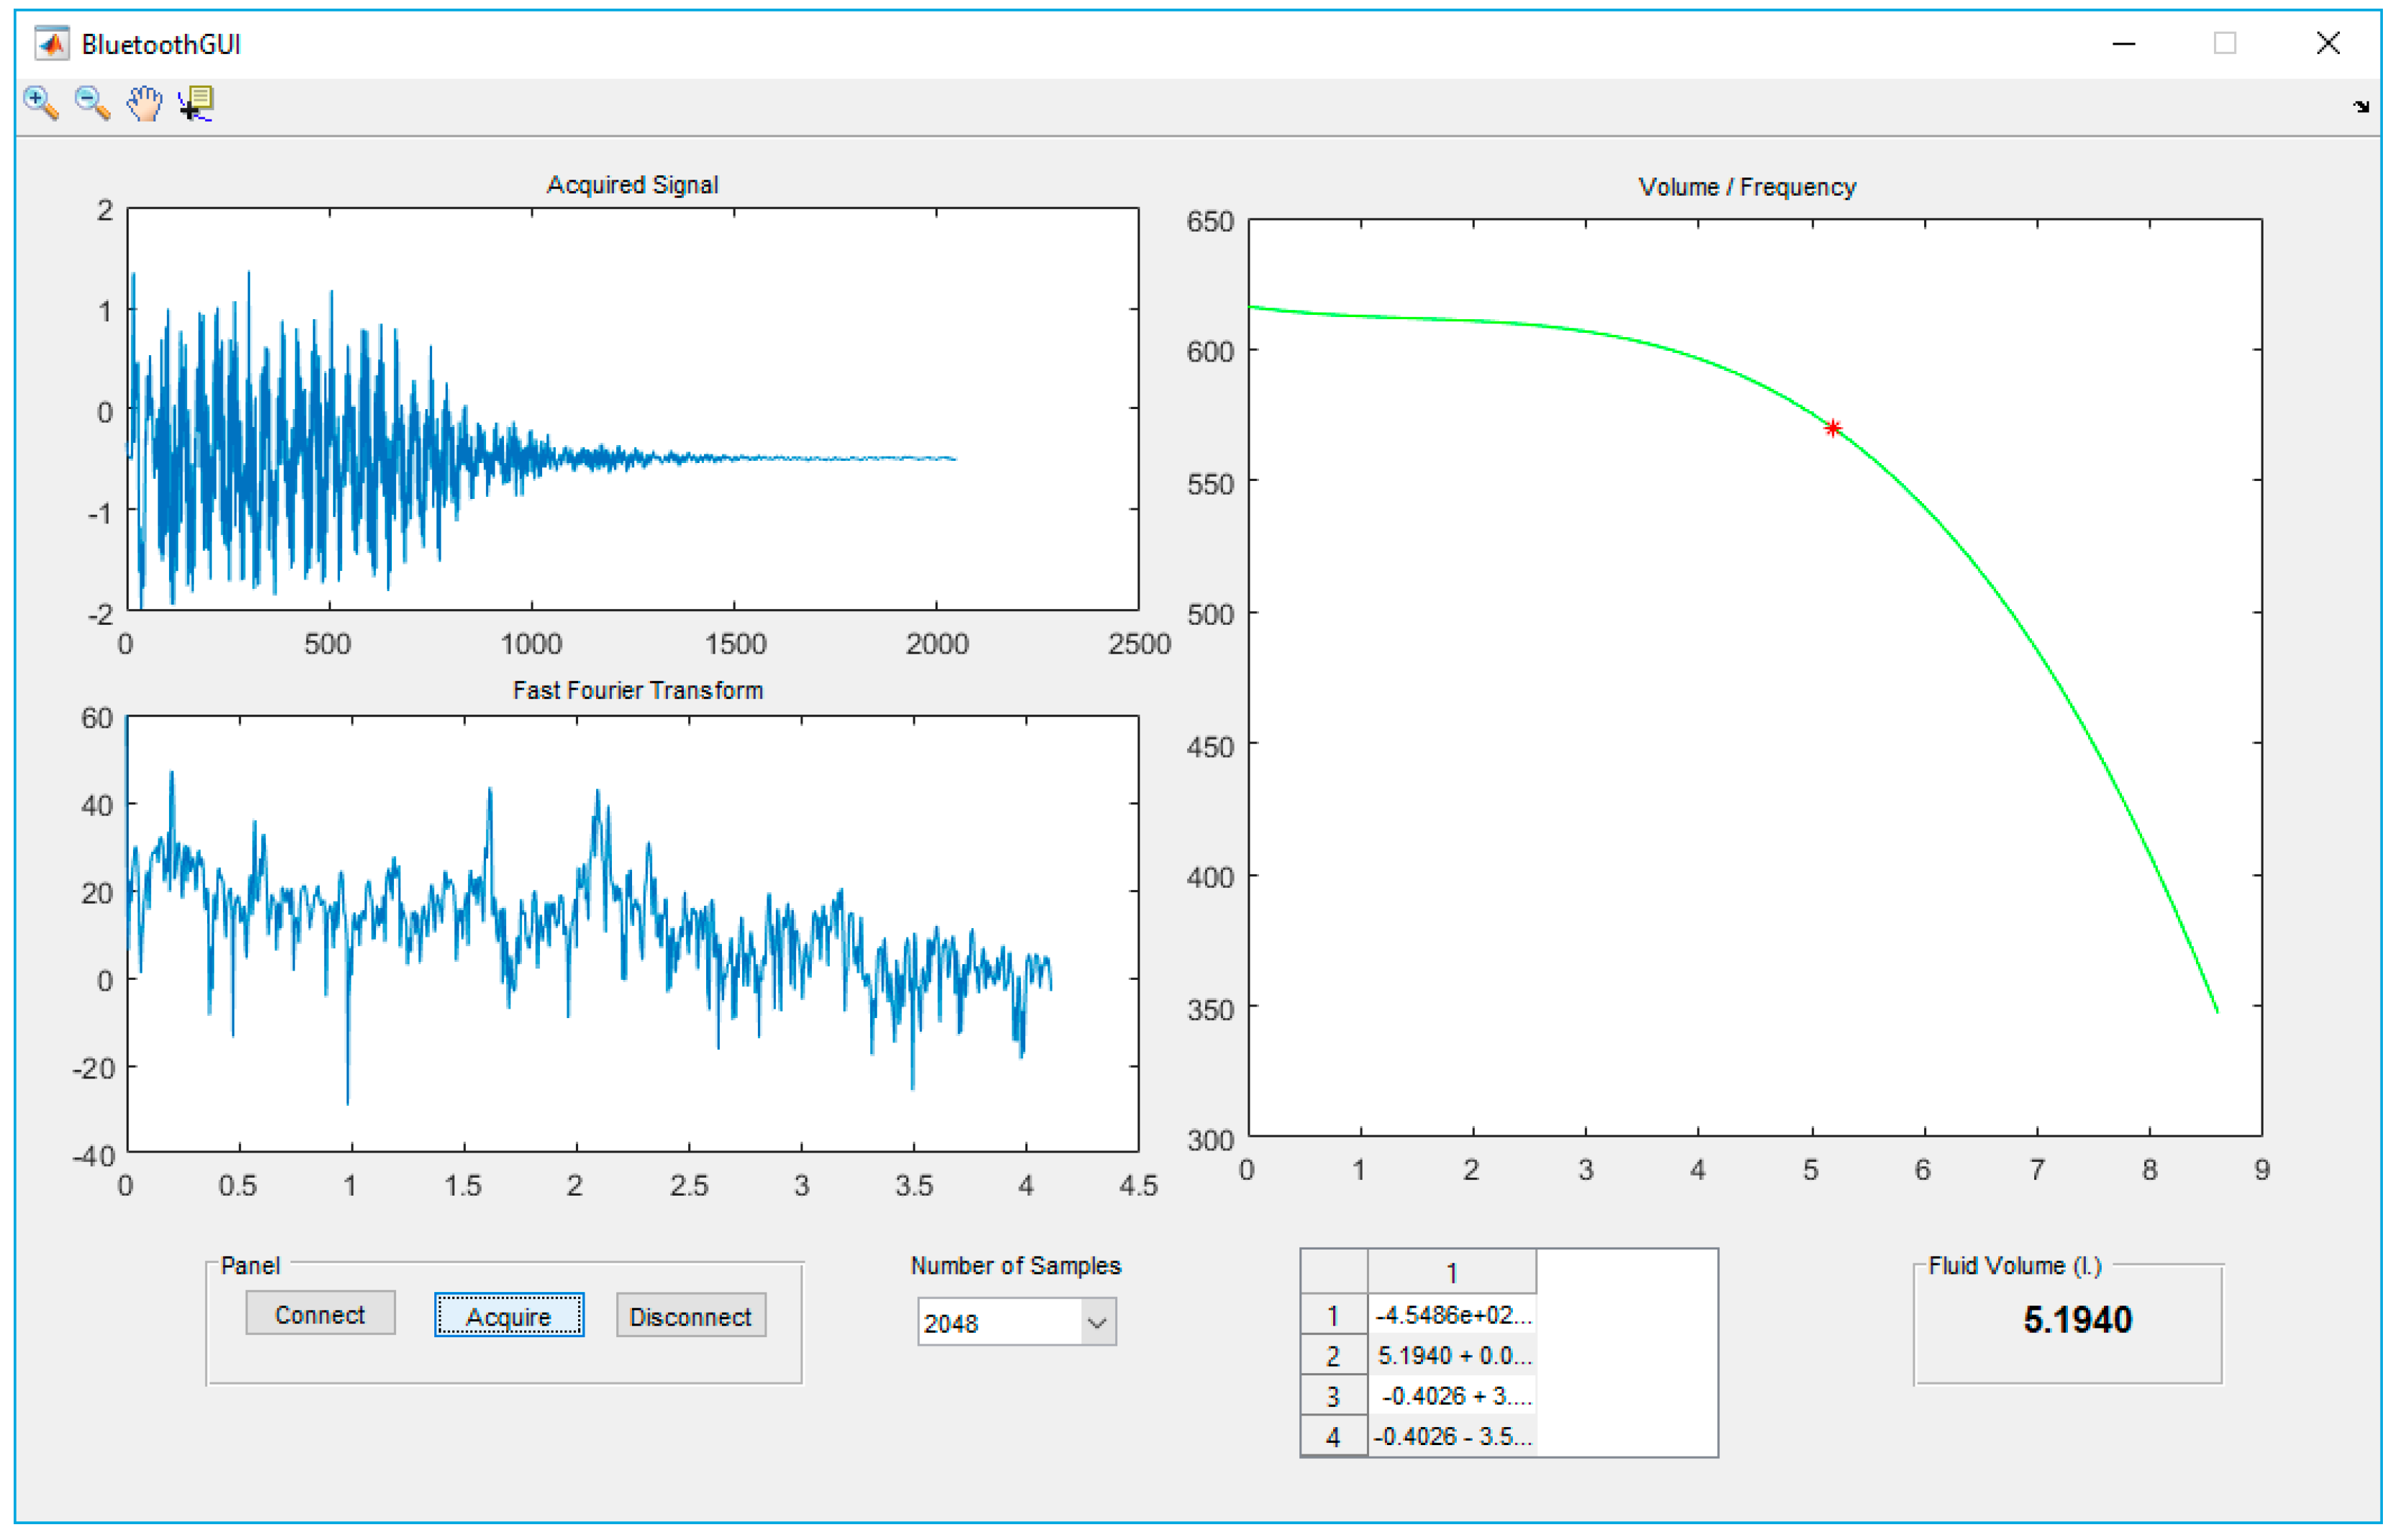
The MATLAB GUI allows interacting with the device via Bluetooth, making it possible to change the number of samples captured by the device and to control the operation of the device. Once the data is transmitted, the GUI shows the level of filling according to the tank model. It also shows the acquired signal, the FFT, and the model that was used. The general appearance of this GUI is illustrated in Figure 8.
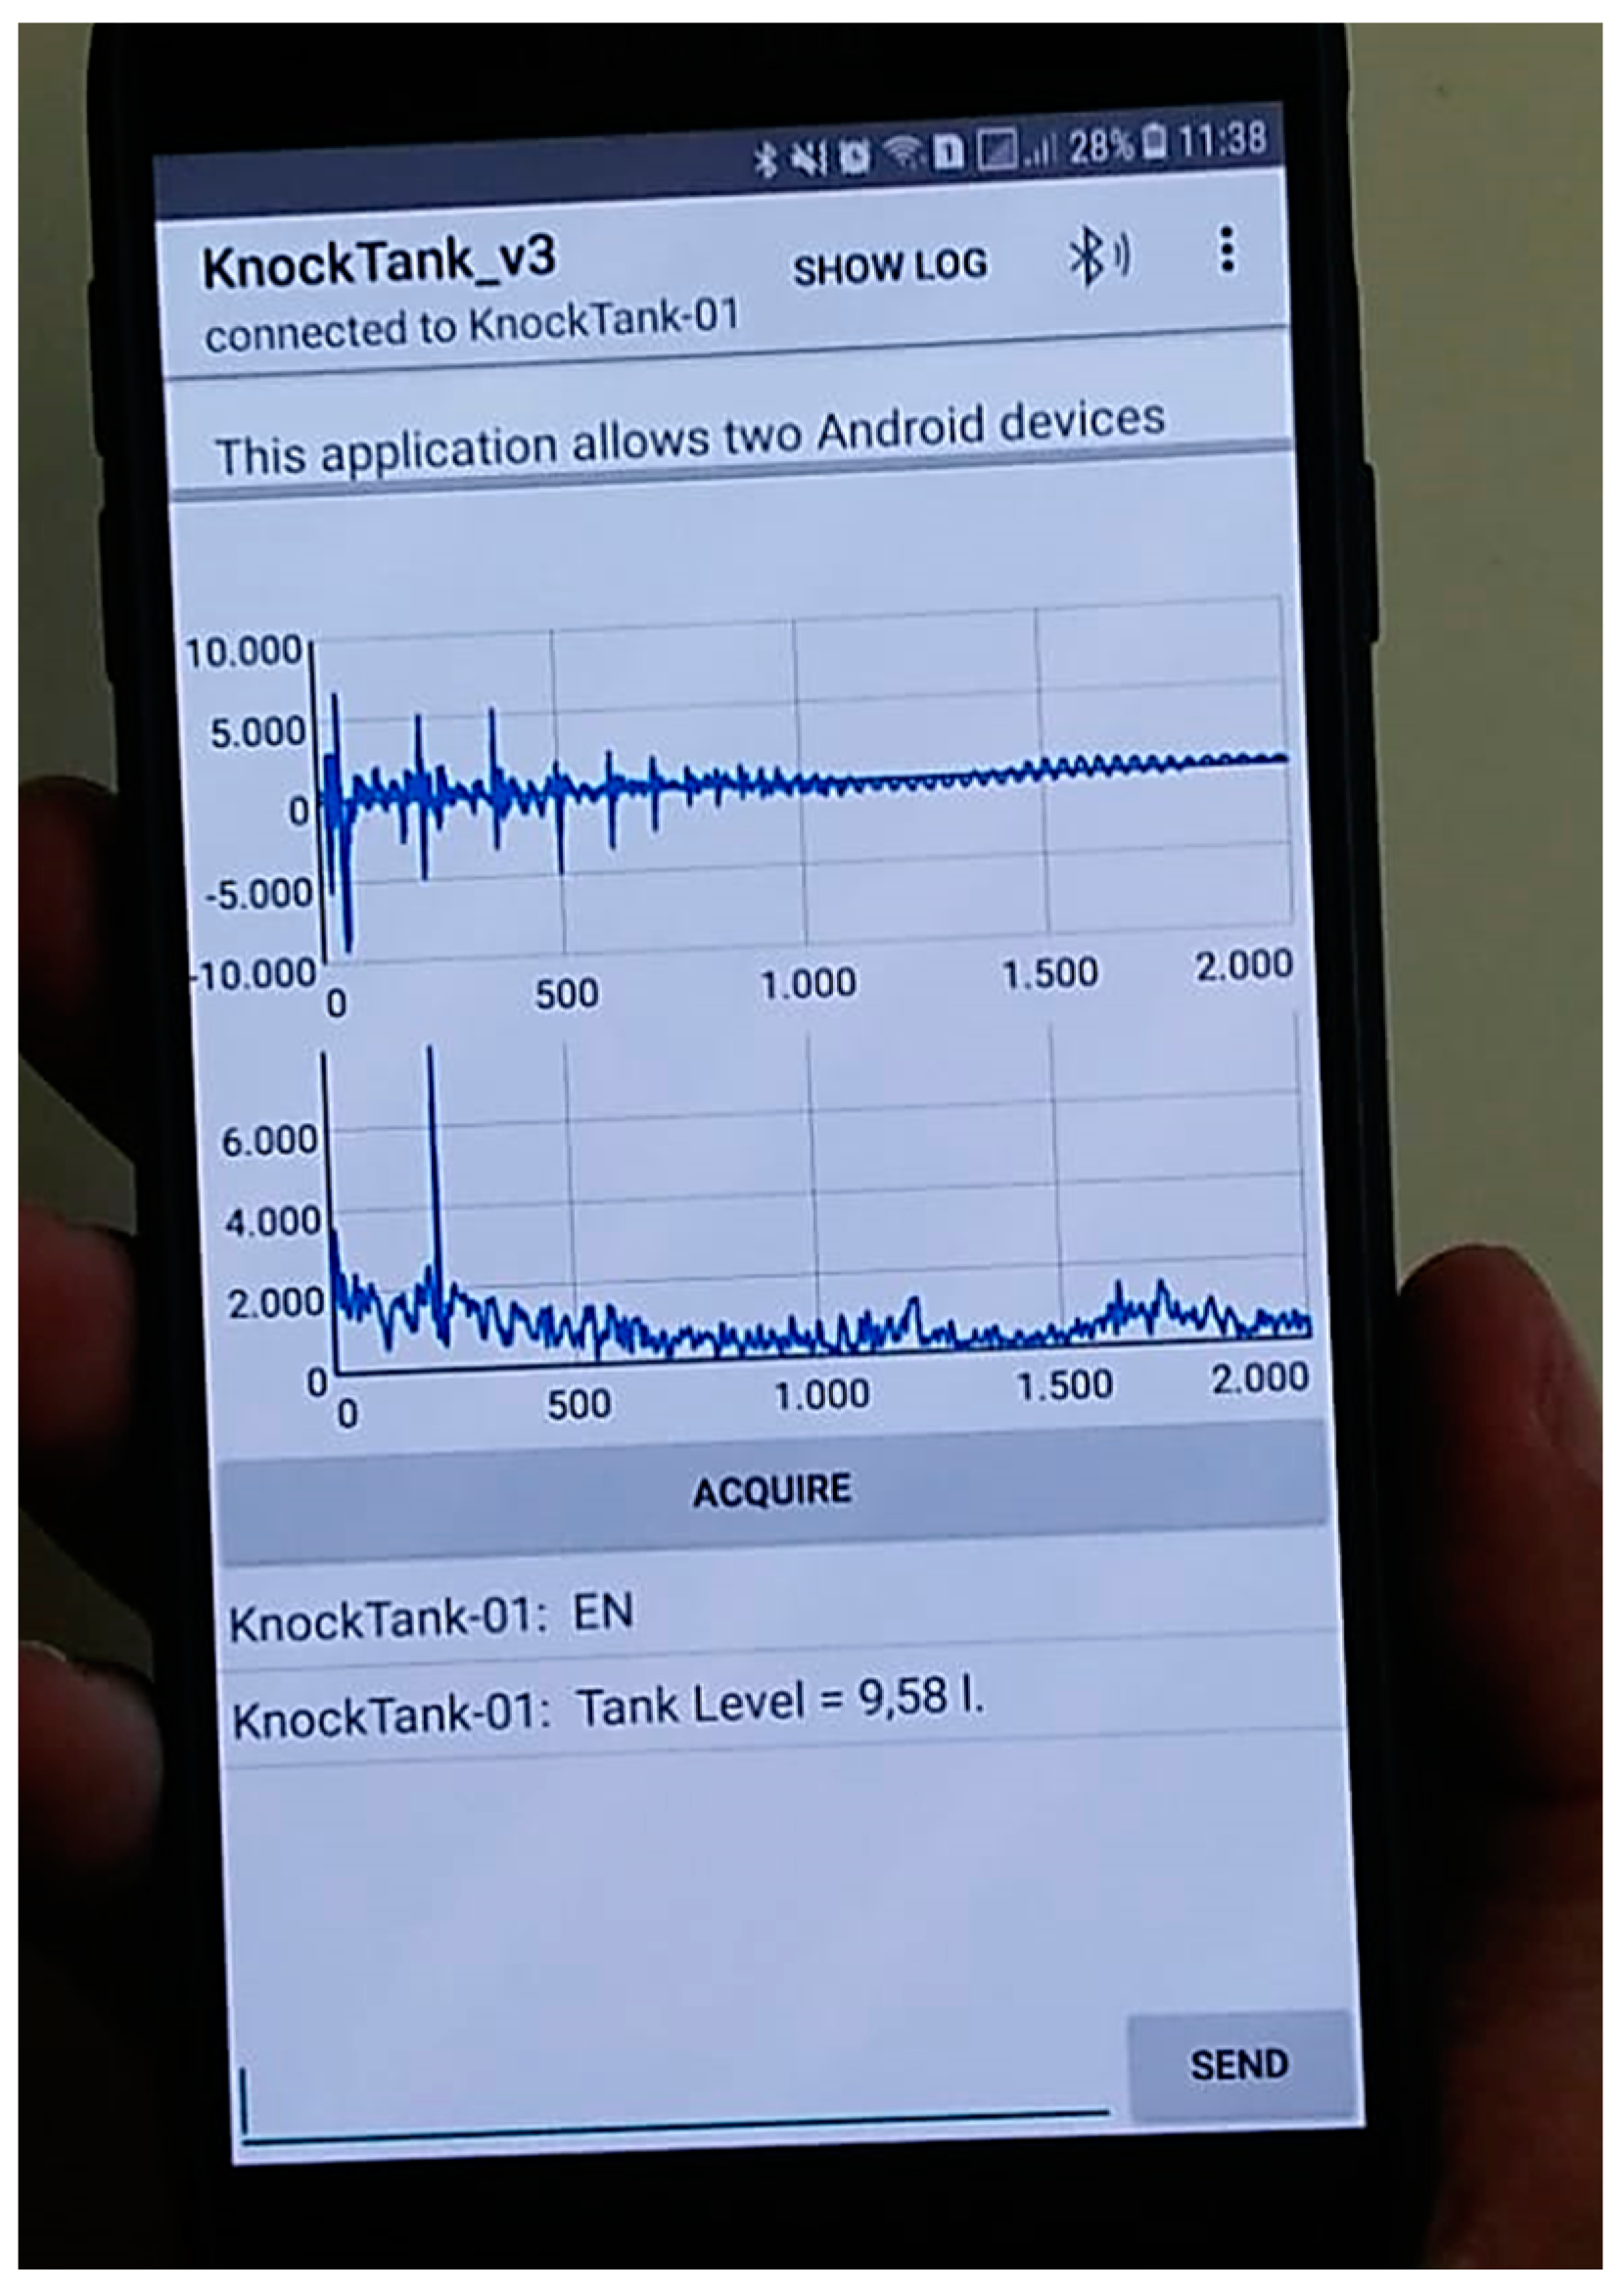
The availability of Bluetooth allows mobile devices to control and read data from the device, so an application for Android has also been created. Thanks to this, the device can be used with smartphones, tablets or smartwatches. For this purpose, a Samsung Galaxy J7 smartphone has been used. It runs Android 7.0, and includes a 5.5″ screen with 720 × 1280-pixel resolution. The application is based in the BluetoothChat example [21]. The main functionality of the application is to capture, analyze and display the signal received from the prototype. Moreover, it also includes some additional control functionalities, such as:
- Defining the number of samples;
- setting the triggering time for the solenoid;
- microphone calibration for offset suppression;
- configuration of the PGA gain.
Although the application cannot create a model for different tanks, it is able to save the raw data of the acquisition in a text file, so the data can be transferred to a computer to calculate the new model for later integrating it in the application.
An example of the appearance of this application can be seen in Figure 9.
3. Results
In order to initially test the system, an 8.5-L enameled steel tank was used. As discussed above, the tank needs to be modeled before any proper measurement, so a calibration process was carried out with measurements at different controlled fill levels. These measurements allow for deriving of the tank model, relating resonance frequency and volume.
3.1. Calibration
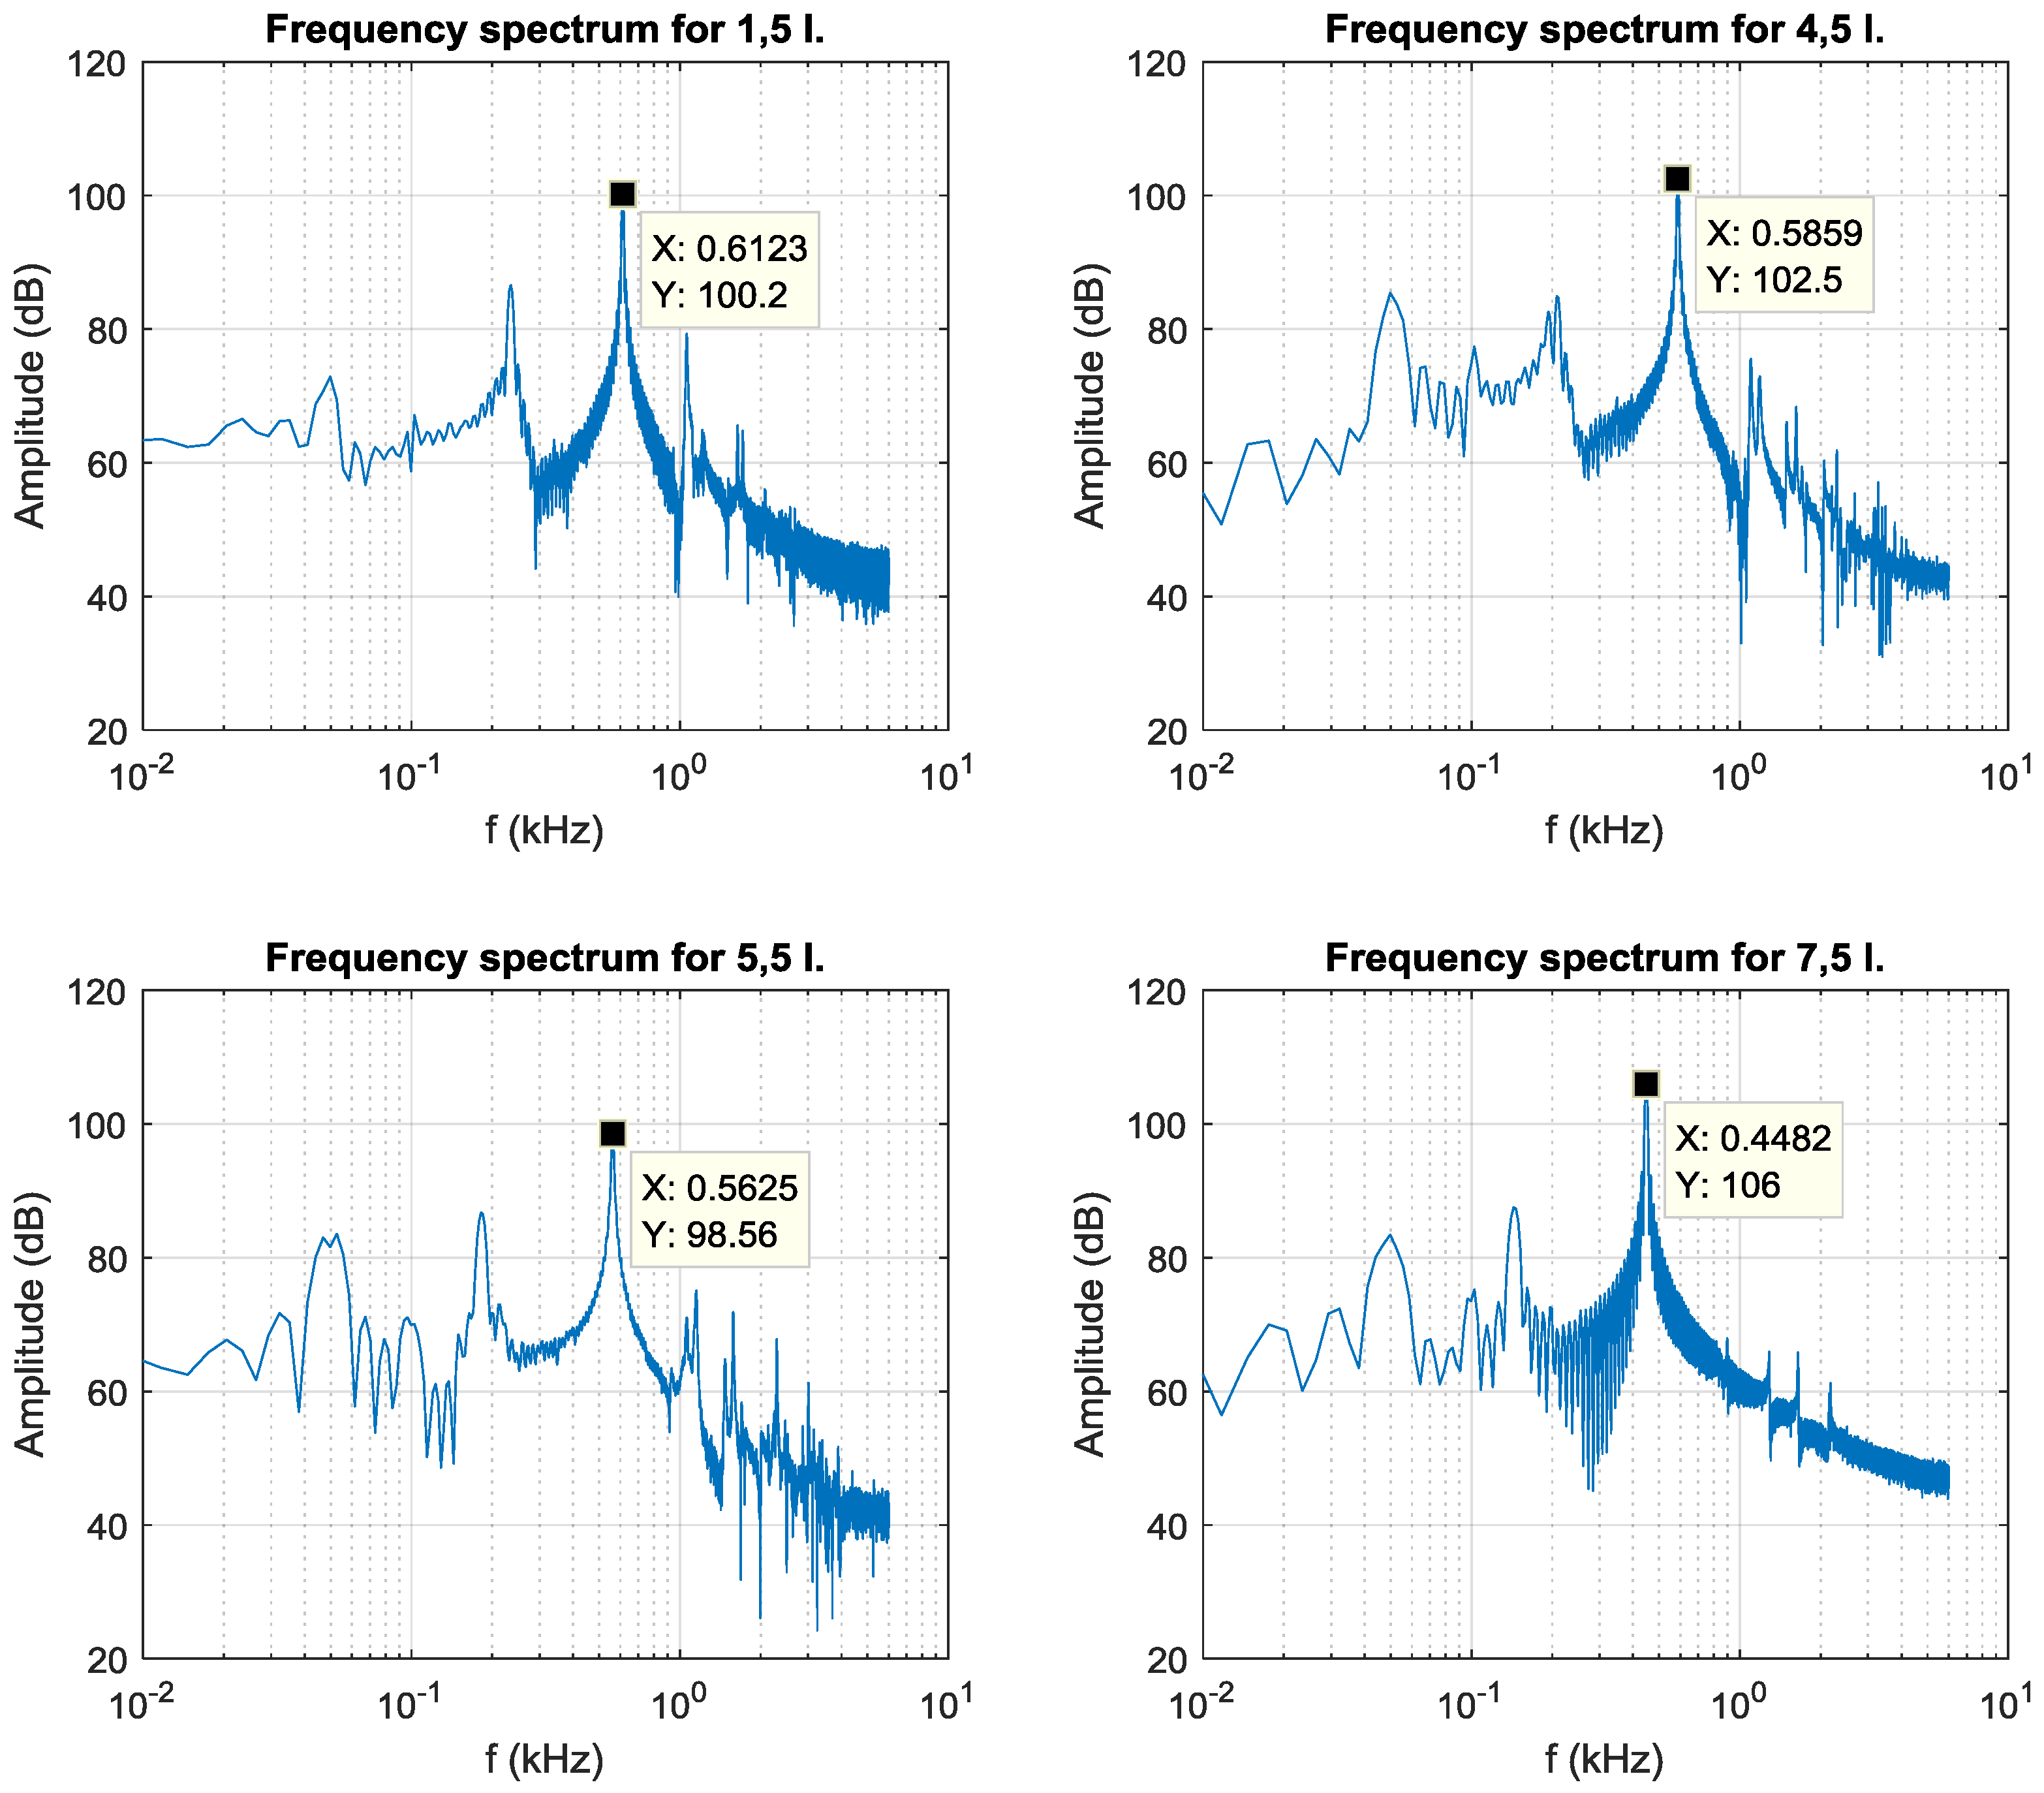
For the calibration process, a commercial audio amplifier [22] and the piezoelectric sensor in the prototype were used for sound acquisition. This commercial audio amplifier was used for validating the data obtained with the reconfigurable prototype and the piezoelectric sensor. Thus, the model derived from this calibration process was later integrated into the prototype. The calibration has been carried out by taking measurements from empty to full with 250 mL steps and following the frequency shift of the higher peak found in the spectrum, which was also found to be the one with more noticeable frequency variations. The results gave resonant frequencies between 615 Hz and 350 Hz. Figure 10 shows examples of how the system responds in four different cases.
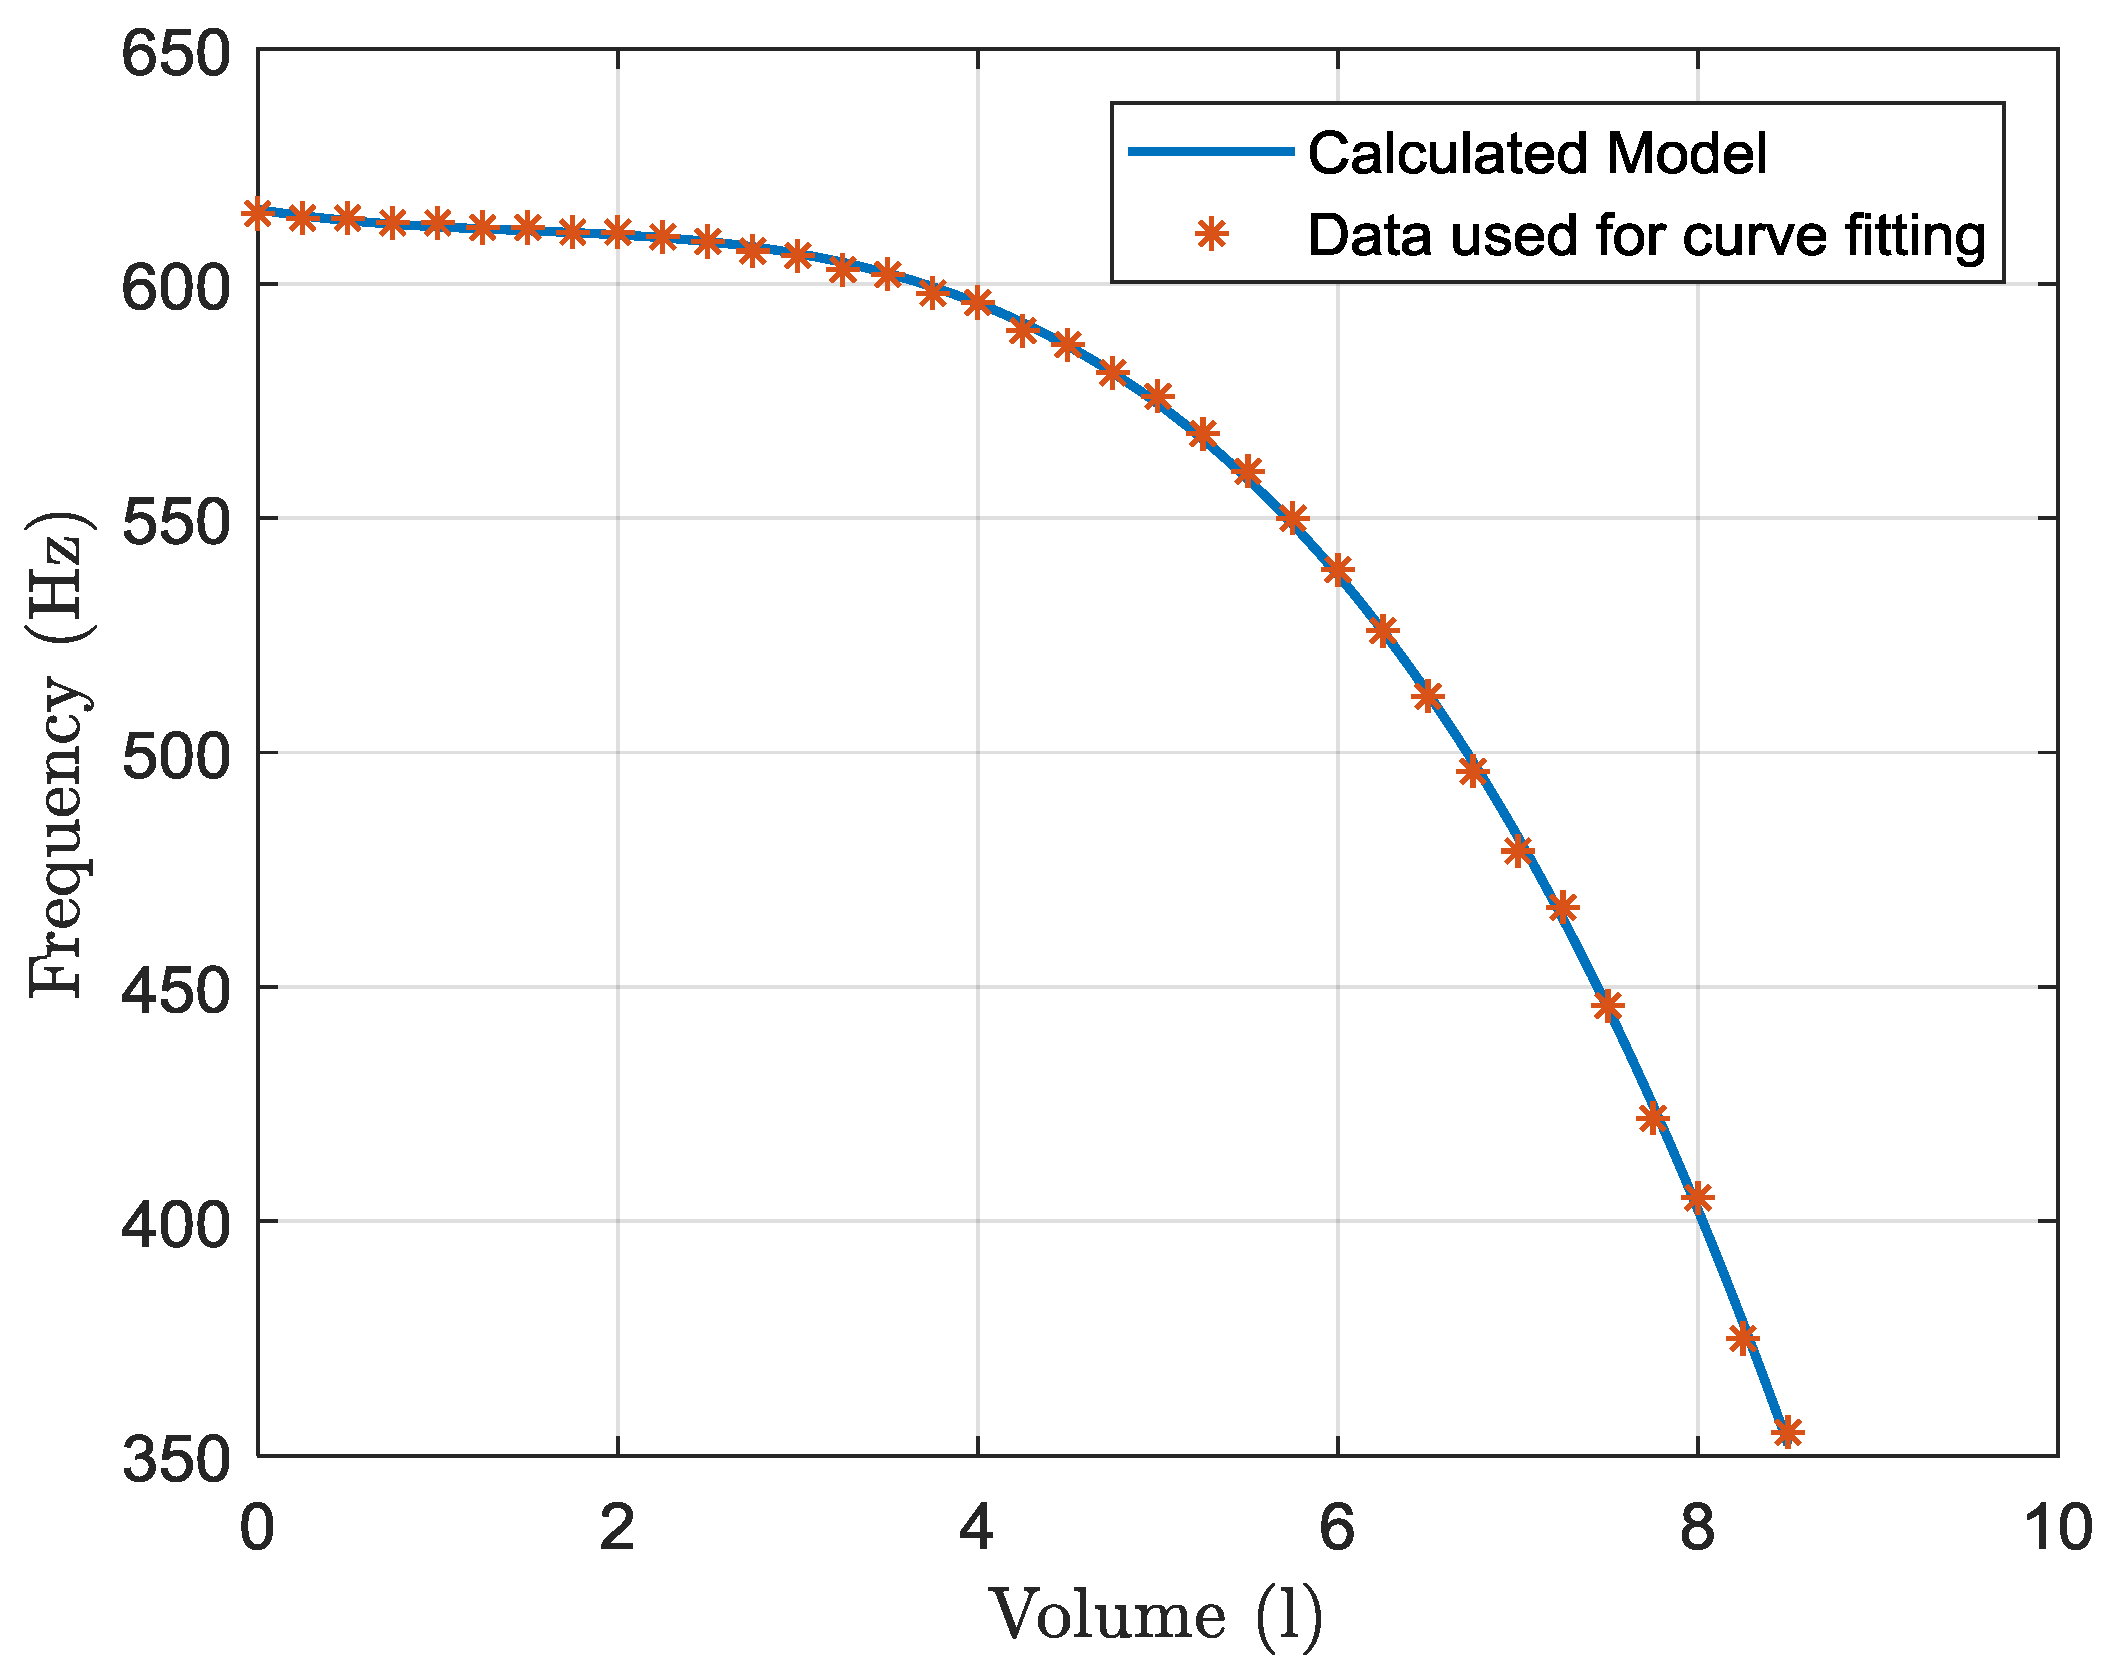
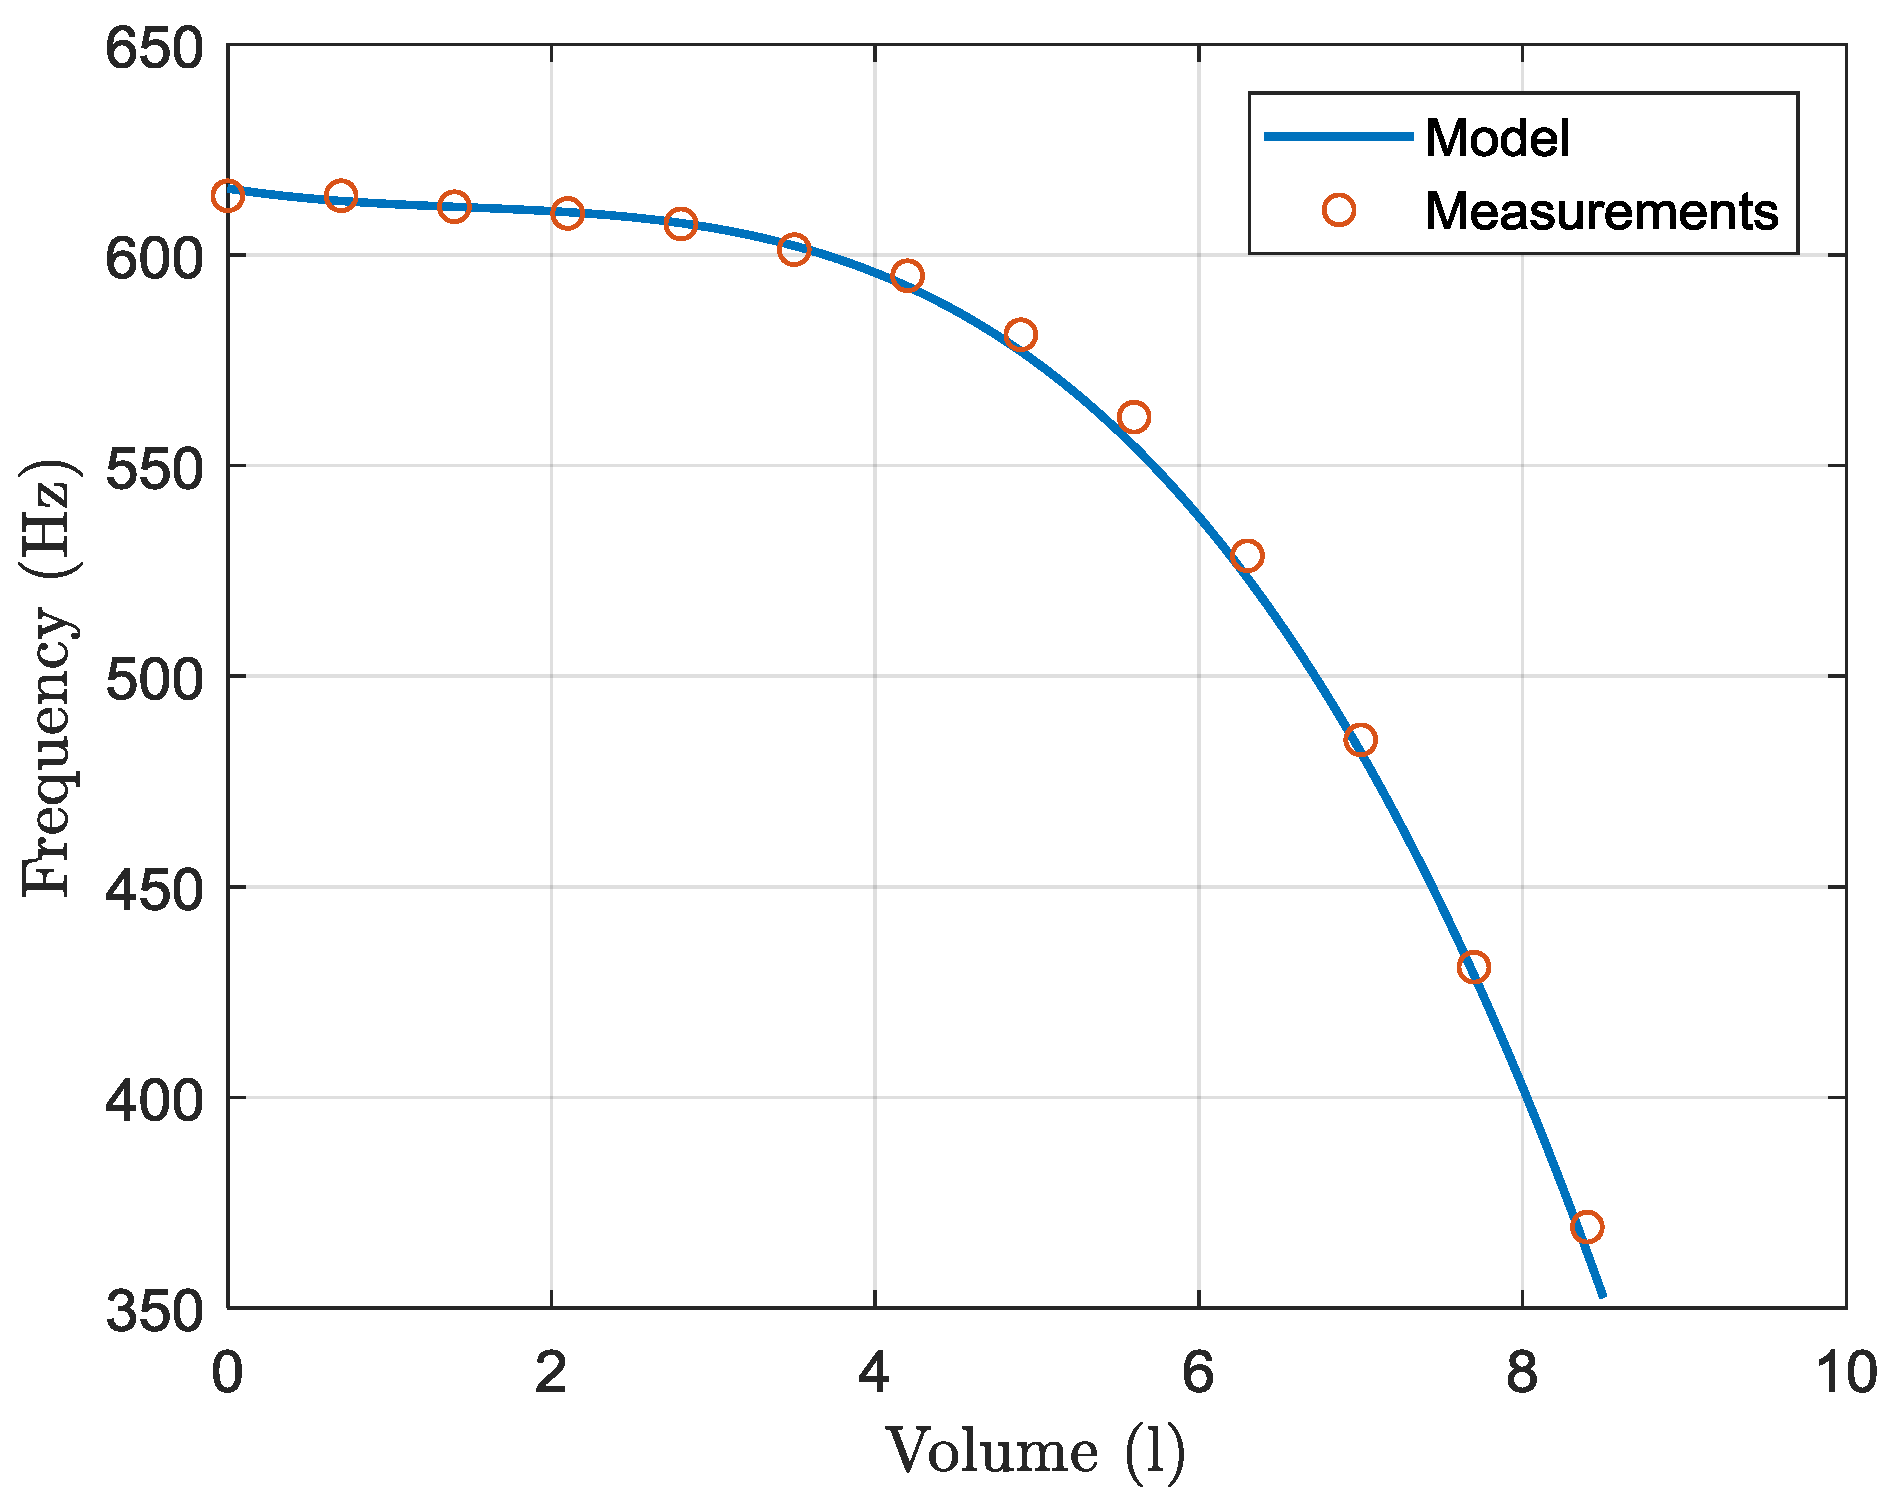
With the results of the different levels, a curve fitting process has been used to obtain the model. Concretely, a four-order polynomic equation was obtained:
where is the volume of liquid expressed in liters and is the resonance frequency expressed in Hz. Figure 11 shows the obtained model compared to the measurements, so it can be observed how the tank model fits the real measurements. It must be noted again that this model directly correlates frequency and liquid volume, so the proposed method is more sophisticated than the simple measurement of the height of the fluid in the tank, which is usually the case for most sensors [4,5,6,7].
3.2. Model Validation
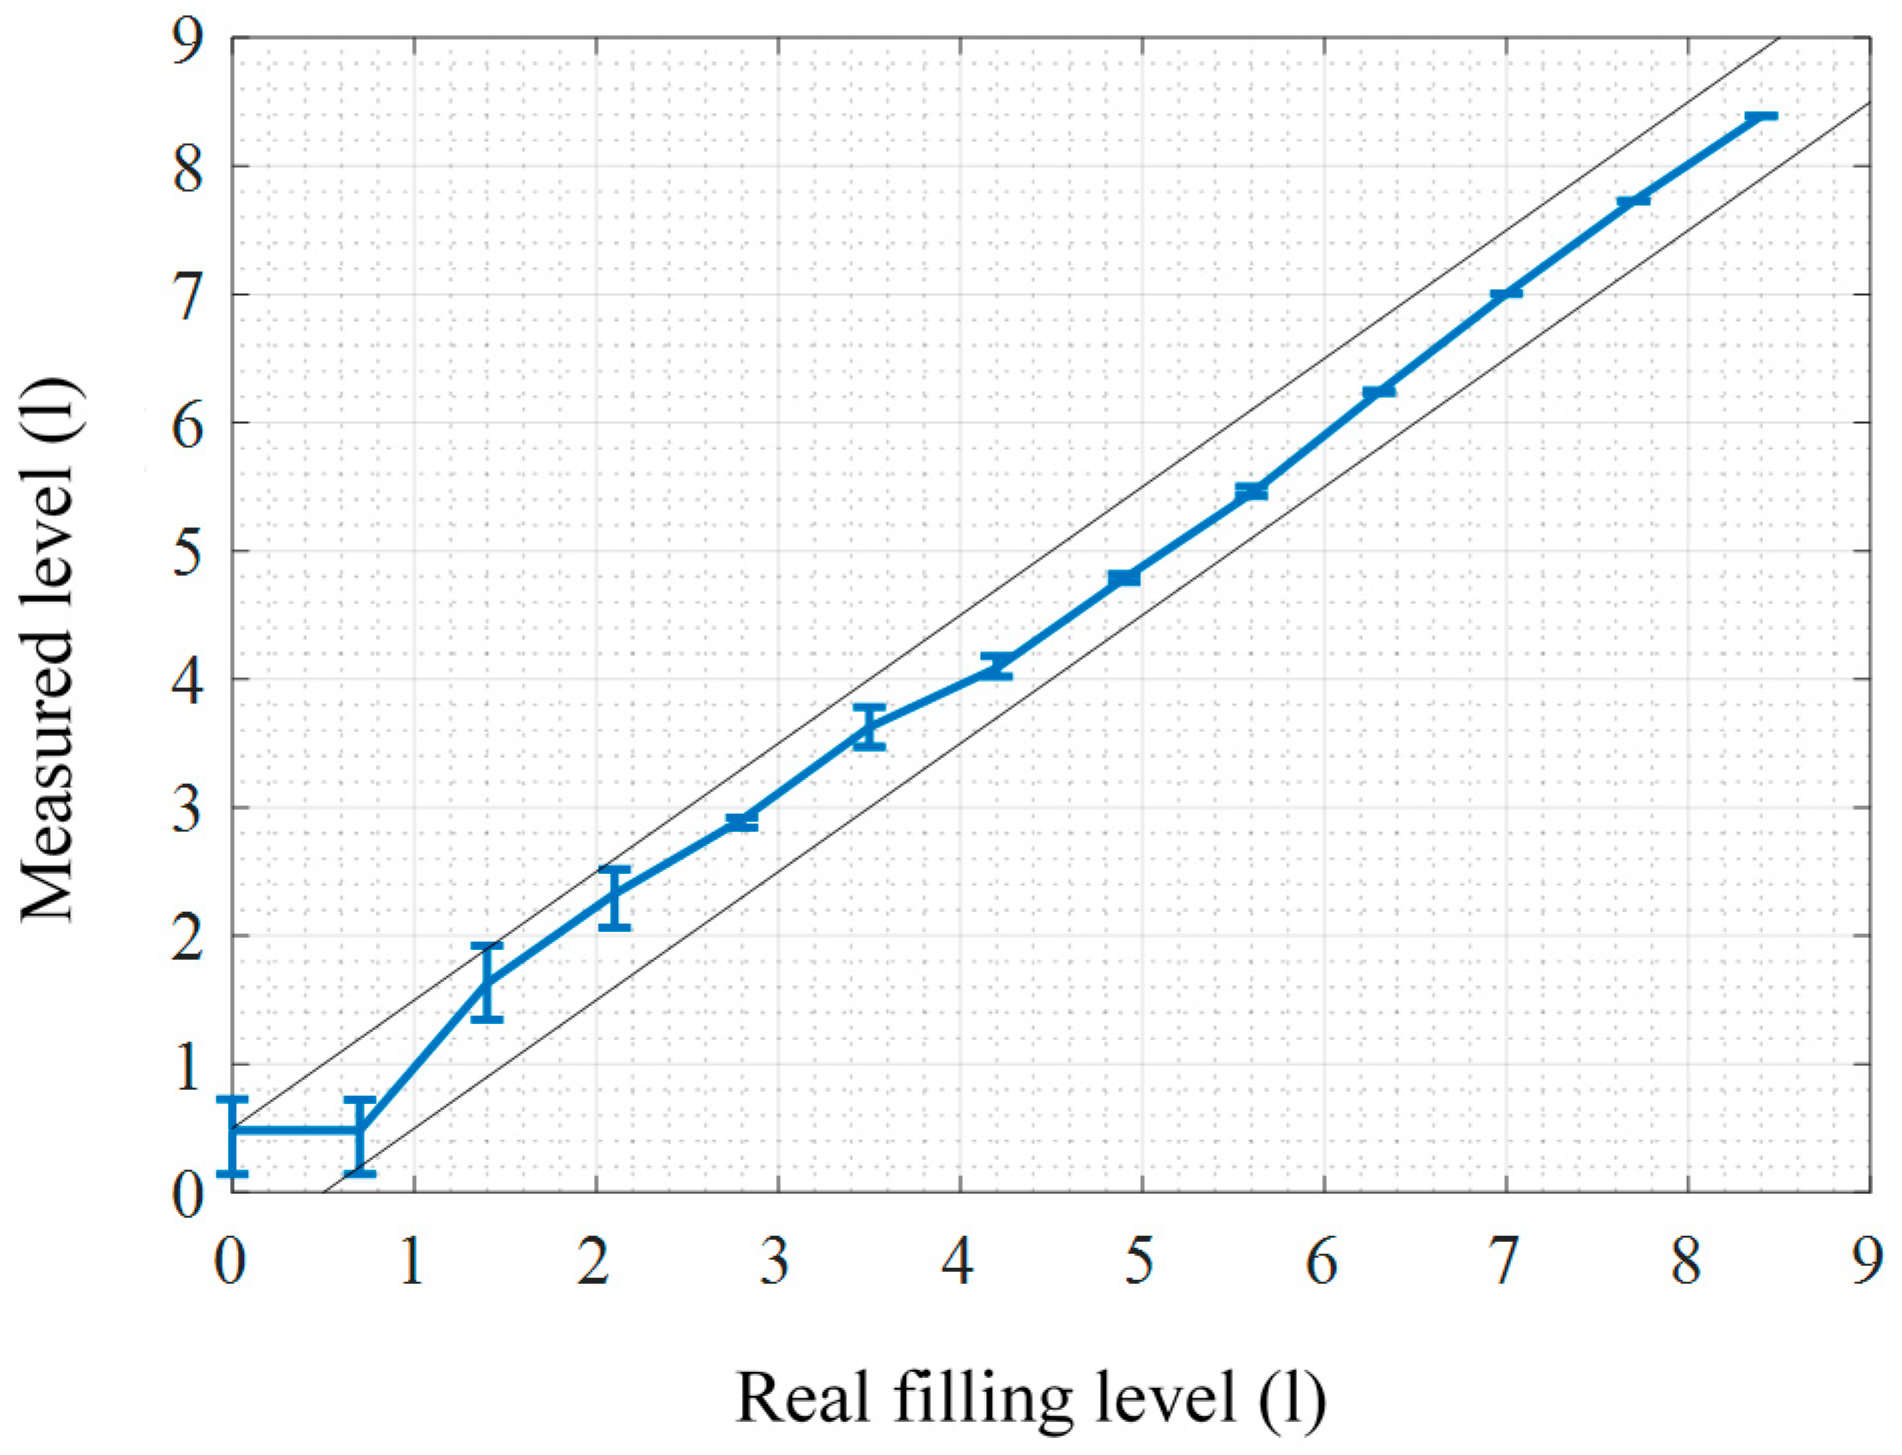
To validate the prototype and the previous calibration, different tests were carried out. The test process was to measure 5 consecutive times the level of the tank without changing the point of measure. This process was repeated with 13 different filling levels separated by 0.7 l all over the capacity of the tank. The results are depicted in Figure 12 and summarized in Table 1.
In Figure 12, the mean value of each level measurement is shown along with the maximum variation of the measurements. The two black lines represent the range of ±0.5 l. It can be observed how all measurements and the corresponding maximum errors are within this range, except when the tank is empty. It is also possible to observe that the measurements are more accurate when the fluid volume is over 4 l. This is explained by the behavior of the system, as the model is less sensitive as the tank gets emptied. If the frequencies obtained in this case are directly compared to those predicted by the model, which are shown as a blue line in Figure 13 with measured frequencies as red dots, it can be observed that experimental results are even closer to the model for larger volumes. This confirms that less sensitivity is thus possible for the low volume range.
3.3. System Validation with Different Tank Materials
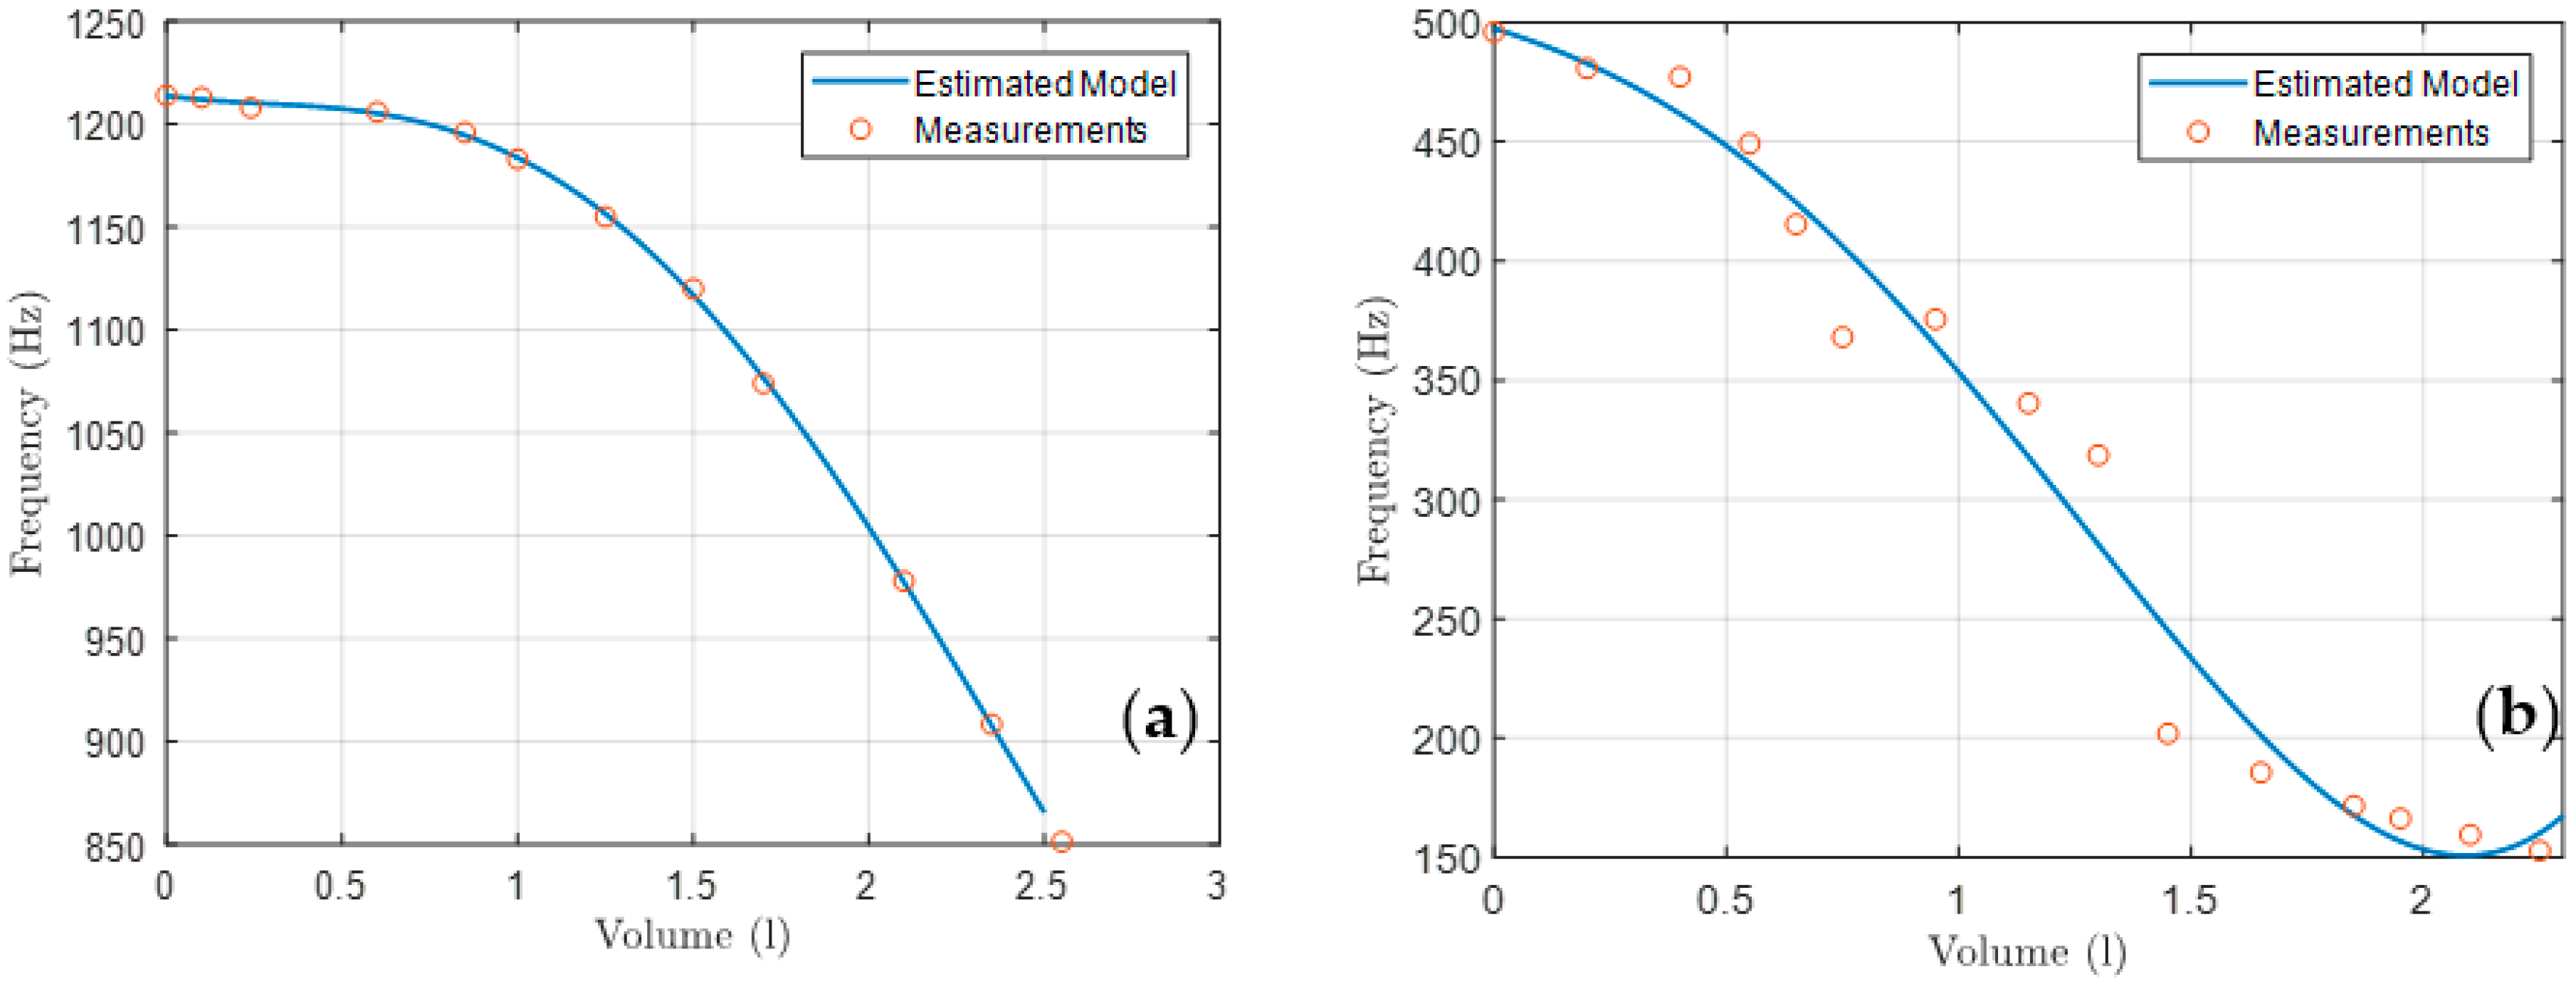
Finally, the system was further validated using two additional tanks, apart from the steel one used above. Concretely, a 2.5-litre aluminum tank and a 2.5-litre polypropylene container were also modeled following the calibration process described above. The aim of using an aluminum tank was to check for any influence of the type of metal in the measurement process, while the polypropylene container was used in order to validate the system when tanks are less rigid. Figure 14 shows, in the same way of Figure 13, the models (blue line) and the measured data (red dots) for both tanks. The behavior in the case of the aluminum tank is close to that of the previous steel tank, with a similar model fitting. In the case of polypropylene, the lack of rigidity results in a different model shape, which in any case still reproduces the expected correlation between frequency and liquid volume, thus confirming the validity of the prototype instrument.
3.4. System Validation with Alternative Fluids
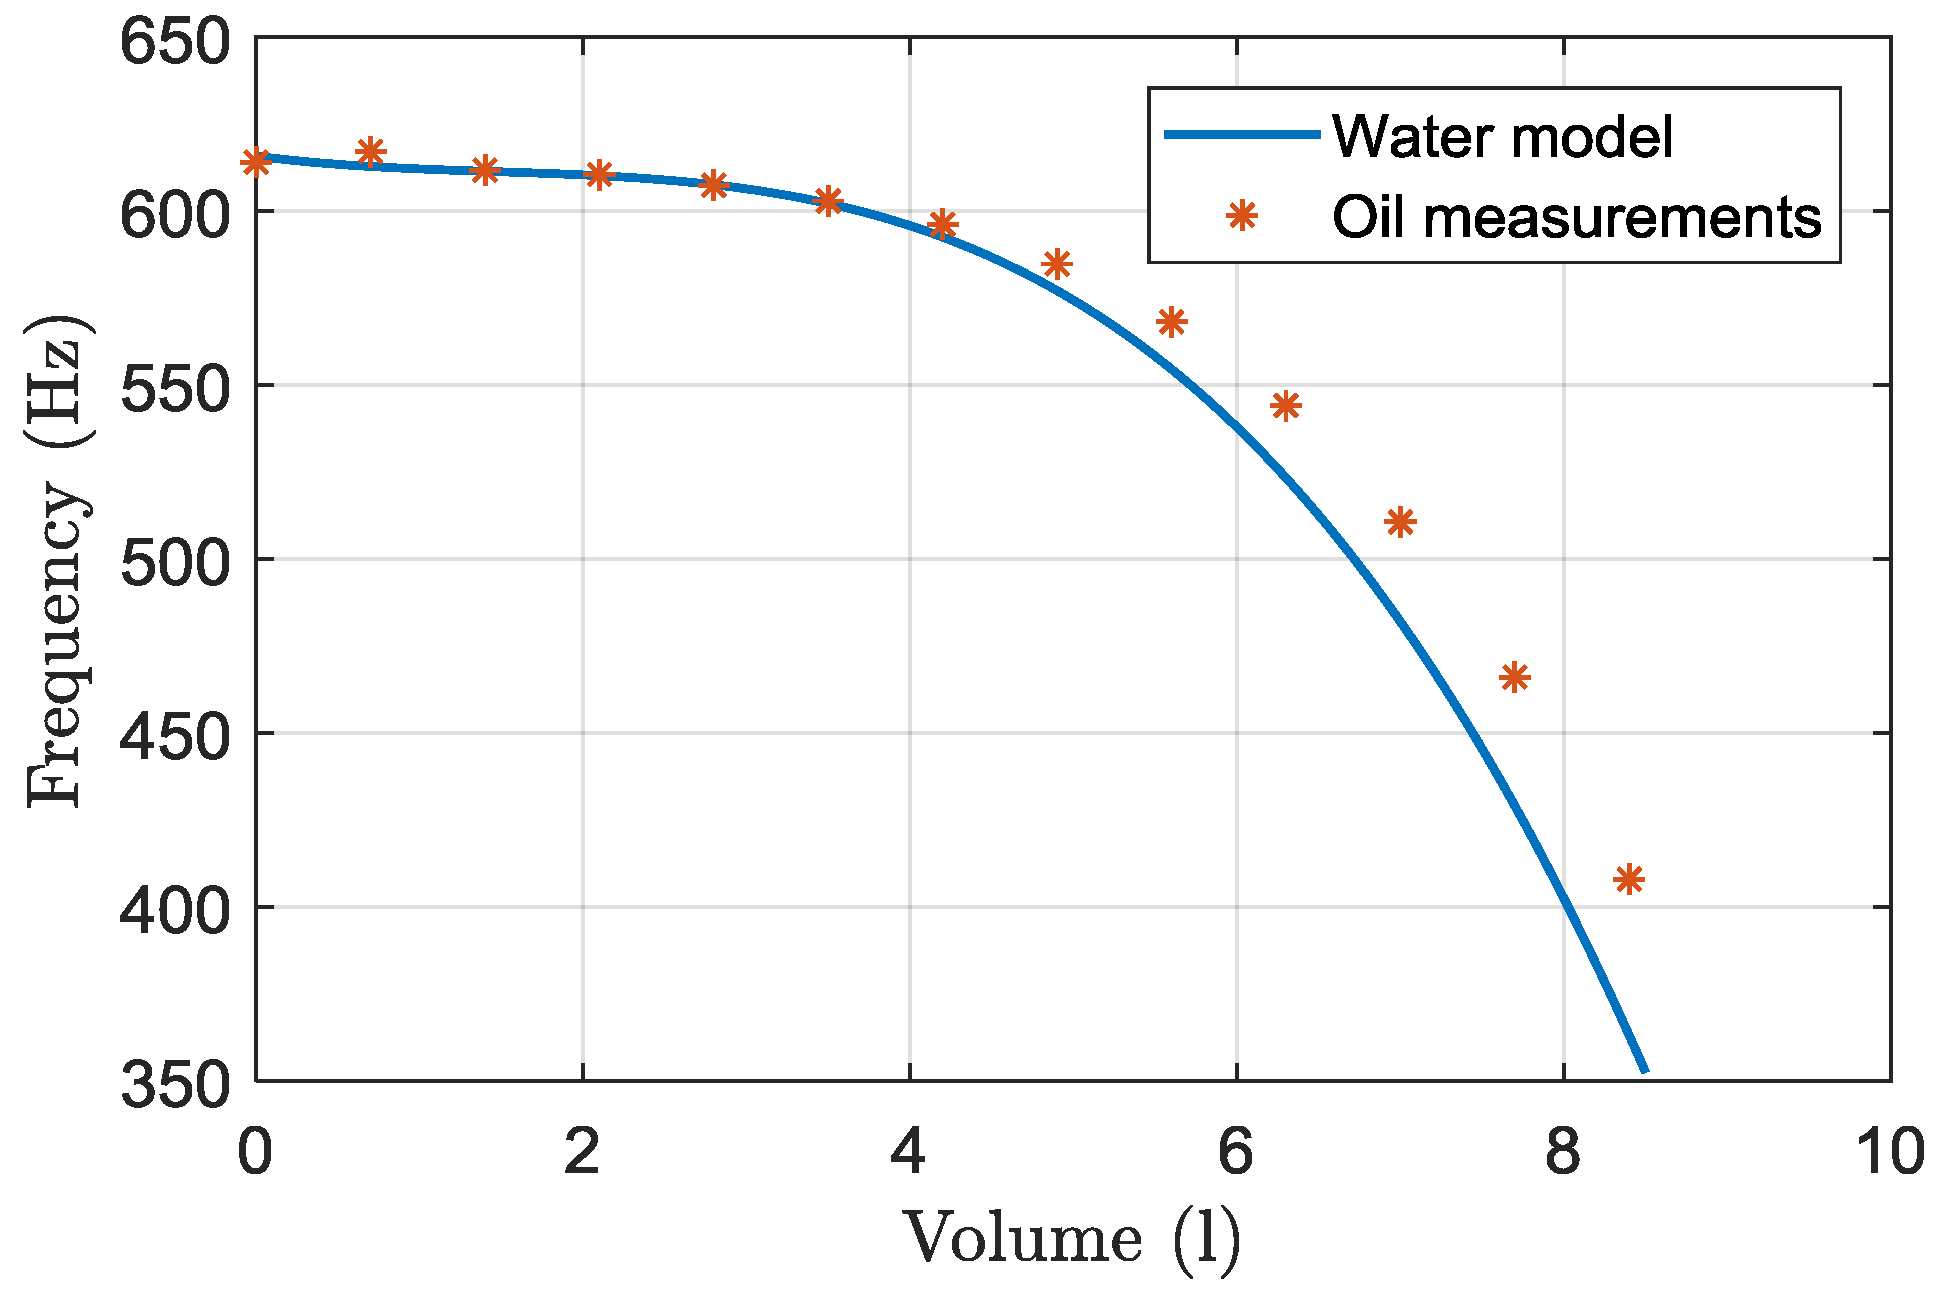
In order to analyze the influence of the type of fluid in the tank, the calibration process for the steel tank was repeated using olive oil, whose viscosity is approximately 80 times higher than water’s but whose density and bulk modulus are noticeably lower than those of water. Figure 15 shows the relationship between frequency and volume when the tank is filled with olive oil, compared to the model obtained for the same tank filled with water. Model shapes are similar for both water and olive oil, but at higher fluid volumes the variation in frequency is lower for olive oil, as different physical parameters for both fluids result in different frequency-volume relationships. While higher viscosity should attenuate the acoustic resonance in the fluid, it also affects the vibration of the tank itself, and fluid parameters such as bulk modulus and density will also influence the way the fluid and tank interact, thus affecting tank vibration. In any case, the presented instrument does not require us to take into account any of these effects and parameters, as they are embedded in the frequency-volume model derived from the tank calibration for each fluid.
3.5. The Effect of Tank Inclination
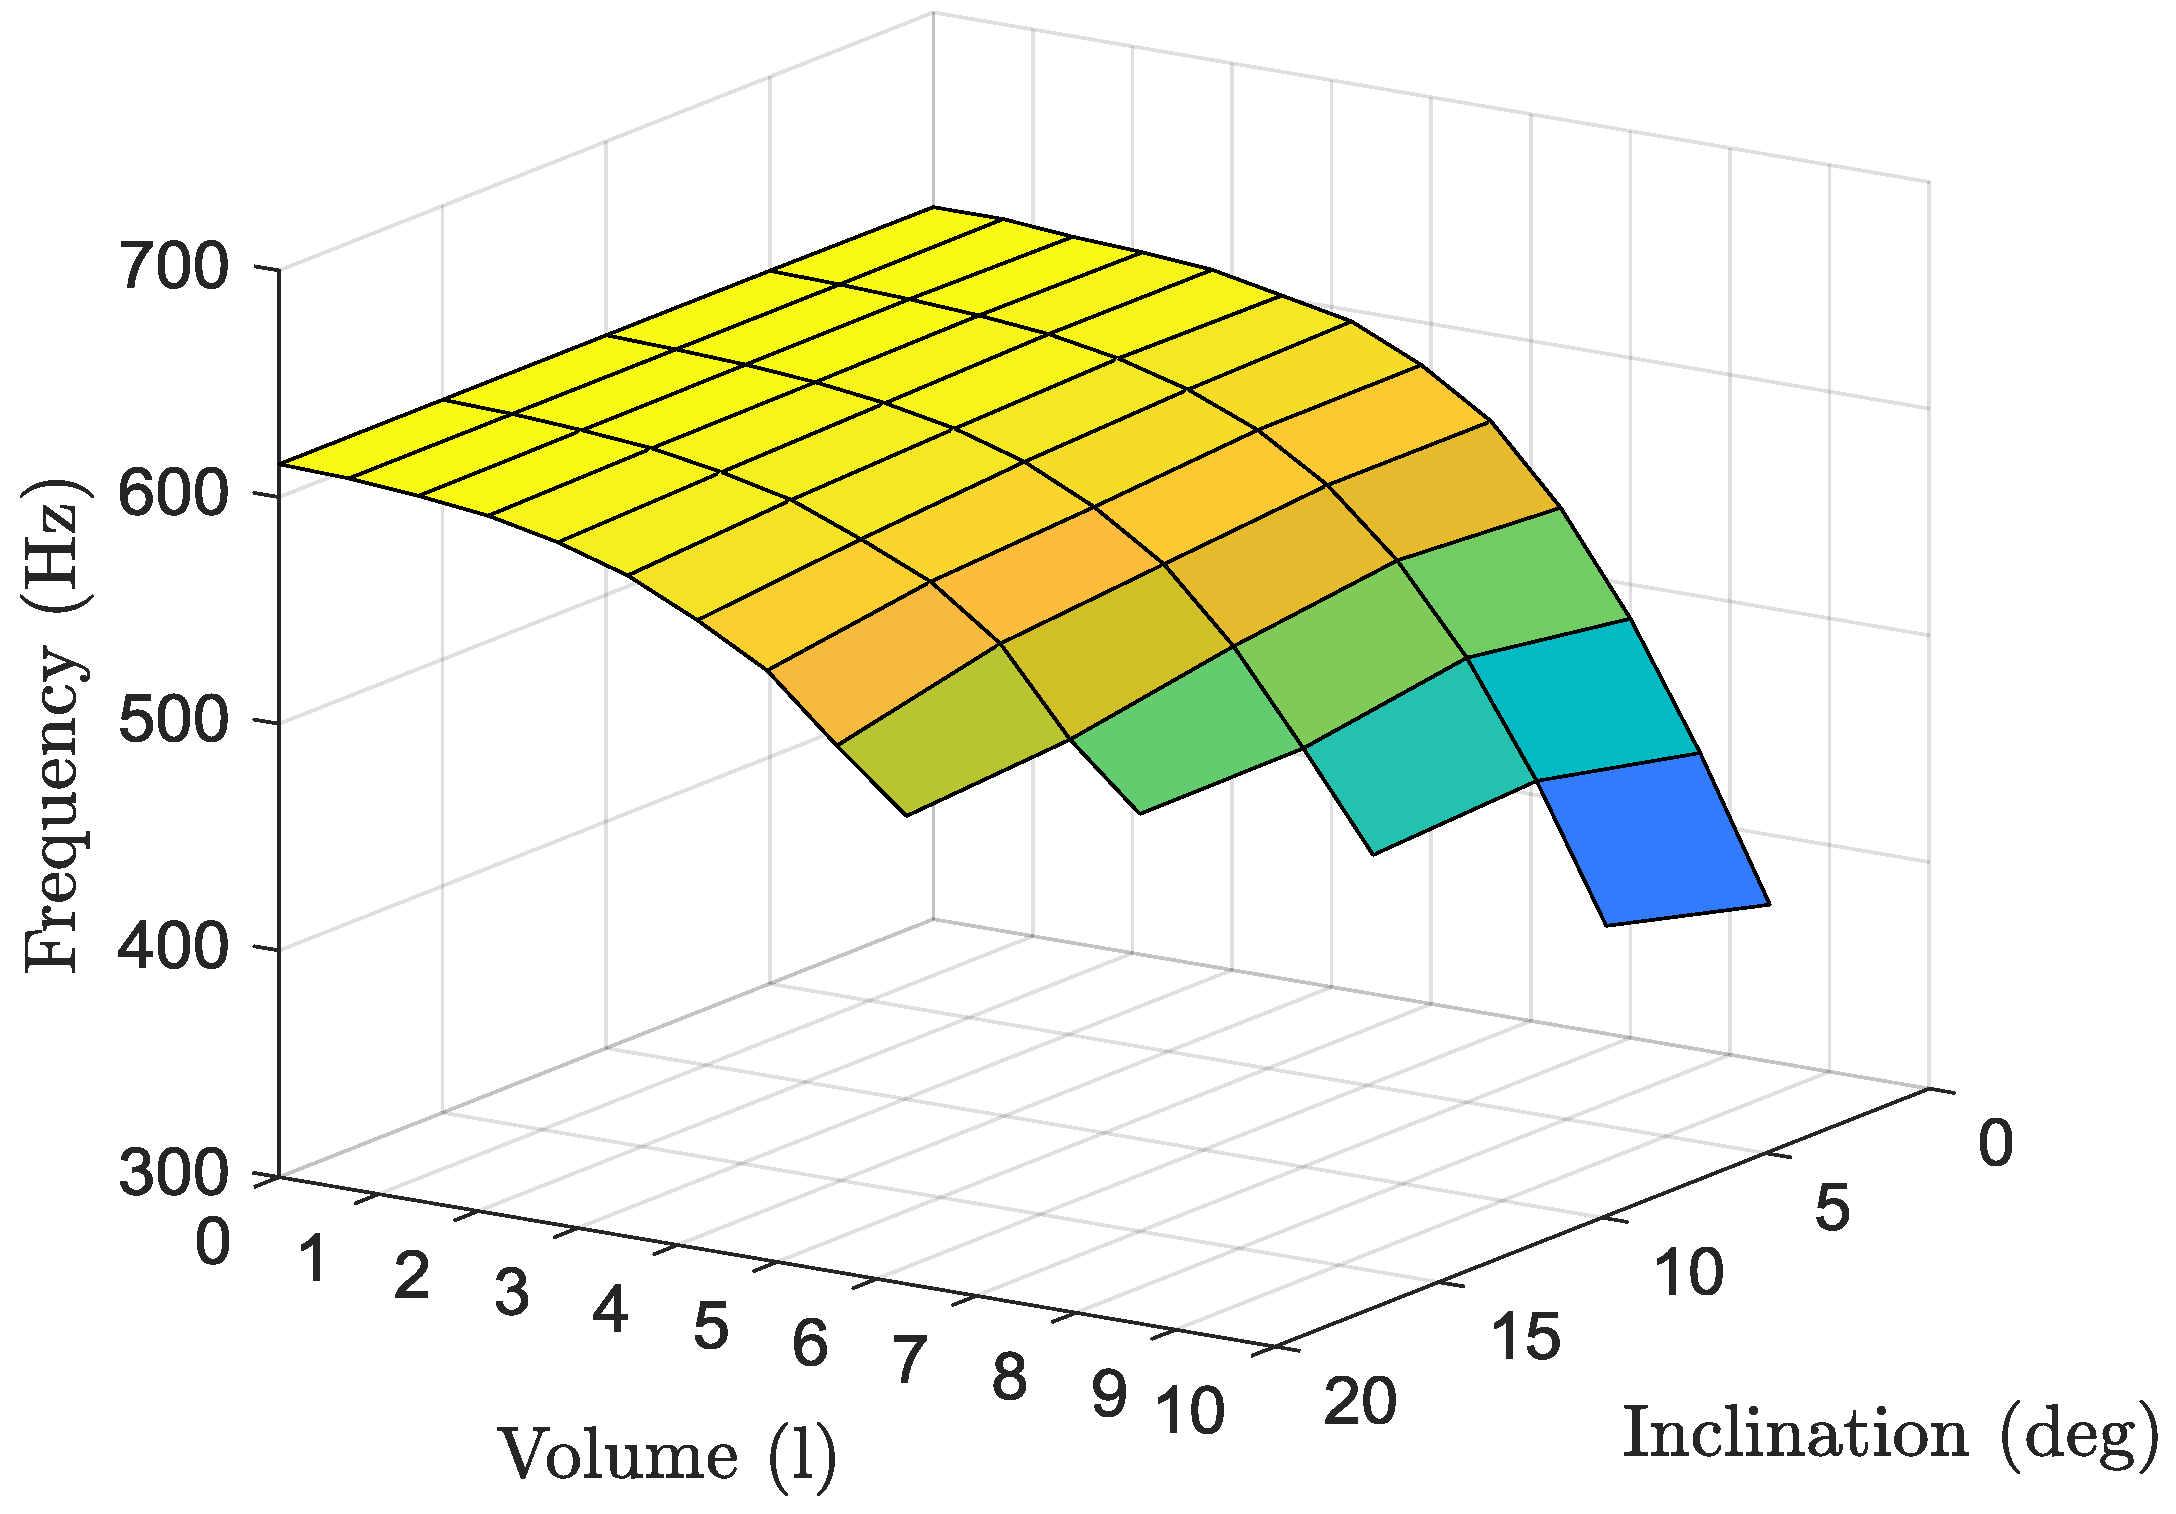
In order to verify the influence of tank tilting, calibration for the steel tank was repeated for five angle steps, from 0° to 20°. From these measurements it was observed that the frequency tends to decrease as the tilting angle increases, an effect that is emphasized for larger fluid volumes. Figure 16 presents the resonance frequency as a function of both angle and fluid volume in the tank.
As it can be observed in Figure 16, the effect of tilting is any case not significant, so small corrections to the model could be introduced as a function of the angle, or even a planar model relating frequency to both volume and angle could be derived from calibration at different angles. Even without any correction, the error caused to the volume reading by inclinations up to 20° is 2.9% in the worst case. Thus, the presented instrument and measurement procedure can be used even for non-stationary tanks.
4. Discussion
A non-intrusive system based on sound resonance for measuring the filling level of a tank has been presented. A prototype system has been developed using reconfigurable technology and tested with different tank materials. With the results above, the system has been shown to be valid for measuring the fill-level of a tank. The mean relative error over the full range is 6.25%, in the case of an enameled steel test tank containing water. Nonetheless, this error is drastically reduced to 1.318% when the tank is filled over half of its capacity, in the range of 4 to 8 L, with the maximum deviation of 4.76% at 4 L. This high error when the tank is almost empty is due to the combination of two reasons: The precision in frequency of the system and the sensitivity of the sensor in that range, in which a small variation in frequency is translated to a big variation in the volume estimated by the model. Thus, while system precision is almost constant, the model relating volume and frequency is not linear, so the error is not linear and is larger for lower volumes. In many industries, this low sensitivity at low filling level is not a problem as, usually, the tanks are not completely depleted during normal operation.
Additionally, different materials have been tested with positive results in both aluminum and propylene tanks, while different contents were also studied to observe the effect of fluid viscosity. In this particular case, olive oil was used with a lower sensitivity in the measure due to higher viscosity. Finally, the effect of tank inclination was analyzed and, while a small variation in frequency was found, results confirmed that the system can be used for non-stationary tanks. A more sophisticated model including the effect of tilting during calibration can be derived for improved readings.
In conclusion, a non-intrusive system has been developed to measure the volume inside tanks. This system is based on reconfigurable electronics and allows us to measure different types of tanks without interfering with or accessing the contents of the tank, only requiring a previous calibration. Thanks to this calibration, the volume of the tank is directly obtained without transformation from height to volume. The presented prototype is not only portable, but also includes wireless communication capabilities, and thus it can be used in a distributed measurement system using wireless sensor network technology. Additionally, the combined use of this device and the associated Android application running on a mobile device (smartphone, tablet, or even wearables such as a smartwatch) makes it possible to use the system as a low-cost measuring hand-held tool.
Author Contributions
Conceptualization, D.P.M.; methodology, A.G. (Adrián García); software A.G. (Adrián García); validation, A.G. (Adrián García) and Á.M.; data curation, V.T.; writing—original draft preparation, V.T.; writing—review and editing, A.G. (Antonio García), E.C. and L.P.; supervision, D.P.M.
Funding
This research received no external funding.
Acknowledgments
The authors wish to acknowledge the anonymous Reviewers for their helpful suggestions.
Conflicts of Interest
The authors declare no conflict of interest. The funders had no role in the design of the study; in the collection, analyses, or interpretation of data; in the writing of the manuscript, or in the decision to publish the results.
References
- Reza Akhondi, M.; Talevski, A.; Carlsen, S.; Petersen, S. The role of wireless sensor networks (WSNs) in industrial oil and gas condition monitoring. In Proceedings of the 4th IEEE International Conference on Digital Ecosystems and Technologies, Dubai, UAE, 12–15 April 2010; pp. 618–623. [Google Scholar]
- Woodard, S.E.; Taylor, B.D. A wireless fluid-level measurement technique. Sens. Actuators A Phys. 2007, 137, 268–278. [Google Scholar] [CrossRef] [Green Version]
- Yan, F.; Shao, X.; Li, G.; Sun, Z.; Yang, Z. Edge Detection of Tank Level IR Imaging Based on the Auto-Adaptive Double-Threshold Canny Operator. In Proceedings of the 2008 Second International Symposium on Intelligent Information Technology Application, Shanghai, China, 21–22 December 2008; pp. 366–370. [Google Scholar]
- Pérez-Ocón, F.; Rubiño, M.; Abril, J.M.; Casanova, P.; Martínez, J.A. Fiber-optic liquid-level continuous gauge. Sens. Actuators A Phys. 2006, 125, 124–132. [Google Scholar] [CrossRef]
- Brumbi, D. Measuring process and storage tank level with radar technology. In Proceedings of the IEEE International Radar Conference, Alexandria, VA, USA, 8–11 May 1995; pp. 256–260. [Google Scholar]
- Hien, P. Radar Sensors for Agricultural and Construction Machinery—Technologies and Applications; MSO Meßtechnik und Ortung GmbH: Bad Münstereifel, Germany, 2017. [Google Scholar]
- Mann, S.; Lindner, S.; Barbon, F.; Linz, S.; Talai, A.; Weigel, R.; Koelpin, A. A tank level sensor based on Six-Port technique comprising a quasi-TEM waveguide. In Proceedings of the 2014 IEEE Topical Conference on Wireless Sensors and Sensor Networks (WiSNet), Newport Beach, CA, USA, 19–23 January 2014; pp. 4–6. [Google Scholar]
- Moser, M.J.; Fuchs, A.; Zangl, H. Non-invasive capacitive sensor for the determination of revolution speed and fill level in screw conveyors. In Proceedings of the 2008 IEEE Sensors, Lecce, Italy, 26–29 October 2008; pp. 49–52. [Google Scholar]
- Olmos, A.M.; Carvajal, M.A.; Morales, D.P.; García, A.; Palma, A.J. Development of an Electrical Capacitance Tomography system using four rotating electrodes. Sens. Actuators A Phys. 2008, 148, 366–375. [Google Scholar] [CrossRef]
- Deghat, M.; Karimaghaee, P. A Level Measurement Method based on Acoustic Resonance using Unscented Kalman Filter. IFAC Proc. Vol. 2008, 41, 1426–1431. [Google Scholar] [CrossRef]
- Webster, E.S.; Davies, C.E. The Use of Helmholtz Resonance for Measuring the Volume of Liquids and Solids. Sensors 2010, 10, 10663–10672. [Google Scholar] [CrossRef] [PubMed] [Green Version]
- Sinha, D.N. Noninvasive Method for Determining the Liquid Level and Density Inside of a Container. U.S. Patent US6053041A, 25 April 2000. [Google Scholar]
- Love, A.E.H. The Small Free Vibrations and Deformation of a Thin Elastic Shell. Philos. Trans. R. Soc. A Math. Phys. Eng. Sci. 1888, 179, 491–546. [Google Scholar] [CrossRef]
- Li, L.; Liu, Y.; Zhang, F.; Sun, Z. Several explanations on the theoretical formula of Helmholtz resonator. Adv. Eng. Softw. 2017, 114, 361–371. [Google Scholar] [CrossRef]
- Nave, R. Resonances of Closed Air Columns. Available online: http://hyperphysics.phy-astr.gsu.edu/hbase/Waves/clocol.html (accessed on 30 September 2018).
- Meyer-Baese, U. Digital Signal Processing with Field Programmable Gate Arrays, 3rd ed.; Signals and Communication Technology; Springer: Berlin, Germany; New York, NY, USA, 2007; ISBN 978-3-540-72612-8. [Google Scholar]
- Morales, D.P.; García, A.; Castillo, E.; Carvajal, M.A.; Parrilla, L.; Palma, A.J. An Application of Reconfigurable Technologies for Non-invasive Fetal Heart Rate Extraction. Med. Eng. Phys. 2013, 35, 1005–1014. [Google Scholar] [CrossRef] [PubMed]
- Morales, D.P.; López-Ruiz, N.; Castillo, E.; García, A.; Martínez-Olmos, A. Adaptative ECT system based on reconfigurable electronics. Measurement 2015, 74, 238–245. [Google Scholar] [CrossRef]
- Cypress Semiconductors Corporation. PSoC 5 LP Family Datasheet; Cypress Semiconductors Corporation: San Jose, CA, USA, 2016. [Google Scholar]
- Cypress Semiconductors. CY8CKIT-059 PSoC®5LP Prototyping Kit Guide; Cypress Semiconductors Corporation: San Jose, CA, USA, 2018. [Google Scholar]
- Google BluetoothChat. Available online: https://github.com/googlesamples/android-BluetoothChat/ (accessed on 26 April 2018).
- MG-012 Amplifier. Available online: http://www.lcprime.com/index.php/mini-portable-audio-guitar-bass-mini-amplifier-clip-amp-headphone-speaker-travel.html (accessed on 30 October 2018).
Figure 1.
Conceptual scheme of the proposed system.

Figure 2.
Vector reordering for the Fast Fourier Transform (FFT) algorithm.

Figure 3.
The butterfly algorithm used to compute the decimation in time (DIT) FFT.

Figure 4.
Conceptual schematic of the prototype device.

Figure 5.
The PSoC 5LP block diagram.

Figure 6.
Schematic of the solenoid driver circuit.

Figure 7.
The complete prototype mounted in the case and position used for measurement.

Figure 8.
The MATLAB graphical user interface (GUI).

Figure 9.
Real use-case of the Android application.

Figure 10.
Frequency spectrums examples.

Figure 11.
The model obtained from calibration vs. measured points.

Figure 12.
Mean value and variation of each measurement.

Figure 13.
The measured frequency vs. model.

Figure 14.
Measures over different materials: (a) Measurements for the aluminum tank. (b) Results for the polypropylene tank (blue line: model; dots: measured data).
Figure 14.
Measures over different materials: (a) Measurements for the aluminum tank. (b) Results for the polypropylene tank (blue line: model; dots: measured data).

Figure 15.
Results for the steel tank using olive oil.

Figure 16.
The effect of tank inclination in the measurement.


Table 1.
Results obtained from measurements for system validation.
| Real Value (l) | M1 (l) | M2 (l) | M3 (l) | M4 (l) | M5 (l) | Mean Value (l) |
|---|---|---|---|---|---|---|
| 0 | 0.825 | 0.356 | 0.640 | 0.356 | 0.240 | 0.483 |
| 0.7 | 0.640 | 0.350 | 0.242 | 0.356 | 0.825 | 0.483 |
| 1.4 | 1.338 | 1.338 | 1.644 | 1.917 | 1.917 | 1.631 |
| 2.1 | 2.462 | 2.310 | 2.590 | 2.136 | 2.136 | 2.327 |
| 2.8 | 2.890 | 2.890 | 2.890 | 2.890 | 2.970 | 2.906 |
| 3.5 | 3.567 | 3.613 | 3.780 | 3.470 | 3.700 | 3.626 |
| 4.2 | 4.096 | 4.157 | 4.064 | 4.127 | 3.998 | 4.088 |
| 4.9 | 4.793 | 4.793 | 4.752 | 4.813 | 4.773 | 4.785 |
| 5.6 | 5.397 | 5.455 | 5.470 | 5.470 | 5.455 | 5.449 |
| 6.3 | 6.227 | 6.237 | 6.247 | 6.237 | 6.247 | 6.239 |
| 7 | 7.004 | 7.004 | 7.008 | 7.008 | 7.004 | 7.006 |
| 7.7 | 7.728 | 7.728 | 7.728 | 7.728 | 7.728 | 7.728 |
| 8.4 | 8.390 | 8.390 | 8.390 | 8.390 | 8.390 | 8.390 |
© 2018 by the authors. Licensee MDPI, Basel, Switzerland. This article is an open access article distributed under the terms and conditions of the Creative Commons Attribution (CC BY) license (http://creativecommons.org/licenses/by/4.0/).
Share and Cite
MDPI and ACS Style
García, A.; Toral, V.; Márquez, Á.; García, A.; Castillo, E.; Parrilla, L.; Morales, D.P. Non-Intrusive Tank-Filling Sensor Based on Sound Resonance. Electronics 2018, 7, 378. https://doi.org/10.3390/electronics7120378
AMA Style
García A, Toral V, Márquez Á, García A, Castillo E, Parrilla L, Morales DP. Non-Intrusive Tank-Filling Sensor Based on Sound Resonance. Electronics. 2018; 7(12):378. https://doi.org/10.3390/electronics7120378
Chicago/Turabian StyleGarcía, Adrián, Víctor Toral, Álvaro Márquez, Antonio García, Encarnación Castillo, Luis Parrilla, and Diego P. Morales. 2018. "Non-Intrusive Tank-Filling Sensor Based on Sound Resonance" Electronics 7, no. 12: 378. https://doi.org/10.3390/electronics7120378
Note that from the first issue of 2016, this journal uses article numbers instead of page numbers. See further details here.